
Submitted:
02 January 2025
Posted:
07 January 2025
You are already at the latest version
Abstract
Background: Changes in salivary proteome in obese patients, in response to weight loss, was previously observed after bariatric surgery. Additionally, saliva responses to exercise and/or dietary treatments have been reported. The present study aimed to assess the changes in salivary proteome induced by weight loss due to negative energy balance. Methods: The participants were a group of individuals (5 men and 5 women) from a reality TV-show that were submitted to intense exercise and energy restriction, for weight loss, for 8 weeks. Saliva was collected at the beginning and at the end of the program. Two-dimensional electrophoresis coupled to mass spectrometry was used to identify changes in salivary protein profile. Results: Most of the protein spots changed after weight loss were identified as containing proteins like amylase, carbonic anhydrase VI (CA VI) and cystatins. For salivary amylase spots, increases after weight loss were observed, whereas the levels of cystatin spots decreased. CA VI increased with weight loss, with this increase being positively correlated with the percentage of weight lost (in men). Conclusions: Some of the effects of weight loss induced by energy restriction combined with intense exercise is different from the ones previously observed in studies where weight was lost due to bariatric surgery, suggesting that different treatments may result in different nervous and metabolic processes that can be reflected in saliva proteome.
Keywords:
Obesity
; weight loss
; salivary proteomics
; carbonic anhydrase VI
; α-amylase
; cystatins
1. Introduction
Obesity is a chronic disease characterized by imbalance between the energy consumed and expended, which leads to increases of body fat stores and consequently to increases of body weight [1]. Despite the existent interventions at several levels (e.g. lifestyle, cognitive behaviour therapies, pharmacotherapy, bariatric/metabolic surgery), obesity is achieving epidemic proportions, even in countries traditionally associated to Mediterranean Diet and lifestyle, such as Portugal, with 57.5% of overweight adults (20.8% obese), in 2016, according to the last report from the World Health Organization, published in 2022 [2]. This makes urgent to improve the knowledge and understanding of this challenging condition.
The increase in physical activity, together with caloric restriction is widely used as a strategy to induce weight loss. However, even achieving good results, at the beginning, weight is often regained in a short-term period after variable periods [3]. The low palatability and reduced reward value usually associated with diets low in carbohydrates and fat, are among the reasons for increased intake of energy after food restriction treatments [4].
Saliva, a fluid whose composition differs among persons and that has been related with oral food perception, both for basic tastes [5,6], astringency [7,8], and retronasal aroma [9] also differs in its protein components between normal weight and obese individuals [10,11]. A comparison of salivary proteome between women subjected to bariatric surgery and not treated obese women revealed differences [10] in the proportion of several proteins, some of which potentially related with bitter taste sensitivity, namely cystatins and carbonic anhydrase VI (CA VI) [5,12,13], and proteins related with sweet taste sensitivity, such as amylase [6]. Changes in taste sensitivity, with obesity [14] and/or weight loss [15], or even taste sensitivity related with the amount of weight lost by obese patients [16], have been reported. Although, from our knowledge, there are no studies where the changes in salivary proteome have been related with the changes in taste perception, in obese individuals, the existence of such association cannot be discarded. A study using obese dog as animal model, also reported changes in salivary proteome induced by body weight loss [17]. In this case, the weight loss was achieved through caloric restriction and the identified salivary proteins are involved in glycolysis or oxidative stress, with changes suggesting metabolic adjustments induced by weight loss.
From what was stated above, it is hypothesized that weight loss induced by negative energy balance will induce changes in salivary proteome. As such, the aim of this study was to determine variations in salivary protein composition of morbidly obese subjects after 8 weeks of a weight-loss program, consisting of both intense physical activity and caloric restriction.
2. Materials and Methods
2.1. Subjects and Saliva Collection
This study included 10 adult volunteers (5 men and 5 women, aged 19-39 years old) enrolling a Portuguese reality TV show [“Peso Pesado” (2nd edition, 2011-2012)] based in the American “Big looser”, where the participants undergone a weight loss program based in intense physical activity and dietary caloric restriction.
Participants were weighed (kg) and measured (m), to determine the Body Mass Index [BMI = Weight (kg)/Height2 (m2)] and waist circumference measured. Fat mass was assessed through bioelectric impedance. From each subject, saliva samples were collected in two different times: at the beginning of the weight-loss program, before weight loss starting (group Before) and 8 weeks after (group After). Saliva collections were performed always between 3:00 p.m. and 4:00 p.m., with all individuals having, at least, 1:30h after lunch. The subjects were asked to refrain from eating and drinking, except water, from lunch time until saliva collection. At collection time, they were requested to rising their mouth with water, to remove “old” saliva and food residues before collection. Unstimulated whole saliva was collected into an ice-cold collection tube by direct draining for 5 minutes.
Saliva samples were stored at -20ºC for subsequent analysis. Until one week after, samples were thawed on ice and centrifuged for 30 min at 4ºC, 13,000g. Precipitate was discarded, and supernatant divided in aliquots and stored at -80ºC. The total protein concentration was determined using the Bradford method with bovine serum albumin as standard for calibration.
This study was conducted according to the guidelines of the Declaration of Helsinki for Medical Research involving Human subjects and was approved by the Research Ethics Committee of the University of Évora. Each participant signed the informed consent form before the start of the study.
2.2. Saliva Protein Profile
2.2.1. Two-Dimensional Gel Electrophoresis (2-DE)
Due to the limiting amounts of saliva collected, protein profiles were only possible for 5 obese individuals (3 male; 2 female). For these samples, collected both before and after weight loss, 2-DE profiles were obtained following the protocol described before [10]. For each sample, a volume corresponding to 160 μg of total protein, was used. Briefly, saliva samples were desalted and concentrated using a 3-kDa cut-off ultra-filtration microfuge tubes (Nanosep 3K omega, PALL Corporation), mixed with rehydration buffer to a final volume of 250 μL and loaded onto 13-cm pH 3–10 NL IPG strips (GE Healthcare) by passive in-gel rehydration overnight in a Multiphor Reswelling Tray (GE Healthcare). The same focusing program described before [10] was used. Following focusing, proteins in the IPG strips were reduced and alkylated and horizontally applied on the top of a 12 % SDS-PAGE gel (1 × 160 × 160 mm), for vertical separation using a Protean II xi cell (Bio-Rad). After gels being stained with 0.1 % CBB-R250 (in 20 % methanol, 10 % acetic acid) and de-stained with 10 % acetic acid, digital images were acquired using a scanning ImageScanner III (GE Healthcare), and analysis was performed using Image Master Platinum v.7 software (GE Healthcare), with automatic spot detection, followed by manual editing for spot splitting and noise removal.
The volume of each spot was normalised using relative spot volumes (% vol). After analysis, the spots of interest were removed from gels, in-gel digested and identified by mass spectrometry (MS).
2.2.2. Protein Identification by MALDI FTICR MS
- (i)
- Tryptic digestion
After manual excision of the spots of interest from the gels, they were washed, reduced and alquilated as described before [5]. For digestion, porcine trypsin (Sequencing Grade Modified Trypsin, Promega) in 50 mM Ammonium hydrogencarbonate was added, being the excess liquid removed after 45min incubation, and 50 mM Ammonium hydrogencarbonate added to gel pieces, being incubated overnight at 37ºC. Extraction of tryptic peptides was performed by addition of 10% of formic acid (FA)/50% ACN three times being lyophilized in a SpeedVac (Thermo Savant).
- (ii)
- Mass spectrometry and database search
After samples being desalted and concentrated, using reverse phase poros R2 (Applied Biosystems), and eluted directly to the MALDI target AnchorChip (BrukerDaltonics, Bremen, Germany) with α-cyano-4-hydroxycinnamic acid (CHCA; Fluka), peptide mixtures were analyzed by MALDI-FTICR-MS in a Bruker Apex Ultra, Apollo II combi-source (Bruker Daltonics, Bremen, Germany), with a 7 Tesla magnet (Magnex corporation, Oxford UK) as previously described [5]. Monoisotopic peptide masses were determined using the SNAP 2 algorithm in Data Analysis software version 3.4 (BrukerDaltonics). External calibration was performed using the BSA tryptic digest spectrum, processed and analyzed with Biotools 3.1 (BrukerDaltonics, Bremen, Germany). Monoisotopic peptide masses were used to search for protein identification with Mascot software (Matrix Science, UK; 27). The Swiss-Prot non-redundant protein sequence database (accessed in December 2024), restricted to Homo Sapiens, was used for all searches. A minimum mass accuracy of 100 ppm, one missed cleavage in peptide masses, carbamidomethylation of Cys and oxidation of Met, as fixed and variable amino acid modifications respectively, were considered. Criteria used to accept the identification were homology scores higher than 56 achieved in Mascot.
2.3. Western Blotting
Western blotting was performed for the saliva samples of all individuals (N=10), collected both before and after weight loss. Sodium dodecyl sulphate polyacrylamide gel electrophoresis (SDS-PAGE) was made in 12% polyacrylamide gels (80×100×7,5 mm) (Protean 3 Cell, Bio-Rad), as described before [5]. A volume corresponding to 3μg of total protein was loaded per sample. The electrophoretic run was performed at constant voltage of 140V, until the front dye reaches the end of the gels. Proteins were subsequently transferred to PVDF membranes at 350 mA constant current for 1h. After a blocking step in 5 % (w/v) powdered skimmed milk in TBS–Tween for 2h, membranes were incubated with primary antibody anti-carbonic anhydrase VI (Santa Cruz sc-99173; 1:200 dilutions) overnight at 4°C. Salivary carbonic anhydrase VI bands were detected using a secondary antibody against rabbit IgG (GE Healthcare, 1:10000 dilution), and a chemifluorescent substrate (ECF Plus Western Blotting Detection Reagents, GE Healthcare). Membranes were revealed in a transilluminator (Gel-doc system, Bio-Rad), and a semi-quantitative analysis of band expression was carried out using Quantity One software (Bio-Rad).
2.4. Statistical Analysis
The data were analysed using descriptive statistics for normality and homoscedasticity assessment using respectively, Kolmogorov-Smirnov and Levene tests. Due to the limited number of individuals tested, non-parametric tests were used, except for multivariate analysis, through Partial Least Square – Determinant Analysis (PLS-DA), where data was normalized. Univariate comparisons between periods were performed for saliva total protein concentration, for the protein spots visualized in 2-DE gels and for CA VI WB expression using Wilcoxon. Spearman correlation coefficients were used to assess the correlation between salivary CA VI and weight, abdominal or total fat losses. Analysis was performed using the software SPSS v.22, considering a significant level of confidence for P<0.05.
Taking into account the possible interdependence among proteins, multivariate analysis of protein spots was performed with MetaboAnalyst 3.0 [28], considering paired data. Data normalization was used when normal distribution was not observed using scaling methods. Partial least squares discriminant analysis (PLS-DA) was used, and discriminant variables selection was done using variable importance in the projection (VIP) with a threshold of 1.5.
3. Results
3.1. Individuals’ Anthropometric Parameters
All the individuals participating in the program presented weight losses from 12,8% to 34,4% of their initial body weight. Reductions in abdominal (6-30.7% reduction) and total fat mass (3.8-20.6% reduction) were also observed. The information regarding individuals submitted to weight loss program is summarized in Table 1. It is observed that, despite the significant weight loss, the Body Mass Index (BMI) continued to be higher than 25, indicating that all are still overweight at the end.
3.2. Two-Dimensional Salivary Protein Profiles
Total protein concentration of saliva samples did not change with individuals’ weight loss (482,2 ± 107,89µg/mL vs. 446,95 ± 52,16µg/mL, before and after weight loss, respectively, P>0.10). Nevertheless, the correlation between variation in total protein concentration and the percentage of total fat loss was marginally significant (R=0.576; P=0.082; N=10).
Salivary 2-DE protein patterns (Figure 1) were compared between the periods before and after weight loss. Weight loss resulted in changes in 2-DE salivary protein profile. Partial least square – determinant analysis (PLS-DA), a multivariate statistical approach, was performed to find proteins that individually or in combination with other proteins vary between the period previous and the period after the weight loss program. The two first PLS components explained 47.8% variance. Figure 2 shows the projection of predictors, i.e. spot normalized volume (%Vol), on the first two components. Thirteen protein spots were observed to be the most important predictors in the model (VIP scores higher than 1.4) (Table 2). For 4 of these spots (86, 97, 109 and 110), these changes were also observed through univariate analysis. Mass spectrometry information, for the spots differing between the periods before and after weight loss, is detailed in Table 2.
Most the spots that decreased after weight loss, comparatively to the period before the intervention were identified as cystatins. Increases after weight loss were mainly observed in spots identified as salivary amylase and serum-derived proteins, such as albumin and chains of immunoglobulins.
3.3. Western Blotting Analysis of Carbonic Anhydrase VI
Since some of the proteins changed in 2DE profiles were proteins previously observed to be related with taste perception, western blot was used to assess the effect of weight loss program in the expression levels of CA VI [another protein potentially involved in taste [5], for the 10 individuals under study. The stain of the band with approximately 42 kDa, which corresponds to the theoretical molecular mass of the protein, was significantly increased after weight loss (Figure 3).
When searching for the relationship between the levels of this protein and the effects of the program (in the amount of weight and total or fat loss) statistically significant results were obtained. Only in men, strong positive correlations were observed between the expression levels of CA VI, in the saliva collected after weight loss and losses on both the total weight and the percentage of fat mass (Table 3, Figure 4). As such, men with higher losses of weight and total fat presented higher levels of salivary CAVI, at the end of the program.
4. Discussion
One of the main concerns in obesity treatment is the recovery of weight, after weight loss treatments. One of the possible reasons for failing in maintaining low-caloric diets, after some time, can be low palatability associated to these diets. Saliva is being increasingly recognized as potentially related with oral food perception e.g., [6]. Moreover, salivary differences were identified for obese individuals [10,18].
In order to get insights about how saliva can change after weight loss, we compared the saliva proteome before and after individuals being subjected to high intensity exercise and low-energy diets consumption, for 8 weeks. Although these are preliminary results, needing further large-population based studies, changes in the levels of salivary proteins, such are α-amylase, CA-VI and cystatins were observed. Moreover, the levels of blood-derived proteins, such as albumins and immunoglobulin chains were also different at the end of the program.
Salivary α-amylase is an enzyme involved in starch digestion. The increase in the levels of this protein, after weight loss, at first sight, appears to contradict the results obtained in previous study, in obese women who lost weight after bariatric surgery [10]. In this last case, the levels of this salivary protein were decreased in bariatric surgery women, comparatively to obese women not treated for weight loss. It is possible that these different results can be due to the different procedure used to lose weight. Salivary α-amylase is considered a marker of sympathetic nervous system activity, being greatly used to assess the activation of this branch of autonomous nervous system [19]. Moreover, in a previous study, using rat as animal model for studying hyperleptinemia, it was observed a reduction in salivary α-amylase levels associated with increases in circulating leptin [20]. Both autonomic nervous system and leptin have been suggested to be involved in obesity and weight loss processes [21]. In the case of bariatric surgery through laparoscopic sleeve gastrectomy used in the previous study [10], a systemic neuro-inhibitory sympathetic effect is described [21], as well as decreased leptin resistance. As such, the observed decrease in salivary α-amylase, induced by this type of bariatric surgery can be explained by these changes. On the other hand, in the present study, individuals lose weight due to caloric restriction and an intense exercise program. A review made by Koibuchi and Suzuki [22] evidence that exercise increases salivary α-amylase activity and concentrations, particularly at an intensity of >70% VO2 max, potentially explaining the increases in this salivary protein that we observed. Finally, carbohydrate-energy restriction was also observed to induce increases in salivary α-amylase levels [23], what also contributes to explain the observations made in the present study.
Salivary amylase was previously found to be negatively related with sweet taste sensitivity by our group [6,24]. In this context, it would be possible to hypothesize that the rise in some isoforms, after weight loss, could result in reduced sensitivity for sweet taste. If this is true, it can be that individuals losing weight due to high energy deficit will be less sensitive to sweetness, what may not occur when individuals lose weight due to bariatric surgery. Although no taste sensitivity assessment was made in the present study, the hypothesis of an association with increased amylase with decreased sweet taste sensitivity goes in line with results, from other authors, reporting reduction in sweet taste perception (i.e. reduced sweet taste sensitivity) in individuals after severe weight loss induced by energy restriction [25].
Another change in salivary proteome, observed in the present study, was for cystatins and CA VI. Salivary cystatins are cysteine protease inhibitors, synthesized by the submandibular glands, whereas CA VI is a protein mainly secreted by serous cells of parotid and the minor lingual salivary glands of von Ebner. CA VI may play a role in the reversible hydration of carbon dioxide, allowing the maintenance of appropriate pH homeostasis on oral cavity. Both proteins were previously associated with bitter taste perception [5,12]. Cystatins and CA VI decreased and increased, respectively, with the weight loss program used in the present work. Interestingly, the association between these proteins and bitter taste sensitivity is negative for cystatins and positive for CA VI [5,12]. As such, the changes induced by weight loss, observed in this study, were in the direction of a potential increase in bitter taste sensitivity. Moreover, CA VI showed a strong positive correlation with the percentage of total fat loss, in men. Considering the association of CA VI with bitter taste sensitivity, it can be hypothesized that individuals losing higher percentage of fat will increase the sensitivity for this taste. Higher bitter taste sensitivity can result in higher avoidance of low-calorie healthy foods, such as vegetables [26], and as such, the real effect of salivary changes induced by energy-deficit weight loss on taste perception must be further explored.
As it occurred in the case of salivary α-amylase, also for CA VI the changes induced by weight loss, in this study, were in opposite direction of the changes observed in the study where weight loss was induced by bariatric surgery [10], reinforcing the notion of different effects according to the type of weight loss.
Some limitations need to be considered, including the low number of participants, limiting the potential to identify changes with reproducibility, particularly concerning salivary 2DE protein profiles. For the evaluation of CA VI changes 10 individuals were studied, corresponding to a sample size is in line with the numbers used in other studies in the weight loss and/or exercise context. Moreover, the absence of a control group, constituted by obese individuals not participating in the weight loss program, but collecting saliva in the same periods, is also a limitation. Another aspect that would be of interest, to strength the conclusions, would be to assess participants taste sensitivity. As such, further studies are needed, which evaluate simultaneously changes in saliva proteome induced by weight loss and variations in sweet and bitter taste response. Despite of this, the study has the strength of resulting from a long-term process, where individuals were monitored through all program and diet and exercise adapted to their performance.
5. Conclusions
Television contexts for weight loss gained popularity. In these, the participants follow monitored energy-restriction and exercise, that have an intensity as high as each of them can support. From our knowledge, the present work is the first one investigating the effects at salivary proteome level. Different salivary proteins were observed to change between the beginning and the end of the program. Most of them were proteins previously observed to relate with taste sensitivity. Despite the limitation of the low number of participants evaluated, in this study, this suggests that weight loss may have consequences in oral food perception, supporting previous studies from our team.
One particularly interesting aspect was the fact of most of the changes observed being in an opposite direction of the ones previously observed to occur when weight was lost due to bariatric surgery. The different nervous, endocrine and metabolic effects that each type of treatment has may justify these differences, suggesting that saliva can be an useful fluid for monitoring the effects of weight loss programs.
This is a pilot study and further work must be done to confirm if the observed changes in saliva protein profile are generalizable to any weight loss due to high energy deficit, as well as if they are related with a real change in taste sensitivity.
Author Contributions
E.L.: conceptualization, data curation, data analysis, writing; L.R.: sample collection and laboratory analysis; C.S..: laboratory analysis, data analysis, writing; C.C.: laboratory analysis, data curation, writing review; A.R..: conceptualization, data collection, writing review; F.C.S.: sample collection, data curation; writing review; C.A.: data curation, writing review; A.R.C.: data analysis, writing review. All authors have read and agreed to the published version of the manuscript.
Funding
This work is funded by National Funds through FCT – Foundation for Science and Technology under the Project UIDB/05183/2020
Institutional Review Board Statement
This study was conducted according to the guidelines of the Declaration of Helsinki and was approved (24/September/2012), by the Research Ethics Committee of the University of Évora (Doc. 12031).
Informed Consent Statement
Written patient consent was obtained.
Data Availability Statement
Data will be made available upon request.
Acknowledgments
The Portuguese Science Foundation (FCT) is acknowledged for the research contract CEECIND/04397/2017 to EL).
Conflicts of Interest
The authors declare no conflict of interest.
References
- Yumuk, V.; Tsigos, C.; Fried, M.; Schindler, K.; Busetto, L.; Micic, D.; Toplak, H. European Guidelines for Obesity Management in Adults. Obes. Facts 2015, 8, 402–424. [CrossRef]
- WHO. WHO European Regional Obesity Report 2022. Copenhagen: WHO Regional Office for Europe; 2022. Licence: CC BY-NC-SA 3.0 IGO.
- Lowe, M.R.; Butryn, M.L.; Thomas, J.G.; Coletta, M. Meal replacements, reduced energy density eating and weight loss maintenance in primary care patients: A randomized controlled trial. Obes. (Silver Spring) 2014, 22, 94–100. [CrossRef]
- Stubbs, R.J.; Whybrow, S. Energy density, diet composition and palatability: influences on overall food energy intake in humans. Physiol. Behav. 2004, 81, 755–764. [CrossRef]
- Rodrigues, L.; da Costa, G.; Cordeiro, C.; Pinheiro, C.C.; Amado, F.; Lamy, E. Relationship between saliva protein composition and 6-n-Propylthiouracil bitter taste responsiveness in young adults. J. Sens. Stud. 2017, 32, e12275. [CrossRef]
- Rodrigues, L.; Costa, G.; Cordeiro, C.; Pinheiro, C.; Amado, F.; Lamy, E. Salivary proteome and glucose levels are related with sweet taste sensitivity in young adults. Food Nutr. Res. 2017, 61, 1389208. [CrossRef]
- Dinnella, C.; Recchia, A.; Vincenzi, S.; Tuorila, H.; Monteleone, E. Temporary modification of salivary protein profile and individual responses to repeated phenolic astringent stimuli. Chem. Senses 2010, 35, 75–85. [CrossRef]
- Lamy, E.; Mowe, M.; Pinheiro, C.; Rodrigues, L.; Lopes, O.; Capela e Silva, F. Oral food perception and polyphenol-rich foods acceptance - the importance of knowing individuals saliva characteristics for promoting consumption. J. Int. Soc. Antioxidants 2016, 3, 1-4. [CrossRef]
- Piombino, P.; Genovese, A.; Esposito, S.; Moio, L.; Cutolo, P.P.; Chambery, A.; Severino, V.; Moneta, E.; Smith, D.P.; Owens, S.M.; Gilbert, J.A.; Ercolini, D. Saliva from obese individuals suppresses the release of aroma compounds from wine. PLoS One 2014, 9, e85611. [CrossRef]
- Lamy, E.; Simões, C.; Rodrigues, L.; Costa, A.R.; Vitorino, R.; Amado, F.; Antunes, C.; do Carmo, I. Changes in the salivary protein profile of morbidly obese women either previously subjected to bariatric surgery or not. J. Physiol. Biochem. 2015, 71, 691-702. [CrossRef]
- Rodrigues, L.; Mouta, R.; Costa, A.R.; Pereira, A.; Capela E Silva, F.; Amado, F.; Antunes, C.M.; Lamy, E. Effects of high fat diet on salivary α-amylase, serum parameters and food consumption in rats. Arch. Oral Biol. 2015, 60, 854-862. [CrossRef]
- Dsamou, M.; Palicki, O.; Septier, C.; Chabanet, C.; Lucchi, G.; Ducoroy, P.; Chagnon, M.-C.; Morzel, M. Salivary protein profiles and sensitivity to the bitter taste of caffeine. Chem. Senses 2012, 37, 87–95. [CrossRef]
- Cabras, T.; Melis, M.; Castagnola, M.; Padiglia, A.; Tepper, B.J.; Messana, I.; Tomassini Barbarossa, I. Responsiveness to 6-n-propylthiouracil (PROP) is associated with salivary levels of two specific basic proline-rich proteins in humans. PLoS One 2012, 7, e30962. [CrossRef]
- Vignini, A.; Borroni, F.; Sabbatinelli, J.; Pugnaloni, S.; Alia, S.; Taus, M.; Ferrante, L.; Mazzanti, L.; Fabri, M. General decrease of taste sensitivity is related to increase of BMI: A simple method to monitor eating behavior. Dis. Markers 2019, 2019. [CrossRef]
- Ahmed, K.; Penney, N.; Darzi, A.; Purkayastha, S. Taste Changes after Bariatric Surgery: a Systematic Review. Obes. Surg. 2018, 28, 3321–3332. [CrossRef]
- Ribeiro, G.; Camacho, M.; Fernandes, A.B.; Cotovio, G.; Torres, S.; Oliveira-Maia, A.J. Reward-related gustatory and psy-chometric predictors of weight loss following bariatric surgery: A multicenter cohort study. Am. J. Clin. Nutr. 2021, 113, 751-761. [CrossRef]
- Lucena, S.; Coelho, A.V.; Muñoz-Prieto, A.; Anjo, S.I.; Manadas, B.; Capela e Silva, F.; Lamy, E.; Tvarijonaviciute, A. Changes in the salivary proteome of beagle dogs after weight loss. Domest. Anim. Endocrinol. 2020, 72, 106474. [CrossRef]
- Rodrigues, L.; Espanca, R.; Costa, A.R.; Antunes, C.M.; Pomar, C.; Capela-Silva, F.; Pinheiro, C.C.; Domingues P.; Amado, F.; Lamy, E. Comparison of salivary proteome of children with different sensitivities for bitter and sweet tastes: association with body mass index. Int. J. Obes. 2019, 43, 701–712. [CrossRef]
- Nater, U.M.; Rohleder, N. Salivary alpha-amylase as a non-invasive biomarker for the sympathetic nervous system: Current state of research. Psychoneuroendocrinology 2009, 34, 486-496. [CrossRef]
- Lamy, E.; Neves, S.; Ferreira, J.; Rodrigues, L.; da Costa, G.; Cordeiro, C.; Fialho, L.; Lima, M.; Costa, A.R.; Antunes, C.M.; Lopes, O.; Amado, F.; Capela e Silva, F. Effects of hyperleptinemia in rat saliva composition, histology and ultrastructure of the major salivary glands. Arch. Oral Biol. 2018, 96, 1-12. [CrossRef]
- An, Z.; Wang, H.; Mokadem, M. Role of the Autonomic Nervous System in Mechanism of Energy and Glucose Regulation Post Bariatric Surgery. Front Neurosci. 2021, 15, 770690. [CrossRef]
- Koibuchi, E.; Suzuki, Y. Exercise upregulates salivary amylase in humans. Exp. Ther. Med. 2014, 7, 773-777. [CrossRef]
- Polito, R.; Valenzano, A.; Scarinci, A.; Villano, I.; Monda, M.; Messina, A.; Cibelli, G.; Porro, C.; La Torre, E.; Pisanelli, D.; Moscatelli, F.; Messina, G.; Monda, V. Very low-calorie ketogenic diet modulates the autonomic nervous system activity through salivary amylase in obese population subjects. Int. J. Environ. Res. Public Health 2021, 18, 8475. [CrossRef]
- Lamy, E.; Santos, V.; Barrambana, S.; Simões, C.; Carreira, L.; Infante, P.; Capela e Silva, F. Saliva Protein Composition Relates with Interindividual Variations in Bread Sensory Ratings. Starch - Stärke 2020, 73, 2000052. [CrossRef]
- Cai, H.; Daimon, C.M.; Cong, W.N.; Wang, R.; Chirdon, P.; De Cabo, R.; Sévigny, J.; Maudsley, S.; Martin, B. Longitudinal analysis of calorie restriction on rat taste bud morphology and expression of sweet taste modulators. J Gerontol A Biol Sci Med Sci. 2014, 69, 532-544. [CrossRef]
- Keller, K.L.; Steinmann, L.; Nurse, R.J.; Tepper, B.J. Genetic taste sensitivity to 6-n-propylthiouracil influences food preference and reported intake in preschool children. Appetite 2002, 38, 3–12. [CrossRef]
- Perkins, D.N.; Pappin, D.J.; Creasy, D.M.; Cottrell, J.S. Probability-based protein identification by searching sequence databases using mass spectrometry data. Electrophoresis 1999, 20, 3551-3567. [CrossRef]
- Xia, J.; Wishart, D.S. Using metaboanalyst 3.0 for comprehensive metabolomics data analysis. Curr. Protoc. Bioinformatics. 2016, 55, 14.10.1-14.10.91. [CrossRef]
Figure 1.
Representative salivary 2DE protein profiles (left – before, right – after weight loss).
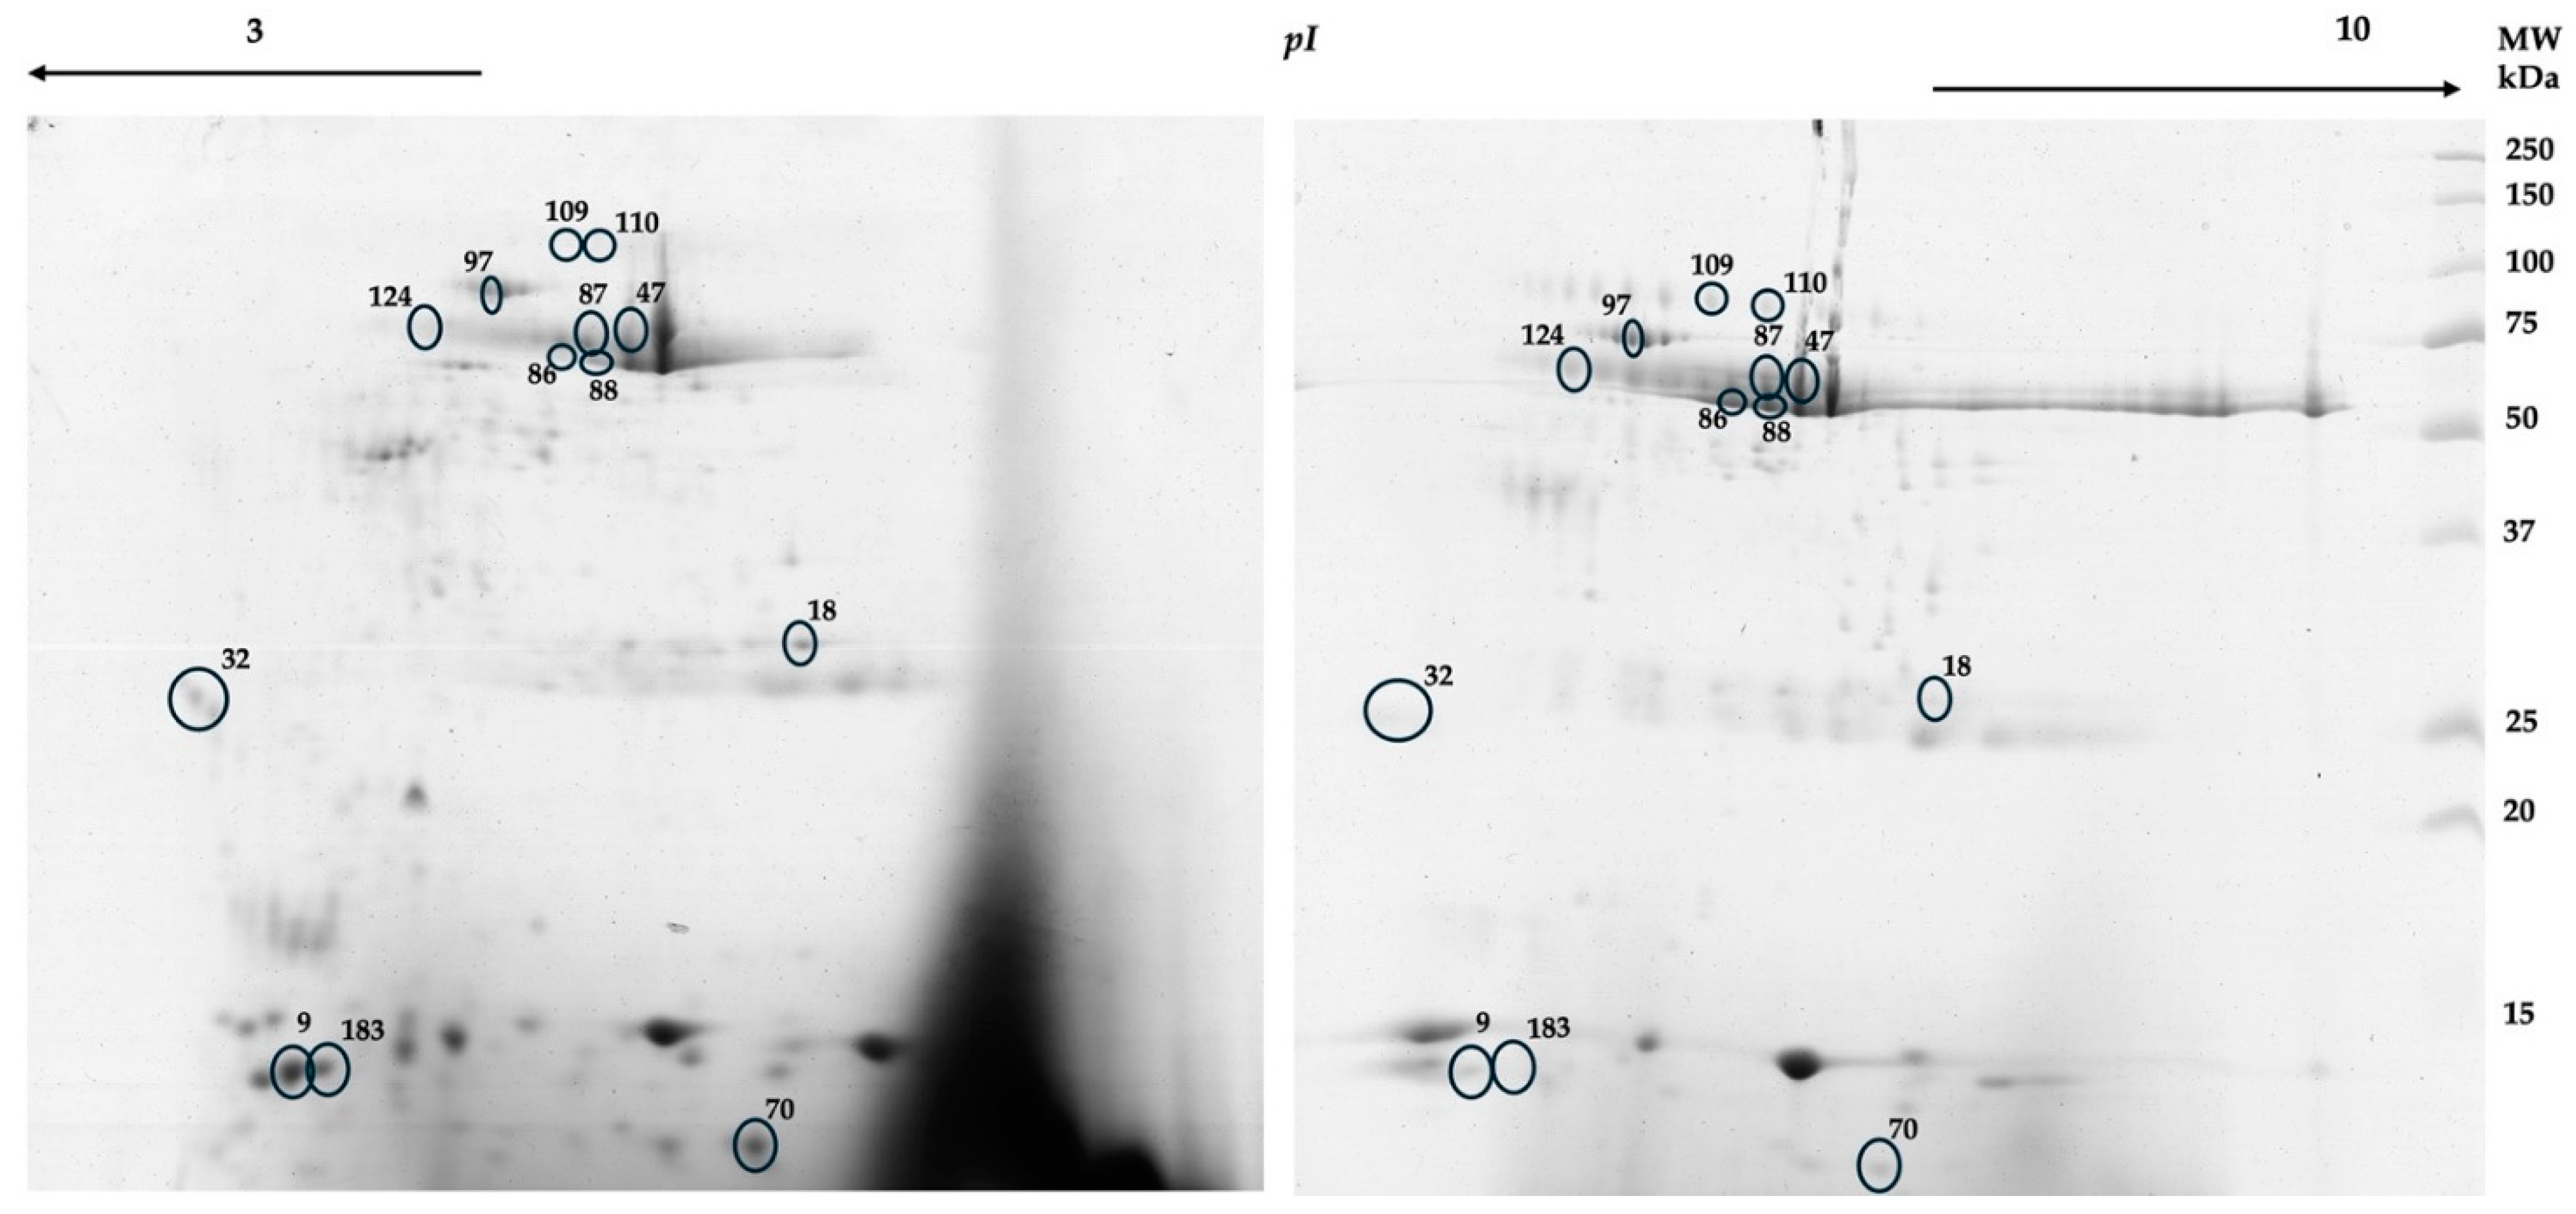
Figure 2.
Results from multivariate analysis of 2DE protein spots. (A) Partial Least Square Determinant Analysis (PLS-DA) model for saliva samples. X and Y axis show principal component 1 (PC1) and principal component 2 (PC2), respectively, and the contribution of each of them for explaining the total variance. (B) Variable Importance in Projection (VIP) represents the contribution score of the proteins that mostly contribute to the separation between the periods before and after weight loss. The red and green boxes on the right indicate the relative concentrations of the corresponding protein in each group under study. 0 – after; 1 –before.
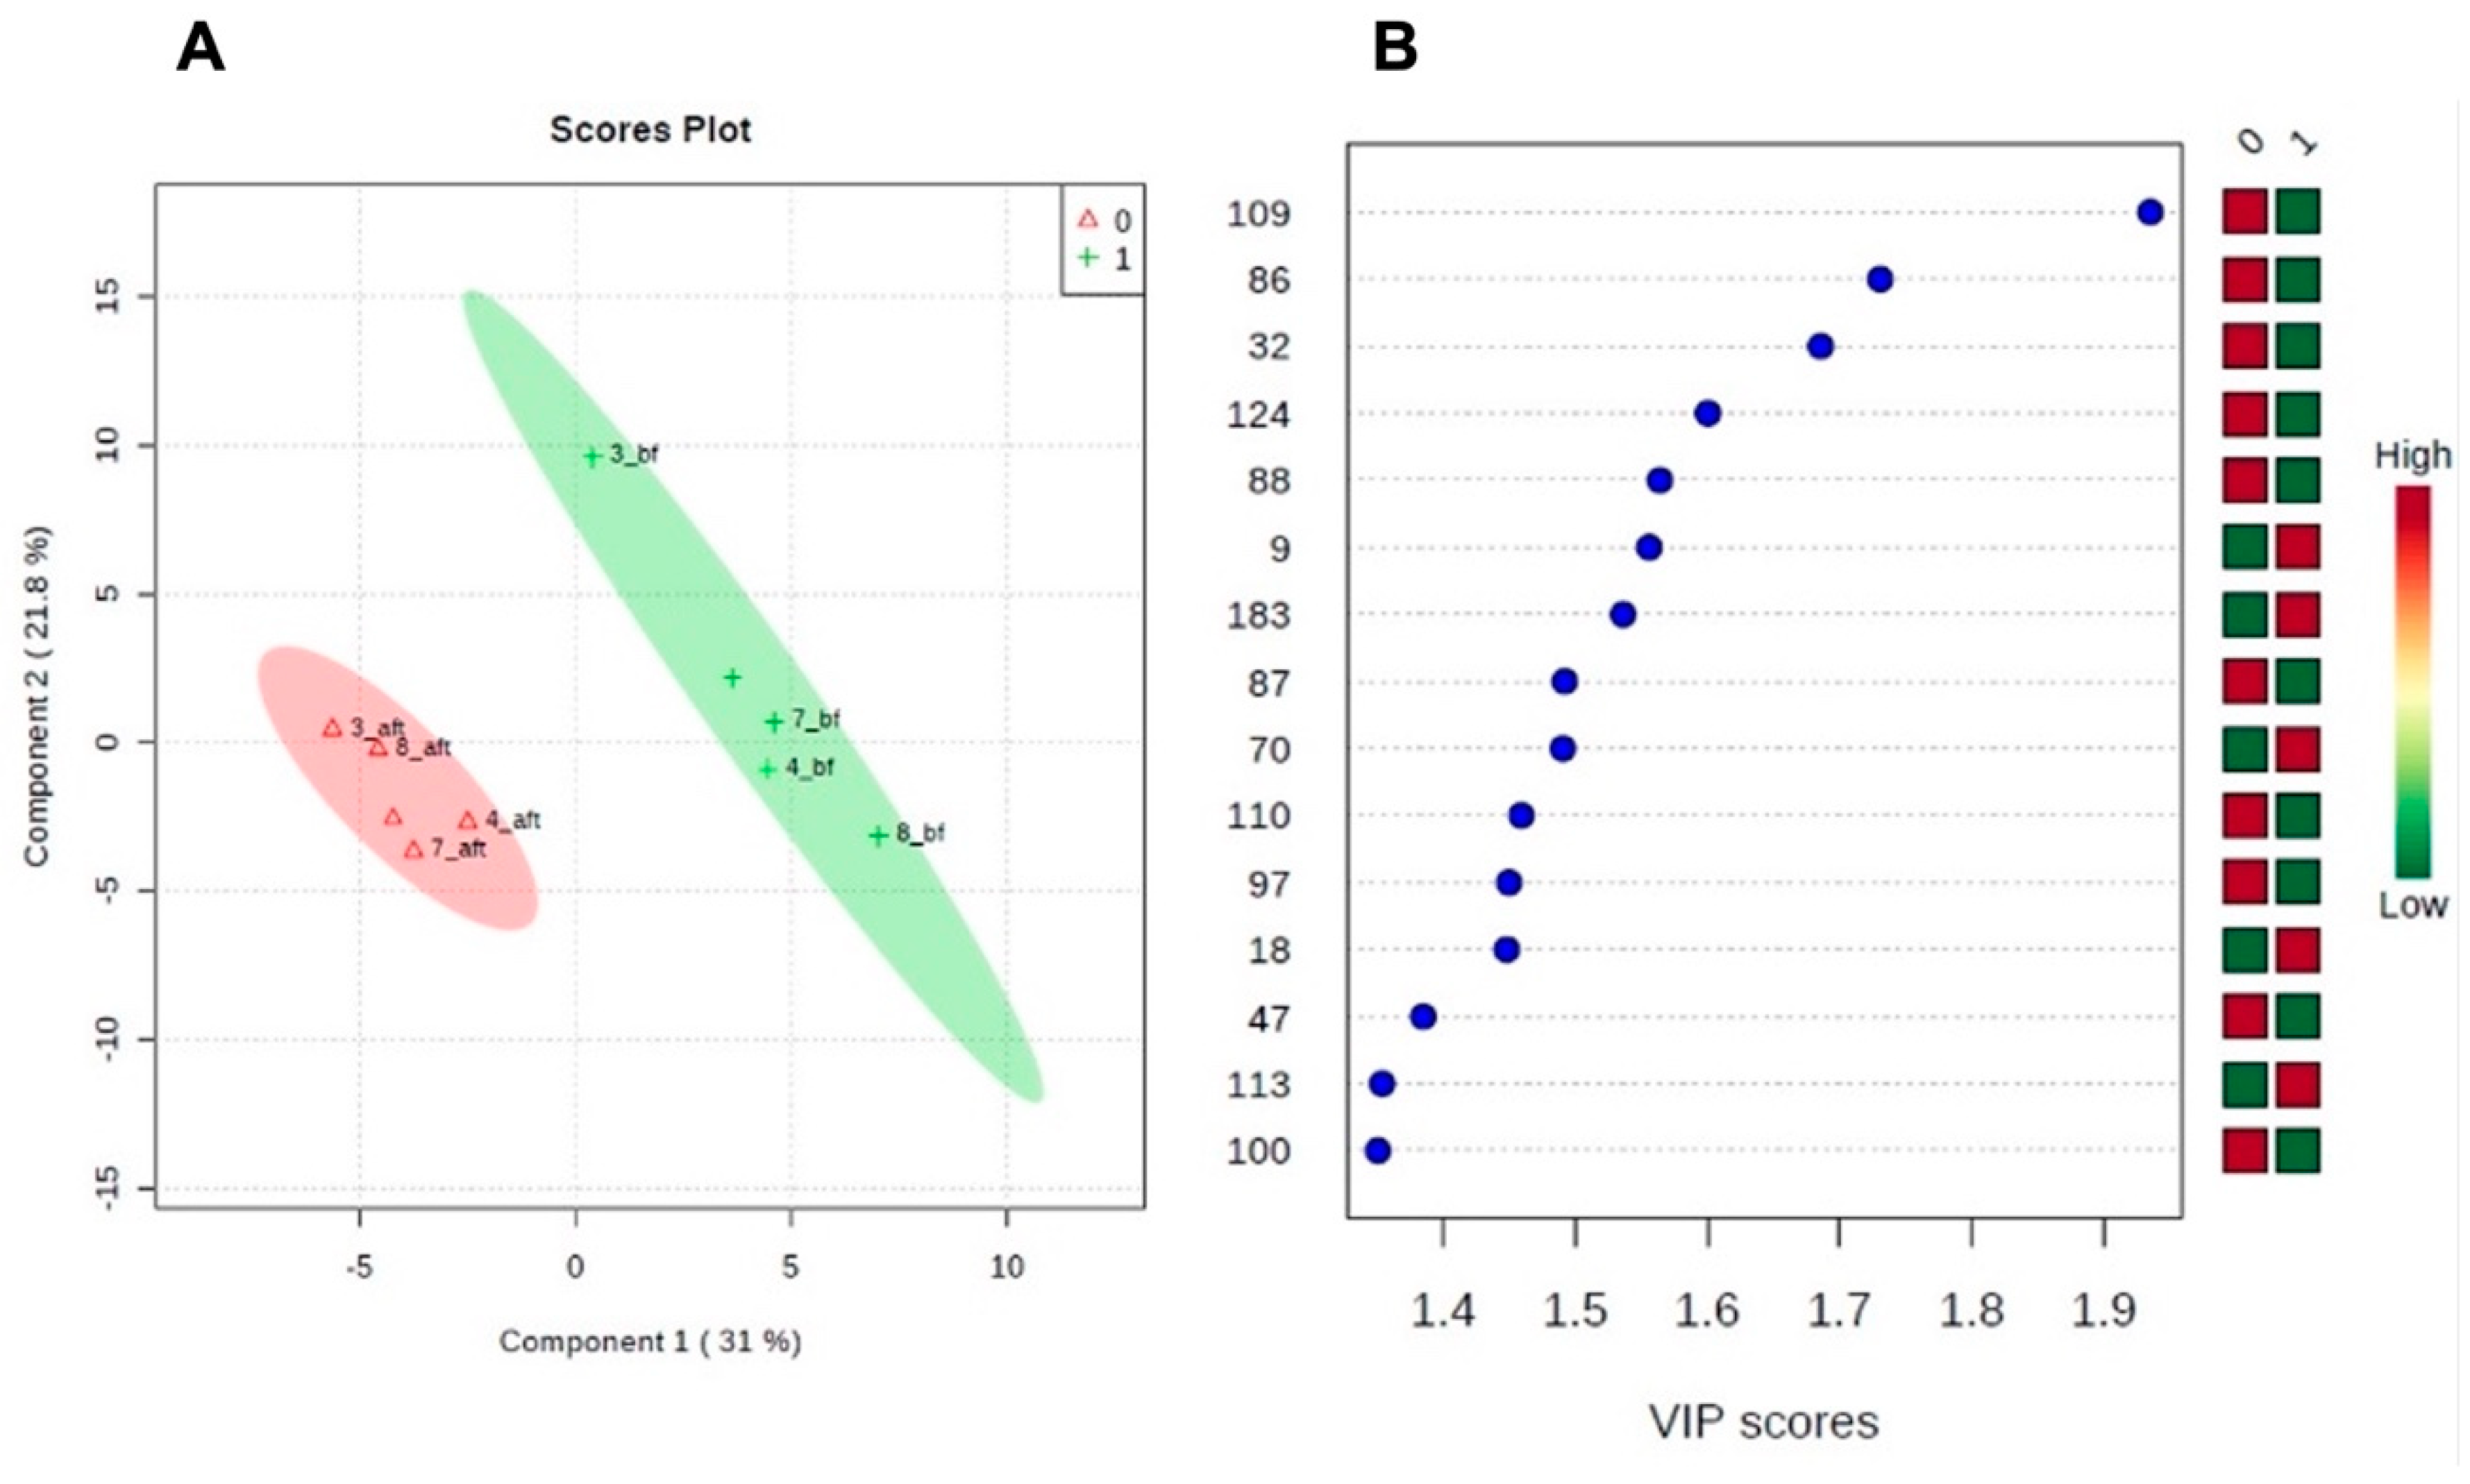
Figure 3.
Changes in salivary carbonic anhydrase VI (CA-VI) after weight loss. A – representative western blot results (B – before; A – after); B – mean changes between periods; C – individual changes in CA-VI expression levels.
Figure 3.
Changes in salivary carbonic anhydrase VI (CA-VI) after weight loss. A – representative western blot results (B – before; A – after); B – mean changes between periods; C – individual changes in CA-VI expression levels.
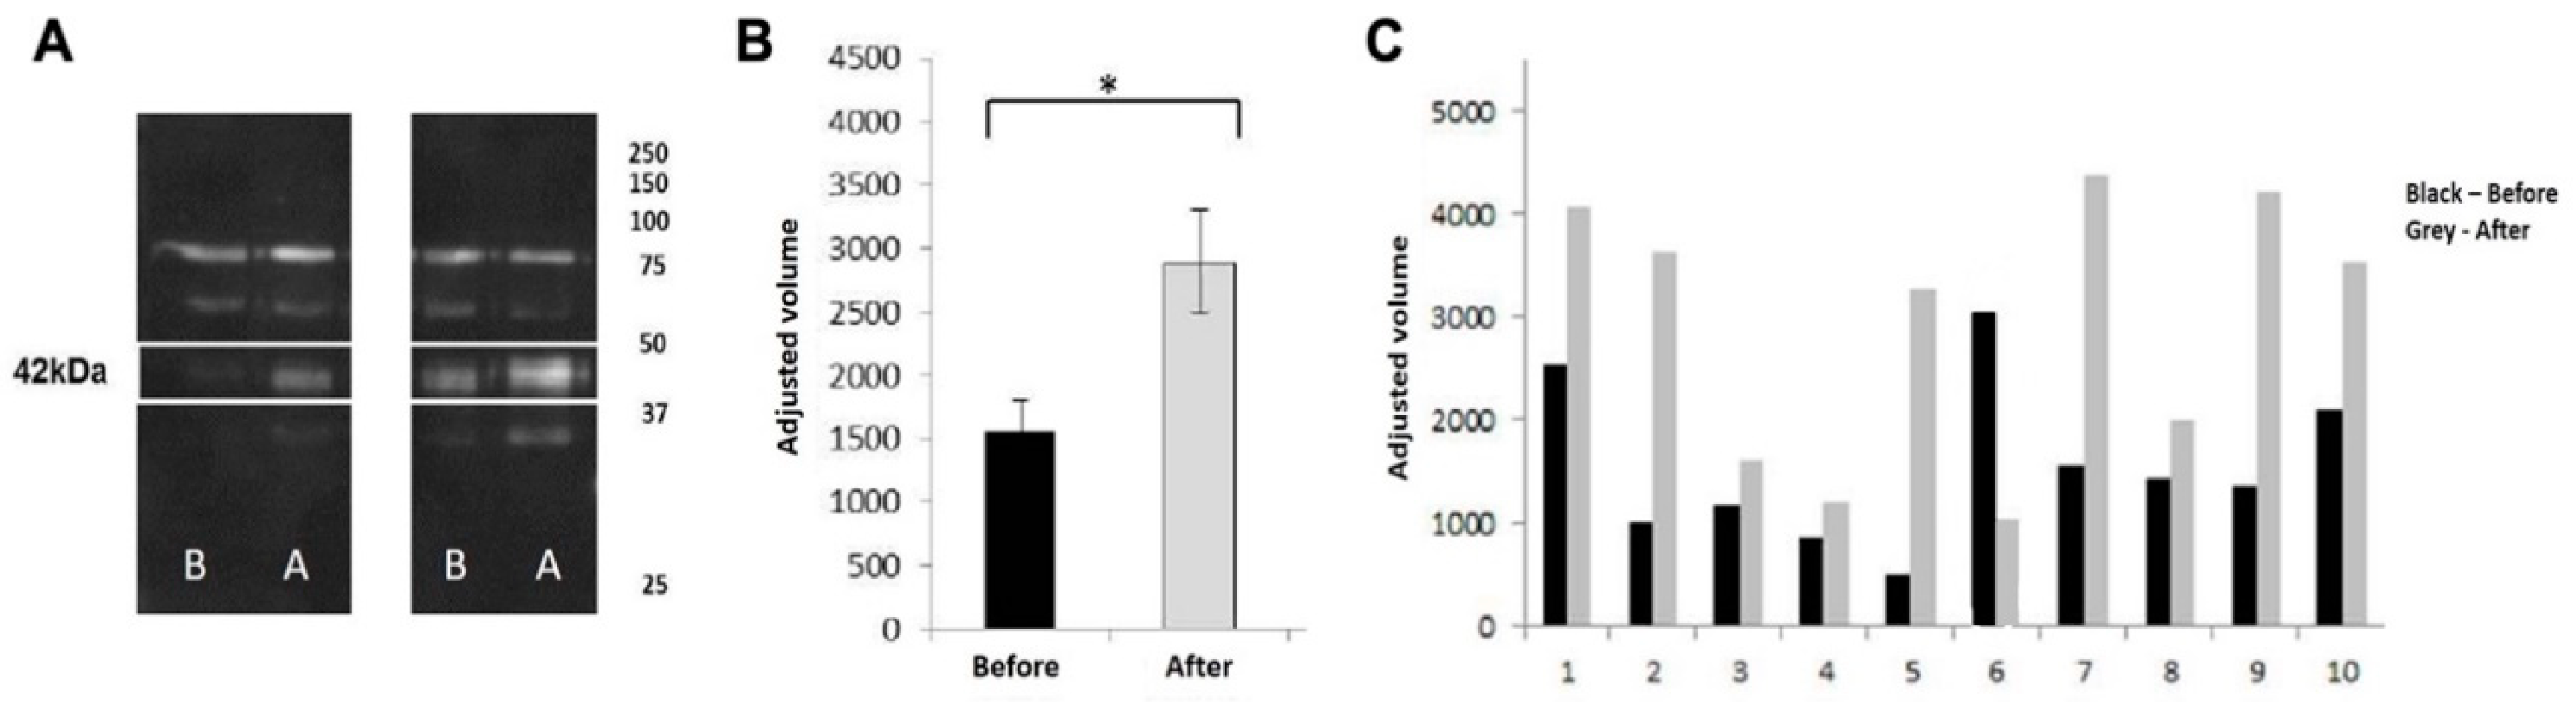
Figure 4.
Relationship between the expression levels of CA VI and the weight or fat mass lost in response to the program, in men.
Figure 4.
Relationship between the expression levels of CA VI and the weight or fat mass lost in response to the program, in men.
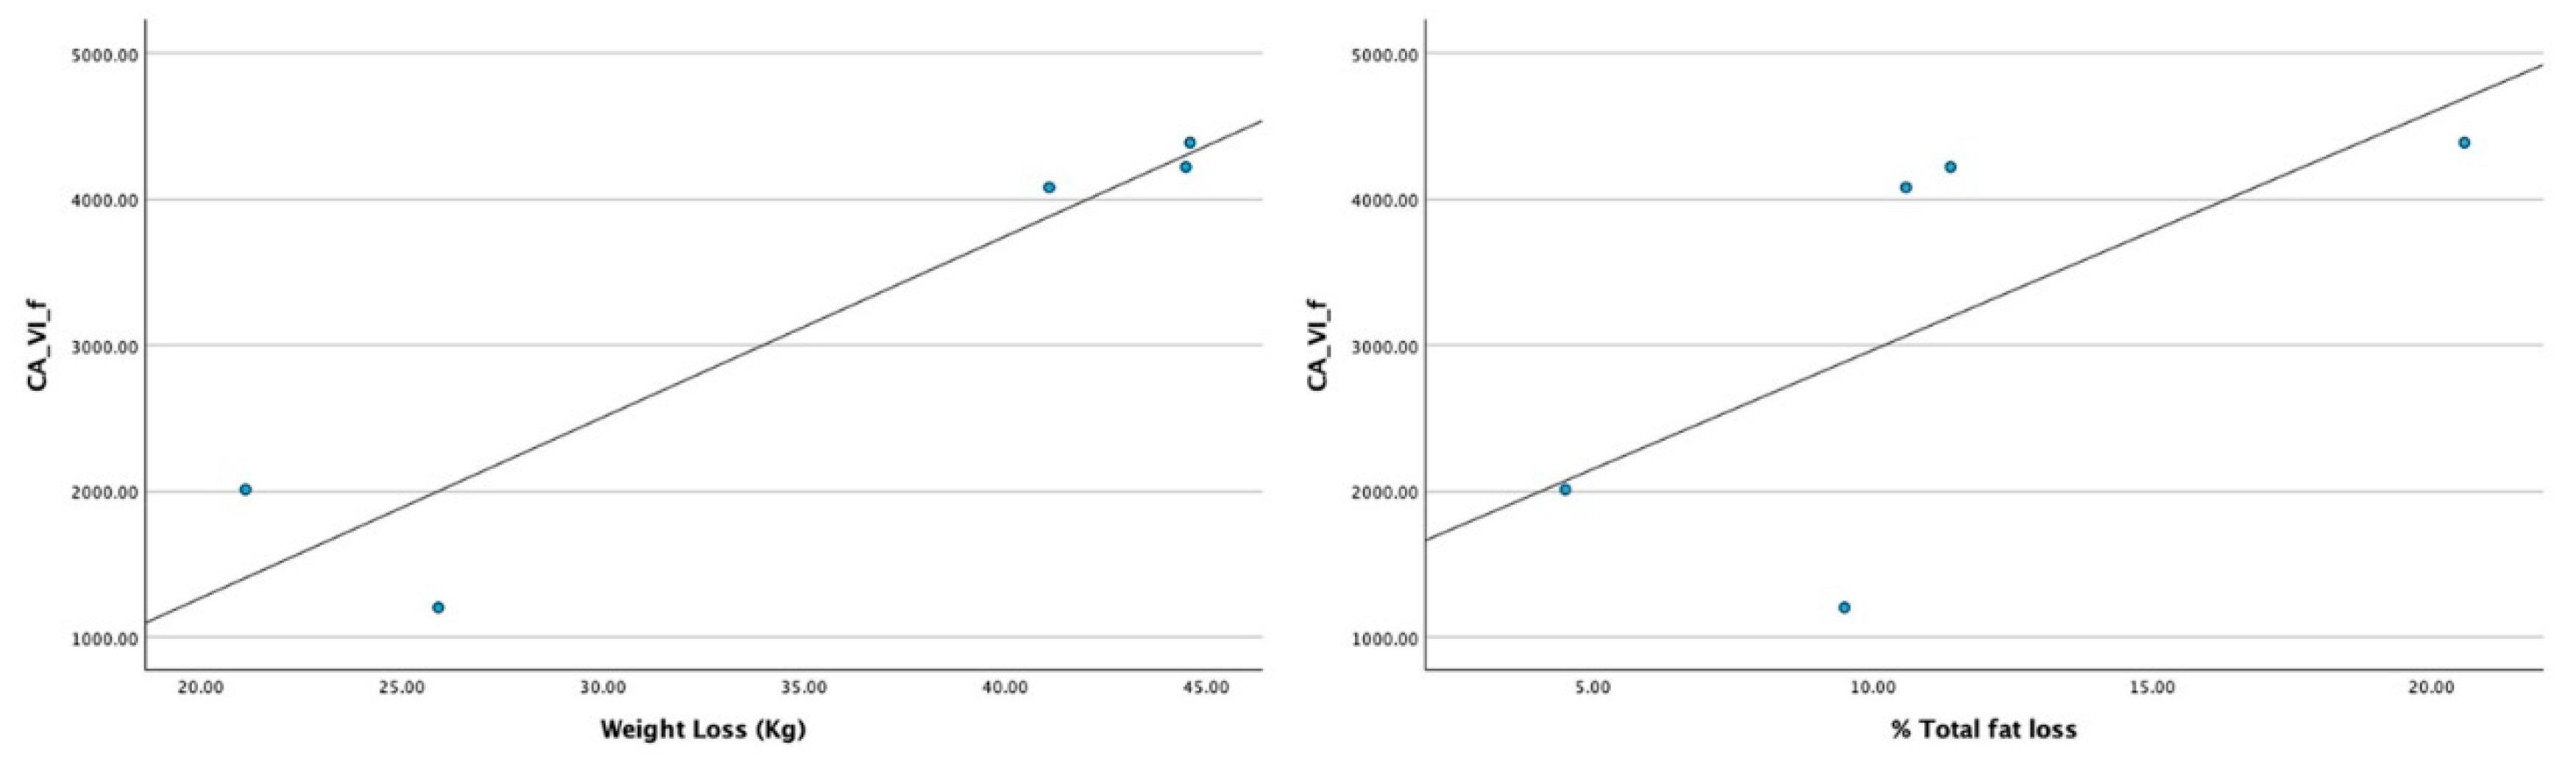

Table 1.
Anthropometric parameters of participants, before and after 8-weeks weight loss.
| Ind | Sex | Age | Before | After | Weight loss (%) |
Abdom. fat loss (%) | Total fat loss (%) |
||
|---|---|---|---|---|---|---|---|---|---|
| Weight (kg) | BMI (kg/m2) | Weight (kg) | BMI (kg/m2) |
||||||
| 1 | M | 32 | 133.7 | 46.81 | 92.6 | 32.4 | 30.7 | 15.0 | 10.6 |
| 2 | F | 24 | 117.6 | 42.68 | 94.8 | 34.4 | 19.4 | 11.9 | 7.8 |
| 3 | F | 25 | 100.0 | 39.56 | 68.2 | 27.0 | 31.8 | 20.1 | 13.8 |
| 4 | M | 35 | 131.6 | 39.73 | 105.7 | 31.9 | 19.7 | 12.7 | 9.5 |
| 5 | F | 31 | 103.4 | 34.15 | 78.7 | 26.0 | 23.9 | 15.5 | 14.0 |
| 6 | F | 21 | 126.6 | 49.45 | 95.9 | 37.5 | 24.3 | 8.6 | 4.6 |
| 7 | M | 22 | 129.8 | 40.06 | 85.2 | 26.3 | 34.4 | 30.7 | 20.6 |
| 8 | M | 34 | 197.3 | 58.28 | 176.2 | 52.0 | 10.7 | 6.2 | 4.5 |
| 9 | M | 39 | 150.7 | 49.78 | 106.2 | 35.1 | 29.5 | 15.0 | 11.4 |
| 10 | F | 19 | 115.9 | 38.72 | 101.1 | 33.8 | 12.8 | 6.0 | 3.8 |
Table 2.
Mass spectrometry identification of the salivary protein spots contributing for the differences induced by weight loss (WL).
Table 2.
Mass spectrometry identification of the salivary protein spots contributing for the differences induced by weight loss (WL).
| Spot | Protein | Uniprot entry | Id Score | Seq. Cov.(%) | % Vol (mean ± s.e.) | Δ | ||
|---|---|---|---|---|---|---|---|---|
| Before WL | After WL | Ratio (A/B)1 | ||||||
| 9 | Cystatin S | P01036 | 57 | 45 | 4.45±1.59 | 0.16±0.12 | 0.036 | ↓ |
| 18 | Polymeric immunoglobulin receptor | P01833 | 120 | 14 | 0.27±0.10 | 0.03±0.01 | 0.11 | ↓ |
| 32 | Immunoglobulin J chain | P01591 | 56 | 26 | 0.75±0.19 | 1.49±0.12 | 1.99 | ↑ |
| 47 | Alpha-amylase 1 | P04745 | 138 | 31 | 1.53±0.14 | 5.16±1.69 | 3.37 | ↑ |
| 70 | n.i. | 1.32±0.49 | 0.11±0.06 | 0,083 | ↓ | |||
| 86 | Alpha-amylase 1 | P04745 | 117 | 33 | 0.66±0.32 | 2.05±0.22 | 3,10 | ↑ |
| 87 | Alpha-amylase 1 | P04745 | 104 | 17 | 0.66±0.17 | 1.83±0.45 | 2,77 | ↑ |
| 88 | Alpha-amylase 1 | P04745 | 159 | 40 | 0.19±0.14 | 0.95±0.24 | 5.00 | ↑ |
| 97 | Serum albumin | Q86YG0 | 255 | 45 | 0.07±0.06 | 0.23±0.04 | 3.29 | ↑ |
| 109 | Polymeric immunoglobulin receptor | P01833 | 116 | 17 | 0.05±0.04 | 0.44±0.05 | 8.80 | ↑ |
| 110 | Polymeric immunoglobulin receptor | P01833 | 120 | 14 | 0.12±0.11 | 0.67±0.21 | 5.58 | ↑ |
| 124 | Ig alpha-2 chain C region | P01877 | 109 | 33 | 0.02±0.02 | 1.11±0.38 | 55,5 | ↑ |
| 183 | Mixture (Cystatin-S + Prolactin inducible protein) | P01036 + P12273 | 103 (82 + 64) | 43 + 40 | 7.26±2.51 | 0.63±0.33 | 0.09 | ↓ |
1 Ratio of the spots % volume between after (A) and before (B) weight loss; n.i. – not identified, due to failure in mass spectra acquisition; MS data presented as supplementary material.
Table 3.
Spearman correlations between expression levels (Western Blot) of CA VI and weight and fat variation after the program.
Table 3.
Spearman correlations between expression levels (Western Blot) of CA VI and weight and fat variation after the program.
| % abdominal fat loss | % total fat loss | weight loss (kg) | ||
| Total (N=10) | ||||
| CA VI | Corr coef. | .358 | .394 | .418 |
| p-value | .310 | .260 | .229 | |
| Men (N=5) | ||||
| CA VI | Corr coef. | .800 | .900 | .900 |
| p-value | .104 | .037* | .037* | |
| Women (N=5) | ||||
| CA VI | Corr coef. | -.200 | -.100 | -.800 |
| p-value | .747 | .873 | .104 | |
Disclaimer/Publisher’s Note: The statements, opinions and data contained in all publications are solely those of the individual author(s) and contributor(s) and not of MDPI and/or the editor(s). MDPI and/or the editor(s) disclaim responsibility for any injury to people or property resulting from any ideas, methods, instructions or products referred to in the content. |
© 2025 by the authors. Licensee MDPI, Basel, Switzerland. This article is an open access article distributed under the terms and conditions of the Creative Commons Attribution (CC BY) license (http://creativecommons.org/licenses/by/4.0/).
Copyright: This open access article is published under a Creative Commons CC BY 4.0 license, which permit the free download, distribution, and reuse, provided that the author and preprint are cited in any reuse.


