
Submitted:
09 January 2024
Posted:
11 January 2024
You are already at the latest version
Abstract
Obesity entails metabolic alterations across multiple organs, highlighting the role of inter-organ communication in its pathogenesis. Extracellular vesicles (EVs) are communication agents in physiological and pathological conditions and although they have been associated with obesi-ty-comorbidities, their protein cargo in this context remain largely unknown. To decipher the messages encapsulated in EVs, we isolated plasma derived EVs from diet induced obese murine models. Obese plasma EVs exhibited a decline in protein diversity while control EVs revealed significant enrichment in protein folding functions, highlighting the importance of proper folder in maintaining metabolic homeostasis. Previously, we revealed that gut derived EVs proteome holds particular significance in obesity. Here, we compared plasma and gut EVs and identified four proteins exclusively present in the control state of both EVs, revealing the potential for a non-invasive assessment of gut health by analyzing blood derived EVs. Given the relevance of post-translational modifications (PTMs), we observed a shift in chromatin-related proteins from glycation to acetylation in obese gut EVs, suggesting a regulatory mechanism targeting DNA transcription during obesity. This study provides valuable insights into novel roles of EVs and protein post-translational modifications in the intricate mechanisms underlying obesity, shed-ding light on potential biomarkers and pathways for future research.
Keywords:
Extracellular Vesicles
; Obesity
; Prediabetes
; Metabolism
; Proteomics
; Post-Translational Modifications
; Acetylation
; Glycation
1. Introduction
Obesity is a growing global concern, with over 1 billion people affected, and unfortunately the numbers continue to rise [1]. While genetics play a role, the increasing global prevalence of obesity is partially due to environmental factors, such as dietary habits, which are major contributors to the obesity epidemic [2,3,4]. The adoption of a westernized lifestyle, which promotes greater consumption of calorie-rich and palatable foods while reducing physical activity, is a root cause of the obesity epidemic. For instance, over consumption of foods with over 30% of total daily energy intake from fat, has contributed to the increase in obesity in the past years [3,4,5]. Additionally, the consumption of high fat foods is strongly associated with a pro-inflammatory state, leading to deleterious consequences for organismal homeostasis [6]. Furthermore, excessive consumption of certain carbohydrates, particularly rapidly digestible carbohydrates, has been linked to suboptimal glycemic control in individuals with diabetes [7]. Therefore, obesity arises from an imbalance between energy intake and expenditure, resulting in excess energy stored as fat in various organs, especially in adipose tissue [8]. This excess fat is associated with systemic complications, including hypertension, dyslipidemia, insulin resistance, and type 2 diabetes (T2D), posing a major healthcare challenge [9,10,11].
Obesity impacts all organs; thus, its progression and associated comorbidities are modulated by inter-organ communication networks. Importantly, extracellular vesicles (EVs) are essential players in this intricate inter-organ dialogue, intimately linked to the pathophysiology of obesity and diabetes [12,13]. EVs are bilayer vesicles, typically measuring between 40 to 5000 nm in diameter, acting as carriers of diverse bioactive molecules, such as proteins, nucleic acids, and lipids [14,15,16,17]. Several studies have shed light on the impact of organ derived EVs on metabolic homeostasis [16,18,19,20]. Importantly, growing evidence strongly suggests that EVs-mediated crosstalk between adipose tissue, liver, and skeletal tissue are key contributors to the development of insulin resistance [21,22,23,24,25]. Furthermore, EVs released by adipose tissue trigger abnormal activation of immune cells and endothelial dysfunction, which could explain vascular complications linked to obesity [26,27,28]. Crucially, when lean mice were administered EVs isolated from control mice but loaded with miRNAs associated with obesity, it resulted in increased glucose intolerance and hepatic steatosis [29]. Conversely, the administration of EVs from lean mice to obese mice ameliorated these conditions [30]. This highlights the significant role of miRNAs carried by EVs in triggering obesity associated traits, even within a healthy context.
Although the miRNA content of EVs has received considerable attention, there is a knowledge gap concerning the protein cargo of these vesicles in the context of diet induced obesity. Recently, we observed significant alterations in the protein content of gut-derived EVs isolated from a diet-induced obese mouse model [31]. The gut plays a significant role in maintaining metabolic homeostasis and is a key player in the development of obesity through different actions, including microbiota composition, hormone secretion and nutrient absorption, and its crucial connection to the central nervous system through the gut-brain axis [32,33]. Interestingly, bariatric surgery, the most effective intervention for weight loss, involves alterations in the anatomy of the small intestine and leads to T2D remission even before significant weigh loss occurs [34,35]. Individuals with T2D who undergo bariatric surgery and achieve T2D resolution display distinct protein profiles in their circulating EVs, setting them apart from those in whom T2D persists post-surgery [36]. This underscores the importance of defining proteome profiles in the context of obesity and their potential role as predictors of resolution for obesity-related comorbidities following bariatric surgery.
Circulating EVs form a dynamic network that facilitates interorgan communication by transporting a diverse array of organ-derived EVs, collectively forming a heterogenous pool of EVs. These EVs act as messengers, transmitting vital molecular information across various cells and organs. It is worth noting that the number of small EVs is elevated in the circulation of patients with insulin-resistance [37] and in individuals with T2D [38]. Notably, obese individuals exhibit a substantial (~10-fold) increase in plasma EVs levels compared to those maintaining a healthy weight [39,40,41]. On the contrary, interventions such as hypocaloric diets, exercise, and weight loss through bariatric surgery have been shown to reduce plasma EVs levels [39,40,42].
Protein post-translational modifications (PTMs) play a significant role in obesity and diabetes by influencing insulin signaling and glucose metabolism, and thus, the development of associated complications [43,44,45]. Two noteworthy PTMs are acetylation and glycation, being the first one tightly associated with high acetyl-CoA and NAD+ levels and the second one with elevated blood glucose levels [46,47,48,49,50]. While lysine acetylation is thought to play a crucial role in maintaining energy homeostasis [51], limited reports suggest that acetylation impacts the sorting of specific proteins and/or RNA molecules into EVs [52]. Moreover, lysine acetylation is important in both immunological and metabolic pathways and helps in maintaining the equilibrium between energy storage and expenditure [53]. For instance, lysine acetylation of non-histone proteins contributes to the cardiac energy disorders seen in obesity, diabetes, and heart failure [54,55]. Therefore, it was speculated that acetylation is likely to become an effective means of monitoring obesity in the future [56]. Glycation is a spontaneous chemical reaction between certain amino acids and reducing sugars, leading to the formation of advanced glycation end-products (AGEs) [57,58]. AGEs are considered to be the primary culprits behind various diabetic complications [59,60]. Importantly, one major precursor of AGEs formation is methylglyoxal, a byproduct of glycolysis, strongly linking glycation to hyperglycemia, diabetes and obesity [47,50]. Interestingly, glycated hemoglobin (HbA1c) is used as a marker for the diagnosis of diabetes [61,62]. Nevertheless, there is a clear need for further research delving into these PTMs in the context of metabolic diseases.
Here we evaluate EVs protein content in obesity providing crucial insights into proteomic changes and PTMs in plasma and gut EVs. This sheds light on the complex mechanisms of diet-induced obesity and prediabetes, highlighting potential biomarkers and pathways for future research.
2. Materials and Methods
2.1. Mouse Models
Six-week-old male C57Bl/6J mice were housed in a temperature-controlled room under a regular light/dark cycle of 12 h and with food and water ad libitum. For induction of prediabetes, mice were fed a high-fat diet (HFD) (OpenSource Diet, D12331) composed of 16.5 % protein, 25.5 % carbohydrate, and 58 % fat with 13% addition of sucrose for 12 weeks. Control mice were fed a normal chow diet (NCD) (Special Diets Services, RM3) composed of 26.51% proteins, 62.14% carbohydrates, and 11.35% fat for the same period. After 12 weeks of diet, mice were subjected to a 8 h fasting period, followed by a 2 h feeding window, and concluded with a 12 h fasting period. Mice were then anesthetized with isoflurane and sacrificed. Blood was collected into a heparinized tube, which was then centrifuged at 500 g for 10 minutes. The supernatant was collected and centrifuged at 3000 g for 20 minutes to obtain plasma, which was stored at -80 °C for EVs isolation. Three biological replicates were performed per experimental condition (diet induced obesity and control groups). Each replica was generated by pooling plasma from 20 animals. Experimental protocols were approved by the Ethics Committee of the NOVA Medical School (nr.82/2019/CEFCM).
2.2. Intra-Peritoneal Glucose Tolerance Test (ipGTT)
In the 11th week of diet, intra-peritoneal glucose tolerance test (ipGTT) was performed after an overnight fasting. Basal glycemia and weight were measured, and then an intra-peritoneal injection of glucose (Sigma Aldrich) at 2 g/kg body weight was administered. Blood glucose levels were measured by tail tipping at 15, 30, 60, 90 and 120 minutes after the injection using a OneTouch Ultra glucose meter (LifeScan Inc.). The evaluation of the glycemic response was performed by calculating the total area under the whole glucose excursion, using the blood glucose concentration at timepoint 0 minutes as the baseline.
2.3. Hematoxylin-eosin staining
The liver was rinsed with phosphate buffered saline (PBS) and placed in 2 % paraformaldehyde (PFA) with 20 % sucrose overnight at 4 °C. After 3 PBS washes, the liver was transferred to 30 % sucrose solution for 2 hours at 4 °C, followed by an overnight incubation in Optimal Cutting Temperature (OCT) compound with 30 % sucrose solution (1:1 ratio). Next, the liver was embedded in molds using a mixture of OCT compound and 20 % sucrose solution (3:1 ratio) and stored at -80 °C. Then, the liver was sliced into 6 μm thin sections in the cryostat and stored at -80 °C for following Hematoxylin-Eosin + Oil Red O staining.
2.4. Extracellular Vesicles isolation
Plasma stored at -80 °C was centrifuged at 12,000 g for 20 minutes, supernatant was then subjected to an ultracentrifugation (Beckman Ti70, rotor 70Ti) at 100,000 g, for 140 minutes. The EV-enriched pellet was collected. This pellet was resuspended in filtered PBS and layered on top of a sucrose solution. This sucrose solution was prepared with 30 g of protease-free sucrose (Sigma), 2.4 g of Tris-base (Sigma) in 100 mL of D2O (Sigma); pH was adjusted to 7.4. Resuspended EVs over the sucrose cushion were centrifuged at 100,000 g, for 70 min. The fraction of sucrose cushion containing EVs was collected and transferred to a new tube with PBS. An overnight centrifugation was then performed at 100,000 g, and the EV pellet was collected and resuspended in filtered PBS.
2.5. Nanoparticle tracking analysis (Nanosight)
The concentration and size of EVs were analyzed in NanoSight NS300 (NS3000) following the manufacturer’s guidelines. Briefly, EVs were diluted at a ratio of 1:1000 in filtered sterile PBS. Each sample was analyzed for 90 s, with measurements taken five times using the Nanosight automatic settings.
2.6. Protein quantification
We prepared protein extracts using a lysis buffer composed of 20 mM Tris-HCl at pH 7.4, 5 mM EDTA at pH 8.0, 1% Triton-X 100, 2 mM Na3VO4, 100 mM NaF, and 10 mM Na4P2O7, supplemented with protease inhibitors (cOmpleteTM, Mini, EDTA-free protein inhibitor cocktail tablets, Roche, Sigma). Plasma EVs were homogenized in lysis buffer and subjected to three rounds of sonication (Sonifier SFX 150, Branson), each lasting 10 seconds at 10 μm amplitude, with cooling on ice between each sonication. Lysates underwent centrifugation at 18,000 g for 10 min at 4°C. The resulting supernatant was collected, and the total protein concentration was determined using the PierceTM BCA Protein Assay kit (Thermo Fisher).
2.7. Nano-LC-MS/MS analysis
Each biological replicate was analyzed twice, yielding two technical replicates. Peptide samples were analyzed by nano-LC-MS/MS (Dionex RSLCnano 3000) coupled to a Q-Exactive Orbitrap mass spectrometer (Thermo Scientific). In summary, 5 μL of sample was loaded onto a fused capillary pre-column (2 cm length, 360 μm outer diameter, 75 μm inner diameter) with a flow of 5 μL/min for 7 min. The trapped peptides were then separated on a fused capillary column (20 cm length, 360 μm outer diameter, 75 μm inner diameter) packed with ReproSil Pur C18 3-μm resin (Dr. Maish, Ammerbuch- Entringen, Germany) using a linear gradient. The gradient started from 92 % of mobile phase A (0.1 % formic acid in water) and transitioned to 28 % of mobile phase B (0.1 % formic acid in 100 % acetonitrile) over 93 min, followed by a linear gradient from 28 % to 35 % of mobile phase B over 20 min, both gradients at a flow rate of 300 nL/min. Mass spectra were acquired in positive ion mode, employing an automatic data-dependent switch. Initially, an Orbitrap survey MS scan was conducted in the mass range of 400 m/z to 1200 m/z. Subsequently, higher-energy collision dissociation (HCD) fragmentation and Orbitrap detection (MS/MS scan) were performed for 15 the most intense ions observed in the initial MS scan. The automatic gain control (AGC) target value in the Orbitrap for the MS and MS/MS scans was set to 1,000,000 ions, at a resolution of 70,000 ions at 200 m/z for MS scans and 25,000 ions at 200 m/z for MS/MS scans. Fragmentation in the HCD cell was achieved with a normalized collision energy of 31 eV. The ion selection threshold for MS/MS analysis was set at 5,000 ions. The maximum injection time for MS scans was 100 ms, while for MS/MS scans it was 200 ms. The selected sequenced ions were dynamically excluded for 60 seconds.
2.8. Database Search
Mass accuracy was set to 5 ppm for peptides and 0.01 Da for ionized fragments. Trypsin cleavage allowing a maximum of four missed cleavages was used. Carbamidomethyl was set as a fixed modification. Methionine oxidation, lysine and N-terminal protein acetylation, lysine glycation (carboxymethyl, carboxyethyl, and pyrraline), arginine glycation (argpyrimidine, glyoxal and methylglyoxal-derived hydroimidazolones, and tetrahydro pyrimidine), glutamine deamidation and asparagine deamidation were set as variable modifications. The MS/MS spectra were searched against all reviewed protein sequences available in a standard mouse proteome database from UniProt (UP000000589). For the search, all protein sequences were also concatenated in reverse order, with lysine and arginine residues maintained in original position. The data was searched and quantified with both MaxQuant [63] and VEMS [64].
2.9. Proteomic functional enrichment analysis
The results from MaxQuant and VEMS searches were processed using Python and then subjected to functional enrichment analysis in R with the clusterProfiler [65] package. Spectral count [66] and intensity-based absolute quantification (iBAQ) [67] values were calculated for all identified proteins. Differential expression analysis was performed using the limma R package [68]. To select proteins exclusively identified in one experimental group, the selection criteria were based on the spectral count of proteins in both groups, defined as the number of MS/MS spectra associated with peptides from a given protein. For instances, if a protein was associated with at least 1 spectrum in one group but none in the other group, it was categorized as exclusively identified in the former. Proteins with spectra identified in samples from both groups were considered shared between HFD-PDEV and NCD-PDEV. Genes of proteins identified with a false discovery rate (FDR) lower than 0.01 underwent over-representation analysis (ORA) [69], using Gene Ontology [70,71] and KEGG [72,73,74] databases.
2.10. Statistical Analysis
Data were analyzed using GraphPad Prism Software, version 9.0.0 (GraphPad Software Inc., San Diego, CA, USA) and presented as mean values with the standard error of the mean (SEM). The significance of the differences between the groups was calculated by unpaired student’s t tests with Welch’s correction. Differences were considered significant as p-value ≤ 0.05.
3. Results
3.1. Evaluation of diet-induced obesity’s effects on plasma derived EVs
To investigate the impact of diet-induced obesity on protein content and PTMs within EVs, we established a murine model designed to replicate obesity hallmarks. A high fat and sugar diet (HFD) was initiated at 6 weeks of age and continued for a duration of 12 weeks to induce obesity in mice (Figure 1a). Mice on HFD exhibited an increase in body weight and hepatic lipid accumulation when compared to the control (Figure 1b, c). To further assess the metabolic impact of obesity, at 11 weeks of diet, both HFD and NCD mice underwent an intraperitoneal glucose tolerance test (ipGTT). HFD mice displayed reduced glucose removal from the circulation relative to NCD mice, thus indicating impaired glucose tolerance as a consequence of obesity (Figure 1d, e).
Next, we analyzed the presence of proteins, as well as acetylation and glycation events within plasma EVs in the context of obesity. The protein content of EVs is dependent on the organ they originate from. As a result, EVs found in the bloodstream consist of a diverse mix released from different organs, aiding in inter-organ communication. The possibility of isolating EVs from body fluids boosts their potential as biomarkers for diagnosing and/or predicting treatment outcomes. Moreover, they serve as therapeutic tools for various diseases. Therefore, to gain insights into the messages sent by organs in obesity we isolated plasma EVs. We isolated of plasma EVs, which poses a substantial challenge, particularly when dealing with reduced volume samples from murine models. To address this limitation, we pooled samples from 20 animals for each biological replicate. Plasma EVs were characterized by nanoparticle tracking analysis (NTA) and total protein content was quantified by BCA. Both NCD and HFD plasma EVS presented mean sizes ranging between 100 to 150 nm (Figure S1), which falls well within the size range for small EVs, particularly exosomes [15]. Noteworthy, we refrain from classifying these EVs as exosomes, since we did not analyze their intracellular origin. NTA and protein quantification revealed a higher particle number and total protein concentration in EVs isolated from HFD mice, resulting in a similar protein content per particle in both experimental groups (Figure 1f-h). Similarly, an increase in circulating EVs under obesity and diabetes was observed in human studies [39,40,41,75].
All statistical analysis were performed using Unpaired t-test with Welch’s correction. All data are presented as mean ± standard error of the mean. *P-value < 0.05; **** P-value < 0.0001. † Each n is a poll of 20 animals, n=3 for plasma EVs in both groups.
3.2. Proteomic analysis of plasma derived EVs
Next, we analyzed the protein content within plasma EVs isolated from HFD and NCD mice. Trypsinized samples were separated by liquid chromatography, ionized by electrospray ionization and analyzed by tandem mass spectrometry (Figure 2a). A total of 340 proteins were identified with statistical significance (False Discovery Rate < 0.01). Among these proteins, 5 were exclusively identified in HFD EVs (Figure 2b, c), 112 proteins exclusively identified in NCD EVs (Figure 2b, Table S1); and 223 were common to both groups (Figure 2b). Noticeably, the vast number of proteins exclusively identified in EVs isolated from NCD fed animals accounts for a considerable portion of the overall identified proteins. Thus, we observed a decline in the diversity of proteins carried by plasma EVs in an obesity environment. The 223 proteins identified in both groups were subjected to intensity-based absolute quantification (iBAQ) and differential expression analysis. The resulting log2 (fold change) values and their respective -log10 (p-value) are depicted in Figure 2d. From those, 12 proteins were found to be regulated (p-value < 0.05). Within the regulated proteins (Figure 2e), 2 proteins were upregulated (immunoglobulins), and 10 proteins downregulated (14-3-3 protein isoforms, proteasome subunits, annexin A7 among others).
Over-representation analysis (ORA) was conducted to gain a better understanding of the identified proteins. In this analysis we evaluate if proteins exclusively identified in one experimental group are more enriched in specific functional terms compared to all proteins in that same experimental group, whether exclusively identified or not. This approach allows to pinpoint functional terms that are particularly impacted by diet-induced obesity. ORA was conducted using the Gene Ontology database, encompassing 3 categories: Biological Processes, Cellular Components and Molecular Functions, as well as the KEGG database for both NCD and HFD exclusive proteins. However, we observed enrichment of functional terms meeting the significance threshold (adjusted p-value < 0.05) solely in the Molecular Functions ORA for proteins exclusively identified in NCD plasma EVs (Figure 3). This enrichment pointed to an overrepresentation of functions related to protein folding, phosphatase activity and hydrolase activity, suggesting the relevance of these functional terms in maintaining metabolic homeostasis. Interestingly, each of these enriched functions was associated to at least 10 out of 16 genes, indicating a high degree of interaction between these functional terms.
3.3. Plasma and Gut EVs crosstalk
Previously our group revealed changes in the protein content of gut EVs in the context of obesity dysmetabolism [31]. These prior findings hinted to a key role of gut derived EVs in the spread of the metabolic dysfunction. As such, understanding the intricate crosstalk between plasma and gut EVs becomes paramount to the identification of mechanisms involved in the development of obesity and importantly to the identification of possible biomarkers.
We analyzed the proteins that were shared between plasma and gut EVs (Figure 4a). While no proteins were exclusively detected in the HFD group, we identified four proteins that were exclusive to the control group of both gut and plasma EVs (Figure 4b) (Complement Factor H, Mannose Binding Protein A, Ig Heavy Chain V Region TEPC 1017, and Ig Gamma-2A Chain C Region (Secreted Form)). The loss of these four proteins in both plasma and gut EVs when obesity settles suggests their crucial role in maintaining a healthy homeostatic state, and their high biomarker potential. Future investigation should address the molecular mechanism by which their absence may induce or result from obesity.
3.4. Post-translational modifications (PTMs) in plasma and gut EVs proteins
PTMs act as precise molecular switches capable of modulating protein's stability, localization, interactions and activity. Hence, PTMs enhance proteins’ functional complexity beyond what can be determined solely from their amino acid sequence and folding. To evaluate shifts in PTMs’ profiles, we limited our analysis to modified peptides from proteins shared between HFD and NCD EVs. Regarding plasma EVs, from the 223 proteins shared between both diet groups, 9 proteins were acetylated with an FDR < 0.01 (Figure 5a), with 4 of these proteins exclusively acetylated in the NCD group (Table S2). Additionally, we detected 11 glycated proteins with an FDR < 0.01 (Figure 5b), 6 of which were exclusively glycated in NCD (Table S3). Although the total number of proteins was larger for NCD plasma EVs, these findings suggest a decrease in both acetylation and glycation events in the context of obesity. However, validation of these results is necessary to make further conclusions.
Regarding gut EVs, a total of 2446 proteins were identified under the significance threshold (FDR < 0.01). Among these proteins, 1804 were shared between HFD and NCD EVs (Figure 5c). Next, following the same approach employed for plasma EVs, we focused on acetylated and glycated proteins within the shared set of 1804 proteins. Our analysis revealed 203 acetylated proteins (Figure 5d), with 41 proteins exclusively acetylated in NCD (Table S4) and 29 proteins exclusively acetylated in HFD (Table S5). Interestingly, these numbers indicate a decrease in acetylation events under obesity, mirroring the observations made for acetylated proteins in plasma EVs. For glycation, a total of 56 proteins were found to be glycated in gut EVs (Figure 5e), with 23 proteins exclusively glycated in NCD (Table S6) and 22 proteins exclusively glycated in HFD (Table S7).
All proteins presented an FDR < 0,01. The identification of acetylated and glycated proteins was only conducted on proteins previously identified in both NCD and HFD samples (223 proteins for plasma EVs and 1804 proteins for gut EVs).
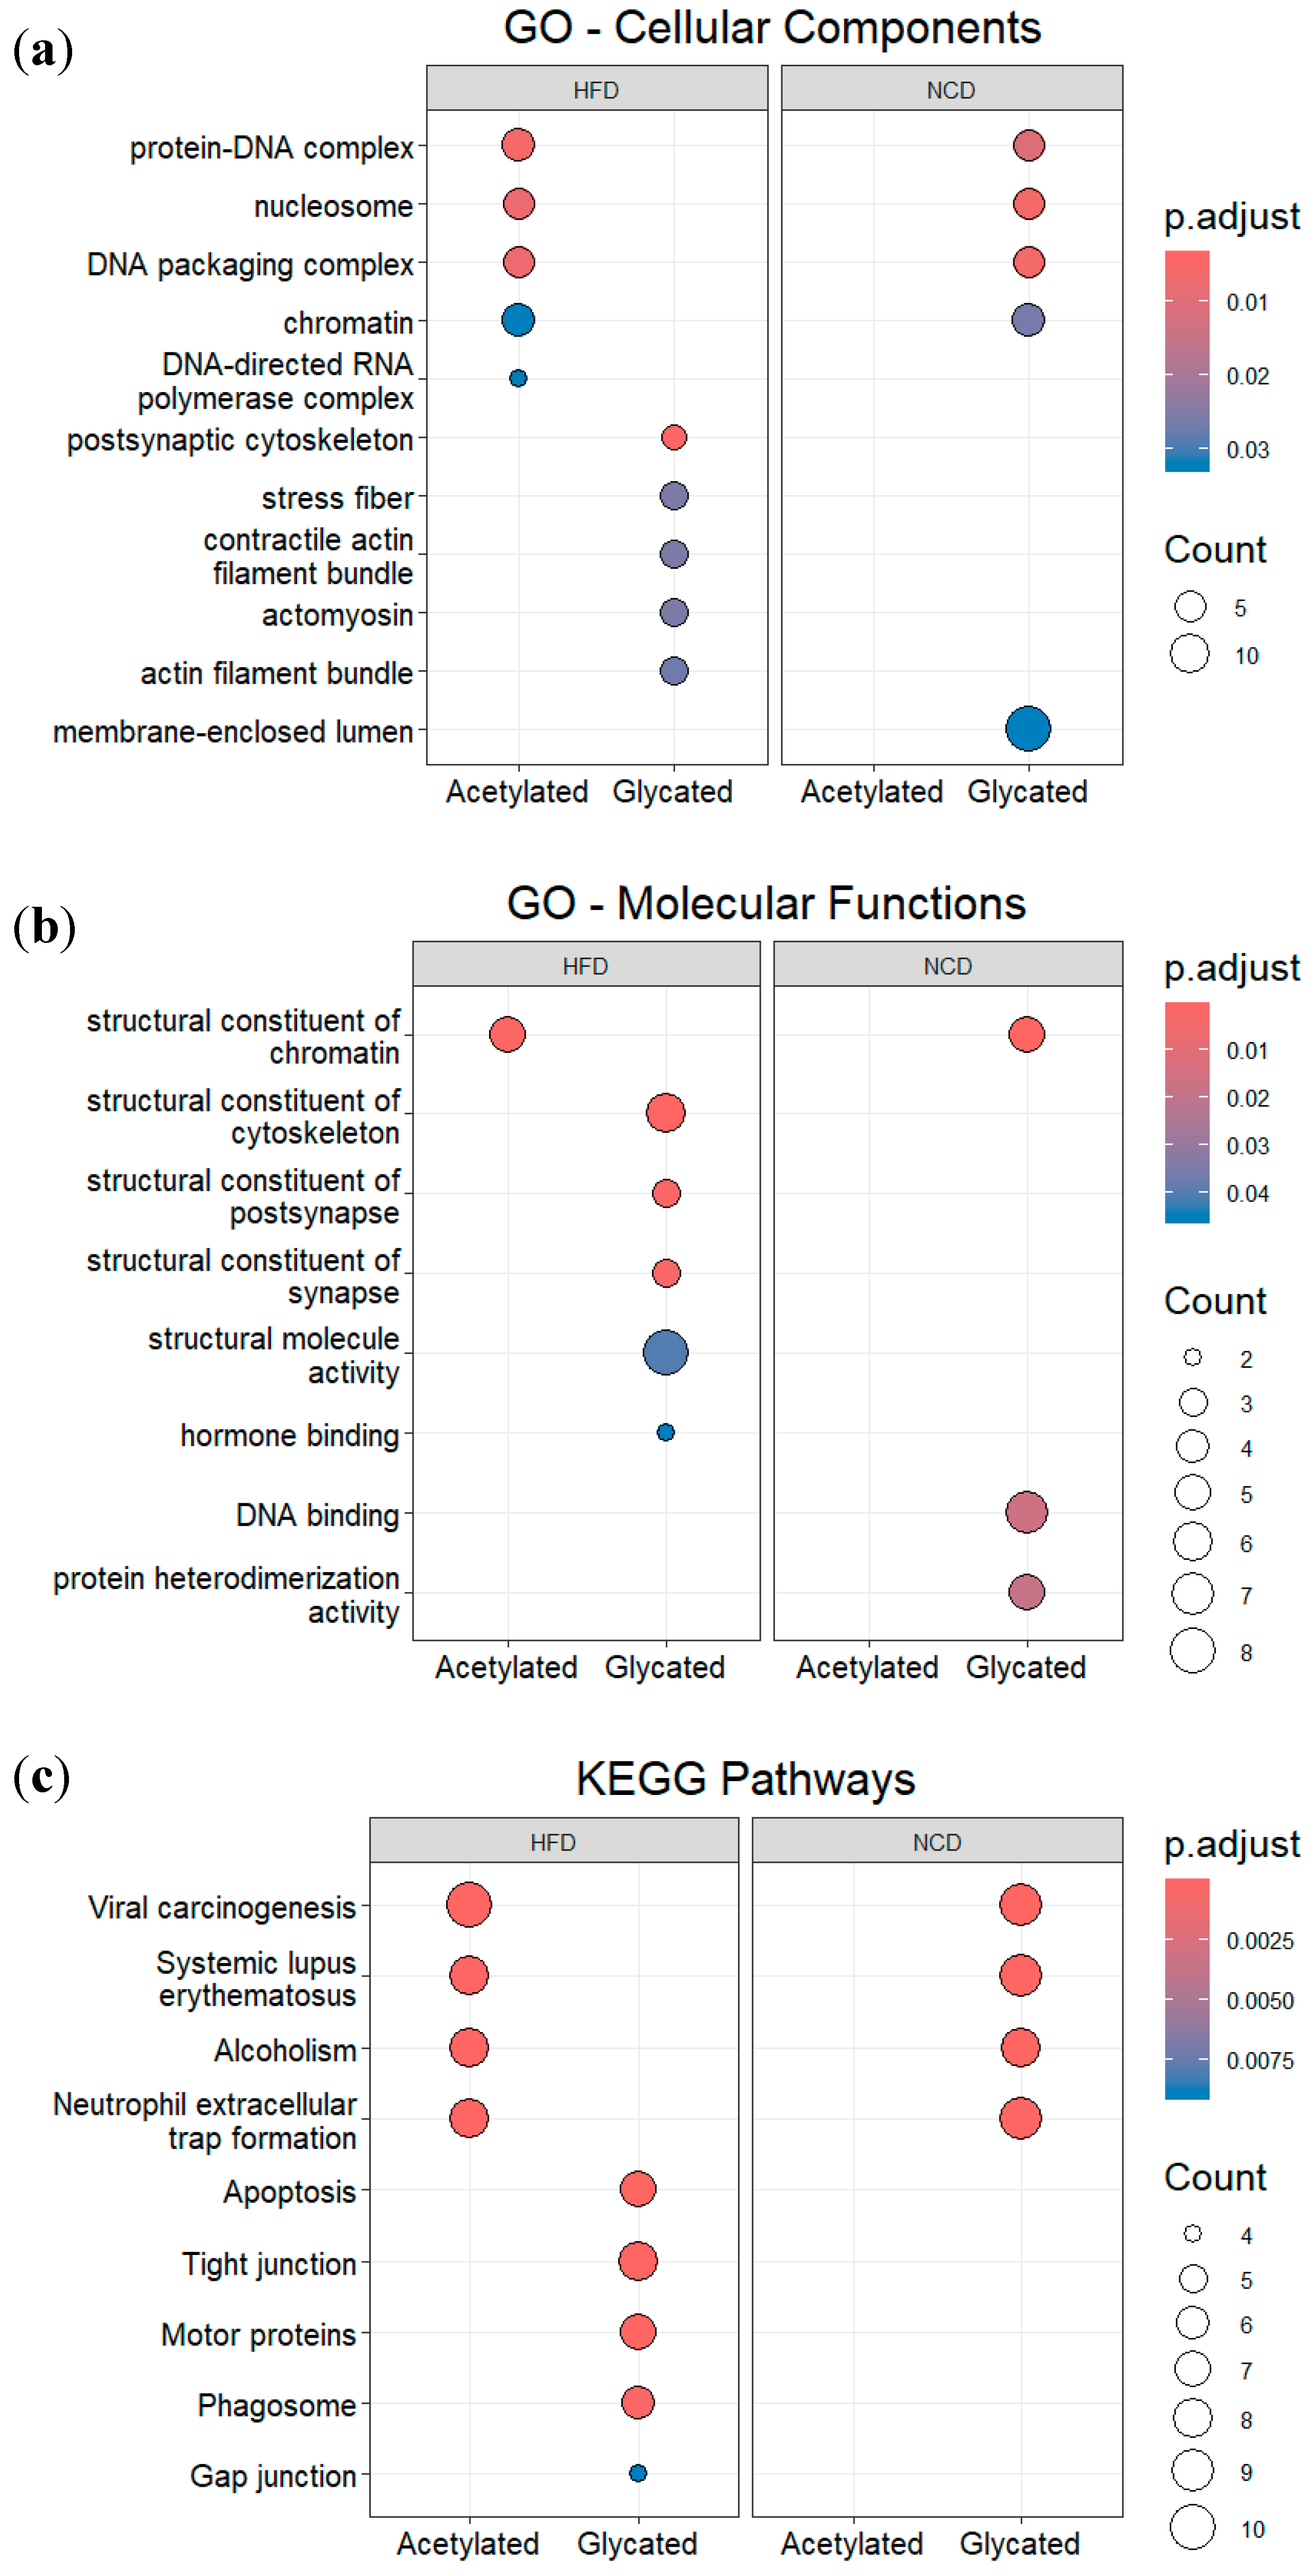
Acetylated and glycated proteins exclusively modified in either NCD or HFD gut derived EVs were subjected to ORA. For these analyses, the list of 1804 proteins identified in both NCD and HFD gut EVs was used as the background reference. Considering Gene Ontology for cellular compartments (Figure 6a), proteins exclusively acetylated in HFD-gut EVs and proteins exclusively glycated in NCD gut EVs exhibited significant enrichment in protein-DNA complexes, nucleosome, chromatin, and polymerase complexes, while proteins exclusively glycated in HFD gut EVs were primarily associated with the cytoskeleton and actin filaments. Regarding Gene Ontology for molecular functions (Figure 6b), proteins exclusively acetylated in HFD gut EVs were enriched in structural constituents of the chromatin, while proteins exclusively glycated in NCD gut EVs exhibited a significant enrichment in structural constituents of the chromatin, DNA binding and protein heterodimerization. In addition, proteins exclusively glycated in HFD gut EVs showed significant enrichment in structural constituents related to the cytoskeleton, synapse, and post synapse.
Considering KEGG pathways (Figure 6c), proteins exclusively acetylated in HFD-gut EVs and proteins exclusively glycated in NCD gut EVs exhibited significant enrichment in pathways related to viral carcinogenesis, systematic lupus erythematosus, alcoholism, and neutrophil extracellular trap formation. It is noteworthy that histones were associated with all four of these enriched KEGG pathways (Figure S2g, i). On the other hand, proteins exclusively glycated in HFD gut EVs were enriched in terms that were mainly related to apoptosis, tight junctions, motor proteins and the phagosome. Importantly, in gut EVs proteins exclusively glycated in HFD, the most enriched functional term across these three analyses were consistently linked to actin and tubulin.
Altogether, these findings indicate that EVs transport proteins with several PTMs and this profile is altered by obesity. Our proteomic data can serve as the basis to develop future studies to understand how PTMs of proteins present in EVs can be modulated to contain obesity progression.
Dot plots represent the 5 most significantly enriched terms in each group.
4. Discussion
Given the fast-changing global dietary patterns, the rise of obesity and its associated health conditions continues. Implementing interventions to combat obesity could serve as potent strategy to mitigate multiple diseases that exert a significant socioeconomic impact. Hence, it is crucial to understand the molecular mechanisms underlying obesity for developing efficacious treatments. As obesity involves systemic interactions depending on inter-organ communication, EVs play a crucial role. Importantly, several studied have highlighted the relevance of EVs cargo in maintaining metabolic homeostasis and enabling cell communication [18,19,22,69]. In this study, we present the first proteomic study on plasma EVs isolated from obese animals and their overlap with gut EVs.
The obese murine model we used, not only displays increased body weight, but it also mirrors obesity comorbidities, such as prediabetic hallmark exemplified by glucose intolerance and liver steatosis exemplified by hepatic lipid deposition (Figure 1). Similar to the results of human studies [87], we observed an increase in the number of plasma EVs under obesity conditions. A total of 340 proteins were identified with 5 exclusively present in HFD plasma EVS and 112 exclusively present in NCD EVs (Figure 2). These results indicate a loss of cargo diversity in diet induced obesity, suggesting that either the messaging system becomes more refined and intense, with more circulating EVs, or that cells try to compensate the lack of protein diversity with an increased EVs secretion. Either way, this may represent an adaptive mechanism or a response to ongoing metabolic changes. The key finding here is that plasma EVs encapsulate proteins that are lost as the disease progresses, highlining their crucial role in maintaining metabolic homeostasis. These proteins could provide insights into the mechanisms underlying obesity.
A further exploration by ORA unveiled a significant enrichment of proteins related to protein folding processes, within the 112 proteins exclusively found in plasma EVs isolated from control animals, mainly Chaperonin Containing TCP1 and Heat shock proteins (Figure 9). Indeed, the functionality of a protein is inherently linked to its conformation, and aberrations in protein folding give rise to a spectrum of alterations associated with the etiology of various human diseases, including β-cell disfunction [90,91,92,93]. Important examples of this association are the islet amyloid polypeptide, which forms toxic aggregates and leads to β-cell disfunction and death [91,92], and heat shock factor 1, a transcriptional activator of molecular chaperones involved in the development of T2D [93].
Regarding the 12 regulated proteins identified in plasma EVs common between NCD and HFD (Figure 2), it is worth to note that 14-3-3 proteins presented higher expression in NCD plasma EVs while immunoglobulins presented higher expression in HFD-PDEV (Figure 2D). The 14-3-3 proteins are molecular adaptors which regulate a large spectrum of signaling pathways, and more importantly, have a beneficial effect on β-cell function and survival that may be decreased in prediabetes [94]. On the other hand, the increased expression of immunoglobulins in HFD plasma EVs may be representative of the initial development of the chronic inflammation characteristic of obesity [95].
One of the novel aspects of this study is the analysis of protein PTMs within EVs, aiming to identify signaling molecules that are acetylated and glycated. These molecules have the potential to directly perform or enhance signaling functions within the recipient cells, by passing xx in the recipient cells. PTMs are dynamic and finely tuned molecular switches that can significantly alter protein function, stability, and interactions [42,43]. Our investigation into acetylated and glycated proteins within plasma EVs revealed a trend—obesity was associated with decreased acetylation and glycation events (Figure 5). This observation suggests that the regulation of these PTMs is altered by the onset of obesity. The similarity between proteins exclusively acetylated in gut EVs in the HFD group and proteins exclusively glycated in the NCD group suggests that those proteins, mainly histones, undergo regulatory shifts by PTMs under obesity conditions. Importantly, these PTMs regulation is detectable within the intercellular communication network, indicating their relevance in the context of organ crosstalk in obesity. Given the well-established roles of PTMs in insulin signaling, glucose metabolism, and the development of associated complications [45,46,47], this finding opens up new avenues for understanding the molecular mechanisms underlying obesity. Importantly, it calls our attention to the need not only to examine the presence of a given protein but also to consider its PTMs status. Further research into the functional consequences of these PTM alterations in the context of metabolic health and disease progression is warranted.
Given our previous study on the protein cargo of gut EV under obesity, we now reanalyzed that data focusing on PTMs. We observed a decrease in acetylation events associated with obesity, suggesting that a possible mechanism of regulation of these PTMs may be more complex involving other organs (Figure 11). When analyzed by ORA, the 29 proteins exclusively acetylated in HFD gut EVs showed an enrichment in GO functional terms related do chromatin, nucleosome, and DNA transcription, with the main enriched proteins being histones (Figure 6). These proteins interact with DNA and provide structural support to chromatin, regulating its condensation according to their own PTM profile [96]. While these associations suggest a crucial role for acetylation, especially of histones and thus transcription control, in regulating obesity, further research is needed to unravel the precise mechanisms and functional implications of these observations in the context of metabolic health and disease. More intriguing are the enriched functional terms obtained from KEGG pathways: viral carcinogenesis; systemic lupus erythematosus; alcoholism; and neutrophil extracellular trap formation (Figure 6). These 4 pathways have been associated with histone acetylation, suggesting their possible interconnection with the development of obesity [97–101]. It has been proposed that acetylation is likely to become an effective means of monitoring obesity in the future [56].
It is very interesting to note that, after analyzing the 23 proteins exclusively glycated in NCD-GDEV by ORA, the results obtained for GO and KEGG were very similar to those obtained for proteins exclusively acetylated in HFD, even with some proteins commonly identified between the two conditions (Figure 14). This fact not only indicates that these enriched functions are affected by the metabolic alterations of prediabetes, as it also strongly suggests that they might be regulated by a shift in histones PTMs profile. More precisely, these changes could involve a interplay between two types of modifications: glycation and acetylation. This interplay can occur in synergy, in antagonism or in competition for the same amino acid in the protein [102]. In this case, histone acetylation and glycation may compete for the same sites since both occur mainly in lysine and arginine residues [103,104]. Exploring the specific glycation and acetylation sites of these proteins will be crucial to pinpoint the regulatory mechanism of interorgan communication mediated by EVs under prediabetic conditions.
ORA enrichment of the 22 proteins exclusively glycated in HFD-GDEV revealed several GO terms related to cellular structural stability (Figure 13). The most enriched proteins were actin and tubulin. Glycation of both proteins results in an increase in endothelial permeability, which compromises the gut barrier during T2D [105–107]. ORA enrichment also revealed KEGG pathways associated with cellular structure and integrity. The enriched pathways of amyotrophic lateral sclerosis, dilated cardiomyopathy and hypertrophic cardiomyopathy are potentiated by increases in blood central nervous system barrier permeability and sarcolemmal permeability, respectively [108–110]. It is possible that GDEV are transporting glycated structural proteins and delivering them to other organs, increasing the risk of developing such pathologies. Further research is needed to explore the mechanistic details and functional implications of these observations.
The crosstalk between plasma-derived extracellular vesicles (PDEVs) and gut-derived extracellular vesicles (GDEVs) adds an intriguing layer of complexity to our understanding of metabolic health and prediabetes. In this study, we identified four proteins exclusively present in the healthy state of both PDEVs and GDEVs (Figure 15A, B). Their absence in prediabetic conditions raises questions about their roles in maintaining metabolic homeostasis. These proteins possess high biomarker potential for a healthy physiological state, as their presence is lost in the context of prediabetic metabolic alterations. Notably, the term "immune response" emerged as significant when examining individual proteins and their functions, suggesting that disruption in immune system orchestration may play a pivotal role in driving dysmetabolism [111]. Complement Factor H, one of these proteins, has previously been associated with metabolic disorders, reinforcing its relevance in the context of prediabetes [112]. The observation of proteins shared between PDEVs and GDEVs highlights the potential for a non-invasive approach to assess gut health by analyzing blood derived EVs. The exact mechanisms by which these altered protein cargos and PTMs contribute to obesity progression remain elusive. Further research is needed to elucidate these mechanisms, potentially through functional studies and investigations into the interplay of EVs with target cells and tissues. Nevertheless, this approach represents a significant advancement in early intervention strategies for halting the progression of obesity.
5. Conclusions
This study sheds light on the novel role of EVs in obesity and their potential as biomarkers for early metabolic dysfunction. The alterations in protein composition and the exploration of PTMs offer new perspectives on the molecular mechanisms underlying obesity. The discovery of proteins shared between plasma and gut-derived EVs opens up exciting possibilities for non-invasive monitoring of gut health through blood-based analysis. These findings have the potential to pave the way for early intervention strategies to combat the rising prevalence of metabolic disorders, emphasizing the critical role of EVs in understanding and addressing these health challenges. Future studies involving human subjects should provide additional insights. Further research in this growing field promises to unravel more intricacies and insights, ultimately advancing our ability to prevent and treat obesity more effectively.
Funding
This research was funded by Fundação para a Ciência e a Tecnologia (PTDC/MEC-MET/29314/2017) and Programa Gileade Génese (2019).
Institutional Review Board Statement
The animal study protocol was approved by the Ethics Committee of the NOVA Medical School (nr.82/2019/CEFCM).
Conflicts of Interest
The authors declare no conflict of interest. The funders had no role in the design of the study; in the collection, analyses, or interpretation of data; in the writing of the manuscript; or in the decision to publish the results.
References
- World Health Organization World Obesity Day 2022 – Accelerating Action to Stop Obesity. Available online: https://www.who.int/news/item/04-03-2022-world-obesity-day-2022-accelerating-action-to-stop-obesity (accessed on 21 November 2023).
- Bastías-Pérez, M.; Serra, D.; Herrero, L. Dietary Options for Rodents in the Study of Obesity. Nutrients 2020, 12, 3234. [Google Scholar] [CrossRef]
- Hill, J.O.; Melanson, E.L.; Wyatt, H.T. Dietary Fat Intake and Regulation of Energy Balance: Implications for Obesity. J Nutr 2000, 130, 284S–288S. [Google Scholar] [CrossRef]
- Jéquier, E. Pathways to Obesity. Int J Obes 2002, 26, S12–S17. [Google Scholar] [CrossRef] [PubMed]
- French, S.; Robinson, T. Fats and Food Intake. Curr Opin Clin Nutr Metab Care 2003, 6, 629–634. [Google Scholar] [CrossRef]
- Losacco, M.C.; de Almeida, C.F.T.; Hijo, A.H.T.; Bargi-Souza, P.; Gama, P.; Nunes, M.T.; Goulart-Silva, F. High-Fat Diet Affects Gut Nutrients Transporters in Hypo and Hyperthyroid Mice by PPAR-a Independent Mechanism. Life Sci 2018, 202, 35–43. [Google Scholar] [CrossRef]
- Hu, F.B. Globalization of Diabetes. Diabetes Care 2011, 34, 1249–1257. [Google Scholar] [CrossRef] [PubMed]
- Shoelson, S.E.; Herrero, L.; Naaz, A. Obesity, Inflammation, and Insulin Resistance. Gastroenterology 2007, 132, 2169–2180. [Google Scholar] [CrossRef]
- Fernández-Sánchez, A.; Madrigal-Santillán, E.; Bautista, M.; Esquivel-Soto, J.; Morales-González, Á.; Esquivel-Chirino, C.; Durante-Montiel, I.; Sánchez-Rivera, G.; Valadez-Vega, C.; Morales-González, J.A. Inflammation, Oxidative Stress, and Obesity. Int J Mol Sci 2011, 12, 3117–3132. [Google Scholar] [CrossRef] [PubMed]
- Ouchi, N.; Parker, J.L.; Lugus, J.J.; Walsh, K. Adipokines in Inflammation and Metabolic Disease. Nat Rev Immunol 2011, 11, 85–97. [Google Scholar] [CrossRef]
- Pardo, F.; Villalobos-Labra, R.; Sobrevia, B.; Toledo, F.; Sobrevia, L. Extracellular Vesicles in Obesity and Diabetes Mellitus. Mol Aspects Med 2018, 60, 81–91. [Google Scholar] [CrossRef]
- Garcia-Contreras, M.; Shah, S.H.; Tamayo, A.; Robbins, P.D.; Golberg, R.B.; Mendez, A.J.; Ricordi, C. Plasma-Derived Exosome Characterization Reveals a Distinct MicroRNA Signature in Long Duration Type 1 Diabetes. Sci Rep 2017, 7, 5998. [Google Scholar] [CrossRef]
- Martínez, M.C.; Andriantsitohaina, R. Extracellular Vesicles in Metabolic Syndrome. Circ Res 2017, 120, 1674–1686. [Google Scholar] [CrossRef]
- Colombo, M.; Raposo, G.; Théry, C. Biogenesis, Secretion, and Intercellular Interactions of Exosomes and Other Extracellular Vesicles. Annu Rev Cell Dev Biol 2014, 30, 255–289. [Google Scholar] [CrossRef]
- Kalluri, R.; LeBleu, V.S. The Biology, Function, and Biomedical Applications of Exosomes. Science (1979) 2020, 367. [Google Scholar] [CrossRef]
- Kalra, H.; Drummen, G.; Mathivanan, S. Focus on Extracellular Vesicles: Introducing the Next Small Big Thing. Int J Mol Sci 2016, 17, 170. [Google Scholar] [CrossRef] [PubMed]
- van Niel, G.; D’Angelo, G.; Raposo, G. Shedding Light on the Cell Biology of Extracellular Vesicles. Nat Rev Mol Cell Biol 2018, 19, 213–228. [Google Scholar] [CrossRef] [PubMed]
- Akbar, N.; Azzimato, V.; Choudhury, R.P.; Aouadi, M. Extracellular Vesicles in Metabolic Disease. Diabetologia 2019, 62, 2179–2187. [Google Scholar] [CrossRef] [PubMed]
- Huang-Doran, I.; Zhang, C.-Y.; Vidal-Puig, A. Extracellular Vesicles: Novel Mediators of Cell Communication In Metabolic Disease. Trends in Endocrinology & Metabolism 2017, 28, 3–18. [Google Scholar] [CrossRef]
- Li, C.-J.; Fang, Q.-H.; Liu, M.-L.; Lin, J.-N. Current Understanding of the Role of Adipose-Derived Extracellular Vesicles in Metabolic Homeostasis and Diseases: Communication from the Distance between Cells/Tissues. Theranostics 2020, 10, 7422–7435. [Google Scholar] [CrossRef] [PubMed]
- Aswad, H.; Forterre, A.; Wiklander, O.P.B.; Vial, G.; Danty-Berger, E.; Jalabert, A.; Lamazière, A.; Meugnier, E.; Pesenti, S.; Ott, C.; et al. Exosomes Participate in the Alteration of Muscle Homeostasis during Lipid-Induced Insulin Resistance in Mice. Diabetologia 2014, 57, 2155–2164. [Google Scholar] [CrossRef]
- Dang, S.-Y.; Leng, Y.; Wang, Z.-X.; Xiao, X.; Zhang, X.; Wen, T.; Gong, H.-Z.; Hong, A.; Ma, Y. Exosomal Transfer of Obesity Adipose Tissue for Decreased MiR-141-3p Mediate Insulin Resistance of Hepatocytes. Int J Biol Sci 2019, 15, 351–368. [Google Scholar] [CrossRef]
- Jalabert, A.; Vial, G.; Guay, C.; Wiklander, O.P.B.; Nordin, J.Z.; Aswad, H.; Forterre, A.; Meugnier, E.; Pesenti, S.; Regazzi, R.; et al. Exosome-like Vesicles Released from Lipid-Induced Insulin-Resistant Muscles Modulate Gene Expression and Proliferation of Beta Recipient Cells in Mice. Diabetologia 2016, 59, 1049–1058. [Google Scholar] [CrossRef]
- Wu, J.; Dong, T.; Chen, T.; Sun, J.; Luo, J.; He, J.; Wei, L.; Zeng, B.; Zhang, H.; Li, W.; et al. Hepatic Exosome-Derived MiR-130a-3p Attenuates Glucose Intolerance via Suppressing PHLPP2 Gene in Adipocyte. Metabolism 2020, 103, 154006. [Google Scholar] [CrossRef]
- Yu, Y.; Du, H.; Wei, S.; Feng, L.; Li, J.; Yao, F.; Zhang, M.; Hatch, G.M.; Chen, L. Adipocyte-Derived Exosomal MiR-27a Induces Insulin Resistance in Skeletal Muscle Through Repression of PPARγ. Theranostics 2018, 8, 2171–2188. [Google Scholar] [CrossRef]
- Deng, Z.; Poliakov, A.; Hardy, R.W.; Clements, R.; Liu, C.; Liu, Y.; Wang, J.; Xiang, X.; Zhang, S.; Zhuang, X.; et al. Ad-ipose Tissue Exosome-Like Vesicles Mediate Activation of Macrophage-Induced Insulin Resistance. Diabetes 2009, 58, 2498–2505. [Google Scholar] [CrossRef]
- Kranendonk, M.E.G.; Visseren, F.L.J.; van Balkom, B.W.M.; Nolte-’t Hoen, E.N.M.; van Herwaarden, J.A.; de Jager, W.; Schipper, H.S.; Brenkman, A.B.; Verhaar, M.C.; Wauben, M.H.M.; et al. Human Adipocyte Extracellular Vesicles in Re-ciprocal Signaling between Adipocytes and Macrophages. Obesity 2014, 22, 1296–1308. [Google Scholar] [CrossRef]
- Pardo, F.; Villalobos-Labra, R.; Sobrevia, B.; Toledo, F.; Sobrevia, L. Extracellular Vesicles in Obesity and Diabetes Mellitus. Mol Aspects Med 2018, 60, 81–91. [Google Scholar] [CrossRef] [PubMed]
- Castaño, C.; Kalko, S.; Novials, A.; Párrizas, M. Obesity-Associated Exosomal MiRNAs Modulate Glucose and Lipid Metabolism in Mice. Proceedings of the National Academy of Sciences 2018, 115, 12158–12163. [Google Scholar] [CrossRef]
- Ying, W.; Riopel, M.; Bandyopadhyay, G.; Dong, Y.; Birmingham, A.; Seo, J.B.; Ofrecio, J.M.; Wollam, J.; Hernan-dez-Carretero, A.; Fu, W.; et al. Adipose Tissue Macrophage-Derived Exosomal MiRNAs Can Modulate In Vivo and In Vitro Insulin Sensitivity. Cell 2017, 171, 372–384e12. [Google Scholar] [CrossRef] [PubMed]
- Ferreira, I.; Machado de Oliveira, R.; Carvalho, A.S.; Teshima, A.; Beck, H.C.; Matthiesen, R.; Costa-Silva, B.; Macedo, M.P. Messages from the Small Intestine Carried by Extracellular Vesicles in Prediabetes: A Proteomic Portrait. J Proteome Res 2022, 21, 910–920. [Google Scholar] [CrossRef] [PubMed]
- Breen, D.M.; Rasmussen, B.A.; Côté, C.D.; Jackson, V.M.; Lam, T.K.T. Nutrient-Sensing Mechanisms in the Gut as Therapeutic Targets for Diabetes. Diabetes 2013, 62, 3005–3013. [Google Scholar] [CrossRef]
- Gurung, M.; Li, Z.; You, H.; Rodrigues, R.; Jump, D.B.; Morgun, A.; Shulzhenko, N. Role of Gut Microbiota in Type 2 Diabetes Pathophysiology. EBioMedicine 2020, 51, 102590. [Google Scholar] [CrossRef] [PubMed]
- Evers, S.S.; Sandoval, D.A.; Seeley, R.J. The Physiology and Molecular Underpinnings of the Effects of Bariatric Surgery on Obesity and Diabetes. Annu Rev Physiol 2017, 79, 313–334. [Google Scholar] [CrossRef] [PubMed]
- Pareek, M.; Schauer, P.R.; Kaplan, L.M.; Leiter, L.A.; Rubino, F.; Bhatt, D.L. Metabolic Surgery. J Am Coll Cardiol 2018, 71, 670–687. [Google Scholar] [CrossRef]
- HILLYER, R.; SULLIVAN, T.; CHRIST, K.; HODARKAR, A.; HODGE, M.B. 2117-P: Biomarkers Isolated from Extracellular Vesicles Prior to Bariatric Surgery May Be Associated with Postoperative Resolution of Type 2 Diabetes. Diabetes 2019, 68. [Google Scholar] [CrossRef]
- Duarte, N.; Coelho, I.C.; Patarrão, R.S.; Almeida, J.I.; Penha-Gonçalves, C.; Macedo, M.P. How Inflammation Impinges on NAFLD: A Role for Kupffer Cells. Biomed Res Int 2015, 2015, 1–11. [Google Scholar] [CrossRef] [PubMed]
- Freeman, D.W.; Noren Hooten, N.; Eitan, E.; Green, J.; Mode, N.A.; Bodogai, M.; Zhang, Y.; Lehrmann, E.; Zonderman, A.B.; Biragyn, A.; et al. Altered Extracellular Vesicle Concentration, Cargo, and Function in Diabetes. Diabetes 2018, 67, 2377–2388. [Google Scholar] [CrossRef] [PubMed]
- Eguchi, A.; Lazic, M.; Armando, A.M.; Phillips, S.A.; Katebian, R.; Maraka, S.; Quehenberger, O.; Sears, D.D.; Feldstein, A.E. Circulating Adipocyte-Derived Extracellular Vesicles Are Novel Markers of Metabolic Stress. J Mol Med 2016, 94, 1241–1253. [Google Scholar] [CrossRef] [PubMed]
- Murakami, T.; Horigome, H.; Tanaka, K.; Nakata, Y.; Ohkawara, K.; Katayama, Y.; Matsui, A. Impact of Weight Reduction on Production of Platelet-Derived Microparticles and Fibrinolytic Parameters in Obesity. Thromb Res 2007, 119, 45–53. [Google Scholar] [CrossRef]
- Stepanian, A.; Bourguignat, L.; Hennou, S.; Coupaye, M.; Hajage, D.; Salomon, L.; Alessi, M.-C.; Msika, S.; de Prost, D. Microparticle Increase in Severe Obesity: Not Related to Metabolic Syndrome and Unchanged after Massive Weight Loss. Obesity 2013, 21, 2236–2243. [Google Scholar] [CrossRef]
- Campello, E.; Zabeo, E.; Radu, C.M.; Spiezia, L.; Foletto, M.; Prevedello, L.; Gavasso, S.; Bulato, C.; Vettor, R.; Simioni, P. Dynamics of Circulating Microparticles in Obesity after Weight Loss. Intern Emerg Med 2016, 11, 695–702. [Google Scholar] [CrossRef]
- Stocks, B.; Zierath, J.R. Post-Translational Modifications: The Signals at the Intersection of Exercise, Glucose Uptake, and Insulin Sensitivity. Endocr Rev 2022, 43, 654–677. [Google Scholar] [CrossRef]
- Wu, X.; Xu, M.; Geng, M.; Chen, S.; Little, P.J.; Xu, S.; Weng, J. Targeting Protein Modifications in Metabolic Diseases: Molecular Mechanisms and Targeted Therapies. Signal Transduct Target Ther 2023, 8, 220. [Google Scholar] [CrossRef]
- Yang, C.; Wei, M.; Zhao, Y.; Yang, Z.; Song, M.; Mi, J.; Yang, X.; Tian, G. Regulation of Insulin Secretion by the Post-Translational Modifications. Front Cell Dev Biol 2023, 11. [Google Scholar] [CrossRef] [PubMed]
- Dieterich, I.A.; Lawton, A.J.; Peng, Y.; Yu, Q.; Rhoads, T.W.; Overmyer, K.A.; Cui, Y.; Armstrong, E.A.; Howell, P.R.; Burhans, M.S.; et al. Acetyl-CoA Flux Regulates the Proteome and Acetyl-Proteome to Maintain Intracellular Metabolic Crosstalk. Nat Commun 2019, 10, 3929. [Google Scholar] [CrossRef]
- Maessen, D.E.M.; Stehouwer, C.D.A.; Schalkwijk, C.G. The Role of Methylglyoxal and the Glyoxalase System in Diabetes and Other Age-Related Diseases. Clin Sci 2015, 128, 839–861. [Google Scholar] [CrossRef]
- Menzies, K.J.; Zhang, H.; Katsyuba, E.; Auwerx, J. Protein Acetylation in Metabolism — Metabolites and Cofactors. Nat Rev Endocrinol 2016, 12, 43–60. [Google Scholar] [CrossRef]
- Smith, K.T.; Workman, J.L. Introducing the Acetylome. Nat Biotechnol 2009, 27, 917–919. [Google Scholar] [CrossRef]
- Sun, F.; Suttapitugsakul, S.; Xiao, H.; Wu, R. Comprehensive Analysis of Protein Glycation Reveals Its Potential Impacts on Protein Degradation and Gene Expression in Human Cells. J Am Soc Mass Spectrom 2019, 30, 2480–2490. [Google Scholar] [CrossRef] [PubMed]
- Pessoa Rodrigues, C.; Chatterjee, A.; Wiese, M.; Stehle, T.; Szymanski, W.; Shvedunova, M.; Akhtar, A. Histone H4 Lysine 16 Acetylation Controls Central Carbon Metabolism and Diet-Induced Obesity in Mice. Nat Commun 2021, 12, 6212. [Google Scholar] [CrossRef] [PubMed]
- Li, Z.; Zhuang, M.; Zhang, L.; Zheng, X.; Yang, P.; Li, Z. Acetylation Modification Regulates GRP78 Secretion in Colon Cancer Cells. Sci Rep 2016, 6, 30406. [Google Scholar] [CrossRef] [PubMed]
- Iyer, A.; Fairlie, D.P.; Brown, L. Lysine Acetylation in Obesity, Diabetes and Metabolic Disease. Immunol Cell Biol 2012, 90, 39–46. [Google Scholar] [CrossRef]
- Alrob, O.A.; Sankaralingam, S.; Ma, C.; Wagg, C.S.; Fillmore, N.; Jaswal, J.S.; Sack, M.N.; Lehner, R.; Gupta, M.P.; Mi-chelakis, E.D.; et al. Obesity-Induced Lysine Acetylation Increases Cardiac Fatty Acid Oxidation and Impairs Insulin Signalling. Cardiovasc Res 2014, 103, 485–497. [Google Scholar] [CrossRef]
- Fukushima, A.; Lopaschuk, G.D. Acetylation Control of Cardiac Fatty Acid β-Oxidation and Energy Metabolism in Obesity, Diabetes, and Heart Failure. Biochimica et Biophysica Acta (BBA) - Molecular Basis of Disease 2016, 1862, 2211–2220. [Google Scholar] [CrossRef] [PubMed]
- Liu, Y.; Yang, H.; Liu, X.; Gu, H.; Li, Y.; Sun, C. Protein Acetylation: A Novel Modus of Obesity Regulation. J Mol Med 2021, 99, 1221–1235. [Google Scholar] [CrossRef]
- Rabbani, N.; Thornalley, P.J. Glycation Research in Amino Acids: A Place to Call Home. Amino Acids 2012, 42, 1087–1096. [Google Scholar] [CrossRef]
- Twarda-Clapa, A.; Olczak, A.; Białkowska, A.M.; Koziołkiewicz, M. Advanced Glycation End-Products (AGEs): Formation, Chemistry, Classification, Receptors, and Diseases Related to AGEs. Cells 2022, 11, 1312. [Google Scholar] [CrossRef]
- Mengstie, M.A.; Chekol Abebe, E.; Behaile Teklemariam, A.; Tilahun Mulu, A.; Agidew, M.M.; Teshome Azezew, M.; Zewde, E.A.; Agegnehu Teshome, A. Endogenous Advanced Glycation End Products in the Pathogenesis of Chronic Diabetic Complications. Front Mol Biosci 2022, 9. [Google Scholar] [CrossRef]
- Negre-Salvayre, A.; Salvayre, R.; Augé, N.; Pamplona, R.; Portero-Otín, M. Hyperglycemia and Glycation in Diabetic Complications. Antioxid Redox Signal 2009, 11, 3071–3109. [Google Scholar] [CrossRef]
- IDF Diabetes Atlas, 10th ed.; International Diabetes Federation: Brussels, Belgium, 2021.
- ElSayed, N.A.; Aleppo, G.; Aroda, V.R.; Bannuru, R.R.; Brown, F.M.; Bruemmer, D.; Collins, B.S.; Gaglia, J.L.; Hilliard, M.E.; Isaacs, D.; et al. 2. Classification and Diagnosis of Diabetes: Standards of Care in Diabetes—2023. Diabetes Care 2023, 46, S19–S40. [Google Scholar] [CrossRef]
- Cox, J.; Mann, M. MaxQuant Enables High Peptide Identification Rates, Individualized p.p.b.-Range Mass Accuracies and Proteome-Wide Protein Quantification. Nat Biotechnol 2008, 26, 1367–1372. [Google Scholar] [CrossRef] [PubMed]
- Carvalho, A.S.; Ribeiro, H.; Voabil, P.; Penque, D.; Jensen, O.N.; Molina, H.; Matthiesen, R. Global Mass Spectrometry and Transcriptomics Array Based Drug Profiling Provides Novel Insight into Glucosamine Induced Endoplasmic Reticulum Stress. Molecular and Cellular Proteomics 2014, 13, 3294–3307. [Google Scholar] [CrossRef] [PubMed]
- Wu, T.; Hu, E.; Xu, S.; Chen, M.; Guo, P.; Dai, Z.; Feng, T.; Zhou, L.; Tang, W.; Zhan, L.; et al. ClusterProfiler 4.0: A Universal Enrichment Tool for Interpreting Omics Data. Innovation 2021, 2. [Google Scholar] [CrossRef] [PubMed]
- Lundgren, D.H.; Hwang, S.-I.; Wu, L.; Han, D.K. Role of Spectral Counting in Quantitative Proteomics. Expert Rev Pro-teomics 2010, 7, 39–53. [Google Scholar] [CrossRef]
- Schwanhüusser, B.; Busse, D.; Li, N.; Dittmar, G.; Schuchhardt, J.; Wolf, J.; Chen, W.; Selbach, M. Global Quantification of Mammalian Gene Expression Control. Nature 2011, 473, 337–342. [Google Scholar] [CrossRef]
- Ritchie, M.E.; Phipson, B.; Wu, D.; Hu, Y.; Law, C.W.; Shi, W.; Smyth, G.K. Limma Powers Differential Expression Analyses for RNA-Sequencing and Microarray Studies. Nucleic Acids Res 2015, 43, e47–e47. [Google Scholar] [CrossRef]
- Boyle, E.I.; Weng, S.; Gollub, J.; Jin, H.; Botstein, D.; Cherry, J.M.; Sherlock, G. GO::TermFinder - Open Source Software for Accessing Gene Ontology Information and Finding Significantly Enriched Gene Ontology Terms Associated with a List of Genes. Bioinformatics 2004, 20, 3710–3715. [Google Scholar] [CrossRef]
- Ashburner, M.; Ball, C.A.; Blake, J.A.; Botstein, D.; Butler, H.; Cherry, J.M.; Davis, A.P.; Dolinski, K.; Dwight, S.S.; Eppig, J.T.; et al. Gene Ontology: Tool for the Unification of Biology. Nat Genet 2000, 25, 25–29. [Google Scholar] [CrossRef]
- Aleksander, S.A.; Balhoff, J.; Carbon, S.; Cherry, J.M.; Drabkin, H.J.; Ebert, D.; Feuermann, M.; Gaudet, P.; Harris, N.L.; Hill, D.P.; et al. The Gene Ontology Knowledgebase in 2023. Genetics 2023, 224. [Google Scholar] [CrossRef]
- Kanehisa, M.; Goto, S. KEGG: Kyoto Encyclopedia of Genes and Genomes; 2000; Vol. 28.
- Kanehisa, M. Toward Understanding the Origin and Evolution of Cellular Organisms. Protein Science 2019, 28, 1947–1951. [Google Scholar] [CrossRef]
- Kanehisa, M.; Furumichi, M.; Sato, Y.; Kawashima, M.; Ishiguro-Watanabe, M. KEGG for Taxonomy-Based Analysis of Pathways and Genomes. Nucleic Acids Res 2023, 51, D587–D592. [Google Scholar] [CrossRef] [PubMed]
- Noren Hooten, N.; Evans, M.K. Extracellular Vesicles as Signaling Mediators in Type 2 Diabetes Mellitus. American Journal of Physiology-Cell Physiology 2020, 318, C1189–C1199. [Google Scholar] [CrossRef] [PubMed]
Figure 1.
Diet-induced Obesity Increases the Number of Plasma Extracellular Vesicle. (a) Schematic representation of the 12-week diet plan. Obesity was induced in male C57Bl/6J mice by feeding them a high fat diet (HFD), while control mice were fed a normal chow diet (NCD). At the 11th week of diet, mice are subjected to intra-peritoneal glucose tolerance test (ipGTT). (b) Statistical analysis of mouse body weight (circles indicate individual animals). (c) Hematoxylin and eosin + Oil Red O staining in liver, histological sections of NCD and HFD mice with 63X magnification. (d) Representation of ipGTT at different time points after glucose administration (0, 15, 30, 60, 90, 120 minutes). (e) Statistical analysis of the area under the curve of the ipGTT graph (circles indicate individual animals; n=60 for NCD and n=70 for HFD). (f) Analysis of the number of particles per mL of sample. (g) Protein quantification in plasma EVs in mg/mL, obtained by BCA. (h) Protein content per EV, represented in mg of protein per particle.
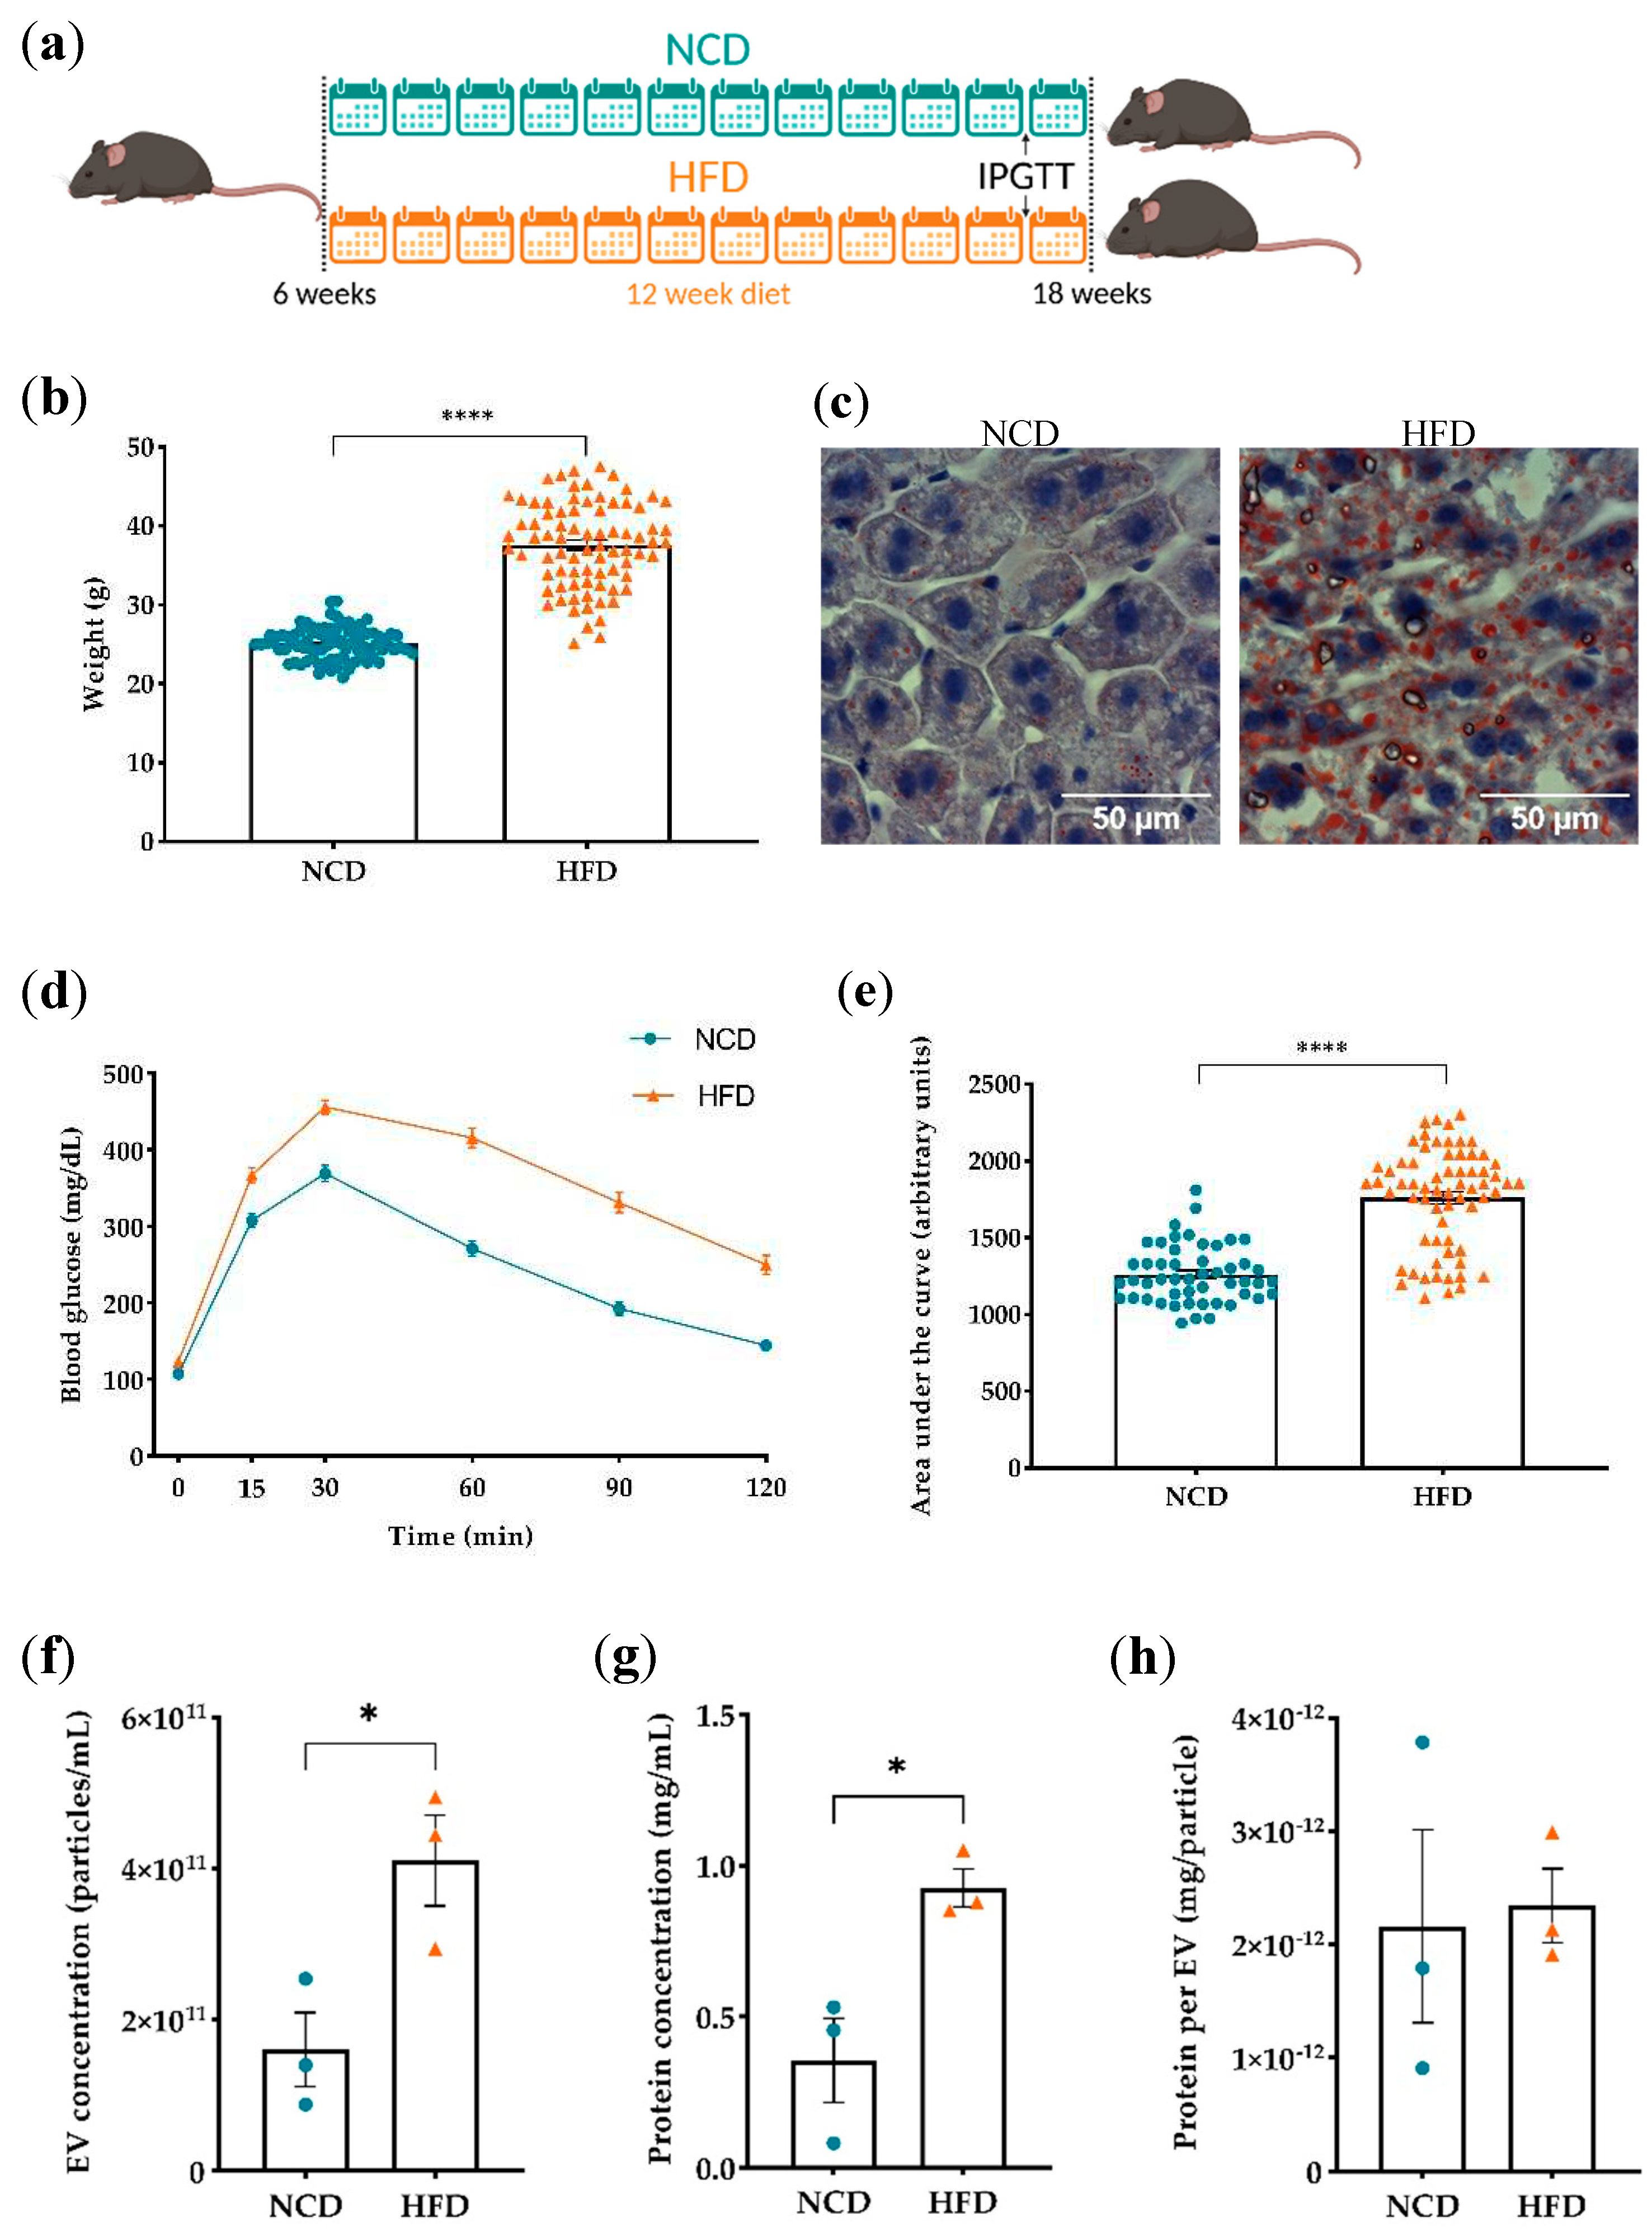
Figure 2.
Comparative Protein Profile in Plasma Derived Extracellular Vesicles from NCD and HFD-fed Mice. (a) Schematic representation illustrating the experimental workflow for the analysis of plasma EVs. Each sample, obtained from mice fed either a NCD or an HFD, underwent two rounds of analysis using Liquid Chromatography-Tandem Mass Spectrometry (LQ-MS/MS). (b) Venn diagram representing the overlap of proteins identified in NCD and HFD plasma EVs with a false discovery rate (FDR) < 0,01. (c) List of Proteins Exclusively Identified in HFD plasma EVs. (d) Volcano plot representing the fold change and p-value of regulated proteins shared between NCD and HFD plasma EVs. Dotted horizontal line indicates the threshold for a p-value < 0,05. A positive log2 (Fold Change) value indicates higher protein levels in prediabetic mice when compared to control mice. Down-regulated proteins are represented in light-blue, while up-regulated proteins are indicated in light red. (e) List of significantly regulated proteins (p-value < 0,05) in plasma EVs from HFD mice compared to NCD mice.
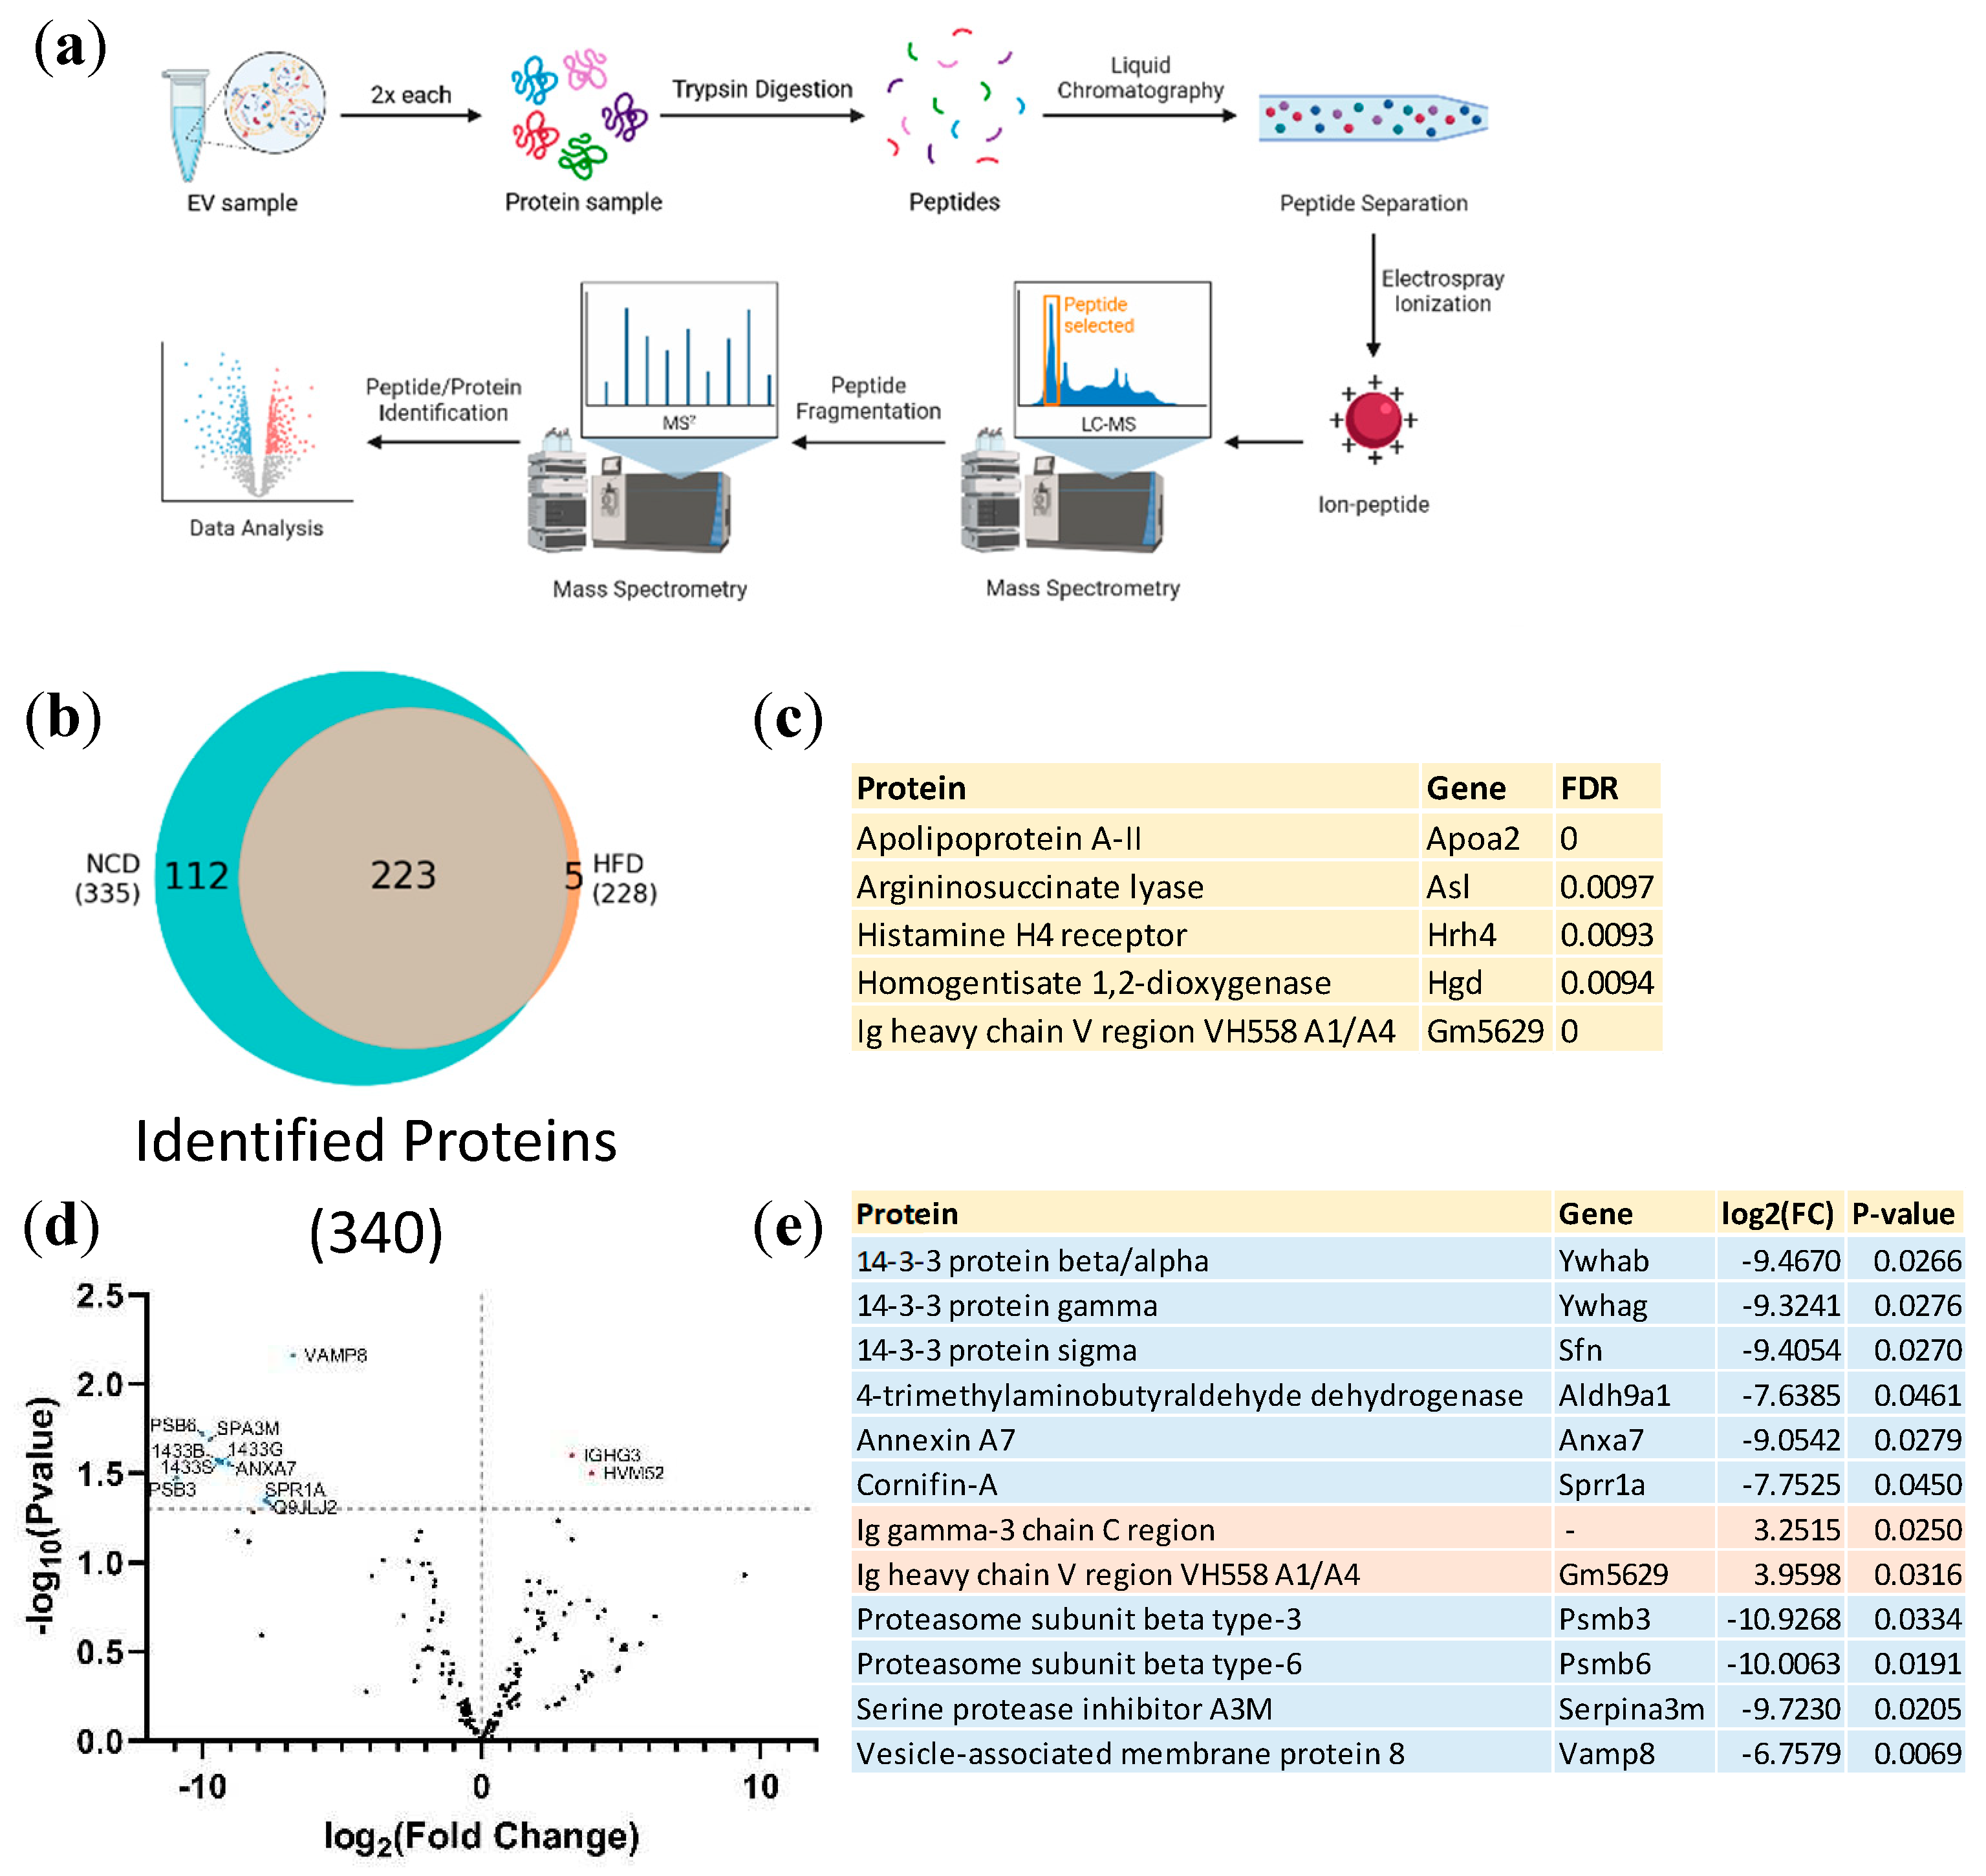
Figure 3.
Gene Ontology Over-Representation analysis of plasma EVs proteins identified exclusively in NCD mice. (a) Bar plot and (b) table of enriched molecular functions and their related identified genes. Black rectangles indicate the association between the identified gene and the enriched term.
Figure 3.
Gene Ontology Over-Representation analysis of plasma EVs proteins identified exclusively in NCD mice. (a) Bar plot and (b) table of enriched molecular functions and their related identified genes. Black rectangles indicate the association between the identified gene and the enriched term.
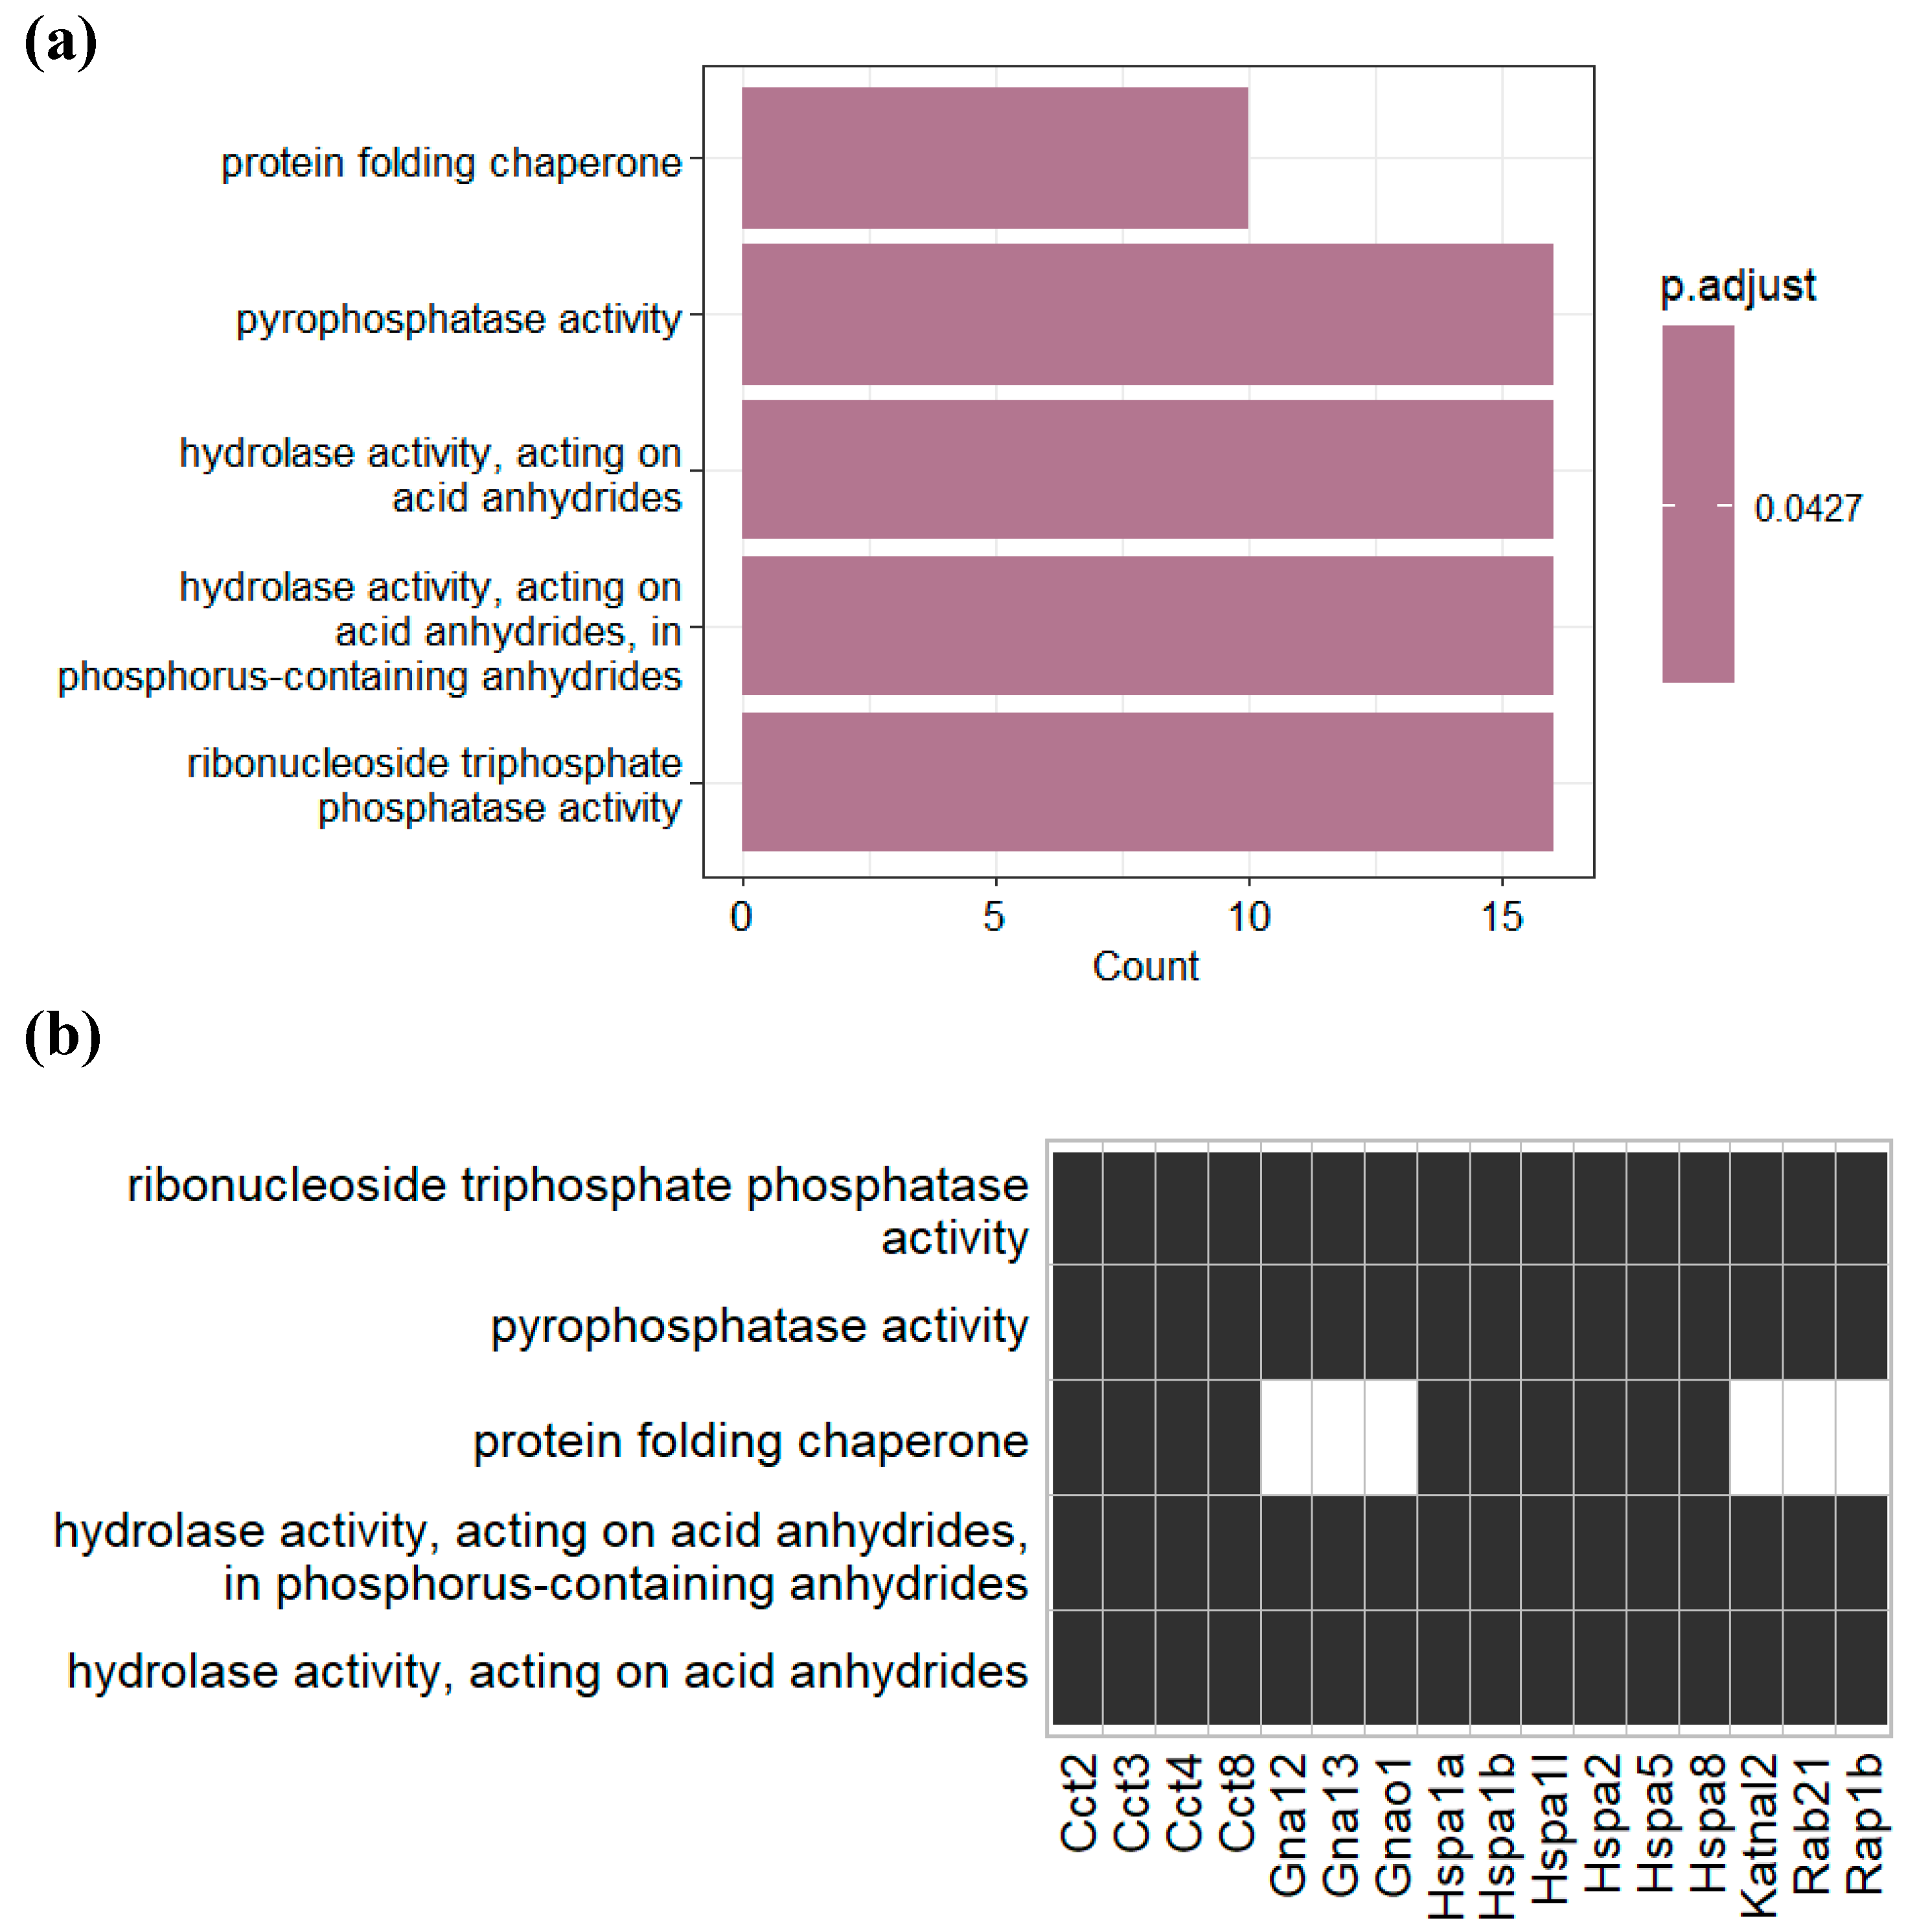
Figure 4.
Obesity-Associated Changes in Proteins shared between Plasma and Gut EVs. (a) Venn diagram displaying the intersection of proteins identified in HFD mice and NCD mice, from all proteins shared between PDEV and GDEV. All proteins presented an FDR < 0,01. (b) List of 4 proteins shared between PDEV and GDEV, present exclusively in NCD mice.
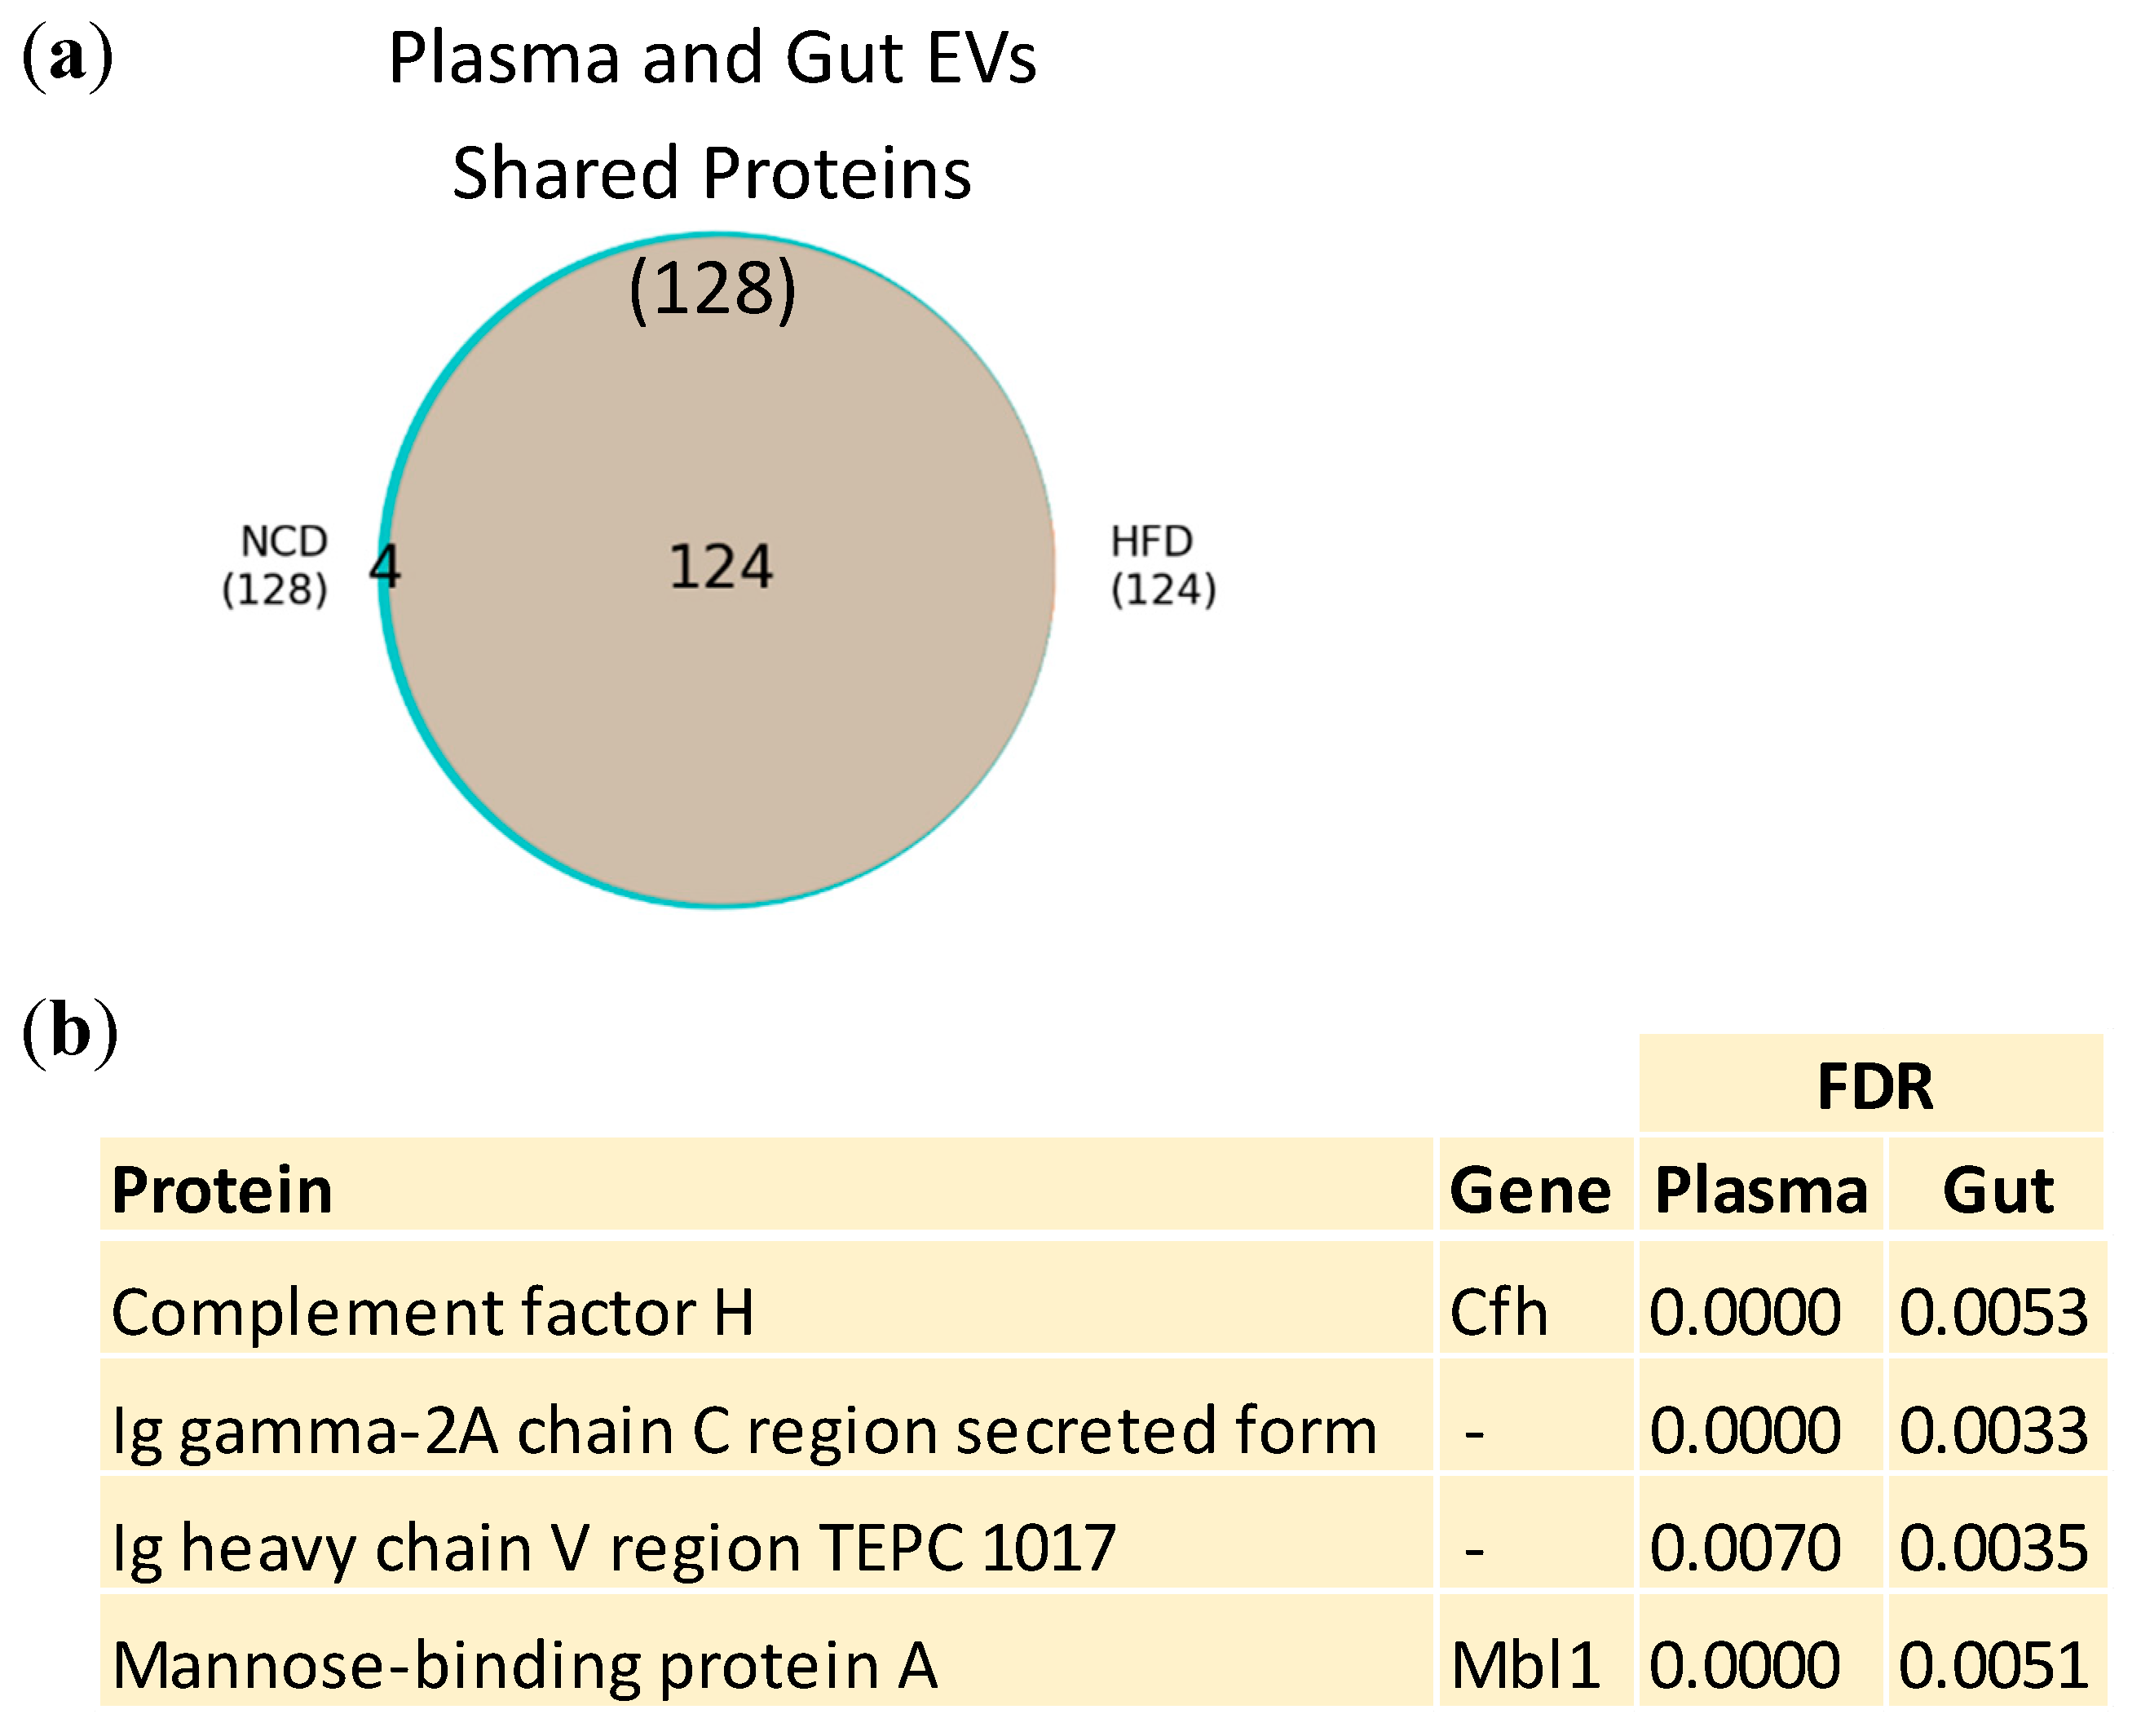
Figure 5.
Analysis of Protein Acetylation and Glycation in Plasma and Gut EVs. (a) Venn diagram representing the intersection of acetylated proteins identified in NCD and HFD plasma EVs. (b) Venn diagram representing the intersection of glycated proteins identified in NCD and HFD plasma EVs. (c) Venn diagram representing the intersection of proteins identified in NCD and HFD gut EVs. (d) Venn diagram representing the intersection of acetylated proteins identified in NCD and HFD gut EVs. (e) Venn diagram representing the intersection of glycated proteins identified in NCD and HFD gut EVs.
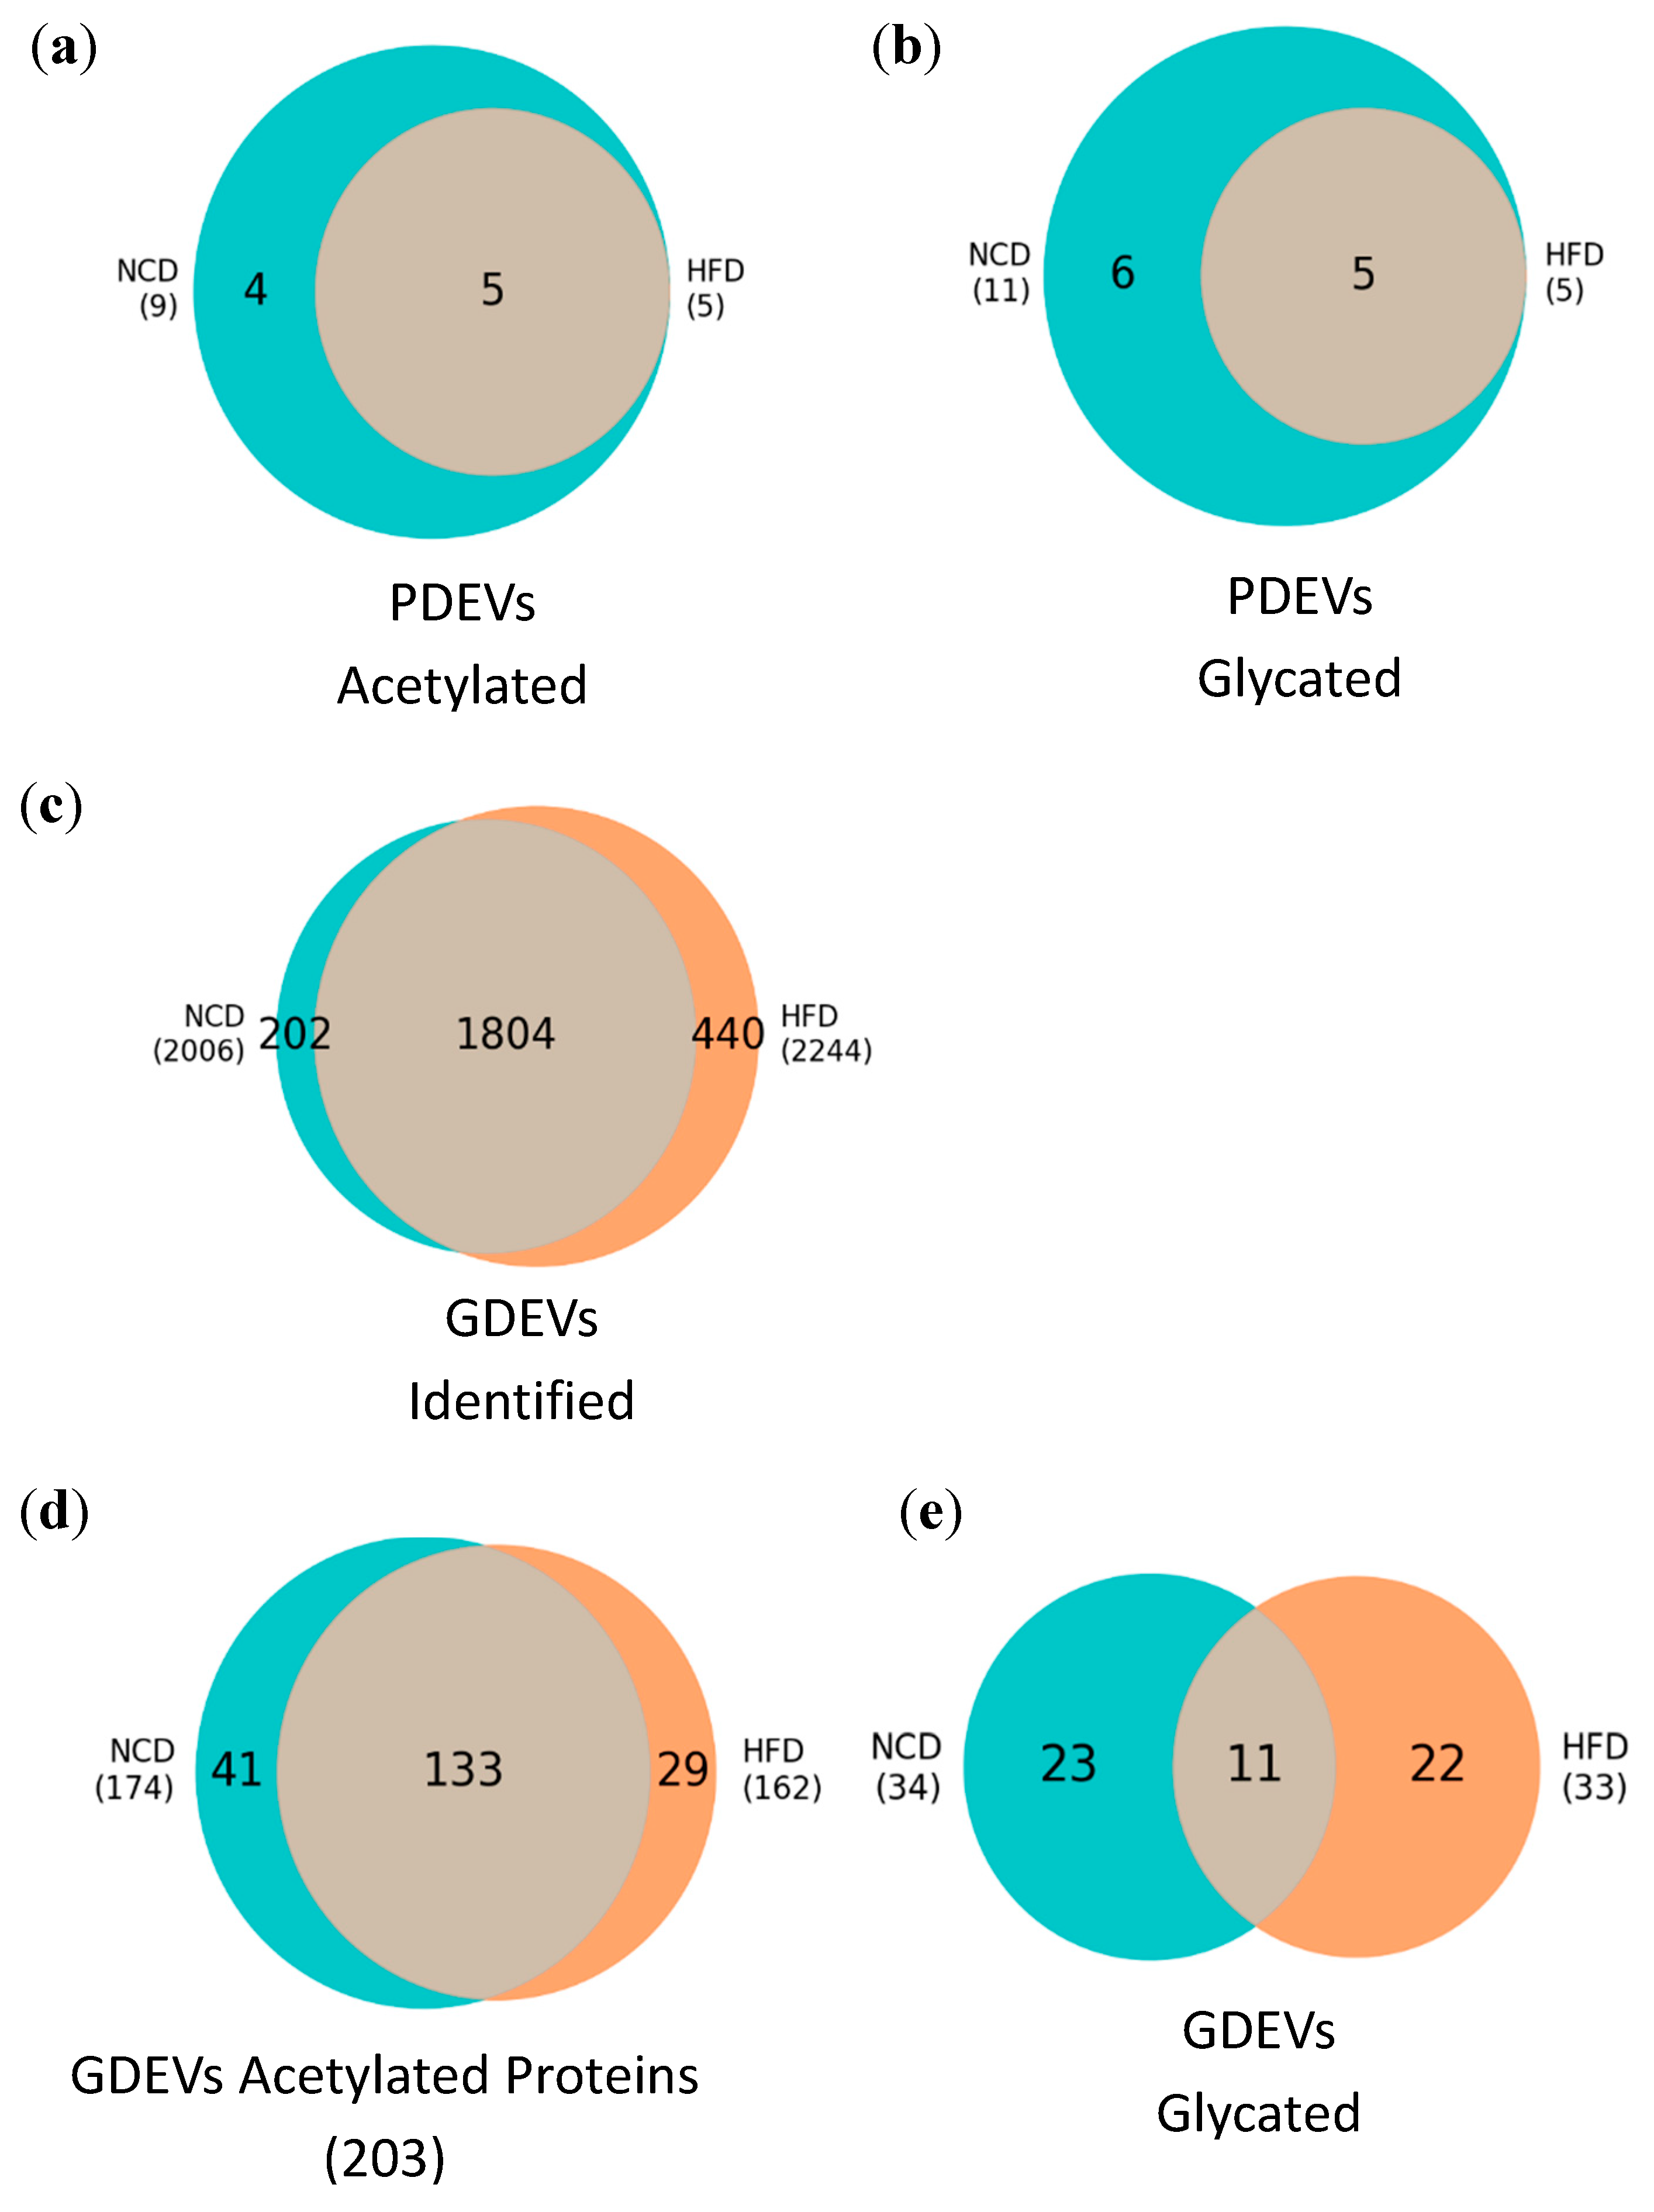
Figure 6.
Over-Representation Analysis of Gut EVs Proteins Featuring Acetylation and Glycation. (a) GO enrichment analysis according to cellular components. (b) GO enrichment analysis according to molecular functions. (c) KEGG enrichment analysis for KEGG pathways.
Figure 6.
Over-Representation Analysis of Gut EVs Proteins Featuring Acetylation and Glycation. (a) GO enrichment analysis according to cellular components. (b) GO enrichment analysis according to molecular functions. (c) KEGG enrichment analysis for KEGG pathways.
Disclaimer/Publisher’s Note: The statements, opinions and data contained in all publications are solely those of the individual author(s) and contributor(s) and not of MDPI and/or the editor(s). MDPI and/or the editor(s) disclaim responsibility for any injury to people or property resulting from any ideas, methods, instructions or products referred to in the content. |
© 2024 by the authors. Licensee MDPI, Basel, Switzerland. This article is an open access article distributed under the terms and conditions of the Creative Commons Attribution (CC BY) license (http://creativecommons.org/licenses/by/4.0/).
Copyright: This open access article is published under a Creative Commons CC BY 4.0 license, which permit the free download, distribution, and reuse, provided that the author and preprint are cited in any reuse.


