
Submitted:
01 January 2025
Posted:
04 January 2025
You are already at the latest version
Abstract
Celiac disease (CD) is an autoimmune disorder characterized by small intestinal enteropathy triggered by gluten ingestion, often associated with gut dysbiosis. The most effective treatment is strict adherence to a gluten-free diet (GFD), which alleviates symptoms. To evaluate the long-term impact of GFD, this study analyzed the gut microbiota of 10 women with CD on a GFD for over a year compared to 10 healthy controls with unrestricted diets. Taxonomic diversity (16S rRNA gene sequencing and the analysis of α and β-diversity), metabolic functionality (Biolog EcoPlates®), and antibiotic resistance profiles (Cenoantibiogram) were assessed. Metagenomic analysis revealed no significant differences in taxonomic diversity but highlighted variations in the abundance of specific bacterial genera. Women with CD showed increased proportions of Bacteroides, Streptococcus, and Clostridium, associated with inflammation, but also elevated levels of beneficial genera such as Roseburia, Oxalobacter, and Paraprevotella. Despite no significant differences in metabolic diversity, higher minimum inhibitory concentrations (MICs) in women in the healthy control group suggest that dietary substrates in unrestricted diets may promote the growth of fast-growing bacteria capable of rapidly developing and disseminating antibiotic resistance mechanisms. These findings indicate that prolonged adherence to a GFD in CD supports remission of gut dysbiosis, enhances microbiota functionality, and may reduce the risk of antibiotic resistance, emphasizing the importance of dietary man agement in CD.
Keywords:
Celiac disease
; Gluten-free diet
; Gut microbiota
; Cenoantibiogram
; Metagenomics
; Antibiotic resistance
Graphical abstract
1. Introduction
Celiac disease (CD) is a systemic, immune-mediated, multifactorial disorder triggered by the ingestion of gluten and related prolamins in genetically predisposed individuals [1]. This disorder affects more than 7 million people in Europe, with a higher prevalence in women, with an estimated incidence of 17,4 cases per 100.000 women compared to 7,8 per 100.000 men [2]. CD is one of the few chronic diseases where the genetic component (HLA-DQ2 and HLA-DQ8), the implicated autoantigen (tissue transglutaminase, tTG), and the environmental trigger (gluten) have been clearly identified [3].
Although CD has a strong hereditary component, with a familial recurrence rate of 10-15%, only 2-3% of individuals carrying the predisposition genes develop the disease, despite more than 30% of the global population carrying these genes and being exposed to gluten. This indicates that additional environmental factors are critical in its development [4]. Research studies such as the TEDDY, EAT, and PRO-FILE studies have identified risk factors such as early viral infections (e.g., rotavirus), early introduction of gluten into the diet, and the use of antibiotics, which can alter the gut microbiota and increase susceptibility to CD [5].
Gluten, a storage protein found primarily in wheat, constitutes between 80% and 85% of the total protein in this cereal. Its most relevant fraction, gliadin, is resistant to complete digestion by gastric, pancreatic, and intestinal enzymes, generating large peptide fragments (up to 33 amino acids) in the small intestine that can trigger immune responses in genetically predisposed individuals [6]. Currently, the only effective therapeutic strategy for CD patients is strict adherence to a lifelong gluten-free diet (GFD) [7].
Numerous studies have shown that a GFD significantly improves the quality of life of celiac patients, reduces clinical symptoms, and prevents long-term complications. For example, Borghini et al. [8] reported improvements in nutrient absorption and a reduction in serum inflammatory markers in patients who strictly followed this diet. Similarly, Poslt Königová et al. [9] indicated that a GFD reduces the risk of autoimmune complications and malignancies associated with CD, while Aljada et al. [10] high-lighted its role in preventing malnutrition, peripheral neuropathy, and other severe complications.
The gut microbiota, an ecosystem composed of approximately 100 trillion microorganisms, plays essential roles in human health, with alterations implicated in the development and progression of CD [11]. Key roles include the production of short-chain fatty acids (SCFAs), such as butyrate, propionate, and acetate, compounds generated by genera like Prevotella, which are crucial for maintaining a proper pH and possess anti-inflammatory properties [12,13]. In CD patients, dysbiosis may decrease SCFA production, contributing to inflammatory processes and exacerbating symptoms [13,14]. Additionally, genera like Bifidobacterium and Lactobacillus synthesize essential vitamins, whose deficiency is common in the dysbiosis associated with CD.
The microbiota also plays a role in protecting against pathogens by competing for nutrients and space, as well as generating bacteriocins with antimicrobial activity. Bacteria like Akkermansia muciniphila and Lactobacillus are essential in this function, which is affected in CD patients, increasing susceptibility to infections [15,16,17]. Moreover, genera like Bacteroides and Enterococcus participate in immune regulation, preventing excessive inflammation and autoimmune processes, while Akkermansia muciniphila contributes to mucus production, reinforcing the integrity of the intestinal barrier and limiting the entry of antigens and bacteria into the bloodstream [18,19,20]. In CD, these functions are compromised, exacerbating inflammation and intestinal damage.
Amplicon metagenomics has revolutionized the study of gut microbial communities, allowing detailed exploration of bacterial diversity in various conditions, such as CD. This approach provides precise information about the composition through the analysis of specific DNA regions, such as 16S rRNA. This technique has proven essential for understanding how dietary and other factors can alter the gut microbiota [21].
On the other hand, the functional diversity of the gut microbiota is a key concept in microbial stability and usually is evaluated using tools like BIOLOG. Functional diversity implies that different bacterial species can carry out similar metabolic functions, ensuring the maintenance of intestinal health even in the face of alterations in bacterial composition. This is especially important in the context of diseases like CD, where dietary or environmental changes can affect the microbiota and its functionality.
Another relevant aspect is the study of microbial communities as biomarkers and potential reservoirs of resistance genes. Gut bacteria can harbor these genes and transfer them to other strains, thereby increasing the spread of resistance mechanisms. This information is crucial for predicting how clinical interventions, such as dietary changes or the use of antibiotics, can influence antimicrobial resistance [22].
This study aims to determine the impact of a prolonged GFD on the gut microbiota in women with CD, compared to healthy women on a standard diet, addressing aspects such as functional and taxonomic diversity and their response to clinically used antibiotics. These approaches may help to understand how adherence to a GFD may modify the gut microbiota, influencing the pathogenesis of CD, intestinal immune regulation, and interaction with antimicrobial treatments [11,13].
2. Results
2.1. Study of the Microbial Community Functionality
Based on the graph of nutrient consumption kinetics on the plate (Figure S1), the peak of metabolic activity was observed at 168 hours post-bacterial inoculation. The metabolic diversity of the microbial community at this time, calculated using the mean Shannon Index from triplicate samples on the plate showed no significant differences between the two study groups.
Figure 1.
Metabolic diversity of bacterial communities from samples in the 'Control vs. Celiac' study groups at 168 hours post-inoculation. Each bar represents the Shannon’s Index.
Figure 1.
Metabolic diversity of bacterial communities from samples in the 'Control vs. Celiac' study groups at 168 hours post-inoculation. Each bar represents the Shannon’s Index.
2.2. Response of the Bacterial Community to Specific Antibiotics
In the analysis of the antibiotic resistance profile of the bacterial community tested with the epsilon test under aerobic and anaerobic conditions, the MIC values obtained are detailed in Tables S1 and S2.
In Figure 2B, a clear aggregation is observed on the left half of the values for the samples from women with CD on a gluten-free diet (red ellipse). In contrast, the control group of women with a normal diet cluster with a slight tendency of the values on the right half of the graph (blue ellipse), although there is greater heterogeneity. Additionally, an area of overlap between the samples from both groups is visible.
In Figure 3a., the segregation of loadings is observed based on their nature and resistance mechanisms. Quinolones (CIP and LEV) are grouped in the upper left corner, while β-lactams (IMI, IMI_EDTA, and AML_CLV) are in the lower right corner. When testing antibiotics under anaerobic conditions (Figure 3B), no segregation of values between the study groups is observed, as both show greater heterogeneity in antibiotic susceptibility across their samples, with a large overlapping area. However, a slight trend is observed with the celiac group (red ellipse) leaning toward the left of the graph, and the control group toward the right. Therefore, the control group samples tend to have higher MICs for the antibiotics CLV, IMI, CD, and AML, as these samples are grouped in the positive region of Component 1, while the celiac group samples show greater variability and lower MICs for these antibiotics, as they are grouped more toward the center and the negative region of Component 1.
These results were compared with a Student's t-test to determine significant differences (p-value < 0,05) between the mean MICs of the two study groups. In antibiotic testing under aerobic conditions, significant differences in antibiotic resistance to CAZ and CR were observed, with the celiac group being more sensitive to both antibiotics (Figure S2).
In antibiotic testing under anaerobic conditions, significant differences in MICs to IMI_EDTA were observed, with the celiac group being more sensitive to this β-lactam (Figure S3).
2.3. Metagenomics
After bacterial DNA sequencing, a total of 1.500.220 reads passed the quality control. The taxonomic analysis revealed 1.424.456 reads at the phylum level, 1.416.882 reads at the order level, 1.859.850 reads at the family level, and 1.379.898 reads at the genus level.
2.3.1. Alpha and Beta Diversity
A preliminary differential approach between the control and celiac groups consisted of comparing the total number of genera obtained for each group using a Venn diagram (Figure 4a). In the set of samples from celiac patients, 788 different bacterial genera were identified, compared to 758 in the control group, of which 567 genera were shared between both groups. Subsequently, alpha and beta diversity analyses were performed (Figure 4b and 4c) to study the intra- and inter-sample richness and diversity. Specifically, in Figure 4b, none of the alpha diversity tests showed significant differences. The Shannon Index had a mean of 2,42 in the control group and 2,56 in celiac patients (p-value = 0,951), the Simpson Index had a mean of 0.850 in the control group and 0.8969 in celiac patients (p-value = 0,690), the Chao1 Index had a mean of 34.5 in the control group and 42,8 in celiac patients (p-value = 0,271), and the ACE Index showed a mean of 39,7 in the control group and 41,9 in celiac patients (p-value = 0,526).
The study of bacterial beta diversity (Figure 4c), using the Jaccard and Bray-Curtis indices, shows that there are no significant differences in the composition and relative abundance of bacterial genera between the two groups. In the Bray-Curtis index analysis, there is a slight tendency of the celiac samples' data to the right, in red, and the control samples to the left, in turquoise.
2.3.2. Dominant Bacterial Phyla
Through the comparative descriptive study of the relative abundance percentages of the 5 dominant bacterial phyla in the women with celiac disease group versus the control group values (Figure 5), no significant differences (p-value > 0,05) were found between both study groups, the bacterial community was predominantly represented by the Bacillota phylum, accounting for 88,736% in the control group and 93,83% % in the women with celiac disease group.
2.3.3. Biodiversity Index
Regarding the study of bacterial biodiversity through the Bacillota/Bacteroidetes and Bacteroides/Prevotella indices (Table 1), in the case of the Bacillota/Bacteroidetes index, in the control group, the abundance of Bacillota is approximately 17,92 times higher than that of Bacteroidetes, considering that the data is in logarithmic scale (e.g., 101,253 = 17,92). In contrast, in the women with celiac disease study group, the abundance of Bacillota is approximately 31,21 times higher than Bacteroidetes.
Regarding the Bacteroides/Prevotella index, it is observed that in the control group, the relative abundance of Prevotella is approximately 1,23 times higher than Bacteroides. In the women with celiac disease study group, the abundance of Bacteroides is approximately 4,14 times higher than Prevotella.
2.3.4. Dominant Bacterial Orders, Families, and Genera
In the comparative analysis of relative abundance at different taxonomic levels between both study groups (Figure 6), no significant statistical differences (p < 0.05) were observed at the taxonomic levels of Order and Family.
At the Order taxonomic level (Figure 6a), the bacterial Order with the highest relative abundance in both study groups is Eubacteriales, with a percentage around 88% in both groups. At the Family taxonomic level, the bacterial Family with the highest relative abundance in both groups is Lachnospiraceae, with a percentage of 44% in the control group versus 45% relative abundance in the women with celiac disease group.
In the analysis of the top 10 genera with the highest intra-microbial relative abundance and comparison between both study groups (Figure 6b and 6c), the genus Blautia is the most abundant, with an average of 14% in the control group compared to 13% in the women with celiac disease group. Secondly it is the genus Faecalibacterium, which is increased in celiacs with an average of 12% compared to 8% in the control group. Roseburia showed a significantly higher abundance (p-value = 0,035) in women with celiac disease compared to the control group. Bacteroides showed a higher abundance in the celiac group, around 2%, compared to approximately 1,5% in the control. Coprococcus was more abundant in the celiac group, around 3%, compared to approximately 2,5% in the control group. Clostridium also had a higher abundance in the celiac group, around 3,5%, compared to approximately 3% in the control group. Ruminococcus showed higher abundance in celiacs, around 4%, compared to approximately 3% in controls. Also, Anaerobutyricum was more abundant in celiacs compared to controls, with both groups having approximately 4%. Romboutsia showed higher abundance in the celiac group, around 5%, compared to approximately 4% in controls. However, Eubacterium showed higher abundance in the control group, around 6%.
In Figure 6d, significant differences in the relative abundance of certain bacterial genera between women with celiac disease on a gluten-free diet (in red) and control women on a normal diet (in blue) are observed, using a p-value cutoff of 0,06. Genera such as Oxalobacter, Paraprevotella, Roseburia, Muricomes, and Streptococcus showed a significant increase in their relative abundance in women with celiac disease compared to the control group with p-values of 0,0064, 0,0201, 0,0348, 0,0367, and 0,0558, respectively (Table S3). In contrast, genera like Acetanaerobacterium showed a significant decrease in women with celiac disease compared to the control group, with a p-value of 0,0077 (Table S3).
In Figure 6e, the relative abundance of some of the cultivable genera is shown: Lactobacillus, Enterococcus, Escherichia, Staphylococcus, and Streptococcus. The genera Lactobacillus and Streptococcus have higher abundance in celiacs compared to controls, with the difference being significant for Streptococcus (p-value = 0,056). Meanwhile, the genera Enterococcus, Escherichia, and Staphylococcus are more abundant in the control group.
3. Discussion
The impact of a gluten-free diet (GFD) on gut microbiota was evaluated by studying 10 women diagnosed with celiac disease (CD) who had been following a GFD for over a year, compared to a control group of 10 women on a normal diet. This comprehensive approach provided a deeper understanding of the microbial changes induced by the GFD, offering valuable insights into the interaction and functioning of gut bacteria. Although the GFD is essential for managing CD it has been debated in several studies [10,23] due to its fiber deficiency, especially soluble fibers like beta-glucans (found in barley), and certain types of resistant starch, because of the exclusion of whole grains and some fiber-rich vegetables. In this context, there is evidence linking a reduced intake of certain types of dietary fiber required for bacterial fermentation and the production of SCFAs like butyrate and propionate to a reduced functional capacity of the microbiota. However, our results suggest that women with CD can maintain intestinal microbial functionality similar to women on a normal diet.
Similarly, the results related to functional diversity, particularly in substrate transformation capabilities, showed no significant differences between the two study groups. This suggests that the bacterial communities of both groups have the capacity to utilize a variety of substrates similarly, indicating that dietary composition has a similar effect on individuals with different sensitivities to gluten when both groups have not been exposed to the allergen [24]. A recent study by Melini and Melini [25] showed that a GFD can be nutritionally adequate if it includes fiber-rich foods such as fruits, vegetables, legumes, and pseudocereals like quinoa or amaranth. These sources can compensate for the lack of fiber typically found in gluten-containing grains, supporting the idea that a well-planned GFD does not necessarily result in lower fiber intake and, therefore, a lower functionality of the microbiota [26].
The intestine may act as a reservoir for molecular mechanisms of antibiotic resistance. There is significant scientific interest in understanding the impact of diet on the preservation or control of the spread of resistance mechanisms shared by intestinal microbial communities. In this regard, the technique of the "cenoantibiogram", defined as the analysis of the bacterial community’s response to antibiotics, does not aim to characterize each of the different mechanisms explaining the community’s response to antibiotics but rather to assess the overall phenotypic behavior of the intestinal microbial community. In this context, the bacterial community of women with CD showed very homogeneous behavior both in aerobic conditions and in the absence of oxygen, with lower minimum inhibitory concentrations (MICs) to all tested antibiotics. These results suggest that prolonged adherence to a GFD in women with CD, compared to the control group, could influence the decrease in MICs to certain antibiotics. Conversely, in the control group’s bacterial community, there was a more heterogeneous antibiotic response in each sample, which suggests that a less restrictive diet may favor the proliferation of fast-growing bacteria, resulting in higher MICs.
Some studies [27,28] suggest that ultra-processed foods (UPFs), many of which are rich in gluten and not included in a GFD, contain simple carbohydrates. These simple sugars may favor the growth of fast-growing bacteria capable of proliferating rapidly due to the high availability of sugars. Fast-growing bacteria represent a significant public health challenge because of their ability to quickly develop and spread multiple antibiotic resistance mechanisms. Their high reproduction rates, horizontal gene transfer, biofilm formation, and rapid adaptation to antibiotic stress are key factors contributing to this problem [29]. Therefore, this observation could suggest that reducing the intake of these simple carbohydrates in GFDs could limit the growth of these bacteria, reducing MICs in the intestinal microbiota of celiac patients. When comparing metagenomic data, we observed a higher proportion of cultivable fast-growing bacteria, such as Escherichia, Enterococcus, and Staphylococcus, in the microbiota of the control women compared to the women with celiac disease. These data support the hypothesis that adherence to a stricter GFD, compared to a normal diet, could lead to lower MICs for antibiotics and possibly lower proliferation of fast-growing bacteria.
However, inherent difficulties in studying the intestinal microbiota and challenges in obtaining consistent results necessitate further studies to clarify these preliminary findings. Furthermore, standardizing protocols for bacterial DNA extraction from fecal samples and the subsequent bioinformatics processing of the obtained data can facilitate better interpretation of results across research studies [30,31]. There is a high scientific consensus stating that Gram-positive bacteria present more difficulty in lysis and proper DNA extraction [32]. In our results, high-quality sequencing and significant relative abundance of the Gram-positive phylum Bacillota were observed in both patient groups, indicating the suitability of the process used for bacterial DNA extraction from fecal samples [33].
A key finding was the result obtained for both alpha and beta diversity indices. Women with CD on a GFD did not show significant differences compared to the control group in either the composition or the bacterial richness at the genus level. This supports recent studies [7,34] that have demonstrated that a GFD can restore microbial balance in the intestines of celiac patients, whose intestinal bacterial dysbiosis is well-documented, thereby improving the gastrointestinal clinical manifestations of the disease. Similarly, other studies suggest that a GFD can restore alpha diversity, while beta diversity differences compared to individuals on a normal diet may persist. This would indicate that celiac patients on a GFD may have a similar amount or richness of bacterial species in their intestines as control individuals, while the exact species present may differ between the two study groups [34]. Our study did not observe these described differences, which is a positive indicator of the importance of a GFD in modulating the gut microbiota and its potential to improve the health of people with CD.
Biodiversity indices revealed a higher relative proportion of bacteria from the Bacteroides genus compared to Prevotella in women with CD. This increase in Bacteroides is documented in inflammatory gastrointestinal pathologies such as CD, Crohn’s disease, and ulcerative colitis [35]. A higher relative abundance of Bacteroides was also observed in the metagenomic study in the women with celiac disease compared to the control group. This genus is described as pro-inflammatory, and an abundance of it may exacerbate gastrointestinal inflammatory conditions [36]. Lipopolysaccharides (LPS) are components of the outer membrane of Gram-negative bacteria like Bacteroides. While high doses of LPS are known to induce a strong inflammatory response, recent research [37,38] has shown that exposure to small amounts of LPS may not trigger such acute inflammation as high doses, but sustained activation of TLR4 and NF-κB may maintain chronic production of pro-inflammatory cytokines like TNF-α, IL-1β, and IL-6.
In the case of the metagenomic results obtained for Streptococcus, another pro-inflammatory genus, a significantly higher abundance was observed in the women with celiac disease compared to the control group. The study by Maciel-Fiuza et al. [39] highlights that Streptococcus, in combination with Veillonella, a genus also increased in the women with celiac disease (Table 3), can exacerbate the production of pro-inflammatory cytokines like TNF-α, IL-8, IL-6, and IL-10, contributing to an inflammatory state in the intestines. It is important to note that although general taxonomic diversity may be similar between women with CD and control women, alterations in specific bacterial genera may influence the inflammation and intestinal permeability characteristic of CD. These alterations may not manifest in daily symptoms if patients adhere to a GFD but highlight the importance of monitoring and maintaining a healthy balance in the gut microbiota to prevent long-term complications. Studies such as Spatola [40] have pointed out that not all celiac patients respond completely to a GFD, with a minority of patients (approximately 10-19%) suffering from non-responsive celiac disease (NRCD), where the intestinal mucosa does not fully recover even after a year on a GFD, with persistent inflammation.
Therefore, the metagenomic results obtained in this study suggest that a GFD could restore bacterial balance in celiac patients, increasing the relative abundance of beneficial SCFA-producing bacteria, such as Paraprevotella, Roseburia, Lactobacillus, or Faecalibacterium, thus supporting other studies [10,41]. This could counteract the possible discussed fiber deficiency in a GFD in celiac patients, as evidenced by a similar substrate degradation capacity in celiac patients compared to the control group.
The increase in the relative abundance of the cultivable Escherichia genus and the significant rise in MICs for the tested antibiotic in anaerobiosis (IMI_EDTA) observed in the control group compared to the celiac group suggests that a non-restrictive diet increases the relative abundance of a bacterial genus known for its ability to acquire and spread antibiotic resistance genes, including carbapenemases, enzymes that degrade carbapenems. Dietary restriction may limit exposure to certain dietary and environmental factors that favor the selection and proliferation of these resistant bacteria.
It is relevant to mention that the functional redundancy of the intestinal microbiota, a concept explaining that different bacterial species can perform similar metabolic functions, ensuring functional stability despite changes in bacterial composition [42], could explain why, despite significant differences in the relative abundance of specific bacterial genera, the overall functionality of the microbiota in women with CD is not compromised.
4. Materials and Methods
4.1. Sample Collection and Inclusion Criteria
In 2022, a double-blind comparative study was conducted to analyze the gut microbiota of 10 women with diagnosed celiac disease (CD) who were following a gluten-free diet for more than one year, compared to 10 control women following a normal diet. All participants were aged between 19 and 59 years.
The samples were collected by the “Food and Nutrition in Health Promotion Research Group (CEU-NutriFOOD), ref. C08/0720” research group from the CEU San Pablo University (Madrid, Spain) as part of the cross-sectional study on women, VENCELIAQ-FOL. Women with CD were identified through the Spanish Celiac Disease and Gluten Sensitivity Association in Madrid (ACSG), by distributing an informational brochure via email, social media, and the association’s publications. For the recruitment of controls, the research team collaborated with volunteers who expressed interest in participating by learning about the study through CEU-NutriFOOD staff at CEU San Pablo University (Alcorcón, Madrid, Spain) and social media. In both cases, volunteers who did not meet the inclusion criteria (Table S4) were excluded, as well as women who were pregnant or breastfeeding. Additionally, for the control group, volunteers who tested positive for anti-tissue transglutaminase antibodies (AAtTG) were excluded, as they might have undiagnosed CD. A stool sample about the size of a walnut was collected in a sterile container, ensuring it was free from urine or water contamination. The container was sealed tightly and labeled appropriately. The sample was then frozen at -80°C.
4.2. Study of Microbial Community Functionality
A 1:9 dilution of each fecal sample was prepared in saline solution (0.45% NaCl) from 2g of pure sample, and the optical density was adjusted to 0.5 McFarland (>108 CFU/mL of viable microorganisms) using a Densimat® (bioMérieux, Marcy-l'Étoile, France). The Biolog Eco® plates were loaded with 135 μL per well. The plates were incubated for 168 hours at 37°C, with absorbance measurements taken every 24 hours at 590 nm using the Asys UVM340 plate reader (Biochrom Ltd, Cambridge, UK) and the Micro WinTM V3.5 software (Mikrotek Laborsysteme GmbH, Overath, Germany).
4.3. Cenoantibiogram
From the same bacterial suspension obtained under the conditions described in the previous section, flooding inoculation was performed on Mueller-Hinton agar (Condalab®, Madrid, Spain), and the minimum inhibitory concentration (MIC) was evaluated in triplicate using antibiotic strips (ε-test). Under aerobic conditions, the following antibiotics were tested: Amikacin (AK), Amoxicillin (AML), Ceftazidime (CAZ), Cefpirome (CR), Gentamicin (CN), and Sulfamethoxazole/Trimethoprim (TS) (BioMérieux®, Marcy l'Etoile, France). The same procedure was performed under anaerobic conditions for the following antibiotics: Ciprofloxacin (CIP), Levofloxacin (LEV), Clindamycin (CD), Rifampicin (RD), Azithromycin (AZM), Metronidazole (MTZ), Imipenem (IMI), Imipenem+EDTA (IMI_EDTA), and Augmentin (AML_CLV) (BioMérieux®, Marcy l'Etoile, France). The plates were incubated according to the manufacturer’s instructions. For MIC quantification, the most restrictive halo was used as the reference.
4.4. Statistical Analysis
A principal component analysis (PCA) was conducted, starting with a 2D projection of the factor loadings. The distribution of individuals in the PCA corresponds to the distribution of the factor loadings. To contrast these data, a Student’s t-test was performed to assess significant differences in MIC values between the two study groups. All statistical analyses were performed using SPSS software (Version 30.0, IBM Corp, Armonk, NY, USA).
To assess significant differences in MIC values between the celiac and control groups, a Student’s t-test was performed. All statistical analyses were conducted using SPSS software (Version 27.0, IBM Corp, Armonk, NY, USA).
The raw results obtained from the absorbance measurements of the Biolog Eco® were corrected by subtracting the blank (corrected absorbance value). The r of AWCD (Average Well Color Development) was plotted against incubation time to obtain the growth curves of the microbial community in the wells of the plate. The point of incubation where microbial growth began to enter the stationary phase was selected for subsequent multivariate analyses. Additionally, using the corrected absorbance values at the selected incubation point as AWCD, the metabolic diversity of each sample was calculated using the following formula:; qi= n/N, where n is the corrected absorbance (AWCD) of each well, and N is the total absorbance of all wells.
4.5. Metagenomic Analysis
4.5.1. Bacterial DNA Extraction
Microbial DNA was extracted using the REAL Microbiome Fecal DNA kit (Durviz, Valencia, Spain), and the protocol was optimized to improve the extraction quality. DNA purity and concentration were determined using the NanoDrop One Microvolume UV-Vis spectrophotometer (Thermo Fisher Scientific, Waltham, MA, USA).
4.5.2. Amplification and Library Preparation
DNA amplification was performed using the 16S Barcoding Kit (SQK-RAB204, Oxford Nanopore Technology, Oxford, UK) following Matsuo et al. [43]. The primers used for amplifying the full 16S gene region were the universal primers 27F (5'-AGAGTTTGATCMTGGCTCAG-3') and 1492R (5'-TACGGYTACCTTGTTACGACTT-3'), with a unique sample barcode sequence attached. PCR was carried out in a thermal cycler with the following conditions: initial denaturation (1 min, 95°C), 25 cycles of denaturation (20 s, 95°C), annealing (30 s, 55°C), and elongation (7 min, 65°C).
The PCR product was purified using AMPure XP beads (Beckman Coulter, Indianapolis, IN, USA) and the library was prepared according to the 16S Barcoding Kit instructions.
4.5.3. Sequencing
200 ng of a pooled library was loaded onto an R9.4.1 flow cell, and sequencing was carried out on the MinION Mk1C device (Oxford Nanopore Technologies, Oxford, UK) for 24 hours using the MinKNOW analysis software with default settings. Demultiplexing, or obtaining signals by sample, was performed using the same software. The FAST5 sequencing data (voltage change signals) were automatically processed with the Guppy software embedded in the MinKNOW interface with default settings to obtain reads in FASTQ format. Additionally, the quality of the obtained reads was assessed, with a minimum Quality Score of 8.
4.5.4. Processing and Analysis of Metagenomic Data
All the reads that passed quality control were isolated and used as input for the Fastq16S v2022.01.07 workflow from EPI2ME (Oxford Nanopore Technologies, Oxford, UK). This protocol uses the NCBI database to return an identification based on sequences analyzed with BLAST. Subsequently, normalization was performed using Total Sum Scaling (TSS) on the CSV reports exported by EPI2ME, utilizing the R programming language and the RStudio interface Version 2023.09.1+494 (RStudio Team, 2023).
The TSS normalization was calculated using the formula: , is the normalized relative abundance of the genus in the sampl,, is the number of reads of the genus in the sample , y is the sum of reads in the sample .
The alpha diversity indices at the taxonomic genus level, including the Shannon indices.(), Simpson (), Chao 1 () andACE () were calculated in RStudio using the “MicrobiomeStat” analysis package to evaluate richness and diversity within the samples (intrasample). Additionally, beta diversity at the taxonomic genus level was calculated using Bray-Curtis dissimilarity () and Jaccard index( ), also calculated with “MicrobiomeStat,” to compare diversity between different samples and study groups (intersample). To identify differences in taxon abundance between groups, the statistical method LinDA (Linear Discriminant Analysis) from the “MicrobiomeStat” package, as described by Zhou et al. [44], was used.
5. Conclusions
This study indicates that a gluten-free diet (GFD) can contribute to the stability of the microbiota in celiac disease. Despite the exclusion of gluten, the functionality of the microbiota was comparable to that of healthy controls, with no significant differences in microbial richness or diversity. Furthermore, the reduced prevalence of fast-growing bacteria in the GFD group and the changes observed in antibiotic resistance patterns highlight the potential benefits of this diet in modulating the gut microbiota and possibly reducing the risk of antibiotic resistance. However, the study underscores the complexity of the gut microbiota and the need for further research to better understand its long-term implications.
Supplementary Materials
The following supporting information can be downloaded at the website of this paper posted on Preprints.org.
Author Contributions
Conceptualization, (AAE), (UMN), (RMM) (RSP) and (JGP); methodology, (RBM), (RSP), (MMM) (DIR) ; software, (GRD), (AHJ); validation, (RMM), (JGP) and (RSP); formal analysis, (AHJ), (GRD) and (MMM); investigation, (MMM), (DIR), and (RSP); resources, (UMN), (AAE), (RMM) and (JGP); data curation, (GRD), (AHJ), and (RSP); writing—original draft preparation (GDR), (MMM); writing—review and editing, (MMM), (RSP); visualization, (DGR), (AHJ); supervision, (DIR); project administration, (UMN), (AAE), (RMM), (RSP) and (JGP); funding acquisition, (RMM), (AAE) and (JGP). All authors have read and agreed to the published version of the manuscript.
Funding
This research was funded by Universidad San Pablo-CEU, CEU Universities grant number MGI22EAA.
Institutional Review Board Statement
The study was conducted in accordance with the Declaration of Helsinki, and approved by the Ethics Committee of Universidad San Pablo -CEU (protocol code 600/22/59, approved April 7th, 2022).
Informed Consent Statement
Informed consent was obtained from all subjects involved in the study.
Conflicts of Interest
The authors declare no conflicts of interest.
References
- Makharia, G.K.; Singh, P.; Catassi, C.; Sanders, D.S.; Leffler, D.; Ali, R.A.R.; Bai, J.C. The Global Burden of Coeliac Disease: Opportunities and Challenges. Nat Rev Gastroenterol Hepatol 2022, 19, 313–327. [Google Scholar] [CrossRef]
- Singh, P.; Arora, A.; Strand, T.A.; Leffler, D.A.; Catassi, C.; Green, P.H.; Kelly, C.P.; Ahuja, V.; Makharia, G.K. Global Prevalence of Celiac Disease: Systematic Review and Meta-Analysis. Clinical Gastroenterology and Hepatology 2018, 16, 823–836.e2. [Google Scholar] [CrossRef]
- Lebwohl, B.; Sanders, D.S.; Green, P.H.R. Coeliac Disease. The Lancet 2018, 391, 70–81. [Google Scholar] [CrossRef] [PubMed]
- Aboulaghras, S.; Piancatelli, D.; Taghzouti, K.; Balahbib, A.; Alshahrani, M.M.; Al Awadh, A.A.; Goh, K.W.; Ming, L.C.; Bouyahya, A.; Oumhani, K. Meta-Analysis and Systematic Review of HLA DQ2/DQ8 in Adults with Celiac Disease. IJMS 2023, 24, 1188. [Google Scholar] [CrossRef]
- the TEDDY Study Group; Rewers, M.; Hyöty, H.; Lernmark, Å.; Hagopian, W.; She, J.-X.; Schatz, D.; Ziegler, A.-G.; Toppari, J.; Akolkar, B.; et al. The Environmental Determinants of Diabetes in the Young (TEDDY) Study: 2018 Update. Curr Diab Rep 2018, 18, 136. [CrossRef]
- Schalk, K.; Lexhaller, B.; Koehler, P.; Scherf, K.A. Isolation and Characterization of Gluten Protein Types from Wheat, Rye, Barley and Oats for Use as Reference Materials. PLoS ONE 2017, 12, e0172819. [Google Scholar] [CrossRef] [PubMed]
- Caio, G.; Lungaro, L.; Segata, N.; Guarino, M.; Zoli, G.; Volta, U.; De Giorgio, R. Effect of Gluten-Free Diet on Gut Microbiota Composition in Patients with Celiac Disease and Non-Celiac Gluten/Wheat Sensitivity. Nutrients 2020, 12, 1832. [Google Scholar] [CrossRef]
- Borghini, R.; Di Tola, M.; Salvi, E.; Isonne, C.; Puzzono, M.; Marino, M.; Donato, G.; Picarelli, A. Impact of Gluten-Free Diet on Quality of Life in Celiac Patients. Acta Gastroenterol Belg 2016, 79, 447–453. [Google Scholar]
- Poslt Königová, M.; Sebalo Vňuková, M.; Řehořková, P.; Anders, M.; Ptáček, R. The Effectiveness of Gluten-Free Dietary Interventions: A Systematic Review. Front Psychol 2023, 14, 1107022. [Google Scholar] [CrossRef] [PubMed]
- Aljada, B.; Zohni, A.; El-Matary, W. The Gluten-Free Diet for Celiac Disease and Beyond. Nutrients 2021, 13, 3993. [Google Scholar] [CrossRef]
- Thursby, E.; Juge, N. Introduction to the Human Gut Microbiota. Biochemical Journal 2017, 474, 1823–1836. [Google Scholar] [CrossRef] [PubMed]
- Christensen, L.; Hjorth, M.F.; Krych, L.; Licht, T.R.; Lauritzen, L.; Magkos, F.; Roager, H.M. Prevotella Abundance and Salivary Amylase Gene Copy Number Predict Fat Loss in Response to Wholegrain Diets. Front. Nutr. 2022, 9, 947349. [Google Scholar] [CrossRef] [PubMed]
- Saviano, A.; Petruzziello, C.; Brigida, M.; Morabito Loprete, M.R.; Savioli, G.; Migneco, A.; Ojetti, V. Gut Microbiota Alteration and Its Modulation with Probiotics in Celiac Disease. Biomedicines 2023, 11, 2638. [Google Scholar] [CrossRef] [PubMed]
- Hati, S.; Patel, M.; Mishra, B.K.; Das, S. Short-Chain Fatty Acid and Vitamin Production Potentials of Lactobacillus Isolated from Fermented Foods of Khasi Tribes, Meghalaya, India. Ann Microbiol 2019, 69, 1191–1199. [Google Scholar] [CrossRef]
- Hanchi, H.; Mottawea, W.; Sebei, K.; Hammami, R. The Genus Enterococcus: Between Probiotic Potential and Safety Concerns—An Update. Front. Microbiol. 2018, 9, 1791. [Google Scholar] [CrossRef] [PubMed]
- Fernandes, A.; Oliveira, A.; Carvalho, A.L.; Soares, R.; Barata, P. Faecalibacterium Prausnitzii in Differentiated Thyroid Cancer Patients Treated with Radioiodine. Nutrients 2023, 15, 2680. [Google Scholar] [CrossRef]
- Kalia, V.C.; Gong, C.; Shanmugam, R.; Lin, H.; Zhang, L.; Lee, J.-K. The Emerging Biotherapeutic Agent: Akkermansia. Indian J Microbiol 2022, 62, 1–10. [Google Scholar] [CrossRef]
- Milani, C.; Duranti, S.; Bottacini, F.; Casey, E.; Turroni, F.; Mahony, J.; Belzer, C.; Delgado Palacio, S.; Arboleya Montes, S.; Mancabelli, L.; et al. The First Microbial Colonizers of the Human Gut: Composition, Activities, and Health Implications of the Infant Gut Microbiota. Microbiol Mol Biol Rev 2017, 81, e00036-17. [Google Scholar] [CrossRef]
- Ruan, W.; Engevik, M.A.; Spinler, J.K.; Versalovic, J. Healthy Human Gastrointestinal Microbiome: Composition and Function After a Decade of Exploration. Dig Dis Sci 2020, 65, 695–705. [Google Scholar] [CrossRef]
- Wang, X.; Yuan, W.; Yang, C.; Wang, Z.; Zhang, J.; Xu, D.; Sun, X.; Sun, W. Emerging Role of Gut Microbiota in Autoimmune Diseases. Front. Immunol. 2024, 15, 1365554. [Google Scholar] [CrossRef] [PubMed]
- Chaudhari, H.G.; Prajapati, S.; Wardah, Z.H.; Raol, G.; Prajapati, V.; Patel, R.; Shati, A.A.; Alfaifi, M.Y.; Elbehairi, S.E.I.; Sayyed, R.Z. Decoding the Microbial Universe with Metagenomics: A Brief Insight. Front. Genet. 2023, 14, 1119740. [Google Scholar] [CrossRef] [PubMed]
- Huang, N.; Nie, F.; Ni, P.; Luo, F.; Gao, X.; Wang, J. NeuralPolish: A Novel Nanopore Polishing Method Based on Alignment Matrix Construction and Orthogonal Bi-GRU Networks. Bioinformatics 2021, 37, 3120–3127. [Google Scholar] [CrossRef] [PubMed]
- De Palma, G.; Nadal, I.; Collado, M.C.; Sanz, Y. Effects of a Gluten-Free Diet on Gut Microbiota and Immune Function in Healthy Adult Human Subjects. Br J Nutr 2009, 102, 1154–1160. [Google Scholar] [CrossRef] [PubMed]
- Deehan, E.C.; Walter, J. The Fiber Gap and the Disappearing Gut Microbiome: Implications for Human Nutrition. Trends in Endocrinology & Metabolism 2016, 27, 239–242. [Google Scholar] [CrossRef]
- Melini, V.; Melini, F. Gluten-Free Diet: Gaps and Needs for a Healthier Diet. Nutrients 2019, 11, 170. [Google Scholar] [CrossRef]
- Simón, E.; Molero-Luis, M.; Fueyo-Díaz, R.; Costas-Batlle, C.; Crespo-Escobar, P.; Montoro-Huguet, M.A. The Gluten-Free Diet for Celiac Disease: Critical Insights to Better Understand Clinical Outcomes. Nutrients 2023, 15, 4013. [Google Scholar] [CrossRef] [PubMed]
- Torsten, M.; Aaron, L. Microbial Transglutaminase Is Immunogenic and Potentially Pathogenic in Pediatric Celiac Disease. Front. Pediatr. 2018, 6, 389. [Google Scholar] [CrossRef]
- Tristan Asensi, M.; Napoletano, A.; Sofi, F.; Dinu, M. Low-Grade Inflammation and Ultra-Processed Foods Consumption: A Review. Nutrients 2023, 15, 1546. [Google Scholar] [CrossRef]
- Andersson, D.I.; Hughes, D. Antibiotic Resistance and Its Cost: Is It Possible to Reverse Resistance? Nat Rev Microbiol 2010, 8, 260–271. [Google Scholar] [CrossRef]
- Costea, P.I.; Zeller, G.; Sunagawa, S.; Pelletier, E.; Alberti, A.; Levenez, F.; Tramontano, M.; Driessen, M.; Hercog, R.; Jung, F.-E.; et al. Towards Standards for Human Fecal Sample Processing in Metagenomic Studies. Nat Biotechnol 2017, 35, 1069–1076. [Google Scholar] [CrossRef]
- Elie, C.; Perret, M.; Hage, H.; Sentausa, E.; Hesketh, A.; Louis, K.; Fritah-Lafont, A.; Leissner, P.; Vachon, C.; Rostaing, H.; et al. Comparison of DNA Extraction Methods for 16S rRNA Gene Sequencing in the Analysis of the Human Gut Microbiome. Sci Rep 2023, 13, 10279. [Google Scholar] [CrossRef] [PubMed]
- Lim, M.Y.; Park, Y.-S.; Kim, J.-H.; Nam, Y.-D. Evaluation of Fecal DNA Extraction Protocols for Human Gut Microbiome Studies. BMC Microbiol 2020, 20, 212. [Google Scholar] [CrossRef] [PubMed]
- Yang, F.; Sun, J.; Luo, H.; Ren, H.; Zhou, H.; Lin, Y.; Han, M.; Chen, B.; Liao, H.; Brix, S.; et al. Assessment of Fecal DNA Extraction Protocols for Metagenomic Studies. GigaScience 2020, 9, giaa071. [Google Scholar] [CrossRef]
- Palmieri, O.; Castellana, S.; Bevilacqua, A.; Latiano, A.; Latiano, T.; Panza, A.; Fontana, R.; Ippolito, A.M.; Biscaglia, G.; Gentile, A.; et al. Adherence to Gluten-Free Diet Restores Alpha Diversity in Celiac People but the Microbiome Composition Is Different to Healthy People. Nutrients 2022, 14, 2452. [Google Scholar] [CrossRef]
- Lawal, S.A.; Voisin, A.; Olof, H.; Bording-Jorgensen, M.; Armstrong, H. Diversity of the Microbiota Communities Found in the Various Regions of the Intestinal Tract in Healthy Individuals and Inflammatory Bowel Diseases. Front. Immunol. 2023, 14, 1242242. [Google Scholar] [CrossRef]
- Ross, B.D. Bacteroides Fragilis Uses Toxins for Gut Success. Nat Microbiol 2024, 9, 11–12. [Google Scholar] [CrossRef]
- Dillingh, M.R.; Van Poelgeest, E.P.; Malone, K.E.; Kemper, E.M.; Stroes, E.S.G.; Moerland, M.; Burggraaf, J. Characterization of Inflammation and Immune Cell Modulation Induced by Low-Dose LPS Administration to Healthy Volunteers. J Inflamm 2014, 11, 28. [Google Scholar] [CrossRef]
- Monguió-Tortajada, M.; Franquesa, M.; Sarrias, M.-R.; Borràs, F.E. Low Doses of LPS Exacerbate the Inflammatory Response and Trigger Death on TLR3-Primed Human Monocytes. Cell Death Dis 2018, 9, 499. [Google Scholar] [CrossRef]
- Maciel-Fiuza, M.F.; Muller, G.C.; Campos, D.M.S.; Do Socorro Silva Costa, P.; Peruzzo, J.; Bonamigo, R.R.; Veit, T.; Vianna, F.S.L. Role of Gut Microbiota in Infectious and Inflammatory Diseases. Front. Microbiol. 2023, 14, 1098386. [Google Scholar] [CrossRef] [PubMed]
- Spatola, B.N.; Kaukinen, K.; Collin, P.; Mäki, M.; Kagnoff, M.F.; Daugherty, P.S. Persistence of Elevated Deamidated Gliadin Peptide Antibodies on a Gluten-free Diet Indicates Nonresponsive Coeliac Disease. Aliment Pharmacol Ther 2014, 39, 407–417. [Google Scholar] [CrossRef]
- Akobeng, A.K.; Singh, P.; Kumar, M.; Al Khodor, S. Role of the Gut Microbiota in the Pathogenesis of Coeliac Disease and Potential Therapeutic Implications. Eur J Nutr 2020, 59, 3369–3390. [Google Scholar] [CrossRef] [PubMed]
- Li, D.; Wang, J.; Jiang, Y.; Zhang, P.; Liu, Y.; Li, Y.; Zhang, Z. Quantifying Functional Redundancy in Polysaccharide-Degrading Prokaryotic Communities. Microbiome 2024, 12, 120. [Google Scholar] [CrossRef] [PubMed]
- Matsuo, Y.; Komiya, S.; Yasumizu, Y.; Yasuoka, Y.; Mizushima, K.; Takagi, T.; Kryukov, K.; Fukuda, A.; Morimoto, Y.; Naito, Y.; et al. Full-Length 16S rRNA Gene Amplicon Analysis of Human Gut Microbiota Using MinIONTM Nanopore Sequencing Confers Species-Level Resolution. BMC Microbiol 2021, 21, 35. [Google Scholar] [CrossRef]
- Zhou, H.; He, K.; Chen, J.; Zhang, X. LinDA: Linear Models for Differential Abundance Analysis of Microbiome Compositional Data. Genome Biol 2022, 23, 95. [Google Scholar] [CrossRef]
Figure 2.
Principal Component Analysis (PCA) of the samples under aerobic conditions using different antibiotics. A) 2D loading plot showing the influence of each antibiotic on the first two principal components, where each variable represents the antibiotics used under aerobic conditions: Amikacin (AK), Amoxicillin (AML), Ceftazidime (CAZ), Cefpirome (CR), Gentamicin (CN), and Sulfamethoxazole/Trimethoprim (TS). B) PCA plot representing the distribution and variation trends of the Control group (Red) and the Celiac group (Yellow) samples under aerobic conditions, in the 2D plane defined by the first two principal components, which explain the majority of the model (53.92% variance), in the context of the bacterial community.
Figure 3.
Principal Component Analysis (PCA) of the samples under anaerobic conditions using different antibiotics. A) 2D loadings plot showing the influence of each antibiotic on the first two principal components, where each variable represents the antibiotics used under anaerobic conditions: Ciprofloxacin (CIP), Levofloxacin (LEV), Clindamycin (CD), Rifampicin (RD), Azithromycin (AZM), Metronidazole (MTZ), Imipenem (IMI), Imipenem+EDTA (IMI_EDTA), and Augmentin (AML_CLV). B) PCA plot representing the distribution and variation trends of the Control (Red) and Celiac (Celiac) group samples in the space defined by the first two principal components, which explain the majority of the model (49,83% of the variance), within the context of the bacterial community.
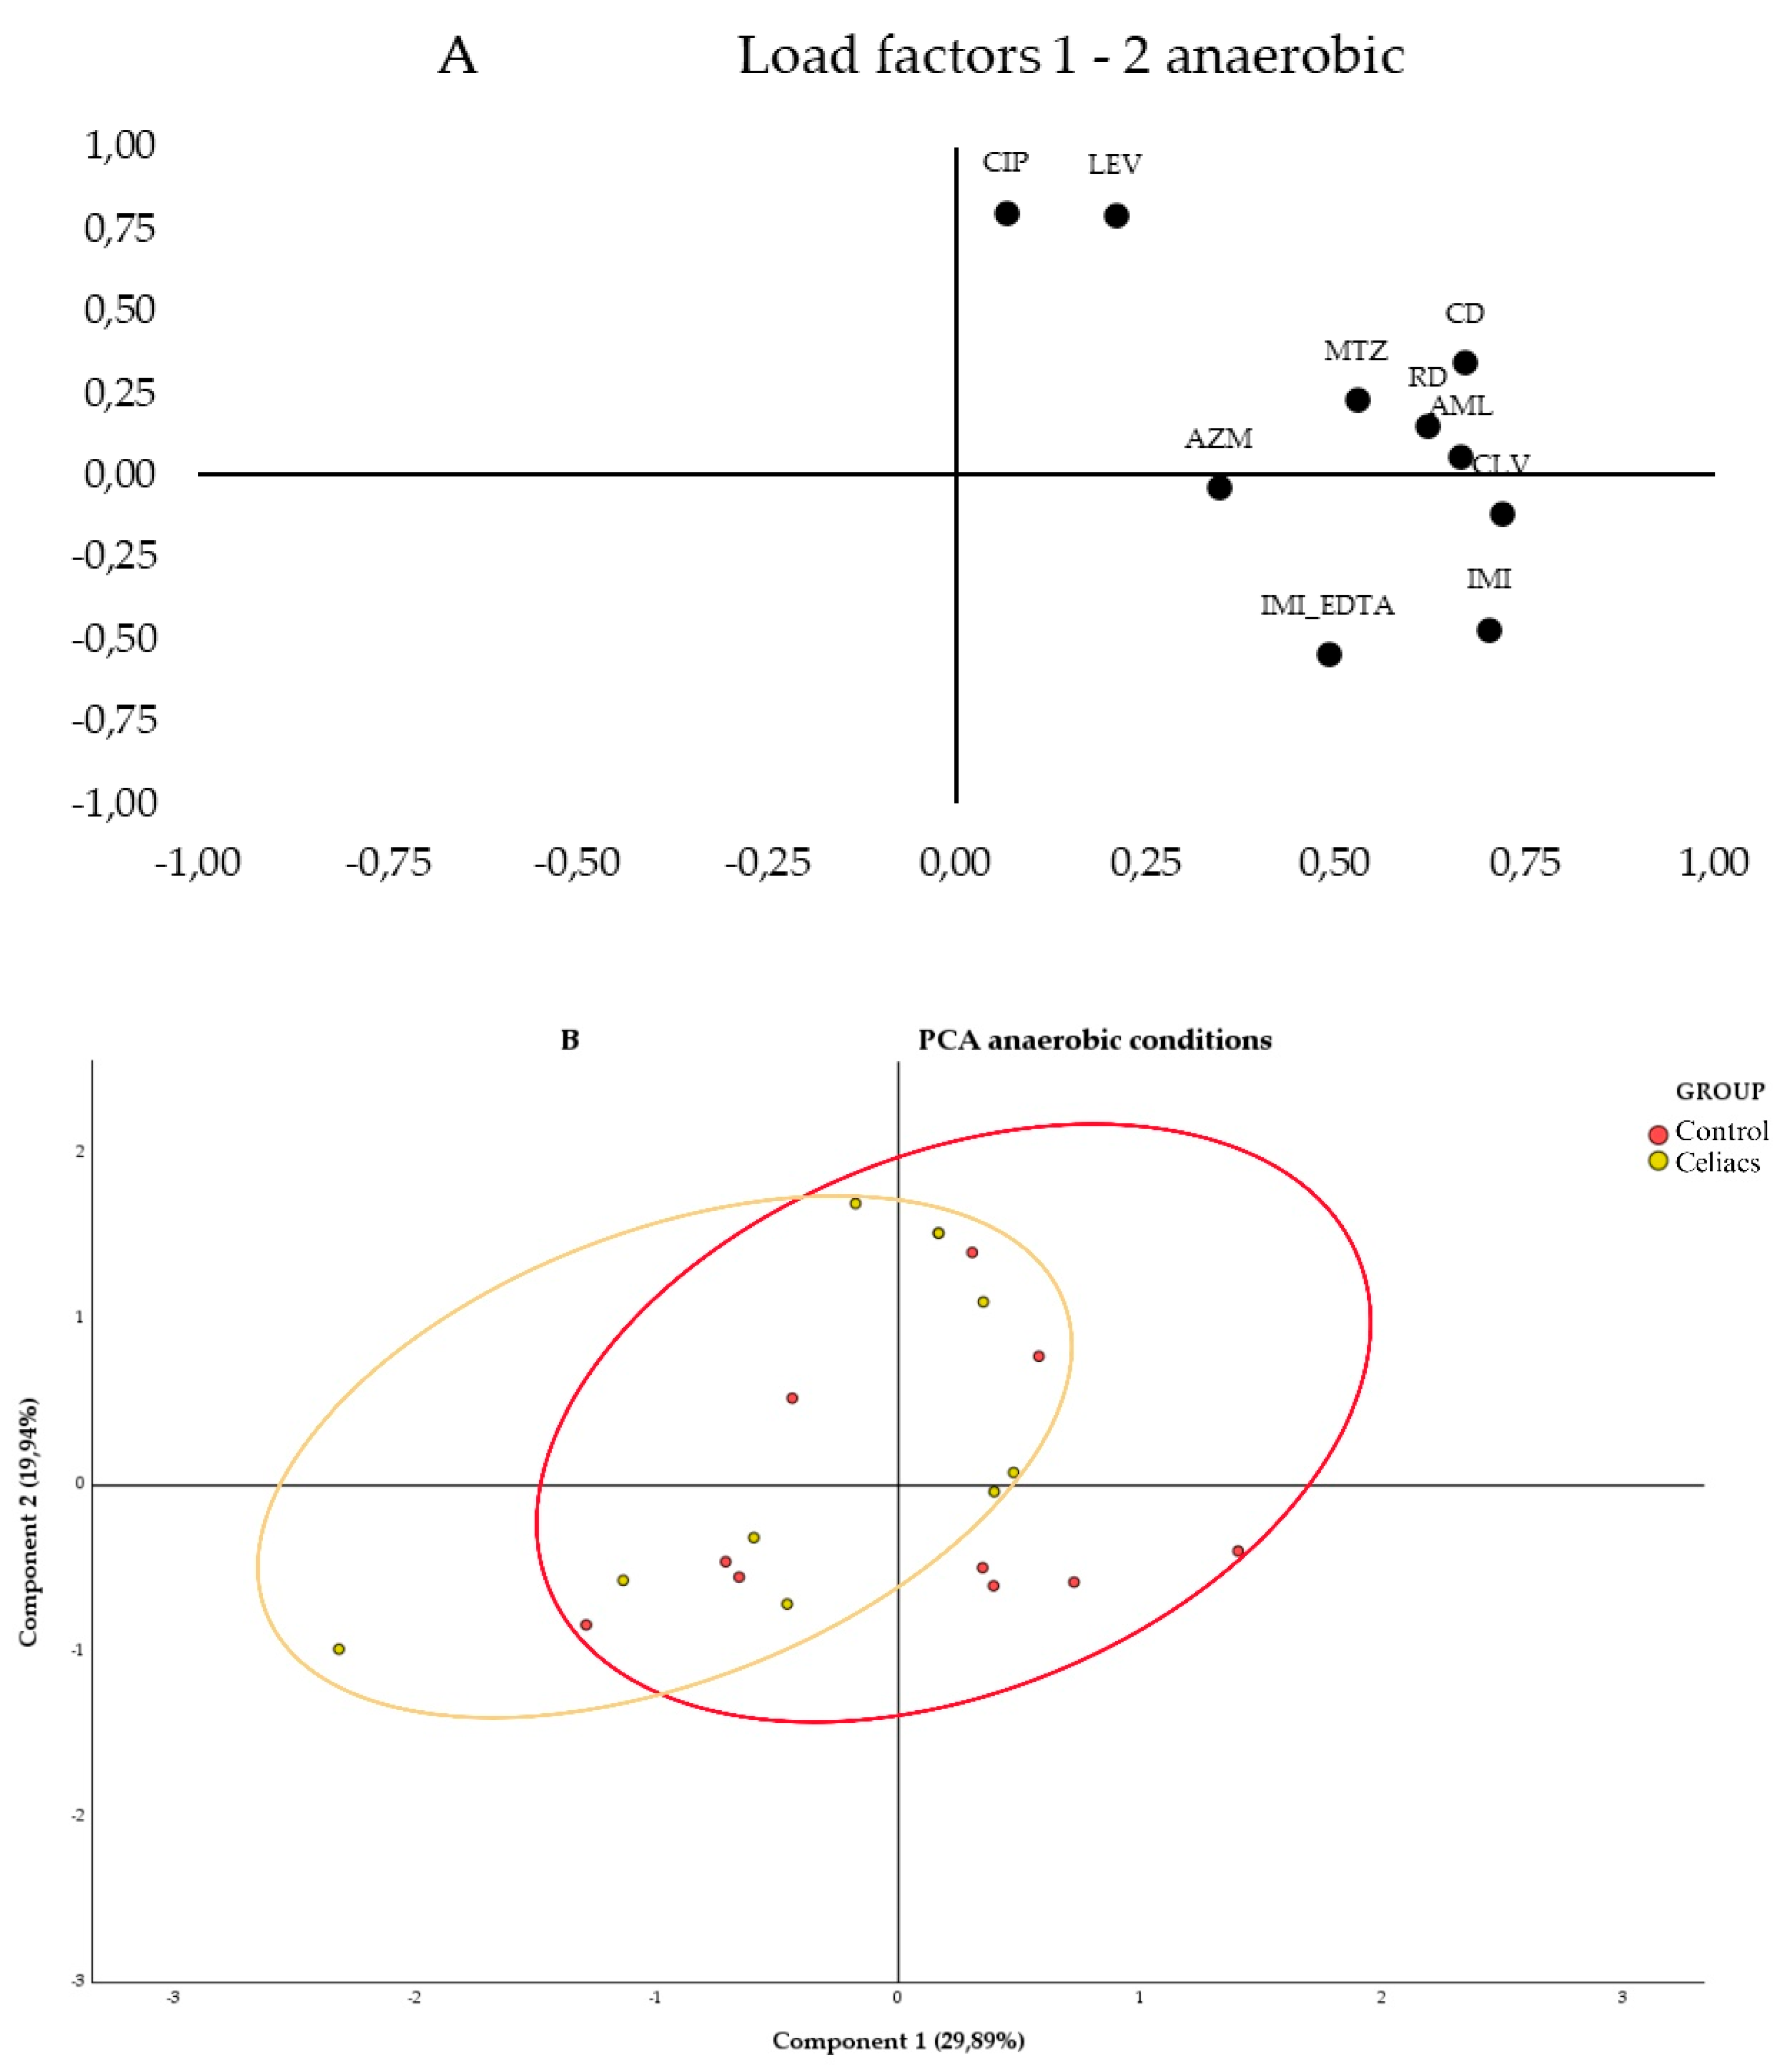
Figure 4.
Bacterial diversity. a) Venn diagram at the genus level. The light blue center shows the bacterial genera shared between both study groups. b) Bacterial alpha diversity at the genus level, performed with the Simpson, ACE, Chao1, and Shannon tests. c) Bacterial beta diversity at the genus level. On the left, the Bray-Curtis dissimilarity index and on the right, the Jaccard index.
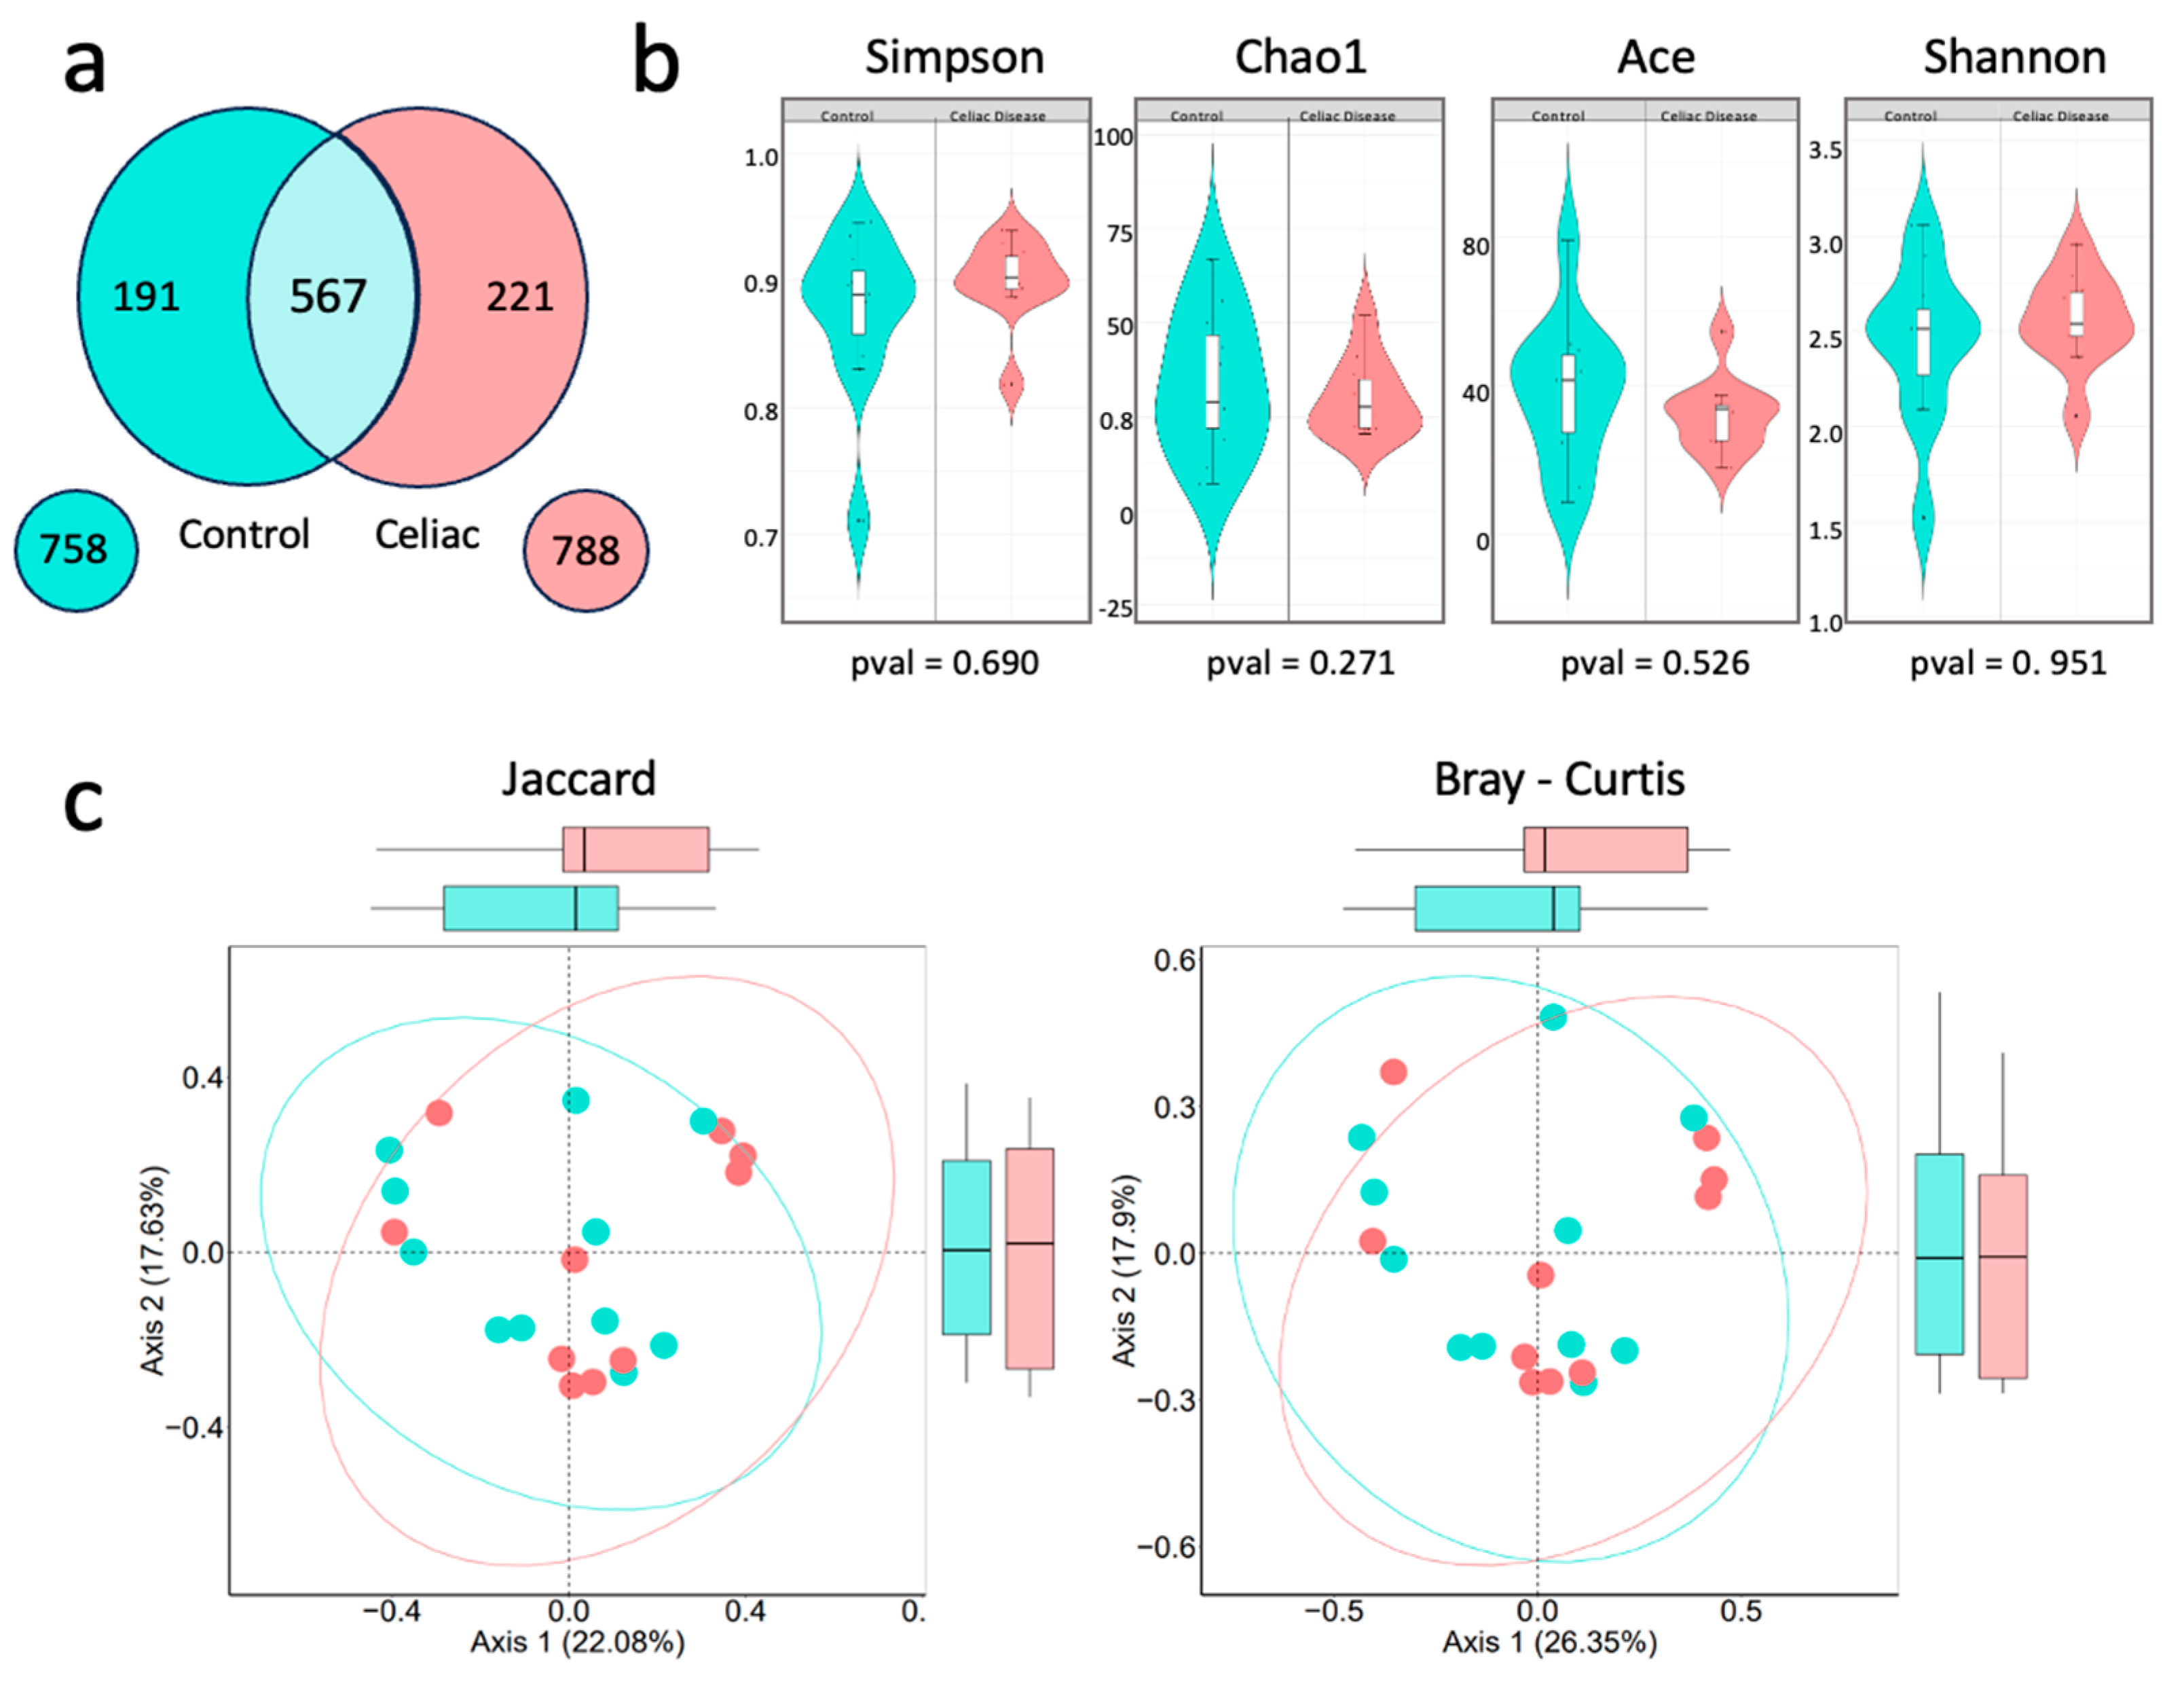
Figure 5.
Relative abundance percentage of the 5 most representative phyla of the human gut microbiota in the control group versus the women with celiac disease study group. Image created with Biorender.
Figure 5.
Relative abundance percentage of the 5 most representative phyla of the human gut microbiota in the control group versus the women with celiac disease study group. Image created with Biorender.
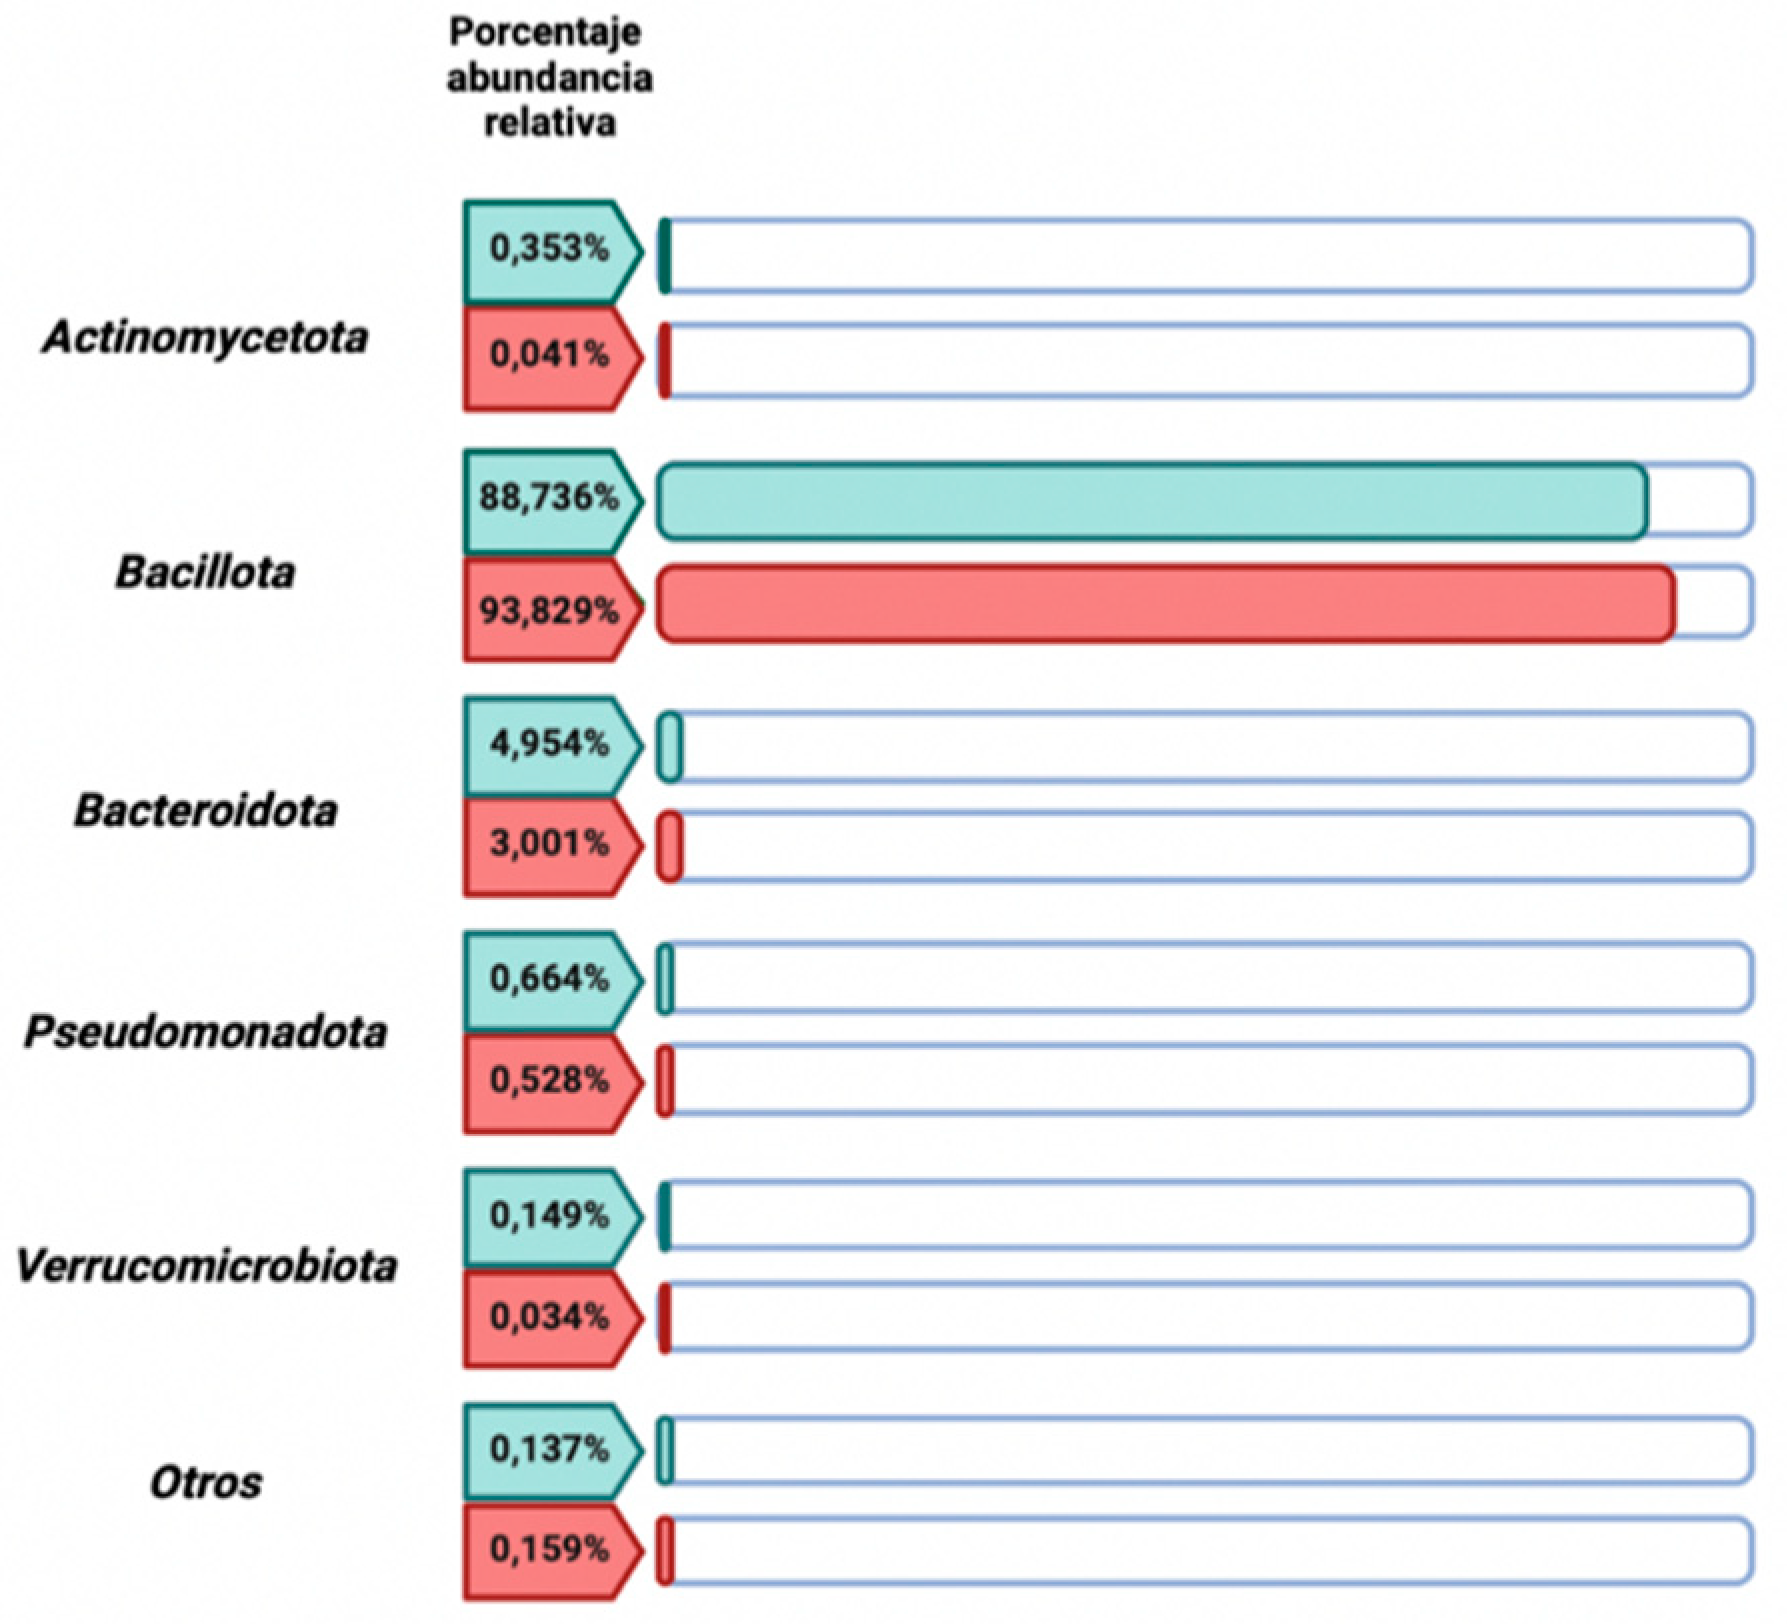
Figure 6.
Comparative analysis of the microbiota composition at different taxonomic levels. a) Comparative bar chart showing the top 10 families and orders with the highest relative abundance, considering those with a relative abundance greater than 0,03 in at least 7 samples. b) Stacked bar chart representing the relative abundance of the top 10 genera within each sample from the Celiac and Control groups. c) Bar chart showing the top 10 genera with the highest relative abundance, considering those with a relative abundance greater than 0,/5903 in at least 7 samples. d) Volcano plot displaying the differential analysis of the relative abundance of bacterial genera using the LinDA method for the Control group (in blue) and the Celiac group (in red), with a cutoff p-value of 0,06. The X-axis represents the log2 Fold Change, indicating the magnitude of change in relative abundance. Positive values on this axis indicate greater abundance in the Celiac group, while negative values indicate greater abundance in the Control group. The Y-axis represents -log10(p-value), where higher values indicate greater statistical significance. e) Boxplot representing cultivable genera: Lactobacillus, Enterococcus, Escherichia, Staphylococcus, and Streptococcus.
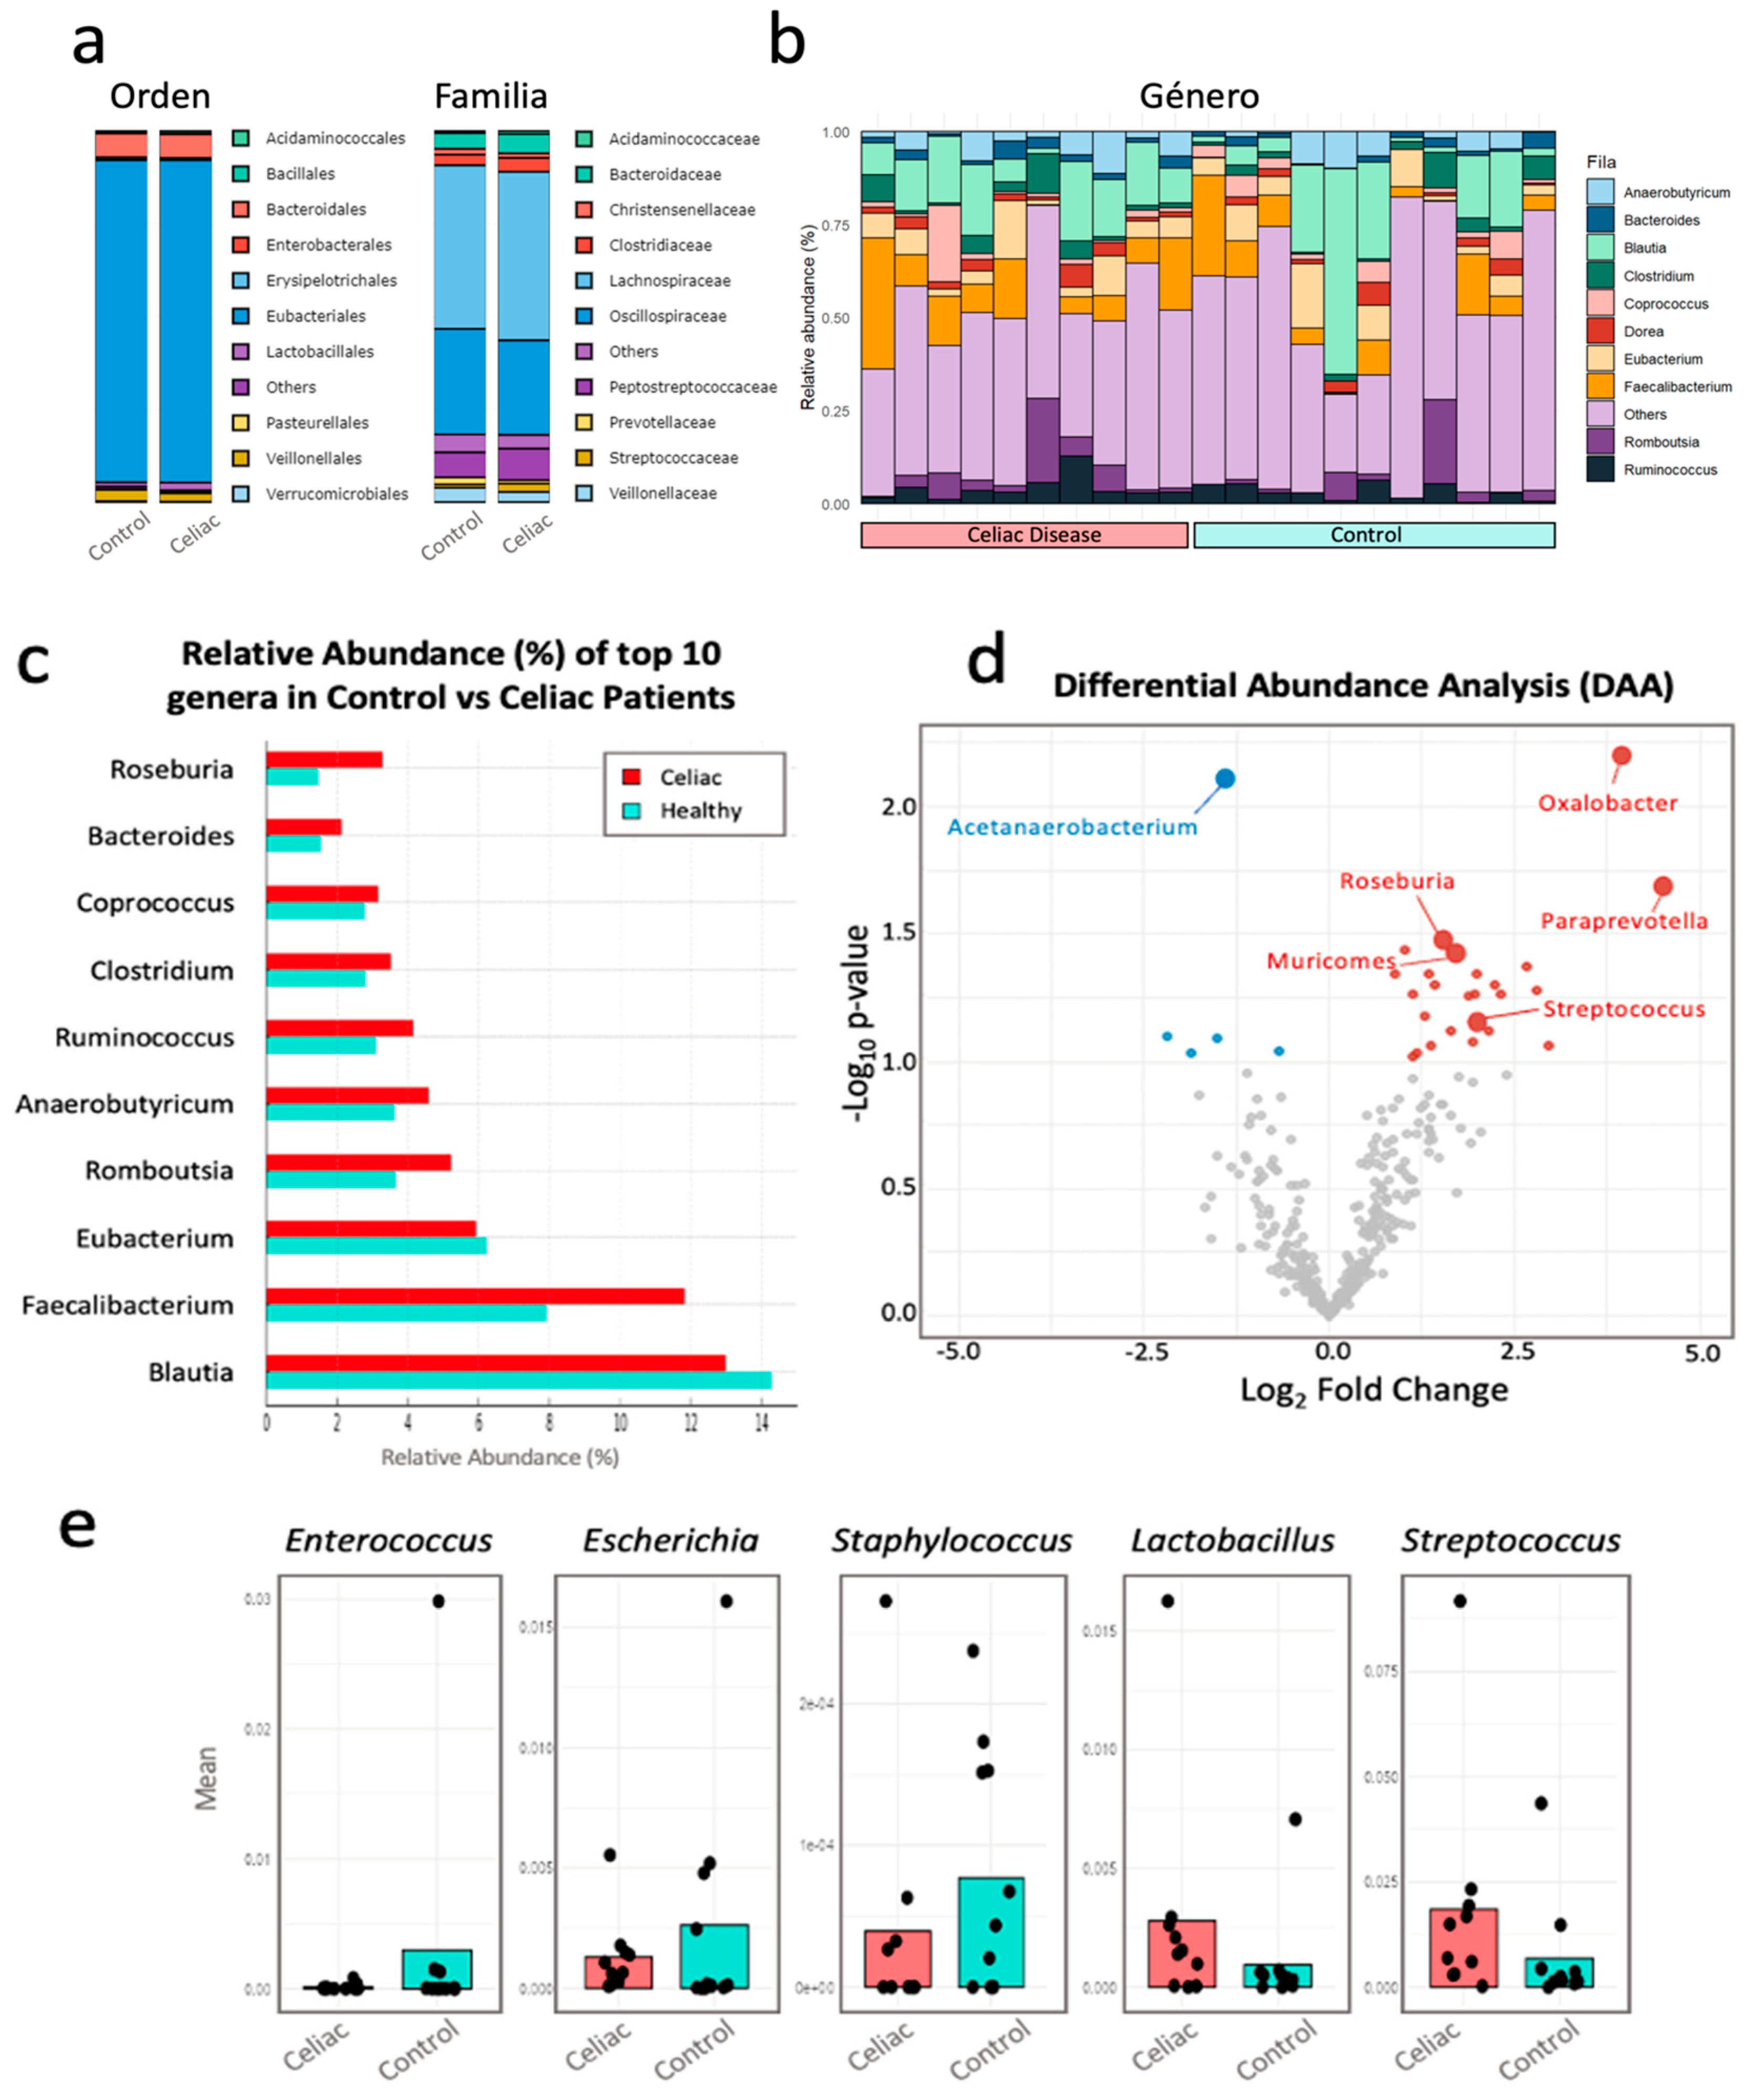

Table 1.
Biodiversity Index Values Calculated from the Logarithmic Difference of the Relative Abundance of Each Bacterial Taxon.
Table 1.
Biodiversity Index Values Calculated from the Logarithmic Difference of the Relative Abundance of Each Bacterial Taxon.
| Group of study | ||
| Index | Control | Celiacs |
| log Bacillota - log Bacteroidetes | 1,253 | 1,494 |
| log Bacteroides - log Prevotella | -0,094 | 0,617 |
Disclaimer/Publisher’s Note: The statements, opinions and data contained in all publications are solely those of the individual author(s) and contributor(s) and not of MDPI and/or the editor(s). MDPI and/or the editor(s) disclaim responsibility for any injury to people or property resulting from any ideas, methods, instructions or products referred to in the content. |
© 2025 by the authors. Licensee MDPI, Basel, Switzerland. This article is an open access article distributed under the terms and conditions of the Creative Commons Attribution (CC BY) license (http://creativecommons.org/licenses/by/4.0/).
Copyright: This open access article is published under a Creative Commons CC BY 4.0 license, which permit the free download, distribution, and reuse, provided that the author and preprint are cited in any reuse.


