Preprint
Article

This version is not peer-reviewed.

Comparative Analysis of Gut Microbiota in Adolescents with Mediterranean and Western Diets

A peer-reviewed article of this preprint also exists.

Submitted:

23 December 2024

Posted:

26 December 2024

You are already at the latest version

Abstract

Dietary patterns, such as the Mediterranean diet (MD) and the Western diet (WD), influence gut microbiota composition and functionality, which play important roles in energy metabolism and nutrient absorption. The gut microbiota of 19 Spanish adolescents following these diets was studied to investigate their association with microbial diversity and community structure. Functional diversity was evaluated using Biolog EcoPlates, taxonomic composition was assessed with 16S rRNA sequencing via MinION, and phenotypic responses to antibiotics were analyzed using the technic of cenoantibiogram under aerobic and anaerobic conditions. Adolescents with high adherence to the MD exhibited greater functional diversity. Under aerobic conditions, no significant differences in MIC values were observed, but under anaerobic conditions, individuals with low adherence to the MD showed lower MICs for most antibiotics tested. The MD group also showed higher abundance of beneficial bacterial genera such as Paraclostridium, Anaerobutyricum, Romboutsia, and Butyricicoccus. In contrast, the WD group had a microbiota composition similar to that of the low-MD group, characterized by decreased abundance of beneficial genera and an altered microbial profile. These results suggest that the MD promotes a healthier and more balanced gut environment, potentially improving metabolic functions in adolescents. The outcomes of this study highlight opportunities for future research to deepen understanding of the long-term health implications of these dietary patterns, as well as the mechanisms regulating the composition and functionality of gut microbial communities.

Keywords: 
;  ;  ;  ;  ;  ;  ;  

1. Introduction

The introduction should briefly place the study in a broad context and highlight why it is important. It should define the purpose of the work and its significance. The current state of the research field should be carefully reviewed and key publications cited. Please highlight controversial and diverging hypotheses when necessary. Finally, briefly mention the main aim of the work and highlight the principal conclusions. As far as possible, please keep the introduction comprehensible to scientists outside your particular field of research. References should be numbered in order of appearance and indicated by a numeral or numerals in square brackets—e.g., [1] or [2,3], or [4,5,6]. See the end of the document for further details on references.
The central role of the gut microbiota as an integrative axis of human health and homeostasis is widely recognized today. The human microbiota is a highly diverse ecosystem, composed primarily of bacteria (90%), but also viruses, fungi, archaea, and protozoa [1]. Through its genetic load and metabolic products, this ecosystem plays a key role in regulating functions such as vitamin synthesis, lipid oxidation, fat storage, and the production of short-chain fatty acids (SCFAs) [2,3]. Thus, the gut microbiota not only performs crucial digestive functions but also plays a systemic and metabolic role, particularly in the modulation of the immune system and the gut-brain axis [4,5].
The gut microbiota is largely determined by maternal transmission, although it undergoes changes throughout life influenced by a variety of factors [6]. Among these factors, diet plays a crucial role in determining the composition and functionality of microbial communities. Dietary patterns can promote a state of eubiosis, characterized by the balance of beneficial bacteria, or conversely, disrupt this balance, leading to a state of dysbiosis. This microbial imbalance is associated with the development of various metabolic, gastrointestinal, and even neurodegenerative diseases [7].
In this context, the Western diet (WD), rich in ultra-processed foods (UPF), has been linked to alterations in the gut microbiota, favoring an inflammatory profile and a higher incidence of various chronic non-communicable diseases [7], [8]. Indeed, in the prospective SUN cohort study conducted in Spain, it was observed that higher UPF consumption was independently associated with a 62% relative increase in the risk of all-cause mortality [9].
Specifically, the term ultra-processed foods (UPF) refer to food products that typically contain five or more ingredients, which primarily represent cheap industrial sources of energy with low nutritional density. Their most common ingredients include refined sugars and fats, along with other food additives such as emulsifiers, sweeteners, or colorants. Furthermore, UPFs are often characterized by low fiber content and a lack of essential nutrients [10]. This contrasts with the Mediterranean Diet (MD) pattern, which emphasizes fresh, minimally processed foods and is characterized by its high content of dietary fiber, polyphenols, and unsaturated fatty acids. This dietary pattern promotes a healthy microbial profile and reduces the risk of metabolic and cardiovascular diseases [11]
On the other hand, alterations in the gut microbiota have also been associated with increased antibiotic resistance, a growing public health issue that could be exacerbated by dietary patterns unfavorable to maintaining a healthy intestinal environment [12]. The World Health Organization (WHO) estimates that, by 2050, deaths related to antibiotic resistance could reach 10 million annually, surpassing deaths caused by cancer [13]. Understanding how Western dietary patterns affect the gut microbiota and its metabolic functions could be key to developing dietary and probiotic interventions to mitigate these negative effects, contributing to the prevention of various diseases in adolescent populations.
This study aims to analyze the impact of the MD compared to the WD on the gut microbiota of adolescents, exploring its relationship with microbial functional diversity, antibiotic response, and the taxonomic composition of microbial communities. This analysis could provide insights into the influence of dietary patterns on gut health and their implications for long-term metabolic health.

2. Results

All comparative analyses were conducted based on the degree of adherence to the Mediterranean Diet (MD) and the level of ultra-processed food (UPF) consumption, with consumption groups established according to the median score for each dietary index.
The analysis was carried out by classifying the groups into HighMD (high adherence to the MD) and LowMD (low adherence to the MD) to evaluate adherence to the Mediterranean Diet. Similarly, the HighUPF (high UPF intake) and LowUPF (low UPF intake) groups were considered to assess the Western diet.

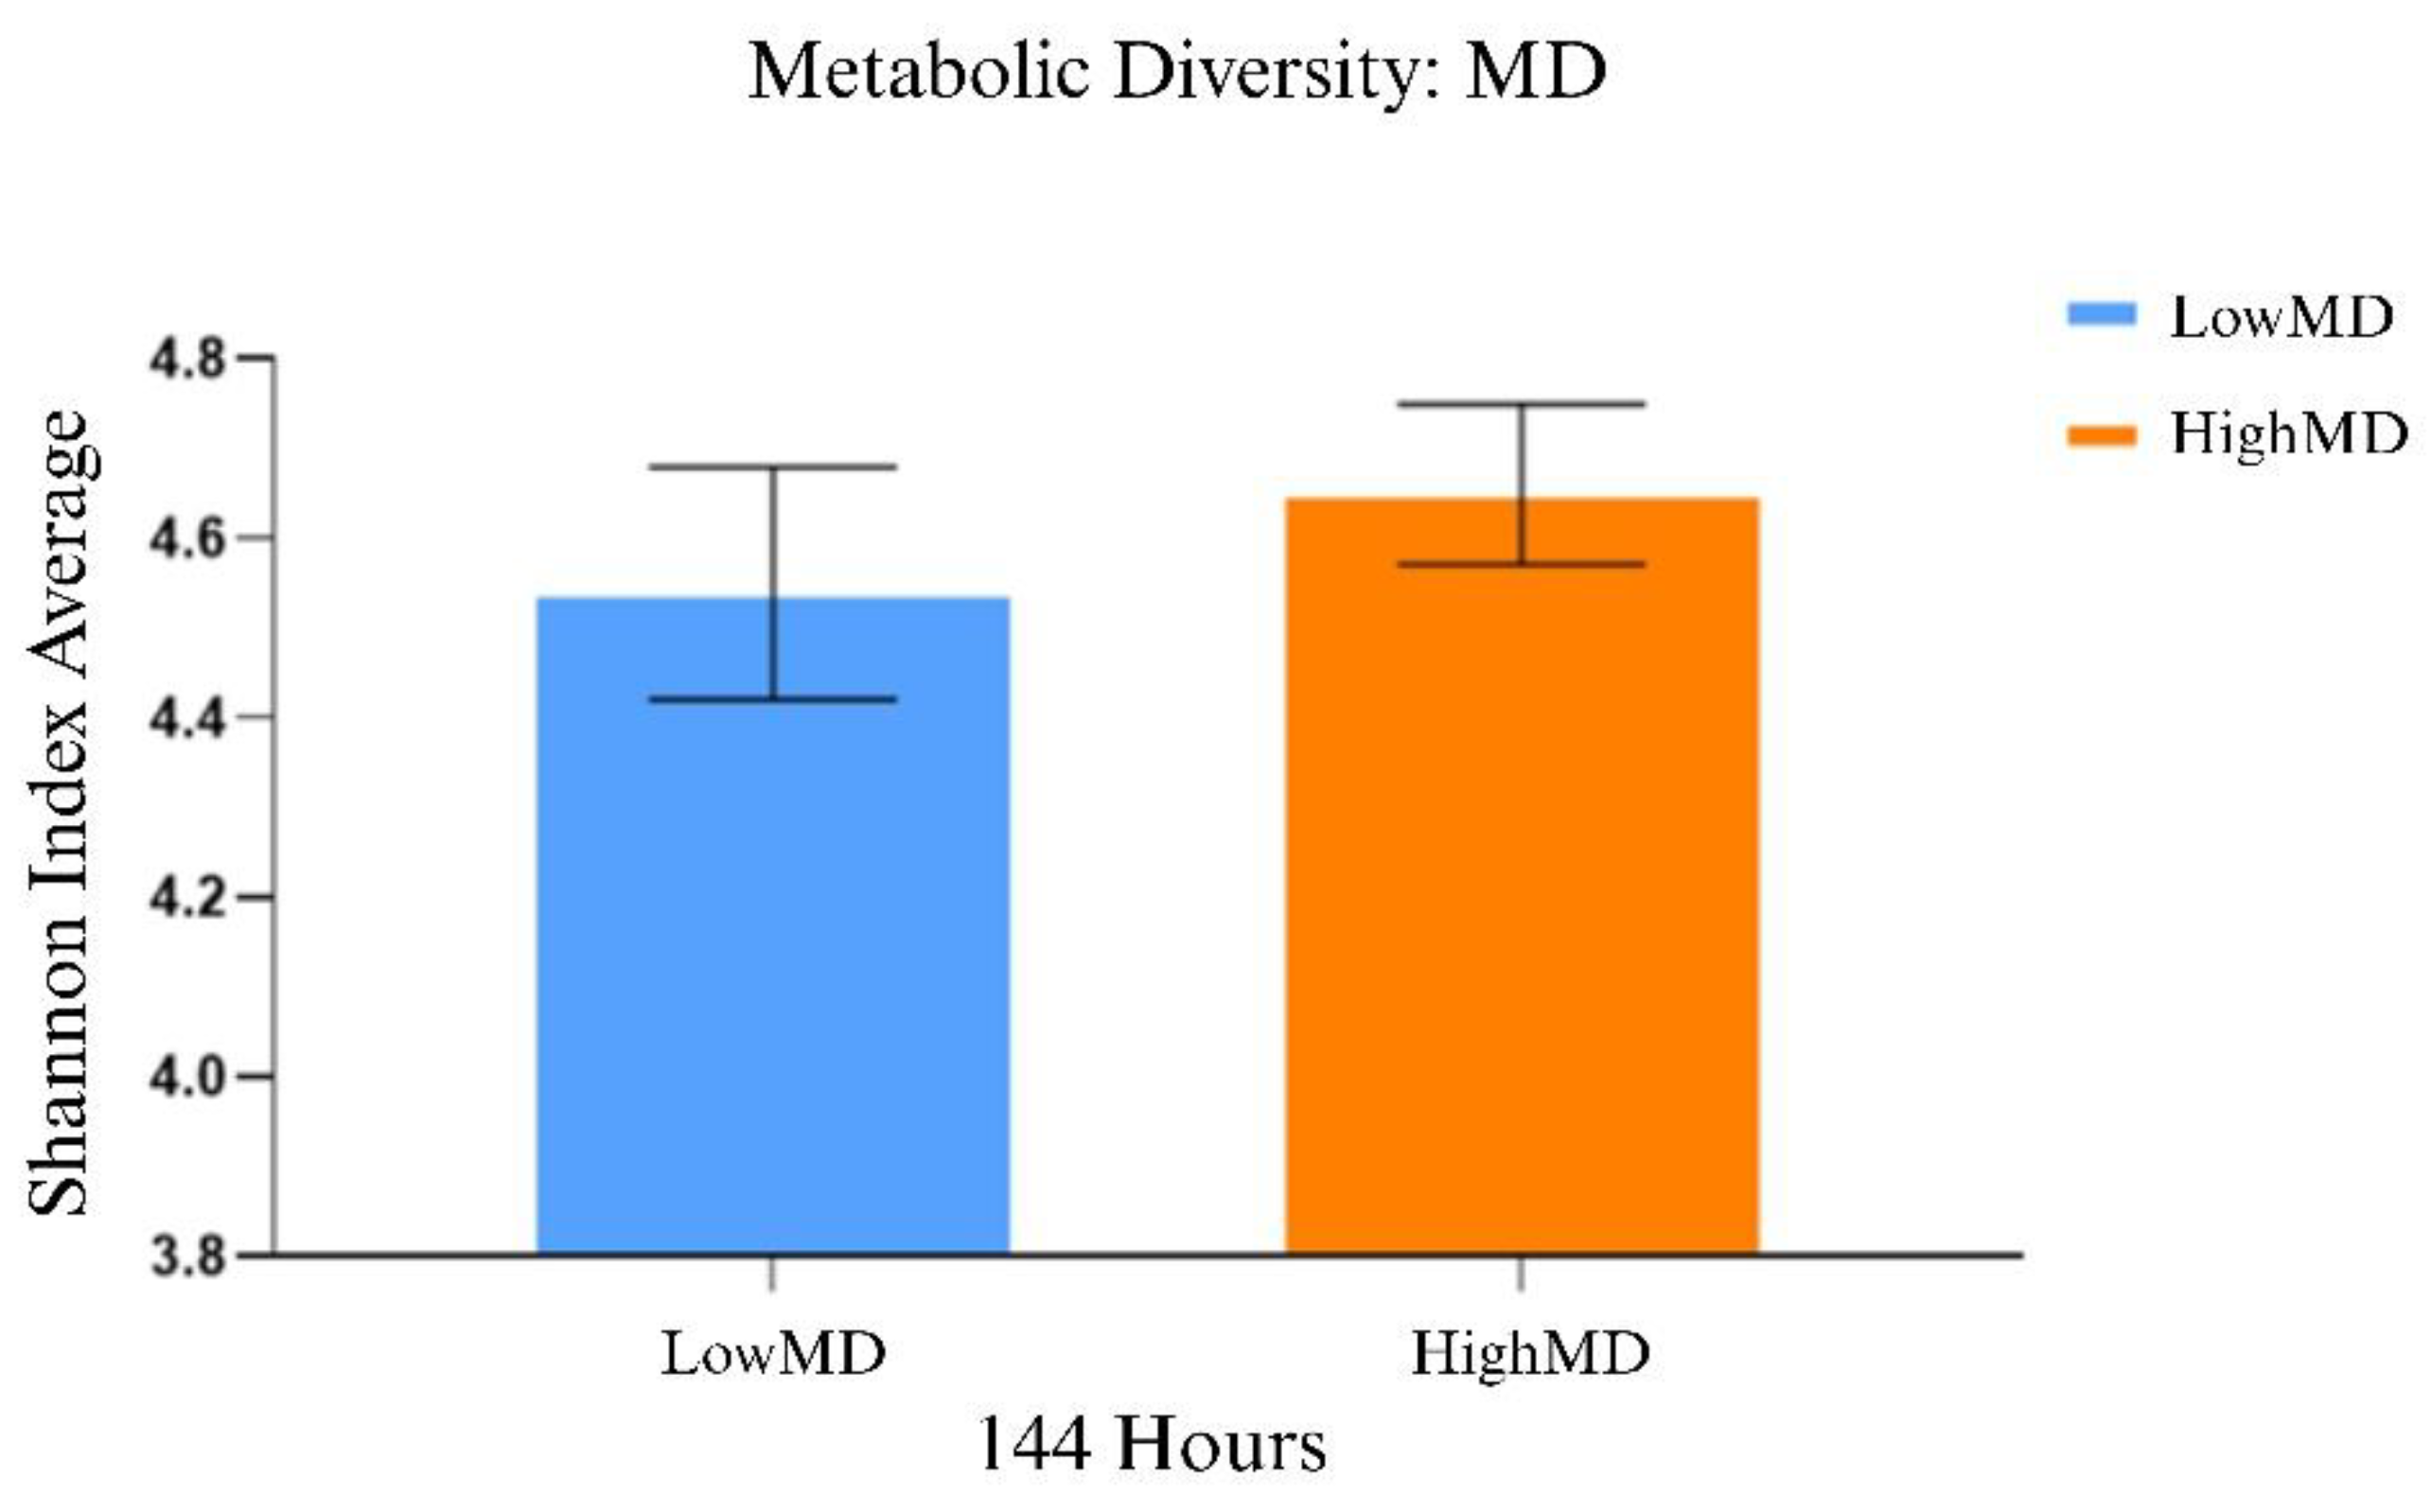
2.1. Comparative Functional Analysis of Gut Microbiota

The results from the Biolog Ecoplate™ assay showed that the peak of metabolic activity was reached at 144 hours, so the comparative functional analysis was conducted considering the metabolic activity at this time point.
After analyzing metabolic diversity using the Shannon-Weaver diversity index, the following means and standard deviations were obtained. The HighMD groups (Figure 1) showed 4.66 ± 0.089, compared to the LowMD groups, which showed 4.55 ± 0.13. No statistically significant differences were identified ( t 17 = -0,739; p= 0,470), although a higher metabolic diversity index was observed in HighMD compared to LowMD at specific points.
On the other hand, the results for HighUPF and LowUPF (Figure S) did not show statistically significant differences ( t 17 = -0,717 17, p= 0,483). No relationship was observed between the results of the HighUPF and LowMD groups.

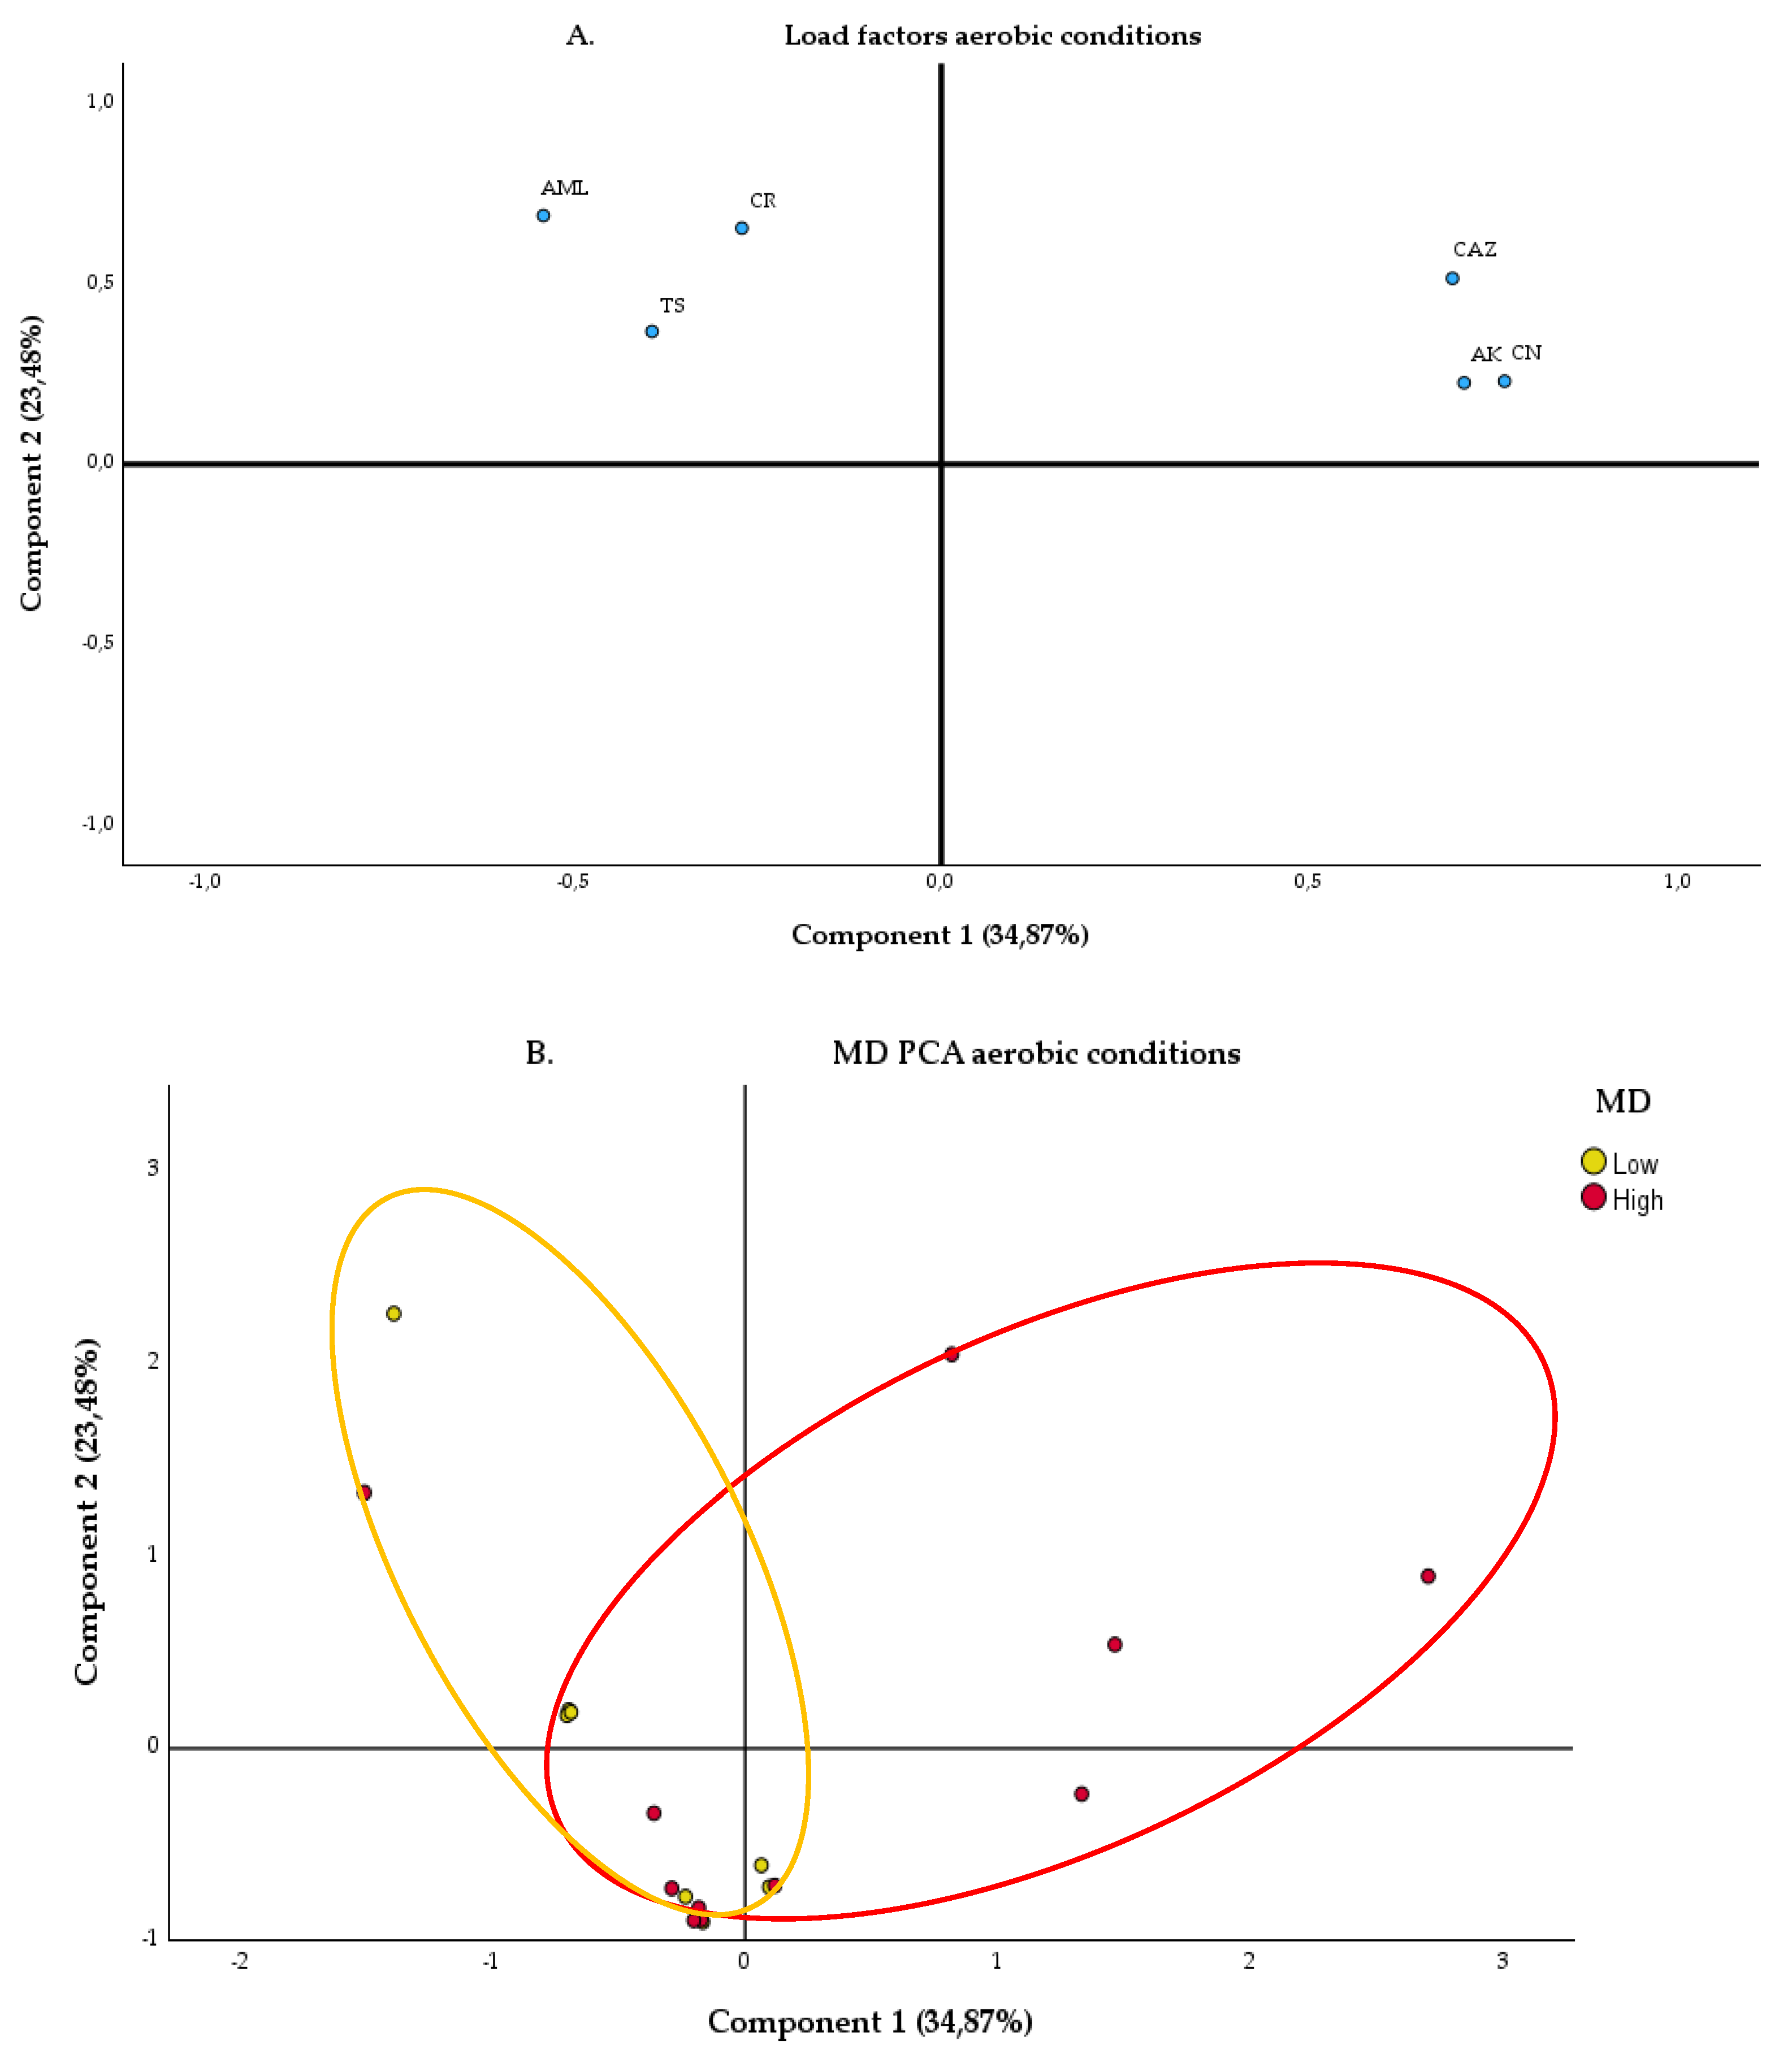
2.2. Comparative Analysis of Antibiotic Response in Gut Microbiota

The data analysis of the antibiotic resistance profile, using the cenoantibiogram (cenoATB), provided the MICs for each sample, presented in (Table S1 and Table S2). The samples were analyzed under both aerobic and anaerobic conditions, exposed to different antibiotics for each condition. Principal Component Analysis (PCA) was performed to observe trends and behaviors of the microbiota at the population level, based on dietary patterns of adherence to the MD (classified as HighMD and LowMD) and WD (classified as HighUPF and LowMD).

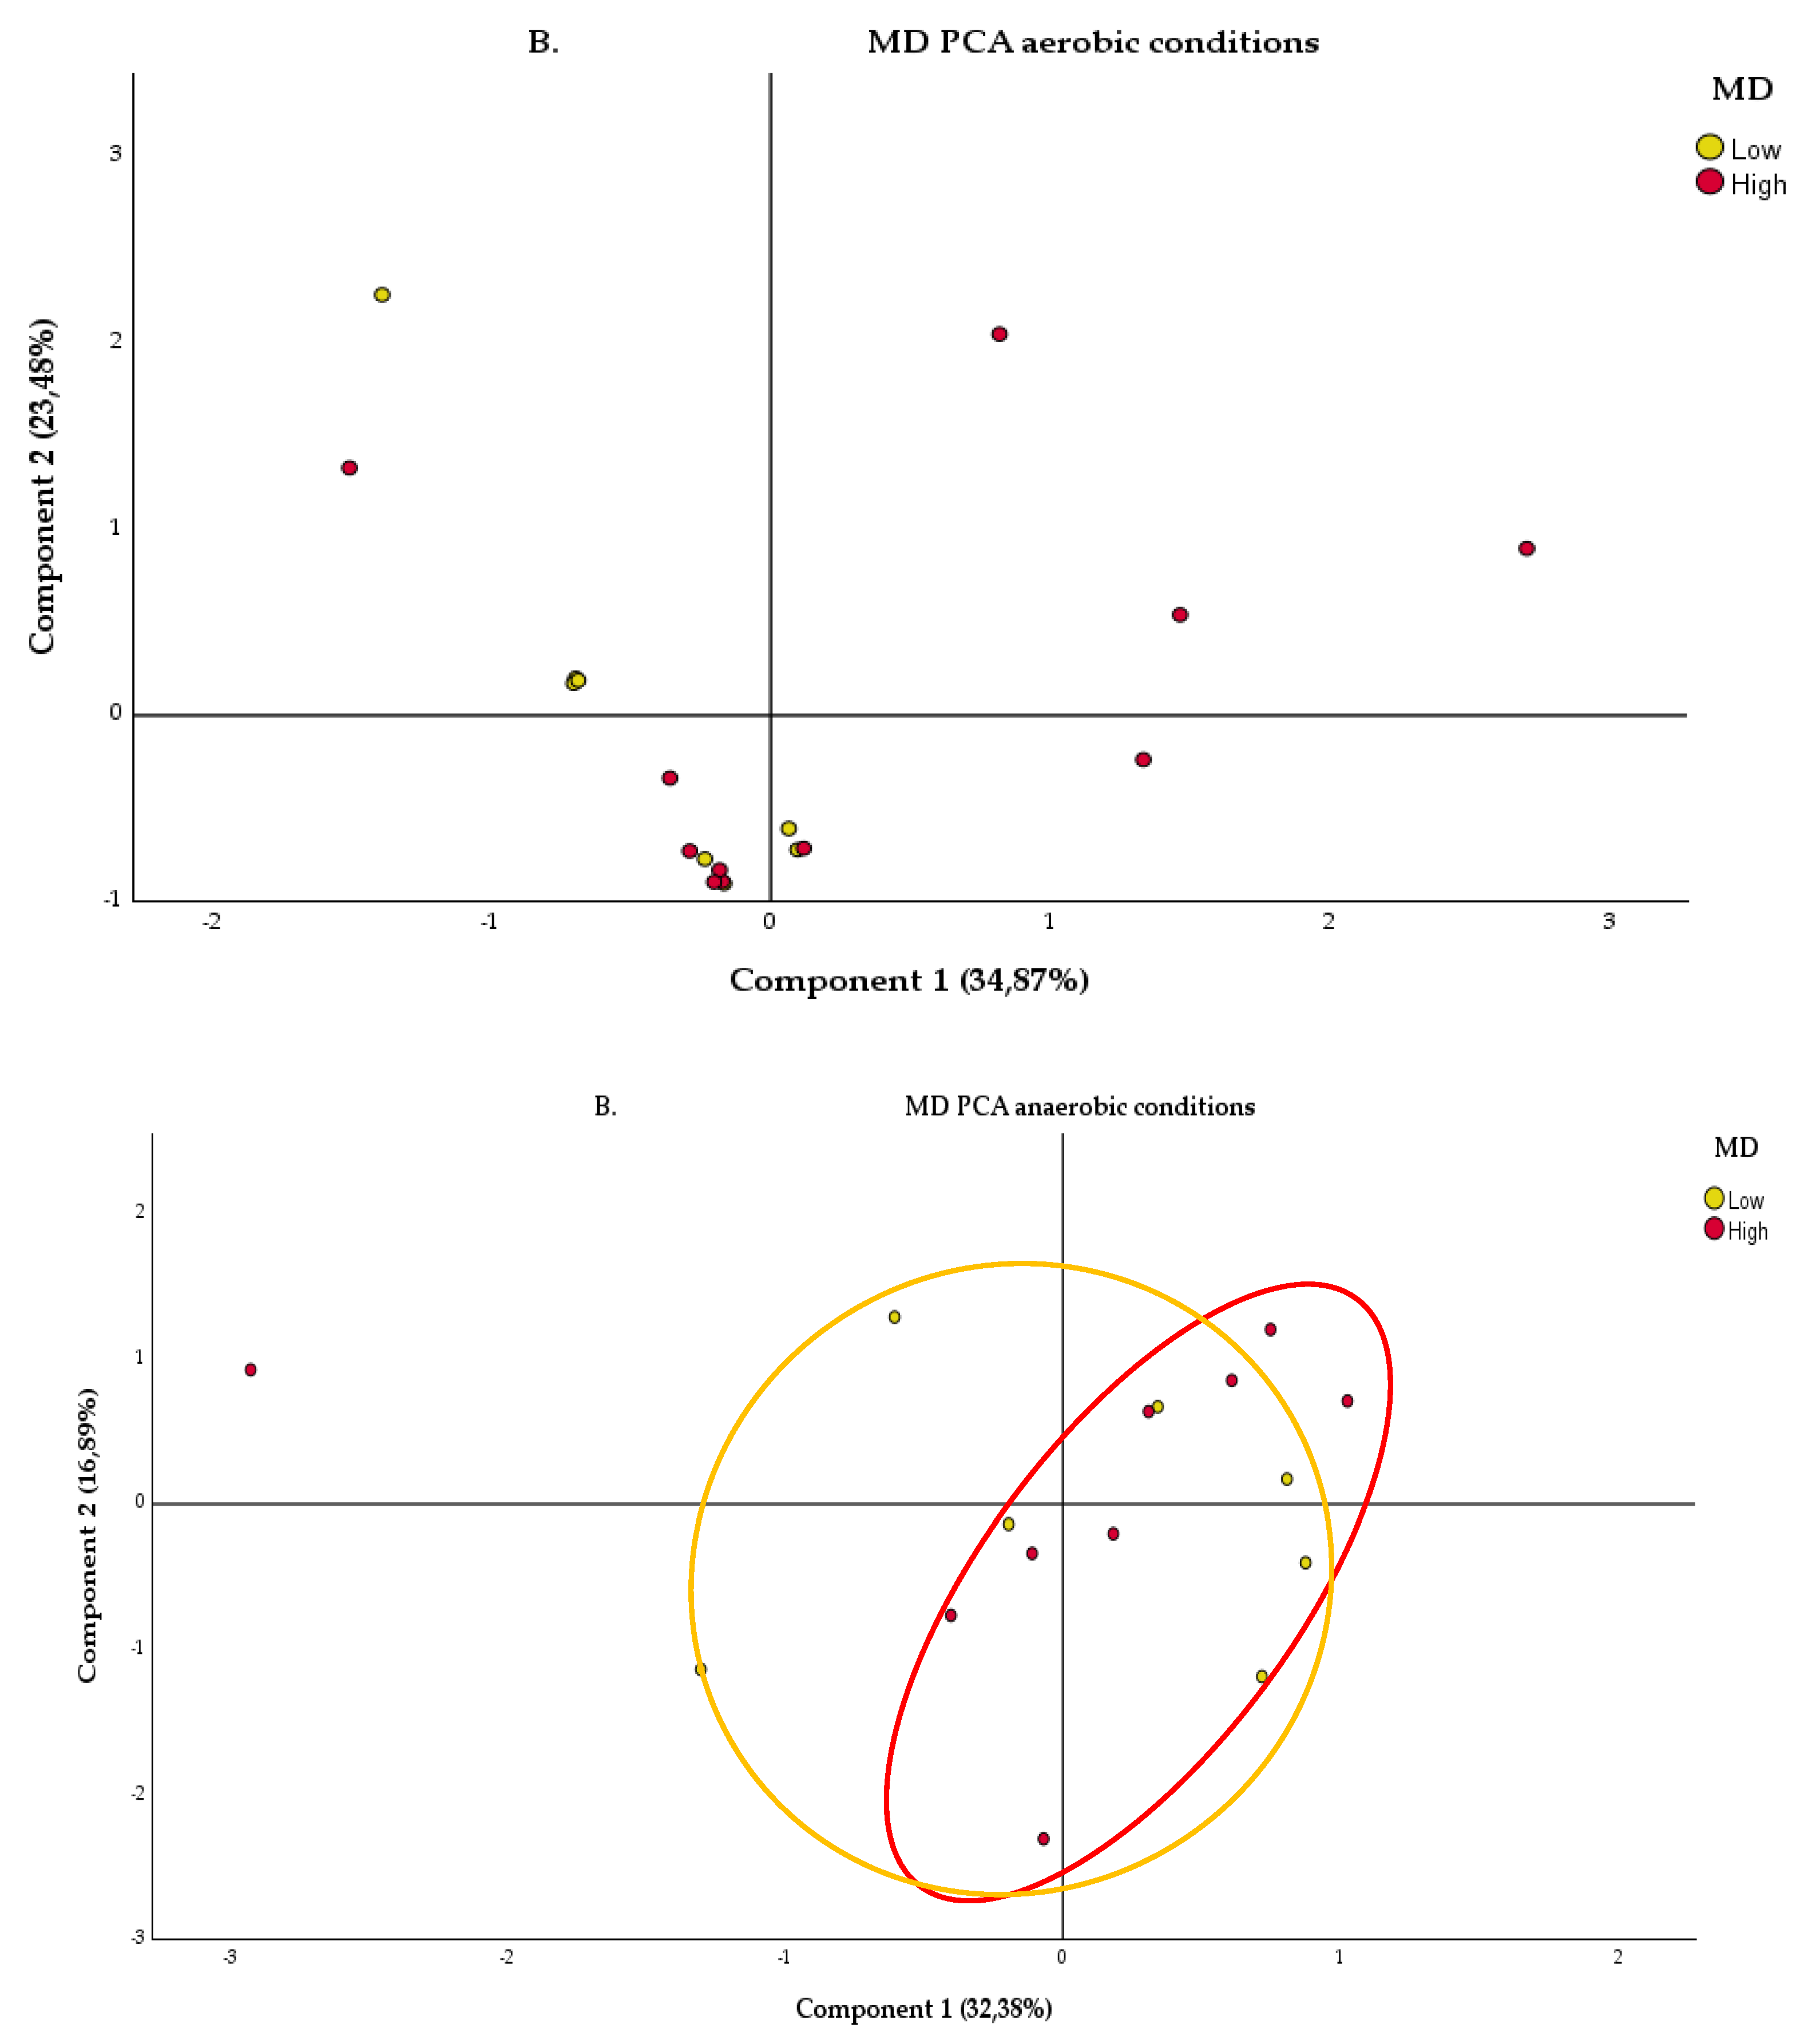
2.2.1. Aerobic Condition

The loading factors (Figure 2A) allow for the interpretation of how antibiotics contribute to the principal components and how these components have a greater or lesser impact on the gut microbiota, depending on the groups being studied. The antibiotics CAZ, AK, and CN show a significant contribution to component 1. At the same time, AML, CR, and TS have a high positive load on component 2, indicating that they also contribute significantly.
The PCA ellipses (Figure 2B) show an area of overlap, although the LowMD and HighMD groups are differentiated. The HighMD group tends to cluster towards the right of component 1 and towards the upper part of component 2, while the LowMD group is more dispersed towards the left of component 1 and the lower part of component 2. The dispersion of points within each group indicates internal variability. HighMD shows a higher concentration of points, while LowMD is more spread out.
The variances explained by component 1 showed low MIC values (Table S1) for the antibiotics CAZ, AK, and CN in the HighMD and LowMD groups. On the other hand, the variances explained by component 2, for the antibiotics AML, CR, and TS, generally showed lower MICs, although some heterogeneity was observed for both HighMD and LowMD. Additionally, samples from both groups were observed to cluster near the axis (0,0), suggesting that their variability does not present extreme characteristics compared to other samples.
When comparing the LowMD and HighUPF groups (Figure S4), representing the Western Diet, very similar trends were observed between the groups. Both LowMD and HighUPF are positioned in the left area, showing trends along component 2.

2.2.2. Anaerobic Condition

For bacteria cultured under anaerobic conditions, the antibiotics IMI, IMI EDTA, and FOX are grouped in the upper left quadrant (Figure 3A), indicating that they have a significant load on component 2. On the other hand, LEV and AMG have a high load on both components, suggesting that these antibiotics are important for explaining the variability observed in the gut microbiota in principal components 1 and 2. Finally, AZM, CIP, CD, MTZ, and RD have a high load on component 1. The distance of these antibiotics from the origin suggests that they have a strong influence on the structure of the microbiota.
The PCA ellipses (Figure 3B) show a certain trend of separation between the LowMD and HighMD groups. However, there is some overlap between them. The HighMD group tends to cluster towards the right of component 1, showing a concentration of points, although they are also spread out in the lower part of the quadrants. On the other hand, the LowMD group is dispersed widely from the coordinate axis (0,0) across the four quadrants, showing a more heterogeneous distribution.
The variances explained by component 1 showed higher MICs (Table S2) in the LowMD group for the antibiotics AZM, CIP, CD, MTZ, and RD, while for LEV and AUG, the values were lower. In the HighMD group, for most of the antibiotics studied (LEV, AUG, AZM, CIP, CD, MTZ, and RD), reduced MICs were observed for most individuals in this group. Additionally, the variances explained by component 2 presented higher MICs for the HighMD group compared to the LowMD group, for the antibiotics IMI and IMI+EDTA.
The Western Diet, represented by the HighUPF (Figure S5) and LowMD groups, showed very similar patterns. Both are represented in the left area, showing trends in component 2.

2.3. Metagenomic Analysis

A metagenomic analysis was performed using 16S rRNA amplicon sequencing of the full region. High-throughput sequencing of DNA extracted from the 19 cecal samples generated a total of 1,864,096 high-quality reads. In the LowMD group, 777,677 reads were obtained with an average of 86,408.5 per sample. In the HighMD group, 875,391 reads were obtained with an average of 87,539.1. Meanwhile, 846,640 reads were obtained in the LowUPF group with an average of 120,946.286. In the HighUPF group, 806,444 reads were generated with an average of 67,203.6.

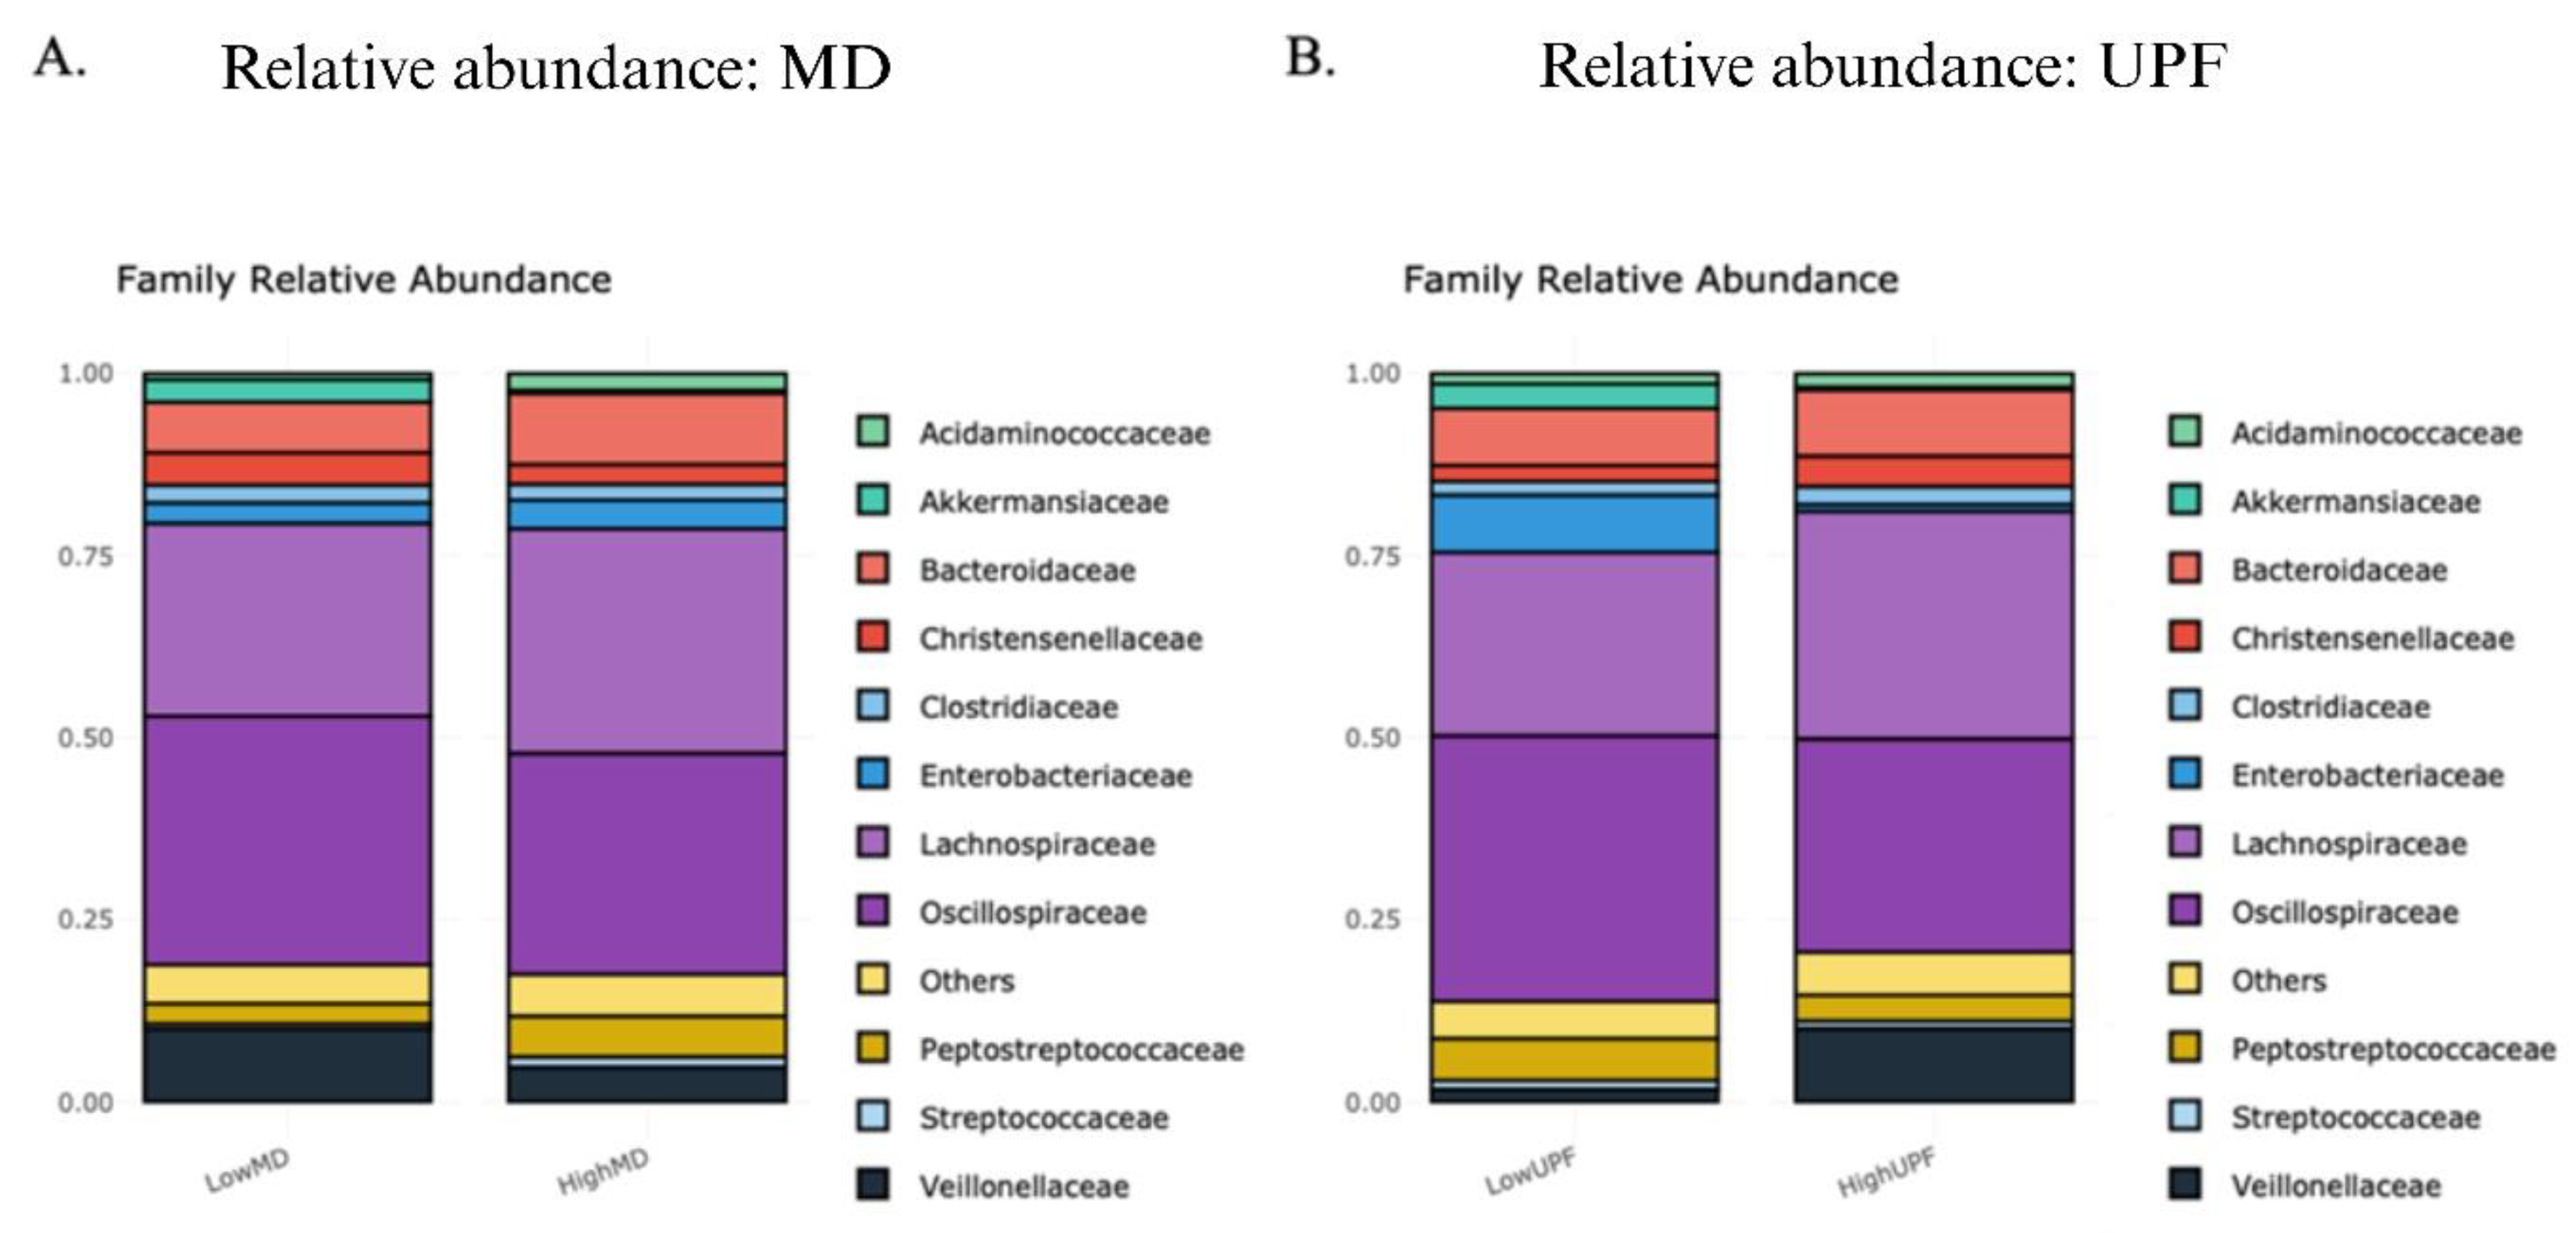
2.3.1. Relative Abundances

The relative abundances of the intestinal microbial composition at the family level were compared (Figure 4).
The relative abundances for the MD group are shown in Table S3 alongside the relative abundances for the UPF group (Table S4). At the family level, the abundances displayed very similar profiles between the HighMD group (Figure 4A) and the LowUPF group (Figure 4B), representative of the Western diet, as well as between LowMD and HighMD. No statistically significant differences were observed in the MD group (U = 74, p = 0.931) or in the UPF group (U = 73, p = 0.977). However, large percentage changes between groups were noted.
In the MD group (Figure 4A), the families Oscillospiraceae (LowMD = 34.12% and HighMD = 30.32%), Veillonellaceae (LowMD = 9.98% and HighMD = 4.69%), and Akkermansiaceae (LowMD = 3% and HighMD = 0.38%) increased in LowMD. Meanwhile, relative abundances increased in HighMD for the families Lachnospiraceae (LowMD = 26.44% and HighMD = 30.87%), Enterobacteriaceae (LowMD = 2.8% and HighMD = 4%), and Peptostreptococcaceae (LowMD = 2.72% and HighMD = 5.59%).
On the other hand, in the UPF group (Figure 4B), increases in LowUPF were observed for the families Oscillospiraceae (LowUPF = 36.45% and HighUPF = 29.28%), Enterobacteriaceae (LowUPF = 7.86% and HighUPF = 0.92%), Akkermansiaceae (LowUPF = 3.38% and HighUPF = 0.42%), and Peptostreptococcaceae (LowUPF = 5.73% and HighUPF = 3.59%). In contrast, increases in HighUPF were observed for the families Lachnospiraceae (LowUPF = 25.18% and HighUPF = 31.24%) and Veillonellaceae (LowUPF = 1.65% and HighUPF = 10%).
A correlation was observed between LowMD and HighUPF (Western diet) in the families Enterobacteriaceae, Veillonellaceae, and Peptostreptococcaceae.

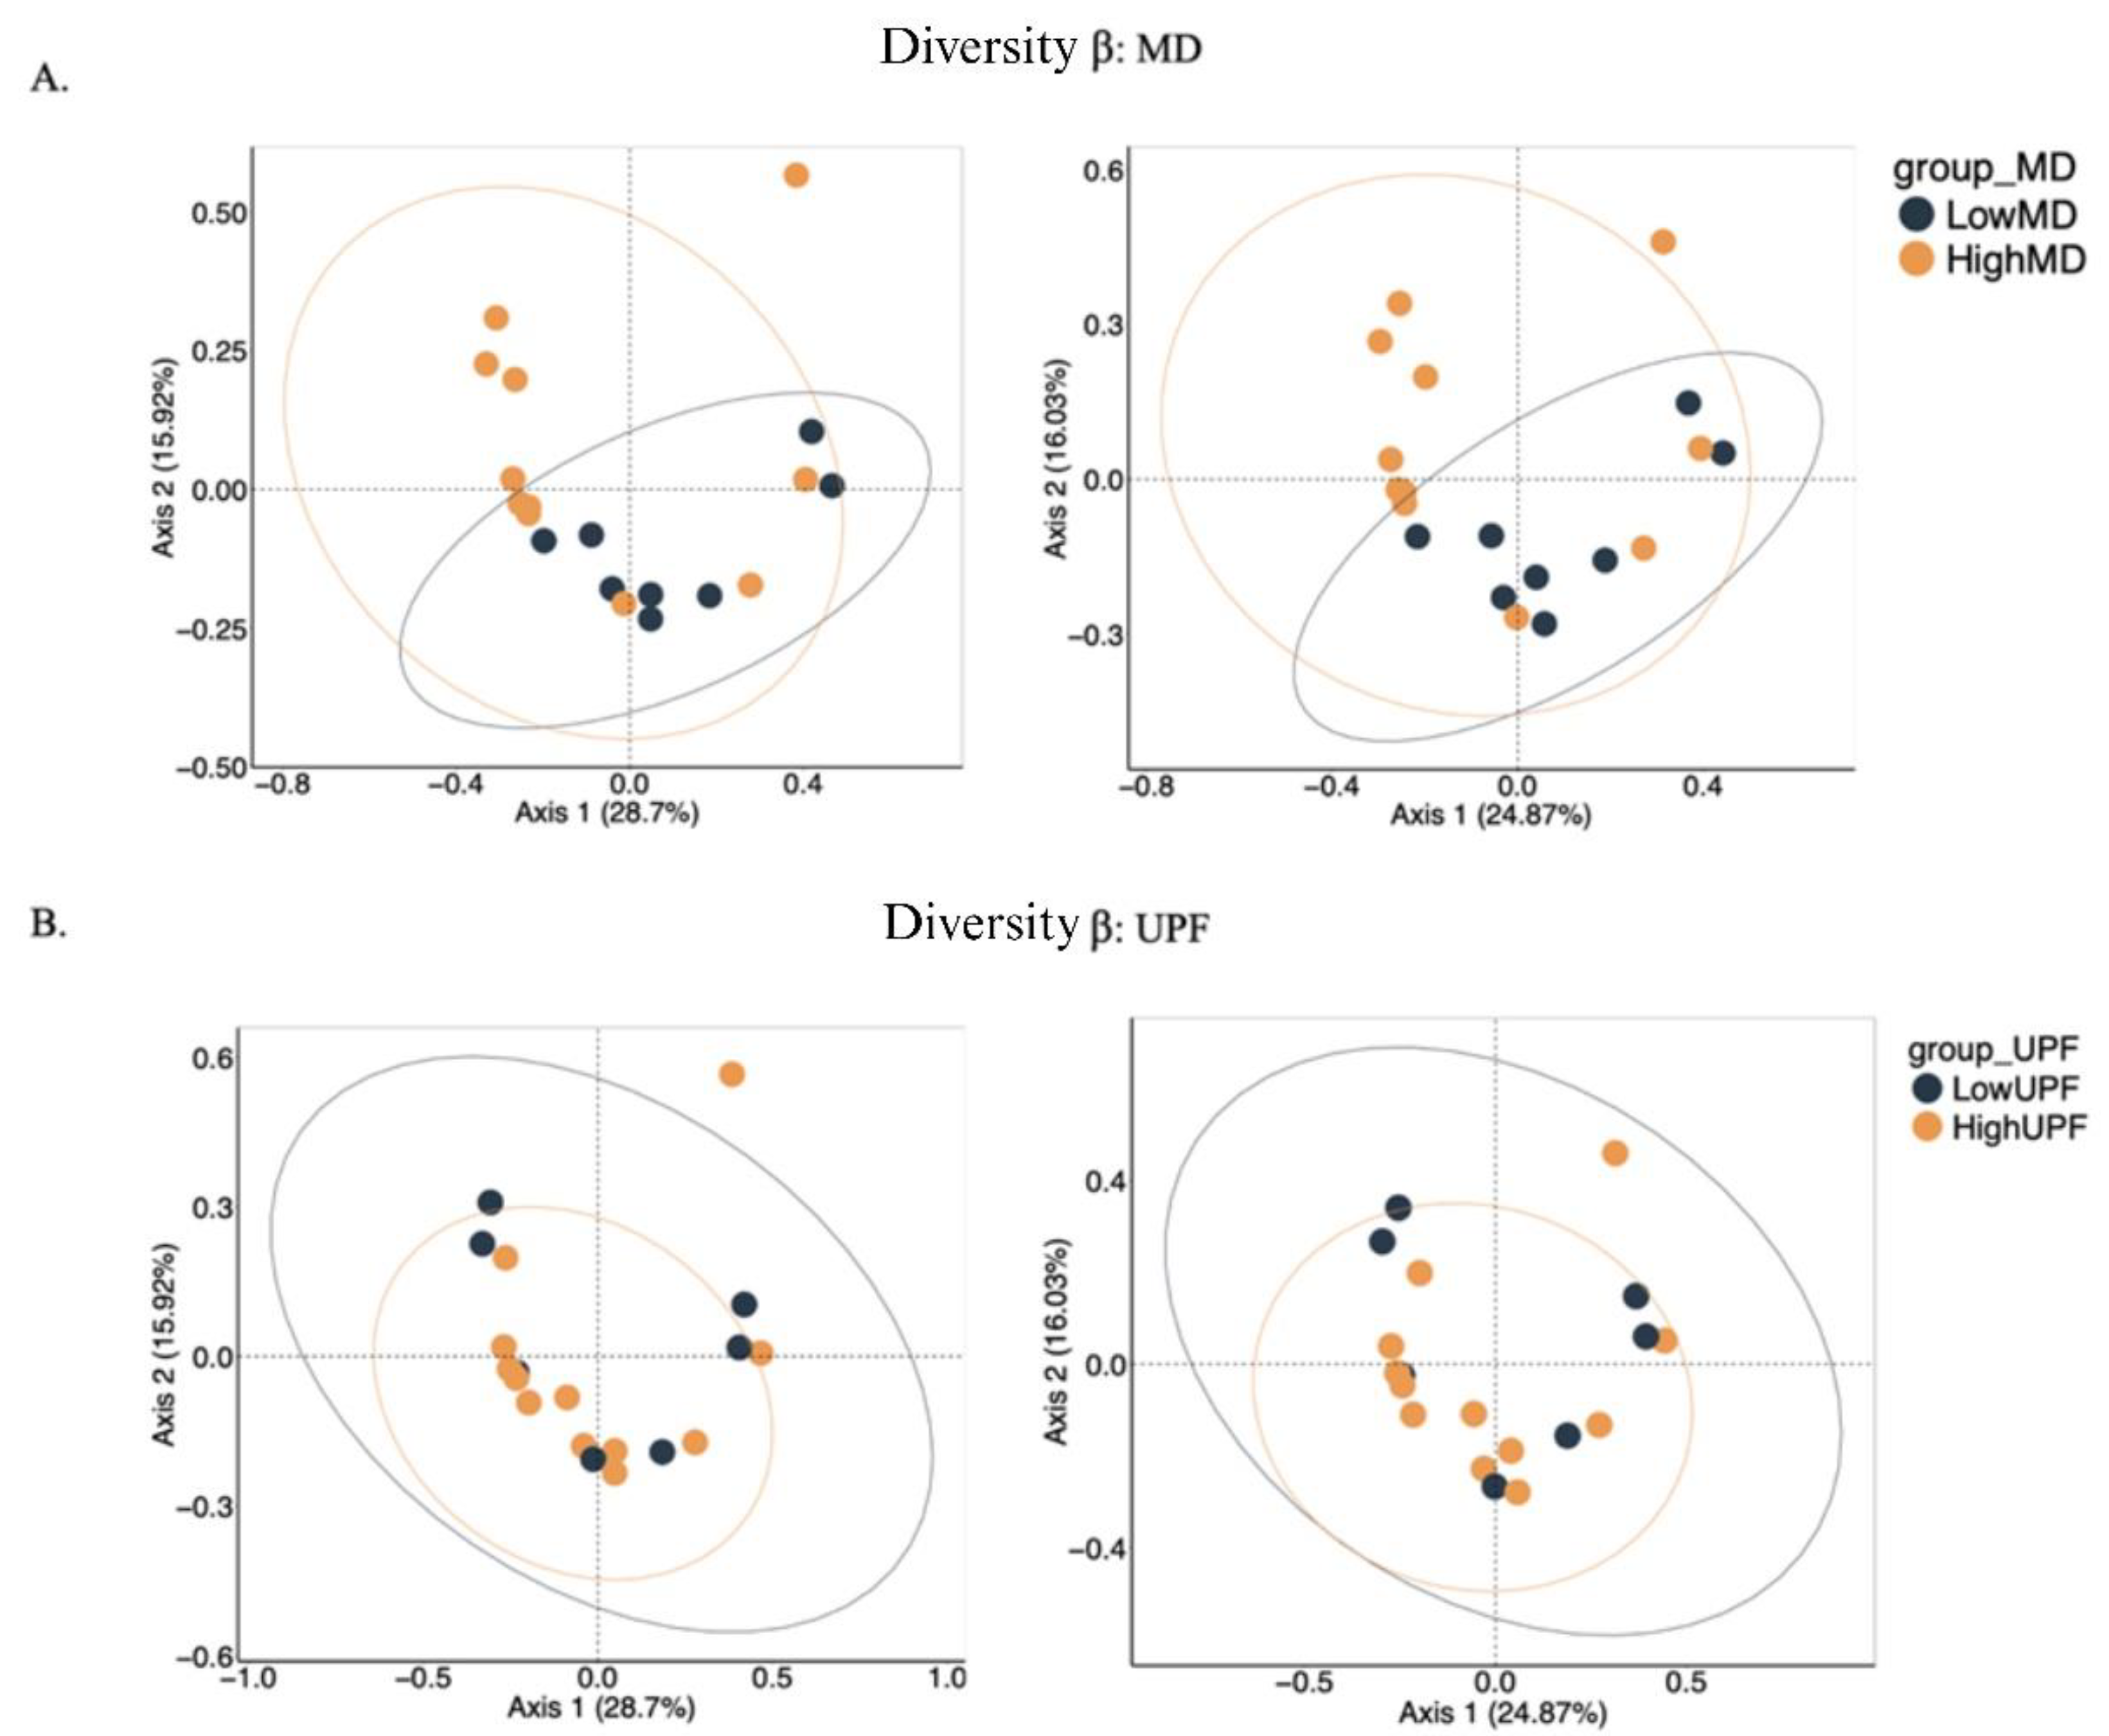
2.3.2 α and β Diversity

To explore alterations in the microbial community structure among adolescents and the impact of dietary patterns, α diversity analysis (Figure S) was performed, measuring both richness and diversity within a sample, and β diversity (Figure 5), comparing differences in species composition between samples, all at the genus level. The diversities were analyzed using the MicrobiomeStat package (RStudio).
The α diversity indices in the MD adherence group (Figure S.A) did not show statistically significant differences, although a more diverse distribution was observed in the HighMD group.
To assess the impact of the Western diet, α diversity indices were compared between the UPF group (Figure S.B) and the MD group (Figure S.A). No statistically significant differences or clear association were observed between the HighUPF and LowUPF groups. However, a slight increase in diversity and evenness was recorded in the HighUPF group. β diversity with respect to MD adherence (Figure 5A) shows greater separation between the LowMD and HighMD points. This suggests more pronounced differences in microbiota composition between the samples. The lack of significant overlap between the 95% confidence ellipses suggests these differences are statistically significant.
When visualizing the HighUPF and LowMD groups (Figure 5B), typical of the Western diet, similar behaviors were observed with trends towards grouping, although the UPF group did not show as clear separation as the MD group.
The variances extracted from both methods are very similar, considering relative abundances (BC) and considering the presence/absence of bacteria (Jaccard), thus indicating a consistent representation of the results.

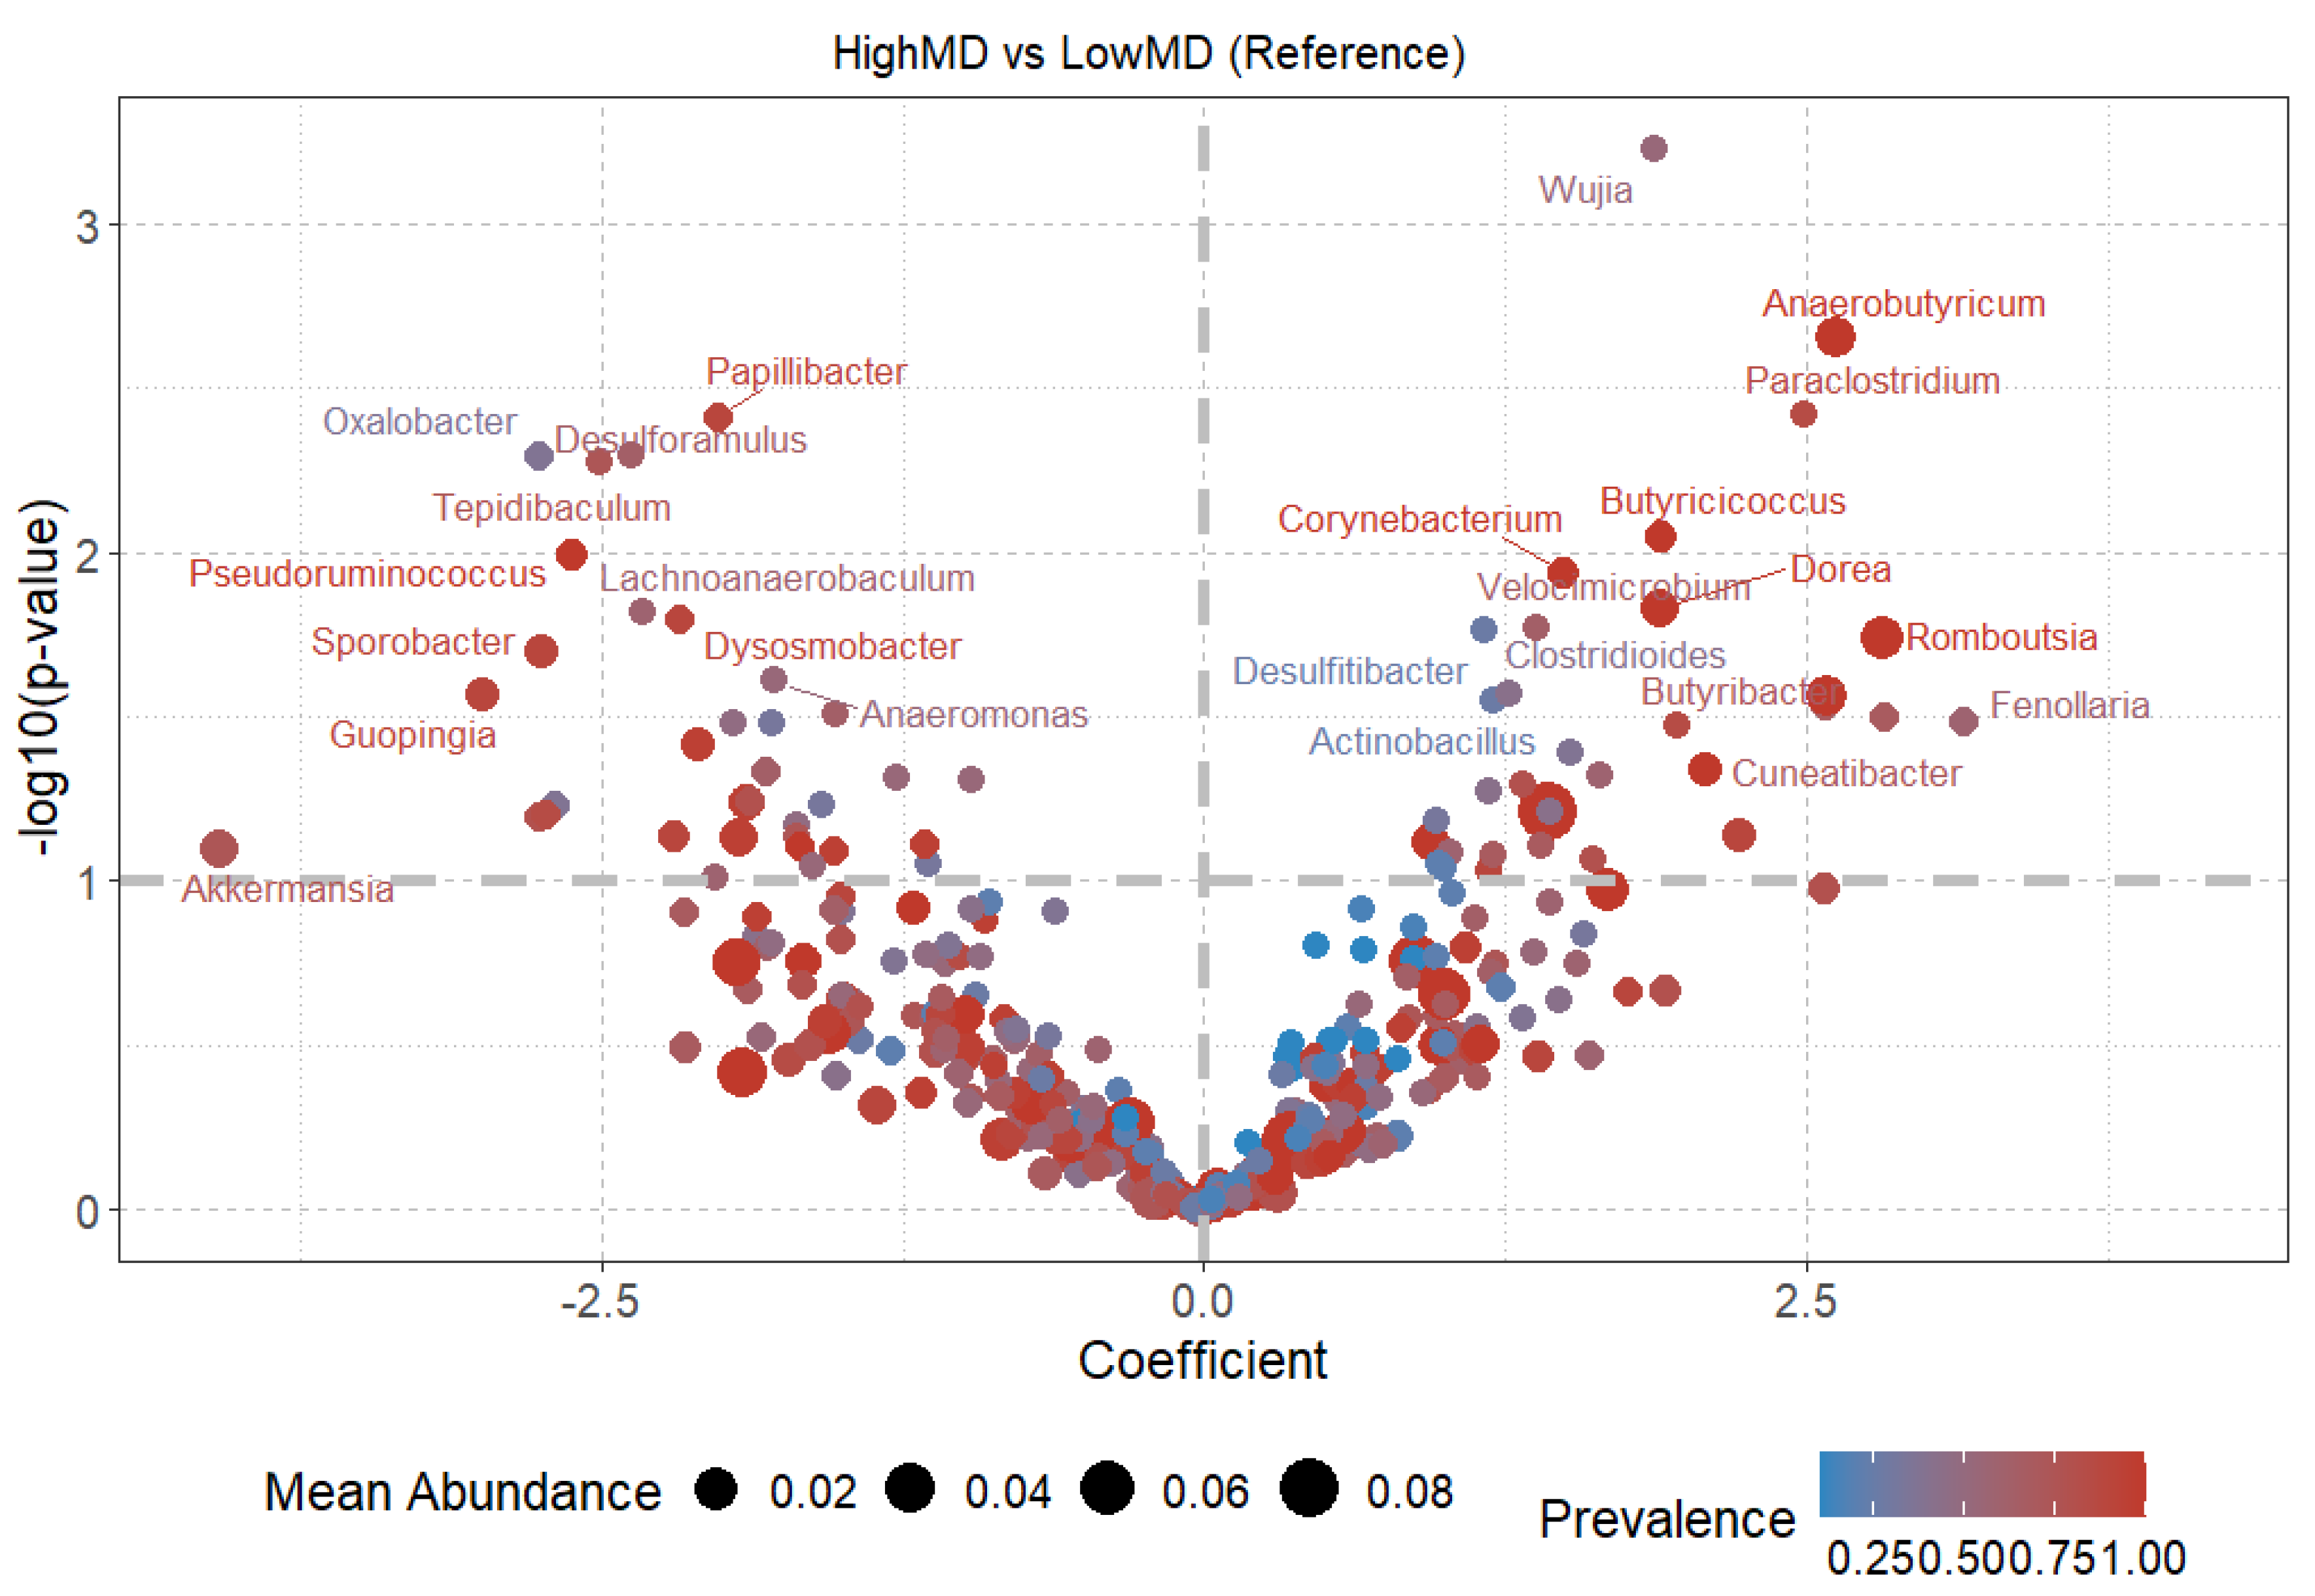
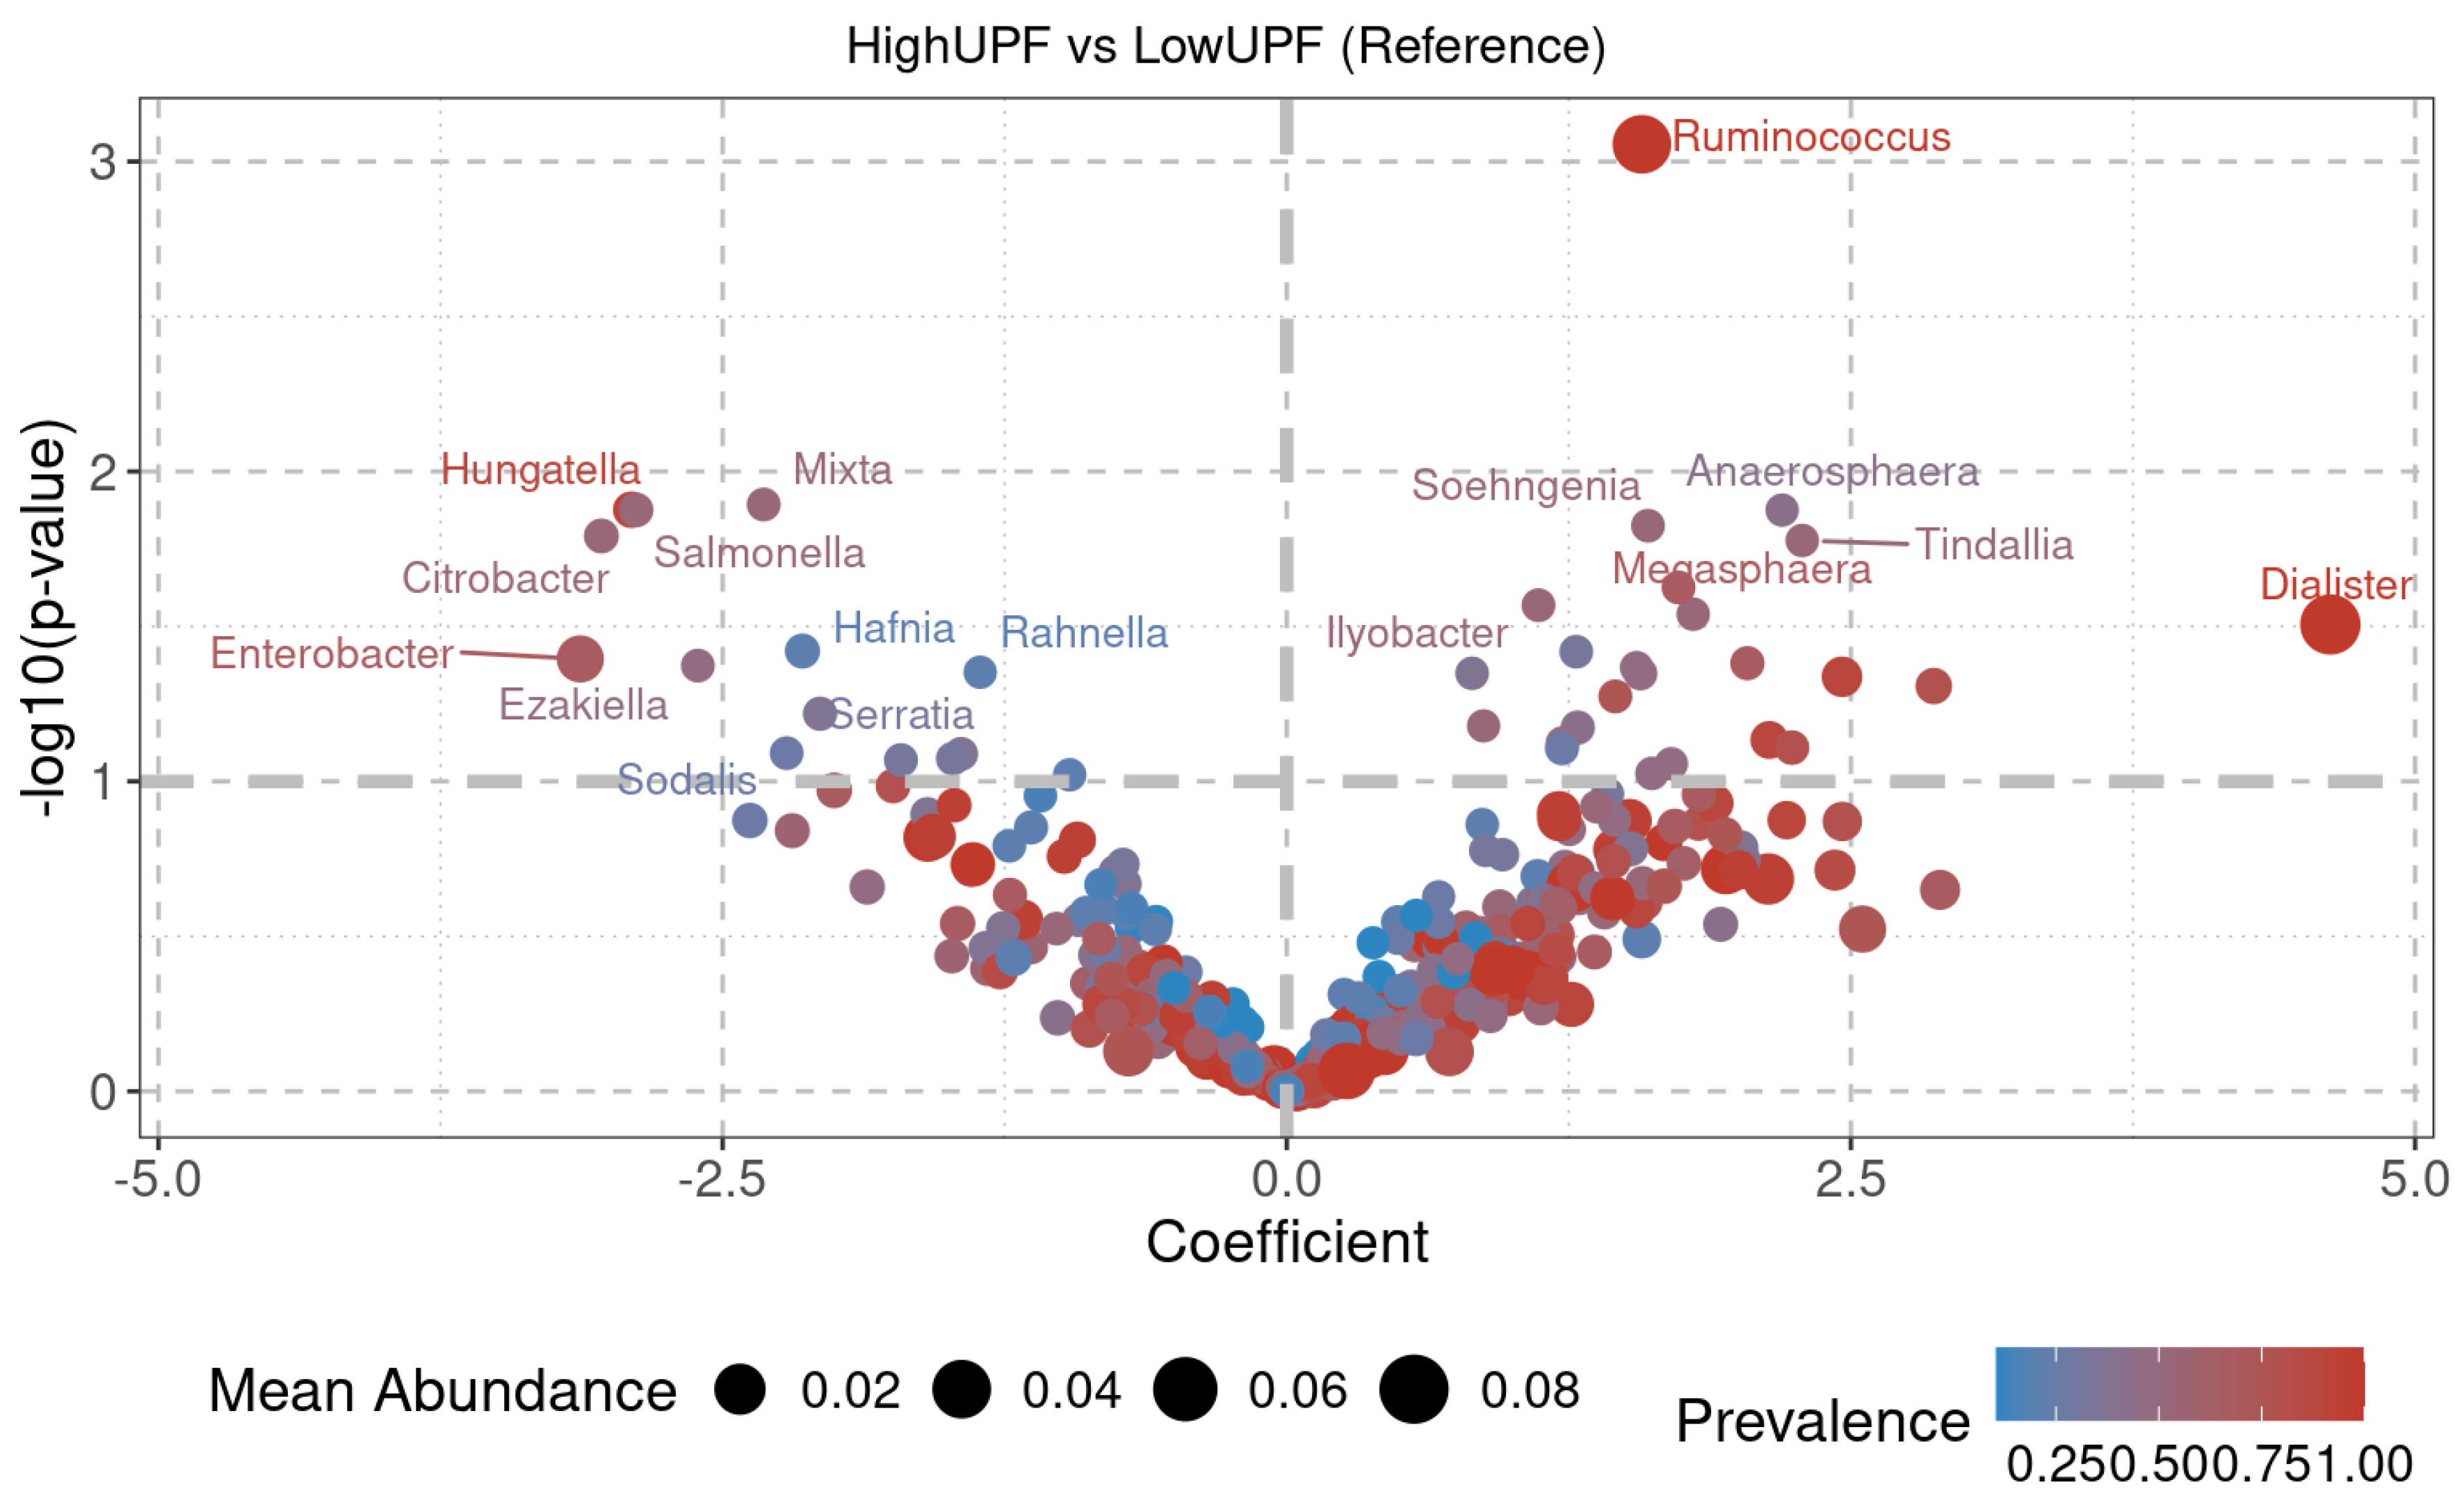
2.3.3. Diversity at the Genus Level

The mean abundances show statistically significant differences between various genera in the HighMD and LowMD groups (Figure 6). A higher mean abundance is observed in the HighMD group for the genera Dorea, Anaerobutyricum, Romboutsia, Clostridioides, Paraclostridium, and Butyricicoccus, among others. In contrast, the genera Lachnoanaerobaculum, Oxalobacter, Dysosmobacter, Sporobacter, and Tepidibaculum, among others, are decreased compared to LowMD.
For the HighUPF and LowUPF groups (Figure 7), statistically significant differences are also observed between various genera. In particular, higher mean abundance is seen in the genera Dialester, Ruminococcus, Megasphaera, Anaerosphaera, and Tindallia, among others, in the HighUPF group; while genera such as Hungatella, Enterobacter, Salmonella, Citrobacter, Hafnia, Rahnella, Serratia, Ezakitella, and Sodalis, among others, are decreased in comparison to the LowUPF group.
A greater number of genera with statistically significant differences were observed in the MD group (Figure 6) compared to the UPF group (Figure 7).

3. Discussion

Authors should discuss the results and how they can be interpreted from the perspective of previous studies and of the working hypotheses. The findings and their implications should be discussed in the broadest context possible. Future research directions may also be highlighted.
The gut microbiota has evolved from being considered a largely passive community of commensal microorganisms to being studied as an active and dynamic microbial community with a significant impact on nearly all areas of human physiology. The relationship between gut microbiota and cardiometabolic diseases, such as obesity and T2D, has been widely documented [14]. Moreover, it is estimated that approximately 60% of gut microbiota structure is influenced by diet, highlighting the importance of dietary habits in shaping gut microbial ecology [15].
Therefore, dietary patterns can influence both the composition and function of these microbial communities, contributing to the maintenance of eubiosis [16] or, conversely, triggering dysbiosis. Recently, comparisons between populations with distinctly different diets have revealed differences in the characteristics of the gut microbiota [17,18,19].
In this context, the present study evaluated the effects of the Mediterranean diet (MD) and Western diet (WD) on the gut microbiota of a group of Spanish adolescents.
The MD has been widely recognized for its preventive properties against non-communicable diseases. Characterized by low consumption of processed foods and a high intake of foods rich in macronutrients, antioxidants, and complex insoluble fiber, it was the first diet studied in this context [20]. Metagenomic studies have suggested that the high fiber intake typical of the MD promotes beneficial modulation of certain microbial taxa, contributing to host health protection [21].
On the other hand, the WD, defined by its high content of refined sugars, fats, and ultra-processed foods (UPF), has been associated with increased local inflammation and intestinal permeability [22]. Specific components of Western-style diets directly modulate metabolism or immune responses, or indirectly affect inflammatory phenotypes by altering the composition or function of the gut microbiota. For example, in healthy volunteers, endotoxemia induced by a Western diet (i.e., an increase in serum concentrations of lipopolysaccharides derived from Bacteroides or Prevotella species) promotes inflammatory processes, while microbial rarefaction encourages calorie storage in the host. Consequently, chronic inflammation promotes metabolic and immune-mediated diseases [7].
In this study, adherence to the MD demonstrated an increase in the functional diversity of gut microbiota in the HighMD group compared to the LowMD group (Figure 1). Although no greater variety of microbial species was observed, the HighMD group exhibited a more balanced distribution in terms of alpha diversity (Fig.S6.A). Moreover, significant differences in beta diversity were identified between the two groups (Figure 5.A), indicating variations in the composition of the gut microbiota. These findings are consistent with previous studies suggesting a positive association between adherence to the MD and greater gut microbiota diversity [23].
The high dietary fiber intake characteristic of the MD not only benefits microbial diversity but also promotes the production of SCFAs, such as acetate, butyrate, and propionate, through fermentation processes. These compounds play a crucial role in maintaining gut health [24]. Additionally, adherence to the MD, combined with high consumption of fiber, legumes, vegetables, fruits, and nuts, is associated with an increase in butyrate-producing taxa abundance, further reinforcing its anti-inflammatory benefits [25].
Overall, these results suggest that the increased functional diversity and beneficial microbial modulation observed in the HighMD group are closely related to nutrients characteristic of the MD.
On the other hand, prospective analysis of population distributions through the cenoantibiogram technique, based on variance results explained by PCA, indicated differentiation between HighMD and LowMD groups under aerobic (Figure 2) and anaerobic conditions (Figure 3). These findings suggest that dietary patterns may impact both the taxonomic composition and phenotypic expression of the gut microbiota.
Previous studies have revealed that mice consuming a high-fat diet are less sensitive to antibiotic treatment following infection compared to those on a standard diet. Conversely, a high-fiber diet, such as the MD, reduces available nutritional resources and transforms bacterial fermentation, favoring the growth of bacteria capable of utilizing carbohydrates. Therefore, dietary patterns can influence antibiotic resistance genes (ARGs) through bacterial interactions or extracellular metabolites [26]. In the future, dietary interventions aimed at controlling ARGs could become a tool for combating antibiotic resistance.
The effects of the MD on gut microbiota extend beyond increased functional diversity. Previous studies have shown variable results regarding individual bacterial genera [27]. In this study, statistically significant differences were observed in mean abundances at the genus level between HighMD and LowMD groups (Figure 6). In the HighMD group, increases were reported in genera such as Paraclostridium, Anaerobutyricum, Romboutsia, and Butyricoccus, anti-inflammatory butyrate-producing bacteria [28]. This finding is relevant, as butyrate plays a crucial role in gut health by providing energy to colon epithelial cells and modulating inflammation [29]. Notably, Romboutsia has been shown to decrease significantly during intestinal mucosal lesions, positioning it as a potential microbial biomarker for intestinal diseases [30].
In contrast, the LowMD group showed an increase in the genera Lachnoanaerobacculum, Sporobacter, and Tepidibaculum. Although the differences in genus abundances between HighMD and LowMD groups were significant, the specific implications of these changes remain unclear. The human gut microbiota is a dynamic and diverse ecosystem, where bacteria interact in complex networks with functional redundancy. This complicates the assignment of exclusive roles to each taxon [31]. Therefore, further functional and experimental research is required to elucidate the implications of these observations.
At the family level, relevant differences were found. In the HighMD group, increases in relative abundances of Enterobacteriaceae and Lachnospiraceae were reported (Figure 4.A). However, these differences were not statistically significant. Longitudinal studies in healthy individuals have shown that gut microbiota composition is relatively stable at high taxonomic levels. Nevertheless, significant strain-level turnover, particularly in Enterobacteriaceae populations, has been reported [32,33], which may explain the results obtained.
Regarding the Western diet, patterns observed in HighUPF and LowMD groups also revealed interesting differences. At the family level, relative abundances did not vary significantly between the two groups (Figure 4.B). However, differences in beta diversity (Figure 5.B) and alpha diversity (Fig.S6.B) were identified.
Moreover, principal component analysis (PCA) under aerobic and anaerobic conditions (Fig.S4 and Fig.S5) showed no correlation in metabolic diversity (Figure 1) or mean abundances at the genus level (Figure 7). These findings reinforce the idea that, while diet influences certain microbiota parameters, it interacts with other intrinsic and environmental factors contributing to the complexity of this ecosystem.
In summary, while the MD appears to be associated with beneficial changes in key butyrate-producing taxa, such as Romboutsia and Butyricoccus, the differences observed in the WD require more detailed analysis to understand its effects on gut microbiota and its relationship with host health.

Study Limitations:

The results related to the WD were not considered particularly relevant due to the non-specific nature of the SQ-HPF test in adolescents, unlike the KIDMED test. This may explain observed inconsistencies, such as adolescents with high UPF consumption also showing high adherence to the MD. Furthermore, the Western diet is complex and not solely characterized by the degree of food processing. The wide variety of food processing technologies and food additives available can exert varied effects on human health.
The observational design of the study did not allow conclusions on causality or directionality, as these results only indicate associations. Nevertheless, observational design is the most appropriate approach to explore such associations since longitudinal intervention-based studies, including high UPF intake and low MD adherence, could be harmful to health and pose ethical concerns. Experimental models, such as humanized mice, could be an effective strategy to further understand how these dietary patterns modulate gut microbiota.
Finally, this study presents other technical limitations. For example, the Biolog EcoPlate™ technique, described in the literature as a relatively fast and economical method [34], has not yet been extensively analyzed in human cecal samples, complicating its interpretation. This highlights the need to employ it in future studies for a better understanding of the functional metabolic capacity of gut microbiota.
Regarding the cenoantibiogram, although differences in minimum inhibitory concentrations (MICs) for various antibiotics were observed between groups, these variations reflect differences in the spatial distribution of the microbiota in response to antibiotics. However, the precise implication of these findings remains unclear due to internal variability and group overlap. This underscores the need for more robust and controlled analyses to clarify the impact of dietary patterns on antibiotic resistance.
To conclude, the analysis of 16S rRNA using Nanopore also presents significant limitations, such as a high error rate, amplification biases, and limited taxonomic resolution [35].

4. Materials and Methods

4.1. Study Design and Sample Collection

A descriptive cross-sectional study was designed with a sample of n = 19 adolescents, aged between 13 and 17 years, all residents of the Autonomous Community of Madrid. The fieldwork was conducted between January and February 2023, at the facilities of the Universidad San Pablo-CEU (Madrid). The study protocol was approved by the Research Ethics Committee of Universidad San Pablo-CEU with code 578/22/55.
A cecal sample was collected from each participant. These samples were immediately refrigerated on ice and stored at −80°C until further analysis.

4.2. Diet Quality Assessment

To evaluate the overall quality of the diet, participants completed two dietary questionnaires that assess adherence to the Mediterranean Diet (MD) (KIDMED Score) [36] and the consumption of Ultra-Processed Food (UPF) (SQ-HPF Score) [37], in accordance with the Declaration of Helsinki.
For each dietary score, participants were divided into two groups based on the median score of all participants. The KIDMED questionnaire was divided into LowMD and HighMD, while the SQ-HPF score was divided into LowUPF and HighUPF.

4.3. Comparative Functional Analysis of the Intestinal Microbiota

2g of cecal sample were weighed per patient. Each sample was suspended in a 0.45% sterile saline solution to a final volume of 20mL. The density of viable microorganisms was confirmed to be cfu/mL (optical density [OD] = 0.5 McFarland). From the obtained microbial suspension, 135µL per well were loaded into Biolog Ecoplate™ plates (Biolog Inc., Hayward, CA, USA), generating a technical replicate (n=3). The plates were incubated at 37°C and analyzed every 24 hours. Absorbance was measured at 630nm and 595nm using the Asys UVM340 plate reader and Micro Win™ V3.5 Software. The AWCD (Average Well Color Development) value was represented [38]. All procedures were conducted as described in the protocol [39].

4.4. Comparative Analysis of Antibiotic Response in the Intestinal Microbiota

From the same bacterial suspension obtained under the conditions described in the previous section, it was plated on Mueller-Hinton agar (Condalab®, Madrid, Spain) and the Minimum Inhibitory Concentration (MIC) of the samples was evaluated from cultures in both anaerobic and aerobic conditions, according to the model described by Marina Robas Mora et al. [40] using the Epsilon test (ε-test).
In aerobic cultures, the following antibiotics were tested: Amikacin (AK), Amoxicillin (AML), Cefpirome (CR), Ceftazidime (CAZ), Gentamicin (CN), Sulfamethoxazole/Trimethoprim (TS) (BioMérieux®, Marcy l’Etoile, France). In anaerobic cultures, the antibiotics used were: Amoxicillin/Clavulanic acid (AUG), Azithromycin (AZM), Cefoxitin (FOX), Ciprofloxacin (CIP), Clindamycin (CD), Imipenem (IMI), IMI+EDTA, Metronidazole (MTZ), Rifampicin (RD), Levofloxacin (LEV) (BioMérieux®, Marcy l’Etoile, France). The samples were incubated anaerobically using an anaerobic bag system from the commercial company Merck (Merck KGaA, 64271, Darmstadt, Germany). Plates were incubated following the manufacturer’s instructions, and the inhibition zones were measured after 48 hours of incubation.

4.5. Metagenomic Analysis

Microbial DNA was extracted using the Real Microbiome Fecal DNA Kit (Real Laboratory SL, Valencia). The DNA concentration was measured using a Nanodrop2000 and adjusted to 10ng with nuclease-free water. The DNA was amplified using the 16S Barcoding Kit (SQK-RAB204, Oxford Nanopore Technology, Oxford, UK). The primers used for the amplification of the 16S rRNA region are specific for the full region, using primers 27F and 1492R. The PCR product was purified using the “HighPrep™ PCR Bead Purification” (Macbio). Next, the library was prepared according to the instructions of the 16S Barcoding Kit. 200ng of samples were loaded onto a R9.4.1 flow cell and sequenced on the MinION Mk1C device for 12 hours.

4.6. Statistical Analysis

The comparative functional analysis of the intestinal microbiota was performed using the corrected absorbance values from the chosen incubation time as AWDC [38]. The metabolic diversity of each sample was calculated using the Shannon-Weaver diversity index. In the comparative analysis of the antibiotic response, the two variables that best explain the model were projected onto the two-dimensional plane to study potential groupings between treatments, based on principal component analysis (PCA). SPSS® Statistics AmosTM v.29.0 (IBM® Company, NY, USA) software was used for all analyses.

5. Conclusions

This section is not mandatory but can be added to the manuscript if the discussion is unusually long or complex.
The results of this study suggest that adherence to the Mediterranean Diet (MD) is associated with greater functional diversity in the gut microbiota of adolescents. This implies that greater adherence to the MD could promote a more diverse and healthier gut microbiota. However, no statistically significant differences in α-diversity were found between the two groups, indicating that microbial richness at the taxonomic level is not strongly influenced by adherence to the MD.
Despite the lack of differences in α-diversity, comparisons of microbial community structure between adolescents following the MD and those following the Western Diet (WD) showed clear differences in terms of β-diversity. These findings suggest that dietary patterns influence the composition of the gut microbiota in a more complex manner, beyond just taxonomic richness.
The analysis of population distributions in response to antibiotics, using the cenoantibiogram, revealed phenotypic differences between the HighMD and LowMD groups, as well as between the HighUPF and LowUPF groups, under both aerobic and anaerobic conditions. These differences in microbial response to antibiotics could be influenced by variations in microbial composition derived from dietary habits, highlighting the interaction between diet and gut microbiota in terms of resistance to antimicrobial treatments.
Regarding the abundance of specific bacterial genera, it was observed that the HighMD group showed a significant increase in butyrate-producing genera, such as Paraclostridium, Anaerobutyricum, Romboutsia, and Butyricoccus, known for their anti-inflammatory effects and benefits for gut health. On the other hand, a significant decrease was observed in the genera Sporobacter, Lachnoanaerobaculum, and Tepibaculum, which could reflect a more favorable microbial pattern for the prevention of inflammatory diseases. These results support the idea that adherence to the Mediterranean Diet promotes a balanced gut microbiota, favoring the production of beneficial metabolites such as butyrate.
Although the obtained results show associations between adherence to the MD and changes in the gut microbiota, the observational design does not allow for causality to be established. To better understand these effects, future longitudinal studies with dietary interventions, such as increasing adherence to the MD and reducing UPF consumption, could provide additional information. However, these approaches may also face ethical challenges. In this context, experimental models, such as humanized mice, present an effective tool to further investigate the mechanisms linking diet to the modulation of the gut microbiota.
This work therefore provides a valuable foundation for future research. Increasing the sample size and applying new methodologies would allow for a deeper understanding of the relationship between dietary patterns and the gut microbiota, helping to address the remaining questions in this field.

Supplementary Materials

The following supporting information can be downloaded at the website of this paper posted on Preprints.org.

Author Contributions

Individual contributions: Blaya, M.M. (BMM); Redruello Requejo M. (RRM); Gonzalez Reguero, D. (GRD); Robas Mora, M. (RMM); Partearroyo Cediel T. (PCT) ; Varela Moreiras, G. (VMG); Penalba Iglesias D.(PID) ; Jimenez Gómez P (JGP) . & Reche Sainz P (RSP) Conceptualization, (PCT) (RSP) and (JGP); methodology, (MRB), (TPC), (PID), (BMM); software, (GRD); validation, (RMM), (RRM) and (RSP); formal analysis, (GRD) and (RMM); investigation, (BMM), (PID), (RSP) and (RRM); resources, (VMG), (PCT), (RMM), (PCT) and (JGP); data curation, (GRD), (RMM), (JGP) and (RSP); writing—original draft preparation (BMM), (PSP); writing—review and editing, (VMG), (PCT), (RMM), (PCT) and (JGP); visualization, (DGR), (PID); supervision, (RSP) and (RMM); project administration, (VMG), (PCT), (RMM) and (JGP); funding acquisition, (RMM), (PCT) and (JGP). All authors have read and agreed to the published version of the manuscript.

Funding

This research received no external funding.

Conflicts of Interest

The authors declare no conflicts of interest.

References

  1. Heintz-Buschart, A.; Wilmes, P. Human Gut Microbiome: Function Matters. Trends Microbiol 2018, 26, 563–574. [Google Scholar] [CrossRef] [PubMed]
  2. Ellis, J.L.; Karl, J.P.; Oliverio, A.M.; Fu, X.; Soares, J.W.; Wolfe, B.E.; Hernandez, C.J.; Mason, J.B.; Booth, S.L. Dietary Vitamin K Is Remodeled by Gut Microbiota and Influences Community Composition. Gut Microbes 2021, 13. [Google Scholar] [CrossRef] [PubMed]
  3. Lamichhane, S.; Sen, P.; Dickens, A.M.; Orešič, M.; Bertram, H.C. Gut Metabolome Meets Microbiome: A Methodological Perspective to Understand the Relationship between Host and Microbe. Methods 2018, 149, 3–12. [Google Scholar] [CrossRef] [PubMed]
  4. Derovs, A.; Laivacuma, S.; Krumina, A. Targeting Microbiota: What Do We Know about It at Present? Medicina (B Aires) 2019, 55, 459. [Google Scholar] [CrossRef] [PubMed]
  5. Levy, M.; Blacher, E.; Elinav, E. Microbiome, Metabolites and Host Immunity. Curr Opin Microbiol 2017, 35, 8–15. [Google Scholar] [CrossRef]
  6. Budden, K.F.; Shukla, S.D.; Rehman, S.F.; Bowerman, K.L.; Keely, S.; Hugenholtz, P.; Armstrong-James, D.P.H.; Adcock, I.M.; Chotirmall, S.H.; Chung, K.F. Functional Effects of the Microbiota in Chronic Respiratory Disease. Lancet Respir Med 2019, 7, 907–920. [Google Scholar] [CrossRef]
  7. Adolph, D.; Margraf, J. Differential Effects of Trait-like Emotion Regulation Use and Situational Emotion Regulation Ability across the Affective and Anxiety Disorders Spectrum: A Transdiagnostic Examination. Sci Rep 2024, 14, 26642. [Google Scholar] [CrossRef]
  8. Nardocci, M.; Leclerc, B.-S.; Louzada, M.-L.; Monteiro, C.A.; Batal, M.; Moubarac, J.-C. Consumption of Ultra-Processed Foods and Obesity in Canada. Canadian Journal of Public Health 2019, 110, 4–14. [Google Scholar] [CrossRef]
  9. da Rocha, B.R.S.; Rico-Campà, A.; Romanos-Nanclares, A.; Ciriza, E.; Barbosa, K.B.F.; Martínez-González, M.Á.; Martín-Calvo, N. Adherence to Mediterranean Diet Is Inversely Associated with the Consumption of Ultra-Processed Foods among Spanish Children: The SENDO Project. Public Health Nutr 2021, 24, 3294–3303. [Google Scholar] [CrossRef]
  10. Bonaccio, M.; Di Castelnuovo, A.; Costanzo, S.; Pounis, G.; Persichillo, M.; Cerletti, C.; Donati, M.B.; de Gaetano, G.; Iacoviello, L. Mediterranean-Type Diet Is Associated with Higher Psychological Resilience in a General Adult Population: Findings from the Moli-Sani Study. Eur J Clin Nutr 2018, 72, 154–160. [Google Scholar] [CrossRef]
  11. Martínez-González, M.A.; Gea, A.; Ruiz-Canela, M. The Mediterranean Diet and Cardiovascular Health. Circ Res 2019, 124, 779–798. [Google Scholar] [CrossRef] [PubMed]
  12. Tong, M.; Li, X.; Wegener Parfrey, L.; Roth, B.; Ippoliti, A.; Wei, B.; Borneman, J.; McGovern, D.P.B.; Frank, D.N.; Li, E. A Modular Organization of the Human Intestinal Mucosal Microbiota and Its Association with Inflammatory Bowel Disease. PLoS One 2013, 8, e80702. [Google Scholar] [CrossRef] [PubMed]
  13. World Health Organization International Organizations Unite on Critical Recommendations to Combat Drug-Resistant Infections and Prevent Staggering Number of Deaths Each Year.
  14. Zhang, L.; Wang, P.; Huang, J.; Xing, Y.; Wong, F.S.; Suo, J.; Wen, L. Gut Microbiota and Therapy for Obesity and Type 2 Diabetes. Front Endocrinol (Lausanne) 2024, 15. [Google Scholar] [CrossRef] [PubMed]
  15. Barber, T.M.; Kabisch, S.; Pfeiffer, A.F.H.; Weickert, M.O. The Effects of the Mediterranean Diet on Health and Gut Microbiota. Nutrients 2023, 15, 2150. [Google Scholar] [CrossRef]
  16. Hamamah, S.; Iatcu, O.C.; Covasa, M. Nutrition at the Intersection between Gut Microbiota Eubiosis and Effective Management of Type 2 Diabetes. Nutrients 2024, 16, 269. [Google Scholar] [CrossRef]
  17. van der Vossen, E.W.J.; Davids, M.; Bresser, L.R.F.; Galenkamp, H.; van den Born, B.-J.H.; Zwinderman, A.H.; Levin, E.; Nieuwdorp, M.; de Goffau, M.C. Gut Microbiome Transitions across Generations in Different Ethnicities in an Urban Setting—the HELIUS Study. Microbiome 2023, 11, 99. [Google Scholar] [CrossRef]
  18. Rosas-Plaza, S.; Hernández-Terán, A.; Navarro-Díaz, M.; Escalante, A.E.; Morales-Espinosa, R.; Cerritos, R. Human Gut Microbiome Across Different Lifestyles: From Hunter-Gatherers to Urban Populations. Front Microbiol 2022, 13. [Google Scholar] [CrossRef]
  19. Walker, R.L.; Vlamakis, H.; Lee, J.W.J.; Besse, L.A.; Xanthakis, V.; Vasan, R.S.; Shaw, S.Y.; Xavier, R.J. Population Study of the Gut Microbiome: Associations with Diet, Lifestyle, and Cardiometabolic Disease. Genome Med 2021, 13, 188. [Google Scholar] [CrossRef]
  20. Nagpal, R.; Shively, C.A.; Register, T.C.; Craft, S.; Yadav, H. Gut Microbiome-Mediterranean Diet Interactions in Improving Host Health. F1000Res 2019, 8, 699. [Google Scholar] [CrossRef]
  21. Myhrstad, M.C.W.; Tunsjø, H.; Charnock, C.; Telle-Hansen, V.H. Dietary Fiber, Gut Microbiota, and Metabolic Regulation—Current Status in Human Randomized Trials. Nutrients 2020, 12, 859. [Google Scholar] [CrossRef]
  22. Clemente-Suárez, V.J.; Beltrán-Velasco, A.I.; Redondo-Flórez, L.; Martín-Rodríguez, A.; Tornero-Aguilera, J.F. Global Impacts of Western Diet and Its Effects on Metabolism and Health: A Narrative Review. Nutrients 2023, 15, 2749. [Google Scholar] [CrossRef] [PubMed]
  23. Merra, G.; Noce, A.; Marrone, G.; Cintoni, M.; Tarsitano, M.G.; Capacci, A.; De Lorenzo, A. Influence of Mediterranean Diet on Human Gut Microbiota. Nutrients 2020, 13, 7. [Google Scholar] [CrossRef]
  24. Wu, G.D.; Compher, C.; Chen, E.Z.; Smith, S.A.; Shah, R.D.; Bittinger, K.; Chehoud, C.; Albenberg, L.G.; Nessel, L.; Gilroy, E. Comparative Metabolomics in Vegans and Omnivores Reveal Constraints on Diet-Dependent Gut Microbiota Metabolite Production. Gut 2016, 65, 63–72. [Google Scholar] [CrossRef] [PubMed]
  25. Rosés, C.; Cuevas-Sierra, A.; Quintana, S.; Riezu-Boj, J.I.; Martínez, J.A.; Milagro, F.I.; Barceló, A. Gut Microbiota Bacterial Species Associated with Mediterranean Diet-Related Food Groups in a Northern Spanish Population. Nutrients 2021, 13, 636. [Google Scholar] [CrossRef] [PubMed]
  26. Wang, R.; Chen, D.; Wang, F.; Fan, X.; Fan, C.; Tang, T.; Li, P.; Yang, M.; Zhao, Y.; Qi, K. An Insight into the Exploration of Proliferation of Antibiotic Resistance Genes in High-Fat Diet Induced Obesity Mice. Genomics 2021, 113, 2503–2512. [Google Scholar] [CrossRef] [PubMed]
  27. Jin, Q.; Black, A.; Kales, S.N.; Vattem, D.; Ruiz-Canela, M.; Sotos-Prieto, M. Metabolomics and Microbiomes as Potential Tools to Evaluate the Effects of the Mediterranean Diet. Nutrients 2019, 11, 207. [Google Scholar] [CrossRef]
  28. Xi, Y.; Jing, Z.; Wei, W.; Chun, Z.; Quan, Q.; Qing, Z.; Jiamin, X.; Shuwen, H. Inhibitory Effect of Sodium Butyrate on Colorectal Cancer Cells and Construction of the Related Molecular Network. BMC Cancer 2021, 21, 127. [Google Scholar] [CrossRef]
  29. Zhang, L.; Liu, C.; Jiang, Q.; Yin, Y. Butyrate in Energy Metabolism: There Is Still More to Learn. Trends in Endocrinology & Metabolism 2021, 32, 159–169. [Google Scholar] [CrossRef]
  30. Mangifesta, M.; Mancabelli, L.; Milani, C.; Gaiani, F.; de’Angelis, N.; de’Angelis, G.L.; van Sinderen, D.; Ventura, M.; Turroni, F. Mucosal Microbiota of Intestinal Polyps Reveals Putative Biomarkers of Colorectal Cancer. Sci Rep 2018, 8, 13974. [Google Scholar] [CrossRef]
  31. Johnson, A.J.; Vangay, P.; Al-Ghalith, G.A.; Hillmann, B.M.; Ward, T.L.; Shields-Cutler, R.R.; Kim, A.D.; Shmagel, A.K.; Syed, A.N.; Walter, J. Daily Sampling Reveals Personalized Diet-Microbiome Associations in Humans. Cell Host Microbe 2019, 25, 789–802.e5. [Google Scholar] [CrossRef]
  32. Calderón, D.; Cárdenas, P.A.; Prado-Vivar, B.; Graham, J.P.; Trueba, G. A Longitudinal Study of Dominant E. Coli Lineages and Antimicrobial Resistance in the Gut of Children Living in an Upper Middle-Income Country. J Glob Antimicrob Resist 2022, 29, 136–140. [Google Scholar] [CrossRef] [PubMed]
  33. Martinson, J.N. V; Pinkham, N. V; Peters, G.W.; Cho, H.; Heng, J.; Rauch, M.; Broadaway, S.C.; Walk, S.T. Rethinking Gut Microbiome Residency and the Enterobacteriaceae in Healthy Human Adults. ISME J 2019, 13, 2306–2318. [Google Scholar] [CrossRef] [PubMed]
  34. Checcucci, A.; Luise, D.; Modesto, M.; Correa, F.; Bosi, P.; Mattarelli, P.; Trevisi, P. Assessment of Biolog EcoplateTM Method for Functional Metabolic Diversity of Aerotolerant Pig Fecal Microbiota. Appl Microbiol Biotechnol 2021, 105, 6033–6045. [Google Scholar] [CrossRef] [PubMed]
  35. Benítez-Páez, A.; Portune, K.J.; Sanz, Y. Species-Level Resolution of 16S RRNA Gene Amplicons Sequenced through the MinIONTM Portable Nanopore Sequencer. Gigascience 2016, 5, 4. [Google Scholar] [CrossRef]
  36. Serra-Majem, L.; Ribas, L.; Ngo, J.; Ortega, R.M.; García, A.; Pérez-Rodrigo, C.; Aranceta, J. Food, Youth and the Mediterranean Diet in Spain. Development of KIDMED, Mediterranean Diet Quality Index in Children and Adolescents. Public Health Nutr 2004, 7, 931–935. [Google Scholar] [CrossRef]
  37. Martinez-Perez, C.; Daimiel, L.; Climent-Mainar, C.; Martínez-González, M.Á.; Salas-Salvadó, J.; Corella, D.; Schröder, H.; Martinez, J.A.; Alonso-Gómez, Á.M.; Wärnberg, J. Integrative Development of a Short Screening Questionnaire of Highly Processed Food Consumption (SQ-HPF). International Journal of Behavioral Nutrition and Physical Activity 2022, 19, 6. [Google Scholar] [CrossRef]
  38. Garland, J.L. Analytical Approaches to the Characterization of Samples of Microbial Communities Using Patterns of Potential C Source Utilization. Soil Biol Biochem 1996, 28, 213–221. [Google Scholar] [CrossRef]
  39. Sofo, A.; Ricciuti, P. A Standardized Method for Estimating the Functional Diversity of Soil Bacterial Community by Biolog® EcoPlatesTM Assay—The Case Study of a Sustainable Olive Orchard. Applied Sciences 2019, 9, 4035. [Google Scholar] [CrossRef]
  40. Marina Robas Mora; Pedro Antonio Jiménez Gómez; Carolina Valbuena; Agustín Probanza Effect of the Type of Vitis Vinifera Cultivation in the Cenophenoresistome and Metabolic Profiling (CLPP) of Edaphic Bacterial Communities. J Agric Sci Technol A 2017, 7. [CrossRef]
  41. Heintz-Buschart, A.; Wilmes, P. Human Gut Microbiome: Function Matters. Trends Microbiol 2018, 26, 563–574. [Google Scholar] [CrossRef]
  42. Ellis, J.L.; Karl, J.P.; Oliverio, A.M.; Fu, X.; Soares, J.W.; Wolfe, B.E.; Hernandez, C.J.; Mason, J.B.; Booth, S.L. Dietary Vitamin K Is Remodeled by Gut Microbiota and Influences Community Composition. Gut Microbes 2021, 13. [Google Scholar] [CrossRef] [PubMed]
  43. Lamichhane, S.; Sen, P.; Dickens, A.M.; Orešič, M.; Bertram, H.C. Gut Metabolome Meets Microbiome: A Methodological Perspective to Understand the Relationship between Host and Microbe. Methods 2018, 149, 3–12. [Google Scholar] [CrossRef] [PubMed]
  44. Derovs, A.; Laivacuma, S.; Krumina, A. Targeting Microbiota: What Do We Know about It at Present? Medicina (B Aires) 2019, 55, 459. [Google Scholar] [CrossRef]
  45. Levy, M.; Blacher, E.; Elinav, E. Microbiome, Metabolites and Host Immunity. Curr Opin Microbiol 2017, 35, 8–15. [Google Scholar] [CrossRef]
  46. Budden, K.F.; Shukla, S.D.; Rehman, S.F.; Bowerman, K.L.; Keely, S.; Hugenholtz, P.; Armstrong-James, D.P.H.; Adcock, I.M.; Chotirmall, S.H.; Chung, K.F. Functional Effects of the Microbiota in Chronic Respiratory Disease. Lancet Respir Med 2019, 7, 907–920. [Google Scholar] [CrossRef]
  47. Adolph, D.; Margraf, J. Differential Effects of Trait-like Emotion Regulation Use and Situational Emotion Regulation Ability across the Affective and Anxiety Disorders Spectrum: A Transdiagnostic Examination. Sci Rep 2024, 14, 26642. [Google Scholar] [CrossRef]
  48. Nardocci, M.; Leclerc, B.-S.; Louzada, M.-L.; Monteiro, C.A.; Batal, M.; Moubarac, J.-C. Consumption of Ultra-Processed Foods and Obesity in Canada. Canadian Journal of Public Health 2019, 110, 4–14. [Google Scholar] [CrossRef]
  49. da Rocha, B.R.S.; Rico-Campà, A.; Romanos-Nanclares, A.; Ciriza, E.; Barbosa, K.B.F.; Martínez-González, M.Á.; Martín-Calvo, N. Adherence to Mediterranean Diet Is Inversely Associated with the Consumption of Ultra-Processed Foods among Spanish Children: The SENDO Project. Public Health Nutr 2021, 24, 3294–3303. [Google Scholar] [CrossRef]
  50. Bonaccio, M.; Di Castelnuovo, A.; Costanzo, S.; Pounis, G.; Persichillo, M.; Cerletti, C.; Donati, M.B.; de Gaetano, G.; Iacoviello, L. Mediterranean-Type Diet Is Associated with Higher Psychological Resilience in a General Adult Population: Findings from the Moli-Sani Study. Eur J Clin Nutr 2018, 72, 154–160. [Google Scholar] [CrossRef]
  51. Martínez-González, M.A.; Gea, A.; Ruiz-Canela, M. The Mediterranean Diet and Cardiovascular Health. Circ Res 2019, 124, 779–798. [Google Scholar] [CrossRef]
  52. Tong, M.; Li, X.; Wegener Parfrey, L.; Roth, B.; Ippoliti, A.; Wei, B.; Borneman, J.; McGovern, D.P.B.; Frank, D.N.; Li, E. A Modular Organization of the Human Intestinal Mucosal Microbiota and Its Association with Inflammatory Bowel Disease. PLoS One 2013, 8, e80702. [Google Scholar] [CrossRef] [PubMed]
  53. World Health Organization International Organizations Unite on Critical Recommendations to Combat Drug-Resistant Infections and Prevent Staggering Number of Deaths Each Year.
  54. Zhang, L.; Wang, P.; Huang, J.; Xing, Y.; Wong, F.S.; Suo, J.; Wen, L. Gut Microbiota and Therapy for Obesity and Type 2 Diabetes. Front Endocrinol (Lausanne) 2024, 15. [Google Scholar] [CrossRef] [PubMed]
  55. Barber, T.M.; Kabisch, S.; Pfeiffer, A.F.H.; Weickert, M.O. The Effects of the Mediterranean Diet on Health and Gut Microbiota. Nutrients 2023, 15, 2150. [Google Scholar] [CrossRef]
  56. Hamamah, S.; Iatcu, O.C.; Covasa, M. Nutrition at the Intersection between Gut Microbiota Eubiosis and Effective Management of Type 2 Diabetes. Nutrients 2024, 16, 269. [Google Scholar] [CrossRef]
  57. van der Vossen, E.W.J.; Davids, M.; Bresser, L.R.F.; Galenkamp, H.; van den Born, B.-J.H.; Zwinderman, A.H.; Levin, E.; Nieuwdorp, M.; de Goffau, M.C. Gut Microbiome Transitions across Generations in Different Ethnicities in an Urban Setting—the HELIUS Study. Microbiome 2023, 11, 99. [Google Scholar] [CrossRef]
  58. Rosas-Plaza, S.; Hernández-Terán, A.; Navarro-Díaz, M.; Escalante, A.E.; Morales-Espinosa, R.; Cerritos, R. Human Gut Microbiome Across Different Lifestyles: From Hunter-Gatherers to Urban Populations. Front Microbiol 2022, 13. [Google Scholar] [CrossRef]
  59. Walker, R.L.; Vlamakis, H.; Lee, J.W.J.; Besse, L.A.; Xanthakis, V.; Vasan, R.S.; Shaw, S.Y.; Xavier, R.J. Population Study of the Gut Microbiome: Associations with Diet, Lifestyle, and Cardiometabolic Disease. Genome Med 2021, 13, 188. [Google Scholar] [CrossRef]
  60. Nagpal, R.; Shively, C.A.; Register, T.C.; Craft, S.; Yadav, H. Gut Microbiome-Mediterranean Diet Interactions in Improving Host Health. F1000Res 2019, 8, 699. [Google Scholar] [CrossRef]
  61. Myhrstad, M.C.W.; Tunsjø, H.; Charnock, C.; Telle-Hansen, V.H. Dietary Fiber, Gut Microbiota, and Metabolic Regulation—Current Status in Human Randomized Trials. Nutrients 2020, 12, 859. [Google Scholar] [CrossRef]
  62. Clemente-Suárez, V.J.; Beltrán-Velasco, A.I.; Redondo-Flórez, L.; Martín-Rodríguez, A.; Tornero-Aguilera, J.F. Global Impacts of Western Diet and Its Effects on Metabolism and Health: A Narrative Review. Nutrients 2023, 15, 2749. [Google Scholar] [CrossRef]
  63. Merra, G.; Noce, A.; Marrone, G.; Cintoni, M.; Tarsitano, M.G.; Capacci, A.; De Lorenzo, A. Influence of Mediterranean Diet on Human Gut Microbiota. Nutrients 2020, 13, 7. [Google Scholar] [CrossRef] [PubMed]
  64. Wu, G.D.; Compher, C.; Chen, E.Z.; Smith, S.A.; Shah, R.D.; Bittinger, K.; Chehoud, C.; Albenberg, L.G.; Nessel, L.; Gilroy, E. Comparative Metabolomics in Vegans and Omnivores Reveal Constraints on Diet-Dependent Gut Microbiota Metabolite Production. Gut 2016, 65, 63–72. [Google Scholar] [CrossRef] [PubMed]
  65. Rosés, C.; Cuevas-Sierra, A.; Quintana, S.; Riezu-Boj, J.I.; Martínez, J.A.; Milagro, F.I.; Barceló, A. Gut Microbiota Bacterial Species Associated with Mediterranean Diet-Related Food Groups in a Northern Spanish Population. Nutrients 2021, 13, 636. [Google Scholar] [CrossRef]
  66. Wang, R.; Chen, D.; Wang, F.; Fan, X.; Fan, C.; Tang, T.; Li, P.; Yang, M.; Zhao, Y.; Qi, K. An Insight into the Exploration of Proliferation of Antibiotic Resistance Genes in High-Fat Diet Induced Obesity Mice. Genomics 2021, 113, 2503–2512. [Google Scholar] [CrossRef] [PubMed]
  67. Jin, Q.; Black, A.; Kales, S.N.; Vattem, D.; Ruiz-Canela, M.; Sotos-Prieto, M. Metabolomics and Microbiomes as Potential Tools to Evaluate the Effects of the Mediterranean Diet. Nutrients 2019, 11, 207. [Google Scholar] [CrossRef]
  68. Xi, Y.; Jing, Z.; Wei, W.; Chun, Z.; Quan, Q.; Qing, Z.; Jiamin, X.; Shuwen, H. Inhibitory Effect of Sodium Butyrate on Colorectal Cancer Cells and Construction of the Related Molecular Network. BMC Cancer 2021, 21, 127. [Google Scholar] [CrossRef]
  69. Zhang, L.; Liu, C.; Jiang, Q.; Yin, Y. Butyrate in Energy Metabolism: There Is Still More to Learn. Trends in Endocrinology & Metabolism 2021, 32, 159–169. [Google Scholar] [CrossRef]
  70. Mangifesta, M.; Mancabelli, L.; Milani, C.; Gaiani, F.; de’Angelis, N.; de’Angelis, G.L.; van Sinderen, D.; Ventura, M.; Turroni, F. Mucosal Microbiota of Intestinal Polyps Reveals Putative Biomarkers of Colorectal Cancer. Sci Rep 2018, 8, 13974. [Google Scholar] [CrossRef]
  71. Johnson, A.J.; Vangay, P.; Al-Ghalith, G.A.; Hillmann, B.M.; Ward, T.L.; Shields-Cutler, R.R.; Kim, A.D.; Shmagel, A.K.; Syed, A.N.; Walter, J. Daily Sampling Reveals Personalized Diet-Microbiome Associations in Humans. Cell Host Microbe 2019, 25, 789–802.e5. [Google Scholar] [CrossRef]
  72. Calderón, D.; Cárdenas, P.A.; Prado-Vivar, B.; Graham, J.P.; Trueba, G. A Longitudinal Study of Dominant E. Coli Lineages and Antimicrobial Resistance in the Gut of Children Living in an Upper Middle-Income Country. J Glob Antimicrob Resist 2022, 29, 136–140. [Google Scholar] [CrossRef]
  73. Martinson, J.N. V; Pinkham, N. V; Peters, G.W.; Cho, H.; Heng, J.; Rauch, M.; Broadaway, S.C.; Walk, S.T. Rethinking Gut Microbiome Residency and the Enterobacteriaceae in Healthy Human Adults. ISME J 2019, 13, 2306–2318. [Google Scholar] [CrossRef] [PubMed]
  74. Checcucci, A.; Luise, D.; Modesto, M.; Correa, F.; Bosi, P.; Mattarelli, P.; Trevisi, P. Assessment of Biolog EcoplateTM Method for Functional Metabolic Diversity of Aerotolerant Pig Fecal Microbiota. Appl Microbiol Biotechnol 2021, 105, 6033–6045. [Google Scholar] [CrossRef] [PubMed]
  75. Benítez-Páez, A.; Portune, K.J.; Sanz, Y. Species-Level Resolution of 16S RRNA Gene Amplicons Sequenced through the MinIONTM Portable Nanopore Sequencer. Gigascience 2016, 5, 4. [Google Scholar] [CrossRef] [PubMed]
  76. Serra-Majem, L.; Ribas, L.; Ngo, J.; Ortega, R.M.; García, A.; Pérez-Rodrigo, C.; Aranceta, J. Food, Youth and the Mediterranean Diet in Spain. Development of KIDMED, Mediterranean Diet Quality Index in Children and Adolescents. Public Health Nutr 2004, 7, 931–935. [Google Scholar] [CrossRef]
  77. Martinez-Perez, C.; Daimiel, L.; Climent-Mainar, C.; Martínez-González, M.Á.; Salas-Salvadó, J.; Corella, D.; Schröder, H.; Martinez, J.A.; Alonso-Gómez, Á.M.; Wärnberg, J. Integrative Development of a Short Screening Questionnaire of Highly Processed Food Consumption (SQ-HPF). International Journal of Behavioral Nutrition and Physical Activity 2022, 19, 6. [Google Scholar] [CrossRef]
  78. Garland, J.L. Analytical Approaches to the Characterization of Samples of Microbial Communities Using Patterns of Potential C Source Utilization. Soil Biol Biochem 1996, 28, 213–221. [Google Scholar] [CrossRef]
  79. Sofo, A.; Ricciuti, P. A Standardized Method for Estimating the Functional Diversity of Soil Bacterial Community by Biolog® EcoPlatesTM Assay—The Case Study of a Sustainable Olive Orchard. Applied Sciences 2019, 9, 4035. [Google Scholar] [CrossRef]
  80. Marina Robas Mora; Pedro Antonio Jiménez Gómez; Carolina Valbuena; Agustín Probanza Effect of the Type of Vitis Vinifera Cultivation in the Cenophenoresistome and Metabolic Profiling (CLPP) of Edaphic Bacterial Communities. J Agric Sci Technol A 2017, 7. [CrossRef]
  81. Heintz-Buschart, A.; Wilmes, P. Human Gut Microbiome: Function Matters. Trends Microbiol 2018, 26, 563–574. [Google Scholar] [CrossRef]
  82. Ellis, J.L.; Karl, J.P.; Oliverio, A.M.; Fu, X.; Soares, J.W.; Wolfe, B.E.; Hernandez, C.J.; Mason, J.B.; Booth, S.L. Dietary Vitamin K Is Remodeled by Gut Microbiota and Influences Community Composition. Gut Microbes 2021, 13. [Google Scholar] [CrossRef]
  83. Lamichhane, S.; Sen, P.; Dickens, A.M.; Orešič, M.; Bertram, H.C. Gut Metabolome Meets Microbiome: A Methodological Perspective to Understand the Relationship between Host and Microbe. Methods 2018, 149, 3–12. [Google Scholar] [CrossRef] [PubMed]
  84. Derovs, A.; Laivacuma, S.; Krumina, A. Targeting Microbiota: What Do We Know about It at Present? Medicina (B Aires) 2019, 55, 459. [Google Scholar] [CrossRef] [PubMed]
  85. Levy, M.; Blacher, E.; Elinav, E. Microbiome, Metabolites and Host Immunity. Curr Opin Microbiol 2017, 35, 8–15. [Google Scholar] [CrossRef] [PubMed]
  86. Budden, K.F.; Shukla, S.D.; Rehman, S.F.; Bowerman, K.L.; Keely, S.; Hugenholtz, P.; Armstrong-James, D.P.H.; Adcock, I.M.; Chotirmall, S.H.; Chung, K.F. Functional Effects of the Microbiota in Chronic Respiratory Disease. Lancet Respir Med 2019, 7, 907–920. [Google Scholar] [CrossRef] [PubMed]
  87. Adolph, D.; Margraf, J. Differential Effects of Trait-like Emotion Regulation Use and Situational Emotion Regulation Ability across the Affective and Anxiety Disorders Spectrum: A Transdiagnostic Examination. Sci Rep 2024, 14, 26642. [Google Scholar] [CrossRef]
  88. Nardocci, M.; Leclerc, B.-S.; Louzada, M.-L.; Monteiro, C.A.; Batal, M.; Moubarac, J.-C. Consumption of Ultra-Processed Foods and Obesity in Canada. Canadian Journal of Public Health 2019, 110, 4–14. [Google Scholar] [CrossRef]
  89. da Rocha, B.R.S.; Rico-Campà, A.; Romanos-Nanclares, A.; Ciriza, E.; Barbosa, K.B.F.; Martínez-González, M.Á.; Martín-Calvo, N. Adherence to Mediterranean Diet Is Inversely Associated with the Consumption of Ultra-Processed Foods among Spanish Children: The SENDO Project. Public Health Nutr 2021, 24, 3294–3303. [Google Scholar] [CrossRef]
  90. Bonaccio, M.; Di Castelnuovo, A.; Costanzo, S.; Pounis, G.; Persichillo, M.; Cerletti, C.; Donati, M.B.; de Gaetano, G.; Iacoviello, L. Mediterranean-Type Diet Is Associated with Higher Psychological Resilience in a General Adult Population: Findings from the Moli-Sani Study. Eur J Clin Nutr 2018, 72, 154–160. [Google Scholar] [CrossRef]
  91. Martínez-González, M.A.; Gea, A.; Ruiz-Canela, M. The Mediterranean Diet and Cardiovascular Health. Circ Res 2019, 124, 779–798. [Google Scholar] [CrossRef]
  92. Tong, M.; Li, X.; Wegener Parfrey, L.; Roth, B.; Ippoliti, A.; Wei, B.; Borneman, J.; McGovern, D.P.B.; Frank, D.N.; Li, E. A Modular Organization of the Human Intestinal Mucosal Microbiota and Its Association with Inflammatory Bowel Disease. PLoS One 2013, 8, e80702. [Google Scholar] [CrossRef]
  93. World Health Organization International Organizations Unite on Critical Recommendations to Combat Drug-Resistant Infections and Prevent Staggering Number of Deaths Each Year.
  94. Zhang, L.; Wang, P.; Huang, J.; Xing, Y.; Wong, F.S.; Suo, J.; Wen, L. Gut Microbiota and Therapy for Obesity and Type 2 Diabetes. Front Endocrinol (Lausanne) 2024, 15. [Google Scholar] [CrossRef] [PubMed]
  95. Barber, T.M.; Kabisch, S.; Pfeiffer, A.F.H.; Weickert, M.O. The Effects of the Mediterranean Diet on Health and Gut Microbiota. Nutrients 2023, 15, 2150. [Google Scholar] [CrossRef] [PubMed]
  96. Hamamah, S.; Iatcu, O.C.; Covasa, M. Nutrition at the Intersection between Gut Microbiota Eubiosis and Effective Management of Type 2 Diabetes. Nutrients 2024, 16, 269. [Google Scholar] [CrossRef] [PubMed]
  97. van der Vossen, E.W.J.; Davids, M.; Bresser, L.R.F.; Galenkamp, H.; van den Born, B.-J.H.; Zwinderman, A.H.; Levin, E.; Nieuwdorp, M.; de Goffau, M.C. Gut Microbiome Transitions across Generations in Different Ethnicities in an Urban Setting—the HELIUS Study. Microbiome 2023, 11, 99. [Google Scholar] [CrossRef] [PubMed]
  98. Rosas-Plaza, S.; Hernández-Terán, A.; Navarro-Díaz, M.; Escalante, A.E.; Morales-Espinosa, R.; Cerritos, R. Human Gut Microbiome Across Different Lifestyles: From Hunter-Gatherers to Urban Populations. Front Microbiol 2022, 13. [Google Scholar] [CrossRef]
  99. Walker, R.L.; Vlamakis, H.; Lee, J.W.J.; Besse, L.A.; Xanthakis, V.; Vasan, R.S.; Shaw, S.Y.; Xavier, R.J. Population Study of the Gut Microbiome: Associations with Diet, Lifestyle, and Cardiometabolic Disease. Genome Med 2021, 13, 188. [Google Scholar] [CrossRef]
  100. Nagpal, R.; Shively, C.A.; Register, T.C.; Craft, S.; Yadav, H. Gut Microbiome-Mediterranean Diet Interactions in Improving Host Health. F1000Res 2019, 8, 699. [Google Scholar] [CrossRef]
  101. Myhrstad, M.C.W.; Tunsjø, H.; Charnock, C.; Telle-Hansen, V.H. Dietary Fiber, Gut Microbiota, and Metabolic Regulation—Current Status in Human Randomized Trials. Nutrients 2020, 12, 859. [Google Scholar] [CrossRef]
  102. Clemente-Suárez, V.J.; Beltrán-Velasco, A.I.; Redondo-Flórez, L.; Martín-Rodríguez, A.; Tornero-Aguilera, J.F. Global Impacts of Western Diet and Its Effects on Metabolism and Health: A Narrative Review. Nutrients 2023, 15, 2749. [Google Scholar] [CrossRef]
  103. Merra, G.; Noce, A.; Marrone, G.; Cintoni, M.; Tarsitano, M.G.; Capacci, A.; De Lorenzo, A. Influence of Mediterranean Diet on Human Gut Microbiota. Nutrients 2020, 13, 7. [Google Scholar] [CrossRef]
  104. Wu, G.D.; Compher, C.; Chen, E.Z.; Smith, S.A.; Shah, R.D.; Bittinger, K.; Chehoud, C.; Albenberg, L.G.; Nessel, L.; Gilroy, E. Comparative Metabolomics in Vegans and Omnivores Reveal Constraints on Diet-Dependent Gut Microbiota Metabolite Production. Gut 2016, 65, 63–72. [Google Scholar] [CrossRef] [PubMed]
  105. Rosés, C.; Cuevas-Sierra, A.; Quintana, S.; Riezu-Boj, J.I.; Martínez, J.A.; Milagro, F.I.; Barceló, A. Gut Microbiota Bacterial Species Associated with Mediterranean Diet-Related Food Groups in a Northern Spanish Population. Nutrients 2021, 13, 636. [Google Scholar] [CrossRef] [PubMed]
  106. Wang, R.; Chen, D.; Wang, F.; Fan, X.; Fan, C.; Tang, T.; Li, P.; Yang, M.; Zhao, Y.; Qi, K. An Insight into the Exploration of Proliferation of Antibiotic Resistance Genes in High-Fat Diet Induced Obesity Mice. Genomics 2021, 113, 2503–2512. [Google Scholar] [CrossRef]
  107. Jin, Q.; Black, A.; Kales, S.N.; Vattem, D.; Ruiz-Canela, M.; Sotos-Prieto, M. Metabolomics and Microbiomes as Potential Tools to Evaluate the Effects of the Mediterranean Diet. Nutrients 2019, 11, 207. [Google Scholar] [CrossRef] [PubMed]
  108. Xi, Y.; Jing, Z.; Wei, W.; Chun, Z.; Quan, Q.; Qing, Z.; Jiamin, X.; Shuwen, H. Inhibitory Effect of Sodium Butyrate on Colorectal Cancer Cells and Construction of the Related Molecular Network. BMC Cancer 2021, 21, 127. [Google Scholar] [CrossRef]
  109. Zhang, L.; Liu, C.; Jiang, Q.; Yin, Y. Butyrate in Energy Metabolism: There Is Still More to Learn. Trends in Endocrinology & Metabolism 2021, 32, 159–169. [Google Scholar] [CrossRef]
  110. Mangifesta, M.; Mancabelli, L.; Milani, C.; Gaiani, F.; de’Angelis, N.; de’Angelis, G.L.; van Sinderen, D.; Ventura, M.; Turroni, F. Mucosal Microbiota of Intestinal Polyps Reveals Putative Biomarkers of Colorectal Cancer. Sci Rep 2018, 8, 13974. [Google Scholar] [CrossRef]
  111. Johnson, A.J.; Vangay, P.; Al-Ghalith, G.A.; Hillmann, B.M.; Ward, T.L.; Shields-Cutler, R.R.; Kim, A.D.; Shmagel, A.K.; Syed, A.N.; Walter, J. Daily Sampling Reveals Personalized Diet-Microbiome Associations in Humans. Cell Host Microbe 2019, 25, 789–802.e5. [Google Scholar] [CrossRef]
  112. Calderón, D.; Cárdenas, P.A.; Prado-Vivar, B.; Graham, J.P.; Trueba, G. A Longitudinal Study of Dominant E. Coli Lineages and Antimicrobial Resistance in the Gut of Children Living in an Upper Middle-Income Country. J Glob Antimicrob Resist 2022, 29, 136–140. [Google Scholar] [CrossRef]
  113. Martinson, J.N. V; Pinkham, N. V; Peters, G.W.; Cho, H.; Heng, J.; Rauch, M.; Broadaway, S.C.; Walk, S.T. Rethinking Gut Microbiome Residency and the Enterobacteriaceae in Healthy Human Adults. ISME J 2019, 13, 2306–2318. [Google Scholar] [CrossRef]
  114. Checcucci, A.; Luise, D.; Modesto, M.; Correa, F.; Bosi, P.; Mattarelli, P.; Trevisi, P. Assessment of Biolog EcoplateTM Method for Functional Metabolic Diversity of Aerotolerant Pig Fecal Microbiota. Appl Microbiol Biotechnol 2021, 105, 6033–6045. [Google Scholar] [CrossRef]
  115. Benítez-Páez, A.; Portune, K.J.; Sanz, Y. Species-Level Resolution of 16S RRNA Gene Amplicons Sequenced through the MinIONTM Portable Nanopore Sequencer. Gigascience 2016, 5, 4. [Google Scholar] [CrossRef] [PubMed]
  116. Serra-Majem, L.; Ribas, L.; Ngo, J.; Ortega, R.M.; García, A.; Pérez-Rodrigo, C.; Aranceta, J. Food, Youth and the Mediterranean Diet in Spain. Development of KIDMED, Mediterranean Diet Quality Index in Children and Adolescents. Public Health Nutr 2004, 7, 931–935. [Google Scholar] [CrossRef] [PubMed]
  117. Martinez-Perez, C.; Daimiel, L.; Climent-Mainar, C.; Martínez-González, M.Á.; Salas-Salvadó, J.; Corella, D.; Schröder, H.; Martinez, J.A.; Alonso-Gómez, Á.M.; Wärnberg, J. Integrative Development of a Short Screening Questionnaire of Highly Processed Food Consumption (SQ-HPF). International Journal of Behavioral Nutrition and Physical Activity 2022, 19, 6. [Google Scholar] [CrossRef] [PubMed]
  118. Garland, J.L. Analytical Approaches to the Characterization of Samples of Microbial Communities Using Patterns of Potential C Source Utilization. Soil Biol Biochem 1996, 28, 213–221. [Google Scholar] [CrossRef]
  119. Sofo, A.; Ricciuti, P. A Standardized Method for Estimating the Functional Diversity of Soil Bacterial Community by Biolog® EcoPlatesTM Assay—The Case Study of a Sustainable Olive Orchard. Applied Sciences 2019, 9, 4035. [Google Scholar] [CrossRef]
  120. Marina Robas Mora; Pedro Antonio Jiménez Gómez; Carolina Valbuena; Agustín Probanza Effect of the Type of Vitis Vinifera Cultivation in the Cenophenoresistome and Metabolic Profiling (CLPP) of Edaphic Bacterial Communities. J Agric Sci Technol A 2017, 7. [CrossRef]
Figure 1. Bar chart for the two MD adherence groups represented on the X-axis, measured after 144 hours. The Y-axis shows the mean values of the Shannon-Weaver index, with error bars indicating variability within each group.
Preprints 143961 g001
Figure 2. (A) Loading factor plot under aerobic conditions. The X-axis (Component 1) represents the first principal component, which explains 34.87% of the variance, while the Y-axis (Component 2) represents the second principal component, explaining 23.48% of the variance. The data points are labeled (AML, CR, TS, CAZ, AK, CN), indicating the different antibiotics contributing to these components. (B) The PCA under aerobic conditions shows the points based on the LowMD and HighMD groups, as indicated in the legend. The ellipses represent confidence intervals containing approximately 95% of the observations for each group, thus showing the clustering of data points within each group.
Preprints 143961 g002
Figure 3. (A) Loading factor plot under anaerobic conditions. The X-axis (Component 1) represents the first principal component, which explains 32.38% of the variance, while the Y-axis (Component 2) represents the second principal component, explaining 15.37% of the variance. The data points are labeled (IMI, IMI+EDTA, FOX, AZM, CD, CIP, MTZ, RD, AUG, LEV), indicating the different antibiotics contributing to these components. (B) The PCA under anaerobic conditions shows the points differentiated between the LowMD and HighMD groups, as indicated in the legend. The ellipses represent the confidence intervals containing approximately 95% of the observations for each group.
Preprints 143961 g003
Figure 4. Relative abundance in the gut microbiota at the family level. The Y-axis represents the proportion within each microbial community, with values ranging from 0.00 to 1.00 (fractional). The X-axis differs between two groups. (A) Shows the comparison of relative abundances between LowMD and HighMD. (B) Shows the comparison of relative abundances between LowUPF and HighUPF. The different colors represent the 12 most significant families, listed in the legend.
Preprints 143961 g004
Figure 5. β-diversity is presented with a PCoA plot. The PCoAs on the left were derived using Bray-Curtis, while those on the right were obtained using Jaccard. The multidimensional components are reduced to two, represented on the Y-axis (Axis 2) and the X-axis (Axis 1). Both axes represent the variability of the data. Each point on the plot represents an individual sample. The position of the points reflects the microbial composition of each sample. Points of different colors represent different groups, as shown in the legends: (A) (LowMD vs. HighMD) and (B) (LowUPF vs. HighUPF). The ellipses surrounding the points represent 95% confidence intervals for each group, indicating dispersion and similarity.
Preprints 143961 g005
Figure 6. The Volcano plot presents the fold change coefficient on the X-axis between the HighMD and LowMD groups. Positive values indicate higher abundance in the HighMD group, while negative values indicate higher abundance in the LowMD group. The Y-axis shows the value of –log10(p-value), with values greater than 1 indicating statistically significant differences between groups.
Preprints 143961 g006
Figure 7. The Volcano plot graph shows the fold change coefficient on the X-axis between the two compared groups: HighUPF and LowUPF. Positive values indicate higher abundance in the HighUPF group, while negative values indicate higher abundance in the LowUPF group. The Y-axis shows the value –log10(p-value), with values greater than 1 indicating statistically significant differences between the groups.
Preprints 143961 g007
Disclaimer/Publisher’s Note: The statements, opinions and data contained in all publications are solely those of the individual author(s) and contributor(s) and not of MDPI and/or the editor(s). MDPI and/or the editor(s) disclaim responsibility for any injury to people or property resulting from any ideas, methods, instructions or products referred to in the content.
Copyright: This open access article is published under a Creative Commons CC BY 4.0 license, which permit the free download, distribution, and reuse, provided that the author and preprint are cited in any reuse.
Prerpints.org logo

Preprints.org is a free preprint server supported by MDPI in Basel, Switzerland.

Subscribe

Disclaimer

Terms of Use

Privacy Policy

Privacy Settings

© 2025 MDPI (Basel, Switzerland) unless otherwise stated