Preprint
Article

This version is not peer-reviewed.

Microbial Signatures Mapping of High and Normal Blood Glucose Participants in the Generation 100 Study

A peer-reviewed article of this preprint also exists.

Submitted:

29 September 2025

Posted:

30 October 2025

You are already at the latest version

Abstract

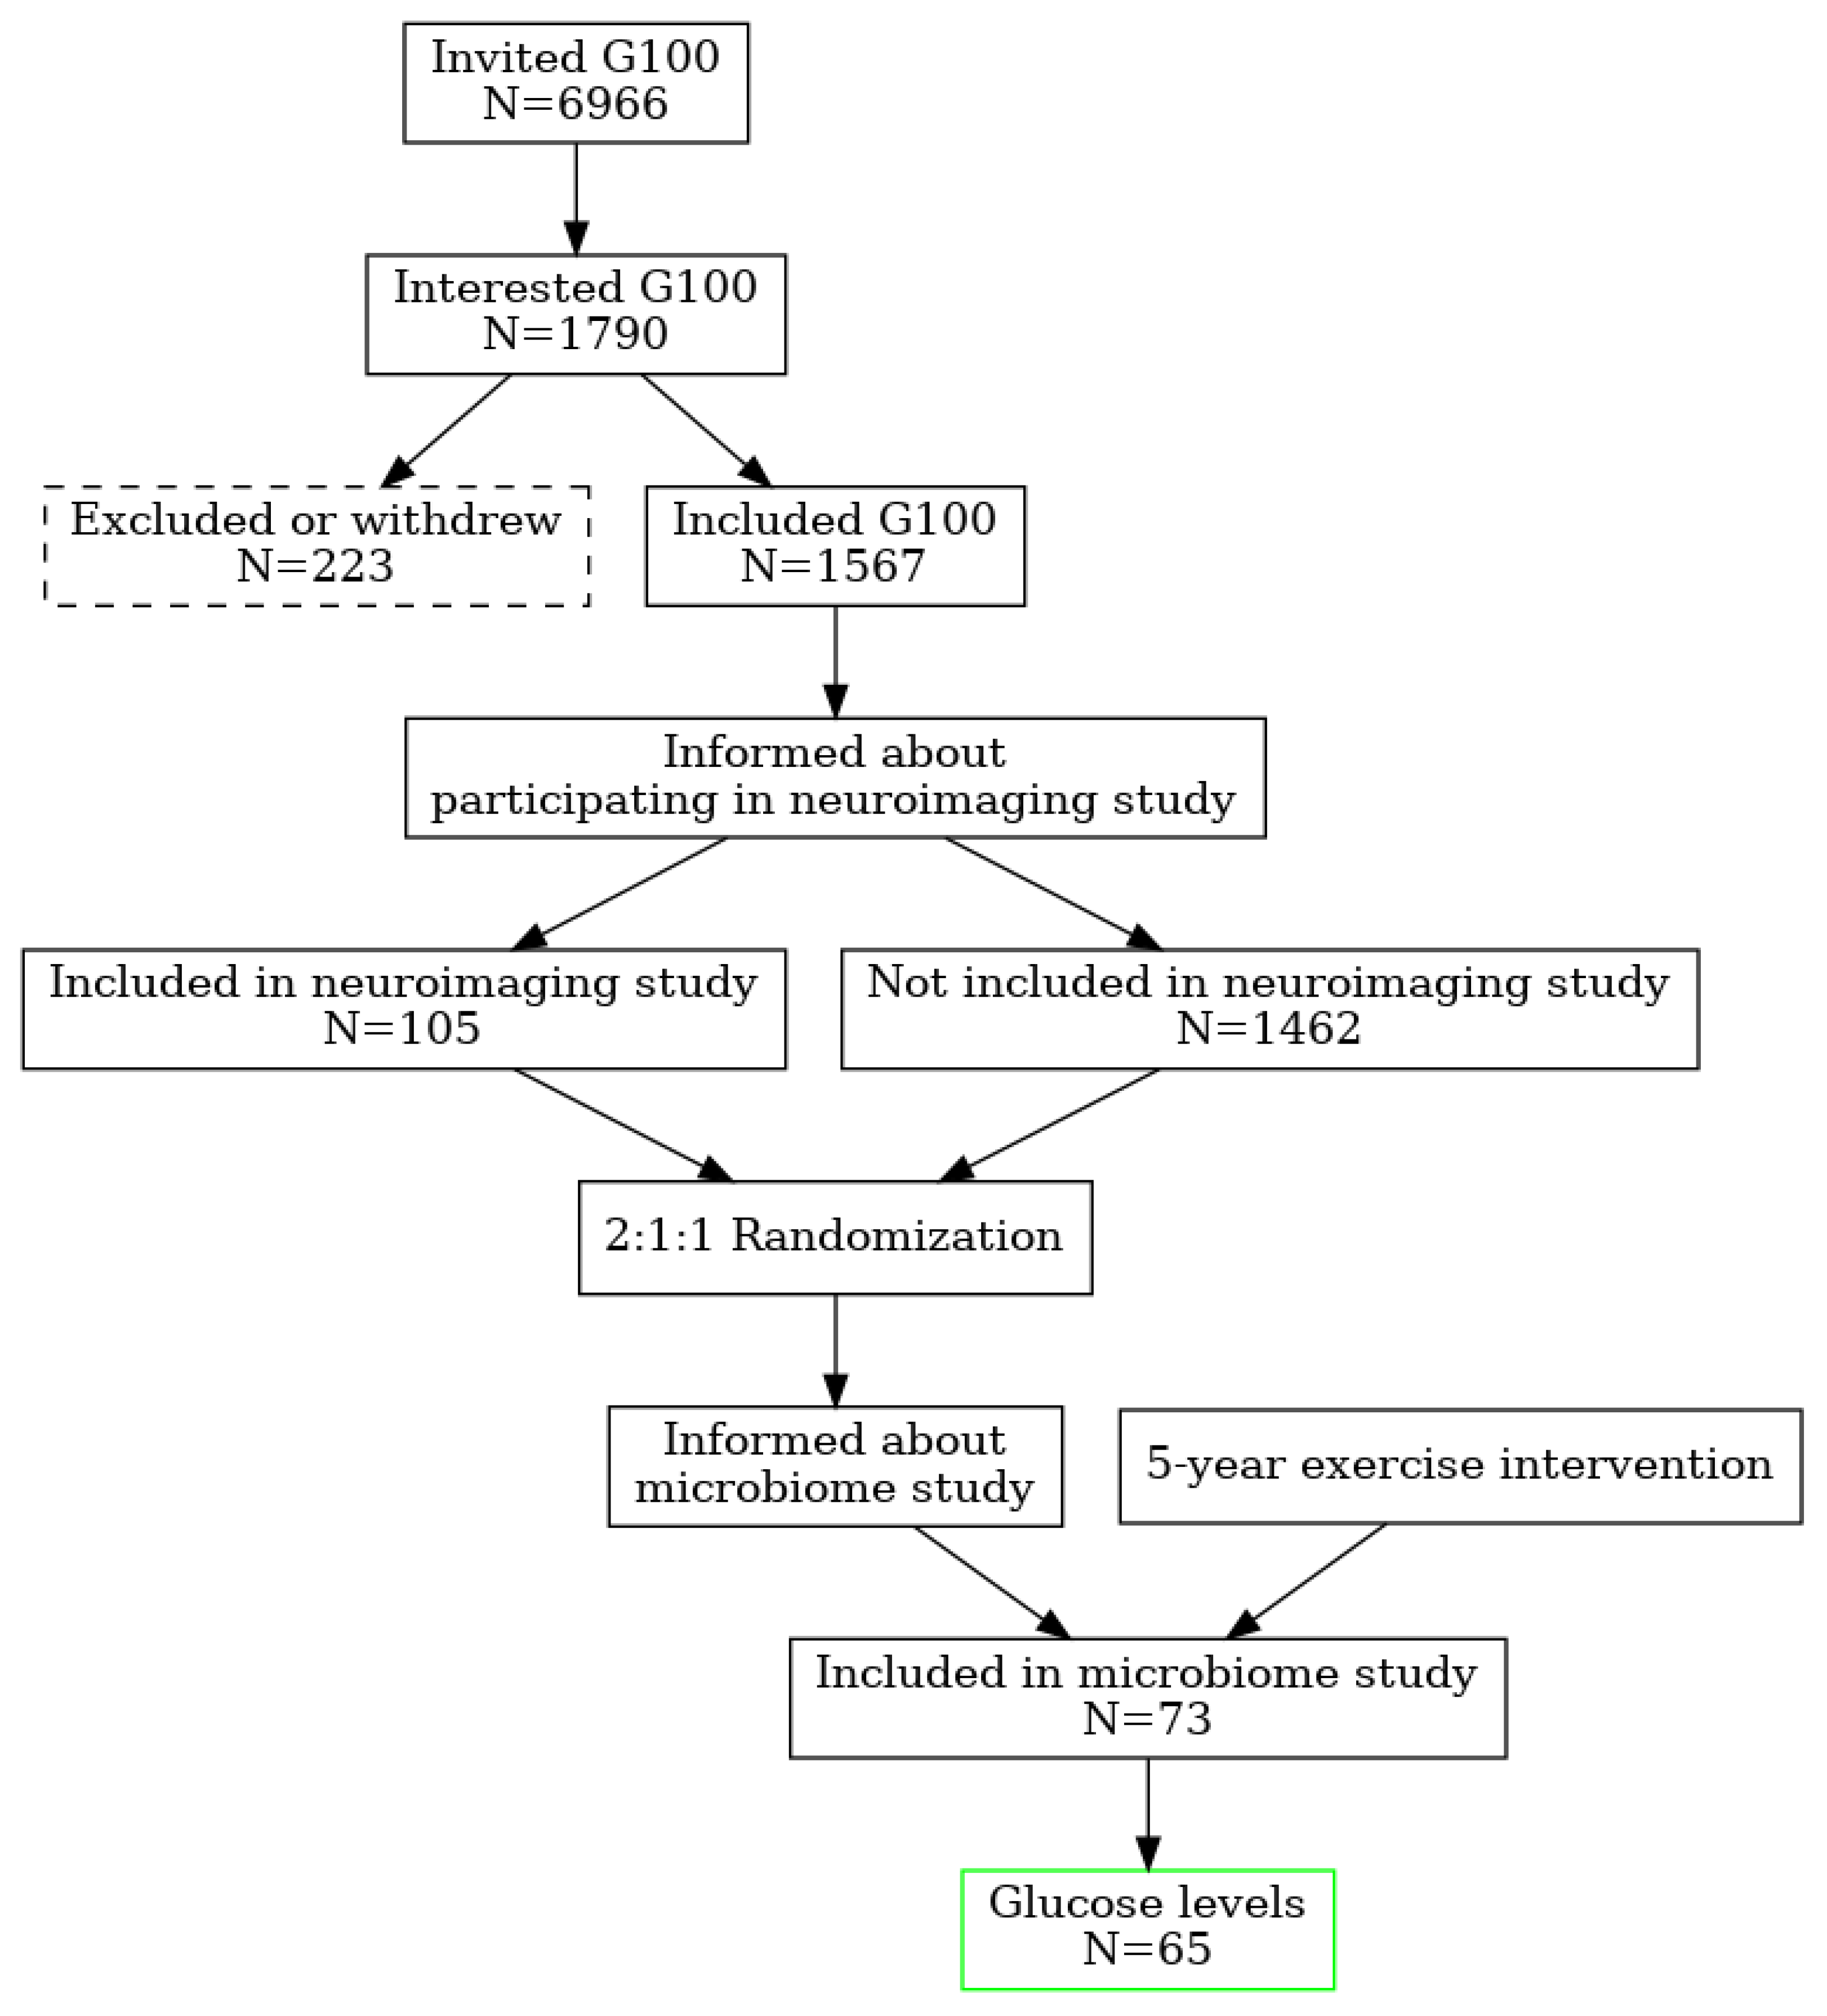
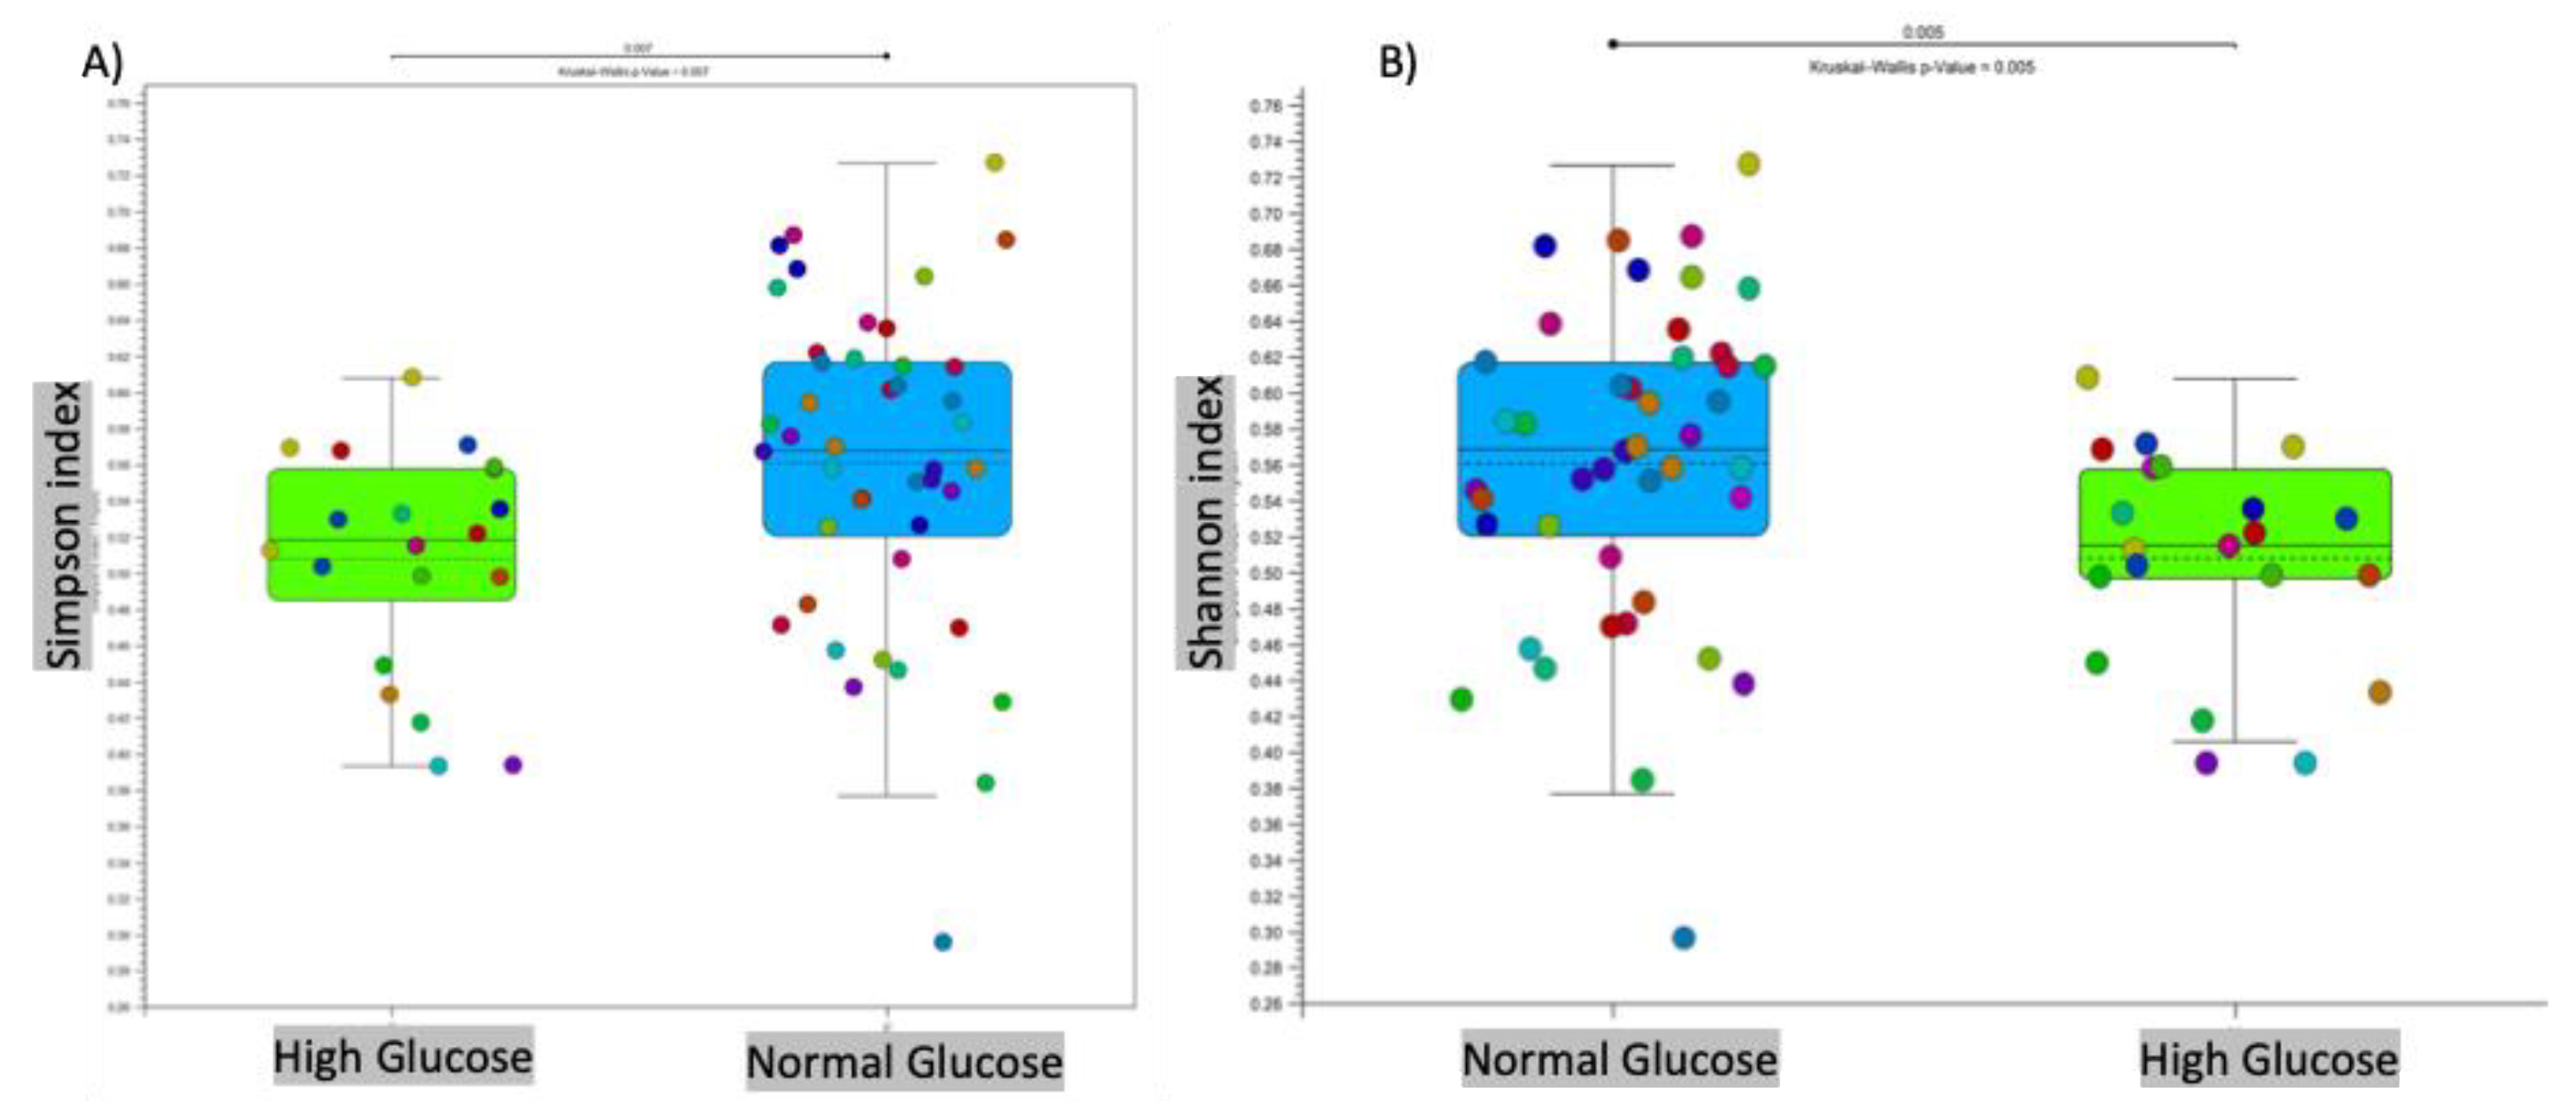
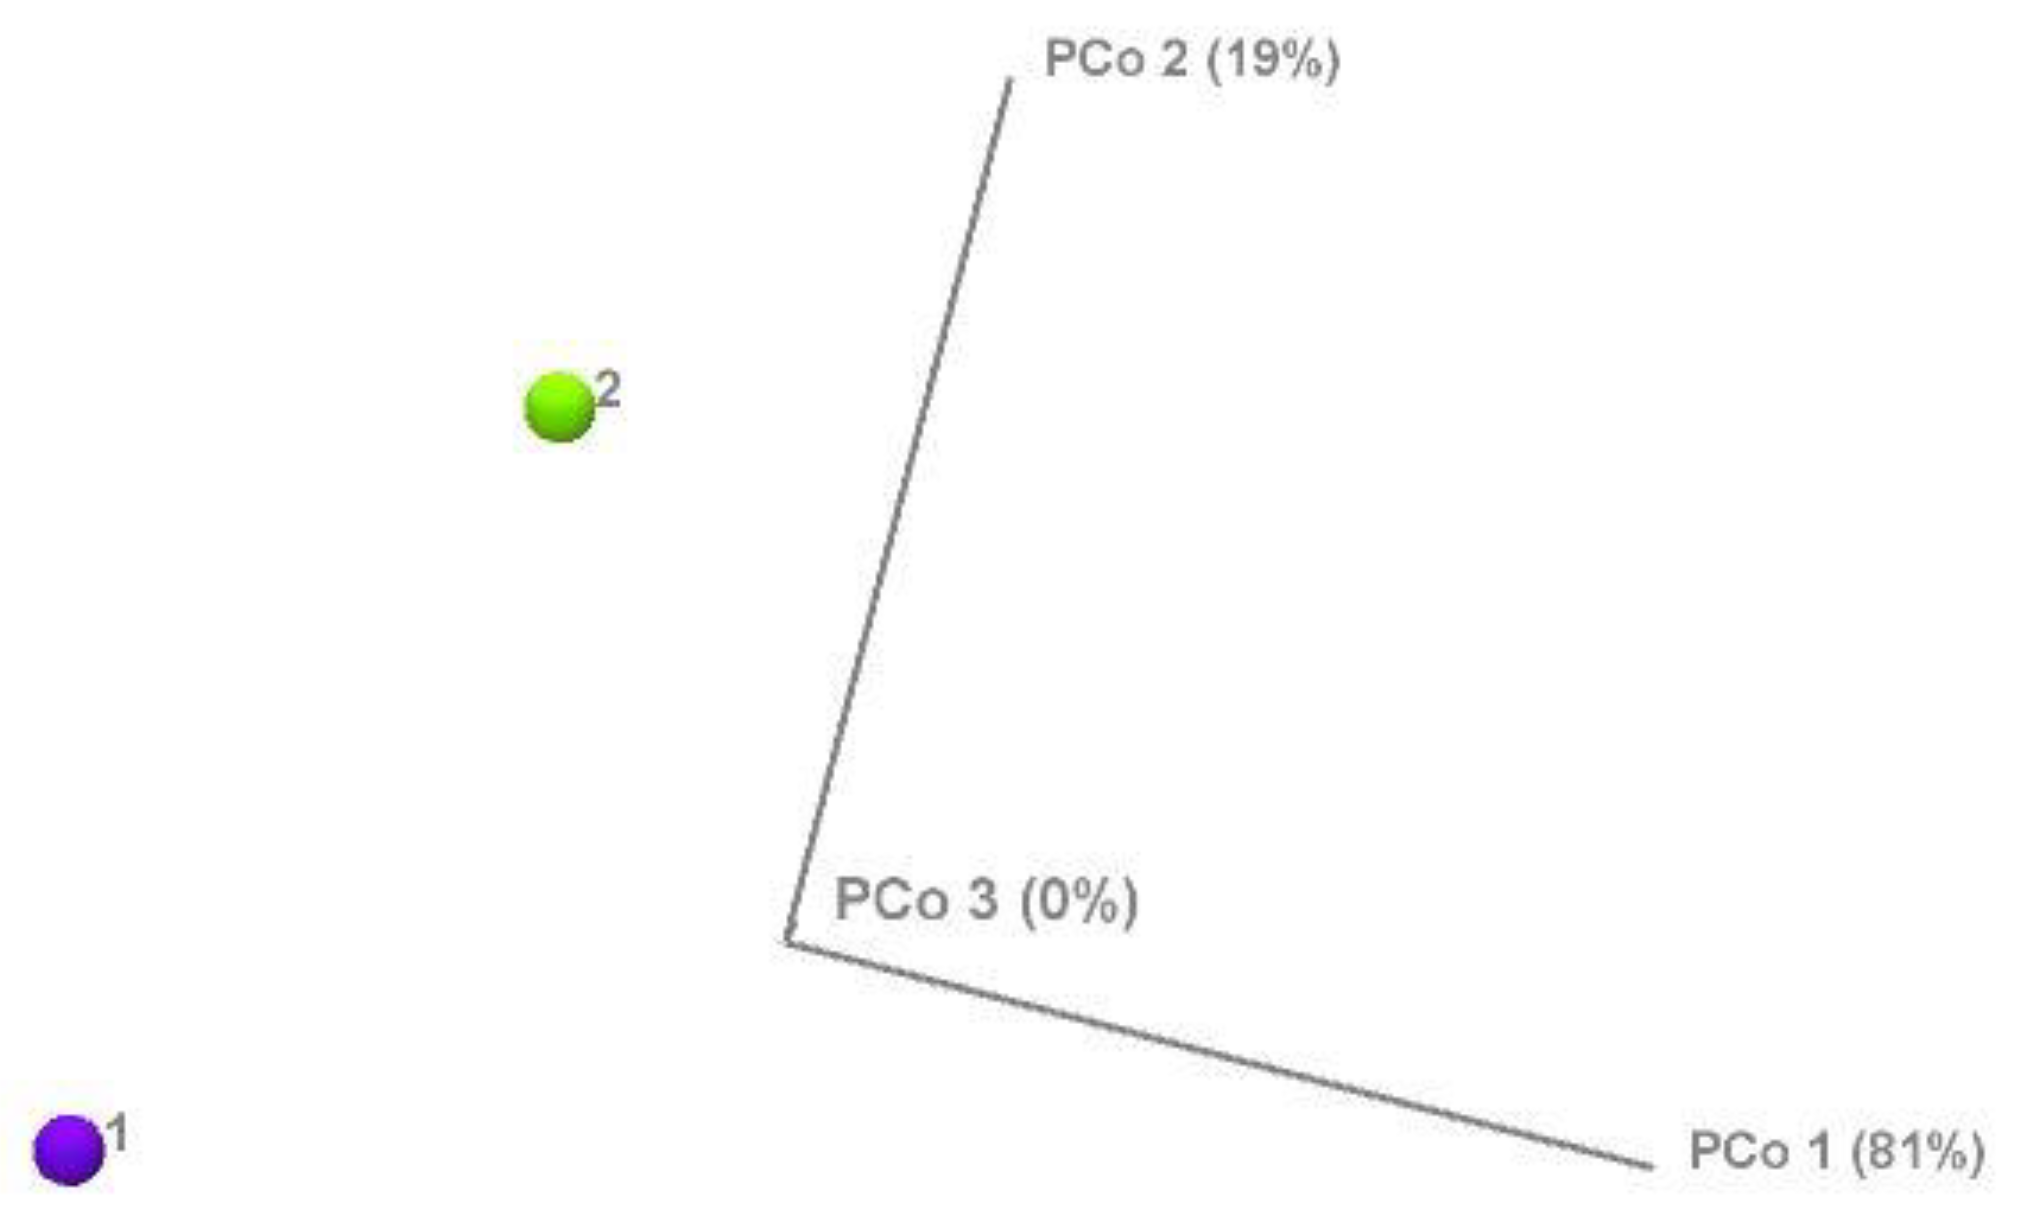
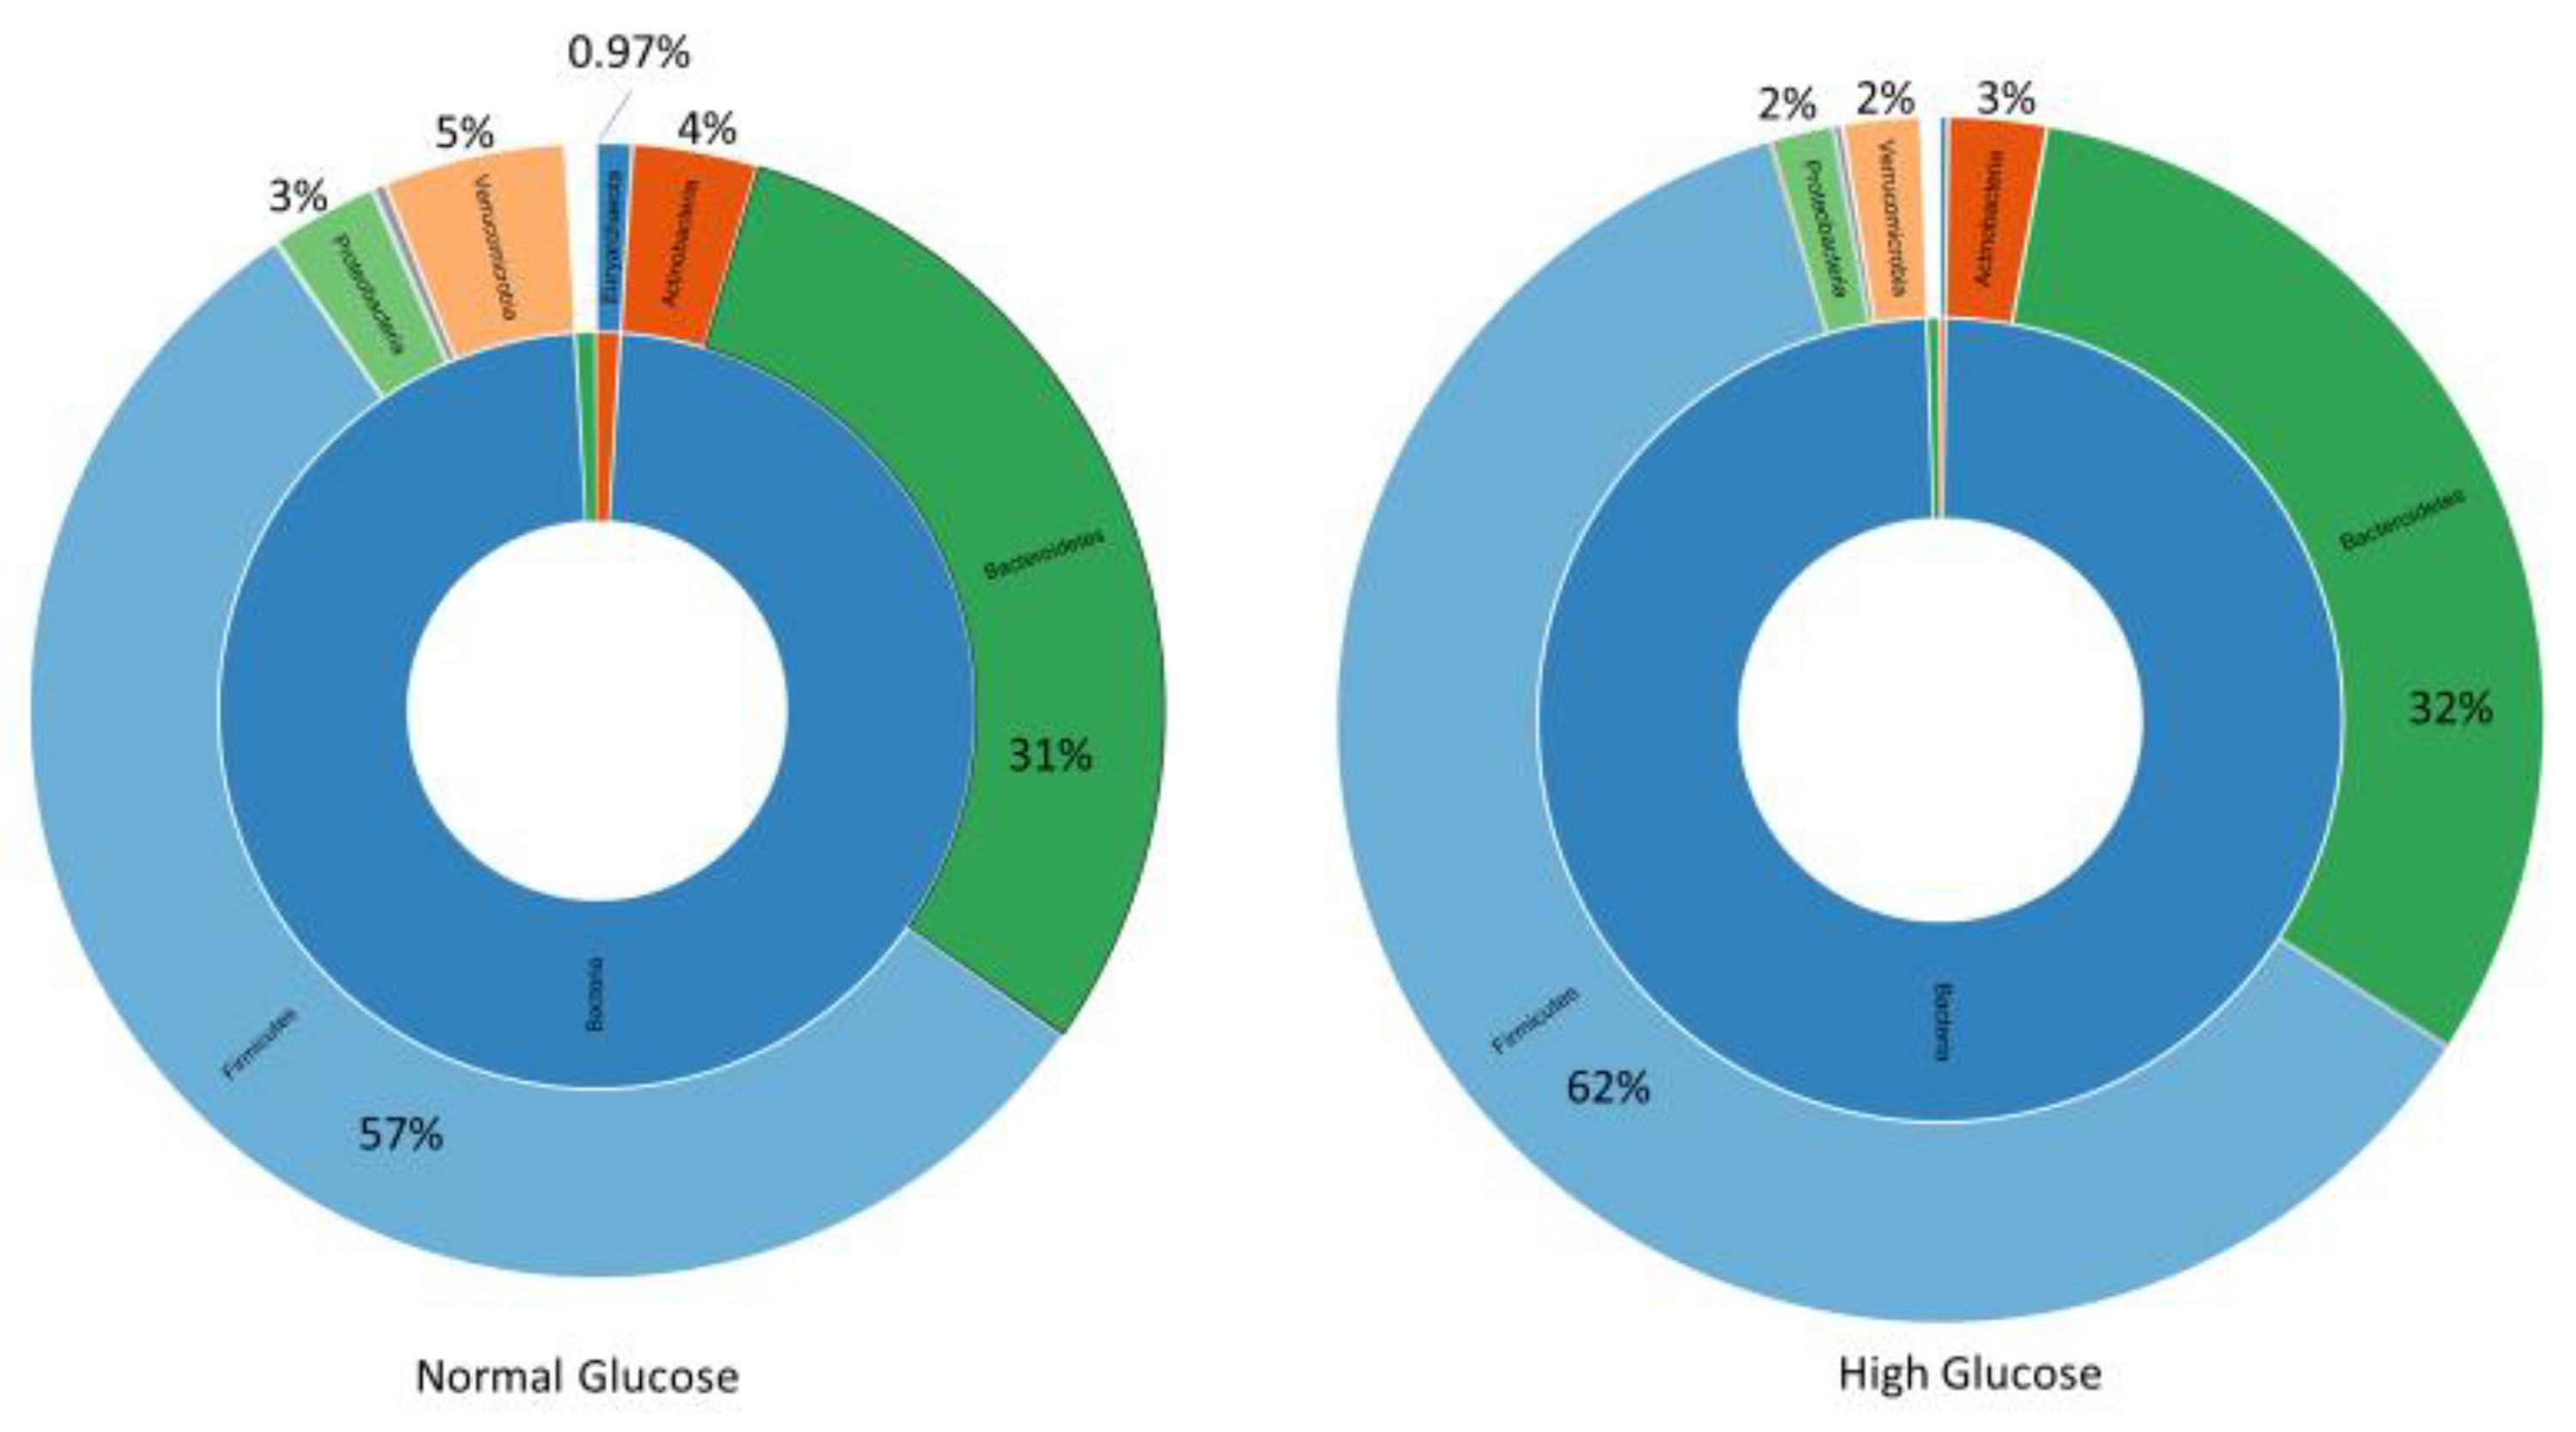
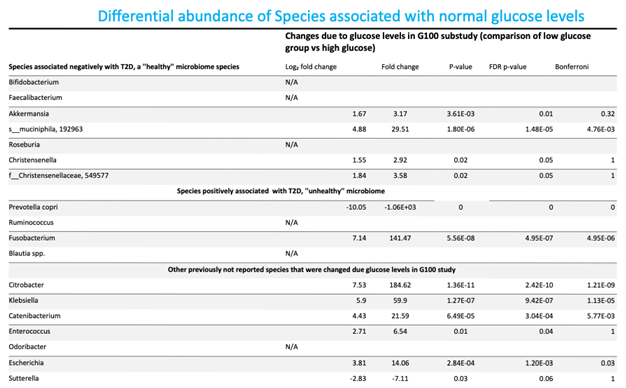
Intestinal dysbiosis has been linked to metabolic disorders, including insulin resistance and Type 2 Diabetes Mellitus (T2DM). T2DM typically follows a prediabetic stage, during which insulin resistance develops. During early stages of T2DM, its development can be corrected, thus potentially preventing or delaying the onset of the disease. This study aimed to compare the gut microbiome of individuals with elevated fasting blood glucose to that of individuals with glucose levels within the normal range. This study involved 65 older adults (ages 76–83 years) enrolled from the randomized controlled trial entitled the “Generation 100 Study”, all of whom consented to provide their gut microbiome samples. We employed a high-throughput sequencing of the bacterial 16S rRNA gene to obtain metagenomic microbial profiles for all participants. These profiles were then correlated with clinical measures. Overall, microbial alpha diversity was significantly reduced in the high glucose group. We have also observed distinct patterns of microbial beta diversity between high and normal glucose groups. At the phylum level, we found that Synergistes, Elusimicobia, Euryarchaeota, Verrucomicrobia, and Proteobacteria were all significantly decreased in participants with high blood glucose. Additionally, P. copri (ASV 909561) was significantly elevated (10-fold increase) in the high glucose groups, suggesting that it may serve as an early T2DM marker. In contrast to prior reports on the Fusobacterium genus, we found that it was significantly increased in the normal glucose group, with a significant 151-fold increase compared to the high glucose group. Our results indicate significant changes in the microbiome that may provide valuable insights for early intervention in pre-diabetic states.

Keywords: 
;  ;  ;  

1. Introduction

Type 2 diabetes (T2DM) is a growing public health concern with serious complications, including kidney damage, blindness, cardiovascular disease and mortality. It is an age-related metabolic disease often considered inflammatory as various cytokine profiles are associated with its progression [1,2]. A strain of Prevotella copri, which has the capacity to produce branched-chain amino acids, was more commonly observed in gut microbiome of people affected with type 2 diabetes [3]. Moreover, the circulatory levels of these branched-chain amino acids were linked with higher risk of T2D [4]. Unequivocally, the decade of research on the gut microbiome has clearly shown common patterns in microbial species depleted or increased in prediabetic and Type II diabetic people compared with healthy individuals[5]. Interestingly, it is difficult to establish cause and effect when it comes to the gut microbiome and insulin resistance development. One possibility is that dietary choices encourage the growth of less beneficial bacterial strains that rely on dietary by-products to thrive. Alternatively, a person may become colonized with unfriendly bacteria that shift the microbiome balance toward producing unhealthy metabolites, which in turn can influence dietary preferences through gut–brain signaling.
Here we present a secondary analysis from an exercise intervention study in which we invited men and women born between 1936-1942 (n=73) to a randomized 5-year, twice weekly, either high intensity interval training (HIITI or moderate/medium intensity continuous training (MICT) sessions, or control group following physical activity as per national recommendations[6]. Participants in the HIIT group were asked to perform 2 weekly exercise sessions of 40 min duration each. Participants in the moderate intensity continuous training group (MICT) were asked to perform 2 weekly exercise sessions of 50 minutes [7].
Participants were subjected to clinical examinations, physical tests, questionnaires and gut microbiome sampling after 5 years at the end of the exercise intervention. Given the known connections between the gut microbiome and insulin sensitivity, we sought to determine whether increased fasting glucose levels had any impact on the microbiome.

2. Materials and Methods

2.1. Population, Randomization, Ethics

Older adults participating in the neuroimaging part of the Generation 100 Study were asked if they were interested in taking part in a gut microbiome study at time of brain MRI after 5 years of exercise intervention. The participants in the G100 Study were invited by mail in letters sent to 6966 adults (3721 women) born between 1936-1942 and registered in the Norwegian National Population Registry with a permanent home address in Trondheim municipality. Of these, 1790 showed an interest. The exclusion criteria were presence of somatic or psychiatric disease precluding exercise intervention, or inclusion in other exercise training studies. Dementia at baseline or diagnosed during the study was an exclusion criterion [6]. A total of 1790 people were interested, of these 223 withdrew - resulting in 1567 participants included. Before randomization, the participants were informed of the possibility of participating in a neuroimaging study during the RCT. Exclusion criteria for the MRI study were limited to standard MRI contraindications (e.g., implanted electronic medical devices) and brain pathology which could interfere with image analysis. In total, 105 participants were included in the MRI study. After 5 years, 85 participants remained in the study and were asked if interested in taking part in a gut microbiome study. A total of 73 participants agreed to provide sample of stool, and 65 participants also supplied their blood for analysis (Figure 2).
Randomization of the participants in G100 was performed by the Unit for Applied Clinical Research. The participants were randomized 2:1:1, stratified by sex and cohabitation status (living with someone versus alone) into exercise according to the national guidelines (i.e. > 30 min daily moderate physical activity) (control group, n=780) [8], or supervised exercise with either MICT (n=387) or HIIT (n=400) [9]. This study was thus a a secondary analysis in the neuroimaging sub-study of the RCT. In this study, we have grouped the participants’ microbiome data according to their glucose status, Above or below the normal range.
The sub-study was approved by the Regional Committee for Medical Research Ethics, Central Norway (2012/849). All participants were legally competent and gave their written informed consent. Descriptive statistics for the key metabolic blood measures along with glucose levels groups distribution can be found in Supplementary Table 1 and Figure 1.
Figure 1. Generation 100 sub-study design.
Preprints 178838 g001
Figure 2. Study design and randomization flowchart.
Preprints 178838 g002
Participants included in microbiome study were then divided based on measured fasting blood glucose levels. Participants with glucose level between 4-5.4 nmol/L were assigned to a normal group whilst participants with glucose higher then >5.5 were assigned to a high glucose group. Based on Cohen’s d value it was estimated that there’s roughly an 89% chance a random person from the higher-mean group has a higher value than a random person from the low group (common-language effect size). There were 6 individuals clinically diagnosed type 2 diabetes in the high glucose group.

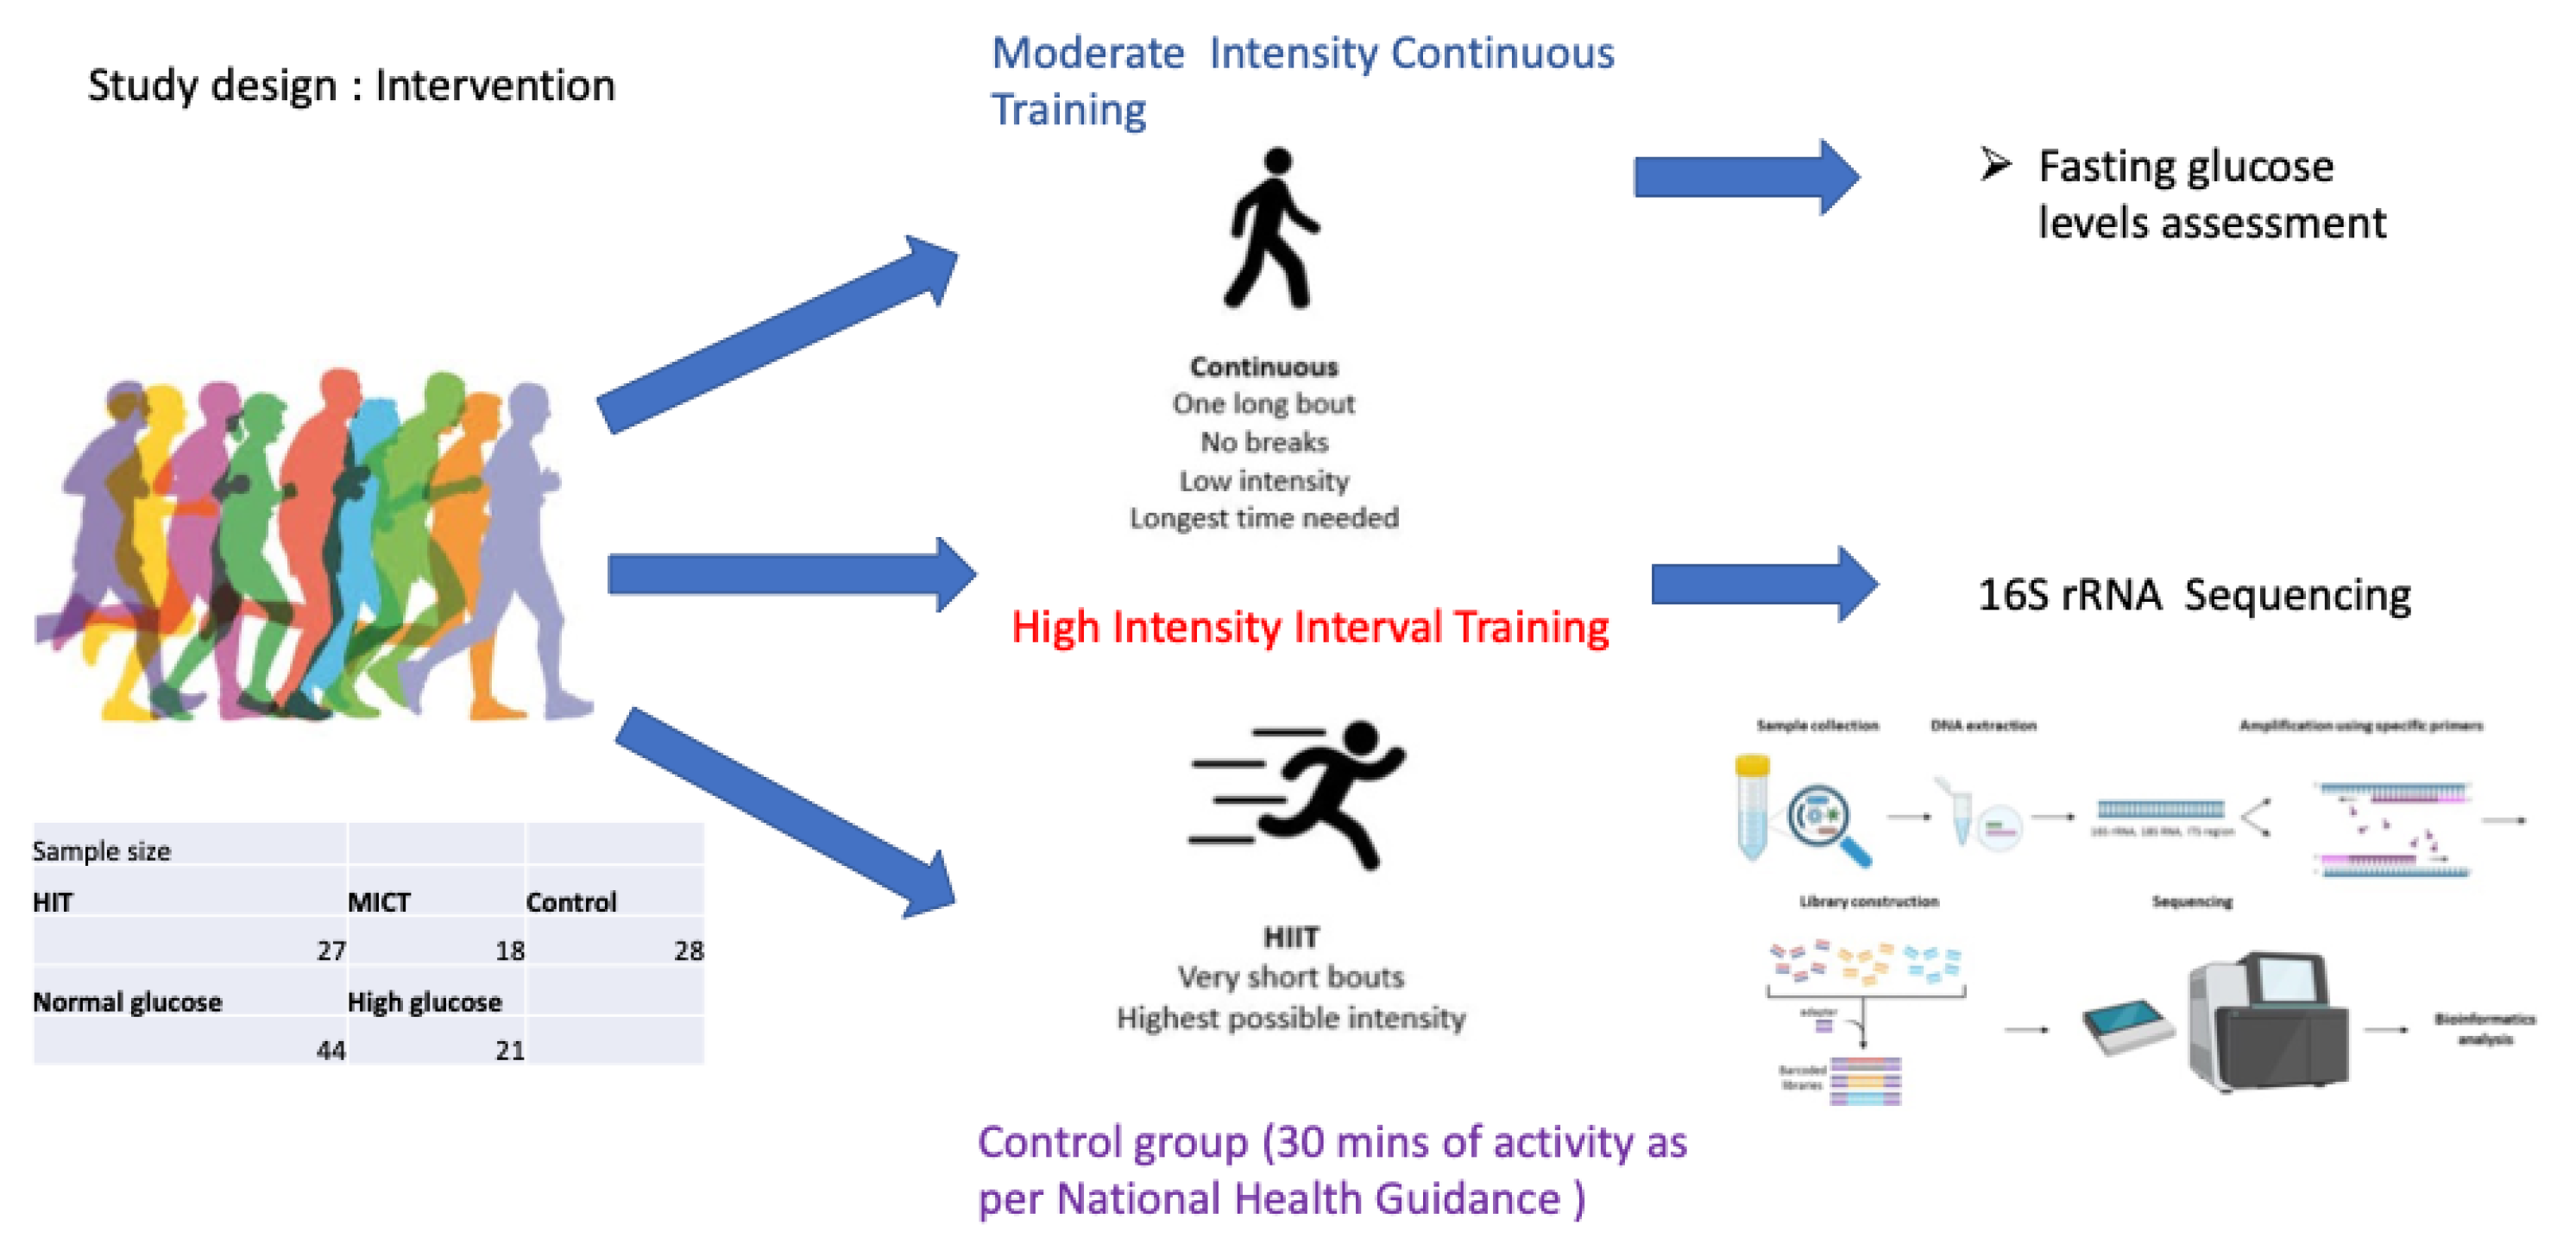
2.2. Gut Microbiome Collection and Preparation

The gut microbiome was collected using the same methods as in the National Institute of Health human microbiome project. A polystyrene box (28 x 28 x 28 cm) with a lid was filled with an Fecotainer (UN3373 Medical Packaging), 10 pre-frozen flat, standard cooler elements in a plastic bag, and a zip-lock plastic bag for the used Fecotainer. The lid of the box was secured with a strap. An illustrated instruction on the procedure for providing the stool and packing the box was provided. In addition, the abdominal health and diet questionnaire and a contact phone number for pick-up was included. In the afternoon of day 1, the prepackaged box was delivered by car directly to the participant´s residence. The participant was asked to remove the cooler elements from the box into a freezer awaiting stool sampling on day 2. The participant performed the stool sampling of the entire stool specimen at his/her usual time of defecation. The box was subsequently packed with cooler elements and the Fecotainer according to the instructions and immediately picked up by a driver who delivered the box to the hospital. Upon arrival at the hospital, the specimens were promptly transferred to a -80°C freezer. When samples from all participants had been acquired, further stool processing commenced.

2.3. DNA Extraction and 16s Ribosomal RNA Sequencing

Total DNA extracts of 73 human stools was performed according to the Standard Operating Procedure published by IHMS Consortium[10,11]. Total cellular DNA was extracted from 0.2 g of starting fecal material using the DNeasy PowerSoil Kit, as per the modified manufacturer protocol (QIAGEN). To improve cellular lysis the samples were transferred to tubes pre-filled with 750ul of PowerBead Solution (0.5mm diameter ceramic/garnet beads) and homogenized using cell homogenizer (Precellys24, Bertin). The DNA was extracted successfully in sufficient quantity and quality for sequencing 73 samples. (DNA concentration was quantified by using Qbit method). 16S metagenomic sequencing libraries were prepared from DNA samples according to the “16S Illumina Demonstrated Library Prep Guide with minor adjustments [12]. In brief, 12.5 ng genomic DNA from the stool samples was used as a template for PCR amplification (25 cycles) of the 16S V3 and V4 regions. The 16S ribosomal RNA gene PCR primers were based on sequences first published by Klindworthe et al. [13] Illumina adaptor compatible overhang nucleotide sequences were added to the gene/locus specific sequences (16S Amplicon PCR Forward Primer=5'TCGTCGGCAGCGTCAGATGTGTATAAGAGACAGCCTACGGGNGCWGCAG and 16S Amplicon PCR Reverse Primer=5'GTCTCGTGGGCTCGGAGATGTGTATAAGAGACAGGACTACHVGGGTATCTAATCC) resulting in a PCR product of the expected size of about 550 bp. The PCR products were then cleaned up by using AMPure XP beads to purify 16S V3 and V4 amplicons away from free primers and primer dimer species. In a second PCR amplification step (8 cycles) dual indices and Illumina sequencing adaptors were added by using the Nextera XT indexing kit (Illumina Inc.) according to the manufacturer’s instructions. A second PCR clean up step were preformed using AMPure XP beads, before validation of the library by a LabChip GX DNA high sensitivity assay (PerkinElmer, Inc). Libraries were normalized and pooled to 10 pM and subjected to clustering on one MiSeq V3 flowcell. Finally, paired end read sequencing was performed for 2X300 cycles on a MiSeq instrument (Illumina, Inc. San Diego, CA, USA), according to the manufacturer's instructions.

2.4. Data Quality Control and Analysis

The data was processed with MiSeq Illumina instrument control software for two-step PCR pools. This step includes MID sequence tag separation and computation of quality control scores and GC distribution. Barcoding was used to demultiplex the samples. FastQC analysis with Illumina built in software indicated high quality reads (both reverse and forward) and resulted in good assembly of paired reads later in CLC Genomics software (CLC Genomics Workbench 20.0.3)
For taxonomic classification (clustering), reads were analyzed using CLC Genomics workflow. Reads were grouped into operational taxonomic units (OTUs) using Greenegenes v13_8 99% version and the OTUs were matched with a similarity of 99% of the database. The parameters for minimum occurrences of combined reads were set to 50 to reduce the number of false positive matches. New OTUs were recorded to explore the number of unique unmapped sequences (e.g., Chao index for unique OTUs). Forward and reverse reads were matched through assembly process and merge pair report has been created with 19,432,643 reads. Chimeras were filtered out of the analysis, at the crossover cost set to the value of 3. After sequence assembly, quality control, rarefaction, frequency-based filtering we proceeded to microbiome analysis with 19,432,643 total reads, which allowed us to predict 2,646 total OTUs, 395 de novo OTUs and 585 unique chimeric reads.
The proportion of the gut microbiome at phylum, genus and species taxonomic levels was determined using Greene genes database (gg_13_8_otus / taxonomy / 97_otu_taxonomy) and described as ratios, relative abundance, and raw numeric abundance (numbers of OTUs). Rarefaction has been done to adjust for differences in library sizes across samples and allow comparisons for ratios and alpha diversity [14,15]
Phylogenetic tree was obtained from the top 100 most abundant OTUs which were aligned using MUSCLE algorithm built in CLC Genomics software to reconstruct the phylogeny tree. The maximum likelihood phylogenetic tree was used to measure alpha diversity and beta diversity. The (α)Alpha diversity, a measure of species richness and evenness within each individual sample was estimated with the Shannon entropy and Simpson diversity indices at the phylum and Genera level [16] The Shannon entropy index summarizes the range of a population in which each member belongs to a unique taxonomic group. The index corresponds directly to sample heterogeneity. The Simpson diversity index measures community diversity considering the number of taxonomic units of choice present relative to the abundance of each taxonomic entity. The index ranges from 1 for infinite diversity to 0 representing no diversity. In the phylum ratio analysis, the total detected kingdoms (Bacteria and Archea) were subdivided according to phylogenetic pyramid into subpopulations and then expressed as ratios. The (β)Beta diversity is a measure of similarity or dissimilarity between samples and groups of samples. Beta diversity was assessed between groups. The Bray-Curtis distance was used as a quantitative measure of abundance across different communities. Additionally, to quantitatively measure dissimilarities between groups the Jaccard distance was calculated. The unweighted and weighted UniFrac indices were calculated from the phylogenetic tree as an indicator of dissimilarity between phylogenetic tree branches across glucose groups. Beta diversity was represented by 2D principal component analysis (PCoA) plots. The statistical significance in beta diversity measures between groups was calculated using PERMANOVA (PERmutational Multivariate ANalysis Of VAriance). Differential abundance (DA) analysis was performed to determine differentially abundant microbes at various taxonomic levels between two groups. The method modeled each feature (e.g., an OTU, an organism, or species name) in a separate Generalized Linear Model where it was assumed that abundances follow a negative binomial distribution. The likelihood ratio test was used to determine significance across groups and if significant, followed by the Wald test to determine significance between group pairs. The false discovery rate (FDR) was calculated to account for multiple testing [17,18] Differential abundance results are presented in diagrams and quantitative tables.
For the demographic, clinical and exercise variables, analyses were performed in SPSS (version 28) and p<0.05 considered significant. All analysis including gut microbiome variables were performed in CLC Genomics Workbench 20.0.3, QIIME2, correction for multiple comparisons were performed with DRF and a q> 0.05 considered statistically significant.

3. Results

3.1. Microbial Diversity and Composition at the Phylum Level

The results shown significant differences amongst the two (high and normal) glucose groups. Phylum level Alpha diversity, a measure of species richness and evenness within each individual sample was estimated with the Shannon entropy and Simpson index. In general, Shannon index at the phylum level of 0.004 to 2.94 is indicative of low alpha diversity. The score corresponds directly with sample heterogeneity. WhileSimpson index scores range from 1 for infinite diversity to 0 representing no diversity. The mean species diversity score measured by Shannon and Simpson indices differed significantly between the normal and higher glucose groups (p = 0.007 for Simpson idex and p = 0.005 for Shannon index, as per Figure 3). However, larger inter-group dispersity of samples was observed in the normal glucose group, where outliers had Simpson index ranging from as low as 0.26 to as high as 0.74. This might be due to the differneces in glucose or demographic and life-style factors impossible to avoid in a study like this. In the nonparametric Spearman correlation test, we confirmed significant correlations between glucose levels as a continous values across all participants and alpha diversity scores measure with Shannon and Simpson Indices at the phylum level. Negative correlation coefficients -0.341 (p=0.005) and -0.323** (p=0.009) were detated, resepctively for Shannon and Simpson indices. These results confirm that a higher glucose levels correspond with lower microbial heterogeneity. To further investigate group differences between the normal and higher glucose groups Beta diversity was measured and represented in 2D principal component analysis (PCoA) plots. The percentages in the brackets depicted on the Figure 4 indicate how much of the total variation in measured distance matrix is explained by each axis (PCo1 and PCo2).These two dimensions capture all the variations in the data. The first coordinate explained 81% of the vairance, with the PCo2 explaining 19% of variance, confirming that the glucose status was the dominant factor shaping microbiome differences.
We then analysed the relative abundances of different bacterial phyla in the normal and high glucose groups (Figure 5). Phylum compositional distribution reveal the differences in Proteobacteria (3% in normal glucose versus 2% in higher glucose, which was statistically significant as per differential abundance analysis , with FDR corrected p-value of <0.05). Another significant change was reported in the relative abudnance of phylum Verrucomicrobia. In the normal glucose group, Verrucomicrobia made up 5% of total microbes whilst it was significantly lower in the high glucose group at 3% of total microbes (FRD p-value 0.04). The percantage of total Euryarchaetoa was also significantly lower in the high glucose compared to the low glucose group (FDR p-value of 0.03).

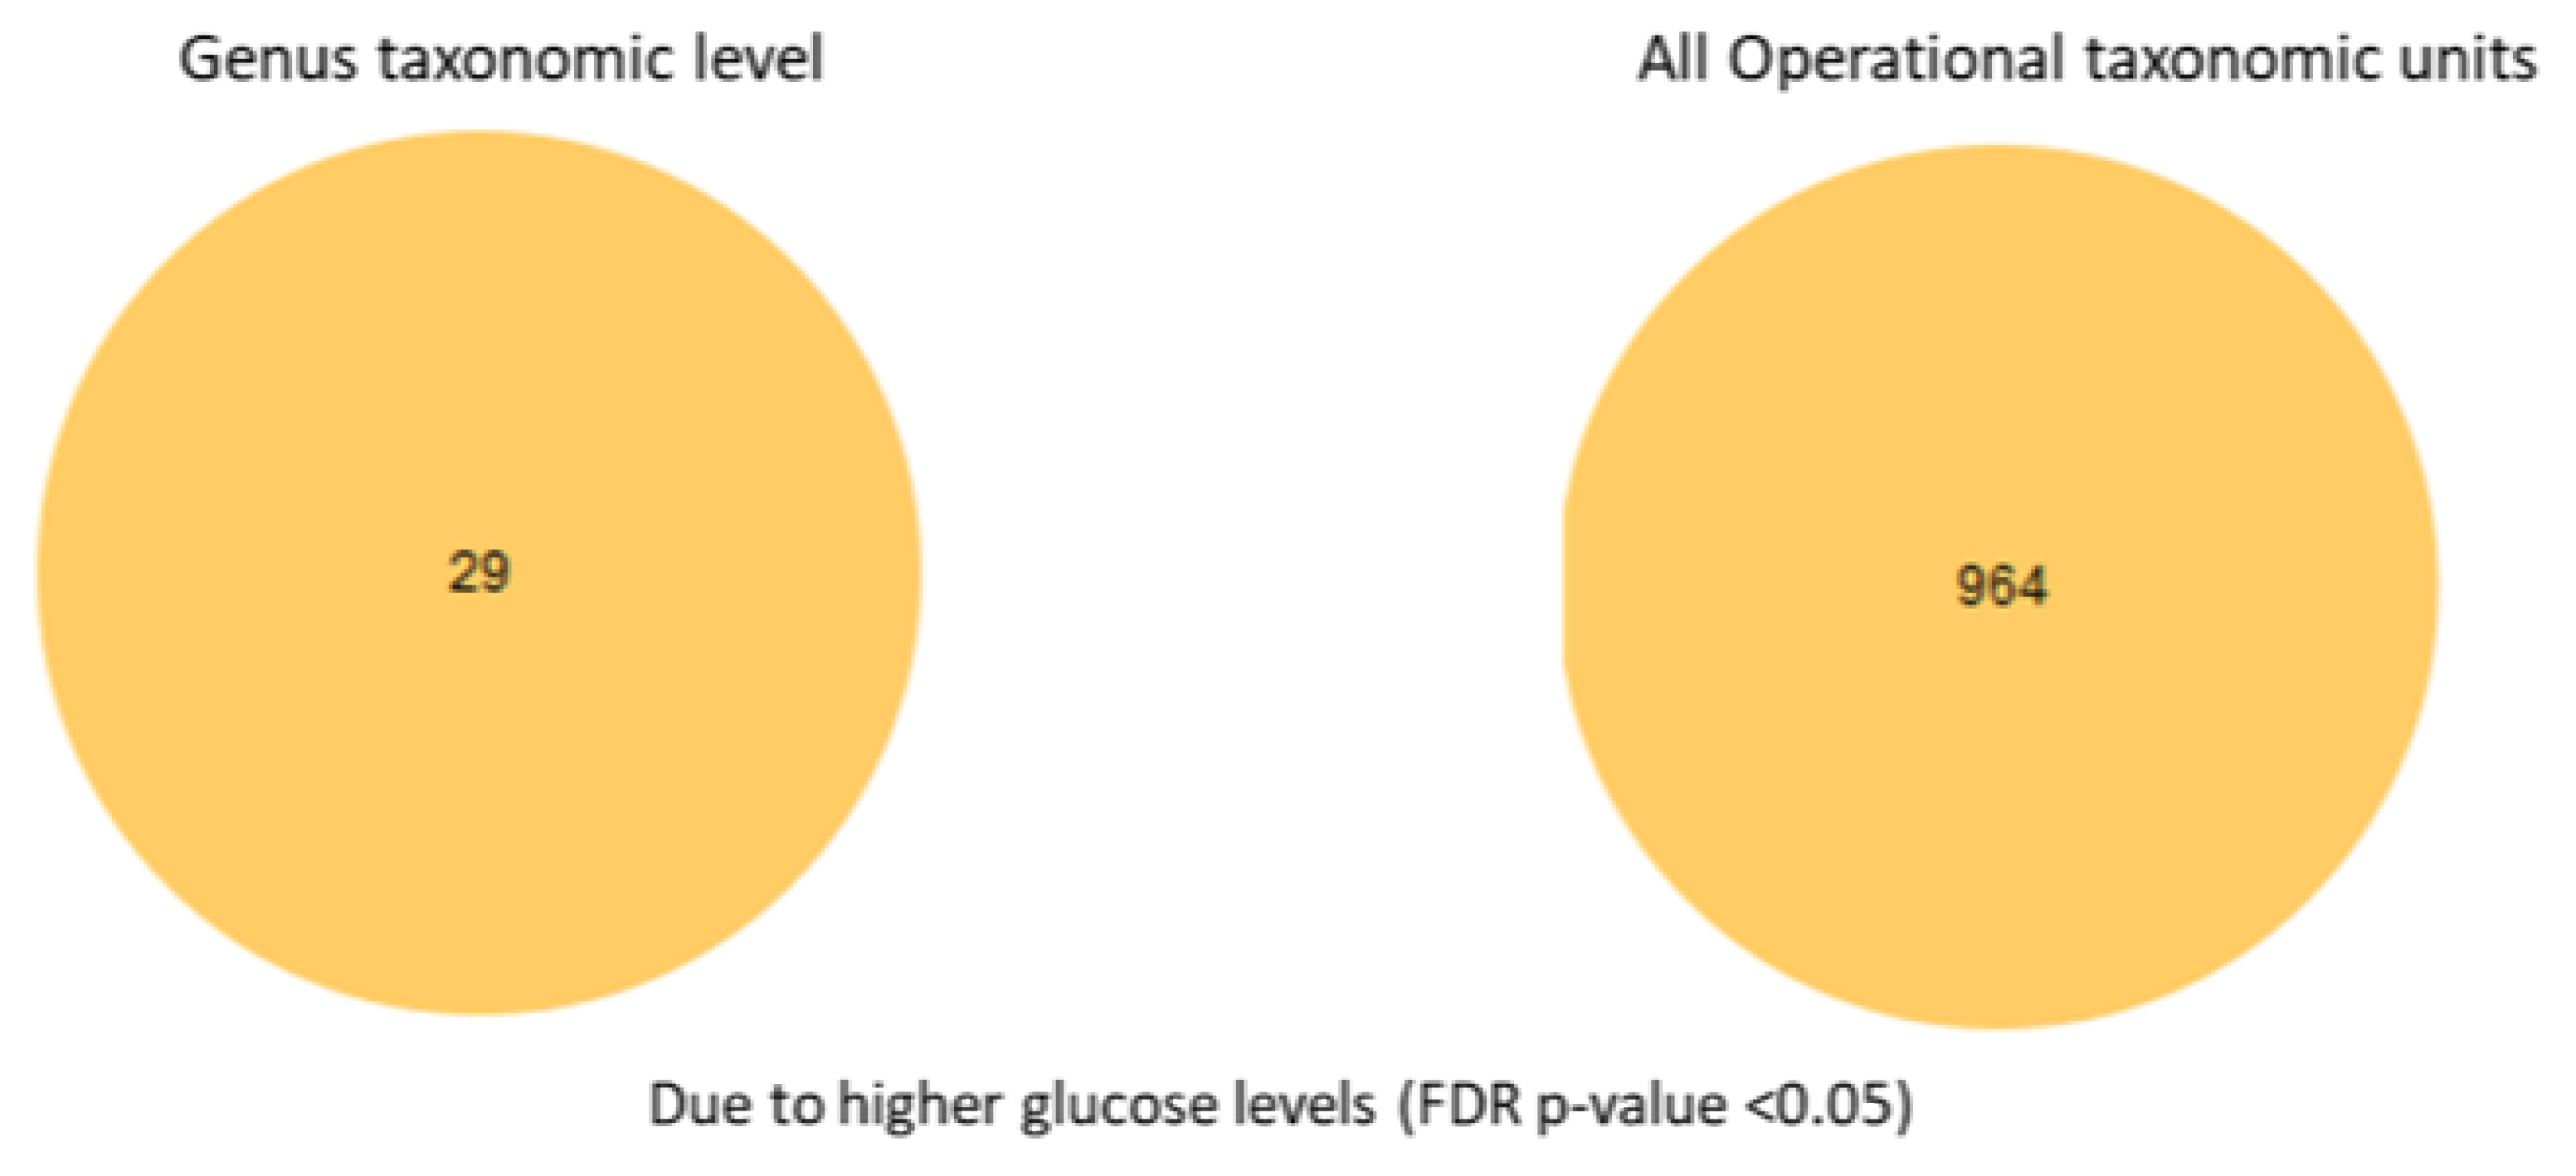
3.3. Differential Abundance Analysis at the Species Level

To examine in more details the specific species, we conducted an analysis of the selective differential abundance of species previously reported to be associated with high glucose levels). We tested differential abundance across glucose groups using a feature-wise generalized linear model with a negative binomial mean–variance relationship. For each feature (OTU/species), a NB-GLM (Negative Binomial Generalized Linear Model) was fitted with group as the main factor and library-size normalization via model-estimated size factors. Pairwise contrasts were evaluated with Wald tests, and the global (ANOVA-like) effect of group was assessed with a likelihood ratio test (LRT) comparing the full model to a reduced model without the group term. Multiple testing was controlled using the Benjamini–Hochberg false discovery rate (FDR) procedure ( < 0.05), following standard guidance on high-dimensional inference[19,20]. Differential abundance analysis with full OTU table (ANOVA-like comparison with FDR corrected p-values <0.05) amongst glucose groups revealed that 964 species differed between the normal and high glucose groups (Figure 6). Differential abundance analysis was performed using a negative binomial generalized linear model, which accounts for differences in sequencing depth and group sizes (n=44 normal glucose; n=21 high glucose). Dispersion estimates for included taxa were within acceptable ranges, indicating that variance was appropriately modeled despite the unequal group sizes.
Differential abundance for species of interest is listed in Table 1 showing species which are changed significantly between the glucose groups( glucose cut levels 4-5.4mmol/L < or= normal and>5.5 mmol/L higher glucose. Normal n=44 and higher risk n=21).
To zoom into more details at the specific species level, we conducted selective differential abundance of species previously reported to be associated with high glucose levels (results shown in Table 1).
We observed distinct patterns of microbial beta(β)diversity between the high- and normal glucose groups. Overall, the microbial diversity was significantly reduced in the high glucose group. At the highest taxonomic level (phylum), we found that Synergistes, Elusimicobia, Euryarchaeota, Verrucomicrobia, and Proteobacteria were all significantly lower in participants with high blood glucose. Additionally, P. copri was significantly elevated in the high glucose group (10-fold increase) suggesting that it may serve as an early inflammatory and diabetic marker. These findings are consistent with previous research identifying P. copri as a pro-inflammatory pathogen. We also found that the Fusobacterium genus was significantly increased in the normal glucose group, with a 151-fold increase compared to the high glucose group (p < 0.005).

4. Discussion

In this Generation 100 sub-study we found statistically significant distinct patterns in the gut microbiome between high and normal glucose groups. The Alpha diversity was significantly lower in high glucose group confirming previous findings that the gut microbiome heterogeneity correlates with glucose levels[21,22]. Furthermore, the nonparametric Spearman correlation test revealed significant negative correlations between glucose levels and alpha diversity scores (Shannon and Simpson Indices at the phylum level), confirming/providing additional support to a link between higher glucose and lower microbial heterogeneity.
The gut epithelial barrier is maintained by a healthy, diverse gut microbiome composed primarily by 4 phyla: Bacteriodetes, Firmicutes, Actinobacteria and Proteobacteria. A healthy gut microbiome consists of species supporting/providing eubiosis, that is supporting immune responses and maintaning a strong epithelial-mucosal barrier. We have compared microbial composition at the phylum level with ranges considered normal as per Ortiz-Alvarez et.al. 2020 [23] (supplementary Table 2). We report significantly lower ratio of Proteobacteria in the high glucose group comared to the normal glucose group. This is in conatrast to the fidnigns in the Ortiz-Alvarez et al., report where much higher abundances (5-10%) were detected in their study population. However, Proteobacteria is a very large and diverse Phylum of bacteria that includes many important groups, some of which are pathogens (like Escherichia coli, Salmonella, and Helicobacter pylori), while others are beneficial or neutral. Such differences across studies may suggest that other factors than blood glucos (e.g. diet, life-style, geographic location) contribute to differences in abundance of Proteobacteria. Gut bacteria are divided into 3 enterotypes according to their nutrient uptake, for example enterotype II and III (Prevotella and Ruminococcus) are mucine degraders, whilst enterotype I (Bacteroides) utilize energy from carbohydrates using glycolysis and pentose phosphate pathways[24]. In short, the abundance and role of Proteobacteria are shaped not only by blood glucose but also by diet, lifestyle, and geography, with different enterotypes specializing in distinct nutrient utilization strategies. Our total population cohort showed larger abundance of Bacterioidetes (31-32%) in comparison wit popoulation descirbed by Ortiz-Alvarez et.al (20-25% ot total phyla) . This phylum is composed of Gram-negative bacteria, many of which are involved in breaking down complex carbohydrates and other organic materials. A higher level of Bacteroidetes in gut was also found to be associated with increased insulin resistance in humans in a recent clinical study[25,26] . Interestingly in our study we have also observed decreased levels of Bacterioidetes (1-fold change) in normal glucose group , however this change was not statistically significant (Table 1 , FDR p value =0.94). As for Firmicutes, despite the difference in percentage between the normal and high glucose groups, there was no statistically significant difference of abundance for this phylum. Firmicutes include a wide range of bacteria, many of which are Gram-positive. It includes various species involved in fermentation processes and can play a role in energy absorption in the gut. A member of the phylum Firmicutes -Christensenella- was increased 2.92 times in normal glucose group compared with the high glucose group. Enrichment of Christensenella was reported to alleviate T2DM by promoting GLP-1 secretion, regulating hepatic glucose metabolism, inhibiting intestinal glucose absorption, enhancing intestinal barrier, reducing inflammation via LPS/TLR4/NF-κB pathway, and improving liver metabolism [27]. Specifically, a study by Wei-Shan Ang et.al [27]showed excellent properties of C.minuta as potential probiotic therapy for metabolic diseases such as T2DM. Surprisingly, the normal glucose groups showed increased abundance of Fusobacterium compared to the high glucose group, whilst other studies found the presence of this bacterium in both oral and gut microbiome as correlated with T2DM and insulin resistance [28].
The finding that Fusobacterium was more abundant in the normal glucose group, despite being linked in other studies to T2DM, may be explained by several factors. First, differences in population characteristics, can strongly influence the microbiome and lead to distinct outcomes across studies. Second, Fusobacterium is not a uniform genus—different species or even strains may have varying roles, with some being relatively harmless and others more strongly associated with inflammation. Third, the impact of Fusobacterium likely depends on the broader microbial community; in a healthy gut environment, its activity may be balanced by protective microbes, whereas in metabolic disease it may flourish within a more pro-inflammatory ecosystem. Furthermore, its presence in T2DM may reflect correlation rather than causation, as it could simply thrive in the altered gut environment of disease rather than drive it. Finally, methodological differences, such as sequencing techniques, study design, and sample size, may also account for the observed inconsistencies across studies.
Differential abundance analysis shows unique microbial patterns in high and normal glucose groups. The microbial composition at the phylum level showed 2.5% lower Verrucomicrobia levels in the high glucose group, whilst Akkermansia muciniphila, a member of the phylum Verrucomicrobia, was 29-fold higher in the normal glucose group. Verrucomicrobia is a relatively lesser-known phylum of bacteria, but it includes some important microorganisms, such as Akkermansia muciniphila, which is present in the human gut and is associated with beneficial effects on metabolism and gut health. Verrucomicrobia are generally Gram-negative and can be found in diverse environments, including soil, water, and the human intestine. Akkermansia spp. plays role in glucose metabolism by improving insulin sensitivity and glucose tolerance. The bacterium showed to decrease fasting blood glucose levels and improve insulin resistance[29]. Overall, several other studies associate presence of Akkermansia muciniphila with improved metabolism, decreased inflammation, improved intestinal barrier function[30]. A study in diet-induced mice confirmed beneficial effect of pasteurized Akkermansia muciniphila, where supplementation of this bacteria species increased energy expenditure and enhanced physical activity [31]. Oral administration of the A. muciniphila to high-fat-diet fed mouse increased glucose tolerance and reduced adipose tissue inflammation[32]. This genus has gained special attention due to its involvement in mucin degradation and ability to regulate genes of other bacterial species, creating symbiotic homeostasis environment in the gut mucosa.
Our study shows significant increase in Akkermansia suggesting beneficial probiotic potential in reducing T2DM or prediabetes risk. Dietary strategies to increase A.muciniphila abundance in gut microflora exists along with commercially available probiotics (ref). Another bacteria from the phylum Bacteroidota named Prevotella copri was significantly elevated (10-fold increase) in the high glucose group suggesting that it may serve as an early diabetic marker. (These findings are consistent with previous research identifying P. copri as a pro-inflammatory pathogen).
Previous studies show that higher levels of enterobacteriaceae are associated with poor glycemic control, metabolic syndromes including obesity, insulin resistance and impaired lipid profile[33,34]. The most recent metadata analysis by Gurung et al. from 2020, summarizes 42 human studies in which T2D were investigated in terms of the gut microbiome[33]. According to their results, genera that were negatively associated with T2D were: Bifidobacterium, Bacteroides, Faecalibacterium, Akkermansia and Roseburia, and higher abundance/level of these species is associate with lower T2DM risk. In our study we did not find significant differences in relative abundance of Bifidobacterium, Faecalibacterium nor Bacterioidetes between the high and normal blood glucose group.
This study was a sub-study of the Generation 100 Study, and hence uneven sample sizes per glucose groups were present (n=44 vs n=21). This imbalance mainly reduces power in the smaller group and can inflate type-I error in PERMANOVA if dispersion differs—hence the beta dispersity was checked within the group. In future research, the use of Bayesian models could help to incorporate prior knowledge to stabilize inference in small groups. The major limitation of this study however lies in the fact that only those willing and eligible (after 5 years of participation + MRI eligibility + microbiome consent) were included, which may not be representive the main cohort or the population at large. Older adults with health issues, dementia, or MRI contraindications were excluded. Additionally as explained earlier, this study is a secondary analysis in an exercise RCT. Thus, blood glucose differences may be confounded by exercise exposure, sex, cohabitation, or other baseline factors related to the main study. However where applicable we had used multivariate regression models adjusting for age, sex, exercise group allocation and BMI.
Overall, a sub-study like this is a great way to utilize all the data from expensive large studies (RCTs) to ensure all information is extracted and analyzed. Various multivariate prediction models could be applied in the future to decipher various confounders and their effect on total microbiome. The next step for future research in significance of microbiome in better glucose metabolism is to design large global cohort studies, which would cover larger population offering better representation of the geographic and ethnical differences. Additionally, a large prospective microbiome intervention study would be a valuable next step, using strains identified in recent research as a probiotic mixture to evaluate their modulatory effects on blood glucose in patients with prediabetes or T2DM. Larger, prospective cohorts in which microbiome, glucose, and lifestyle factors are measured longitudinally would provide an excellent opportunity to advance our understanding of the impact of the microbiome on glucose management. In particular, the use of causal inference frameworks will be essential to distinguish correlation from causation, which in this field of research is especially challenging to disentangle.

5. Conclusions

This study extends current understanding of the relationship between gut microbiome composition and glucose metabolism by providing novel insights from an older adult population. Consistent with prior research, we observed reduced microbial diversity and distinct compositional shifts in individuals with elevated fasting glucose, reinforcing the concept that dysbiosis is a hallmark of early type 2 diabetes development. Importantly, our findings identify specific taxa—such as the striking elevation of P. copri and the unexpected enrichment of Fusobacterium in normoglycemic individuals—that may represent early microbial signatures of glucose dysregulation or protection. By situating these observations within the prediabetic stage, this study adds to the growing evidence that microbiome alterations precede overt diabetes, thereby underscoring their potential as biomarkers for early detection and as targets for preventive interventions. Moreover, this study contributes to the growing body of evidence on the role of the gut microbiome in type 2 diabetes. Collectively, the findings highlight the potential for identifying novel bacterial species that may serve as indicators of dysbiosis. Understanding these microbial shifts not only deepens our knowledge of disease mechanisms but also opens avenues for interventions aimed at restoring microbial balance, thereby improving glucose sensitivity and metabolic outcomes.

Supplementary Materials

The following supporting information can be downloaded at the website of this paper posted on Preprints.org

Author Contributions

Conceptualization, AKH. and NGB .; methodology NGB. VB .; software, NGB and VB validation, LSR., AH, VB, DS.; formal analysis NGB .; investigation NGB, LSR, AKH,VB.; data curation VB, NGB,LSR .; writing—original draft preparation NGB.; writing—review and editing, NGB, AKH,DS.; visualization, NGB, LSR .; supervision AKH, DS .; project administration AKH, NGB.; funding acquisition, AKH. All authors have read and agreed to the published version of the manuscript.

Funding

This research was funded by the Faculty of Medicine and Health Sciences at NTNU and other costs were covered by fMRI unit, MiDT national research center, Center for innovation, medical equipment, and technology, St. Olav University Hospital, Trondheim University Hospital, Trondheim, Norway.

Data Availability Statement

The data could be obtained via request to Generation 100 study database. We are also happy to provide raw data upon request with corresponding author.

Acknowledgments

We would like to acknowledge the help of a colleague Sissel Skara in sample processing.

Conflicts of Interest

The authors declare no conflicts of interest. The funders had no role in the design of the study; in the collection, analyses, or interpretation of data; in the writing of the manuscript; or in the decision to publish the results.

References

  1. Wu, H.; Tremaroli, V.; Schmidt, C.; Lundqvist, A.; Olsson, L.M.; Krämer, M.; Gummesson, A.; Perkins, R.; Bergström, G.; Bäckhed, F. The Gut Microbiota in Prediabetes and Diabetes: A Population-Based Cross-Sectional Study. Cell Metab 2020, 32, 379-390.e3. [CrossRef]
  2. Randeria, S.N.; Thomson, G.J.A.; Nell, T.A.; Roberts, T.; Pretorius, E. Inflammatory Cytokines in Type 2 Diabetes Mellitus as Facilitators of Hypercoagulation and Abnormal Clot Formation. Cardiovasc Diabetol 2019, 18, 72. [CrossRef]
  3. Chakaroun, R.M.; Massier, L.; Kovacs, P. Gut Microbiome, Intestinal Permeability, and Tissue Bacteria in Metabolic Disease: Perpetrators or Bystanders? Nutrients 2020, 12, 1082. [CrossRef]
  4. Qin, J.; Li, R.; Raes, J.; Arumugam, M.; Burgdorf, K.S.; Manichanh, C.; Nielsen, T.; Pons, N.; Levenez, F.; Yamada, T.; et al. A Human Gut Microbial Gene Catalogue Established by Metagenomic Sequencing. Nature 2010, 464, 59–65. [CrossRef]
  5. Bednarska, N.G.; Håberg, A.K. Understanding Patterns of the Gut Microbiome May Contribute to the Early Detection and Prevention of Type 2 Diabetes Mellitus: A Systematic Review. Microorganisms 2025, 13, 134. [CrossRef]
  6. Stensvold, D.; Viken, H.; Rognmo, Ø.; Skogvoll, E.; Steinshamn, S.; Vatten, L.J.; Coombes, J.S.; Anderssen, S.A.; Magnussen, J.; Ingebrigtsen, J.E.; et al. A Randomised Controlled Study of the Long-Term Effects of Exercise Training on Mortality in Elderly People: Study Protocol for the Generation 100 Study. BMJ Open 2015, 5. [CrossRef]
  7. Stensvold, D.; Viken, H.; Steinshamn, S.L.; Dalen, H.; Støylen, A.; Loennechen, J.P.; Reitlo, L.S.; Zisko, N.; Bækkerud, F.H.; Tari, A.R.; et al. Effect of Exercise Training for Five Years on All Cause Mortality in Older Adults—the Generation 100 Study: Randomised Controlled Trial. BMJ 2020, 371. [CrossRef]
  8. Helsedirektorate Arsrapport 2019 Available online: https://www.helsedirektoratet.no/rapporter/helsedirektoratet-arsrapporter/%C3%85rsrapport%202019%20-%20Helsedirektoratet.pdf/_/attachment/inline/8947572c-7f1f-4b3a-a9dd-6e165cfe014d:acc662d5e305e4c6d0f9e37f2605d8147ae94fd4/%C3%85rsrapport%202019%20-%20Helsedirektoratet.pdf (accessed on 17 September 2025).
  9. Stensvold, D.; Viken, H.; Steinshamn, S.L.; Dalen, H.; Støylen, A.; Loennechen, J.P.; Reitlo, L.S.; Zisko, N.; Bækkerud, F.H.; Tari, A.R.; et al. Effect of Exercise Training for Five Years on All Cause Mortality in Older Adults—the Generation 100 Study: Randomised Controlled Trial. BMJ 2020, 371. [CrossRef]
  10. Santiago, A.; Panda, S.; Mengels, G.; Martinez, X.; Azpiroz, F.; Dore, J.; Guarner, F.; Manichanh, C. Processing Faecal Samples: A Step Forward for Standards in Microbial Community Analysis. BMC Microbiol 2014, 14. [CrossRef]
  11. IHMS Available online: https://human-microbiome.org/index.php?id=Sop&num=006 (accessed on 17 September 2025).
  12. Illumina IMPORTANT NOTICE This Document Provides Information for an Application for 16S Metagenomic Sequencing Library Preparation Preparing 16S Ribosomal RNA Gene Amplicons for the Illumina MiSeq System.
  13. Klindworth, A.; Pruesse, E.; Schweer, T.; Peplies, J.; Quast, C.; Horn, M.; Glöckner, F.O. Evaluation of General 16S Ribosomal RNA Gene PCR Primers for Classical and Next-Generation Sequencing-Based Diversity Studies. Nucleic Acids Res 2013, 41. [CrossRef]
  14. Roswell, M.; Dushoff, J.; Winfree, R. A Conceptual Guide to Measuring Species Diversity. Oikos 2021, 130, 321–338. [CrossRef]
  15. Hurlbert, S.H. The Nonconcept of Species Diversity: A Critique and Alternative Parameters. Ecology 1971, 52, 577–586. [CrossRef]
  16. Schneider, T.D. and Stephens, R.M. (1990) Sequence Logos A New Way to Display Consensus Sequences. Nucleic Acids Res, 18, 6097-100. - References - Scientific Research Publishing Available online: https://www.scirp.org/reference/referencespapers?referenceid=21870 (accessed on 17 September 2025).
  17. Multiple Hypothesis Testing in Microarray Experiments on JSTOR Available online: https://www.jstor.org/stable/3182872 (accessed on 17 September 2025).
  18. Almudevar, A. Multiple Hypothesis Testing: A Methodological Overview. Methods in Molecular Biology 2013, 972, 37–55. [CrossRef]
  19. Benjaminit, Y.; Hochberg, Y. Controlling the False Discovery Rate: A Practical and Powerful Approach to Multiple Testing. J R Stat Soc Series B Stat Methodol 1995, 57, 289–300. [CrossRef]
  20. Benjamini, Y. and Hochberg, Y. (1995) Controlling the False Discovery Rate A Practical and Powerful Approach to Multiple Testing. Journal of the Royal Statistical Society, Series B, 57, 289-300. - References - Scientific Research Publishing Available online: https://www.scirp.org/reference/referencespapers?referenceid=1425368 (accessed on 29 September 2025).
  21. Wu, H.; Lv, B.; Zhi, L.; Shao, Y.; Liu, X.; Mitteregger, M.; Chakaroun, R.; Tremaroli, V.; Hazen, S.L.; Wang, R.; et al. Nature Medicine Microbiome-Metabolome Dynamics Associated with Impaired Glucose Control and Responses to Lifestyle Changes. Nature Medicine | 2025, 31. [CrossRef]
  22. Keshet, A.; Segal, E. Identification of Gut Microbiome Features Associated with Host Metabolic Health in a Large Population-Based Cohort. Nature Communications 2024, 15, 1–13.
  23. Ortiz-Alvarez, L.; Xu, H.; Martinez-Tellez, B. Influence of Exercise on the Human Gut Microbiota of Healthy Adults: A Systematic Review. Clin Transl Gastroenterol 2020, 11, e00126. [CrossRef]
  24. Rinninella, E.; Raoul, P.; Cintoni, M.; Franceschi, F.; Miggiano, G.A.D.; Gasbarrini, A.; Mele, M.C. What Is the Healthy Gut Microbiota Composition? A Changing Ecosystem across Age, Environment, Diet, and Diseases. Microorganisms 2019, 7. [CrossRef]
  25. Wang, J.; Li, W.; Wang, C.; Wang, L.; He, T.; Hu, H.; Song, J.; Cui, C.; Qiao, J.; Qing, L.; et al. Enterotype Bacteroides Is Associated with a High Risk in Patients with Diabetes: A Pilot Study. J Diabetes Res 2020, 2020. [CrossRef]
  26. Chen, Z.; Radjabzadeh, D.; Chen, L.; Kurilshikov, A.; Kavousi, M.; Ahmadizar, F.; Ikram, M.A.; Uitterlinden, A.G.; Zhernakova, A.; Fu, J.; et al. Association of Insulin Resistance and Type 2 Diabetes With Gut Microbial Diversity: A Microbiome-Wide Analysis From Population Studies. JAMA Netw Open 2021, 4. [CrossRef]
  27. Ang, W.S.; Law, J.W.F.; Letchumanan, V.; Hong, K.W.; Wong, S.H.; Ab Mutalib, N.S.; Chan, K.G.; Lee, L.H.; Tan, L.T.H. A Keystone Gut Bacterium Christensenella Minuta-A Potential Biotherapeutic Agent for Obesity and Associated Metabolic Diseases. Foods 2023, 12. [CrossRef]
  28. Salguero, M. V; Al-Obaide, M.A.I.; Singh, R.; Siepmann, T.; Vasylyeva, T.L. Dysbiosis of Gram-Negative Gut Microbiota and the Associated Serum Lipopolysaccharide Exacerbates Inflammation in Type 2 Diabetic Patients with Chronic Kidney Disease. Exp Ther Med 2019, 18, 3461. [CrossRef]
  29. Li, J.; Yang, G.; Zhang, Q.; Liu, Z.; Jiang, X.; Xin, Y. Function of Akkermansia Muciniphila in Type 2 Diabetes and Related Diseases. Front Microbiol 2023, 14, 1172400. [CrossRef]
  30. Ghotaslou, R.; Nabizadeh, E.; Memar, M.Y.; Law, W.M.H.; Ozma, M.A.; Abdi, M.; Yekani, M.; Kadkhoda, H.; hosseinpour, R.; Bafadam, S.; et al. The Metabolic, Protective, and Immune Functions of Akkermansia Muciniphila. Microbiol Res 2023, 266, 127245. [CrossRef]
  31. Depommier, C.; Everard, A.; Druart, C.; Plovier, H.; Van Hul, M.; Vieira-Silva, S.; Falony, G.; Raes, J.; Maiter, D.; Delzenne, N.M.; et al. Supplementation with Akkermansia Muciniphila in Overweight and Obese Human Volunteers: A Proof-of-Concept Exploratory Study. Nat Med 2019, 25, 1096-+. [CrossRef]
  32. Shin, N.-R.; Lee, J.-C.; Lee, H.-Y.; Kim, M.-S.; Whon, T.W.; Lee, M.-S.; Bae, J.-W. An Increase in the Akkermansia Spp. Population Induced by Metformin Treatment Improves Glucose Homeostasis in Diet-Induced Obese Mice. Gut 2014, 63, 727–735. [CrossRef]
  33. Gurung, M.; Li, Z.; You, H.; Rodrigues, R.; Jump, D.B.; Morgun, A.; Shulzhenko, N. Role of Gut Microbiota in Type 2 Diabetes Pathophysiology. EBioMedicine 2020, 51, 102590. [CrossRef]
  34. Moreira de Gouveia, M.I.; Bernalier-Donadille, A.; Jubelin, G. Enterobacteriaceae in the Human Gut: Dynamics and Ecological Roles in Health and Disease. Biology (Basel) 2024, 13, 142. [CrossRef]
Figure 3. Phylum level heterogeneity in high glucose versus normal glucose group: A) Simpson Index Alpha Diversity measure with p=0.007. B) Alpha diversity described by Shannon Index, p=0.005.
Preprints 178838 g003
Figure 4. Beta diversity of the normal glucose (1) and high glucose (2) groups measured by Principal Component analysis.
Preprints 178838 g004
Figure 5. Distribution of the bacterial phyla amongst the normal and high glucose groups.
Preprints 178838 g005
Figure 6. Differential abundance analysis at the genus taxonomic level and all taxonomic units level.
Preprints 178838 g006
Table 1. Differential abundance analysis with full OTU table (ANOVA-like comparison with FDR corrected p-values <0.05) between normal versus high glucose groups.
Preprints 178838 i001
Disclaimer/Publisher’s Note: The statements, opinions and data contained in all publications are solely those of the individual author(s) and contributor(s) and not of MDPI and/or the editor(s). MDPI and/or the editor(s) disclaim responsibility for any injury to people or property resulting from any ideas, methods, instructions or products referred to in the content.
Copyright: This open access article is published under a Creative Commons CC BY 4.0 license, which permit the free download, distribution, and reuse, provided that the author and preprint are cited in any reuse.
Prerpints.org logo

Preprints.org is a free preprint server supported by MDPI in Basel, Switzerland.

Subscribe

Disclaimer

Terms of Use

Privacy Policy

Privacy Settings

© 2025 MDPI (Basel, Switzerland) unless otherwise stated