
Submitted:
02 January 2025
Posted:
03 January 2025
You are already at the latest version
Abstract
Currently, research on lithium-ion batteries has been driven by increased demand for electric vehicles to mitigate greenhouse gas emissions. Despite advances, batteries still face significant challenges in efficiency, lifetime, safety, and material optimization for their production. In this context, we present a Transformer-based deep learning model to predict lithium-ion batteries' charging and discharging behavior from their electrochemical parameters. A database of experiments characterized by their electrochemistry and their charge-discharge response was performed to achieve this goal. The database was generated by experimentation on a set of commercial batteries and new approaches in materials science. Subsequently, a model based on the Deep-Learning Transformers methodology was designed and trained from the database measurements. The results show that the deep-learning model can accurately predict lithium-ion batteries' charging and discharging behavior, even in complex scenarios such as abrupt changes in charging capacity. In conclusion, developing a Transformer deep-learning-based model to predict lithium-ion batteries' charging and discharging behavior is effective. These results significantly affect the battery industry and their optimization in electric vehicles.
Keywords:
Lithium-Ion Batteries
; Deep Learning
; Transformers
; Electrochemistry
; Prediction
; Energy Efficiency
; Electric Vehicles
1. Introduction
The climate crisis and its environmental impact have set off alarm bells as a problem requiring an immediate response to preserve the balance and avoid irreversible damage to the planet [1]. In response to the problem of global warming, research has built a conceptual framework to understand the environmental crisis and its effects on biodiversity loss, highlighting the importance of addressing them as a unified and interconnected problem, thus coining the term planetary health. For example, rising global temperatures can cause droughts, forest fires, and rising sea levels, leading to biodiversity loss and a negative indicator of planetary health [2,3].
The issue of global warming has led to research into the integration of renewable energy sources and technologies that mitigate greenhouse gas emissions. As a solution to this problem, researchers have proposed electric vehicles and clean-source storage technologies [4]. However, a paradigm transition requires efficient energy demand management and adequate infrastructure to support the growing demand for electric vehicles powered by renewable energy sources [5]. Consequently, research is directed at different approaches: evaluating the effectiveness of energy response techniques to harness the variability of renewable energy generation and manage electric vehicle charging patterns; optimizing energy use and ensuring grid stability; harnessing the variability of renewable energy generation and managing electric vehicle charging patterns [6,7].
An important point in the transition to electric vehicles is electrochemical batteries, which play a crucial role in the mastery of energy storage systems that drive the motive power of vehicles. Roughly speaking, batteries are characterized by storing electrical energy from chemical rations in a potential difference, divided by three elements: anode, cathode, and electrolyte, which can then be used to power engines or other systems [8]. However, batteries have limited the transition to electric vehicles due to the degradation of battery components. In general, several factors contribute to degradation, including ambient temperature, discharge current and cut-off voltage, and electrochemical interactions of their operation [9,10]. A detailed analysis reveals that the intensive use of batteries in energy storage applications can affect their service life [11].
The needs posed by electromobility have driven the design and production of new generations of batteries, such as lead-acid, nickel-cadmium, and, more recently, lithium-ion-based batteries [12,13]. In this context, lithium-ion battery development has higher energy density than other storage systems. Research has presented significant advances in developing lithium-ion battery anodes and cathodes with high charge and discharge rates [14]. Incorporating a uniformly implanted nanometric amorphous silicon layer, which increases battery performance, stands out. On the other hand, the state of the art has focused on thermal regulation during fast charging as an effective strategy to achieve optimal performance [15]. In conclusion, exploring key opportunities to improve lithium battery efficiency and increase energy density through design parameter optimization and advanced material selection is challenging in the transition to electromobility [14,16].
To accelerate the transition to electric vehicles worldwide, optimizing and designing improvements in battery energy storage is essential. In this context, research has shown that artificial intelligence can be an ally for optimization. In particular, key areas of artificial intelligence, such as supervised and non-supervised machine learning, optimization by metaheuristics, and deep learning, have made important contributions [17]. Based on artificial intelligence, battery design can be studied and optimized through exploitation and exploration. Exploitation involves training models with data generated on performance, lifetime, failures, and other key aspects of battery operation [18]. On the other hand, exploration focuses on finding new materials or components to improve energy storage or battery life, thus opening up new possibilities for battery design and optimization [10].
Applying machine learning techniques in the operation of energy storage batteries has significantly optimized their performance and lifetime. Through research and analysis, several avenues for improvement have been identified: the use of the Krill Herd algorithm to manage energy in microgrids with dynamic reconfiguration has demonstrated improved efficiency and significant cost reduction [19]; the application of machine learning to fault detection in energy storage batteries has led to significant cost reductions improved efficiency and significant cost reduction; the application of machine learning to lithium-ion battery fault detection is effective, reducing the risk of unexpected failures and improving efficiency [20]; finally, Q-learning techniques have allowed optimizing battery management in electric vehicles, significantly improving their efficiency and reducing costs [21]. In short, machine learning has revolutionized battery optimization, significantly improving battery performance and lifetime [22].
In exploring research on lithium-ion batteries, both optimization and design and applying deep learning techniques to improve their management have been addressed. On the one hand, the Physics-Informed Neural Network has provided a method to accurately estimate the useful state of batteries, taking advantage of the combination of physical models and neural networks to capture the dynamics of battery degradation [23]. This allows for the estimation of its useful life with an average error [24]. On the other hand, deep learning techniques have been applied to estimate batteries’ state of charge (SOC), taking advantage of available field and test data. The developed methodology allows for studying different battery chemistries and electrochemical parameter conditions and their correlation with the state of charge [25]. In summary, the combination of models based on the laws of physics and artificial neural networks has proven effective in accurately estimating the utility state and state of charge of batteries, which can significantly improve their management [26].
We present a framework for the analysis and design optimization of lithium-ion batteries based on applying deep learning using a Transformer Deep Learning scheme [27,28]. This framework allows us to accurately analyse the state of charge and discharge of batteries, which is fundamental for their optimization and improvement. The main contributions of this work lie in:
- An electronic system designed specifically for data acquisition and graphical representation of the charge and discharge voltage curves of commercial lithium-ion batteries was developed. This system allows for accurate information on the electrical behavior of batteries under various operating conditions, providing essential data to understand their performance and dynamic characteristics, including the measurement of critical parameters such as voltage, current, and temperature during the charge and discharge processes. This information is valuable not only for the analysis and optimization of commercial batteries, but also for the development of predictive models that improve their management and allow progress in the design of more efficient and long-lasting energy management systems.
- A database of 425 stable batteries has been created, each with its voltage discharge time series and electrochemical parameters. This collection includes a variety of behaviors, including undesirable storage configurations and configurations that match those present in today’s market. This database has been expressly designed to provide rigorous training for simulation and design using the Transformer Deep-Learning scheme.
- We present a neural network trained and refined to simulate lithium-ion batteries’ behavior accurately. This network has been developed by integrating the Informed Physics technique with Pseudo-2D models, which allows for capturing the complex and varied patterns in the responses of these batteries under changes in their electrochemical parameters.
2. Materials and Methods
2.1. Physico-Chemical Model of the Lithium-Ion Battery
The study of the charge/discharge cycles of lithium batteries in a sandwich unit cell is the starting point of our analysis since the battery voltage will depend on the configuration of its unit cell. This analysis allows us to better understand the underlying phenomena affecting the charge density and cycle life of the cell system, which are critical in applications such as lithium-ion batteries. In particular, we focus on the physicochemical models that allow us to describe the electrochemical parameters that, in design or laboratory experimentation, determine battery charge and discharge potentials [29].
The base model for the simulation of a lithium cell was proposed by Doyle, Fuller, and Newman (DFN), which focuses on the idealization of the one-dimensional transport of the lithium-ion from the anode through the separator to the cathode. In particular, DFN deals with lithium-ion diffusion without introducing unnecessary complexity, discarding in the model the generation of additional film elements in the separator zone and volumetric variations during cell operation. The delimitations proposed above allow describing the differential equations in a standard model. On the other hand, it is important to note that the diffusion spaces of the lithium-ion are modeled as spherical elements for simplicity and identification.
In the following, we describe the fundamental equations that model under a physicochemical approach of a lithium cell; the first equation is characterized by Fick’s Law, which studies the diffusion of the lithium-ion between the electrodes in spherical coordinates given by Equation (1):
In agreement with previous works by Doyle et al. [29] and Chen et al. [30], which provide detailed descriptions of the boundary and initial conditions for Equations (1)–(4), we aim to present only the models used in the present investigation. In particular, for Equation (1), the solid-phase ion diffusion coefficient is defined as the proportionality constant between the lithium-ion concentration .
The second governing equation for a lithium battery is defined by the application of Ohm’s law, considering the solid-state regions of the cell. In this context, Equation (2) describes the relationship between the electric potential () and the reaction ratio in the cell (), which is characteristic of the effective electrical conductivity () of the solid phases of the cell.
The third equation, Equation (3), estimates the lithium ion concentration in the electrolyte zone, which is influenced by electrochemical parameters that determine the charge density of the battery. In this context, the lithium-ion comes in contact with a dynamic medium involving the diffusion coefficient (), the amount of porosity of the medium (), the Faraday constant (F), and the ionic transfer value ():
The fourth equation, Equation (4), describes the estimation of the electrolyte’s potential, which is this investigation’s main actor. Since we seek to model the charge/discharge curve of the battery, Equation (4) plays a crucial role in this context:
In particular, the sum of all the potentials of the different phases of the cell determines the total potential, which is a fundamental magnitude for understanding the battery’s behavior. Equation (4) is determined by the conductivity coefficient in the medium (), which describes the cell’s capabilities to conduct electricity.
2.2. Half-Cell of ZnO
Zinc oxide (ZnO) was obtained by chemical precipitation using the methodology described in a previous work [31]. The synthesis was performed using zinc nitrate hexahydrate and NaOH, both at 0.2 M in a molar ratio of 1:2 . The solution was added dropwise to the NaOH solution for 45 min and at a temperature of 50 °C, under constant stirring. The solution was then vigorously agitated with ultrasonic for 30 min at 50 °C. Finally, the temperature was reduced to room temperature, and the precipitate was washed with distilled water and dried at 100 °C for 24 h.
The structural characterization was performed with X-ray diffraction (XRD), using a Bruker D8Advance equipment, for Raman microspectroscopy equipment was used, an Horiba Olympus BX41(50 to 3000 ) green laser whose wavelength is 532 nm. The morphology was measured with scanning electron microscopy (SEM).
On the other hand, the electrochemical characterization of ZnO was performed by assembling a coin-type half-cell. The assembly was made by depositing the anode material on a copper foil. The composition of the anode is a weight ratio of 80|10|10, which is made up of ZnO|carbon super P|polyvinylidine fluoride, respectively. (1M, 150 m) was used as an electrolyte, which was impregnated in a fiberglass separator (0.6 mm thickness), and for the cathode, a metallic Li foil was used whose diameter is 13 mm. Charge and discharge measurements were made for a current density of 100 in a voltage range of 0.01-3.0 V vs. at 25 °C.
2.3. Basic Battery Management System
The electric vehicle industry (EVI) has received significant attention due to the high performance and efficiency of its vehicles, which presents a viable solution to mitigate emissions and address global pollution problems. Vehicles of this kind utilize lithium-ion batteries as their power source, enabling the engines to operate in an eco-friendly and sustainable manner. However, the automotive sector is confronting a pressing necessity: the creation of effective Battery Management Systems (BMS). These systems play a crucial role in accurately gauging and estimating the electrical parameters of batteries and accurately regulating their State of Charge (SOC), thereby guaranteeing optimal and safe operation of electric vehicles.
The advancement of Battery Management Systems (BMS) for electric vehicle batteries is presently in an investigation phase. BMS created for portable electronic devices like cell phones and computers are not directly transferable or adaptable to these applications. Lithium-ion batteries employed in electric vehicles exhibit electrical properties that surpass those of batteries in electronic devices by a factor of at least 100, introducing novel challenges concerning design, efficiency, and scalability for this technology.
A vehicle’s Battery Management System (BMS) comprises various electronic elements that execute several essential tasks. Sensing stages, electronic conditioning stages, control stages, actuators, and a processing stage for real-time programming of control algorithms are included. These phases handle measurement signals that reflect the battery’s charge/discharge electrical conditions, allowing for accurate control of its performance, and thereby guaranteeing its safe and efficient operation.
To design a standardized BMS for monitoring and assessing various lithium-ion batteries, it is essential to consider that such systems utilize the constant voltage/constant current (CV/CC) method for charging. As a result, a simplified model like an Equivalent Circuit Model (ECM) is employed. Presented below is a schematic that illustrates an equivalent circuit, which captures the electronic mathematical representation of a second-order linear dynamic system.
2.3.1. Equivalent Circuit Model (ECM)
Electric vehicles (EVs) use battery packs as key components for their performance. A battery pack is composed of a significant number of individual cells, each of which is a complete battery with two terminals. In this context, the Thévenin equivalent circuit model, introduced mainly by... et al. and later modified by … et al., is proposed in order to estimate the state of charge (SOC) of a lithium-ion battery in electric vehicle (EV) applications using an adaptive Kalman filter as a tool to represent the electrical behavior of the cells. The resistance and capacitance parameters presented in the following model were obtained through Electrochemical Impedance Spectroscopy (EIS) tests on the battery cells. However, this model has limitations in terms of accuracy, as each of the elements that make up it can experience significant variations depending on operating conditions, handling, and battery status.
In the equivalent circuit model shown in Figure 1, the Open Circuit Voltage () represents the State of Charge (SoC) of the battery and can be considered an ideal approximation of a constant voltage source. This parameter reflects the level of energy stored in the battery.
The resistive and capacitive elements of the circuit model the internal phenomena of the battery:
- : represents the ohmic resistance of the cell, associated with the opposition to the passage of current due to the conductive materials of the battery.
- : represents the resistance to electrochemical polarization, which models the losses related to electrochemical processes during charging and discharging.
- : represents the concentration polarization resistance, which describes the losses due to ion transport in the electrolyte.
The equivalent capacitances of the circuit include:
- : The capacitance associated with electrochemical polarization, which reflects the battery’s ability to respond to rapid changes in charge.
- : The capacitance associated with the concentration polarization, which models the transient response due to the movement of ions lithium in the electrolyte.
This set of resistances and capacitances describes the dynamic behavior of the battery, especially during charging and discharging, and allows the capture of its transient response. Together, the model reflects how the internal characteristics of the battery influence its State of Charge (SoC) and overall performance.
2.3.2. Mathematical Equivalent Circuit Model
The proposed equivalent circuit (EMC) described appears to model the electrical behavior of an electrochemical cell by considering several elements representing specific physical and chemical effects. The general description using Kirchhoff’s second law (or voltage law) can be represented as follows:
Cell voltage (): It is modeled as an ideal voltage source, representing the state of charge (SoC) of the cell.
Ohmic resistance (): Immediately after the voltage source, there is a potential drop because of the ohmic resistance of the cell. This includes internal resistances, such as those associated with electrical contacts.
First resonant circuit (): This parallel circuit, composed of a resistor () and a capacitor (), models the resistance of the solid electrolyte. It represents the capacitive and resistive response of the electrolyte.
Second resonant circuit (): Similar to the first, this parallel circuit is composed of a resistor () and a capacitor (), It represents the resistance associated with charge transfer at electrochemical interfaces.
External load (): Finally, the voltage drop due to the load connected to the cell is modeled as resistance.
2.4. Informed Physics-Chemestry Deep Learning
Physico-chemistry is a constantly evolving field where technological advances and mathematical modeling allow complex problems to be tackled more effectively. Deep learning is one of the frontier approaches that is revolutionizing the way physics problem simulations are done. In this context, we use deep neural networks to solve numerical problems and model physico-chemical phenomena, such as the simulation of lithium-ion batteries. In a definitional context, Informed Physics-Chemestry Deep Learning is the area of deep learning neural networks that allow solving problems utilizing the information of the mathematical field that characterizes each problem (conservative laws), for example, the simulation of electrochemical reactions that exist in the transport of lithium ions where deep learning can go deep at different scales, both atomic, molecular, and macroscopic.
2.5. Transformer Deep-Learning
In this section, we will address the implications of Transformers-Deep Learning in the context of the design and optimization of Lithium Ion batteries from their sequence of electrochemical parameters. As a starting point, historically, the concept of attention has become a fundamental tool in machine learning since its introduction in the 1990s [32]. At the time, attention was successfully used in computer vision tasks to study critical regions of images. However, its potential was limited since, at the beginning of the 21st century, specific applications dominated the concept of attention, and it could not be extended to other areas, such as natural language processing or applications in the laws of electrochemistry.
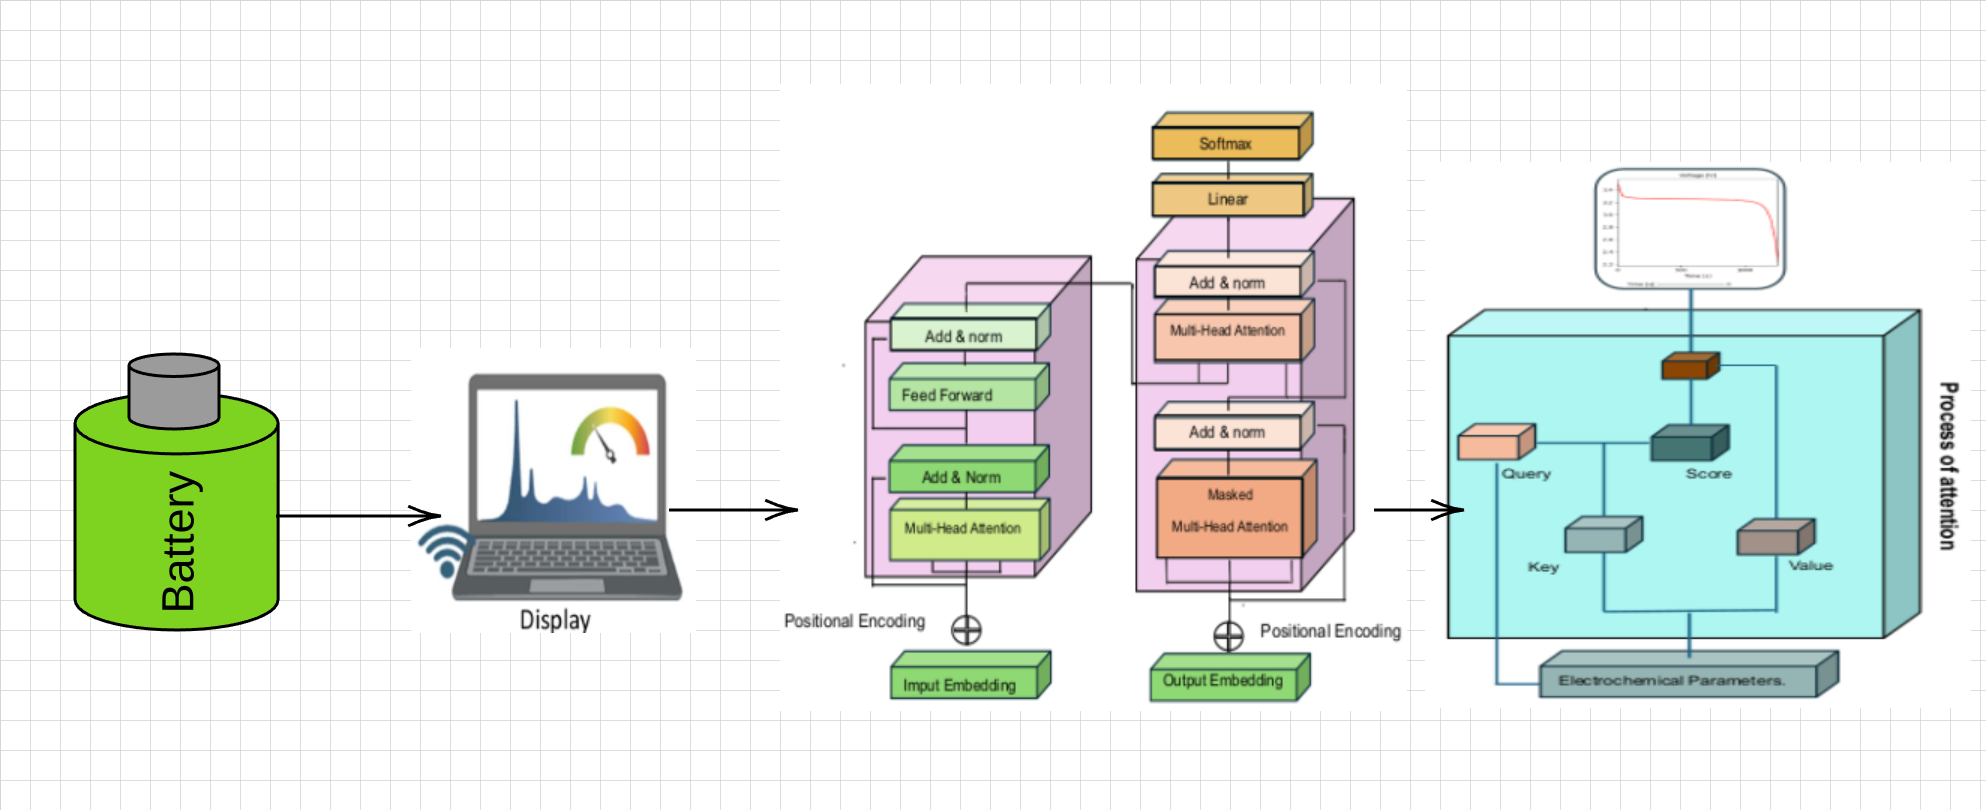
2017 was a turning point in the development of artificial intelligence because Vaswani et al. [27] coined the term “Attention Is All You Need,” which presents the fundamental structure of Transformers. A transformer, Figure 2, is constituted by an attention layer, which is the main part of the learning model since it allows neural networks to pay attention to certain parts of the input data. The attention mechanism was proposed at the end of the 20th century to allow neural networks to focus their attention on particular areas of the input data; consequently, the state of the art has improved the accuracy and efficiency of deep learning.
Critical parameters, such as lithium-ion diffusion, modify the batteries’ storage density in the context of the simulation and design of lithium batteries and their charge-discharge curve. This is where the concept of Attention, Figure 2b, allows deep learning to focus on the most relevant characteristics of the most relevant parameters in energy storage. In the next subsection, we will address the architecture of a Deep-Learning Transformer in battery design and simulation; then, we will focus on encoder and decoder processing to provide a complete framework for battery behavioral learning.
2.5.1. Encoder
The encoder, Figure 2a is one of the components of the Transformers model for Deep Learning, which is constituted by a set of layers divided into two main elements: the first, the multi-headed attention, is used to process the input information and obtain a compact representation of the data, this layer uses three matrices constituted by Query Q, Key K and Value V; the second, the forward-feed layer, is used to process the information obtained in the multi-headed attention layer and obtain a complete representation of the data. The forward-feed layer works as follows: the output of the multi-head attention layer of the electrochemical parameters is used, and a dense neural network processes the information to obtain a complete representation representative of the main elements that modulate the Lithium batteries.
2.5.2. Decoder
The Decoder, Figure 2b, is a key system in the transformer architecture; in the practice of deep learning on lithium battery values, it allows the translation of the sequence of information in terms of responses of interest, e.g., charge-discharge curves. In contrast to the Encoder, the Decoder includes layers such as Masked Multi-Head Attention, Multi-Head Attention, Feed-Forward, Residual Connection. These layers use the scaled product to exclude electrochemical parameter estimates and consider only outputs of interest in the discharge curve. In the electrochemical parameter learning practice, the attention mechanism is applied twice in the Decoder: first, to estimate the attention between output elements in the lithium-ion battery discharge, and second, to determine the attention between the parameter and the charge curve.
3. Results
3.1. Experimental Setup
In order to characterize the properties of lithium batteries, we designed a series of experiments to evaluate their behavior during the charging and discharging process. To achieve this, we carried out a cell-level experimentation based on material analysis to characterize the charge and discharge of lithium batteries and determine their characteristic curves, an analysis of electronic instrumentation for data acquisition, and finally, deep learning training, focusing on the behavior of the voltage discharge curve about the electrochemical parameters of the battery:
On the other hand, in the context of the development of lithium batteries, it is essential to characterize their behavior during the charge and discharge process. We developed an electronic design based on data acquisition circuits to measure and calculate the voltage versus time curve to achieve this goal. This tool allows us to collect accurate data on the behavior of batteries during the charge and discharge process, particularly in the discharge cycle. In this approach, we analyzed various types: CR2032, CR1616, CR2025, CR2016, CR2050, CR1620, CR1632, and CR2430. In addition, we built a database of rechargeable batteries, such as CRG-255, 18650, CR2, CRP2, CRP2, 14500, and CR123. As a contribution to the community, we have provided access to the data generated in this study; our database is available on GitHub (https://github.com/Optimization-litihum-Baterry/electrochemistry_database-.git).
Finally, we developed a database containing the experimental results of 425 stable batteries, which were obtained from the numerical estimation presented in subsection 1; under the standards presented in State of the Art, our contribution is to generate a set of electrochemical parameters, cell discharge time series, and simulation time. These database elements were generated to train a machine learning model based on Transformer Deep Learning, which is used to design or optimize lithium-ion batteries with a nominal voltage standard of 3.9 to 4.2 Volts.
3.2. Half-Cell
Figure 3a shows the diffraction pattern of ZnO in which only the signals corresponding to the crystalline phase of this material are observed (COD-2300450). The results show only the characteristic planes of the which are: (101), (100), (002) and (102), as no other signal is observed, it can be assumed that the was only obtained in the expected phase. Furthermore, in Figure 3b a micro-Raman spectra of is shown where only the vibrational modes at 98, 202, 330, 380, 437 and 581 are observed. These results corroborate the results obtained by XRD since no signals that don’t correspond to ZnO are observed either.
The charge-discharge measurements are shown in Figure 3c, the battery, which in this case is a half-cell, was measured under the conditions described above, i.e., a current density of in a voltage range of vs. at . Ten charge and discharge cycles were performed as observed at the peaks of each signal. However, in the same figure each cycle is carried out at different times, since it is known that as the cycles increase, every battery loses capacity and therefore, the charging and discharging times for each cycle are reduced. This is shown in Figure 3c, where the first cycle is performed in and gradually reduced to in cycle 10.
3.3. Data Acquisition System
The block diagram of the data acquisition system is presented in this investigation in Figure 4. The data obtained through this system are crucial to collect reliable and accurate experimental data on commercial rechargeable lithium batteries such as BAT-Li-AAA, BAT-Li14500 and LIR18500. This system allows monitoring, controlling, and recording the voltage discharge curves as a function of time, as well as other relevant electrochemical parameters under different operating conditions. The importance of obtaining these curves lies in that they provide a detailed view of the behavior of the batteries.
This database covers not only common configurations in the current market, but also undesired behaviors, which enriches the range of data available for model training. In this context, the diversity of data collected ensures that simulation and design models, such as those based on deep learning schemes with Transformers, can be rigorously trained, covering a wide variety of real and potential scenarios.
Furthermore, the information obtained from these curves is essential for developing and refining neural networks capable of accurately simulating the behavior of lithium batteries. The integration of techniques such as Informed Physics and Pseudo-2D models allows capturing the complex and varied patterns in the responses of these batteries to changes in their electrochemical parameters. This is essential for the design of more efficient and long-lasting batteries, as well as for improving simulations that inform critical decisions in energy storage and management systems.
Below is a detailed description of the data acquisition system for obtaining charge and discharge graphs for commercial lithium-ion batteries.
3.3.1. Data Acquisition Process Details Sensing Stage
High-precision sensors were used to capture variations in battery parameters. These sensors were selected based on the specific nature of each variable.
- Current: Measured with a Hall effect-based sensor, capable of recording both alternating currents (AC) and direct currents (DC).
- Voltage: The signal was conditioned using attenuation/amplification and filtering circuits to ensure an accurate reading even in the presence of noise.
- Temperature: Recorded using a thermistor, whose resistance change proportional to temperature allowed reliable measurements of thermal conditions.
3.3.2. Sampling and Holding Process
The analog data was digitized using an ADC converter integrated into an ESP32 microcontroller. This device was configured for an appropriate sampling rate, which ensures accurate and continuous data capture in real time. In addition, standard communication protocols were used to transfer the data to the central processing system.
3.3.3. Processing and Storage
Once acquired, the data were processed using algorithms designed to calculate parameters such as state of charge (SoC), available capacity, charge/discharge rates, and thermal behavior. These data were stored in a structured database to facilitate later analysis and visualization.
3.3.4. Utility of Experimental Data
Detailed analysis of the charge/discharge graph allows identifying important patterns and trends in battery performance. This includes:
The efficiency of the charge and discharge process under different operating conditions. The influence of factors such as temperature and usage cycles on the remaining battery capacity. The detection of possible anomalies, such as overheating or abrupt voltage drops, could compromise the battery’s lifespan.
In Figure 5, the charge and discharge behavior of an LIR18500 type battery, obtained from experimental data collected using our Battery Management System (BMS), is shown.
This experimental database was generated by constantly monitoring critical battery parameters such as voltage, current, and temperature during operation. The data were recorded under different charge and discharge conditions to ensure that they were representative of the actual behavior of the battery.
3.4. Deep-Learning Transformer Training Database
The deep learning canon divides the validation of a model into three main stages: first, setting up the training dataset, which contains the necessary information to highlight the main data; second, the training process, where the learning structures are fitted to the database; third, data validation, a crucial step to know the level of confusion or uncertainty in the database. Consequently, Transformer deep Learning is a structure adapted following the canon of Learning, and therefore, in the following sections, we will follow this methodology.
As a first stage of deep learning, we have designed and built a set of simulations and experimental analysis of lithium battery discharge measurements for the training of models based on Transformer and other techniques following the same methodology; the simulations have been configured by the model of section 1, focusing the attention on the electrochemical parameters that coincide with the configurations that determine a lithium battery. This set of simulations is bounded to a voltage boundary between 4.2 and 2 volts, constituting a fundamental basis for training. This process is crucial as it allows the deep learning structures to adjust to the electrochemical parameter information, resulting in more accurate and effective models.
We have released a lithium battery simulation experiment set, which is available in our GitHub repository for access and exploitation. This set of experiments is composed of three fundamental elements: the electrochemical parameters that define the experimental configuration of a battery, the time window plots derived from the experimental design simulation, and the lithium battery discharge voltage data. The selection of the electrochemical parameters involved has been carried out from state-of-the-art research for their level of importance, which has identified 45 fundamental parameters that form the basis of the study—appendix A details these essential elements, providing crucial information for their understanding and application in future research (https://github.com/Optimization-litihum-Baterry/electrochemistry_database-.git).
To illustrate the database proposed in this work, Figure 6 highlights two significant simulation experiments for lithium batteries, each illustrating a particular behavior with variations in electrochemical parameters. In Figure 6a, a battery is observed that starts with an initial voltage of 4.1 V and discharges following a linear trend until it reaches 3.3 V, highlighted by a discharge slope. This pattern suggests a controlled response to discharge. In contrast, in Figure 6b shows a different experiment where the initial voltage is 4 V and decreases slowly, where the discharge slope is maintained with a horizontal trend; finally, at about 0.8 hours, the discharge behavior changes exponentially until reaching 2.8 V.
The experiments presented in the database provide a training corpus to analyze different scenarios and battery behaviors, enriching the variations of electrochemical parameters and their response in voltage density. By having access to these variations of results, the training process can delve into different Deep-Learning methodologies for creating new models and develop effective strategies to predict and understand the discharge voltages in real experiments. This not only allows a deeper understanding of lithium battery operation but also provides valuable tools for the development of solutions in the field of electric vehicles.
3.5. Transformer Deep Learning Training and Validation
In the deep learning methodology, the second stage of processing lies in training the specific system or model to be implemented. In our particular case, we are working with deep learning transformers, a new paradigm of deep artificial neural networks, and advanced attention techniques. The main objective of this stage is to prepare the model to perform dedicated learning tasks and attention to the relevant electrochemical parameters that characterize a lithium battery. To achieve this, we perform experiments using the databases from Section 3.3-Section 3.4, taking into account experimental material measurements, computational simulation, and measurements of commercial lithium batteries.
Figure 7 shows the convergence behavior of the transformer-based deep learning model for time series (charge/discharge curve), which we have implemented as part of our methodology. In particular, the transformer methodology implemented the following sequence of steps: first, embedded inputs, characterized by passing the electrochemical parameters, the time, and the discharge curve through the neural network layers; second, combination of Embeddings, at this point the electrochemical parameters are summed with the discharge curve and the time; third, the Paddings mask, which discards patterns and prepares the data for the attention stage; fourth, transformer encoding, its objective is the self-attention process by a set of intermediate dense networks; fifth, output layer, where the result is configured in terms of the charge/discharge time series.
Once the training process of the Transformer-based model has been achieved, the next step in the deep-learning methodology is to validate the learning results with the experimental databases described above. Figure 8 shows a comparative approximation between an experimental measurement of the rechargeable lithium battery in a time window of 3600 s; the predictive approach is characterized by fitting the discharge curve to the transform and then estimating the electrochemical parameters of the battery. For example, we show the validation of the results in experimental measurements for two commercial batteries, the 18650 and another one of the same type, but with serial number 14500, both characterized by providing a used voltage of 3.7 V.
In the first battery, Figure 8a, we observed that the model managed to fit adequately along the experimental voltage curve, which implies an approximate confidence level in the electrochemical parameters modeling the behavior of the 18650 battery. In summary, the obtained parameters in Table 1 can be described as a good representation of the battery behavior without the need for invasive experimentation of the structure and its components. In Table 1, we have reported and delimited for practicality those parameters that we consider relevant in manufacturing. In comparison, the state-of-the-art results of this type of battery allow us to verify that the transformer has achieved competitive results in describing a battery from its discharge curve measurement.
On the other hand, in the battery of Figure 8b, we observed that the model was properly fitted during the first units of time up to approximately 1500 seconds. However, the abrupt change that the battery takes after 3000 seconds generates uncertainty in the model and cannot achieve a good approximation of the electrochemical parameters described by this battery. In Table 2, we present the electrochemical parameters. Although they are valid, these parameters have certain levels of approximation; nevertheless, before the design of a lithium battery, they are elements to begin its configuration, as well as the optimization of batteries where a starting solution set is needed.
4. Discussion
One of the most important aspects of the present research is the proposal of a database that includes experimental results from 425 stable batteries, which are available to open an area of research in the design and optimization of lithium batteries from Deep-learning Transformers. This database was used to train a deep-learning model based on Transformers, which allowed accurate prediction of discharge curves of both commercial and matter-design lithium batteries. In addition, the research discusses the importance of characterizing the behavior of lithium batteries during their charging and discharging process. This concluded that this characterization is fundamental to improving the efficiency and durability of these batteries without an exhaustive laboratory analysis.
The scientific implications of this research bring new advances to the state of the art, as they directly address the development of more advanced technologies in lithium battery design and optimization, a crucial point to reduce the consumption of fossil fuels in electromobility. The ability to accurately predict these batteries’ charge and discharge curves makes optimizing their design and operation possible. In addition, the research has significant practical applications in developing electric vehicles and other devices that rely on these batteries. By improving the efficiency and durability of lithium batteries, the cost and range of these vehicles can be reduced.
5. Conclusions
In this research, we have presented an experimental characterization of material and time series acquisition of lithium batteries to be applied to deep learning models, particularly Transformer Deep-Learning, which are applied to the simulation and prediction of lithium batteries’ charging and discharging behavior. The main objective of the research was achieved through the characterization of measurement and monitoring of lithium-ion batteries, resulting in a set of electrochemical parameters that characterize the behavior of the battery; from the experimental database, we have trained a model based on deep-learning transformers that can accurately predict the behavior of these parameters, without the need for invasive analysis of the battery.
As one of the main contributions of the research, we have designed and trained a model based on deep learning transformers to simulate the behavior of lithium batteries from the charge and discharge curve of a lithium battery and dedicated the attention mechanism to the electrochemical parameters that characterize a battery. This is through the use of a combination of experimental measurements of materials, computational simulations, and commercial battery measurements; concluding, from Section 3, in their results, Table 1 and Table 2, state that it is possible to train a deep learning model that allows predicting the behavior of a lithium battery.
From another perspective, the research results show that the proposed Transformer model can achieve adequate training convergence for approximating experimental voltage discharges. This indicates that the electrochemical parameters modeling the battery behavior are reliable in battery discharge predictions. In the first case study, the Transformer model reliably fits the experimental voltage time series for the 18650 battery, Section 3.5.
The research we have presented in this scientific paper opens new perspectives for the development of more advanced battery technologies. It focuses on design and optimization, which are fundamental in electric vehicles that are transitioning towards the eradication of fossil fuel use. In line with the results and findings of the Transformer deep learning, the design, and optimization of lithium batteries can positively impact the development of electric vehicles and other devices that rely on them.
Author Contributions
Conceptualization, Juan de Anda-Suárez, Germán Pérez-Zúñiga, and José L. López-Ramírez; methodology, Juan de Anda-Suárez, Germán Pérez-Zúñiga, and José L. López-Ramírez; software, Juan de Anda-Suárez, Germán Pérez-Zúñiga, and José L. López-Ramírez; formal analysis, Juan de Anda-Suárez, Germán Pérez-Zúñiga, and José L. López-Ramírez; investigation, Juan de Anda-Suárez, Germán Pérez-Zúñiga, and José L. López-Ramírez; data curation, Herrera Pérez, Isaías Zeferino González, and José Ysmael Verde Gómez; writing—original draft preparation, Juan de Anda-Suárez, Germán Pérez-Zúñiga, and José L. López-Ramírez, Herrera Pérez, Isaías Zeferino González, and José Ysmael Verde Gómez; writing—review and editing, Herrera Pérez, Isaías Zeferino González, and José Ysmael Verde Gómez; visualization, Herrera Pérez, Isaías Zeferino González, and José Ysmael Verde Gómez; All authors have read and agreed to the published version of the manuscript.
Data Availability Statement
Experiment data for training and analysis of lithium batteries are published in the repository: https://github.com/Optimization-litihum-Baterry/electrochemistry_database-.git.
Acknowledgments
We thank the Consejo Nacional de Humanidades, Ciencias y Tecnologías for supporting and motivating the research’s development, the Tecnológico Nacional de México for approving the project financed with key: 19918.24-PD, which made possible the experimentation and the work’s results with its contributions, and the Instituto Tecnológico Superior de Purísima del Ricón for the time provided to work on the project.
Conflicts of Interest
The authors declare no conflicts of interest.
Appendix A
Appendix A.1
Table A1 summarizes the electrochemical parameters selected from the literature related to the characteristics that modulate and characterize the behavior of a lithium-ion battery. The objective of Table A1 is to construct a database containing experiments on stable lithium-ion batteries for training deep learning methodologies, which are deposited in the Github repository (https://github.com/Optimization-litihum-Baterry/electrochemistry_database-.git). Some of the parameters listed are constant variables that are part of the design and manipulation of lithium-ion batteries. However, an additional set of independent variables modulates battery behavior. Accordingly, these parameters are listed in the database.

Table A1.
This is a table caption.
| Nombre | Variable |
|---|---|
| Ideal gas constant [J.K-1.mol-1] | 7.300 |
| Faraday constant [C.mol-1] | 70194.084 |
| Boltzmann constant [J.K-1] | 0.000 |
| Electron charge [C] | 0.000 |
| Negative electrode thickness [m] | 0.000 |
| Separator thickness [m] | 0.000 |
| Positive electrode thickness [m] | 0.000 |
| Electrode height [m] | 0.500 |
| Electrode width [m] | 0.200 |
| Nominal cell capacity [A.h] | 2.748 |
| Current function [A] | 1.545 |
| Contact resistance [Ohm] | 0.000 |
| Negative electrode conductivity [S.m-1] | 173.022 |
| Maximum concentration in negative electrode [mol.m-3] | 43023.260 |
| Negative electrode diffusivity [m2.s-1] | 0.000 |
| Negative electrode porosity | 0.350 |
| Negative electrode active material volume fraction | 0.737 |
| Negative particle radius [m] | 0.000 |
| Negative electrode Bruggeman coefficient (electrolyte) | 1.410 |
| Negative electrode Bruggeman coefficient (electrode) | 1.415 |
| Negative electrode charge transfer coefficient | 0.468 |
| Negative electrode double-layer capacity [F.m-2] | 0.174 |
| Negative electrode OCP entropic change [V.K-1] | 0.000 |
| Positive electrode conductivity [S.m-1] | 0.306 |
| Maximum concentration in positive electrode [mol.m-3] | 26597.640 |
| Positive electrode diffusivity [m2.s-1] | 0.000 |
| Positive electrode porosity | 0.379 |
| Positive electrode active material volume fraction | 0.233 |
| Positive particle radius [m] | 0.000 |
| Positive electrode Bruggeman coefficient (electrode) | 1.134 |
| Positive electrode Bruggeman coefficient (electrolyte) | 2.444 |
| Positive electrode charge transfer coefficient | 0.539 |
| Positive electrode double-layer capacity [F.m-2] | 0.260 |
| Positive electrode OCP entropic change [V.K-1] | 0.000 |
| Separator porosity | 0.457 |
| Separator Bruggeman coefficient (electrolyte) | 1.221 |
| Initial concentration in electrolyte [mol.m-3] | 1216.002 |
| Cation transference number | 0.495 |
| Thermodynamic factor | 2.030 |
| Electrolyte diffusivity [m2.s-1] | 0.000 |
| Reference temperature [K] | 439.879 |
| Ambient temperature [K] | 311.921 |
| Number of electrodes connected in parallel to make a cell | 0.629 |
| Number of cells connected in series to make a battery | 0.980 |
| Lower voltage cut-off [V] | 1.610 |
| Upper voltage cut-off [V] | 3.658 |
| Open-circuit voltage at 0% SOC [V] | 1.911 |
| Open-circuit voltage at 100% SOC [V] | 4.108 |
| Initial concentration in negative electrode [mol.m-3] | 24340.483 |
| Initial concentration in positive electrode [mol.m-3] | 90.190 |
| Initial temperature [K] | 275.012 |
References
- Abbasi, K.; Ali, P.; Barbour, V.; Benfield, T.; Bibbins-Domingo, K.; Hancocks, S.; Horton, R.; Laybourn-Langton, L.; Mash, R.; Sahni, P.; et al. Time to treat the climate and nature crisis as one indivisible global health emergency. npj Primary Care Respiratory Medicine 2023, 33, 37. [Google Scholar] [CrossRef]
- Gabric, A.J. The Climate Change Crisis: A Review of Its Causes and Possible Responses. Atmosphere 2023, 14, 1081. [Google Scholar] [CrossRef]
- Kumar, S.; Chatterjee, U.; Raj, A.D.; Sooryamol, K.R. Global Warming and Climate Crisis/Extreme Events; 2023; pp. 3–18. [CrossRef]
- Fu, Y.; Bai, H.; Cai, Y.; Yang, W.; Li, Y. Optimal configuration method of demand-side flexible resources for enhancing renewable energy integration. Scientific Reports 2024, 14, 7658. [Google Scholar] [CrossRef] [PubMed]
- Chatuanramtharnghaka, B.; Deb, S.; Singh, K.R.; Ustun, T.S.; Kalam, A. Reviewing Demand Response for Energy Management with Consideration of Renewable Energy Sources and Electric Vehicles. World Electric Vehicle Journal 2024, 15, 412. [Google Scholar] [CrossRef]
- Tomczyk, M.; Wojtaszek, H.; Chackiewicz, M.; Orłowska, M. Electromobility and Renewable Energy Sources: Comparison of Attitudes and Infrastructure in Poland and Germany. Energies 2023, 16, 7935. [Google Scholar] [CrossRef]
- Habib, K.; Hansdóttir, S.T.; Habib, H. Critical metals for electromobility: Global demand scenarios for passenger vehicles, 2015–2050. Resources, Conservation and Recycling 2020, 154, 104603. [Google Scholar] [CrossRef]
- Kostenko, G.; Zaporozhets, A. Transition from Electric Vehicles to Energy Storage: Review on Targeted Lithium-Ion Battery Diagnostics. Energies 2024, 17, 5132. [Google Scholar] [CrossRef]
- Alanazi, F. Electric Vehicles: Benefits, Challenges, and Potential Solutions for Widespread Adaptation. Applied Sciences 2023, 13, 6016. [Google Scholar] [CrossRef]
- Suanpang, P.; Jamjuntr, P. Optimal Electric Vehicle Battery Management Using Q-learning for Sustainability. Sustainability 2024, 16, 7180. [Google Scholar] [CrossRef]
- Lin, Z.; Li, D.; Zou, Y. Energy efficiency of lithium-ion batteries: Influential factors and long-term degradation. Journal of Energy Storage 2023, 74, 109386. [Google Scholar] [CrossRef]
- Nyamathulla, S.; Dhanamjayulu, C. A review of battery energy storage systems and advanced battery management system for different applications: Challenges and recommendations. Journal of Energy Storage 2024, 86, 111179. [Google Scholar] [CrossRef]
- Ajibade, H.; Ujah, C.O.; Nnakwo, K.C.; Kallon, D.V.V. Improvement in battery technologies as panacea for renewable energy crisis. Discover Applied Sciences 2024, 6, 374. [Google Scholar] [CrossRef]
- Ghani, F.; An, K.; Lee, D. A Review on Design Parameters for the Full-Cell Lithium-Ion Batteries. Batteries 2024, 10, 340. [Google Scholar] [CrossRef]
- Zeng, Y.; Zhang, B.; Fu, Y.; Shen, F.; Zheng, Q.; Chalise, D.; Miao, R.; Kaur, S.; Lubner, S.D.; Tucker, M.C.; et al. Extreme fast charging of commercial Li-ion batteries via combined thermal switching and self-heating approaches. Nature Communications 2023, 14, 3229. [Google Scholar] [CrossRef]
- Chen, G.J.; Chung, W.H. Evaluation of Charging Methods for Lithium-Ion Batteries. Electronics 2023, 12, 4095. [Google Scholar] [CrossRef]
- Zhang, J.; Wang, Y.; Jiang, B.; He, H.; Huang, S.; Wang, C.; Zhang, Y.; Han, X.; Guo, D.; He, G.; et al. Realistic fault detection of li-ion battery via dynamical deep learning. Nature Communications 2023, 14, 5940. [Google Scholar] [CrossRef]
- Karthick, K.; Ravivarman, S.; Priyanka, R. Optimizing Electric Vehicle Battery Life: A Machine Learning Approach for Sustainable Transportation. World Electric Vehicle Journal 2024, 15, 60. [Google Scholar] [CrossRef]
- Hassan, M. Machine learning optimization for hybrid electric vehicle charging in renewable microgrids. Scientific Reports 2024, 14, 13973. [Google Scholar] [CrossRef]
- Samanta, A.; Chowdhuri, S.; Williamson, S.S. Machine Learning-Based Data-Driven Fault Detection/Diagnosis of Lithium-Ion Battery: A Critical Review. Electronics 2021, 10. [Google Scholar] [CrossRef]
- Jiang, Y.; Song, W. Predicting the Cycle Life of Lithium-Ion Batteries Using Data-Driven Machine Learning Based on Discharge Voltage Curves. Batteries 2023, 9, 413. [Google Scholar] [CrossRef]
- Nozarijouybari, Z.; Fathy, H.K. Machine learning for battery systems applications: Progress, challenges, and opportunities. Journal of Power Sources 2024, 601, 234272. [Google Scholar] [CrossRef]
- Wang, F.; Zhai, Z.; Zhao, Z.; Di, Y.; Chen, X. Physics-informed neural network for lithium-ion battery degradation stable modeling and prognosis. Nature Communications 2024, 15, 4332. [Google Scholar] [CrossRef] [PubMed]
- Lu, J.; Xiong, R.; Tian, J.; Wang, C.; Sun, F. Deep learning to estimate lithium-ion battery state of health without additional degradation experiments. Nature Communications 2023, 14, 2760. [Google Scholar] [CrossRef] [PubMed]
- Tian, J.; Chen, C.; Shen, W.; Sun, F.; Xiong, R. Deep Learning Framework for Lithium-ion Battery State of Charge Estimation: Recent Advances and Future Perspectives. Energy Storage Materials 2023, 61, 102883. [Google Scholar] [CrossRef]
- Madani, S.S.; Ziebert, C.; Vahdatkhah, P.; Sadrnezhaad, S.K. Recent Progress of Deep Learning Methods for Health Monitoring of Lithium-Ion Batteries. Batteries 2024, 10, 204. [Google Scholar] [CrossRef]
- Vaswani, A.; Shazeer, N.; Parmar, N.; Uszkoreit, J.; Jones, L.; Gomez, A.N.; Kaiser, L.; Polosukhin, I. Attention Is All You Need. CoRR 2017. abs/1706.03762. [Google Scholar] [CrossRef]
- Nayak, G.H.; Alam, M.W.; Avinash, G.; Kumar, R.R.; Ray, M.; Barman, S.; Singh, K.; Naik, B.S.; Alam, N.M.; Pal, P.; et al. Transformer-based deep learning architecture for time series forecasting. Software Impacts 2024, 22, 100716. [Google Scholar] [CrossRef]
- Doyle, M.; Fuller, T.F.; Newman, J. Modeling of Galvanostatic Charge and Discharge of the Lithium/Polymer/Insertion Cell. Journal of The Electrochemical Society 1993, 140, 1526. [Google Scholar] [CrossRef]
- Chen, C.H.; Planella, F.B.; O’Regan, K.; Gastol, D.; Widanage, W.D.; Kendrick, E. Development of Experimental Techniques for Parameterization of Multi-scale Lithium-ion Battery Models. Journal of The Electrochemical Society 2020, 167, 080534. [Google Scholar] [CrossRef]
- Pérez-Zúñiga, G.; Herrera-Pérez, G.; Verde-Gómez, Y.; Valenzuela-Muñiz, A.M. Self-assembled ZnO-rGO nanocomposite, a solid-state transformation to control its crystallite size. Journal of Alloys and Compounds 2021, 875, 159992. [Google Scholar] [CrossRef]
- Niu, Z.; Zhong, G.; Yu, H. A review on the attention mechanism of deep learning. Neurocomputing 2021, 452, 48–62. [Google Scholar] [CrossRef]
Figure 1.
Equivalent circuit model.
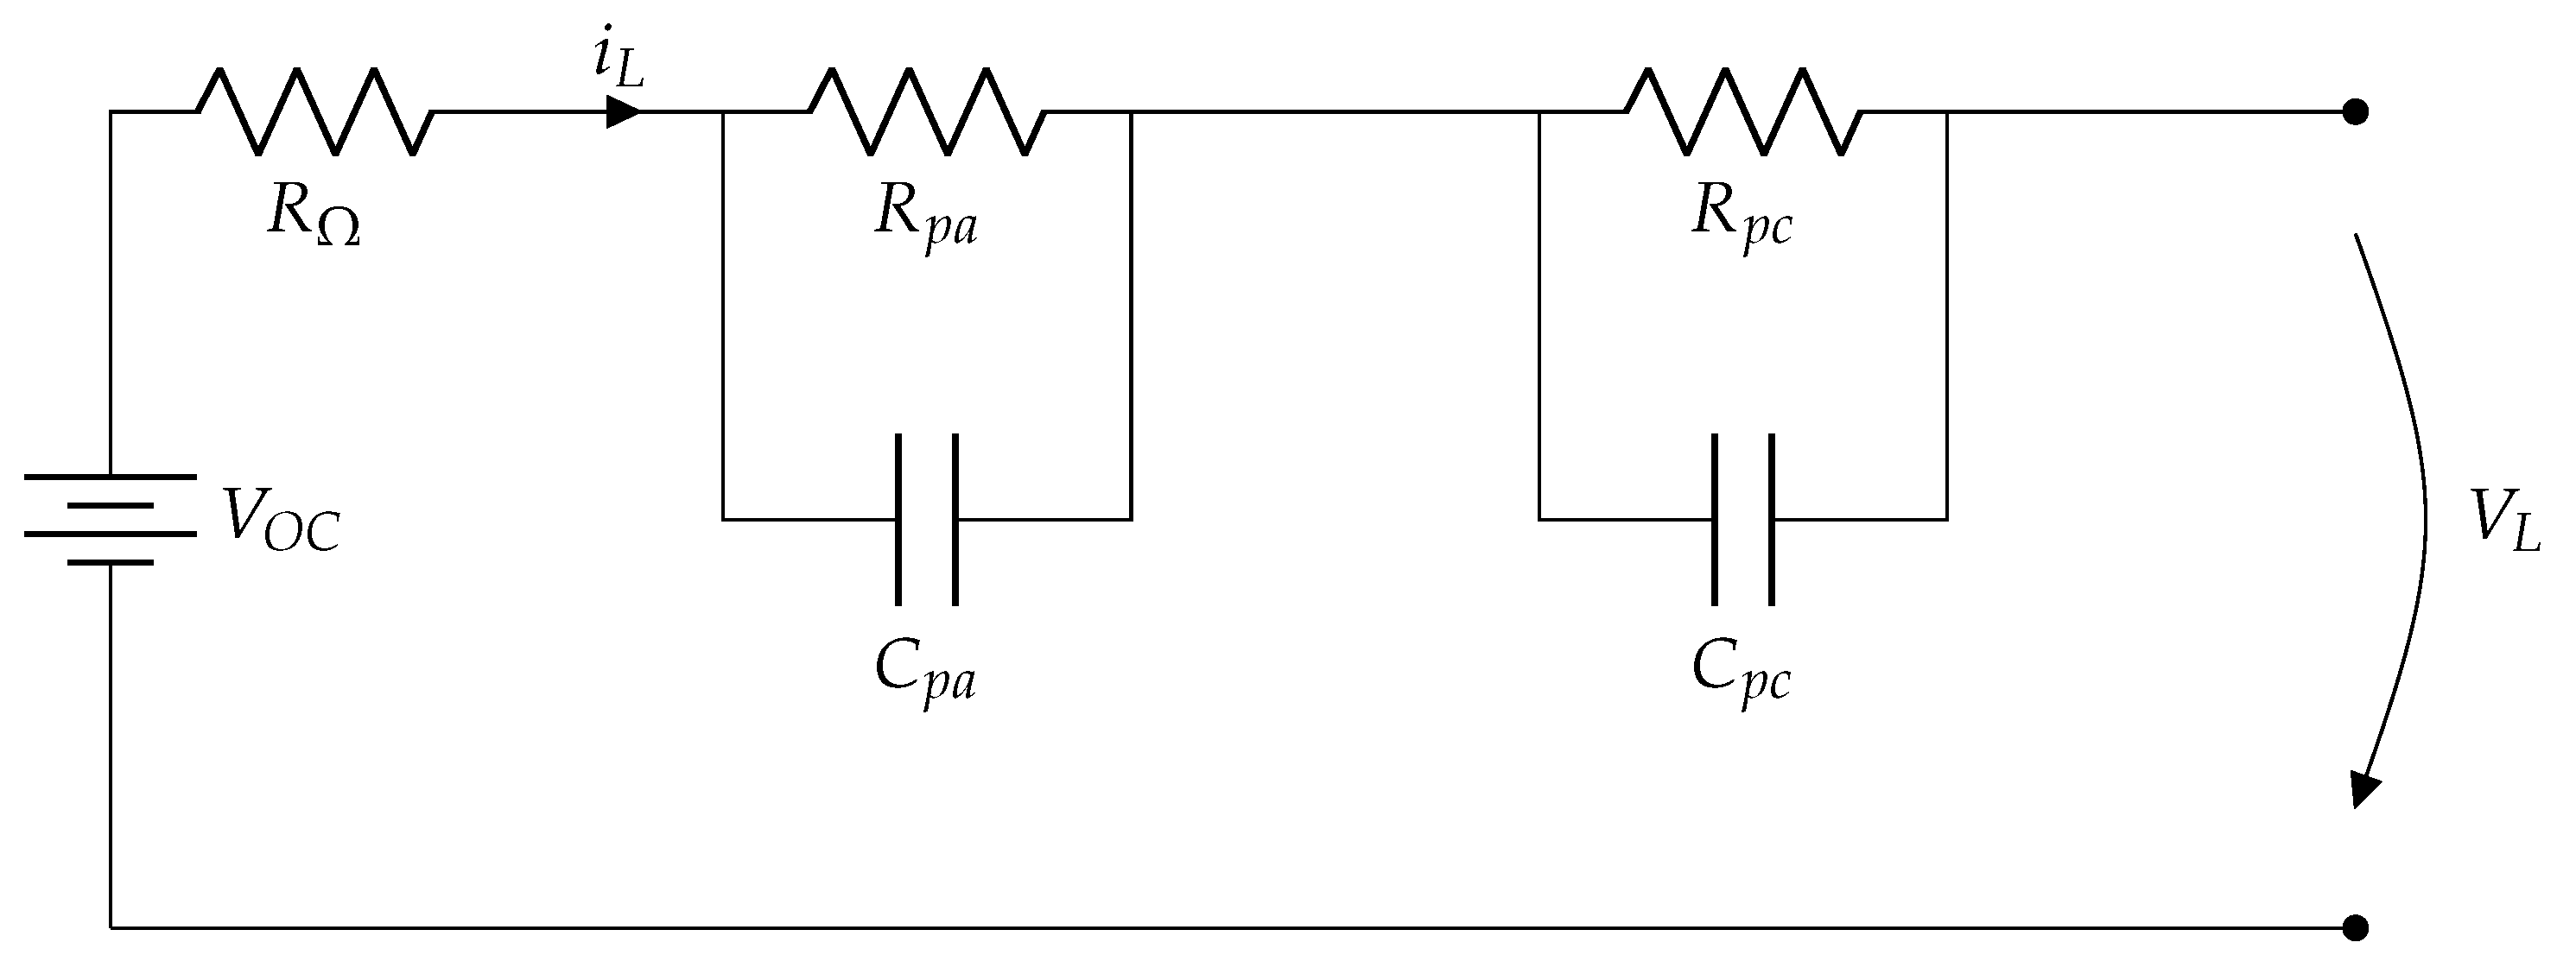
Figure 2.
Representation of the Transformer deep learning model for the estimation of the charge/discharge curve from the electro-chemical parameters of stable batteries: (a) describes the encoder-decoder process for the input patterns (electro-chemical parameters); (b) represents the attention mechanism for the description of the learning curve from the physical-chemistry of the battery.
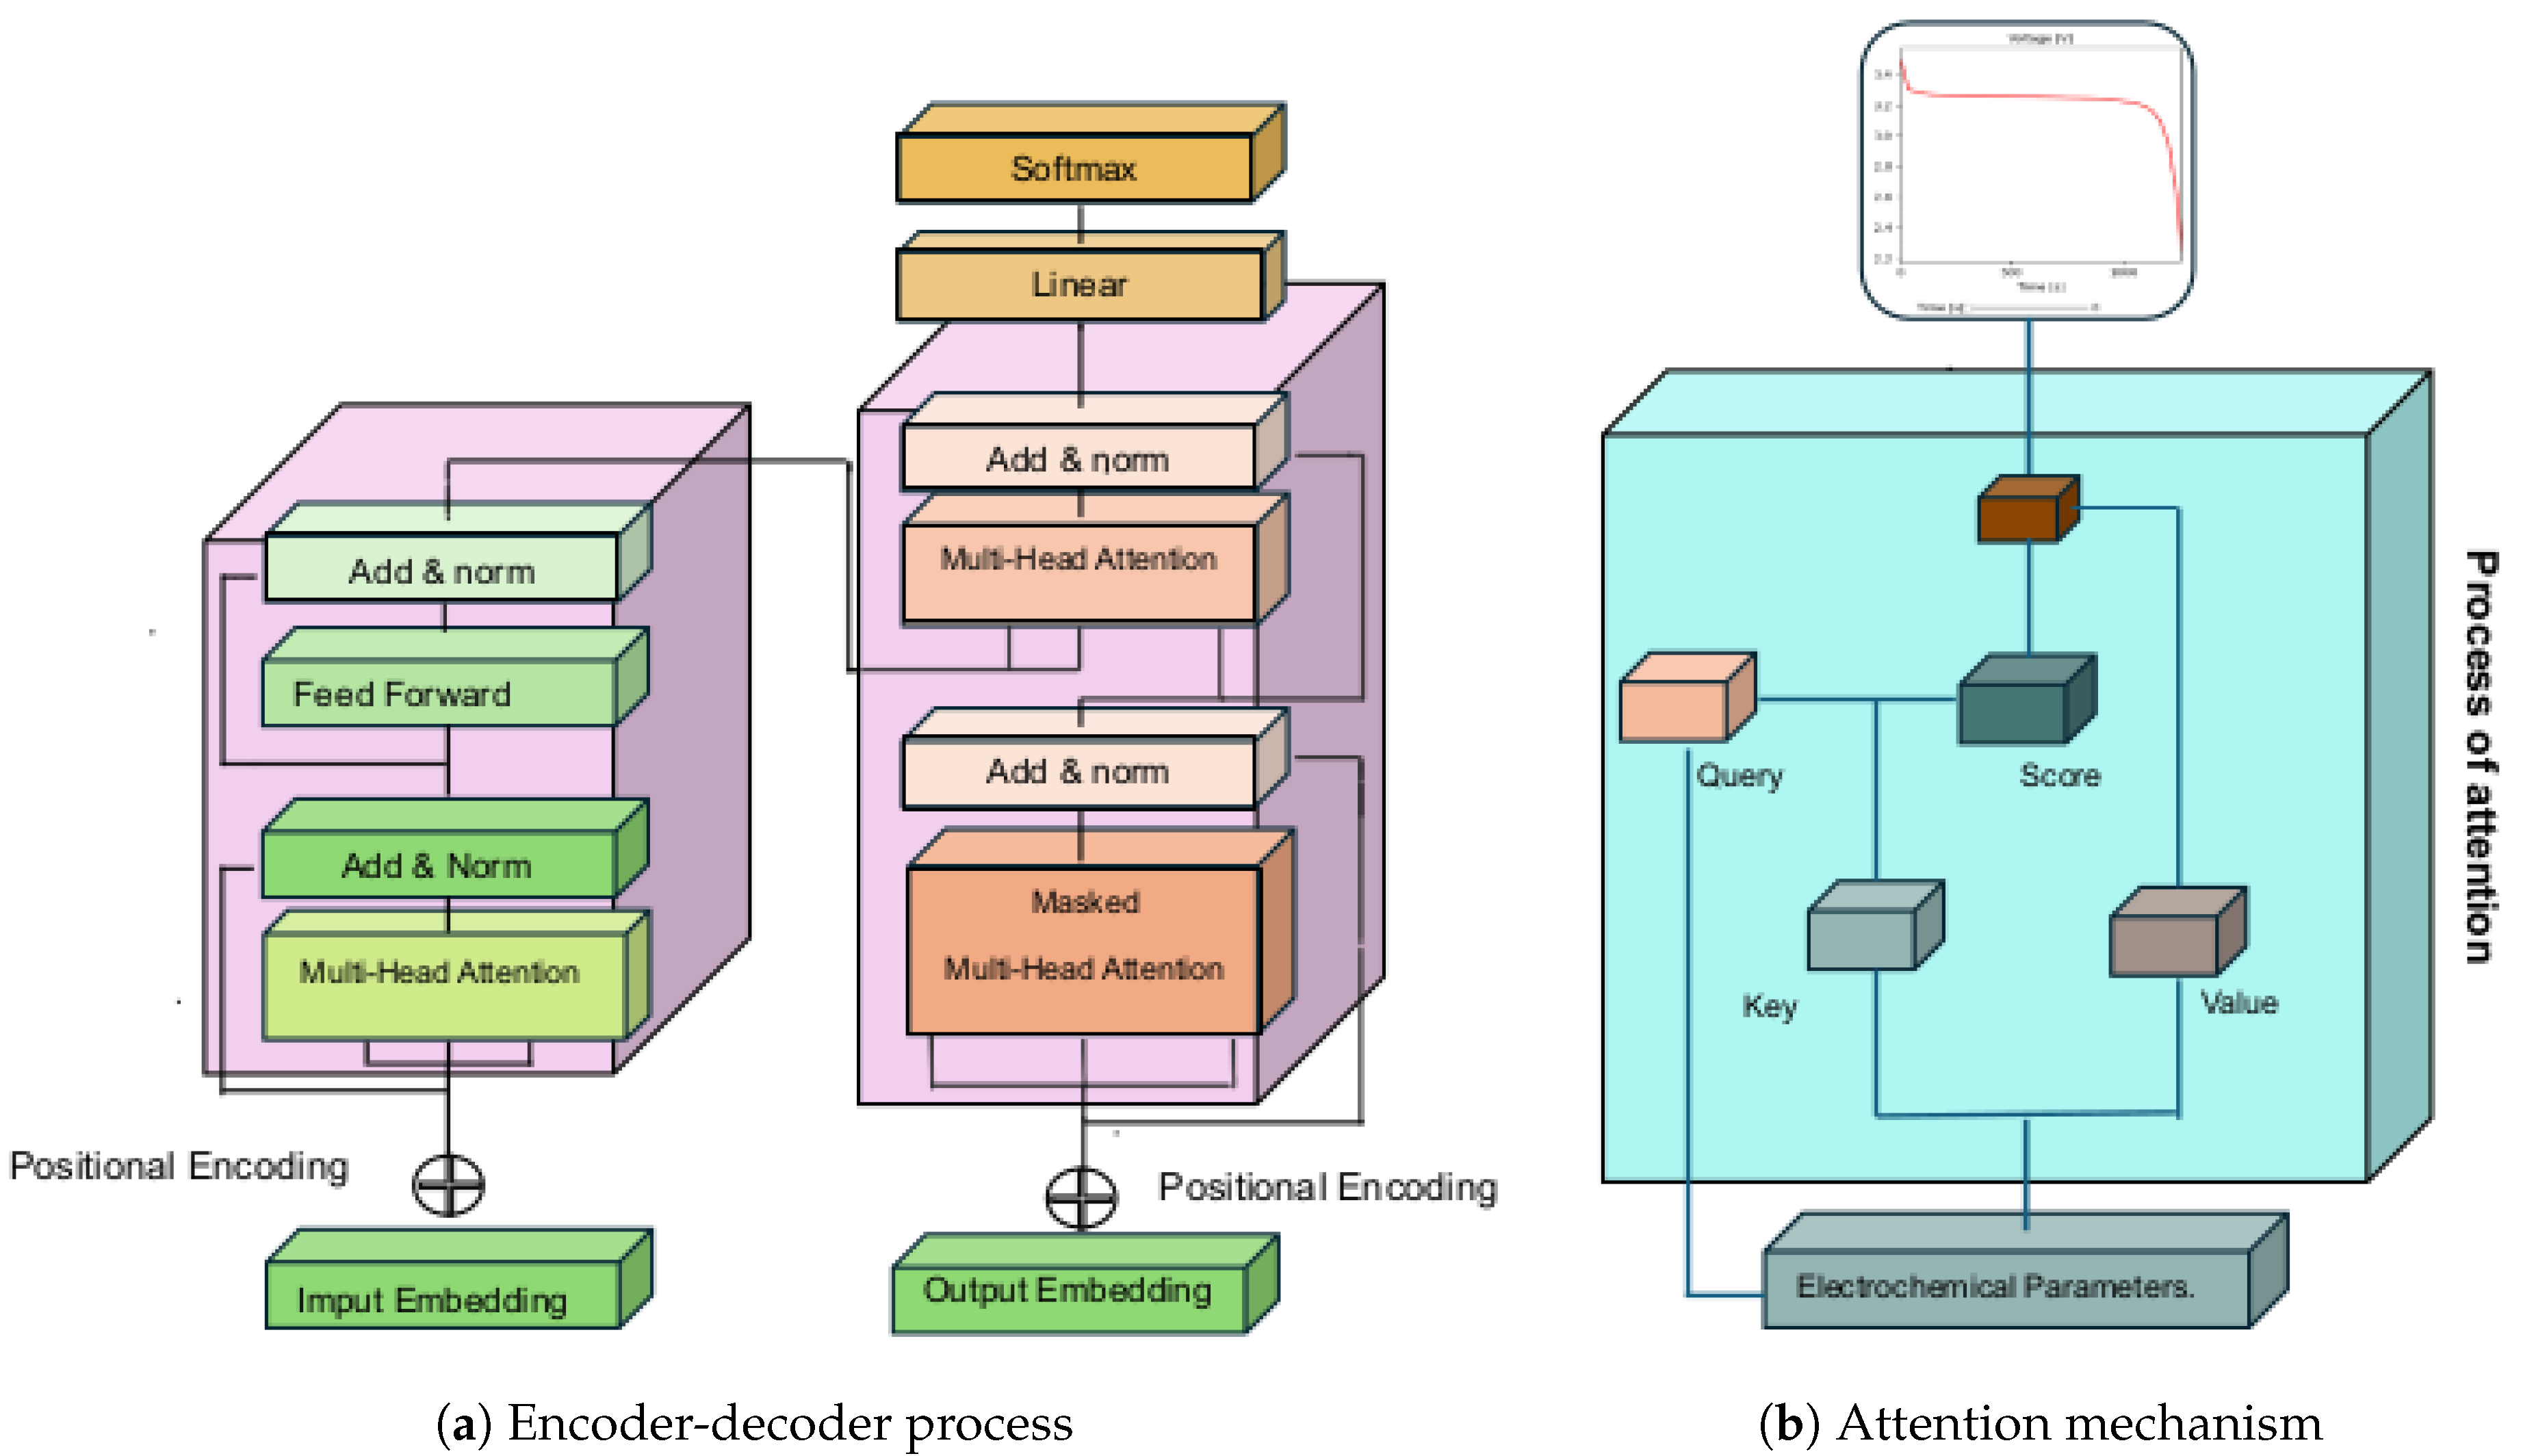
Figure 3.
a) XRD pattern, b) micro-Raman spectroscopy spectra and c) Charge-Discharge of the ZnO.
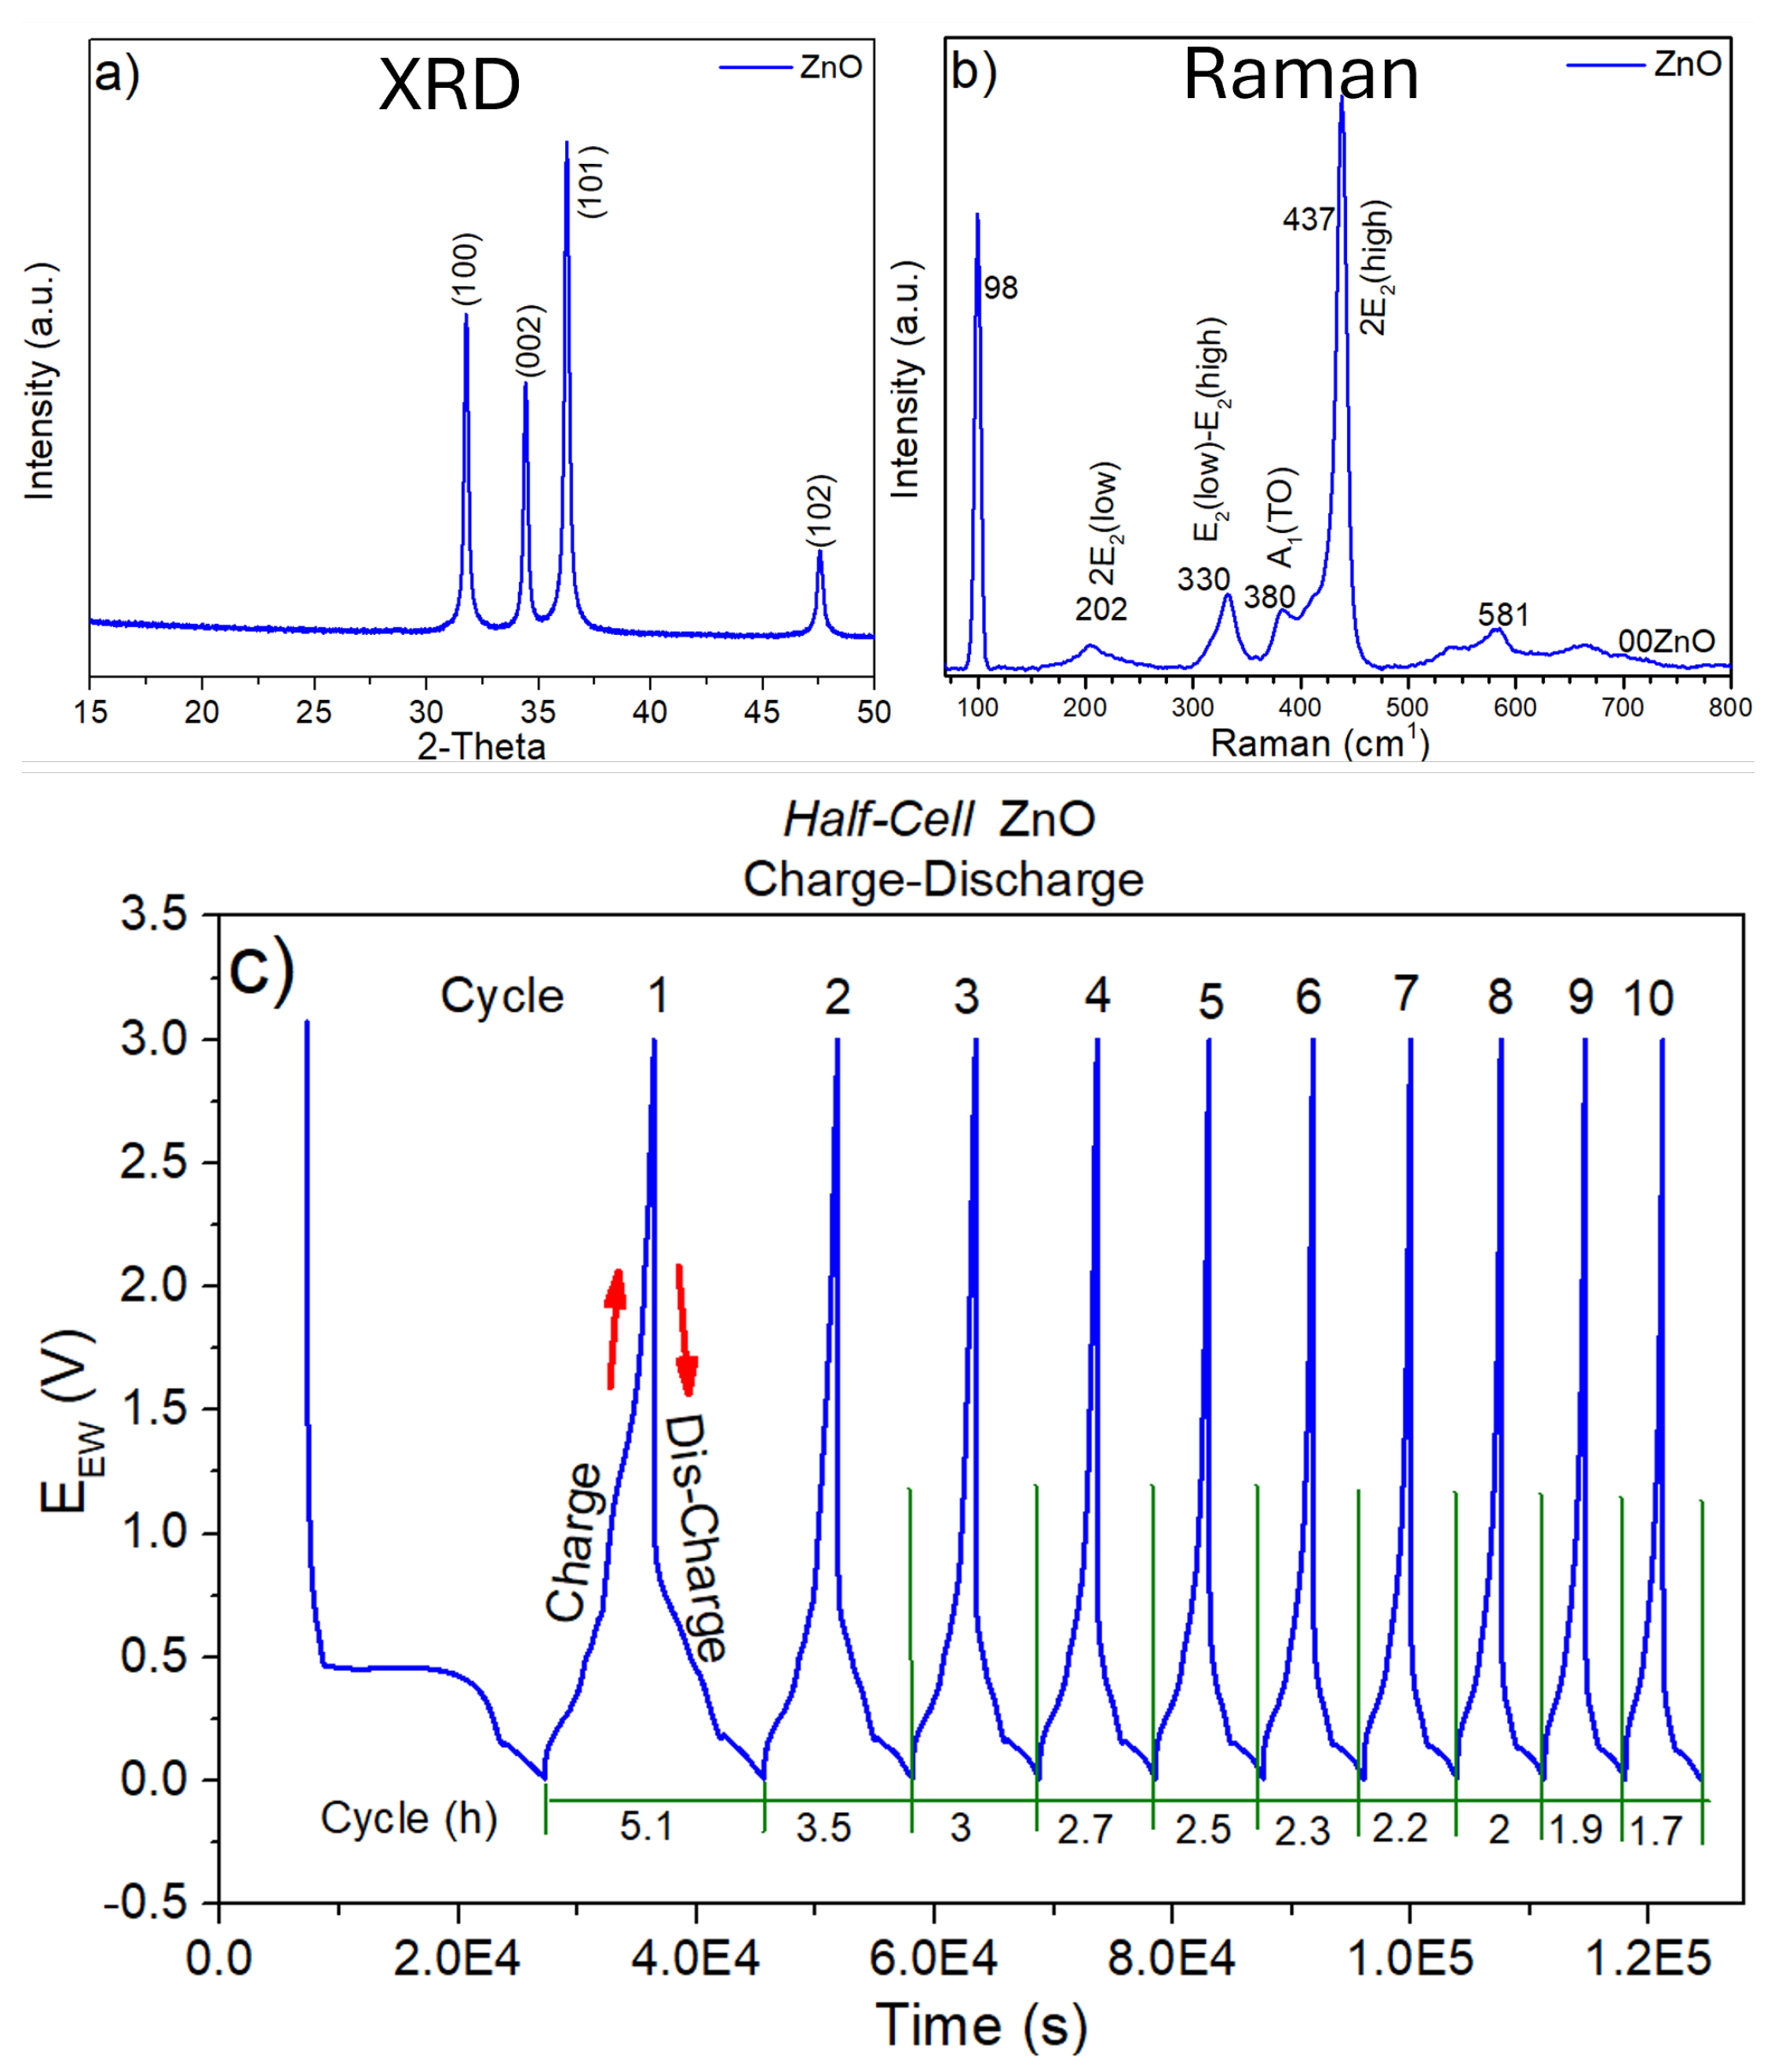
Figure 4.
Data Acquisition System Proposal.
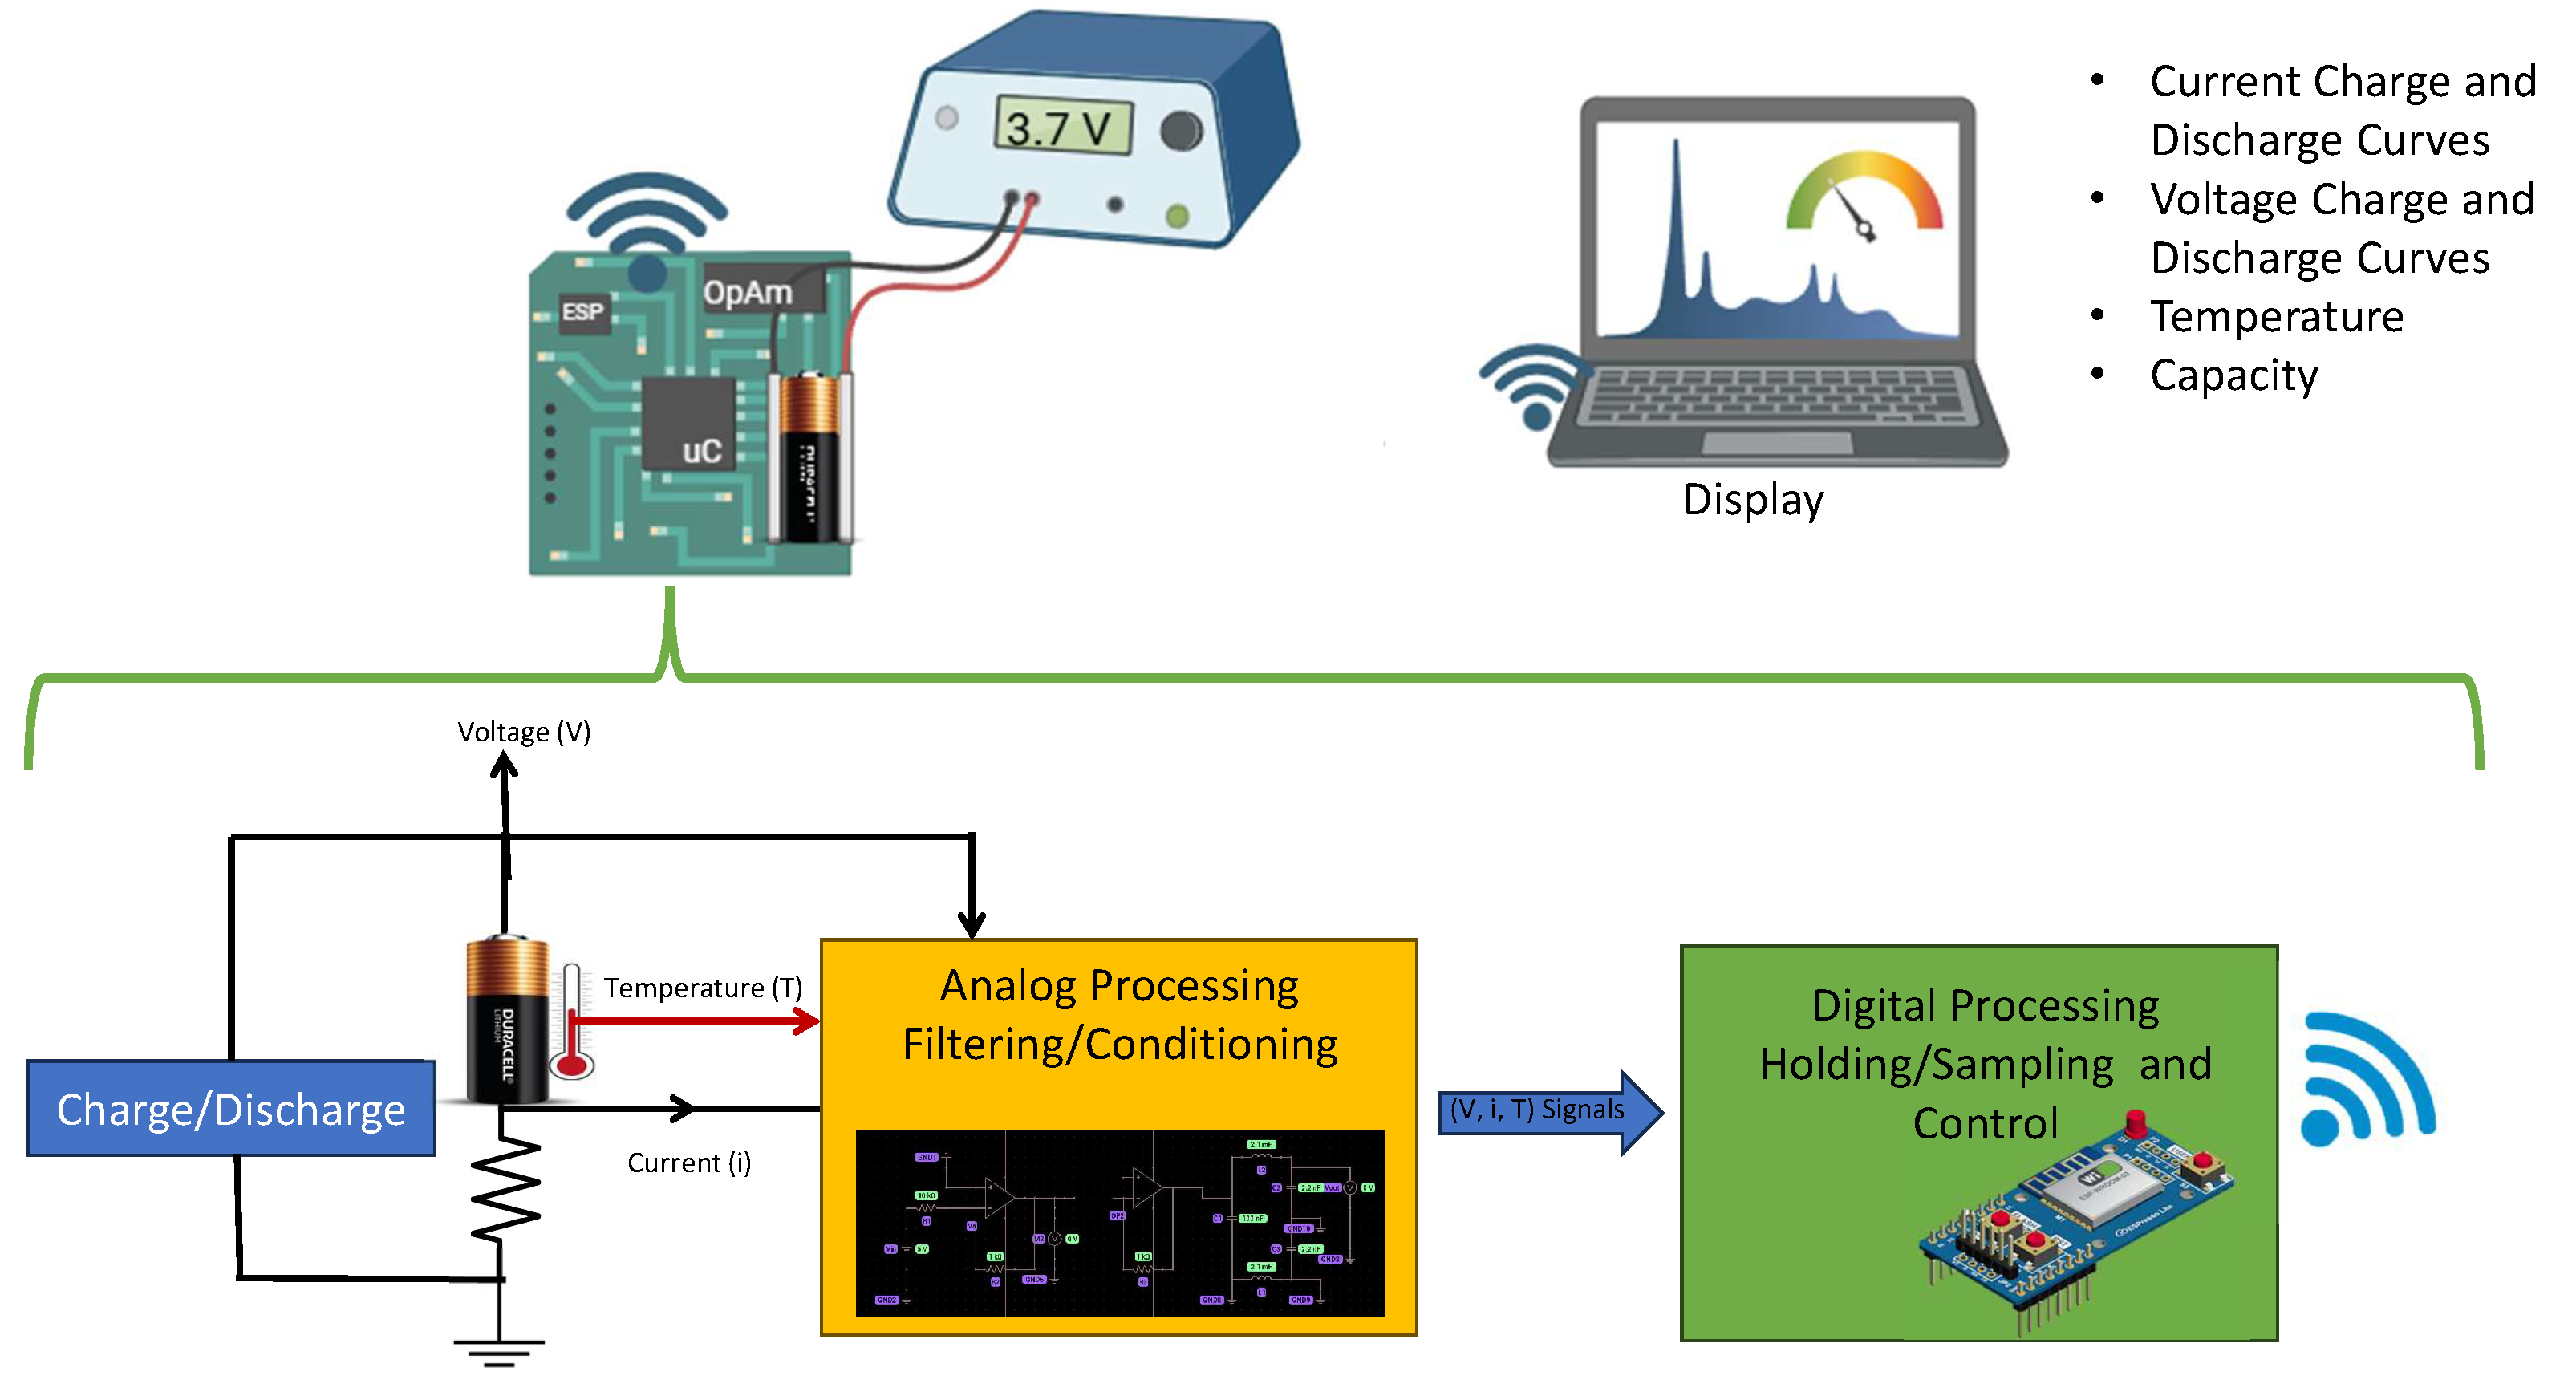
Figure 5.
Experimental Dataset For Commercial Batteries (Charge/Discharge Voltage Curves).
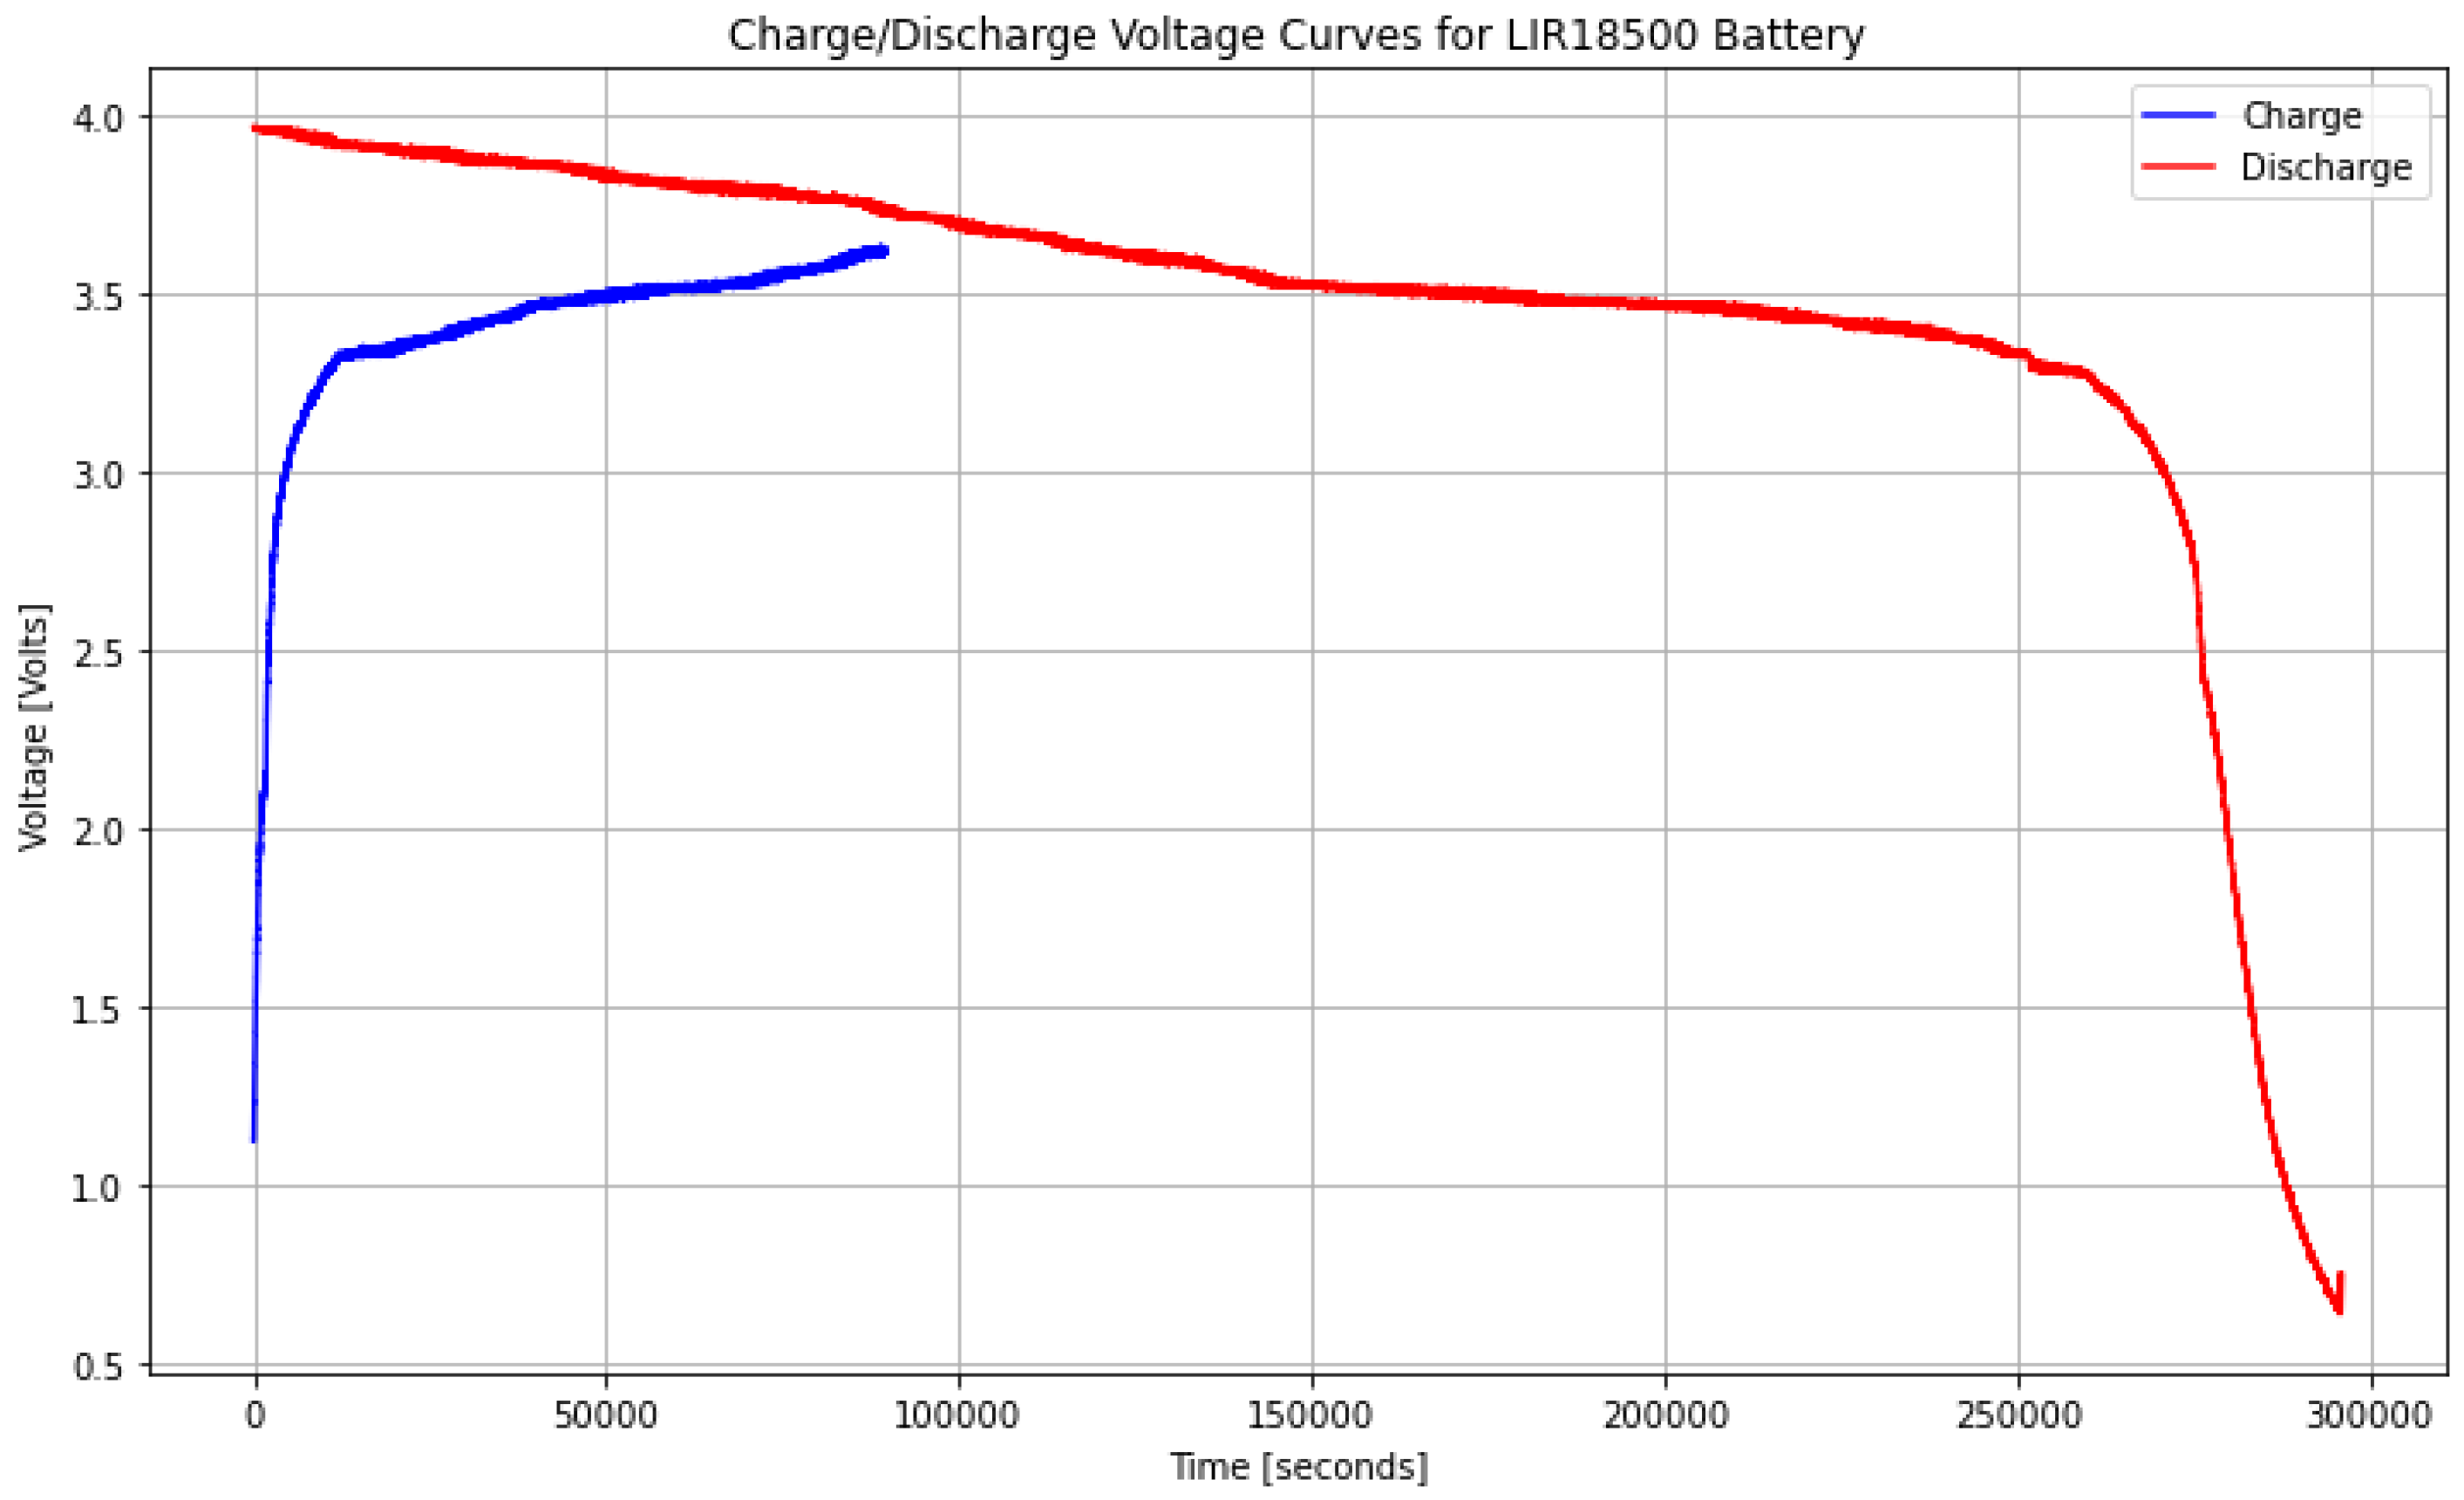
Figure 6.
Representation of the Transformer deep learning model for the estimation of the charge/discharge curve from the electro-chemical parameters of stable batteries: (a) describes the encoder-decoder process for the input patterns (electro-chemical parameters); (b) represents the attention mechanism for the description of the learning curve from the physical-chemistry of the battery.
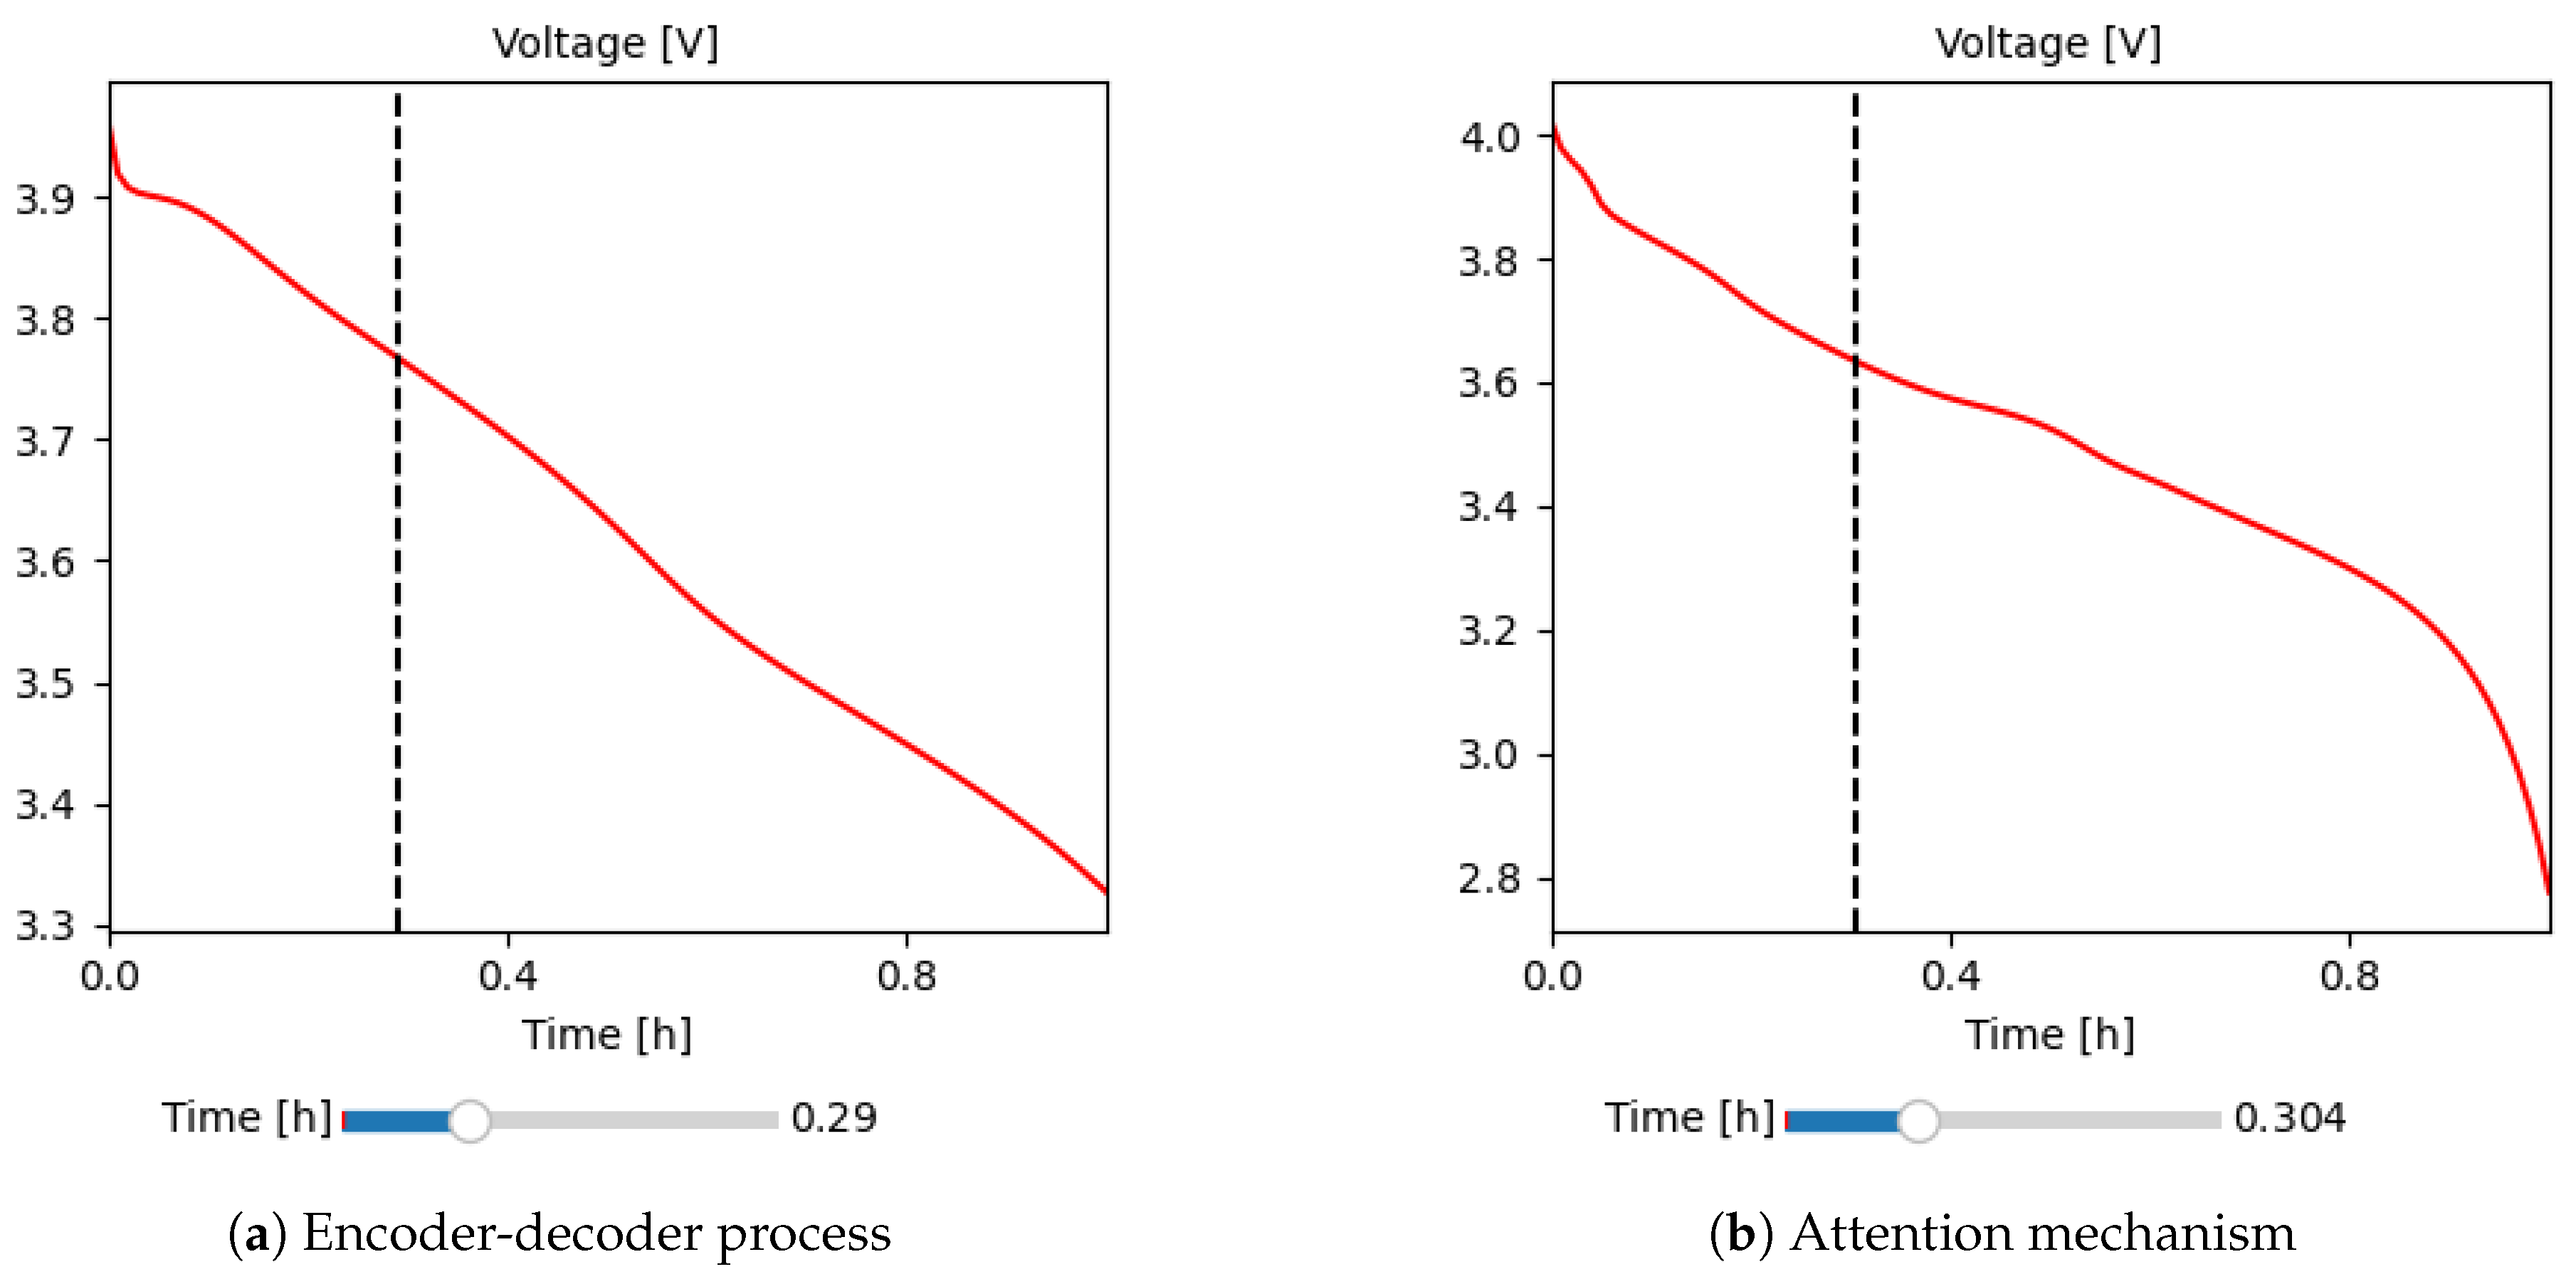
Figure 7.
Convergence of Deep-Learning Transformer training on a logarithmic scale: the convergence process is approached with a database of 425 stable battery cells (Section 3.4).
Figure 7.
Convergence of Deep-Learning Transformer training on a logarithmic scale: the convergence process is approached with a database of 425 stable battery cells (Section 3.4).
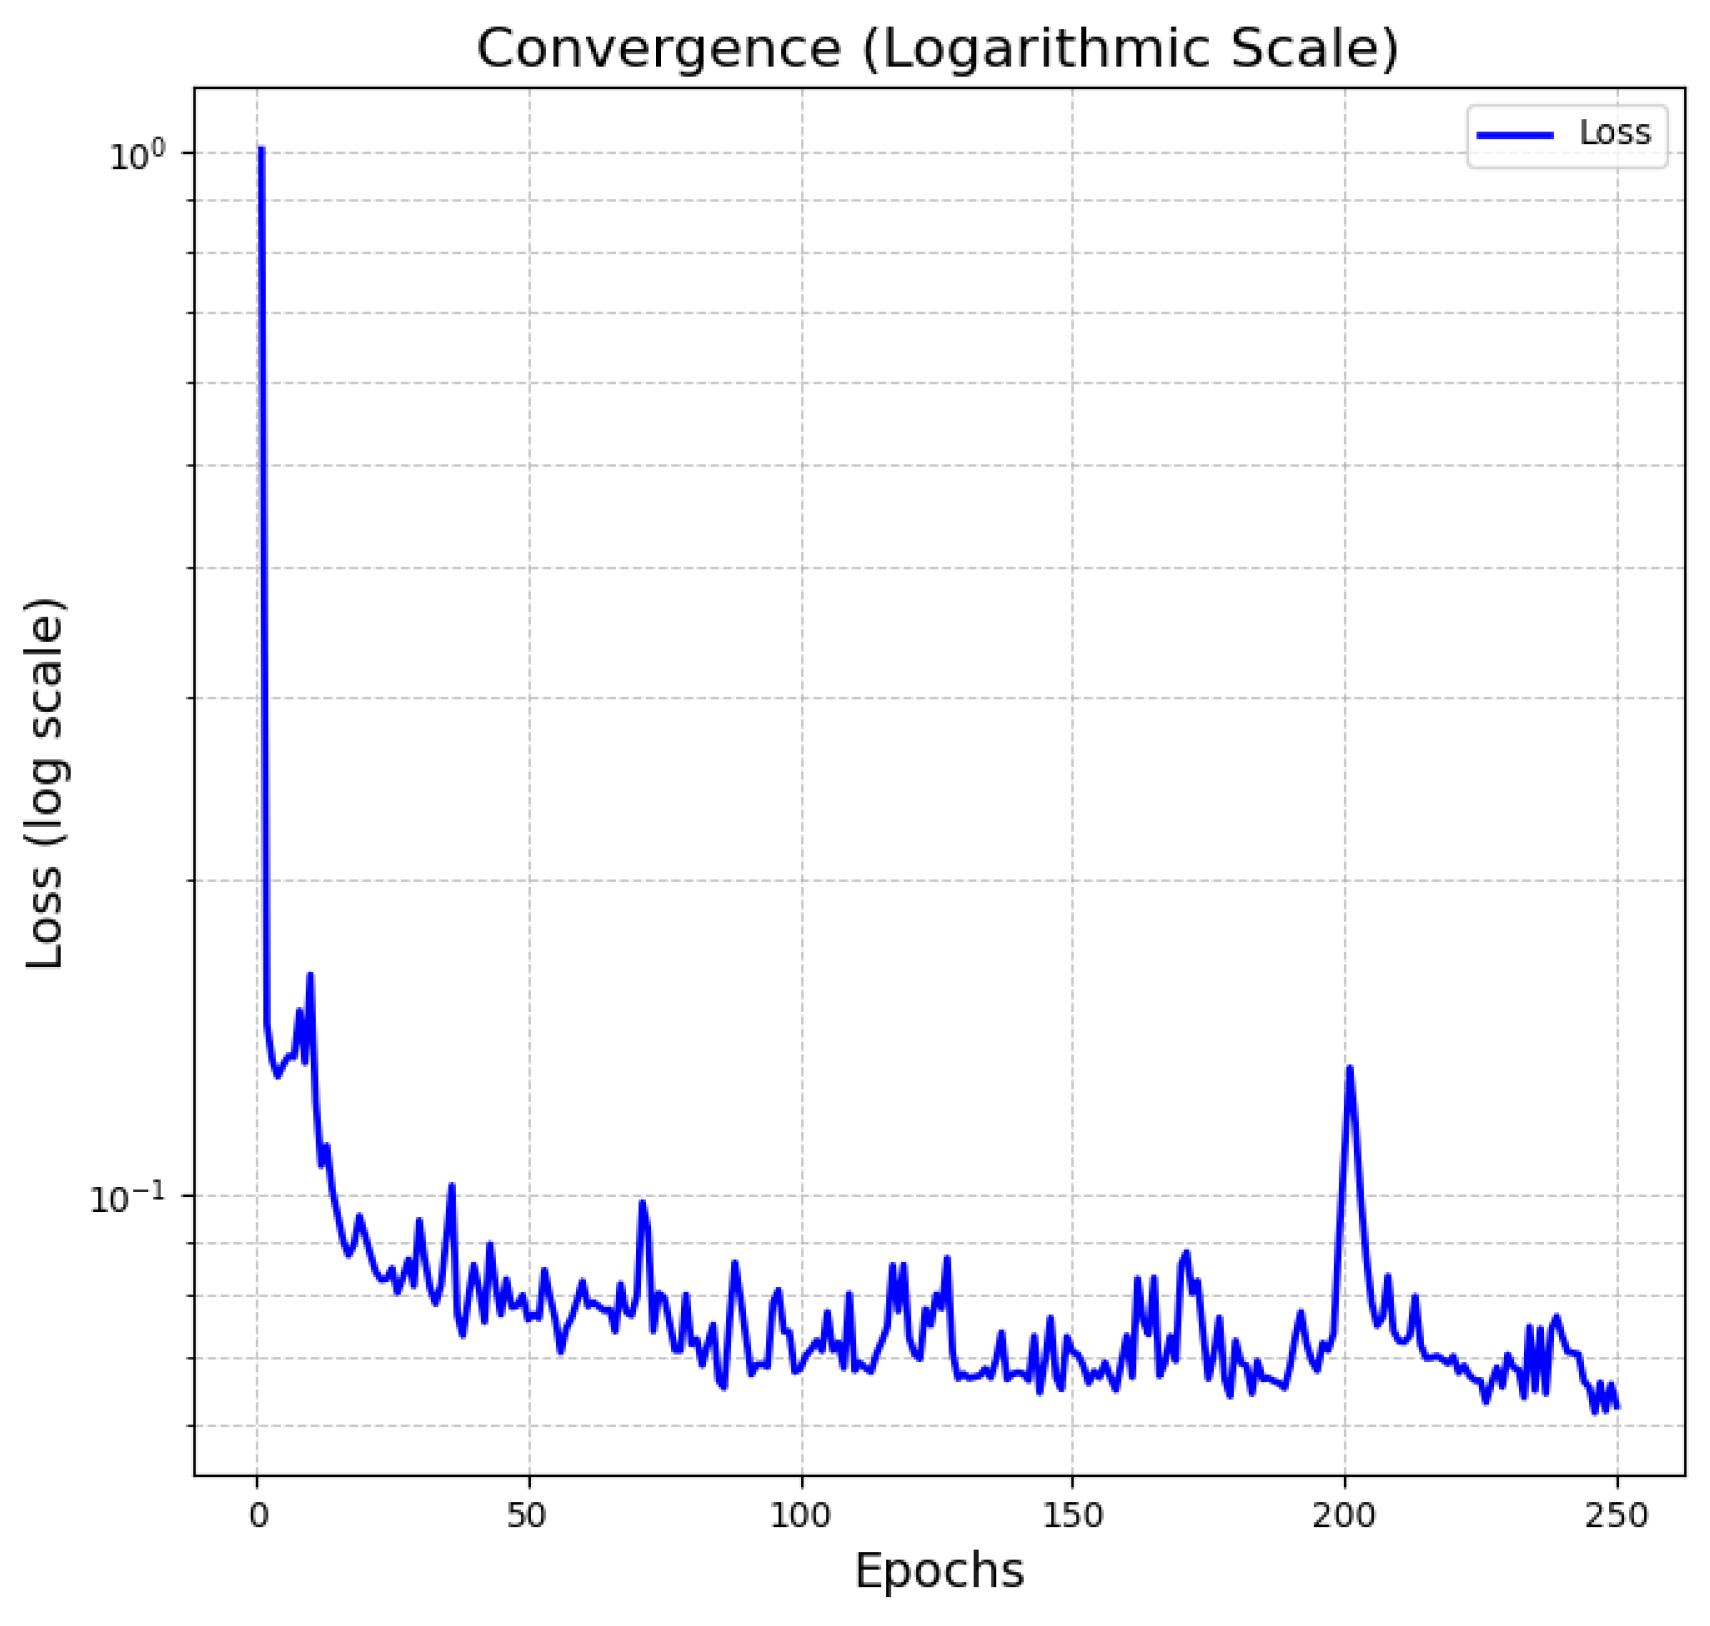
Figure 8.
Prediction of electrochemical parameters using the Deep Learning Transformer trained in section 2: a) Shows a fit of a cell discharge potential drop from experimental samples taken for an 18650 battery; b) depicts a 3600 s time window of the potential drop for a 14500 battery.
Figure 8.
Prediction of electrochemical parameters using the Deep Learning Transformer trained in section 2: a) Shows a fit of a cell discharge potential drop from experimental samples taken for an 18650 battery; b) depicts a 3600 s time window of the potential drop for a 14500 battery.
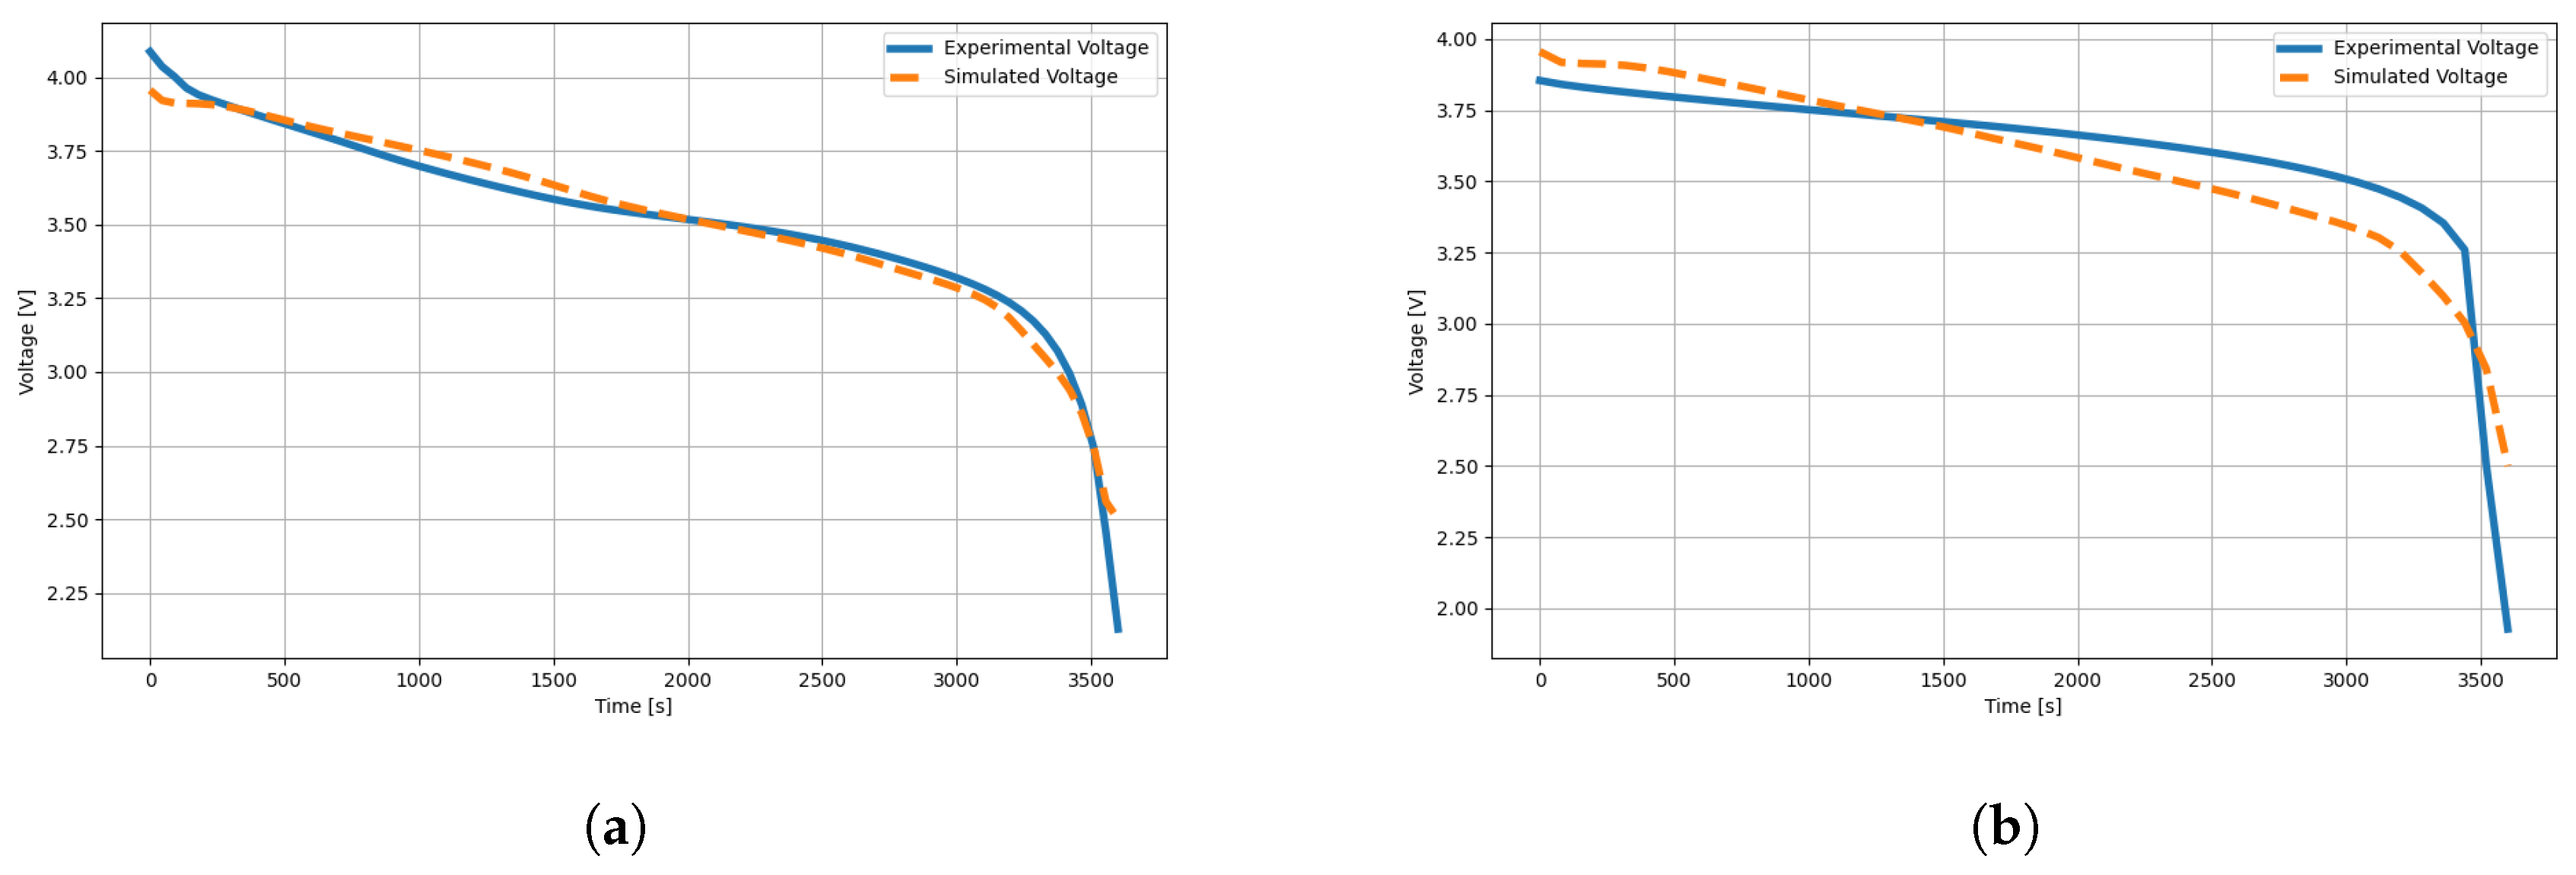
Table 1.
Electrochemical parameters approximated by Transformer Deep-Learning for one discharge cycle of an 18650 battery.
Table 1.
Electrochemical parameters approximated by Transformer Deep-Learning for one discharge cycle of an 18650 battery.
| Electrochemical parameters | Values |
|---|---|
| Negative electrode thickness | |
| Separator thickness | |
| Positive electrode thickness | |
| Maximum concentration in negative electrode | |
| Outer SEI solvent diffusivity | |
| Inner SEI lithium interstitial diffusivity | |
| EC diffusivity | |
| Negative electrode porosity | |
| Negative particle radius | |
| Maximum concentration in positive electrode | |
| Positive electrode porosity | |
| Positive particle radius | |
| EC initial concentration in electrolyte |
Table 2.
Electrochemical parameters approximated by Transformer Deep-Learning for one discharge cycle of an 14500 battery.
Table 2.
Electrochemical parameters approximated by Transformer Deep-Learning for one discharge cycle of an 14500 battery.
| Electrochemical parameters | Values |
|---|---|
| Negative electrode thickness | |
| Separator thickness | |
| Positive electrode thickness | |
| Maximum concentration in negative electrode | |
| Outer SEI solvent diffusivity | |
| Inner SEI lithium interstitial diffusivity | |
| EC diffusivity | |
| Negative electrode porosity | |
| Negative particle radius | |
| Maximum concentration in positive electrode | |
| Positive electrode porosity | |
| Positive particle radius | |
| EC initial concentration in electrolyte |
Disclaimer/Publisher’s Note: The statements, opinions and data contained in all publications are solely those of the individual author(s) and contributor(s) and not of MDPI and/or the editor(s). MDPI and/or the editor(s) disclaim responsibility for any injury to people or property resulting from any ideas, methods, instructions or products referred to in the content. |
© 2025 by the authors. Licensee MDPI, Basel, Switzerland. This article is an open access article distributed under the terms and conditions of the Creative Commons Attribution (CC BY) license (https://creativecommons.org/licenses/by/4.0/).
Copyright: This open access article is published under a Creative Commons CC BY 4.0 license, which permit the free download, distribution, and reuse, provided that the author and preprint are cited in any reuse.


