
Submitted:
02 January 2025
Posted:
03 January 2025
You are already at the latest version
Abstract
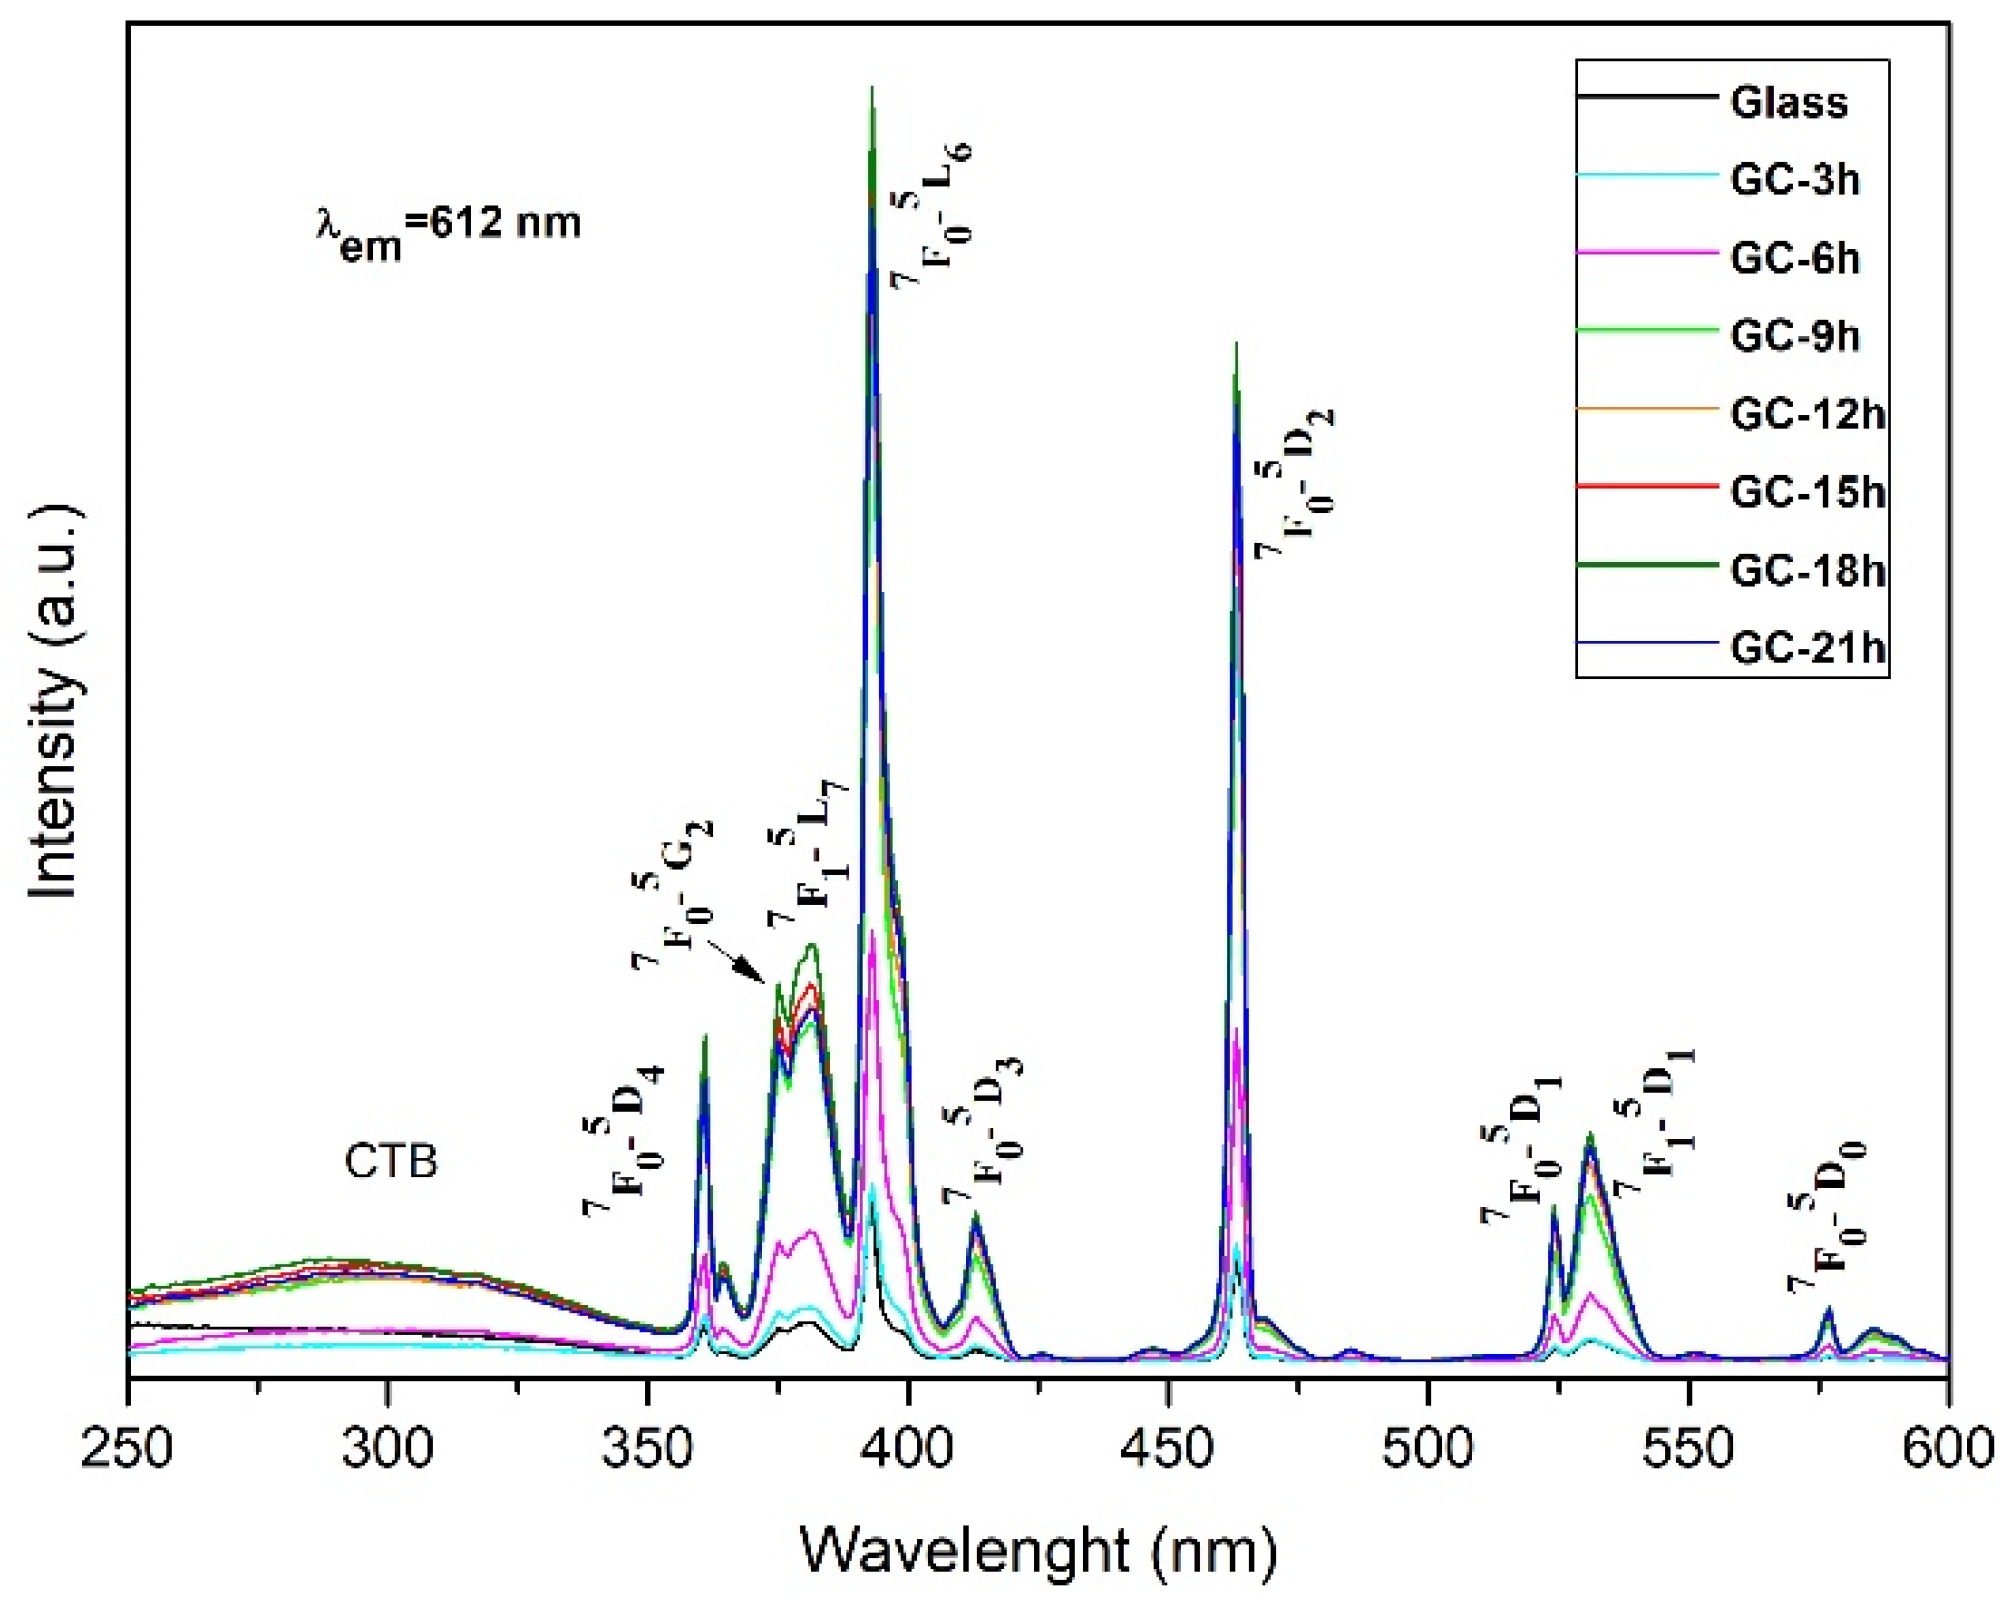
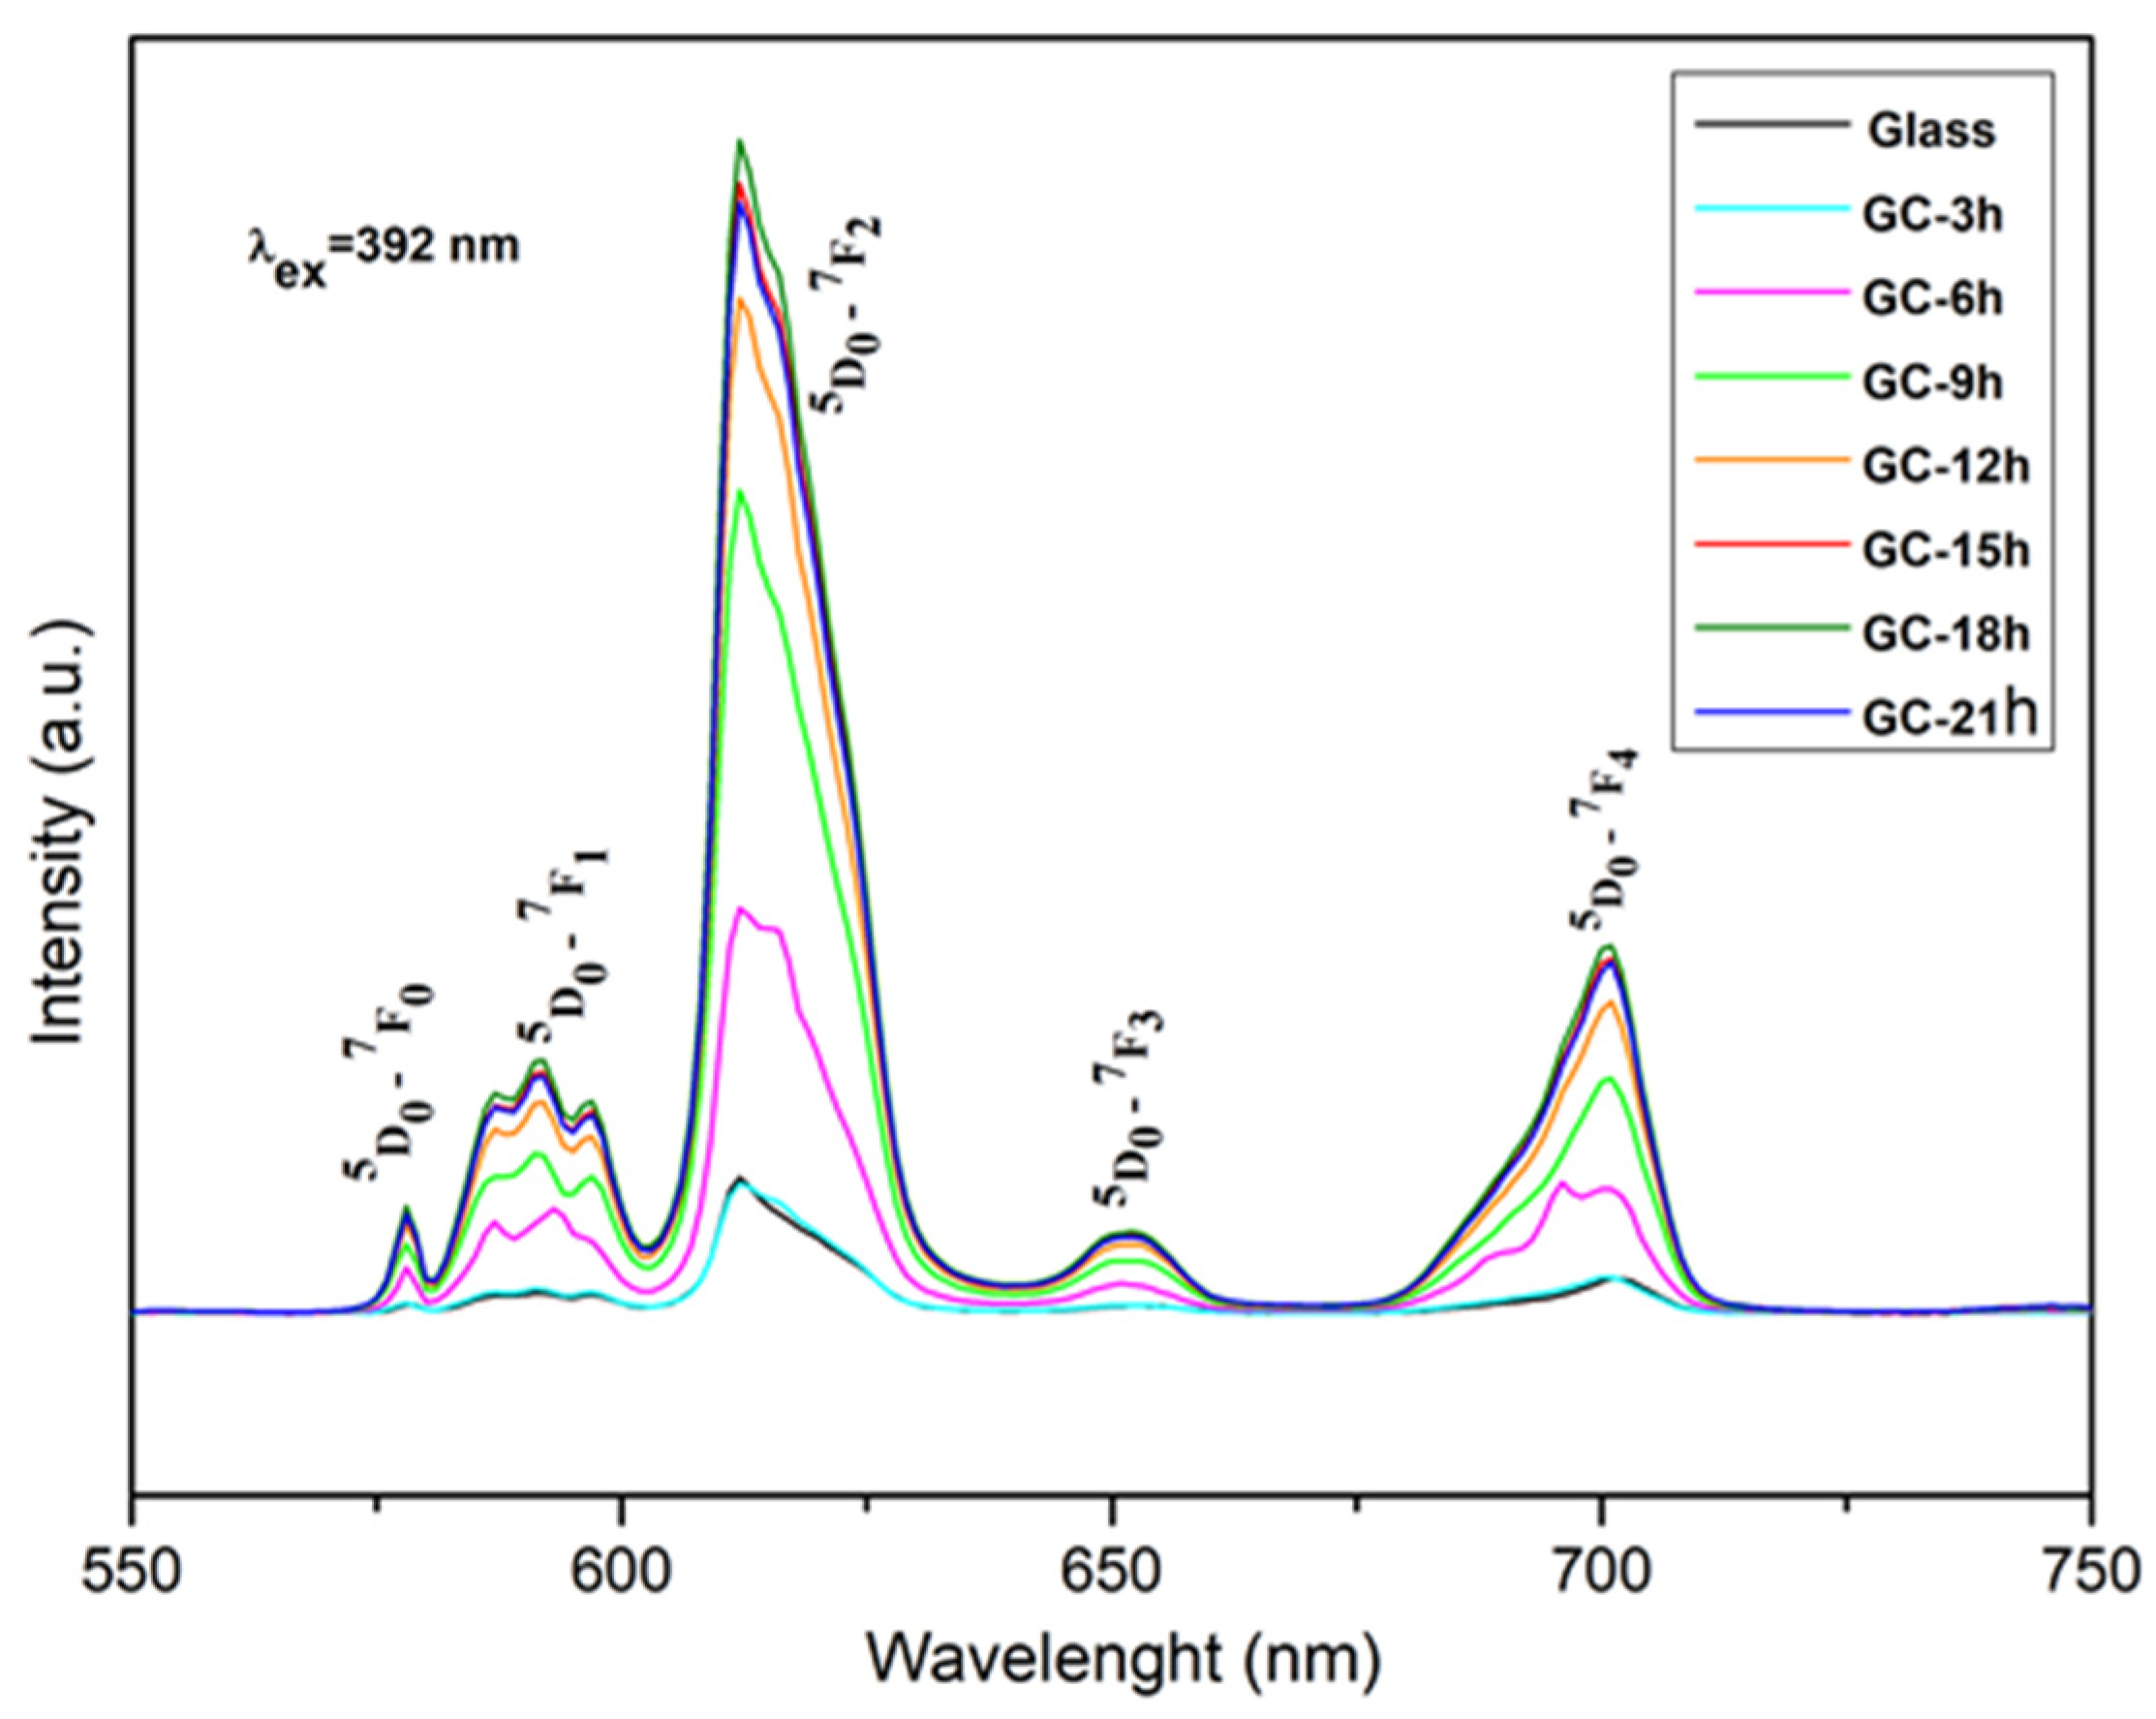
In this paper, the crystallization behavior of 52WO3:22B2O3:26La2O3:0.5Eu2О3 glass has been investigated in detail by XRD and TEM analysis. The luminescent properties of the resulting glass-ceramics were also investigated. By XRD and TEM analysis, crystallization of β-La2W2O9 and La2WO6 crystalline phases has been proved. Photoluminescent spectra showed increased emission in the resulting glass-ceramic samples compared to the parent glass sample due to higher asymmetry of Eu3+ ions in the obtained crystalline phases. It was established that the optimum emission intensity is registered for glass-ceramic samples obtained after 18 h heat treatment of the parent glass.
Keywords:
1. Introduction
2. Results and Discussion
2.1. XRD Data
2.2. Luminescent Properties
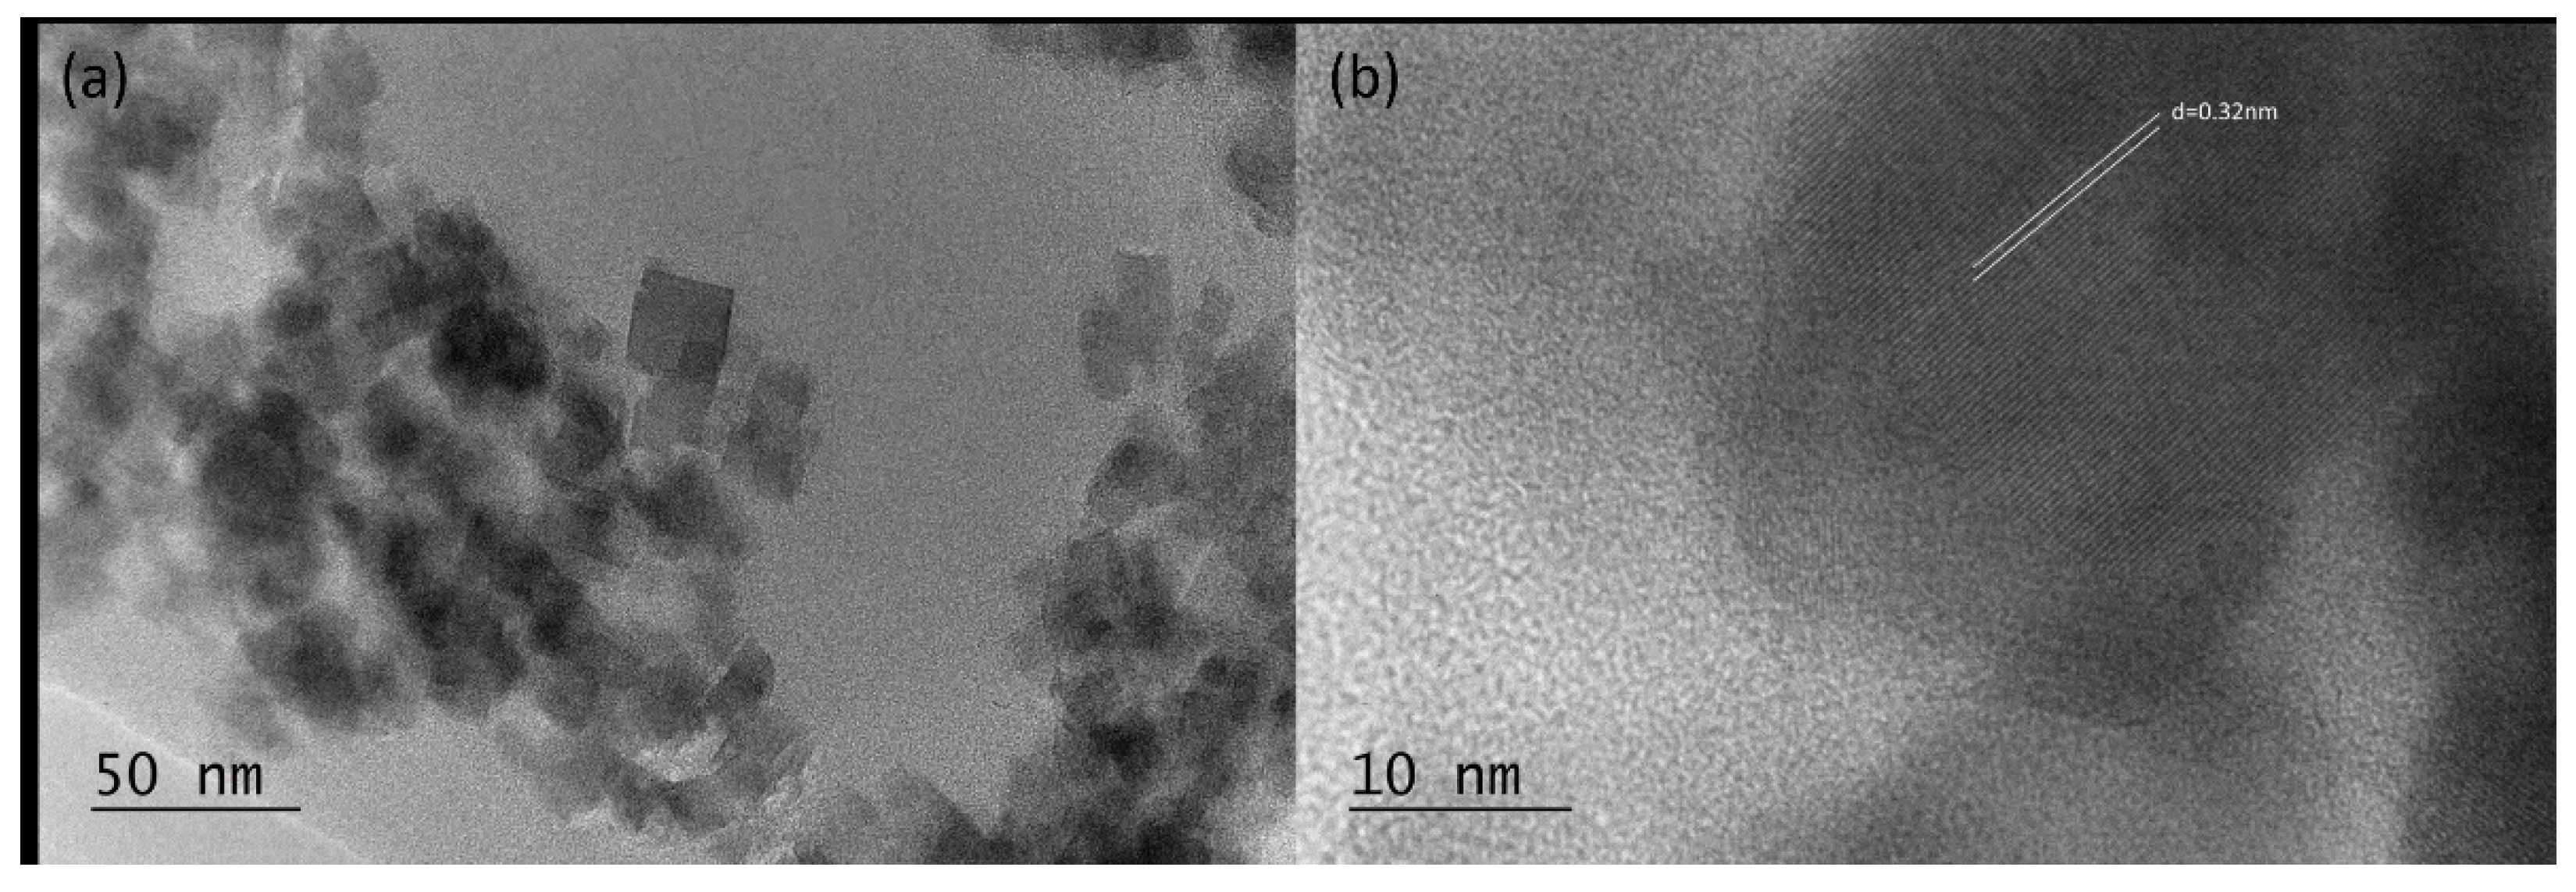
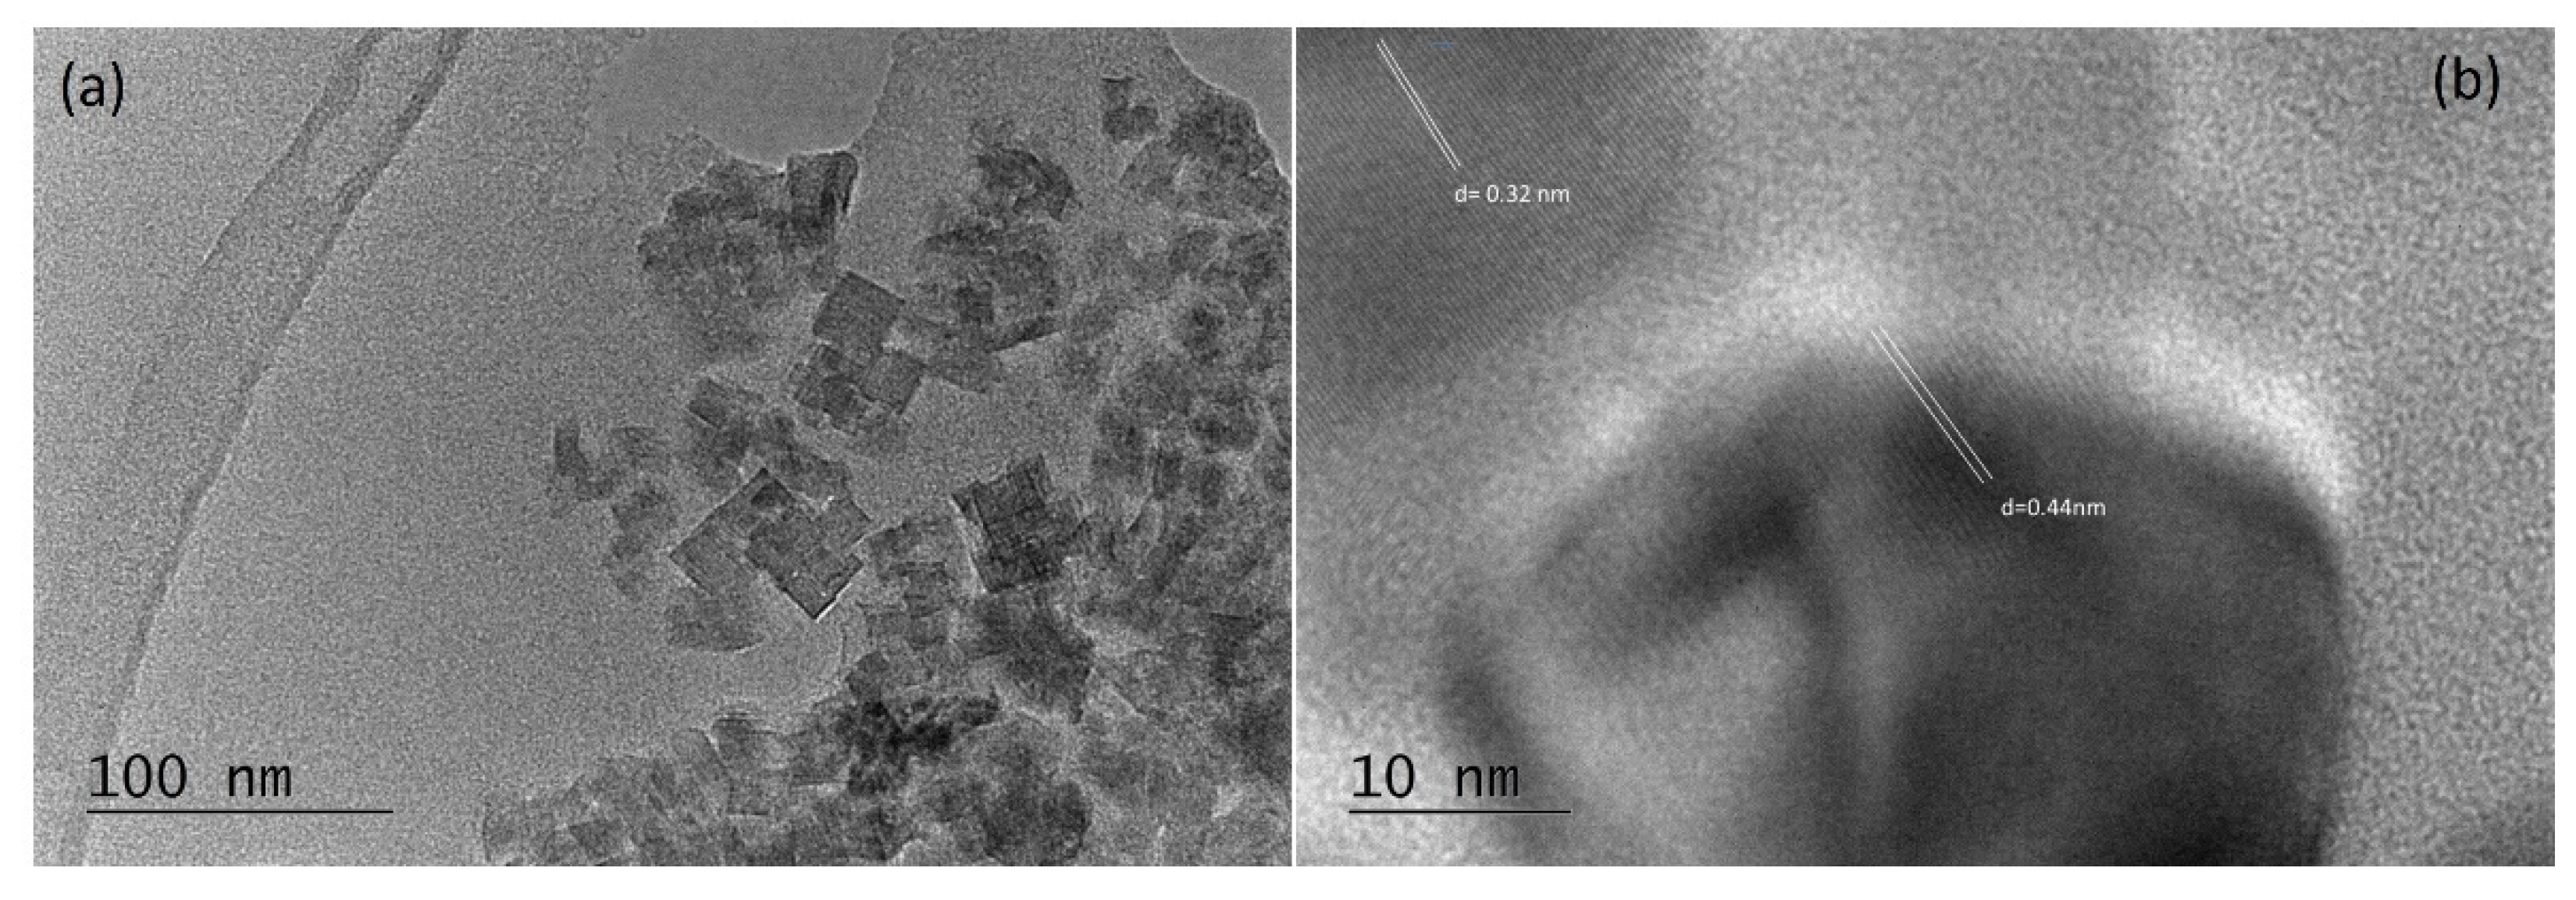
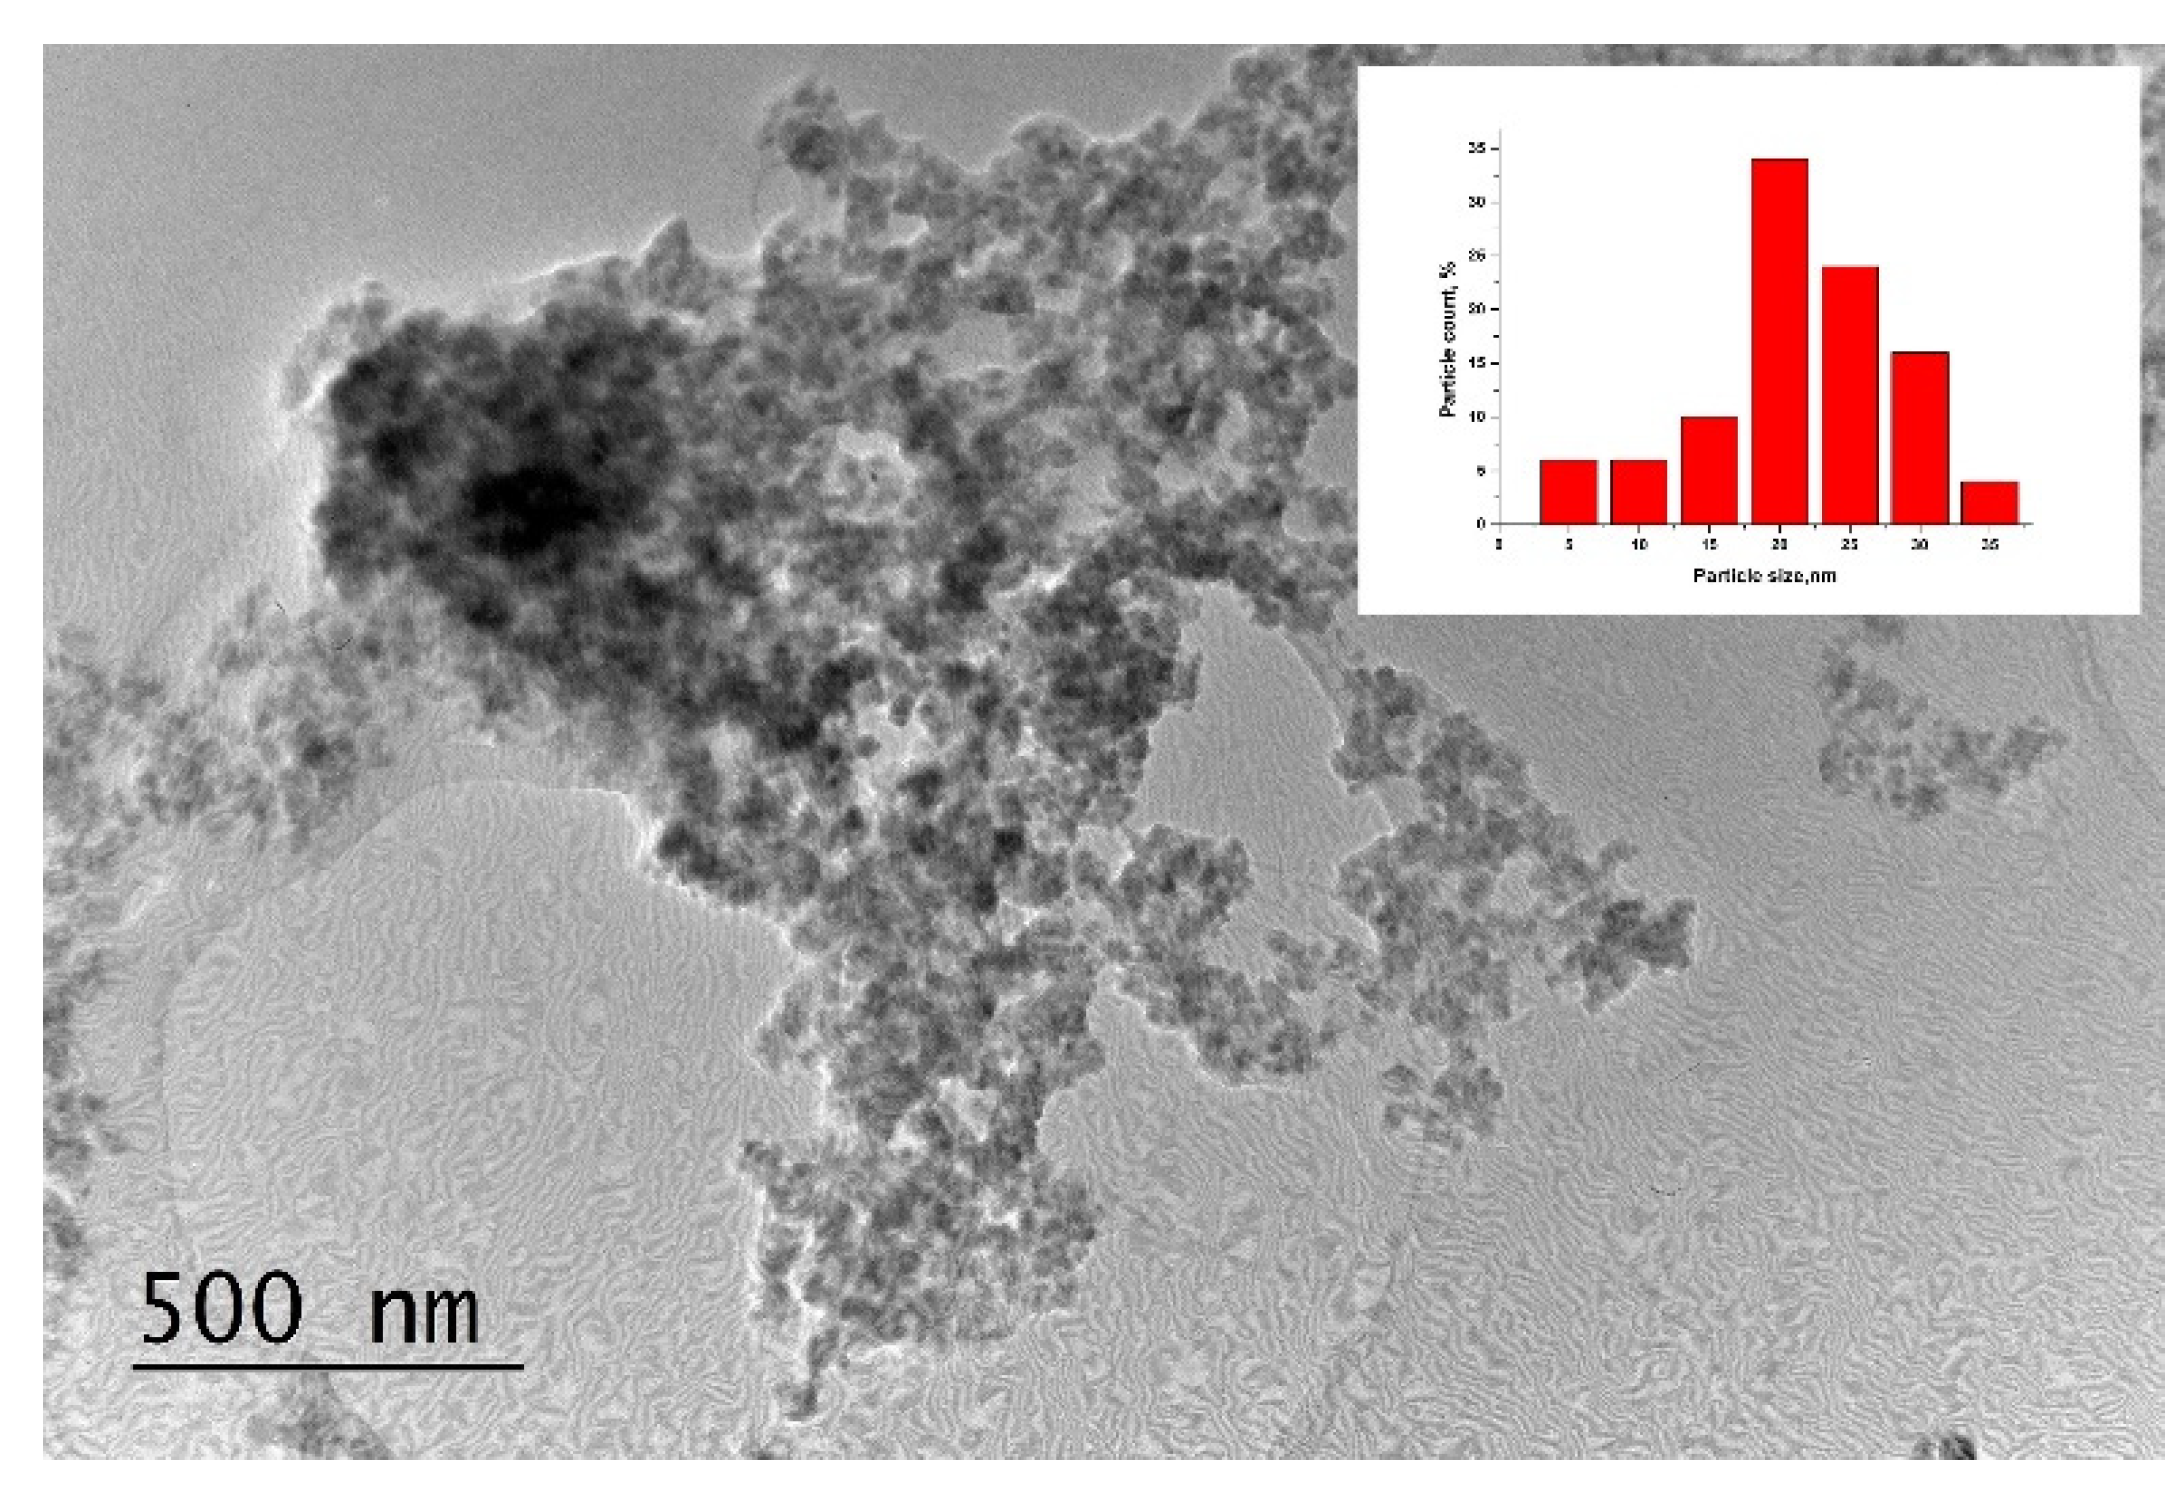
2.3. TEM Investigations
3. Materials and Methods
4. Conclusions
Author Contributions
Funding
Institutional Review Board Statement
Informed Consent Statement
Data Availability Statement
Acknowledgments
Conflicts of Interest
References
- Kumar, K. N.; Vijayalakshmi, L.; Lee, G.; Kang, G.; Lim, J. , Choi, J. Robust color purity of reddish-orange emission from Sm3+-activated La10W22O81 biocompatible microphosphors for solid state lighting and anticancer applications. J. Rare Earths 2023, 41, 1850–1859. [Google Scholar] [CrossRef]
- Patout, L.; Jacob, D.; Arab, M.; Pereira de Souza, C.; Leroux, C. Monoclinic Superstructure in Orthorhombic Ce10W22O81 from Transmission Electron Microscopy. Acta Crystallogr., Sect. B: Struct.Sci., Cryst. Eng. Mater 2014, 70, 268–274. [Google Scholar] [CrossRef]
- Pier, T.; Jüstel, T. Application of Eu(III) activated tungstates in solid state lighting. Optical materials 2024, X 22, 100299. [Google Scholar] [CrossRef]
- Cheng, Q.; Ren, F.; Lin, Q.; Tong, H.; Miao, H. High quantum efficiency red emitting alpha-phase La2W2O9: Eu3+phosphor. J Alloys Compd. 2019, 772, 905–911. [Google Scholar] [CrossRef]
- Song, K.; Li, G. Electrospinning synthesis, characterization and luminescence properties of La2W2O9: Eu3+ nanofibers. J Mater Sci: Mater Electron. 2015, 27, 1227–1231. [Google Scholar] [CrossRef]
- Zhang, J.; Yang, Y.; Yu, F.; Liu, Y.; Han, B.; Chao, M.; Liu, L. Synthesis and Luminescence Properties of La2W2O9:Eu3+ Micron-Crystals. J. Nanosci. Nanotechnol. 2016, 16, 3852–3856. [Google Scholar] [CrossRef] [PubMed]
- Baby, B.; Thomas, S.; Jose, J.; Gopinath, M.; Biju, P.R.; Joseph, C. Spectroscopic analysis of La2(WO4)3:Tb3+ phosphor and the delayed concentration quenching of 5D4 →7FJ emission. J. Lumin. 2025, 277, 120895. [Google Scholar] [CrossRef]
- Kumar, K. N.; Vijayalakshmi, L.; Lee, G.; Kang, G.; Lim, J.; Choi, J. Robust color purity of reddish-orange emission from Sm3+-activated La10W22O81 biocompatible microphosphors for solid state lighting and anticancer applications. J Rare Earths. 2023, 41, 1850–1859. [Google Scholar] [CrossRef]
- Naveen Kumar, K.; Vijayalakshmi, L.; Hwang, P.; Wadhwani, A.; Choi, J. Bright red-luminescence of Eu3+ion-activated La10W22O8 microphosphors for noncytotoxic latent fingerprint imaging. J. Alloys Compd. 2020, 840, 155589. [Google Scholar] [CrossRef]
- Fedorov, P.P.; Luginina, A.A.A.; Popov, I. Transparent oxyflouride glas ceramics. J. Fluor. Chem. 2015, 172, 22–50. [Google Scholar] [CrossRef]
- Erth, D. Photoluminescenec in Glass and Glass Ceramics. IOP Conf. Series Mater. Sci. Eng. 2009, 2, 012001. [Google Scholar]
- Ferrari, M.; Righini, G.C. Glass-ceramic materials for guided-waste optics. Int. J. Appl. Sci. 2015, 6, 240–248. [Google Scholar]
- Aleksandrov, L.; Iordanova, R.; Dimitried, Y.; Geogiev, N.; Komatsu, T. Eu3+ doped 1La2O3:2WO3:1B2O3 glass and glass-ceramic. Opt. Mater. 2014, 26, 1366–1372. [Google Scholar] [CrossRef]
- Aleksandrov, L.; Komatsu, T.; Iordanova, R.; Dimitried, Y. Raman spectroscopic study of structure of WO3-La2O3-B2O3 glasses with no color and crystallization of LaBWO6. Opt. Mater. 2011, 34, 201–206. [Google Scholar] [CrossRef]
- Jurinski, B.; Lisanova, G. Compounds of rare earth elements with mixed oxyanions: synthesis, structure, boundaries of existence in the series La-Lu. J. Inorg. Chem. (in Russian) 1998, 43, 2064–2074. [Google Scholar]
- Collado, J. A.; Aranda, M. A. G.; Cabeza, A.; Olivera-Pastor, P.; Bruque, S. Synthesis, structures, and thermal expansion of the La2W2− xMoxO9 series. J. Solid State Chem. 2002, 167(1), 80–85. [Google Scholar] [CrossRef]
- Binnemans, K. Interpretation of europium (III) spectra. Coord. Chem. Rev. 2015, 295, 1–45. [Google Scholar] [CrossRef]
- Blasse, G.; Grabmaier, B.C. Luminescent Materials, 1st ed.; Springer: Berlin/Heidelber, Germany, 1994; pp. 18–29. [Google Scholar]
- Hoefdraad, H.E. The charge-transfer absorption band of Eu3+ in oxides. J. Solid State Chem. 1975, 15, 175–177. [Google Scholar] [CrossRef]
- Parchur, A.K.; Ningthoujam, R.S. Behaviour of electric and magnetic dipole transitions of Eu3+, 5D0-7F0 and Eu-O charge transfer band in Li+ co-doped YPO4:Eu3+. RSC Adv. 2012, 2, 10859–10868. [Google Scholar] [CrossRef]
- Mariselvam, K.; Liu, J. Synthesis and luminescence properties of Eu3+ doped potassium titano telluroborate (KTTB) glasses for red laser applications. J. Lumin. 2021, 230, 117735. [Google Scholar] [CrossRef]
- Dutta, P.S.; Khanna, A. Eu3+ activated molybdate and tungstate based red phosphors with charge transfer band in blue region. ECS J. Solid State Sci. Technol. 2013, 2, R3153–R3167. [Google Scholar] [CrossRef]
- Thieme, C.; Herrmann, A.; Kracker, M.; Patzig, C.; Hoche, T.; Russel, C. Microstructure investigation and fluorescence properties of Europium-doped scheelite crystals in glass-ceramics made under different synthesis conditions. J. Lumin. 2021, 238, 118244. [Google Scholar] [CrossRef]
- Bunzli, J.C.G. Lanthanide luminescence: From a mystery to rationalization, understanding, and applications. In Handbook on the Physics and Chemistry of Rare Earths; Elsevier: Amsterdam, The Netherlands, 2016; 50, 141–176. [Google Scholar]
- Shigeo, S.; William, M. Phosphor Handbook. CRC Press: Washington, DC, USA, 1998.
- Iordanova, R.; Milanova, M.; Yordanova, A.; Aleksandrov, L.; Nedylkov, N.; Kukeva, R.; Petrova, P. Structure and Luminescent Properties of Niobium Modified ZnO-B2O3: Eu3+ Glass. Materials 2024, 17, 1415. [Google Scholar] [CrossRef] [PubMed]
- Milanova, M.; Aleksandrov, L.; Yordanova, A.; Iordanova, R.; Tagiara, N.S.; Herrmann, A.; Gao, G.; Wondraczek, L.; Kamitsos, E.I. Structural and luminescence behavior of Eu3+ ions in ZnO-B2O3-WO3 glasses. J. Non-Cryst. Solids 2023, 600, 122006. [Google Scholar] [CrossRef]
- Aleksandrov, L.; Milanova, M.; Yordanova, A.; Iordanova, R.; Nedyalkov, N.; Petrova, P.; Tagiara, N.S.; Palles, D.; Kamitsos, E.I. Synthesis, structure and luminescence properties of Eu3+-doped 50ZnO.40B2O3.5WO3.5Nb2O5 glass. Phys. Chem. Glas. Eur. J.Glass Sci. Technol. B 2023, 64, 101–109. [Google Scholar]
- Narro-García, R.; Desirena, H.; López-Luke, T.; Guerrero-Contreras, J.; Jayasankar, C. K. , Quintero-Torres, R.; De la Rosa, E. Spectroscopic properties of Eu3+/Nd3+ co-doped phosphate glasses and opaque glass–ceramics. Opt. Mater. 2015, 46, 34–39. [Google Scholar] [CrossRef]
- Aleksandrov, L.; Yordanova, A.; Milanova, M.; Iordanova, R.; Tzvetkov, P.; Markov, P.; Petrova, P. Glass Ceramic Materials with Luminescent Properties in the System ZnO-B2O3-Nb2O5-Eu2O3. Molecules, 2024, 29, 3452. [Google Scholar] [CrossRef]
- Dwivedi, A.; Joshi, C.; Rai, S. B. Effect of heat treatment on structural, thermal and optical properties of Eu3+ doped tellurite glass: formation of glass-ceramic and ceramics. Opt. Mater. 2015, 45, 202–208. [Google Scholar] [CrossRef]
- Laia, A. S.; Maciel, G. S.; Rodrigues Jr, J. J.; Dos Santos, M. A.; Machado, R.; Dantas, N. O.; Silva, A.C.A.; Rodrigues, R. B.; Alencar, M.A. Lithium-boron-aluminum glasses and glass-ceramics doped with Eu3+: A potential optical thermometer for operation over a wide range of temperatures with uniform sensitivity. J. Alloys Compd., 2022, 907, 164402. [Google Scholar] [CrossRef]
- Muniz, R. F.; De Ligny, D.; Sandrini, M.; Zanuto, V. S.; Medina, A. N.; Rohling, J. H.; Guyot, Y. Fluorescence line narrowing and Judd-Ofelt theory analyses of Eu3+-doped low-silica calcium aluminosilicate glass and glass-ceramic. J. Lumin. 2018, 201, 123–128. [Google Scholar] [CrossRef]
- Smentek, L.; Kȩdziorski, A. f ↔ f electric dipole transitions; old problems in a new light. J. Alloys Compd. 2009, 488, 586–590. [Google Scholar] [CrossRef]
- Binnemans, K.; Gorller-Walrand, C. Application of the Eu3+ ion for site symmetry determination. J. Rare Earths 1996, 14, 173–180. [Google Scholar]
- Paolini, T.B. SpectraChroma (Version 1.0.1) [Computer Software]. 2021. Available online: https://zenodo.org/records/4906590 (accessed on 7 June 2021).
- Trond, S.S.; Martin, J.S.; Stanavage, J.P.; Smith, A.L. Properties of Some Selected Europium—Activated Red. J. Electrochem. Soc. 1969, 116, 1047–1050. [Google Scholar] [CrossRef]
- Putz, H.; Brandenburg, K. Match! - Phase Analysis using Powder Diffraction, Crystal Impact - GbR, Kreuzherrenstr. 102, 53227 Bonn, Germany, https://www.crystalimpact.de/match.
- Bruker AXS (2008): TOPAS V4: General profile and structure analysis software for powder diffraction data. - User’s Manual, Bruker AXS, Karlsruhe, Germany.
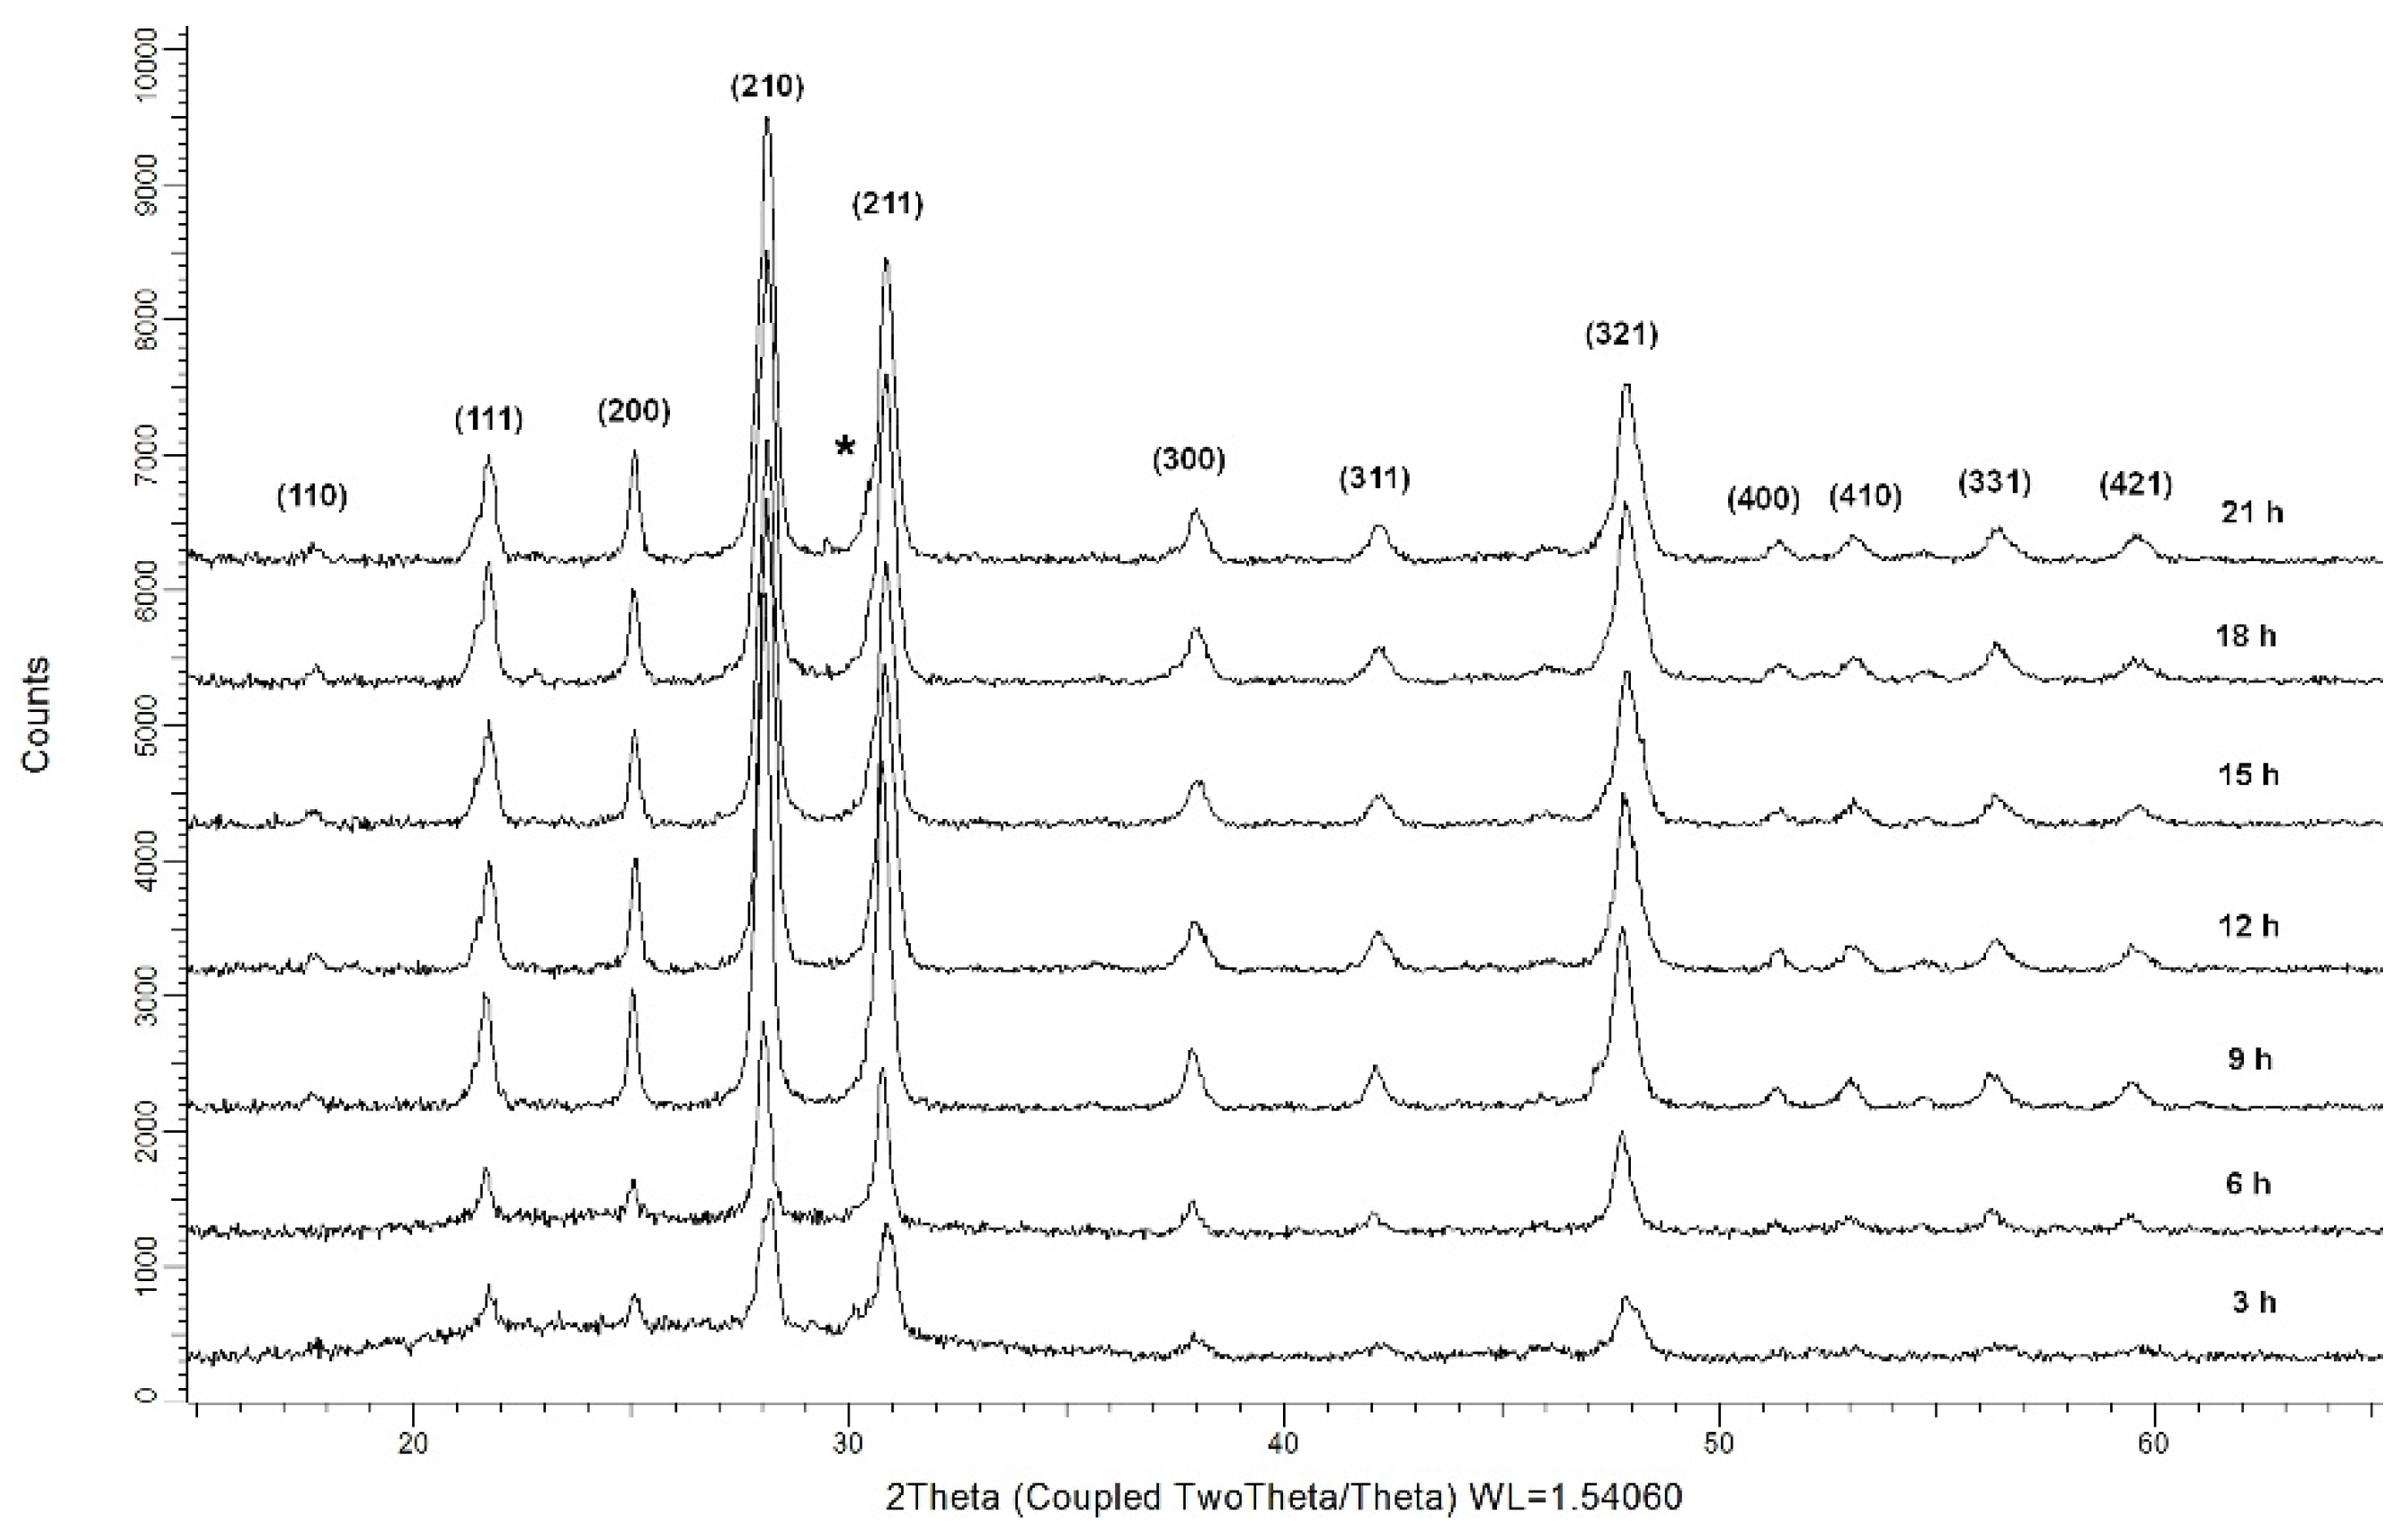

| Crystallized at 680 °C |
Unit cell parameter [Å] |
Crystallite size [nm] |
|---|---|---|
| 3h | 7.134(1) | 27.8(6) |
| 6h | 7.118(2) | 17.9(5) |
| 9h | 7.132(1) | 26.6(4) |
| 12h | 7.131(1) | 23.9(3) |
| 15h | 7.1187(2) | 22.1(3) |
| 18h | 7.117(1) | 22.1(4) |
| 21h | 7.119(1) | 23.3(4) |
| Glass composition | Relative Luminescent Intensity Ratio, R | Reference |
|---|---|---|
| Glass 52WO3:22B2O3:26La2O3:0.5Eu2O3 | 4.88 | Current work |
| GC-3h | 4.93 | Current work |
| GC-6h | 5.58 | Current work |
| GC-9h | 5.83 | Current work |
| GC-12h | 5.88 | Current work |
| GC-15h | 5.95 | Current work |
| GC-18h | 6.12 | Current work |
| GC-21h | 5.92 | Current work |
| Glass 50ZnO:(50-x)B2O3: xNb2O5:0.5Eu2O3:, x= 0, 1, 3 and 5 mol% | 4.31-5.16 | [26] |
| Glass 50ZnO:40B2O3:10WO3:xEu2O3 (0≤x≤10) | 4.54÷5.77 | [27] |
| Glass 50ZnO:40B2O3:5WO3:5Nb2O5:xEu2O3 (0≤x≤10) | 5.09÷5.76 | [28] |
| Glass 66P2O5–10.5Al2O3–3.05BaO–16.5K2CO3–0.7NaF–xEu2O3–0.5Nd2O3–(2.75-x) La2O3 (mol.%), where x = 0, 0.25, 0.5, 0.75, 1.5 and 2 | 3.72 | [29] |
| Glass-ceramic 66P2O5–10.5Al2O3–3.05BaO–16.5K2CO3–0.7NaF–xEu2O3–0.5Nd2O3–(2.75-x) La2O3 (mol.%), where x = 0, 0.25, 0.5, 0.75, 1.5 and 2 | 4.72 | |
| Glass 50ZnO:47B2O3:3Nb2O5:0.5Eu2O3 | 5.16 | [30]. |
| Glass-ceramic 50ZnO:47B2O3:3Nb2O5:0.5Eu2O3 | 5.21-5.49 | |
| Glass 74.0 TeO2+25.0 Li2CO3+1.0 Eu2O3 | 3.70 | [31] |
| Glass-ceramic 74.0 TeO2+25.0 Li2CO3+1.0 Eu2O3 | 3.65 | |
| Glass 50Li2O·45B2O3·5Al2O3: 2Eu2O3 | 3.91 | [32] |
| Glass ceramic 50Li2O·45B2O3·5Al2O3: 2Eu2O3 | 4.047 | |
| Glass 7SiO2-47.4CaO-40.5Al2O3-4.1MgO-1Eu2O3 | 4.58 | [33] |
| Glass-ceramic 7SiO2-47.4CaO-40.5Al2O3-4.1MgO-1Eu2O3 | 1.97 |
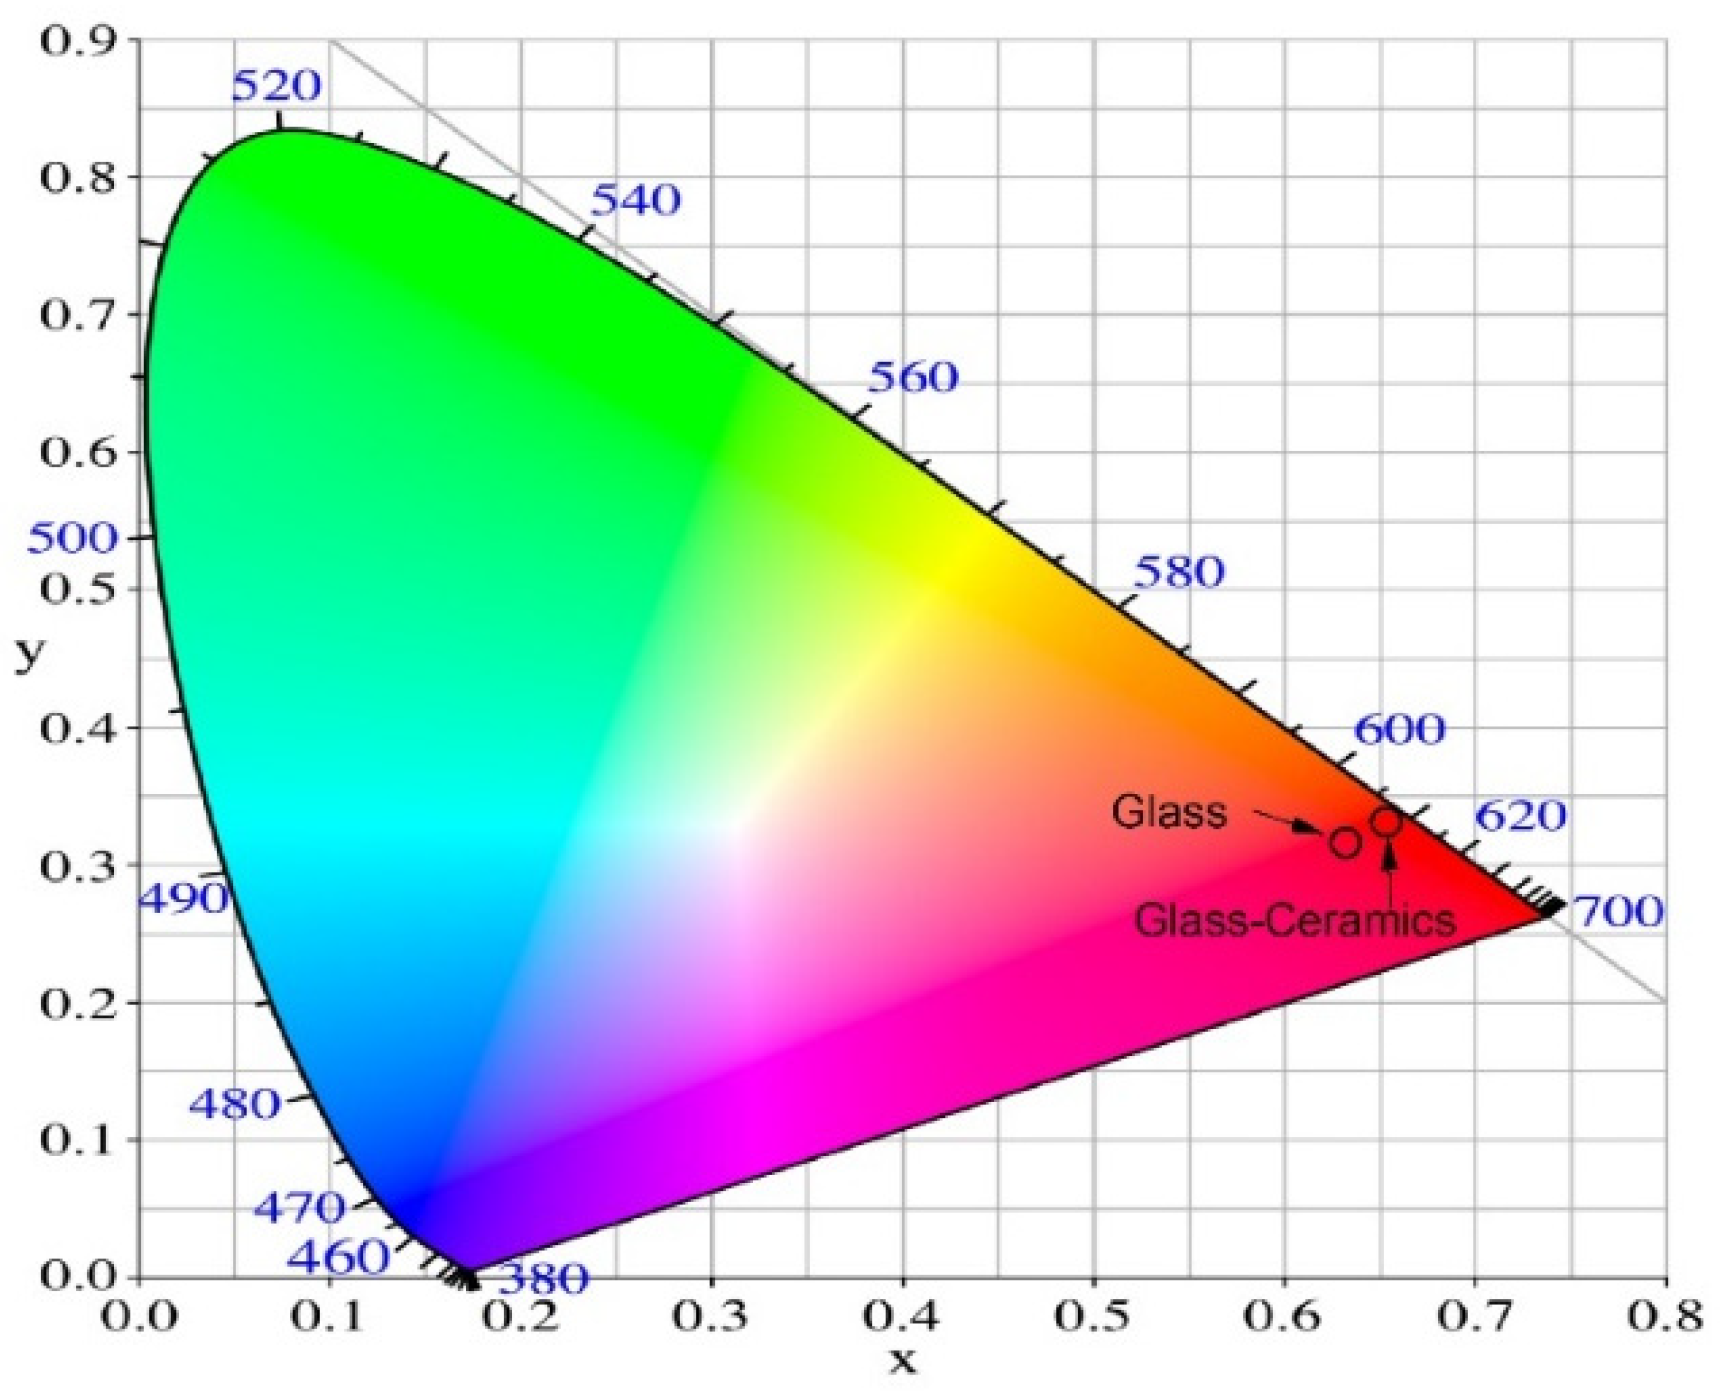
| Glass composition | Chromaticity coordinates (x, y) |
|---|---|
| Glass 52WO3:22B2O3:26La2O3:0.5Eu2O3 | 0.629, 0.328 |
| GC-3h | 0.650, 0.343 |
| GC-6h | 0.648, 0.345 |
| GC-9h | 0.651, 0.345 |
| GC-12h | 0.651, 0.345 |
| GC-15h | 0.650, 0.346 |
| GC-18h | 0.650, 0.346 |
| GC-21h | 0.651, 0,346 |
| NTSC standard for red light | 0.670, 0.330 |
| Y2O2S:Eu3+ | 0.658, 0.340 |
Disclaimer/Publisher’s Note: The statements, opinions and data contained in all publications are solely those of the individual author(s) and contributor(s) and not of MDPI and/or the editor(s). MDPI and/or the editor(s) disclaim responsibility for any injury to people or property resulting from any ideas, methods, instructions or products referred to in the content. |
© 2025 by the authors. Licensee MDPI, Basel, Switzerland. This article is an open access article distributed under the terms and conditions of the Creative Commons Attribution (CC BY) license (http://creativecommons.org/licenses/by/4.0/).


