
Submitted:
18 June 2024
Posted:
19 June 2024
You are already at the latest version
Abstract
In this paper glass crystallization behavior of 50ZnO:47B2O3:3Nb2O3:0.5Eu2O3 (G-0h) glass has been investigated in detail by DSC, XRD and TEM analysis. The luminescent properties of resulted glass-ceramics were also investigated. By XRD and TEM analysis crystallization of several crystalline phases have been proved (α-Zn3B2O6, β-Zn3B2O6 and ZnNb2O6). By calculating of crystal parameters it was found that europium ions are successfully incorporated in the β-Zn3B2O6. Photo-luminescent spectra show an increased emission in the resulting glass-ceramic samples as compared with the parent glass sample because of the higher asymmetry of Eu3+ ions in the crystalline phases obtained. It was established that the optimum emission intensity is registered for glass-ceramic sample obtained after 25 hours heat treatment of the parent glass.
Keywords:
glass ceramics
; XRD
; TEM
; luminescence
1. Introduction
In recent years, a great deal of attention has been payed to rare earth doped glass-ceramic materials, which play a crucial role in many optical application as up-conversion fibers, solid-state lasers, medical sensors, optical electronic chips, luminescence labels, optical amplifiers, 3D displays ets [1,2]. Most optical applications require transparency that is due to the reduced scattering effect because of the presence of nanocrystals inside glass ceramics. In addition, nanocrystalline glass ceramics might exhibit distinct optical properties in relation to pristine glasses when the rare earth ions occupy sites in the crystalline phase. In this case, an increase of emission intensities can occur due to the presence of rare earth ions in environments with lower phonon energy [3,4]. Transparent glass-ceramics possess excellent characteristics from both glasses and crystals and lack drawbacks of these two materials. Similar to glasses, glass ceramics have a large capacity for accommodating an active rare earth dopant, are isotropic and have evenly distributes activators within their bodies. Similar to single crystals, glass ceramics contain rare earth ions within strictly ordered ligand surroundings. As a result, the presence of crystalline environment around a rare earth ion allows high absorption and emission cross section reduction in the non-radiative relaxation because of the lower phonon cut-off energy, and tailoring of the ion-ion interaction by the control of the rare earth ion partition [1,4].
The glass ceramic materials are usually obtained by subsequent thermal treatment of a glass, first melted and annealed as usual. This conventional method relies on thermally induced phase separation and in situ crystallization processes, which however, are very complex to control experimentally [4]. The choice of an appropriate glass composition is very important for luminescent glass ceramics elaboration. The search for more efficient glass compositions and guiding structures for rare earth doped glass ceramics is continuing.
More recently we have reported for the preparation, structure and luminescence properties of niobium modified zinc-borate glasses doped with Eu2O3 with compositions in mol% of 50ZnO:(50-x)B2O3:xNb2O5:0.5Eu2O3, (x = 0, 1, 3 and 5 mol.%) [5]. Through differential thermal analysis and density measurements, various physical properties such as molar volume, oxygen packing density and glass transition temperature were determined. IR and Raman spectra revealed that niobium ions enter into the base zinc borate glass structure as NbO4 tetrahedra and NbO6 octahedra. It was found that the incorporation of Nb2O5 into Eu3+: ZnO:B2O3 glass creates more disordered and reticulated glass networks, which are favorable for doping with Eu3+ active ions. The luminescent properties of the obtained Eu3+ - doped glasses revealed that they could be excited by 392 nm and exhibit pure red emission centered at 612 nm (5D0 → 7F2 transition). The introduction of niobium oxide into the ZnO:B2O3 glass enhances the luminescent intensity. 3 mol% was the optimal Nb2O5 concentration at which the most intensive red luminescence was obtained.
In this work, we report on the preparation and luminescent properties of glass ceramic materials, obtained by controlled crystallization of glass with the composition in mol% of 50ZnO:47B2O3:3Nb2O5:0.5Eu2O3. The crystallization behavior of glass–ceramics were characterized by X-ray diffraction and transmission electron microscopy. Emission spectra were measured, and color coordinates of the materials were determined
2. Results
2.1. Thermal Analysis and XRD Data
As it was mentioned at the Introduction section, in our previous study glasses with nominal composition 50ZnO:(50 − x)B2O3:xNb2O5:0.5Eu2O3, (x = 0, 1, 3 and 5 mol.%) were obtained and their luminescent properties were examined [5]. It was established that the optimum Nb2O5 concentration to obtain the most intensive red luminescence is 3 mol.% (x=3). This was the reason to choose the glass 50ZnO:47B2O3:3Nb2O5:0.5Eu2O3 (G-0h) and to investigate its crystallization ability in order to increase the luminescent properties of the resulted glass-ceramic materials comparing with the initial glass. The glass ceramics obtained after heat treatment of the parent glass for different time (5h, 10h, 15h, 20h, 25h, 25h, 30h) were labeled as GC-5h, GC-10h, GC-15h, GC-20h, GC-25h, GC-30h, respectively.
The DSC curve for the glass G-0h is shown in Figure 1.
The first endothermic peak corresponds to the glass transition temperature (Tg) while next three exothermic peaks are due to the crystallization of the glass (Tkn, where n=1, 2 and 3). The last endothermic effect corresponds to the melting temperature (Tm). The synthesized glass is characterizing with high glass transition temperature. The Tg value is 557 oC while the crystallization temperatures are as follows 633, 745 and 846 oC. The melting temperature is 846 oC. On the other hand, the thermal stability of the glass, i.e., ΔT=Tk1–Tg is 76 oC.
In the ternary system ZnO-B2O3-Nb2O5 it is not reported for existence of any three component crystalline phases. This means that the crystalline phases from the binary systems during the crystallization of glass G-0h would be expected. In the phase-equilibrium diagram of the system Nb2O5-B2O3 only one binary compound with composition 3Nb2O5:B2O3 exists, which melts incongruently [6]. A large region of liquid phase separation exits in the range from 10 to 66 mol.% Nb2O5 [6]. For the binary system ZnO-Nb2O5 there are two crystalline phases Zn3Nb2O8 and ZnNb2O6 (congruently melting) and Nb-rich compound labeled Zn2Nb34O87 that melts incongruently [7,8]. The third binary system is ZnO-B2O3 that is the richest in terms of crystalline phases. In the different references the following crystalline phases have been reported: Zn5B4O11, ZnB2O4, Zn3B2O6, ZnB4O7 and Zn4B6O13 [8,9]. A large immiscibility region located above 50 mol. % B2O3 is also reported [8,10].
In order to avoid the full crystallization of the investigated glass we applied a glass heating temperature below first crystallization temperature (Tk1-633°C). The XRD patterns at room temperature for the initial and crystallized glass for different times (5, 10, 15, 20, 25 and 30 hours) at 610 oC are shown in Figure 2.
The amorphous nature of the investigated glass was presented in our previous paper [5]. In this work, the powder pattern of the initial glass is included only for comparison and to track the crystalline phases resulted due to heat treatment of G-0h. Тhe weight percentages (wt.%) ratio of the obtained phases is summarized in Figure 3a. For GC-5h and GC-10h samples it was impossible to determine the ratio between crystalline phases due to the low intensity of the diffraction lines. For sample GC-5h the predominated crystalline phase corresponds to formation of α-Zn3B2O6 (ICDD PDF # 01-075-3037). A small amount of ZnNb2O6 (ICDD PDF # 00-037-1371) crystal phase was also detected. With increasing of heat treatment time (15 hours), the appearance of β-Zn3B2O6 (ICDD PDF #00-027-0983) was observed at the expense of both - α-Zn3B2O6 and the amorphous phase.
After 30 hours of heating of glass (GC-30h), the X-ray analysis shows that β-Zn3B2O6 grows and dominates compared to the other crystalline phases. Also, the amount of ZnNb2O6 crystalline phase does not change and remains within 14% in all glass-ceramic samples. Figure 3b traces the changes in the degree of crystallinity for all samples. It changes from 3.6 % for GC-5h and increases approximately up to 30 % for GC-30h. The crystallite sizes for all phases were calculated and the results are presented on Figure 4.
The particle sizes of β-Zn3B2O6 changes from 68 to 99 nm. On the other hand, for α-Zn3B2O6 the crystal sizes do not change significantly (from 85 to 89 nm), and as well as for ZnNb2O6 (from 27 to 34 nm).
X-ray studies show that during the heat treatment of the glass the main crystalline phase is Zn3B2O6 in two polymorph modifications. For the first time Chen at all. [9] reported for low-temperature α-Zn3B2O6 crystallized in a triclinic space group P-1 with unit cell parameters a = 6.302(2)Å , b = 8.248(1)Å , c = 10.020(1)Å , α = 89.85(1)o, β = 89.79(1)o, γ = 73.25(1)o, V = 498.73 Å3 and Z = 4. The crystal structure of β-Zn3B2O6 was reported for the first time by Garcia-Blanco and Fayos [11] in monoclinic space group Ic (9) with unit cell parameters a = 23.40, b = 5.04, c = 8.38, β = 97.53o, V = 979.78 Å3 and Z = 8. Two years later, H. Baur and Tillmanns predetermined the crystal structure in the centrosymmetric space group I2/c (15) with the same unit cell parameters [12]. α-Zn3B2O6 represents a new structural type in which ZnO4 tetrahedra are connected to each other and also to BO3 flat triangles by common corners giving rise to a three-dimensional framework, while β-Zn3B2O6 is characterized by a three-dimensional network built from corner- and edge-sharing ZnO4 tetrahedra as well as corner sharing ZnO4 tetrahedra and BO3 triangles [9].
The second in quantity is the crystalline phase of ZnNb2O6. This compound crystallizes in orthorhombic space group Pbcn (60) with unit cell parameters: a = 14.208 Å, b = 5.726 Å, c = 5.04 Å, V = 410.03 Å3, Z = 4. The zinc niobate has a columbite-type structure in which Zn2+ and Nb5+ are in an octahedral environment. Each of the cations forms zigzag chains made up of octahedra connected by common edges and vertices along the [001] direction.
In this regard, the unit cell parameters and volume of the resulting crystalline phases during the thermal treatment of the glass were calculated and their values are presented in Table 1.
As can be seen, a significant difference for the a-cell parameter of β-Zn3B2O6 was observed. For instance, the calculated a-parameter for β-Zn3B2O6 varies from 23.833 to 23.885 Å with increasing heat treatment time. Compared to the literature data this parameter is 23.40 Å. Moreover, the volume of the unit cell increases from 979.78 Å3 for the referent β-Zn3B2O6 phase up to 985.1 Å3 for the resulting β-Zn3B2O6. For the other crystalline phases, no such changes are observed. This gives us reason to assume that the doped europium ions predominantly are accommodated in the β-Zn3B2O6 crystal structure.
2.2. Luminescent Properties
In order to study the luminescent behavior of the synthesized glass and glass ceramics, the emission (λex = 392 nm) and excitation (λem = 612 nm) spectra of the obtained samples were measured. Figure 5 displays the room temperature PLE spectra of 0.5 mol% Eu3+ doped 50ZnO:47B2O3:3Nb2O5 glass and glass ceramics, recorded at 612 nm emission, corresponding to 5D0→7F2 transition of Eu3+ ions.
The narrow peaks located in the spectral range 350-580 nm, are assigned to the characteristic 4f - 4f transitions of Eu3+ ion, in particular from 7F0 → 5HJ, 7F0 → 5D4, 7F0 → 5L7, 7F0 → 5L6, 7F0 → 5D3, 7F0 → 5D2, 7F0 → 5D1, 7F1 → 5D1, 7F0 → 5D0 at 317 nm, 361 nm, 380 nm, 392 nm, 413 nm, 463 nm, 523 nm, 531 nm and 576 nm, respectively [13]. The part of the spectra in the lower wavelength region, below 350 nm, is represented by a broad band due to the charge transfer transitions of the host absorbing groups, in particular Nb2On (O2-→Nb5+) [14] and ZnOn (O2-→Zn2+) [15] and from oxygen 2p orbital to the empty 4f orbital of europium (O2−→Eu3+) [16,17,18,19]. The appearance of this absorption in the excitation spectra when monitoring the Eu3+ emission at 612 nm, is an indication of the occurrence of a charge transfer from the matrix, in this case from NbOn and ZnOn structural polyhedra to the rare earth Eu3+ ion and previously has been shown to play an important role in the enhancement of the rare earth emission intensity. [20,21,22,23,24]. This process is known as “host sensitized” energy transfer.
The intensity of the f-f peaks increases with the time of the heat treatment up to 25h and then decreases at 30h. The same trend is observed in the emission spectra. This behavior is most likely caused by change of the active ion surroundings after glass crystallization and hence more effective excitation of Eu3+ may be expected in the glass ceramic samples. [25]. The most intensive peak of the excitation spectra is located at 392 nm attributed to 7F0 → 5L6, followed by the 7F0 → 5D2 at 463 nm. These wavelengths can be used as excitation source to register the emission spectra and are compatible with the commercially available near ultraviolet light emitting diodes (LED) (250-400 nm) and blue LED chips (430-470 nm).
The room-temperature PL spectra are recorded in the range of 550-750 nm and are shown in Figure 6. The spectra are composed of the typical Eu3+ emission lines at 578nm, 591nm, 612nm,651 and 700 nm due to the transitions from the 5D0 excited state to the 7F0, 7F1, 7F2, 7F3, 7F4 ground states of Eu3+ ion, respectively [13].
The glass spectrum is characterized by the lowest luminescence intensity. After preparing glass ceramic samples, by heat treatment and crystallization at 610°C, the emission intensity becomes stronger. The luminescent intensity of glass ceramics increases with increasing heat treatment time up to 25 hours. This behavior can be attributed to the Eu3+ ions incorporation into the Zn3B2O6 crystal and therefore, the enhancement of the spectral intensity is due to the change of the site symmetry around the Eu3+ ion. This fact is consistent with the X-ray structural data. A further increase in the treatment time to 30 hours results in a sharp drop in emission intensity.
As can be seen from Figure 6 the major emission line is located at 612 nm and is caused by the forced electric dipole transition (ED) 5D0→7F2. According to Judd-Ofeld theory this transition is sensitive to the chemical bonds and site symmetry in the vicinity of Eu3+ ions, and it is most intensive when Eu3+ ions are occupying non-inversion symmetry sites [26].
The magnetic dipole transition (MD) at 591nm (5D0→7F2) is insensitive to the crystal field environment and can be used as reference, since its intensity hardly varies with the change of the site symmetry around the Eu3+ ions [13,16]. An indication that Eu3+ ions are located in lattice sites without an inversion center is the more intensive ED emission compared to MD one. Therefore, by calculating the intensity ratio of these two emissions (Table.2.), known as asymmetric ratio R, the degree of asymmetry in the local environment around the Eu3+ and the strength of Eu - O covalence in the different Eu3+ doped compounds can be studied. The lower the R value, the higher the local site symmetry around the active ion, and the lower Eu–O covalency and emission intensity [27]. Ratio values greater than 1 correspond to the location of Eu3+ ions into lower symmetry sites, while values below 1 indicate that the active ion occupies high symmetry sites. The higher R values (from 5,16 to 5.49), compared to ones reported for Eu3+ doped glasses and glass ceramics (Table) [5,20,28,29,30,31,32], suggest more asymmetry in the vicinity of Eu3+ ions, stronger Eu–O covalence, and thus enhanced emission intensity. With increasing crystallinity, the asymmetry ratio increases gradually, up to glass ceramic sample with 25 hours of thermal treatment (GC-25h). This fact is directly related to the higher emission intensity of the heat-treated samples, as the higher the asymmetry the stronger the luminescent intensity. At 30 hours heat treatment (CG-30h), a decrease in R value is observed, which is consistent with the decrease of the emission intensity of this specimen.
Additionally, an indication of the low symmetry in the local environment around the Eu3+ is the appearance of the strictly forbidden 5D0 → 7F0 transition, which as stated by Binnemans, shows that Eu3+ ions are located in sites with C2v, Cn or Cs symmetry [13]. Moreover, the splitting into three peaks of the 5D0 → 7F1 transition is also evidencing that the symmetry of the Eu3+ sites in the studied glass and glass ceramics are C2v or lower [33].
In order to estimate the actual emitted colors, the Commission International de l’Eclairage (CIE) 1931 chromaticity diagram was used [34]. The chromaticity coordinates were calculated from the emission spectra by using color calculator software SpectraChroma (CIE coordinate calculator) [35]. The calculated values are listed at Table 3. The chromaticity coordinates of the glass and glass ceramics lie in the red region in the CIE diagram (Figure 7). Their values are almost identical and accordingly are represented in the figure as one point. The closest to the CIE coordinate of standard red light (0.670,0.330) and to the color coordinates of the commercial red phosphor Y2O2S:Eu3+ (0.658;0.340) [36] is the glass sample (0.656, 0.343).
The color-correlated temperature (CCT) of each sample were calculated by using the McCamy empirical formula [37]
;
where x and y are chromaticity coordinates, which are calculated by CIE1931 software.
Generally, color-correlated temperatures greater than 5300 K are considered as cool light, between 3300 and 5300 K are considered moderate light and less than 3300 K as warm light. As can be seen from table, the obtained values are in range 2324.60 K ÷ 2505.78 K and the Eu3+ doped glass and the corresponding glass ceramics can be assigned as warm light emitting materials.
The obtained results indicate that the studied glass and glass ceramics emit warm red light, which is very useful for development of red-emitting lightning solid state devices.
2.3. TEM Investigations and Density Measurment
The morphology, particle size distribution, and phase composition of the glass ceramic sample obtained after 25 hours heat treatmnnet that is characterised with the best luminescent properties were investigated using TEM and HRTEM analytical methods. Morphology studies (Figure 8) show that the sample contains spherical and rectangular nanosized particles, as well as larger particles with sizes of about 80-90 nm. The inset of the Figure 8 illustrates the particle size distribution.
The average particle size of the glass ceramic sample obtained after 25 hour heat treatment of the parent glass is 33 nm. The particle sizes range between 10 and 80 nanometers, with some larger particles also present. The majority of the particles are in the range of 20-40 nm. HRTEM analysis (Figure 9) reveals the presence of both high-temperature monoclinic and low-temperature triclinic Zn₃(BO₃)₂ phases in the sample, with cell parameters of a = 23.400, b = 5.040, c = 8.38 for the monoclinic phase, and a = 8.248, b = 10.020, c = 6.302 for the triclinic phase. The interplanar distances are d = 3.9 Å and d = 3.2 Å, respectively.
The luminescent properties measured showed that the glass ceramic sample obtained after 25 hours heat treatment of the parent glass (GC-25h) is characterized with the highest luminescence intensity. That is why we have measured the density of the GC-25h by applying the Archimedes method, which is found to be 5.577±0.002 g/cm3. The density of GC-25h obtained is similar to the density of the parent glass with same composition (5. 663±0.001 g/cm3) [5], which is an evidence for the homogeneous nucleation of the glass [38].
3. Discussion
In this paper glass crystallization behavior of 50ZnO:47B2O3:3Nb2O3:0.5Eu2O3 (G-0h) glass has been investigated in details by XRD and TEM analysis. XRD data show that the crystallization started after 5 hours heat treatment at 610 °C with separation of two crystalline phases –α-Zn3B2O6 and ZnNb2O6. After 15 hours of heat treatment β-Zn3B2O6 appears additionally and with further heating increases in amount at the expense of both α-Zn3B2O6 and glass phase. Comparative analysis of structural data of referent zinc borate and zinc niobate crystalline phases and glass-ceramics obtained here (see Table 1) shows more significant changes in both the parameter (a) and unit cell volume for β-Zn3B2O6 obtained from glass crystallization. This observation suggests that doped europium ions preferentially are accommodated in the β-Zn3B2O6. This suggestion is confirmed by the luminescence measurements as a drastic increase of the emission intensity of the GC-15h was observed when β-Zn3B2O6 appears. With increasing time of heat treatment (20 and 25 hours) the luminesce emission increases most probably because the amount of β-Zn3B2O6 also increases. However, 30 hours heat treatment leads to decrease of luminescence intensity due to the emission quenching effect of europium ions. We assume that this quenching is a result of decreased average distance between europium ions because of increasing amount of β-Zn3B2O6. The enhanced photoluminescence emission in the glass ceramic samples compared with the glass is related to the covalence and structural changes in the vicinity of RE3+ ions (short range effect) [39]. The higher intensity of the 5D0→7F2 emission band in glass ceramics spectra and as well as the higher values of luminescence intensity ratio R in comparison with that of parent glass can be related to the more asymmetrical coordination environment around Eu3+ ions in the glass ceramics. On other hand the increased emission efficiency of Eu3+ ions in the crystallized samples as compared with the glass, can be explained with the fact that in the glass ceramics the crystalline particles are embedded in the amorphous matrix and more of them are separated each other’s which improve the light scattering intensity from the free interfaces of the nanocrystallites [40].
4. Materials and Methods
Glass with nominal compositions 50ZnO:47B2O3:3Nb2O5:0.5Eu2O3, was obtained by applying the conventional melt-quenching method, using commercial powders of reagent grade Nb2O5 (Merck KGaA, Darmstadt, Germany), ZnO (Merck KGaA, Amsterdam, The Netherlands), H3BO3 (SIGMA-ALDRICH, St. Louis, MO, USA), and Eu2O3 (SIGMA-ALDRICH, St. Louis, MO, USA) as starting materials. The details of glass synthesis were given in ref. 5. To prepare the glass ceramics (GC), the precursor glass 50ZnO:47B2O3:3Nb2O5:0.5Eu2O3 was subjected to the heat treatment at 610oC for 5h, 10h, 15h, 20h, 25h and 30h. The glass transition (Tg) temperature of the glass was determined by differential scanning calorimetry (DSC) using а Netzsch 404 Pegasus instrument,2021 Selb, Germany at a heating rate of 10 K/min in Ar flow of 10 ml/s, using corundum crucible with lids. The XRD investigations were performed by using Bruker D8 Advance X¬-ray powder diffractometer equipped with X-ray tube with copper anode (CuKα = 1.542 A, 40 kV and 40 mA) and LynxEye position sensitive detector. The powder patterns were collected in the angular kkrange 5.5 - 80.0° 2θ with a step of 0.03° 2θ and total of 52.5 sec/step counting statistics, integrated over the whole area of the detector. The qualitative phase analysis was performed using DIFFRAC.EVA v.4 software program [41] in combination with ICDD PDF-2 (2021) reference database. The quantitative phase analysis, crystallite size, unit cell parameters and degree of crystallinity were determined using Topas v.4.2 software program [42]. The crystal structure parameters for α-Zn3B2O6, β-Zn3B2O6 and ZnNb2O6 were taken from the literature cited in “Thermal analysis and XRD data” section earlier in this text. The TEM observations were carried out using transmission electron microscope JEOL JEM 2100 with GATAN Orius 832 SC1000 CCD Camera at accelerating voltage of 200 kV. The specimen for TEM investigation was prepared by grinding the sample in an agate mortar and then disintegrating it in the form of ethanol suspension by ultrasonic treatment for 6 min. A droplet of the suspension was coated on standard carbon films on Cu grids. The size distribution of the particles was performed with the image processing program ImageJ, the measurements of the interplanar distances were performed with the specialized software Digital Micrograph. The density of the glass ceramic obtained after 25 hours heat treatment was measured at room temperature by the Archimedes principle using toluene (ρ = 0.867 g/cm3) as an immersion liquid on a Mettler Toledo electronic balance of sensitivity 10−4 g. Photoluminescence (PL) excitation and emission spectra at room temperature for all glasses were measured with a Spectrofluorometer FluoroLog3-22, 2014 (Horiba Jobin-Yvon, Longjumeau, France).
5. Conclusions
Glass ceramics materials with enhanced photoluminescence emission have been obtained by controlled crystallization of glass with nominal composition 50ZnO:47B2O3:3Nb2O5:0.5 Eu2O3. Photoluminescence spectra revealed that obtained glass ceramics can emit red light under excitation of 392 nm originating from the dominant dipole transition 5D0→7F2 of Eu3+ ions. Based on the results from the emission spectra it was established that the formation of β-Zn3B2O6:Eu3+ nanocrystals and an appropriate degree of crystallinity are decisive factors to improve the luminescence properties of the samples.
Author Contributions
Conceptualization, R.I. A.Y. and L.A; methodology, A.Y. and L.A.; software, A.Y., L.A., P.Tz. and P.M.; validation, R.I.; formal analysis, A.Y., L. A. and R.I.; investigation, A.Y., P. Tz., P. M., P. P. and L.A.; resources, L.A.; data curation, R.I.; writing—original draft preparation, R.I., M.M. L. A. and A.Y.; writing—review and editing, R.I.; visualization, R.I. A.Y. and L. A..; supervision, R.I.; project administration, L.A.; funding acquisition, L.A. All authors have read and agreed to the published version of the manuscript.
Funding
This research received no external funding
Informed Consent Statement
Not applicable.
Data Availability Statement
Data are contained within the article.
Acknowledgments
Research equipment of distributed research infrastructure INFRAMAT (part of Bulgarian National roadmap for research infrastructures) supported by Bulgarian Ministry of Education and Science
Conflicts of Interest
The authors declare no conflicts of interest.
References
- Fedorov, P. P.; Luginina, A. A.; A. Popov, I. Transparent oxyflouride glas ceramics. J. Fluor. Chem. 2015, 172, 22-50.
- Erth, D. Photoluminescenec in Glass and Glass Ceramics. IOP Conf. Series:Materials Science and Engineering 2009, 2. [Google Scholar]
- Marcondes, L. M.; Evangelista, R. O.; Gonçalves, R. R.; de Camargo, A. S.S.; Manzani, D.; Nalin, M.; Cassanjes, F. C.; Poirier, G. Y. Er3+-doped niobium alkali germanate glasses and glass-ceramics: NIR and visible luminescence properties. J. Non-Cryst. Solids 2019, 521, 119492. [Google Scholar] [CrossRef]
- Ferrari, M.; Righini, G. C. Glass-ceramic materials for guided-waste optics. Int. J. Appl. Sci. 2015, 6, 240–248. [Google Scholar]
- Iordanova, R.; Milanova, M.; Yordanova, A.; Aleksandrov, L.; Nedyalkov, N.; Kukeva, R.; Petrova, P. Structure and Luminescent Properties of Niobium-Modified ZnO-B2O3:Eu3+ Glass. Mater. 2024, 17, 1415. [Google Scholar] [CrossRef] [PubMed]
- Levin, E.M. Phase Equilibria in the System Niobium Pentoxide-Boric Acid. J Res. Nationa Bureau of Standards - A. Phys. Chem. 1966, 70A, 11–16. [Google Scholar] [CrossRef] [PubMed]
- Ballman, A.A.; Brown, H. Czochralski growth in the zinc oxide-niobium pentoxide system. J. Cryst. Growth, 1977, 41, 1–36. [Google Scholar] [CrossRef]
- Phase equilibrium diagrams, AcerS-NIST, CD-ROM Database, Version 3.1.0.
- Chen, X.; Hue, H.; Chang, X.; Zhang, Li; Zhao, Y.; Zuo, J.; Zang, H.; Xiao, W. Syntheses and crystal structures of the α- and β-forms zinc orthoborate, Zn3B2O6. J. Alloys. Compd. 2006, 425, 96-100.
- Dimitriev, Y.; Yordanova, R.; Aleksandrov, L.; Kostov, K. Boromolybdate glasses containing rare earth oxides. Phys. Chem. Glasses: Eur. J. Glass Sci. Technol. B. 2009, 50, 212–218. [Google Scholar]
- Garcia-Blanco, S.; Fayos, J. The crystal structure of zinc orthoborate, Zn3(BO3)2. Z. Kristallogr. 1968, 127, 145–159. [Google Scholar] [CrossRef]
- H. Baur, W.; Tillmanns, E. The space group and crystal structure of trizinc diorthoborate. Z. Kristallogr. 1970, 131, 213–221. [CrossRef]
- Binnemans, K. Interpretation of europium (III) spectra. Coord. Chem. Rev. 2015, 295, 1–45. [Google Scholar] [CrossRef]
- Zeng, H.; Song, J.; Chen, D.; Yuan, S.; Jiang, X.; Cheng, Y.; Chen, G. Three-photon-excited upconversion luminescence of niobium ions doped silicate glass by a femtosecond laser irradiation. Opt. Express 2008, 16, 6502–6506. [Google Scholar] [CrossRef] [PubMed]
- Nimpoeno, W.A.; Lintang, H.O.; Yuliati, L. Zinc oxide with visible light photocatalytic activity originated from oxygen vacancy defects. IOP Conf. Ser. Mater. Sci. Eng. 2020, 833, 012080. [Google Scholar] [CrossRef]
- Blasse, G.; Grabmaier, B.C. Luminescent Materials, 1st ed.; Springer: Berlin/Heidelber, Germany, 1994; p. 18. [Google Scholar]
- Hoefdraad, H.E. The charge-transfer absorption band of Eu3+ in oxides. J. Solid State Chem. 1975, 15, 175–177. [Google Scholar] [CrossRef]
- Parchur, A.K.; Ningthoujam, R.S. Behaviour of electric and magnetic dipole transitions of Eu3+,5D0-7F0 and Eu-O charge transfer band in Li+ co-doped YPO4:Eu3+. RSC Adv. 2012, 2, 10859–10868. [Google Scholar] [CrossRef]
- Mariselvam, K.; Liu, J. Synthesis and luminescence properties of Eu3+ doped potassium titano telluroborate (KTTB) glasses for red laser applications. J. Lumin. 2021, 230, 117735. [Google Scholar] [CrossRef]
- Aleksandrov, L.; Milanova, M.; Yordanova, A.; Iordanova, R.; Nedyalkov, N.; Petrova, P.; Tagiara, N.S.; Palles, D.; Kamitsos, E.I. Synthesis, structure and luminescence properties of Eu3+-doped 50ZnO.40B2O3.5WO3.5Nb2O5 glass. Phys. Chem. Glas. Eur. J. Glass Sci. Technol. B 2023, 64, 101–109. [Google Scholar]
- Yordanova, A., Aleksandrov, L., Milanova, M., Iordanova, R., Petrova, P., Nedyalkov, N. Effect of the addition of WO<sub>3</sub> on the structure and luminescent properties of ZnO-B2O3: Eu3+ glass. Molecules, 2024, 29, 2470.
- Sreena, T. S.; Raj, A. K.; Rao, P. P. Effects of charge transfer band position and intensity on the photoluminescence properties of Ca1.9M2O7: 0.1Eu3+ (M= Nb, Sb and Ta). Solid State Sci. 2022, 123, 106783. [Google Scholar] [CrossRef]
- Sun, X. Y.; Jiang, D. G.; Chen, S. W.; Zheng, G. T.; Huang, S. M.; Gu, M.; Zhao, J. T. Eu3+- activated borogermanate scintillating glass with a high Gd2O3 content. J. Am. Ceram. Soc. 2013, 96, 1483–1489. [Google Scholar] [CrossRef]
- Pang, M.; Liu, X.; Lin, J. Luminescence properties of R2MoO6: Eu3+ (R= Gd, Y, La) phosphors prepared by Pechini sol-gel process. J. Mater. Res. 2005, 20, 2676–2681. [Google Scholar] [CrossRef]
- Walas, M. , Lisowska, M., Lewandowski, T., Becerro, A.I., Łapiński, M., Synak, A., Sadowski, W. and Kościelska, B. From structure to luminescence investigation of oxyfluoride transparent glasses and glass-ceramics doped with Eu3+/Dy3+ ions. J. Alloys Compd. 2019, 806, 1410–1418. [Google Scholar] [CrossRef]
- S. Shigeo, M. William, Phosphor Handbook. CRC Press, Washington, DC, 1998.
- Dejneka, M.; Snitzer, E.; Riman, R. E. Blue, green and red fluorescence and energy transfer of Eu3+ in fluoride glasses. J. Lumin. 1995, 65, 227–245. [Google Scholar] [CrossRef]
- Milanova, M.; Aleksandrov, L.; Yordanova, A.; Iordanova, R.; Tagiara, N.S.; Herrmann, A.; Gao, G.; Wondraczek, L.; Kamitsos, E.I. Structural and luminescence behavior of Eu3+ ions in ZnO-B2O3-WO3 glasses. J. Non-Cryst. Solids 2023, 600, 122006.
- Narro-García, R. , Desirena, H., López-Luke, T., Guerrero-Contreras, J., Jayasankar, C. K., Quintero-Torres, R., De la Rosa, E. Spectroscopic properties of Eu3+/Nd3+ co-doped phosphate glasses and opaque glass–ceramics. Opt. Mater. 2015, 46, 34–39. [Google Scholar] [CrossRef]
- Dwivedi, A., Joshi, C., Rai, S. B. Effect of heat treatment on structural, thermal and optical properties of Eu3+ doped tellurite glass: formation of glass-ceramic and ceramics. Opt. Mater. 2015, 45, 202-208.
- Laia, A. S., Maciel, G. S., Rodrigues Jr, J. J., Dos Santos, M. A., Machado, R., Dantas, N. O., Silva, A.C.A, Rodrigues, R. B., Alencar, M.A. Lithium-boron-aluminum glasses and glass-ceramics doped with Eu3+: A potential optical thermometer for operation over a wide range of temperatures with uniform sensitivity. J. Alloys Compd. 2022, 907, 164402. [CrossRef]
- Muniz, R. F., De Ligny, D., Sandrini, M., Zanuto, V. S., Medina, A. N., Rohling, J. H., Guyot, Y. Fluorescence line narrowing and Judd-Ofelt theory analyses of Eu3+-doped low-silica calcium aluminosilicate glass and glass-ceramic. J. Lumin. 2018, 201, 123–128.
- Binnemans, K.; Görller-Walrand, C. Application of the Eu3+ ion for site symmetry determination. J. Rare Earths 1996, 14, 173–180. [Google Scholar]
- Smith, T.; Guild, J. The CIE colorimetric standards and their use. Trans. Opt. Soc. 1931, 33, 73. [Google Scholar] [CrossRef]
- Paolini, T.B. SpectraChroma (Version 1.0.1) [Computer Software]. 2021. Available online: https://zenodo.org/records/4906590 (accessed on 7 June 2021).
- Trond, S.S.; Martin, J.S.; Stanavage, J.P.; Smith, A.L. Properties of Some Selected Europium—Activated Red. J. Electrochem. Soc. 1969, 116, 1047–1050. [Google Scholar] [CrossRef]
- McCamy, C.S. Correlated color temperature as an explicit function of chromaticity coordinates. Color Res. Appl. 1992, 17, 142–144. [Google Scholar] [CrossRef]
- Zanotto, E. D. Glass Crystallization Research — A 36-Year Retrospective. Part I, Fundamental Studies. Int. J. Appl. Glass Sci., 2013, 4, 105–116. [Google Scholar] [CrossRef]
- Fu, J; Kobayashi, M.; Sigimoto, S.; Parker, J. M. Scintillation from Eu2+ in Nanocrystallized Glass. J. Am. Ceram. Soc., 2009, 92, 2019-2021.
- Aleksandrov, L; Iordanova, R.; Dimitriev, Y.; Georgiev, N.; Komatsu, T. Eu3+ doped 1La2O3:2WO3:1B2O3 glass and glass ceramic. Opt. Mater. 2014, 36, 1366-1372.
- DIFFRAC.EVA V.4, User’s Manual, Bruker AXS, Karlsruhe, Germany, 2014.
- TOPAS V4.2: General Profile and Structure Analysis Software for Powder Diffraction Data. - User’s Manual, Bruker AXS, Karlsruhe, Germany, 2009.
Figure 1.
DSC curve of glass 50ZnO:47B2O3:3Nb2O5:0.5Eu2O3 (in mol %).
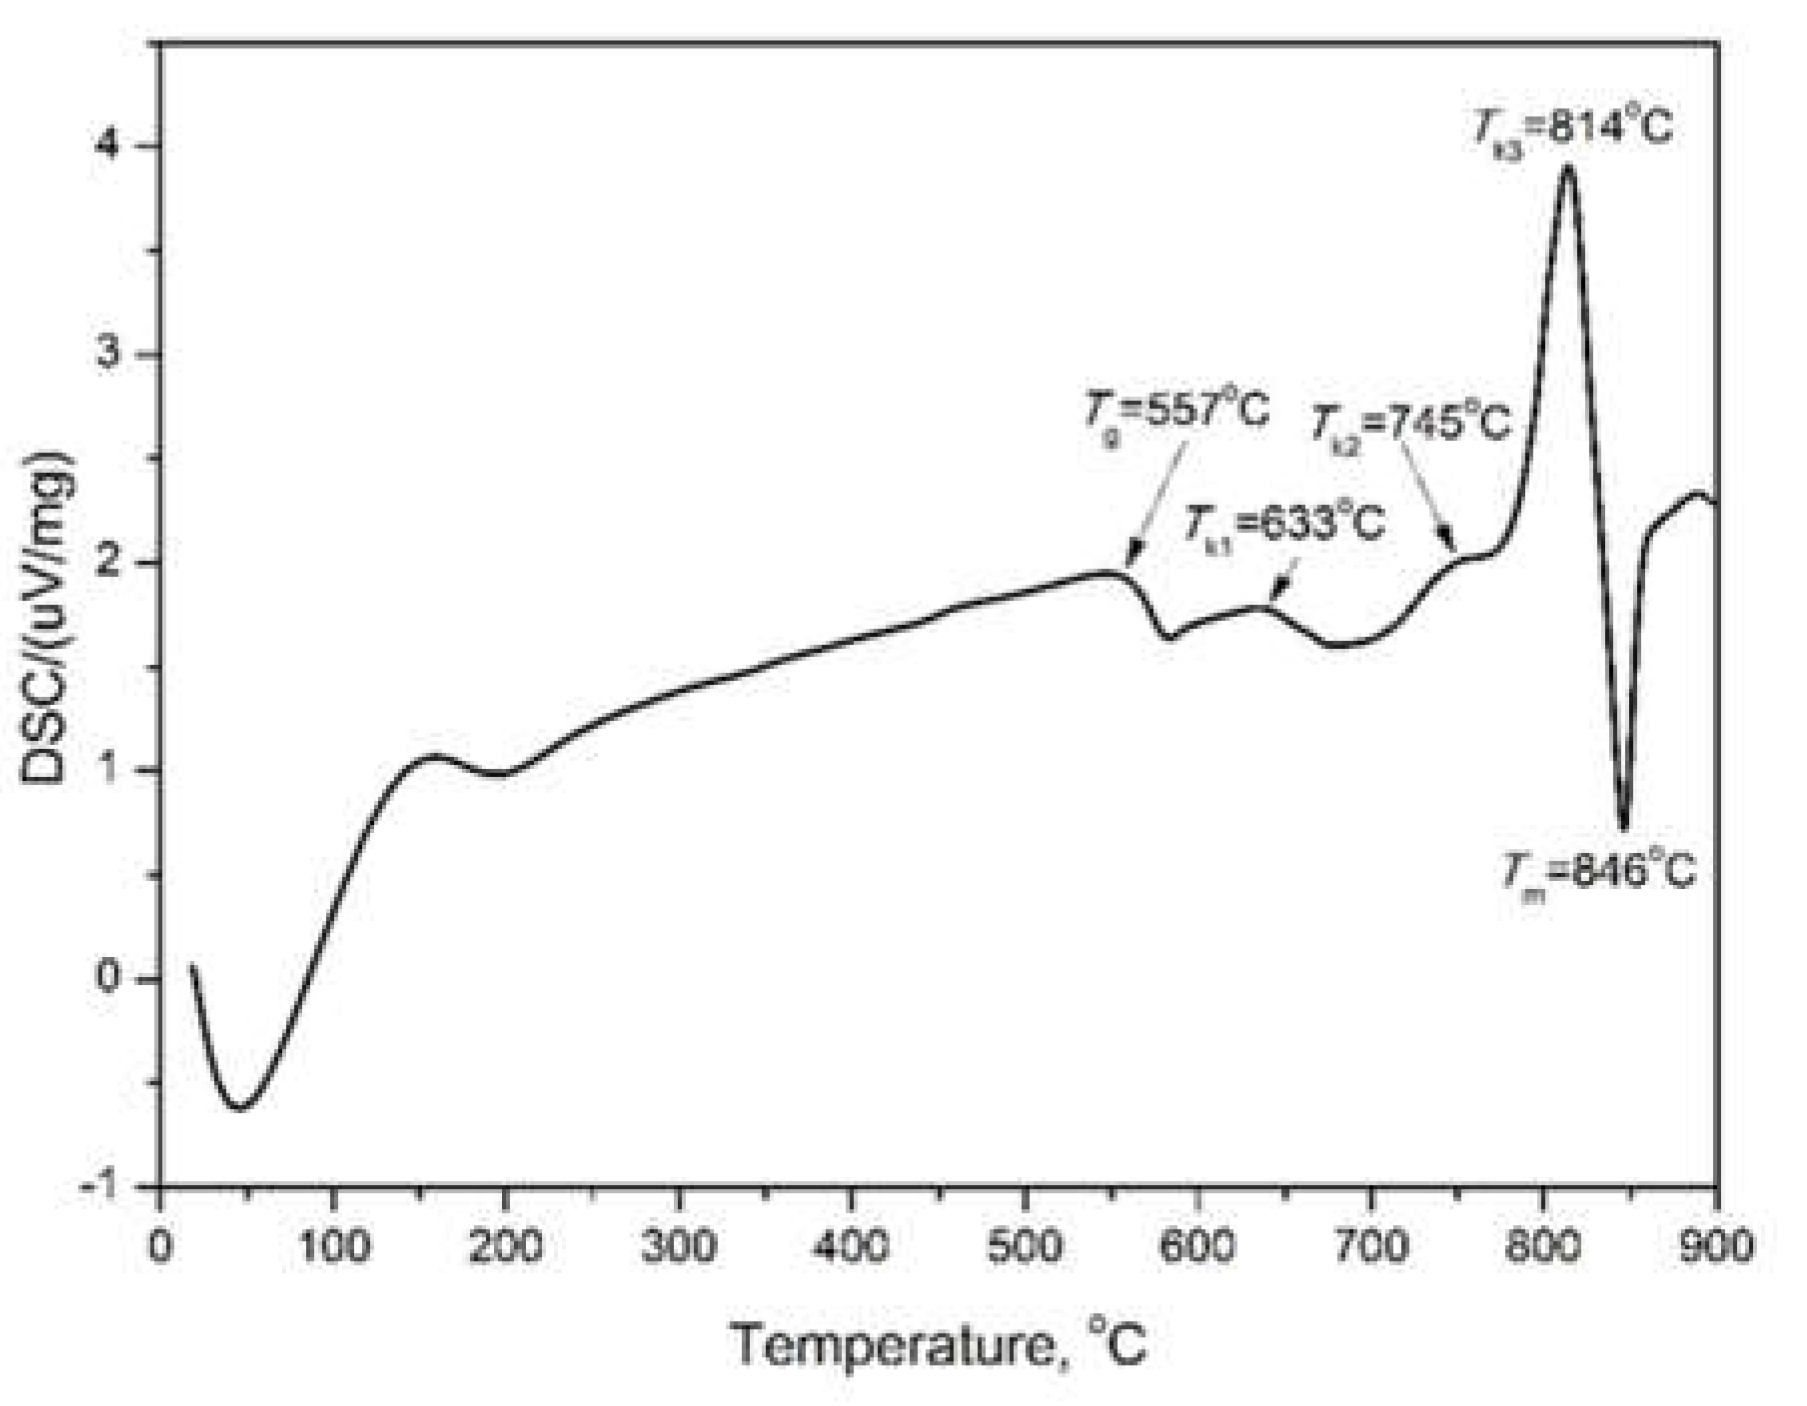
Figure 2.
XRD patterns of the initial glass and of the glass ceramic samples obtained.
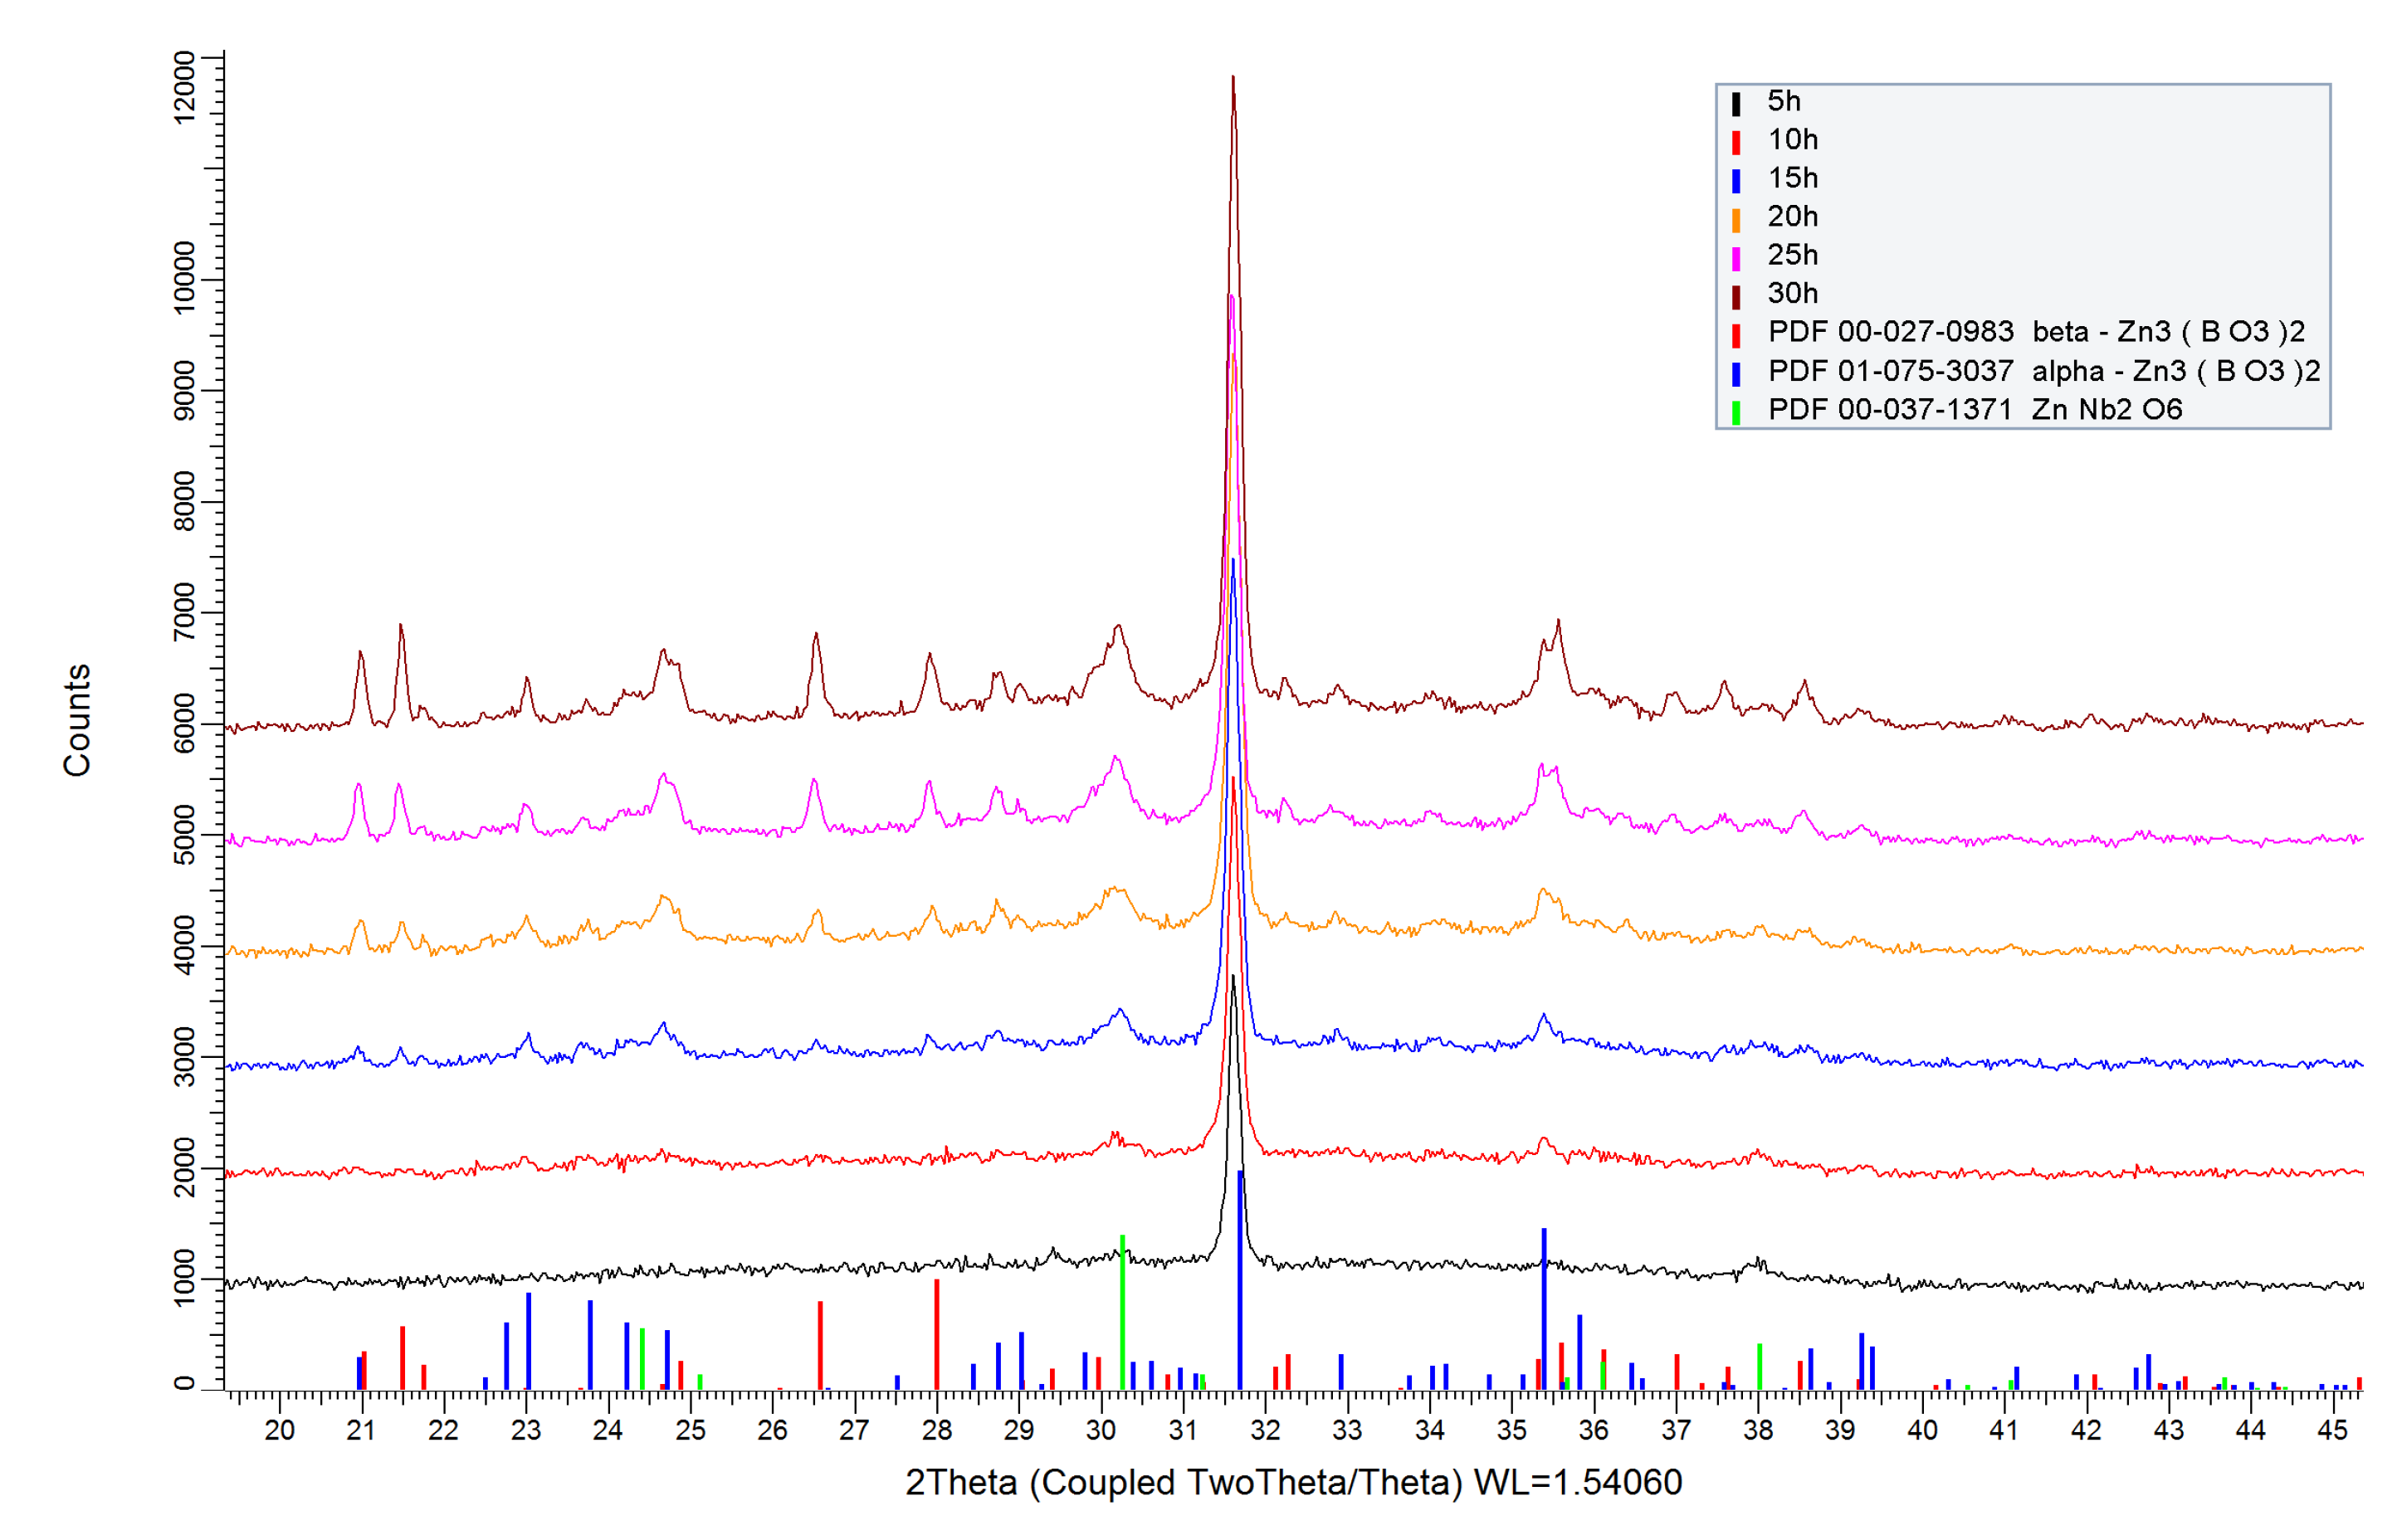
Figure 3.
Comparisons of: a) the ratio between obtained crystal phases in wt.% b) degree of crystallinity of glass-ceramic materials.
Figure 3.
Comparisons of: a) the ratio between obtained crystal phases in wt.% b) degree of crystallinity of glass-ceramic materials.
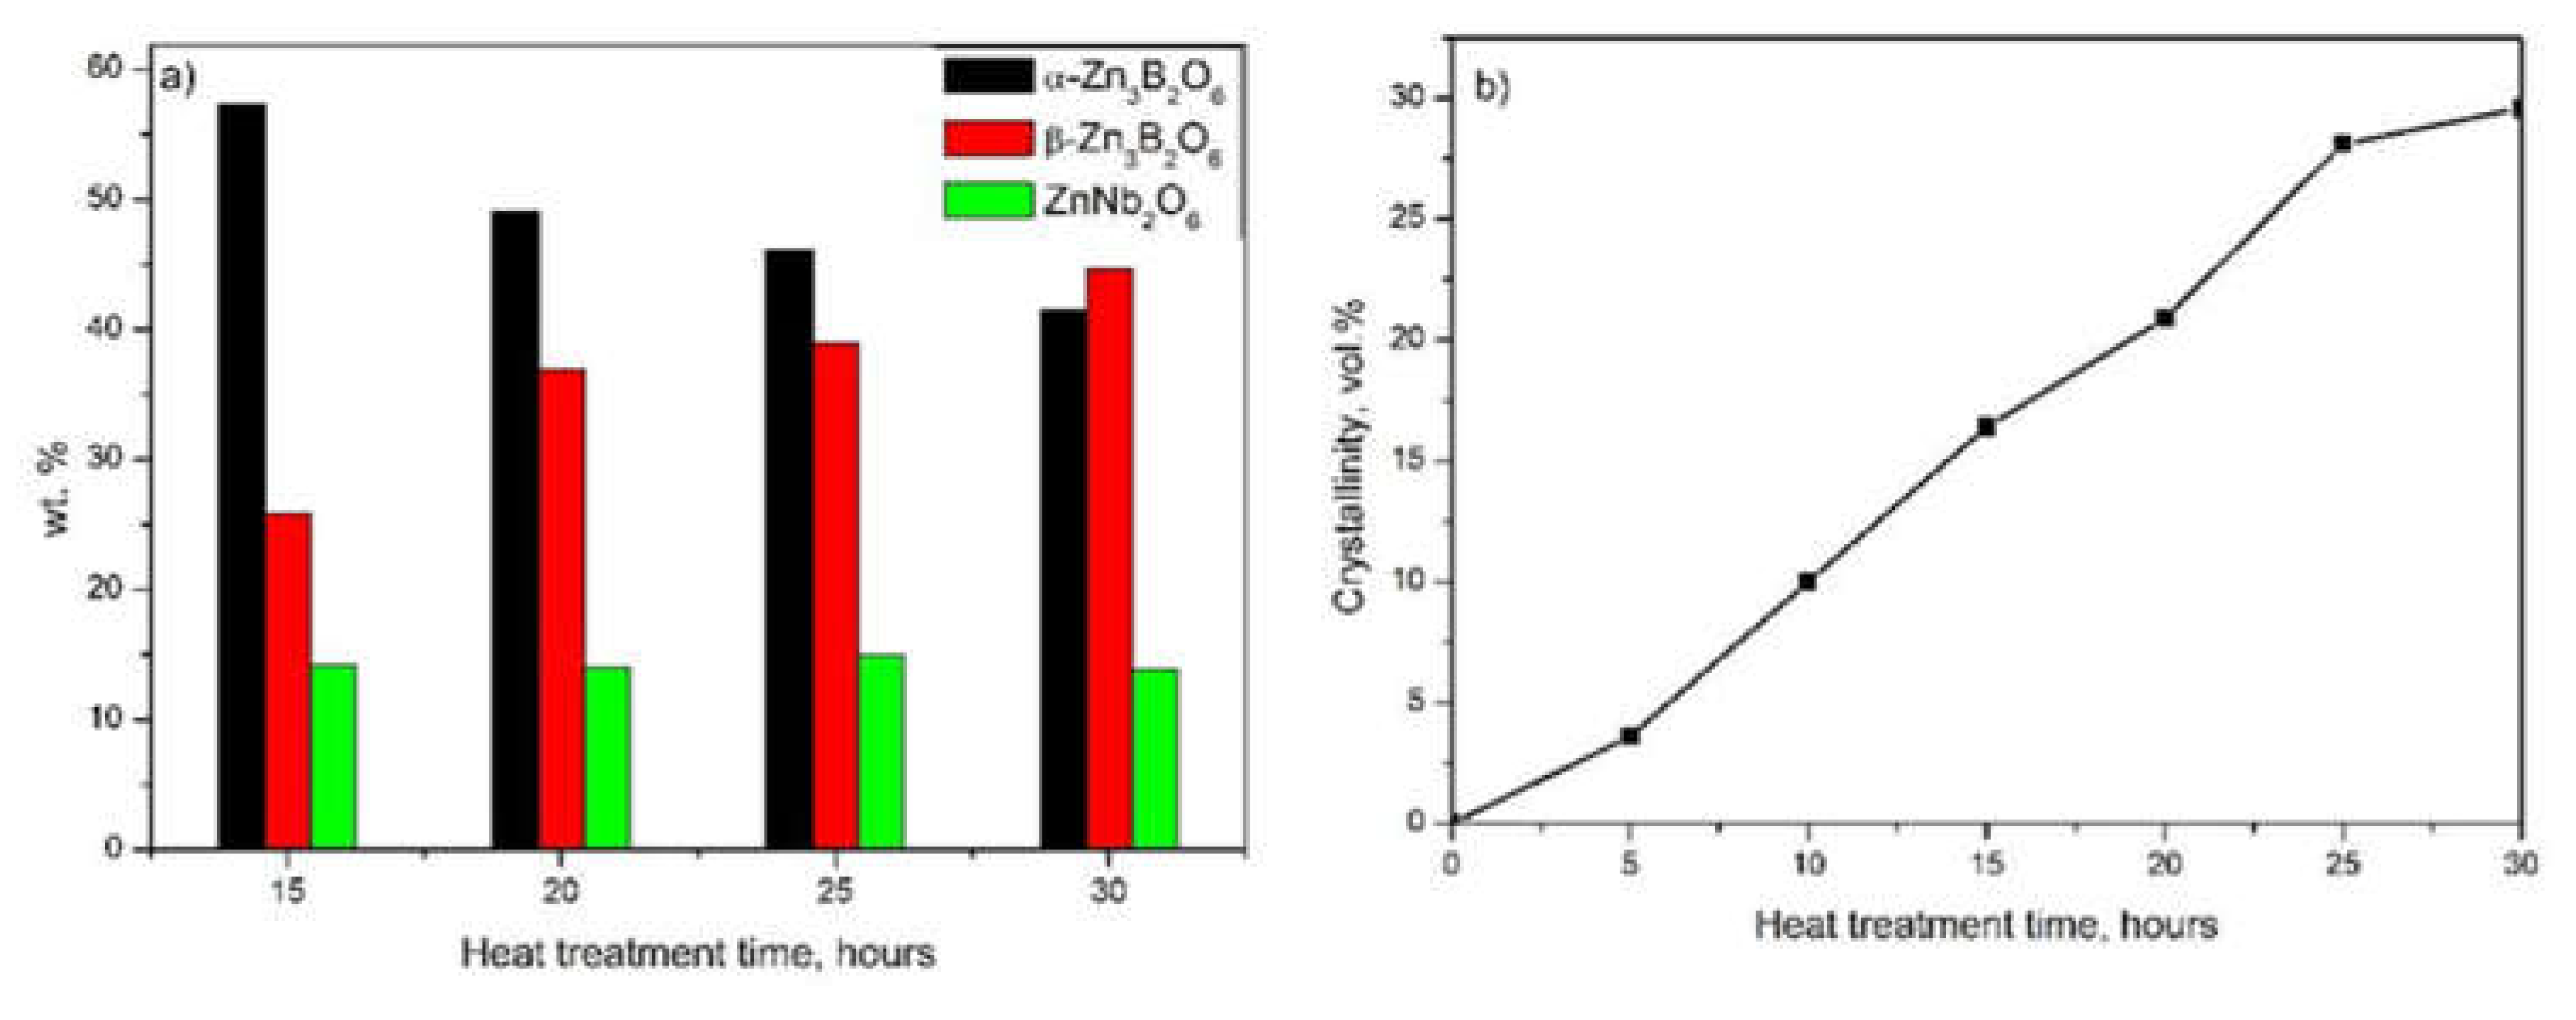
Figure 4.
The crystallites size of the crystalline phases obtained in the crystallized samples.
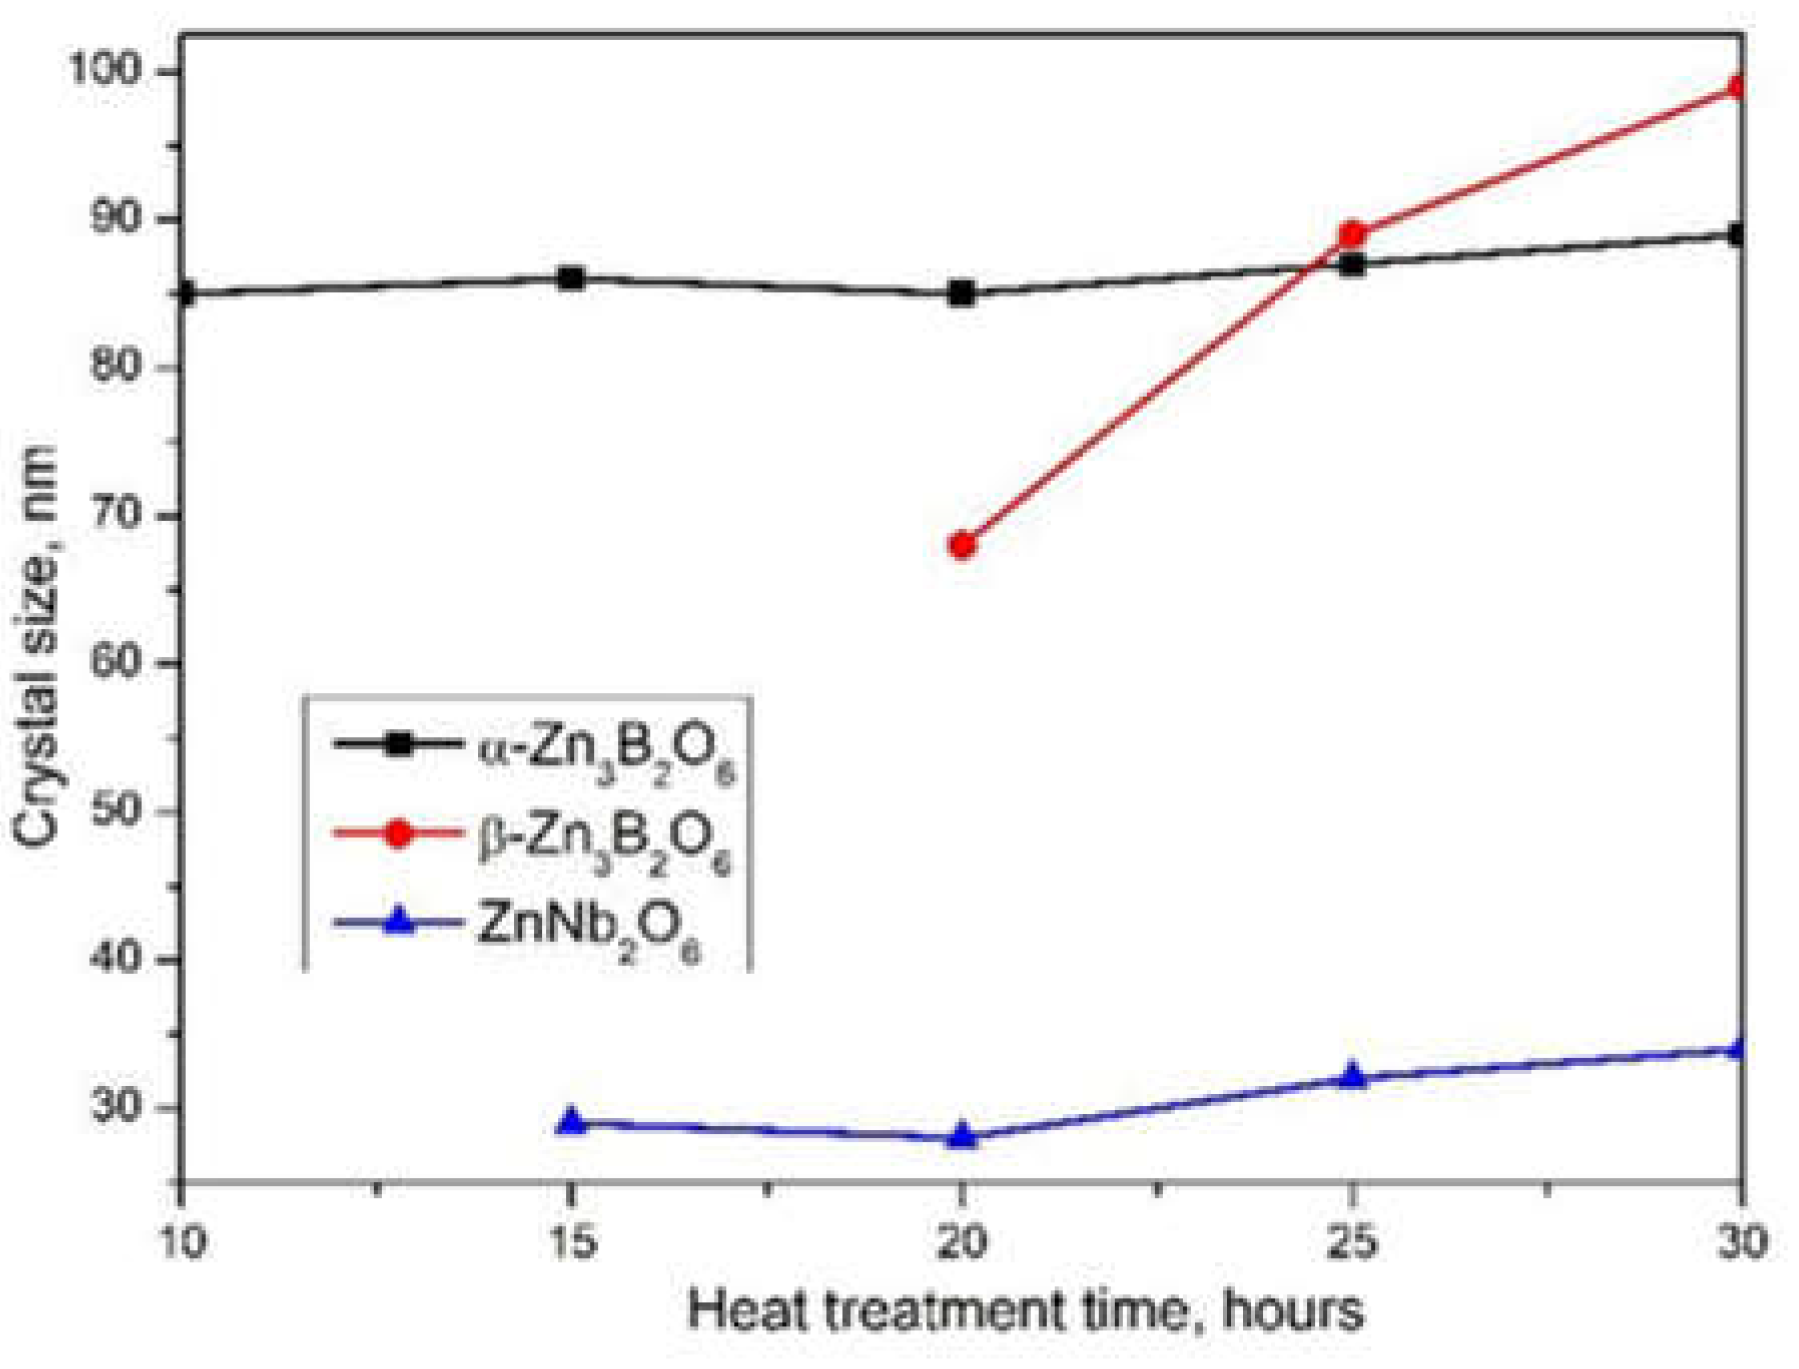
Figure 5.
Excitation spectra of 50ZnO:47B2O3:3Nb2O5:0.5Eu2O3 glass and the corresponding glass ceramics heat treated at different time durations.
Figure 5.
Excitation spectra of 50ZnO:47B2O3:3Nb2O5:0.5Eu2O3 glass and the corresponding glass ceramics heat treated at different time durations.
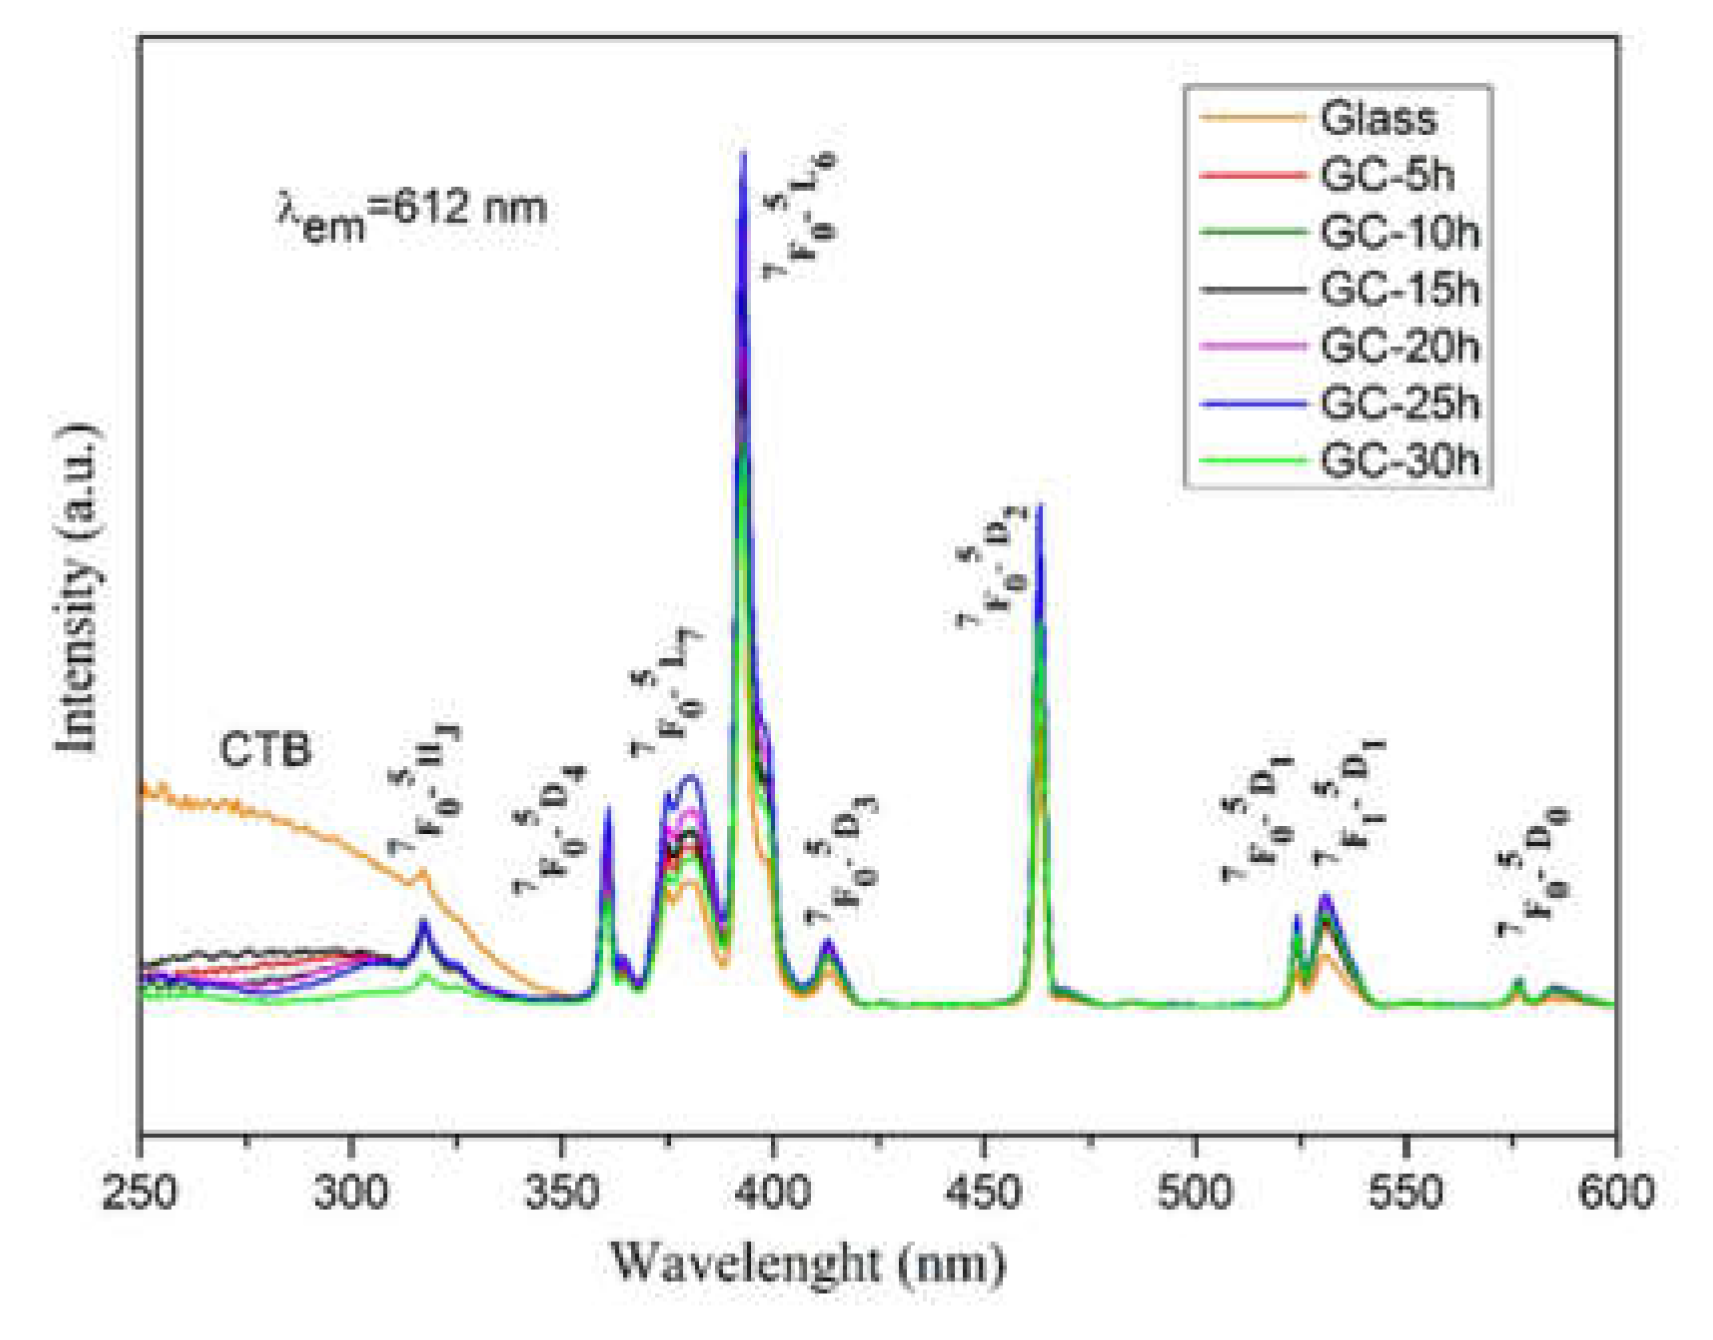
Figure 6.
Emission spectra of 50ZnO:47B2O3:3Nb2O5:0.5Eu2O3 glass and the corresponding glass ceramics heat treated at different time durations.
Figure 6.
Emission spectra of 50ZnO:47B2O3:3Nb2O5:0.5Eu2O3 glass and the corresponding glass ceramics heat treated at different time durations.
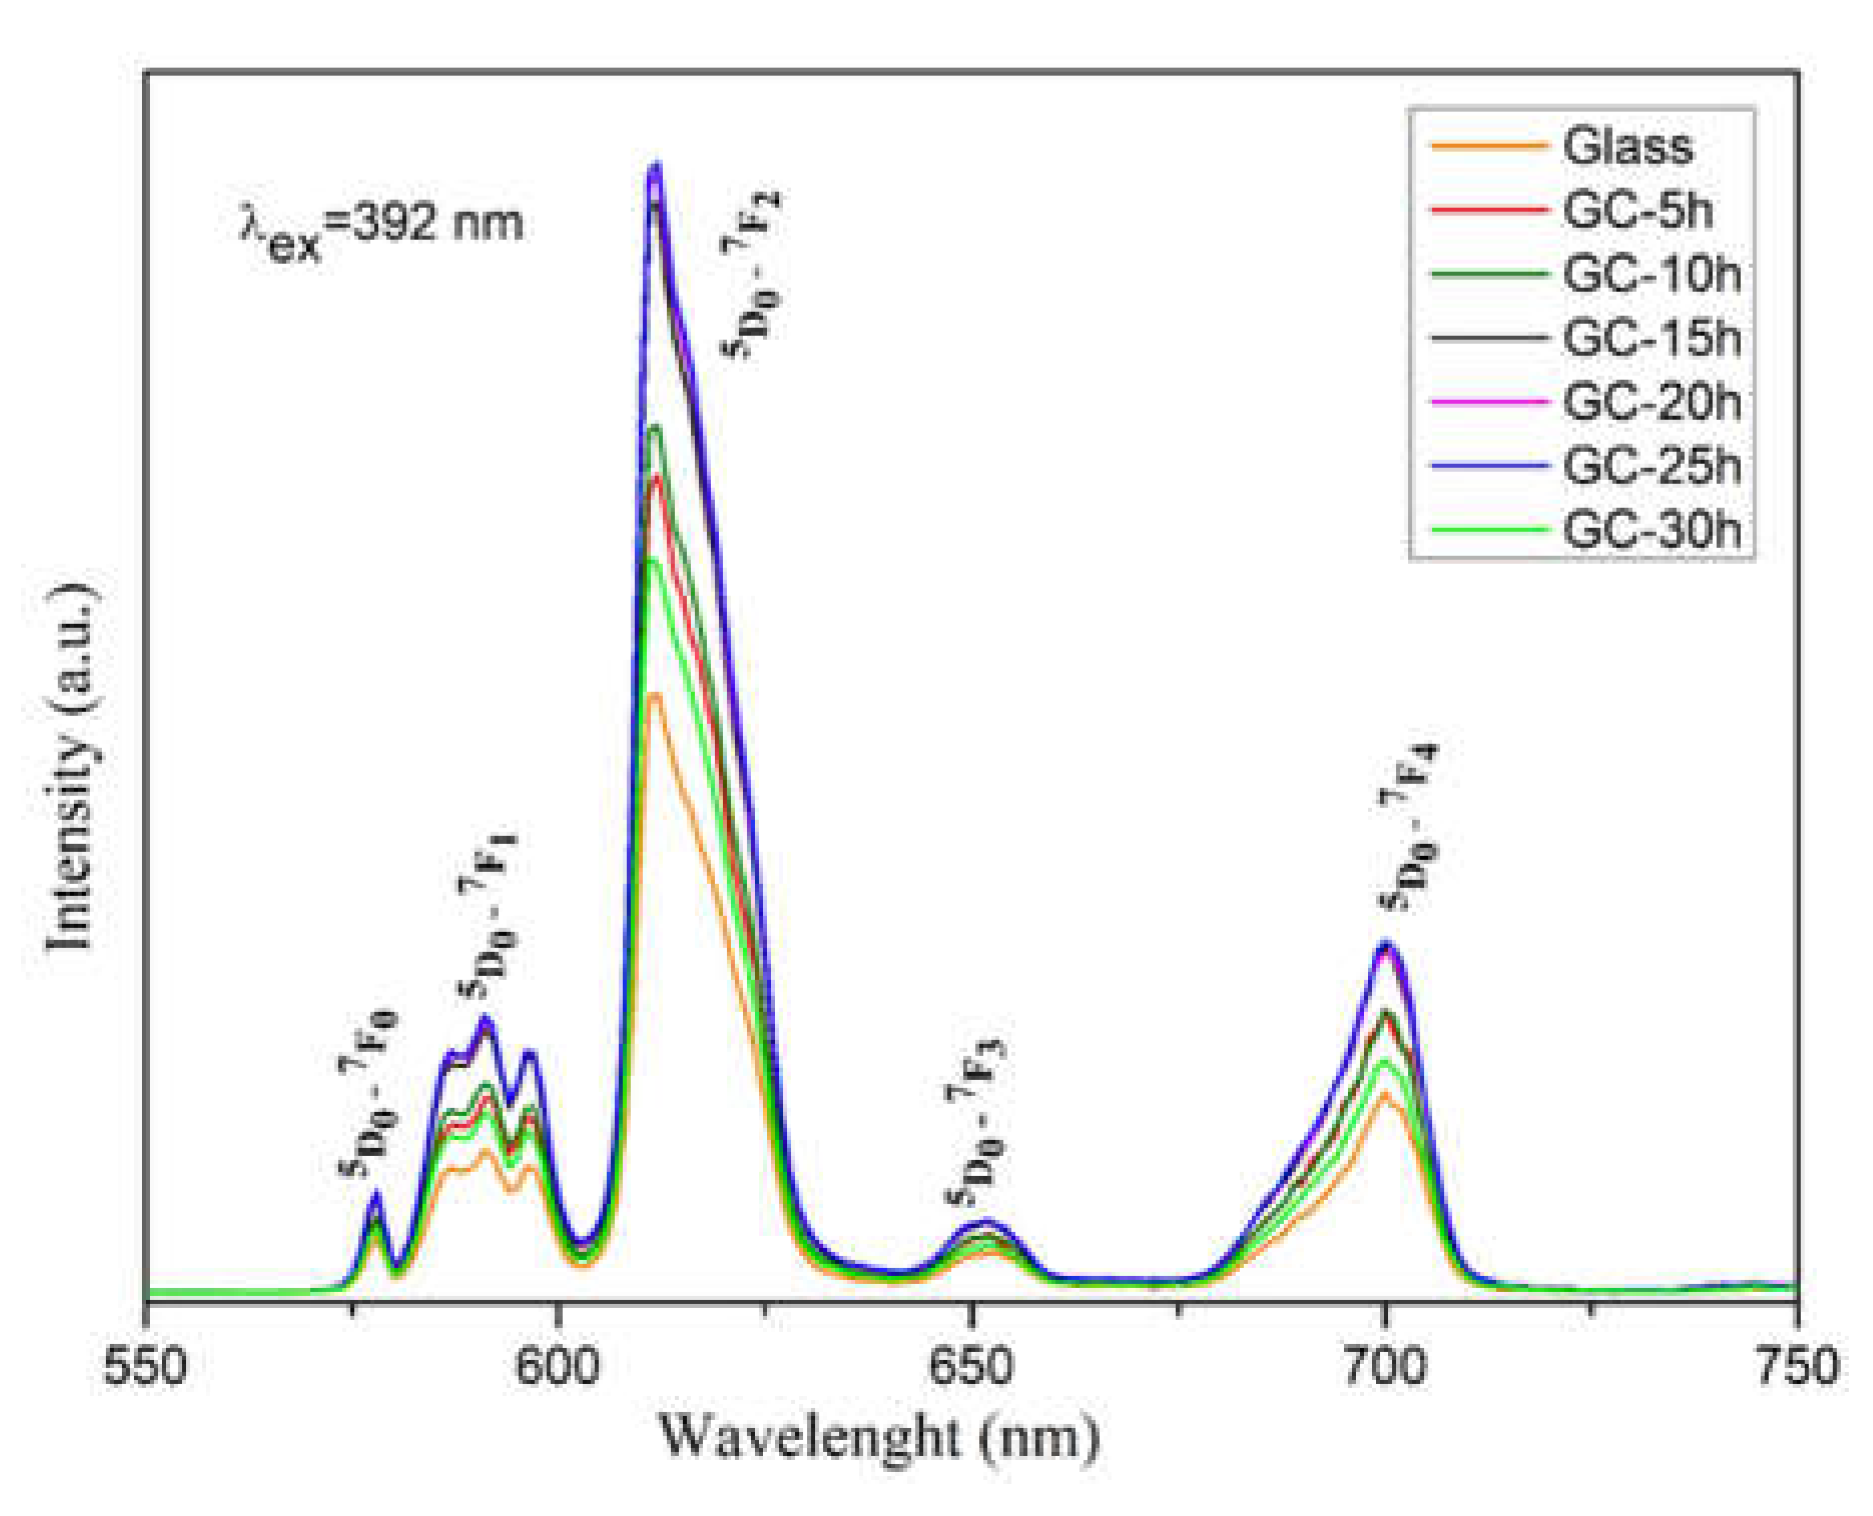
Figure 7.
CIE chromaticity diagram of 50ZnO:47B2O3:3Nb2O3:0.5Eu2O3 glass and the corresponding glass ceramic.
Figure 7.
CIE chromaticity diagram of 50ZnO:47B2O3:3Nb2O3:0.5Eu2O3 glass and the corresponding glass ceramic.
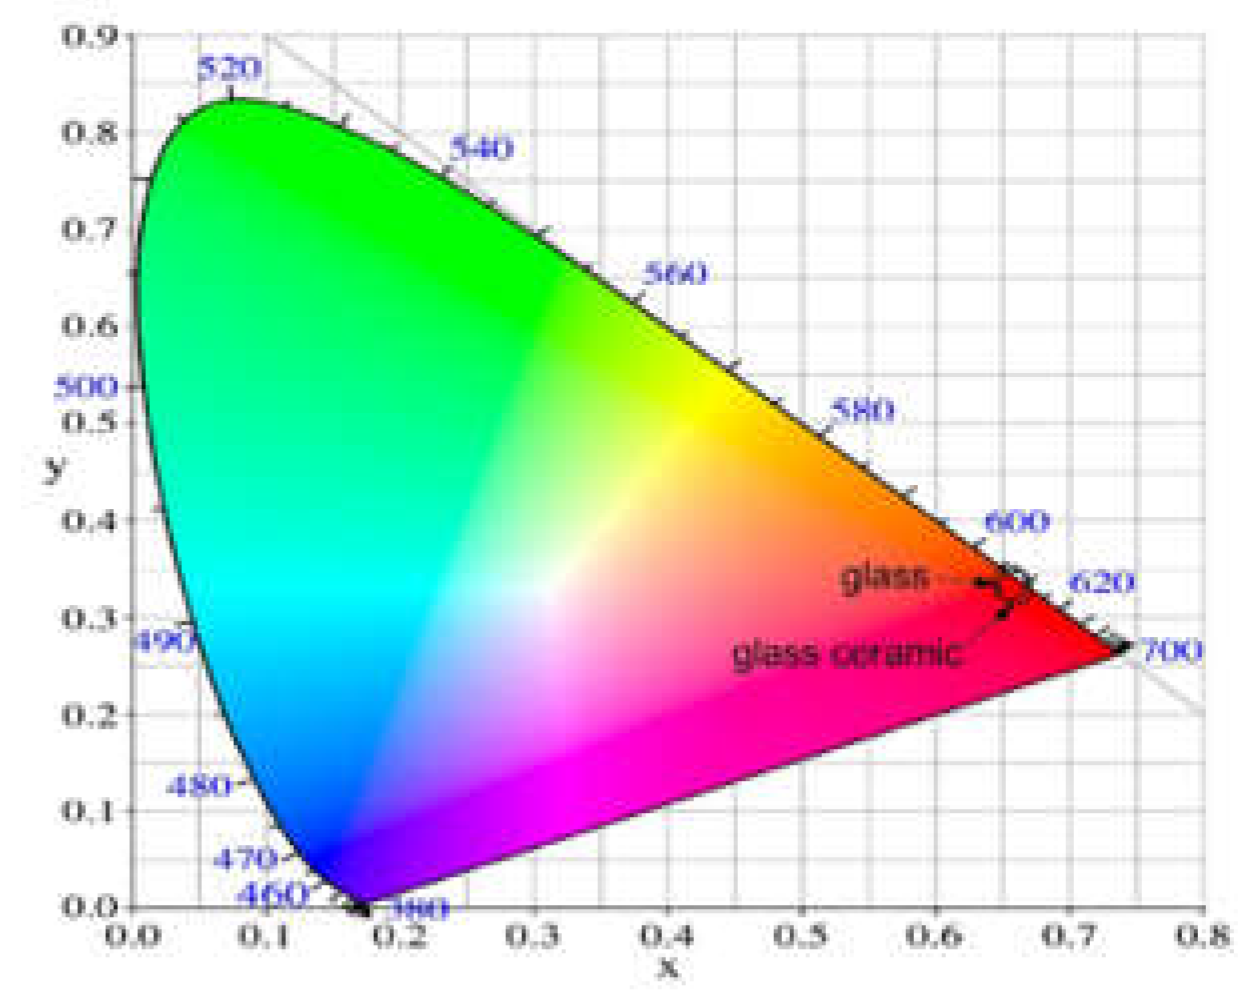
Figure 8.
Bright field micrograph and particle size distribution (inset).
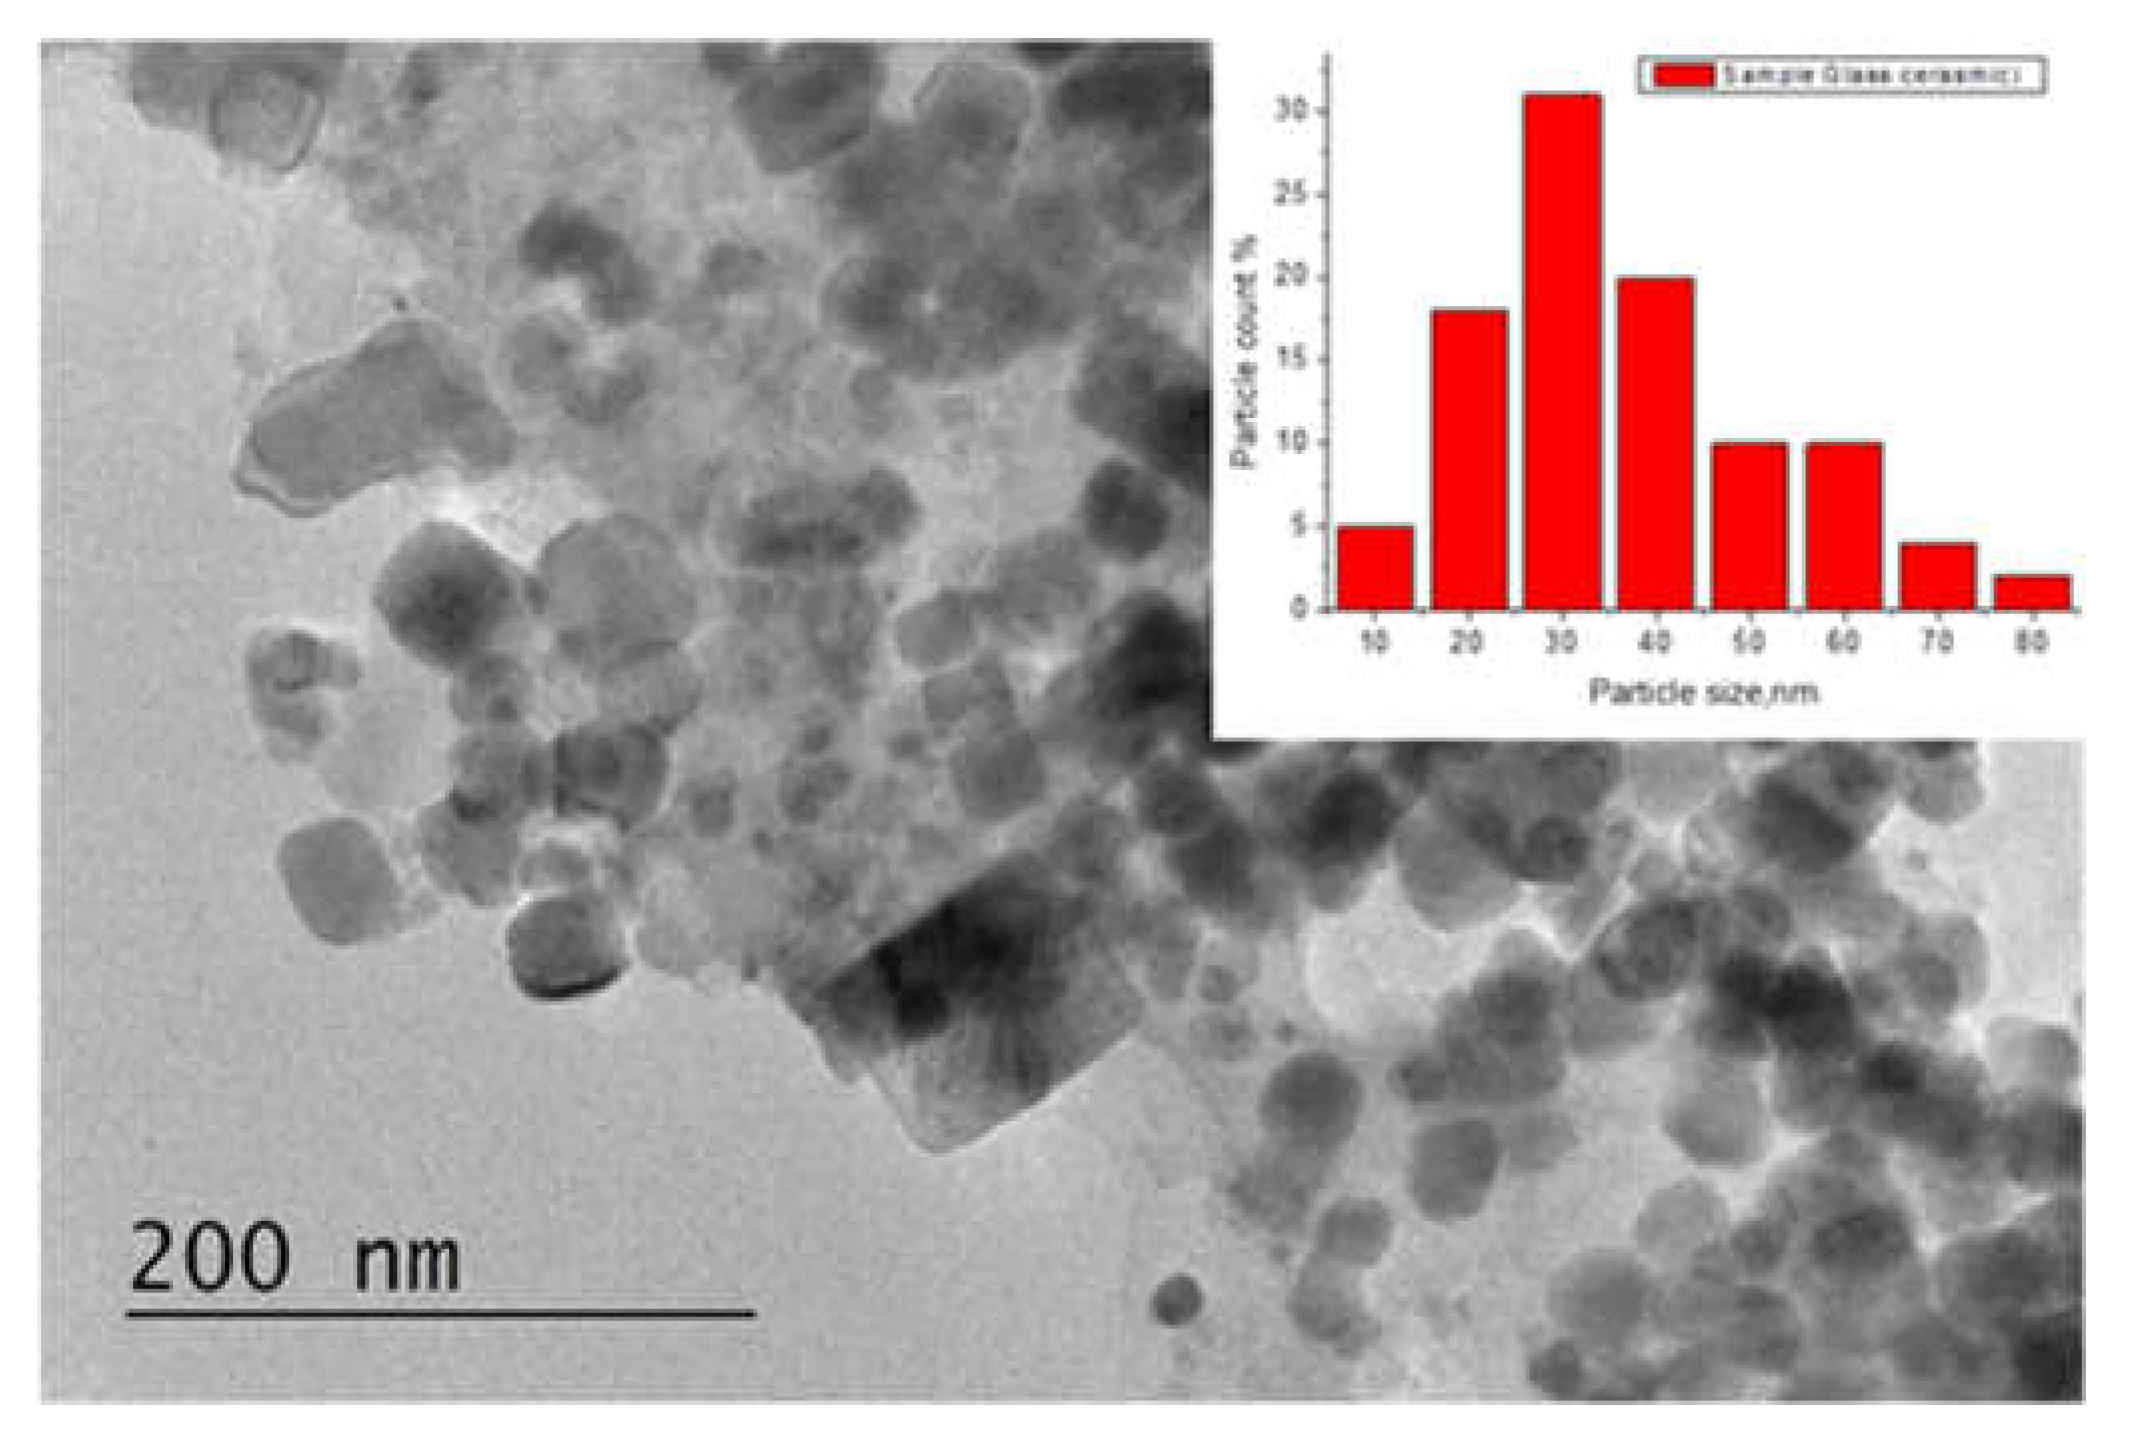
Figure 9.
HRTEM picture of glass ceramic obtained after 25 hours heat treatment of the parent glass.
Figure 9.
HRTEM picture of glass ceramic obtained after 25 hours heat treatment of the parent glass.
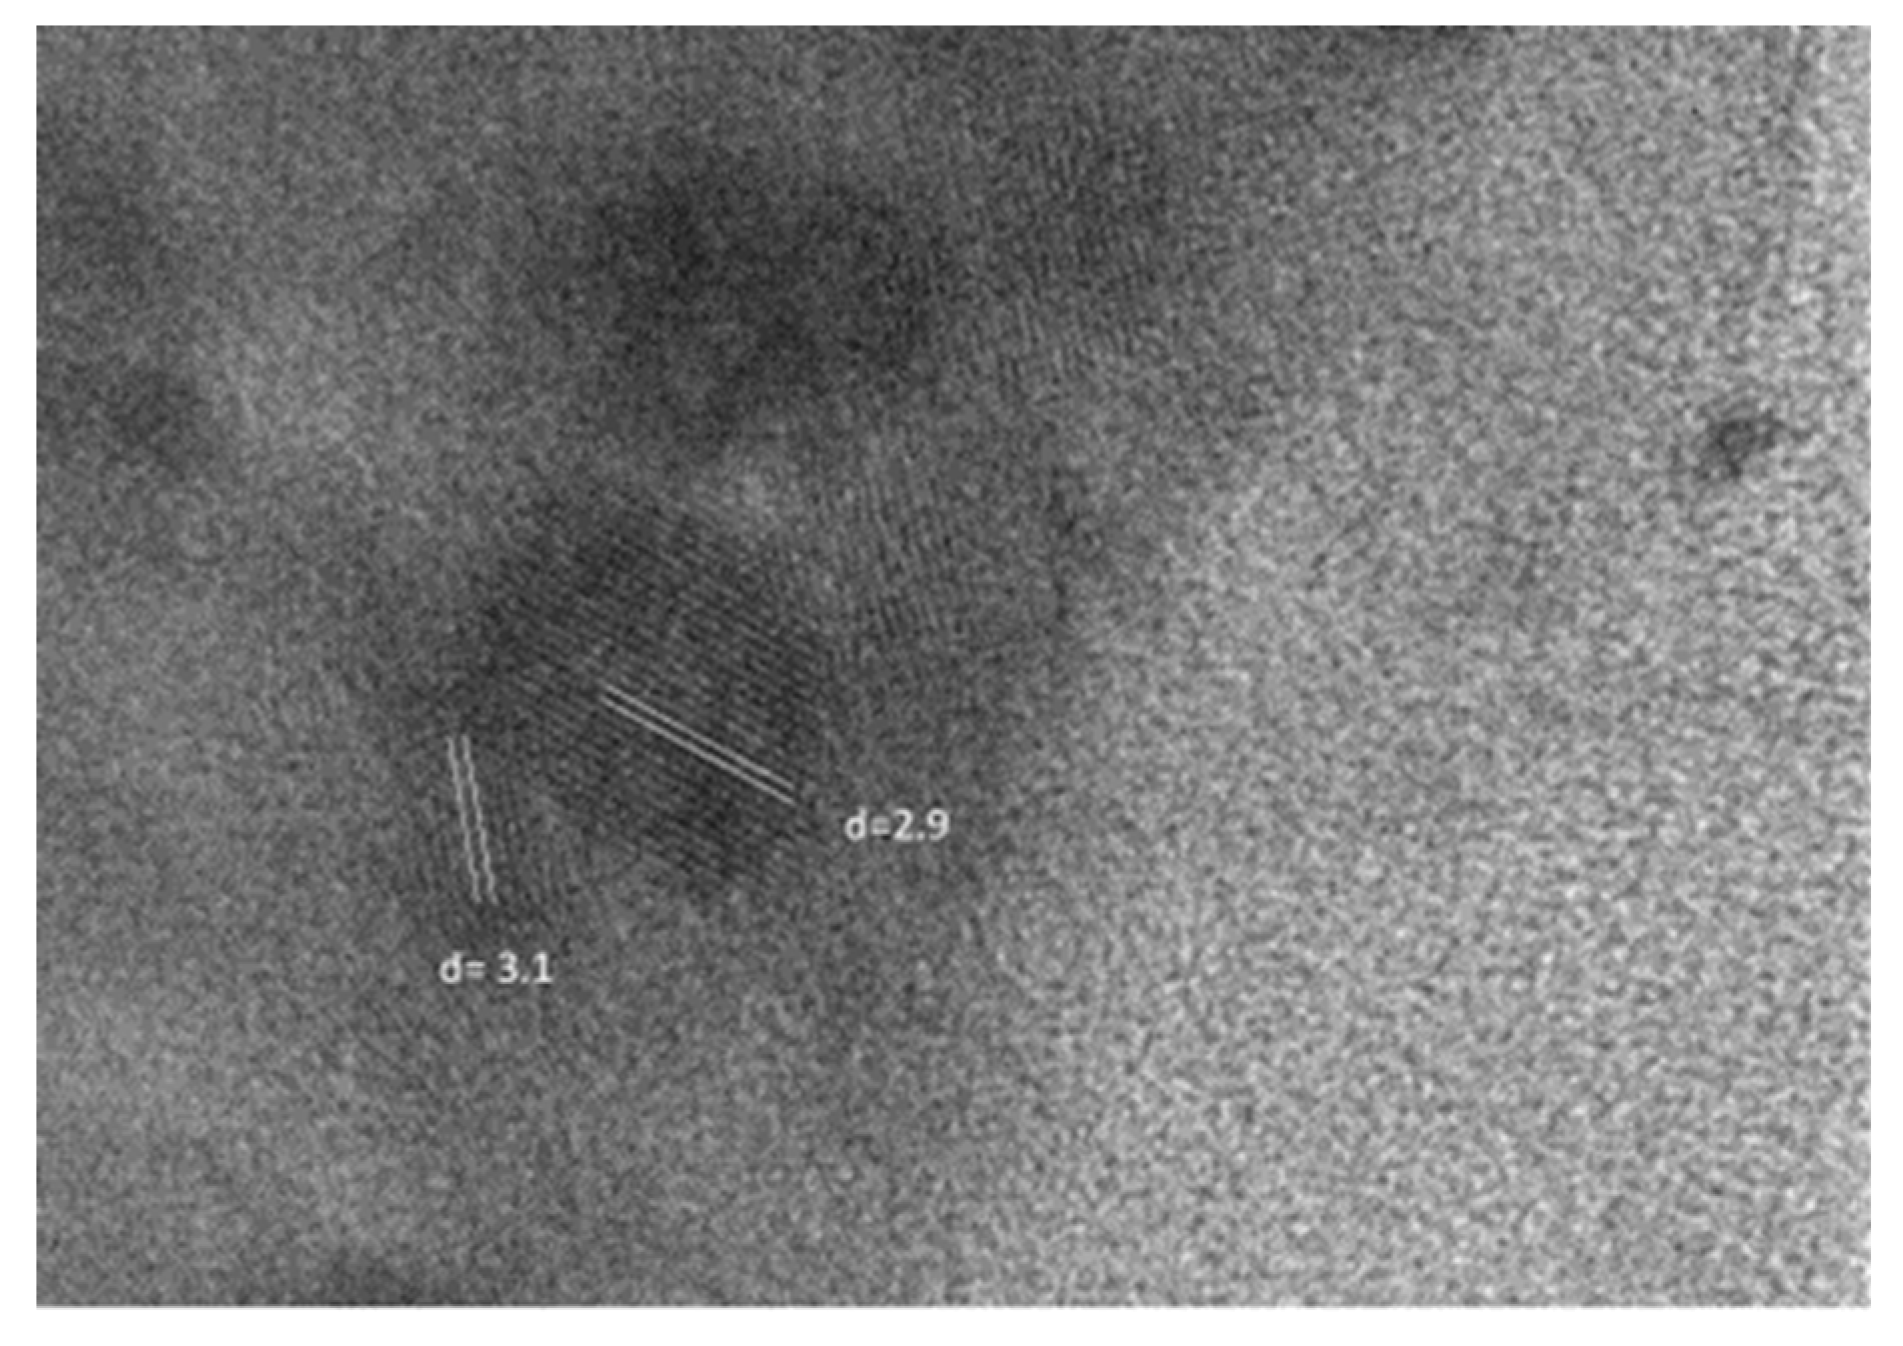

Table 1.
Calculated lattice parameter and unit cell volume for crystals resulted due to heat treatment of glass. The unit cell angles are intentionally omitted.
Table 1.
Calculated lattice parameter and unit cell volume for crystals resulted due to heat treatment of glass. The unit cell angles are intentionally omitted.
| Time | α-Zn3B2O6, a/b/c [Å], volume [Å3] |
β-Zn3B2O6 a/b/c [Å], volume [Å3] |
ZnNb2O6 a/b/c [Å], volume [Å3] |
| 30h | 6.311/8.267/10.035 500.9(2) | 23.885/5.047/8.385 985.0(3) | 14.219/5.706/5.066 411.0(4) |
| 25h | 6.312/8.265/10.035 500.8(2) | 23.885/5.048/8.383 985.1(4) | 14.212/5.708/5.067 411.0(4) |
| 20h | 6.310/8.264/10.031 500.5(3) | 23.873/5.048/8.379 984.1(7) | 14.216/5.701/5.067 410.7(6) |
| 15h | 6.302/8.255/10.023 499.0(4) | 23.833/5.039/8.365 978.7(7) | 14.189/5.692/5.063 408.9(6) |
| 10h | n.a. | n.a. | n.a. |
| 5h | n.a. | n.a. | n.a. |
Table 2.
Relative luminescent intensity ratio (R) of the two transitions (5D0 → 7F2 )/(5D0 → 7F1 ) for 50ZnO:47B2O3:3Nb2O3:0.5Eu2O3 glass and ceramics heat treated at different time durations and of other reported Eu3+-doped oxide glasses.
Table 2.
Relative luminescent intensity ratio (R) of the two transitions (5D0 → 7F2 )/(5D0 → 7F1 ) for 50ZnO:47B2O3:3Nb2O3:0.5Eu2O3 glass and ceramics heat treated at different time durations and of other reported Eu3+-doped oxide glasses.
| Glass composition | Relative Luminescent Intensity Ratio, R | Reference |
|---|---|---|
| Glass 50ZnO:47B2O3:3Nb2O3:0.5Eu2O3 | 5.16 | Current work+ [5] |
| GC-5h | 5.28 | Current work |
| GC-10h | 5.39 | Current work |
| GC-15h | 5.42 | Current work |
| GC-20h | 5.47 | Current work |
| GC-25h | 5.49 | Current work |
| GC-30h | 5.21 | Current work |
| Glass 50ZnO:(50-x)B2O3: xNb2O5:0.5Eu2O3:, x= 0, 1, 3 and 5 mol% | 4.31-5.16 | [5] |
| Glass 50ZnO:40B2O3:10WO3:xEu2O3 (0≤x≤10) | 4.54÷5.77 | [28] |
| Glass 50ZnO:40B2O3:5WO3:5Nb2O5:xEu2O3 (0≤x≤10) | 5.09÷5.76 | [20] |
| Glass 66P2O5– 10.5Al2O3–3.05BaO–16.5K2CO3–0.7NaF–xEu2O3–0.5Nd2O3–(2.75-x) La2O3 (mol.%), where x = 0, 0.25, 0.5, 0.75, 1.5 and 2 | 3.72 |
[29] |
| Glass ceramic 66P2O5– 10.5Al2O3–3.05BaO–16.5K2CO3–0.7NaF–xEu2O3–0.5Nd2O3–(2.75-x) La2O3 (mol.%), where x = 0, 0.25, 0.5, 0.75, 1.5 and 2 | 4.72 | |
| Glass 74.0 TeO2+25.0 Li2CO3+1.0 Eu2O3 | 3.70 | [30] |
| Glass ceramic 74.0 TeO2+25.0 Li2CO3+1.0 Eu2O3 | 3.65 | |
| Glass 50Li2O·45B2O3·5Al2O3: 2Eu2O3 | 3.91 | [31] |
| Glass ceramic 50Li2O·45B2O3·5Al2O3: 2Eu2O3 | 4.047 | |
| Glass 7SiO2-47.4CaO-40.5Al2O3-4.1MgO-1Eu2O3 | 4.58 | [32] |
| Glass ceramic 7SiO2-47.4CaO-40.5Al2O3-4.1MgO-1Eu2O3 | 1.97 |
Table 3.
CIE chromaticity coordinates and correlated color temperature (CCT, K) of 50ZnO:47B2O3:3Nb2O5:0.5Eu2O3 glass and the corresponding glass – ceramics.
Table 3.
CIE chromaticity coordinates and correlated color temperature (CCT, K) of 50ZnO:47B2O3:3Nb2O5:0.5Eu2O3 glass and the corresponding glass – ceramics.
| Glass composition | Chromaticity coordinates (x,y) |
CCT(K) |
| Glass 50ZnO:47B2O3:3Nb2O3:0.5Eu2O3 | 0.656, 0.343 | 2505.78 [5] |
| GC-5h | 0.652, 0.347 | 2350.82 |
| GC-10h | 0.652,0.348 | 2333.75 |
| GC-15h | 0.652, 0.348 | 2333.75 |
| GC-20h | 0.652,0.348 | 2333.75 |
| GC-25h | 0.652,0.348 | 2333.75 |
| GC-30h | 0.651,0.348 | 2324.60 |
| NTSC standard for red light | 0.670,0.330 | |
| Y2O2S:Eu3+ | 0.658, 0.340 |
Disclaimer/Publisher’s Note: The statements, opinions and data contained in all publications are solely those of the individual author(s) and contributor(s) and not of MDPI and/or the editor(s). MDPI and/or the editor(s) disclaim responsibility for any injury to people or property resulting from any ideas, methods, instructions or products referred to in the content. |
© 2024 by the authors. Licensee MDPI, Basel, Switzerland. This article is an open access article distributed under the terms and conditions of the Creative Commons Attribution (CC BY) license (http://creativecommons.org/licenses/by/4.0/).
Copyright: This open access article is published under a Creative Commons CC BY 4.0 license, which permit the free download, distribution, and reuse, provided that the author and preprint are cited in any reuse.


