
Submitted:
16 February 2024
Posted:
19 February 2024
You are already at the latest version
Abstract
In this study we have investigated the effect of the addition of Nb2O5 (up to 5 mol%) on the structure and luminescent properties of ZnO-B2O3 glass doped with 0.5 mol % Eu2O3 by using of infrared (IR), Raman and photoluminescence (PL) spectroscopy. Physical properties as molar volume, oxygen packing density and glass transition temperature were determined using the results of differential thermal analyisis (DTA) and Archimedes principle for density. IR and Raman spectra revealed that niobium ions incorporate into the base zinc borate glass as NbO4 trtraherda and NbO6 octahedra. A strong red emission from the 5D0 level of Eu3+ ions was registered under near UV (392 nm) excitation using the sharp 7F0 - 5L6 transition of Eu3+. The integrated fluorescence intensity ratio R (5D0 → 7F2/5D0 → 7F1) was calculated to estimate the degree of asymmetry around the active ion, suggesting a location of Eu3+ in non-centrosymmetric sites. The higher Еu3+ luminescence emission observed in zinc borate glasses containing 1÷5 mol% Nb2O5 compared to the Nb2O5-free zinc borate glass evidences that Nb2O5 is suitable component for modification of host glass structure and improving the emission intensity.
Keywords:
glass structure
; europium
; IR
; photoluminescence
; density
1. Introduction
Glasses accommodating rare-earth ions have been studied from years as luminescent materials in solid state lasers, photonic, opto-electronic devices like optical amplifiers, multicolor displays and detectors. Among them glasses containing trivalent europium ion have the subject of a great deal of interest due to its intense red emission [1,2,3,4,5]. In current years large emphasis has been given to the discovery of new glass compositions for exploitation as Eu3+ doped luminescent hosts, as the optical properties of the active rare-earth ions in glasses strongly depend on the glass matrix chemical composition [6]. Glasses containing Nb2O5 are suitable matrices for doping with active Eu3+ ions since Nb5+ ions can modify the environment around the rare earth ions due to their higher polarizability [7]. Also Nb2O5 possesses significant optical characteristics as low phonon energy, high refractive index (n = 2.4), NIR and visible transparency, that are directly related to the luminescence properties [8,9]. The optical properties and glass forming ability of Nb2O5-containing glasses are strongly related with the structural features of glasses and more particularly with the coordination state of Nb5+ ions and their way of bonding in the glass network which make, the structural role of Nb2O5 in various glass compositions also a subject of intensive research. IR and Raman spectroscopic studies indicate that the niobium present in the amorphous network in the form of octahedral NbO6 units or NbO4 tetrahedral groups with different degree of distortions and type of bonding (by corners and by edges) [10,11,12].
In this work we report for the preparation, structure and photoluminescence properties of glasses 50ZnO:(50-x)B2O3:0.5Eu2O3:xNb2O5, (x=0, 1, 3 and 5 mol %). The aim is to investigate the effect of the addition of Nb2O5 to the binary 50ZnO:50B2O3 glass, on the glass structure and photoluminescence properties of the active Eu3+ ions doped in this host glass matrix.
2. Materials and Methods
Glasses with the composition in mol% of 50ZnO:(50-x)B2O3:xNb2O5:0.5Eu2O3, (x=0, 1, 3 and 5 mol %) were prepared by melt quenching method using reagent grade ZnO, WO3, H3BO3 and Eu2O3 as starting compounds. The homogenized batches were melted at 1240°C for 30 min in a platinum crucible in air. The melts were cast into pre-heated graphite mold to get bulk samples. Then the glasses were transferred in a laboratory electric furnace annealed at 540oC (a temperature 10°C below the glass transition temperature) and were cooldown to room temperature at a very slow cooling rate of about 0.5°C/min in order to remove the thermal stresses. The amorphous state of the samples was confirmed by x-ray diffraction analysis (XRD) with a Bruker D8 Advance diffractometer, using Cu Kα radiation in the 10 < 2Ө < 60 range. The glass transition temperature (Tg) of the synthesized glasses was determined by differential thermal analysis (DTA) using а Setaram Labsys Evo 1600 apparatus, France at a heating rate of 10 K/min in air atmosphere. The density of the obtained glasses at room temperature was estimated by Archimedes principle using toluene (ρ = 0.867 g/cm3) as an immersion liquid on a Mettler Toledo electronic balance of sensitivity 10-4 g. From the experimentally evaluated density values the molar volume (Vm), the molar volume of oxygen (Vo) (volume of glass in which 1 mol of oxygen is contained) and the oxygen packing density (OPD) of glasses obtained were estimated, using the following relations respectively:
where xi is the molar fraction of each component i, Mi the molecular weight, ρg the glass density and ni is the number of oxygen atoms in each oxide, C is the number of oxygen per formula units, and M is the total molecular weight of the glass compositions. Optical transmission spectra at room temperature for the glasses were measured by spectrometer (Ocean optics, HR 4000) using a UV LED light sources at 385 nm. Photoluminescence (PL) excitation and emission spectra at room temperature for all glasses were measured with Spectrofluorometer FluoroLog3-22, Horiba JobinYvon. The IR spectra of the obtained samples were measured using the KBr pellet technique on a Nicolet-320 FTIR spectrometer with a resolution of ± 4 cm−1, by collecting 64 scans in the range 1600–400 cm−1. A random error in the center of IR bands was found as ± 3 cm−1. Raman spectra were recorded at the Raman spectrometer: Delta NU, Advantage NIR 785 nm.
3. Results
3.1. XRD spectra and thermal analysis
The measured X-ray diffraction patterns are shown in Figure 1 and confirm the amorphous nature of the prepared materials. The photographic images (insets, Figure 1) show that transparent bulk glass specimens are obtained. The Eu3+ doped Nb2O5-free base zinc borate glass is colorless, while the glass samples having Nb2O5 are light yellowish due to the present of Nb5+ ions. [13].
The DTA data of investigated glasses are presented on Figure 2. The all curves contain an exothermic peaks over 500◦C corresponding to the glass transition temperature, Tg and an absence of glass crystallization effects. However, the Tg values of Nb2O5 containing glasses are slightly lower as compared with the Eu3+ doped Nb2O5-free base zinc borate glass due to the formation of weaker Nb-O bonds at the expense of stronger B-O bonds.
3.2. Raman analysis
Both IR and Raman spectroscopy techniques were used to study the effect of Nb2O5 addition on the structure of glass 50ZnO:50B2O3:0.5Eu2O3 The Raman spectra of the 50ZnO:(50-x)B2O3:xNb2O5:0.5Eu2O3, (x=0, 1, 3 and 5 mol %) glasses are shown on Figure 3.
The spectrum of Nb2O5-free glass, (Figure 3, spectrum x = 0) agreed well with what has been reported by other authors for similar compositions (14–16). The most prominent band at 877 cm-1 in the base binary glass x = 0 is assigned to the symmetric stretching of pyroborate dimmers, [B2O5]4- [14,15,16]. The two shoulders at 800 cm-1 and at 770 cm-1 observed are due to the ring breathing of the boroxol rings and of the six-membered borate rings with one BO4 tetrahedron (tri-, tetra- and pentaborate rings) respectively [14]. The broad shoulder at about 705 cm-1 contains contributions of at least 4 borate arrangements as: metaborate chains [BØ2O-]n (deformation modes; Ø=bridging oxygen, O-=nonbridging oxygen), in-plain and out of plain bending modes of both polymerized (BØ0) species and isolated orthoborate units (BO3)3-, and bending of the B-O-B connection in the pyroborate dimmers,[B2O5]4- [14,15,16]. The weak lower frequency features at 270, 300 and 430 cm-1 are related with the Zn-O vibrations, Eu-O vibrations and borate network deformation modes, respectively [14,17]. The higher frequency activity at 1235 cm-1 reflects the stretching of boron-non-bridging oxygen bonds, ν(B-O-) of the pyroborate dimers, while the other two features at 1365 and 1420 cm-1 are due to the B-O- stretching in metaborate triangular units BØ2O- [14]. The addition of Nb2O5 to the 50ZnO:50B2O3:0.5Eu2O3 glass leads to the increase in the intensity of the bands at 705, 800 and 877 cm-1. Moreover, the shoulder at 800 cm-1 observed in the x = 0 glass spectrum become a peak in the Raman spectrum of glass having 1 mol% Nb2O5 (Figure 3 spectrum x = 1). With future increase in Nb2O5 content (Figure 3. spectrum x = 3 and x= 5) the peak at 800 cm-1 again turns into a shoulder. According to the Raman spectral data for the other niobium containing glasses and crystalline compounds, the niobium can be present in the amorphous networks and in the crystalline structures in the form of NbO4 tetrahedral and octahedral NbO6 units with different degree of polyhedral distortion and different kinds of connection (by corners or edges) [10,18]. Slightly and highly distorted octahedral give rise to intensive bands in the regions 500-700 cm-1 and 850-1000 cm-1, respectively [10,18,19]. The vibration frequencies of NbO4 tethahedra that have been observed only in a few niobate crystals (LnNbO4, Ln = Y, Yb, La, Sm) and their melts containing NbO4 ions, occurred in the range 790-830 cm-1 [10,18,19,20]. In the 800-850 cm-1 range stretching vibrations of Nb-O-Nb bonding in chain of corner shared NbO6 are also reported [10,21]. On this base, the increased intensity of the bands in the intermediate spectral range 600-1000 cm-1 observed in the spectra of Nb2O5 containing glasses compared to the Nb2O5- free is because of the overlapping contribution of the vibrational modes of niobate and borate structural groups present in the glass networks. The band at 800 cm-1 observed in the x = 1 glass is due to the coupled mode including the ring breathing of the boroxol rings, the symmetric stretching ν1 mode of tetrahedral NbO4 groups, and vibrations of Nb-O-Nb bonding [10,18]. Because of the complex character of this band, its transformation into a shoulder in the spectra of glasses x = 3 and x = 5 having higher Nb2O5 content is difficult to explain. However, the slight increase of the intensity of the low frequency band at 430 cm-1 due to the bending (δ) vibrations of the NbO6 octahedra shows that with the increasing Nb2O5 concentration, NbO4 →NbO6 transformation take place [22]. In addition, the reduced intensity of the band at 800 cm-1 observed in the glasses x = 3 and x = 5 also suggests decreasing number of NbO4 tetrahedra. This assumption is confirmed also by the variations in the physical parameters established which will be discussed in the next paragraph of the paper. Stretching vibration ν1 of terminal Nb-O (short or non-bridging) bonds from NbO6 octahedras or short Nb-O bonds forming part of Nb-O-B bridges contribute to the band at 877 cm-1 [11]. The broad Raman shoulder at 705 cm-1 is attributed to the vibration of less distorted NbO6 octahedra with no non-bridging oxygens, which overlap with the out-of-plane bending of triangular borate groups [10,14,15,16,18,23]. The nature of borate units also change with the addition of Nb2O5 into the base x = 0 glass, manifested by the disappearance of the shoulder at 770 cm-1 due to the ring breathing of the six-membered borate rings with one BO4 tetrahedron (tri-, tetra- and pentaborate rings) together with the increased intensity of the band over 1200 cm-1 due to the vibration of trigonal borate units containing non-bridging oxygens. These spectral changes suggest that niobium oxygen polyhedra enter into the base zinc borate glass network by destruction of the superstructural borate units and favor formation of pyroborate, [B2O5]4- (band at 1235 cm-1) and metaborate BØ2O- groups (bands at 1365 and at 1420 cm-1) which are charge balanced by niobium.
3.3. IR analysis
Information for the structure of the present glasses was obtained also by using IR spectroscopy. The normalized IR spectra of the glasses 50ZnO:(50-x)B2O3:xNb2O5:0.5Eu2O3, (x=0, 1, 3 and 5 mol %) are depicted in Figure 4. All glass spectra are characterized with a stronger absorption in the 1600 - 1150 cm-1 range, a wide spectral contour in the region 1150 – 750 cm-1 and strong bands in the 750 - 500 cm-1 range. IR spectra of Nb2O5 containing glasses (Fig. x= 1, x=3, x=5) exhibit also a band at 470 cm-1, reaching the highest intensity in the x= 3 glass spectrum. The stronger absorption in the 1600 - 1150 cm-1 range is connected with the stretching vibration of the B-O bonds in the trigonal borate units [24]. The IR activity in the spectral range 1150-750 cm-1 arises from the vibrations of B-O bonds in [BØ4]- species, the vibrations of Nb-O-Nb bonding in chains of corner shared NbO6 groups, and Nb-O short bonds vibrations in highly distorted NbO6 octahedra and NbO4 tetrahedra [10,14,22,25]. The strong bands in the 750 - 500 cm-1 range are connected with the bending modes of trigonal borate entities which overlaps with the ν3 asymmetric stretching vibrations of corner-shared NbO6 groups [10,22,25]. The low frequency band at 470 cm-1, visible in the spectra of glasses containing Nb2O5 (x = 1, x = 3 and x = 5) can be related with the NbO6 stretching modes, having in mind the data in ref. 22 for Eu3+ doped crystalline rare earth niobate Gd3NbO7. The structure of this compound consists of GdO8 units forming infinite chains along the [001] direction alternately with the NbO6 units and its IR spectrum containing the strong band at 483 cm-1 due to the stretching (ν) vibrations of NbO6 octahedra [22].
Taking into account this and as well as the Raman data above, for increasing number of NbO6 octahedra as a result of NbO4→NbO6 conversion upon Nb2O5 content, it could be suggested the highest intensity of this band observed in the x= 3 glass spectrum evidences the higher number of NbO6 octahedra in the vicinity of Eu3+ ions in its glass network. From the analysis of the IR spectra obtained above it is seen that various borate and niobate structural units co-exist in the structure of the investigated glasses and their vibrational modes are strongly overlapped. That is why a deconvolution process of the IR glass spectra was performed to make a more precise assignment of the peaks observed. The observed absorption bands in the deconvoluted spectra of the investigated glasses (Figure 5) can be interpreted having in mind the band assignments proposed by Topper et al in ref. [14] for xZnO-(1-x)B2O3 glasses just above the metaborate stoichiometry and as well as taking into account our previous spectral investigation on 50ZnO:40B2O3:10WO3:xEu2O3 (0≤x≤10) and (50-x)WO3:25La2O5:25B2O3:xNb2O5(0≤x≤20) glasses reported in refs. [10,17].
The low frequency range 750-400 cm-1 in the x = 0 glass is fitted with three bands 1 - 3 at 566 cm-1, 646 cm-1 and 700 cm-1 respectively which arise from the bending modes of various trigonal borate entities [14,17]. The wide spectral contour in the region 750-1150 cm-1 is deconvoluted into four peaks 4-7 at 841 cm-1, 936 cm-1, 1025 cm-1 and 1105 cm-1 respectively related with the B-O stretching modes of borate tetrahedral units [BØ4]- from ring-type superstructures that contain one or two tehtrahedral boron sites and as well to asymmetric stretching of tetrahedral metaborate groups, νas[BØ4]- [14]. The broad band in the region 1150 - 1600 cm-1 is well fitted with five peaks. The most intense band 8 at 1236 cm-1 is attributed mainly to the stretching vibration of BØ3 triangles involved in various ring types superstructural borate groups (boroxol rings, tri-, tetra- and pentaborates) [14,17]. This band can be also associated with the BO3 stretching vibration in meta-, pyro- and orthoborate units [14]. The band 9 at 1313 cm-1 is ascribed to the B-O- stretch in pyroborate units, [B2O5]4- [24]. The two bands 10, 11 at 1387 and 1472 cm-1 respectively are due to the stretching vibration of non-bridging B-O– bonds in metaborate units, BØ2O- [10,14], while the band 12 at 1535 cm-1 originates from the stretching of B-Ø bonds in neutral BØ3 triangles [24]. The Zn2+ ions are mainly located in the tetrahedral coordination in borate glasses with characteristic Zn2+ motion band below 400 cm-1, (225 cm-1) that is outside of the limit of our apparatus [15].
The addition of Nb2O5 in the 50ZnO:50B2O3 glass doped with 0.5 mol % Eu2O3 produces some changes in the IR spectrum. More precise after the deconvolution of the x = 1, x = 3 and x = 5 glass spectra shown in Figure 5 several new bands have appeared related with the vibrations of niobate structural units. These are: band 13 at 480 cm-1, due to the stretching vibrations of NbO6 [22,26]; band 14 at 670-680 cm-1 related with the ν3 asymmetric stretching vibrations of corner-shared NbO6 groups; band 15 at 825 cm-1 ascribed to the vibrations of Nb-O-Nb bonding in chains of corner shared NbO6; band 16 at 876 cm-1 which is interpreted as ν1 symmetric mode of short Nb-O bonds in both distorted NbO6 and in NbO4 groups [10]; band 19 at 628-629 cm-1 in the spectra of glasses x = 3 and x = 5 and band 21 at 692 cm-1 in the deconvoluted spectrum of glass x= 5 due to the ν3 asymmetric stretching vibrations of corner-shared NbO6 groups [10,25]. These additional bands arise from the splitting of the ν3 bands as a result of the lowering the symmetry of NbO6 units [25]. On the other hand, as the IR spectrum of Eu3+ doped Gd3NbO7 is characterized with a strong band at 627 cm-1 due to stretching vibration of NbO6, the intenisive band 19 at 628-629 cm-1 observed in the spectra of glasses x=3 and x=5 evidences the presence of Eu3+ ions located around the niobate octahedra (Nb-O-Eu bonding)[22]. In the x = 3 glass spectrum the band 13 at 480 cm-1 (ν of NbO6 in the vicinity of Eu3+) and as well as the band at 629 cm-1 possess higher relative area, indicating the highest number of NbO6 octahedra surrounding rare earth ions in this glass compositions (i. e. the highest number of Nb-O-Eu linkadges).
The other changes in in the deconvoluted spectra of Nb2O5 containing glasses, x = 1, x = 3 and x= 5 are connected with the modification of the borate oxygen network due the introduction of niobium to the binary base glass x = 0. The most obvious effects are the reduction of the numbers of the [BØ4]- bands in the region 750-1150 cm-1 together with the strong decrease of the relative area of the band number 8 at 1236 cm-1, due mainly to the stretching vibration of BØ3 triangles involved in various ring types superstructural borate groups. At the same time new bands 17 at 1199 cm-1-1180 cm-1; and 18 at 1276-1258 cm-1 appear. The higher frequency bands at 1387 cm-1 and at 1472 cm-1 characteristic of the B-O- stretching in the metaborate entities, BØ2O- observed in the spectrum of glass x= 0 strengthen and red shift to 1370 and 1459 cm-1 in the spectrum of glass x = 1, while in the x = 3 glass spectrum the relative area of these band strongly decreases and their peak positions shifts to the higher frequencies (1398 cm-1 and 1462 cm-1). The decreased number of the bands due to the [BØ4]- tethahedra, and the strong reduction of the band 8 at 1236 cm-1 (B-O-B bridges connecting superstructural groups through three – fold coordinated boron centers) are in agreement with the conclusions of the Raman analysis above and corresponds to the destructions of borate superstructural units containing tetrahedral groups, and increasing of the number of the BO3 containing entities. The new strong bands 17 at 1199 cm-1-1179 cm-1 and 18 at 1283 -1258 cm-1 signals for the formation of pyro- and ortoborate groups in the network of Nb2O5 containing glasses [24]. The observed red shift of the terminal B-O- stretching of BØ2O- units (1387 – 1370 cm-1 and 1472 - 1459 cm-1) observed in the spectrum of x= 1 glass suggests interaction between Nb5+ ions and non-bridging oxygens, (Nb – O - B bonding), which consequently weakens the strength of the B-O-bonding and shifts its characteristic peak positions to the lower frequency [14,24].
To summarize this section, the IR spectral analysis show that addition of Nb2O5 into the base zinc borate glass depolymerizes borate oxygen network causing the destruction of superstructural borate groups and their conversion to BO3 containing borate entities. Thus the structure of Nb2O5-containing glasses consists mainly of [BØ2O]- and [BØ4]- metaborate groups, [B2O5]4- pyroborate and [BO3]3- ortoborate units, isolated NbO4 tetrahedra and corner shared NbO6. The presence of niobium increases the disorder and the degree of connectivity between the various structural units in the glass network as it participate in the formation of mixed bridging Nb-O-B and Nb-O-Eu bonds and as well as Nb-O-Nb linkages.
3.4. Physical parameters
The observed variation in density and various physical parameters: as molar volume (Vm), oxygen molar volume (Vo) and oxygen packing density (OPD) of the investigated glasses, which are listed in Table 1 are in line with the proposed structural features, based on the Raman and IR spectral data. As it is seen the Nb2O5 containing glasses are characterized with higher density and OPD values, evidencing that the presence of Nb2O5 into the zinc borate glass causes formation of highly cross-linked and compact networks [27]. The lowest value of OPD of the glass having the highest Nb2O5 content (x = 5) as compared with the OPD values of other Nb2O5-containing glasses indicates decreasing cross-link efficiency of niobium ions and higher number of non-bridging atoms in the structure of this glass. With the introduction of 1 mol% Nb2O5 to the base zinc-borate glass the molar volume Vm and oxygen molar volume Vo decrease while with the further increase in Nb2O5 content (x = 3 and x = 5) both parameters start to increase. These changes observed can be explained with the NbO4→NbO6 conversion upon Nb2O5 loading and formation of reticulated network because of the presence of high number of mixed bridging bonds (B-O-Nb, and Eu-O-Nb) within Nb2O5 containing glass networks. [28].
3.5. Determination of optical band gap
Some structural information can be also obtained from the optical band gap values (Eg) evaluated from the UV–Vis spectra on the Tauc method by plot (F(R∞) hν)1/n, n = 2 versus hν (incident photon energy) shown in Figure 6. [29].
It is seen that Eg of investigated glasses decreases with the increasing concentration of Nb2O5. Similar behavior is observed in the other glass systems containing high Nb2O5 content, where the reduction in the band gap energy is related to the increase of the glass overall polarizability due to the insertion of NbO6 octahedra and their mutual linking into the glass structure [8].
3.6. EPR Spectroscopy
EPR analysis have been carried to provide insightful information about the Eu2+ ions in the studied glasses.
In the Figure 7 are registered several dominant signals with g-values at g=2.7, g=4.6, g=6.0. The most intensive feature is assigned to the impurities of isolated Mn2+ ions. The observed resonance signals in the spectral range 0-300 mT are assigned to the to the presence of Eu2+ ions in a highly asymmetric site environment [30,31] .The EPR spectra indicate the presence of low concentration of Eu2+ ions in the obtained glasses, based on the comparison between the background spectrum and the analyzed spectra.
3.7. Optical studies
The optical transmittance spectra for investigated glasses are presented in Figure 8.
As can be seen all glasses are characterized with a good transmission in the visible region (around 80 %). The low intensive absorption bands at about 395 nm and 465 nm are corresponding to f-f transitions of Eu3+ ions between the ground and excited levels. It should be mentioned that the reduction process of the valence of niobium ions (Nb4+), produces very intense absorption peaks in the visible range due to the d-d transition. In the presented spectra there is no absorption bands corresponding to d-d transition, suggesting that Nb ions in the investigated glasses are presented as Nb5+.
3.8. Luminescent properties
The excitation spectra (Figure 9) of the obtained glasses, monitored at 612 nm, consist of a wide excitation band below 350 nm and some narrow transitions of Eu3+ located at 317 nm (7F0→5H3), 360 nm (7F0→5D4), 375 nm (7F0→5G2), 380 nm (7F1→5L7), 392 nm (7F0→5L6), 413 nm (7F0→5D3), 463 nm (7F0→5D2) 524 (7F0→5D1), 530 nm (7F1→5D1) and 576nm (7F0→5D0) [32].The wide excitation band in the UV-region is attributed to the charge transfer transition of Eu3+ (O2-→ Eu3+) for x=0 [33,34,35,36]. With introduction of Nb2O5 in the glass composition (x=1÷5), the charge transfer band is assigned to the combined absorptions of Eu3+ and of NbOn groups, NbOn=NbO6, NbO4 (O2-→Nb5+) [37,38].The contribution of these two components cannot be clearly differentiated because of the spectral overlap. The appearance of absorption of host matrix, under excitation at 612 nm (Eu3+ most intense emission), has been shown to play an essential role in the enhancement of the rare earth luminescence [17,39,40,41] through the occurring of non-radiative energy transfer, in particular from NbOn structural polyhedra to the Eu3+ ion.
Figure 9 shows that the increasing of Nb2O5 concentration in the glass composition leads to a decrease of charge transfer band intensity, while the narrow Eu3+ peaks increases. Similar behavior was observed by Liu et al. [42] and Sreena et al. [41]. This suggest that some amount of the absorbed energy from NbOn groups is transferred to the Eu3+ excitation levels. The maximum transferred energy corresponds to the lowest intensity of the charge transfer band of niobium-containing glasses. The probability of this energy transfer increases when the host absorbing groups, in our case NbOn and the Eu3+ active ion are nearest neighbors in the structure [43]. Hence, the incorporation of niobium into Eu3+ doped 50ZnO:50B2O3 host materials is favorable for achieving proper excitation, since in general Eu3+ bands are weak due to the parity-forbidden law. As can be seen from Figure 9, the strongest bands is located at 392 nm (7F0→5L6 transition), followed by 7F0→5D2 transition at 463 nm. This data signifies that the obtained phosphors can be efficiently excited with a range of excitation wavelength of the commercially available near ultraviolet - NUV (250 - 400 nm) and blue LED chips (430 - 470 nm).
The emission spectra of Eu3+ doped 50ZnO:(50-x)B2O3: xNb2O5:0.5Eu2O3:, x= 0, 1, 3 and 5 mol% glasses (Figure 10) is acquired upon excitation at 392 nm (7F0→ 5L6 transition). The observed bands are due to the intra-configurational transitions of the excited 5D0 state to the ground states 7F0 (578 nm), 7F1 (591 nm), 7F2 (612 nm), 7F3 (651 nm), 7F4 (700 nm) in the 4F6 configuration of Eu3+ ion [32]. As can be seen, the addition of Nb2O5 up to 3 mol% leads to the increase of the emission intensity. The luminescence suppression is observed at 5 mol% Nb2O5.
According to literature data in the spectral region 350-600 nm region is registered the broad emission band of NbOn [33;44,45]. In the same spectral region are located the excitation bands of Eu3+, shown at Figure 9. In this way, the other condition for effective energy transfer, i.e. the overlap of the host group emission, in our case NbOn and the excitation levels of the active Eu3+ ion, is satisfied [43]. This process is known as host sensitized energy transfer. An evidence of the non-radiative transfer is the absence of the emission band of NbOn groups in the spectra (Figure 10). The strongest emission line, located at 612 nm, is caused by the sensitive to the small changes in the environment, forced electric dipole transition (ED) 5D0 → 7F2, followed by the insensitive to the surroundings magnetic dipole (MD) 5D0→7F1 one [32,33]. The fact that the predominant emission is from the ED transition rather than from the MD transition is an indication that Eu3+ ions are distributed in a non-inversion symmetry sites in the glass host. Therefore, the value of relative luminescent intensity ratio R of the two transitions (5D0→7F2)/(5D0→7F1) (Table 2) gives information of the degree of asymmetry around the Eu3+ ions [2,46].
The higher the value of the asymmetry parameter, the lower the local site symmetry of the active ion, the higher Eu–O covalence and emission intensity. The calculated higher R values (from 4.31-5.16) compared to the other reported in the literature (Table 2) [17,40,47,48,49,50,52], suggest more asymmetry in the vicinity of Eu3+ ions and stronger Eu–O covalence and thus enhanced emission intensity.

Table 2.
Relative luminescencent intensity ratio (R) of the two transitions (5D0→7F2)/(5D0→7F1) for glasses with different Nb2O5 content and of other reported Eu3+ doped oxide glasses.
Table 2.
Relative luminescencent intensity ratio (R) of the two transitions (5D0→7F2)/(5D0→7F1) for glasses with different Nb2O5 content and of other reported Eu3+ doped oxide glasses.
| Glass composition | Relative luminescencent intensity ratio, R | Reference |
| 50ZnO:50B2O3:0.5Eu2O3 | 4.31 | Present work |
| 50ZnO:49B2O3: 1Nb2O3:0.5Eu2O3 | 4.89 | Present work |
| 50ZnO:47B2O3: 3Nb2O3:0.5Eu2O3 | 5.16 | Present work |
| 50ZnO:45B2O3: 5Nb2O3:0.5Eu2O3 | 5.11 | Present work |
| 50ZnO:40B2O3:10WO3:xEu2O3 (0≤x≤10) |
4.54÷5.77 | 17 |
| 50ZnO.40B2O3. 5WO3.5Nb2O5.xEu2O3 (0≤x≤10) |
5.09÷5.76 | 40 |
| (100-y)TeO2-10Nb2O5-yPbF2 (0 ≤ y ≤ 30) |
2÷4.16 | 47. |
| 69TeO2 :1K2O:15Nb2O5:1.0Eu2O3 | 5 | 48. |
| 60TeO2:19ZnO:7.5Na2O:7.5Li2O:5Nb2O5: 1Eu2O3 |
3.73 | 49. |
| 4ZnO:3B2O3:0.5÷2.5 mol % Eu3+ | 3.94-2.74 | 50. |
| (99.5-x):B2O3:xLi2O:0.5Eu2O3 | 2.41-3.40 | 51 |
| (64-x)GeO2:xSiO2:16K2O:6BaO:4Eu2O3 | 3.42-4.07 | 51 |
| (98-x)P2O5:xCaO:2Eu2O3 | 3.88-3.95 | 51. |
| 79TeO2+20Li2CO3+1Eu2O3 | 4.28 | 52. |
Comparing the R values of the synthesized zinc borate glass without Nb2O5 (4.31) and glass samples containing 1÷5 mol% Nb2O5 (4.89-5.16) can be supposed that Nb2O5 addition leads Eu3+ to high asymmetry environments in the host, increasing the intensity of 5D0→7F2 transition. The most intensive emission was registered with 3 mol% Nb2O5. The increase of Nb2O5 content (5 mol%) leads to a slight diminishing in the emission intensity (Figure 10) as a result of the increasing Eu3+ site symmetry (lightly reducing of R) (Table 2). An additional indication of the Eu3+ location in non - centrosymmetric sites is the appearance of the 5D0→7F0 transition in the emission spectra. Based on the standard Judd-Ofelt theory, this transition is strictly forbidden. According to Binnemans, the observation of 5D0→7F0 band shows that Eu3+ occupy sites with C2v, Cn or Cs symmetry. [53]
3.8.1. CIE color coordinates and CCT (K) values
To characterize the emission color of Eu3+ doped glasses, the standard Commission International de l’Eclairage (CIE) 1931 chromaticity diagram was applied [54]. From the luminescence spectra the chromaticity coordinates of specimens were calculated using color calculator software (CIE coordinate calculator). The obtained values are listed in Table 3, whereas references are included the chromaticity coordinates of the commercial phosphor Y2O2S:Eu3+ [55] and National Television Standards Committee (NTSC) for red color. As can be seen from the Table 3, the chromaticity coordinates of the niobium containing glasses are very close to the standard recommended by NTSC (0.67, 0.33) values and nearly equivalent with the commercially applied red phosphor Y2O2S:Eu3+ (0.658, 0.340). The calculated values are almost identical and cannot be individually separated on CIE diagram (Figure 11). This data show that the obtained glasses are characterized with high color purity.
Table 2.
CIE chromaticity coordinates, dominant wavelength, color purities and correlated color temperature (CCT, K) of 50ZnO:(50-x)B2O3: xNb2O5:0.5Eu2O3, x= 0, 1, 3 and 5 mol%.
Table 2.
CIE chromaticity coordinates, dominant wavelength, color purities and correlated color temperature (CCT, K) of 50ZnO:(50-x)B2O3: xNb2O5:0.5Eu2O3, x= 0, 1, 3 and 5 mol%.
| Glass composition | Chromaticity coordinates (x,y) | CCT(K) |
| 50ZnO:B2O3:0.5Eu2O3 (x=0) | (0.645, 0.346) | 2301.26 |
| 50ZnO:49B2O3:1Nb2O3:0.5Eu2O3 (x=1) | (0.656, 0.344) | 2479.99 |
| 50ZnO:47B2O3:3Nb2O3:0.5Eu2O3 (x=3) | (0.656, 0.343) | 2505.78 |
| 50ZnO:45B2O3: 5Nb2O3:0.5Eu2O3 (x=5) | (0.657, 0.343) | 2518.60 |
| NTSC standard for red phosphors | (0.67, 0.33) | |
| Y2O2S:Eu3+ | (0.658, 0.340) |
The color correlated temperature (CCT) was calculated by the McCamy empirical formula:
where n= (x−xe)/(y−ye) is the reciprocal slope, (xe=0.332, ye=0.186) are epicenter of convergence and x and y are the chromaticity coordinates. The phosphors with CCT values below 3200 K are generally considered as a warm light source, while those with values above 4000 K, as a cold light source [56]. The calculated CCT values of Eu3+ doped glasses (Table 2) ranges from 2301.26 K to 2518.60 K and these glasses can be considered as warm red light emitting materials for solid state lightening application.
4. Discussion
The Raman and IR spectral data as well as the established values of the structural sensitive physical parameters demonstrate that at smaller amount, the niobium ions (up to 5 mol %) are embedded into the base Eu3+: ZnO:B2O3 glass as isolated NbO4 tetrahedra and corner shared NbO6 with increasing distortion upon Nb2O5 loading. NbO4 tetrahedral units play a network forming role and strengthened the host glass structure through B-O-Nb bonding. NbO6 octhedra are situated around of the Eu3+ ions (i. e niobate groups are charge balanced by Eu3+ ions) and the higher number of the NbO6 surrounding Eu3+ is found for the glass containing 3 mol% Nb2O5. Except by Eu3+ ions, NbO6 octhahedra are also charge balanced by Zn2+ ions. Hence, the incorporation of Nb2O5 into Eu3+: ZnO:B2O3 glass creates more disordered and reticulated glass networks, which is favorable for doping with Eu3+ active ions. Moreover, the DTA analysis shows high values of glass transition temperatures (over 500 oC) and together with the absence of glass crystallization effects are both confirming the formation of connected and stable glass networks.
The observed optical properties are discussed on the base of the glass structural features. The most intensive Eu3+ emission peak, corresponding to the hypersensitive 5D0→7F2 transition, along with the high values of the luminescent ratio R, evidence that Eu3+ ions are located in low site symmetry in the host matrix.This emission peak intensity and R values of Nb2O5 containing glasses are higher in comparison with the Nb2O5-free Eu3+: ZnO:B2O3 glass, indicating that Eu3+ are in higher asymmetry environments in the Nb2O5 containing glasses because of combining of niobate and borate structural units in the active ion surrounding. Thus, the introduction of Nb2O5 oxide in the Eu3+: ZnO:B2O3 glass, increases connectivity in the glass network and contributes to the creation of more distorted and rigid glass structure, that lowers the site symmetry of the rare earth ion and improves its photoluminescence behavior. Finally, the existence of NbO6 groups around Eu3+ ions ensures an occurrence of non-radiative energy transfer from the niobate groups to the active ions that additionally improves the Eu3+luminescence intensity. The influence of Eu2+ ions on the luminescence of Eu3+ is negligible due to their low content.
The result of these investigations show that Nb2O5 is appropriate constituent for modification of zinc borate glass structure and for enhancing the luminescence intensity of the doped Eu3+ ion.
5. Conclusions
The impact of the glass matrix on the Europium luminescent efficiency has been studied According to IR and Raman data, the structure of glasses consists of [BØ2O]- and [BØ4]- metaborate groups, [B2O5]4- pyroborate and [BO3]3- ortoborate units, isolated NbO4 tetrahedra and corner shared NbO6. The local environment of the Eu3+ ions in the Nb2O5 containing ZnO:B2O3 glasses is dominated by the interaction with both, borate and NbO6 octahedral structural groups. The niobate units in the active ion surrounding act as synthesizer and improve its emission as a result of the nonradiative energy transfer. The luminescent properties of the obtained Eu3+ doped glasses revealed that they could be excited by 392 nm and exhibit pure red emission centered at 612 nm (5D0→7F2 transition). The incorporation of niobium oxide into the ZnO:B2O3 glass enhances the luminescent intensity, making it a desirable component into the glass structure. It was established that the optimum Nb2O5 concentration to obtain the most intensive red luminescence is 3 mol%. The structure-optical property relationship studied in this work will be favorable for the elaboration of novel red - emitting materials.
Author Contributions
For research articles with several authors, a short paragraph specifying their individual contributions must be provided. The following statements should be used “Conceptualization, R.I. and M.M.; methodology, M. M.; A. Y. and L. A. software, M.M. A.Y, L.A, R. K and P.P.; validation, R.I, and N.N.; formal analysis, M. M.; A. Y and R.K.; investigation, , M. M.; A. Y. and L. A.; resources, L.A.; data curation, R.I.; writing—original draft preparation, R.I.; M.M. and A.Y; writing—review and editing, R.I.; visualization, R.I. and M.M..; supervision, R.I.; project administration, L.A.; funding acquisition, L.A. All authors have read and agreed to the published version of the manuscript.” Please turn to the CRediT taxonomy for the term explanation. Authorship must be limited to those who have contributed substantially to the work reported.
Funding
Please add: Research equipment of distributed research infrastructure INFRAMAT (part of Bulgarian National roadmap for research infrastructures) supported by Bulgarian Ministry of Education and Science under contract D01-322/30.11.2023 were used in this investigation.
Institutional Review Board Statement
Not applicable
Informed Consent Statement
Not applicable.
Data Availability Statement
Not applicable.
Conflicts of Interest
The authors declare no conflict of interest.
References
- Sontakke, A.D.; Tarafder, A.; Biswas, K.; Annapurna, K. Sensitized red luminescence from Bi3+ co-doped Eu3+: ZnO–B2O3 glasses. Phys. B: Condens. Matter. 2009, 404, 3525–3529. [Google Scholar] [CrossRef]
- Devi, C.H.B.; Mahamuda, S.; Swapna, K.; Venkateswarlu, M.; Rao, A.S.; Prakash, G.V. Compositional dependence of red luminescence from Eu3+ ions doped single and mixed alkali fluoro tungsten tellurite glasses. Opt. Mater. 2017, 73, 260–267. [Google Scholar] [CrossRef]
- Rajaramakrishna, R.; Nijapai, P.; Kidkhunthod, P.; Kim, H.J.; Kaewkhao, J.; Ruangtaweep, Y. Molecular dynamics simulation and luminescence properties of Eu3+ doped molybdenum gadolinium borate glasses for red emission. J. Alloys Comp. 2020, 813, 151914. [Google Scholar] [CrossRef]
- Rakpanicha, S.; Wantanab, N.; Kaewkhao, J. Development of bismuth borosilicate glass doped with Eu3+ for reddish orange emission materials application. Mater. Today: Proc. 2017, 4, 6389–6396. [Google Scholar] [CrossRef]
- Lakshminarayana, G.; Wagh, A.; Kamath, S. D.; Dahshan, A.; Hegazy, H. H.; Marzec, M.; Kityk, I.V.; Lee, D.; Yoon, J.; Park, T. Eu3+-doped fluoro-telluroborate glasses as red-emitting components for W-LEDs application. Opt. Mater. 2020, 99, 109555. [Google Scholar] [CrossRef]
- Balda, R.; Fernàndez, J.; Lacha, L.M.; Arriandiaga, M.A.; Fernàndez-Navarro, J.M. Energy transfer studies in Eu3+-doped lead–niobium–germanate glasses. Opt. Mater. 2005, 27, 1776–1780. [Google Scholar] [CrossRef]
- Bilir, G.; Ertap, H.; Ma, L.; Di Bartolo, B. Infrared to visible upconversion emission in Nb2O5 modified tellurite glasses triply doped with rare earth ions. Mater. Res. Express. 2019, 6, 085203–0852214. [Google Scholar] [CrossRef]
- Marcondes, L. M.; Maestri, S.; Sousa, B.; Gonçalves, R. R.; Cassanjes, F. C.; Poirier G., Y. High niobium oxide content in germanate glasses: Thermal, structural, and optical properties. J. Am. Ceram. Soc. 2018, 101(1), 220–230. [Google Scholar] [CrossRef]
- Chen, Q. Nb2O5 improved photoluminescence, magnetic, and Faraday rotation properties of magneto-optical glasses. J. Non-Cryst. Solids 2019, 519, 119451. [Google Scholar] [CrossRef]
- Iordanova, R.; Milanova, M.; Aleksandrov, L.; Shinozaki, K.; Komatsu, T. Structural study of WO3-La2O3-B2O3-Nb2O5 glasses. J. Non-Cryst. Solids 2020, 543, 120132. [Google Scholar] [CrossRef]
- Komatsu, T.; Honma, T.; Tasheva, T.; Dimitrov, V. Structural role of Nb2O5 in glass-forming ability, electronic polarizability and nanocrystallization in glasses: A review. J. Non-Cryst. Solids 2022, 581, 121414. [Google Scholar] [CrossRef]
- Siva Sesha Reddy, A.; Ingram, A.; Brik, M. G.; Kostrzewa, M.; Bragiel, P.; Kumar, V.R.; Veeraiah, N. Insulating characteristics of zinc niobium borate glass-ceramics. J. Am. Ceram. Soc. 2017, 100, 4066–4080. [Google Scholar] [CrossRef]
- Barbosa, A.J.; Dias Filho, F.A.; Maia, L.J.Q.; Messaddeq, Y.; Ribeiro S. J., L.; Gonçalves, R.R. Er3+ doped phosphoniobate glasses and planar waveguides: structural and optical properties. J. Phys.: Condens. Matter 2008, 20, 285224. [Google Scholar] [CrossRef]
- Topper, B.; Möncke, D.; Youngman, R.E.; Valvi, C.; Kamitsos, E.I.; Varsamis, C.P. Zinc borate glasses: properties, structure and modelling of the composition-dependence of borate speciation. Phys. Chem. Chem. Phys. 2023, 25, 5967–5988. [Google Scholar] [CrossRef]
- Yao, Z. Y.; Möncke, D.; Kamitsos, E. I.; Houizot, P.; Célarié, F.; Rouxel, T.; Wondraczek, L. Structure and mechanical properties of copper–lead and copper–zinc borate glasses. J. Non-Cryst. Solids 2016, 435, 55–68. [Google Scholar] [CrossRef]
- Kamitsos, E.I.; Karakassides, M.A.; Chryssikos, G.D. Vibrational Spectra of Magnesium-Sodium-Borate Glasses. 2. Raman and Mid-Infrared Investigation of the Network Structure. J. Phys. Chem. 1987, 91, 1073–1079. [Google Scholar] [CrossRef]
- Milanova, M.; Aleksandrov, L.; Yordanova, A.; Iordanova, R.; Tagiara, N. S.; Herrmann, A.; Gao, G.; Wondraczek, L.; Kamitsos, E. I. Structural and luminescence behavior of Eu3+ ions in ZnO-B2O3-WO3 glasses. J. Non-Cryst. Solids 2023, 600, 122006. [Google Scholar] [CrossRef]
- Aronne, A.; Sigaev, V.N.; Champagnon, B.; Fanelli, E.; Califano, V.; Usmanova, L. Z.; Pernice, P. The origin of nanostructuring in potassium niobosilicate glasses by Raman and FTIR spectroscopy. J. Non-Cryst. Solids 2005, 351, 3610–3618. [Google Scholar] [CrossRef]
- Jeng, J. M.; Wachs, I. E. Structural chemistry and Raman spectra of niobium oxides. Chem. Mater. 1991, 3, 100–107. [Google Scholar] [CrossRef]
- Pradhan, A. K.; Choudhary, R. N. P. Vibrational spectra of rare earth orthoniobates. Phys. Stat. Sol. B. 1987, 143, K161–K166. [Google Scholar] [CrossRef]
- Cardinal, T.; Fargin, E.; Couszi, M.; Canioni, L.; Segonds, P.; Sarger, L.; Ducasse, A.; Adamietz, F. Non-linear optical properties of some niobium oxide (V) glasses. Eur. J. Solid State Chem. 1996, 33, 597–605. [Google Scholar]
- Ptak, M.; Pilarek, B.; Watras, A.; Godlewska, P.; Szczygieł, I.; Hanuza, J. Structural, vibrational and optical properties of Eu3+-doped Gd3NbO7 niobates-The mechanism of their structural phase transition. J. Alloys Compd. 2019, 810, 151892. [Google Scholar] [CrossRef]
- Fukumi, K.; Sakka, S. Coordination states of Nb5+ ions in silicate and gallate glasses as studied by Raman spectroscopy. J. Mater. Sci. 1998, 23, 2819–2823. [Google Scholar] [CrossRef]
- Varsamis, C. P. E.; Makris, N.; Valvi, C.; Kamitsos, E. I. Short-range structure, the role of bismuth and property-structure correlarion in bismuth borate glasses, Phys. Chem. Chem. Phys. 2021, 23, 10006–10020. [Google Scholar] [CrossRef] [PubMed]
- Tatsumisago, M.; Hamada, A.; Minami, T.; Tanaka, M. Infrared spectra of rapidly quenched glasses in the systems Li2O-RO-Nb2O5 (R=Ba, Ca, Mg). J. Am. Ceram Soc. 1982, 66, 117–119. [Google Scholar] [CrossRef]
- G. Blasse, G.; Van den Heuvel, G. Vibrational spectra of some oxidic niobates. Z. fur Phys. 1973, Bd. 84, 114–120. [CrossRef]
- Villegas, M.A.; Fernández Navarro, J.M. Physical and structural properties of glasses in the TeO2–TiO2–Nb2O5 system. J. Eur. Ceram. Soc. 2007, 27, 2715–2723. [Google Scholar] [CrossRef]
- Zhongcai, W.; Bingkai, S.; Shizhuo, W.; Hanxing, L. Investigation of the network structure of niobium borate glasses. J. Non-Cryst. Solids 1986, 80(1-3), 160–166. [Google Scholar] [CrossRef]
- Tauc, J. Amorphous and Liquid Semiconductor; Plenum Press: London and New York, 1974. [Google Scholar]
- Brodbeck, M.; Iton, L.E. The EPR spectra of Gd3+ and Eu3+ in glassy systems. J. Chem. Phys. 1985, 83, 4285–4299. [Google Scholar] [CrossRef]
- Nandyala, S.; Hungerford, G.; Babu, S.; Rao, J.L.; Leonor, I.B.; Pires, R.; Reis, R.L. Time resolved emission and electron paramagnetic resonance studies of Gd3+ doped calcium phosphate glasses. Adv. Mater. Lett. 2016, 7, 277–281. [Google Scholar] [CrossRef]
- Binnemans, K. Interpretation of europium (III) spectra. Coord. Chem. Rev. 2015, 295, 1–45. [Google Scholar] [CrossRef]
- Blasse, G.; Grabmaier, B.C. Luminescent Materials, 1st ed.; Springer: Berlin/Heidelber, Germany, 1994; p. 18. [Google Scholar]
- H. E. Hoefdraad, The charge-transfer absorption band of Eu3+ in oxides. J. Solid State Chem. 1975, 15, 175–177. [CrossRef]
- Parchur, A.K.; Ningthoujam, R.S. Behaviour of electric and magnetic dipole transitions of Eu3+,5D0→7F0 and Eu–O charge transfer band in Li+ co-doped YPO4:Eu3+. RSC Adv. 2012, 2, 10859–10868. [Google Scholar] [CrossRef]
- Mariselvam, K.; Liu, J. Synthesis and luminescence properties of Eu3+ doped potassium titano telluroborate (KTTB) glasses for red laser applications. J. Lumin. 2021, 230, 117735. [Google Scholar] [CrossRef]
- Sun, Z.; Fu, Z.; Ma, L.; Cao, H.; Wang, M.; Cao, H.; Zhang, A. Excellent multi-color emission and multi-mode optical ratiometric thermometer in (Ca, Tb, Eu, Sm) Nb2O6 phosphors based on wide O2–→ Nb5+ CTB. Appl. Surf. Sci. 2022, 575, 151791. [Google Scholar] [CrossRef]
- Zeng, H.; Song, J.; Chen, D.; Yuan, S.; Jiang, X.; Cheng, Y.; Chen, G. Three-photon-excited upconversion luminescence of niobium ions doped silicate glass by a femtosecond laser irradiation. Opt. Express 2008, 16(9), 6502–6506. [Google Scholar] [CrossRef]
- Yordanova, A.; Milanova, M.; Iordanova, R.; Fabian, M.; Aleksandrov, L.; Petrova, P. Network Structure and Luminescent Properties of ZnO–B2O3–Bi2O3–WO3:Eu3+ Glasses. Materials 2023, 16, 6779. [Google Scholar] [CrossRef]
- Aleksandrov, L.; Milanova, M.; Yordanova, A.; Iordanova, R.; Nedyalkov, N.; Petrova, P.; Tagiara, N.S.; Palles, D.; Kamitsos, E.I. Synthesis, structure and luminescence properties of Eu3+-doped 50ZnO.40B2O3.5WO3.5Nb2O5 glass. Phys. Chem. Glas. Eur. J. Glass Sci. Technol. B 2023, 64, 101–109. [Google Scholar] [CrossRef]
- Sreena, T. S.; Raj, A. K.; Rao, P. P. Effects of charge transfer band position and intensity on the photoluminescence properties of Ca1.9M2O7:0.1 Eu3+(M= Nb, Sb and Ta). Solid State Sci. 2022, 123, 106783. [Google Scholar] [CrossRef]
- Liu, Q.; Zhang, M.; Ye, Z.; Wang, X.; Zhang, Q.; Wei, B. Structure variation and luminescence enhancement of BaLaMg (Sb, Nb)O6: Eu3+ double perovskite red phosphors based on composition modulation. Ceram. Int. 2019, 45(6), 7661–7666. [Google Scholar] [CrossRef]
- Blasse, G. On the Eu3+ fluorescence of mixed metal oxides. IV. The photoluminescent efficiency of Eu3+-activated oxides. J. Chem. Phys. 1996, 45, 2356–2360. [Google Scholar] [CrossRef]
- Hazenkamp, M. F.; Strijbosch, A. W. P. M.; Blasse, G. Anomalous luminescence of two d0 transition-metal complexes: KVOF4 and K2NbOF5·H2O. J. Solid State Chem. 1992, 97(1), 115–123. [Google Scholar] [CrossRef]
- Verhaar, H.C.G.; Donker, H.; Dirksen, G.J.; Lammers, M.J.J.; Blasse, G.; Torardi, C.C.; Brixner, L.H. J. The luminescence of α- and β-LaNb3O9. Solid State Chem. 1985, 60, 20–28. [Google Scholar] [CrossRef]
- Nogami, M.; Umehara, N.; Hayakawa, T. Effect of hydroxyl bonds on persistent spectral hole burning in Eu3+ doped BaO-P2O5 glasses. Phys. Rev. B 1998, 58, 6166–6171. [Google Scholar] [CrossRef]
- Barbosa, J.S.; Batista, G.; Danto, S.; Fargin, E.; Cardinal, T.; Poirier, G.; Castro Cassanjes, F. Transparent glasses and glass-ceramics in the ternary system TeO2-Nb2O5-PbF2. Materials 2021, 14(2), 317. [Google Scholar] [CrossRef]
- Praveena, R.; Venkatramu, V.; Babu, P.; Jayasankar, C.K.; Tröster, Th.; Sievers, W.; Wortmann, G. Pressure dependent luminescence properties of Eu3+: TeO2-K2O-Nb2O5 glass. J. Phys.: Conf. Ser. 2008, 121, 042015. [Google Scholar]
- Babu, S. S.; Jang, K.; Cho, E. J.; Lee, H.; Jayasankar, C. K. Thermal, structural and optical properties of Eu3+ doped zinc-tellurite glasses. J. Phys. D: Appl. Phys 2007, 40, 5767. [Google Scholar] [CrossRef]
- Bettinelli, M.; Speghini, A.; Ferrari, M.; Montagna, M. Spectroscopic investigation of zinc borate glasses doped with trivalent europium ions. J. Non-Cryst. Solids 1996, 201, 211–221. [Google Scholar] [CrossRef]
- Oomen, E. W. J. L.; Van Dongen, A. M. A. Europium (III) in oxide glasses: dependence of the emission spectrum upon glass composition. J. Non-Cryst. Solids 1989, 111, 205–213. [Google Scholar] [CrossRef]
- Kumar, A.; Rai, D. K.; Rai, S. B. Optical studies of Eu3+ ions doped in tellurite glass. Spectrochim. Acta A Mol. Biomol. Spectrosc. 2002, 58(10), 2115–2125. [Google Scholar] [CrossRef]
- Binnemans, K.; Görller-Walrand, C. Application of the Eu3+ ion for site symmetry determination. J. Rare Earths 1996, 14, 173–180. [Google Scholar]
- Smith, T.; Guild, J. The CIE colorimetric standards and their use. Trans. Opt. Soc. 1931, 33, 73. [Google Scholar] [CrossRef]
- Trond, S. S.; Martin, J. S.; Stanavage, J. P.; Smith, A. L. Properties of Some Selected Europium-Activated Red Phosphors. J. Electrochem. Soc. 1969, 116(7), 1047–1050. [Google Scholar] [CrossRef]
- McCamy, C.S. Correlated color temperature as an explicit function of chromaticity coordinates. Color Res Appl. 1992, 17(2), 142–144. [Google Scholar] [CrossRef]
Figure 1.
XRD patterns of glasses 50ZnO:(50-x)B2O3:0.5Eu2O3:xNb2O5, (x=0, 1, 3 and 5 mol %).
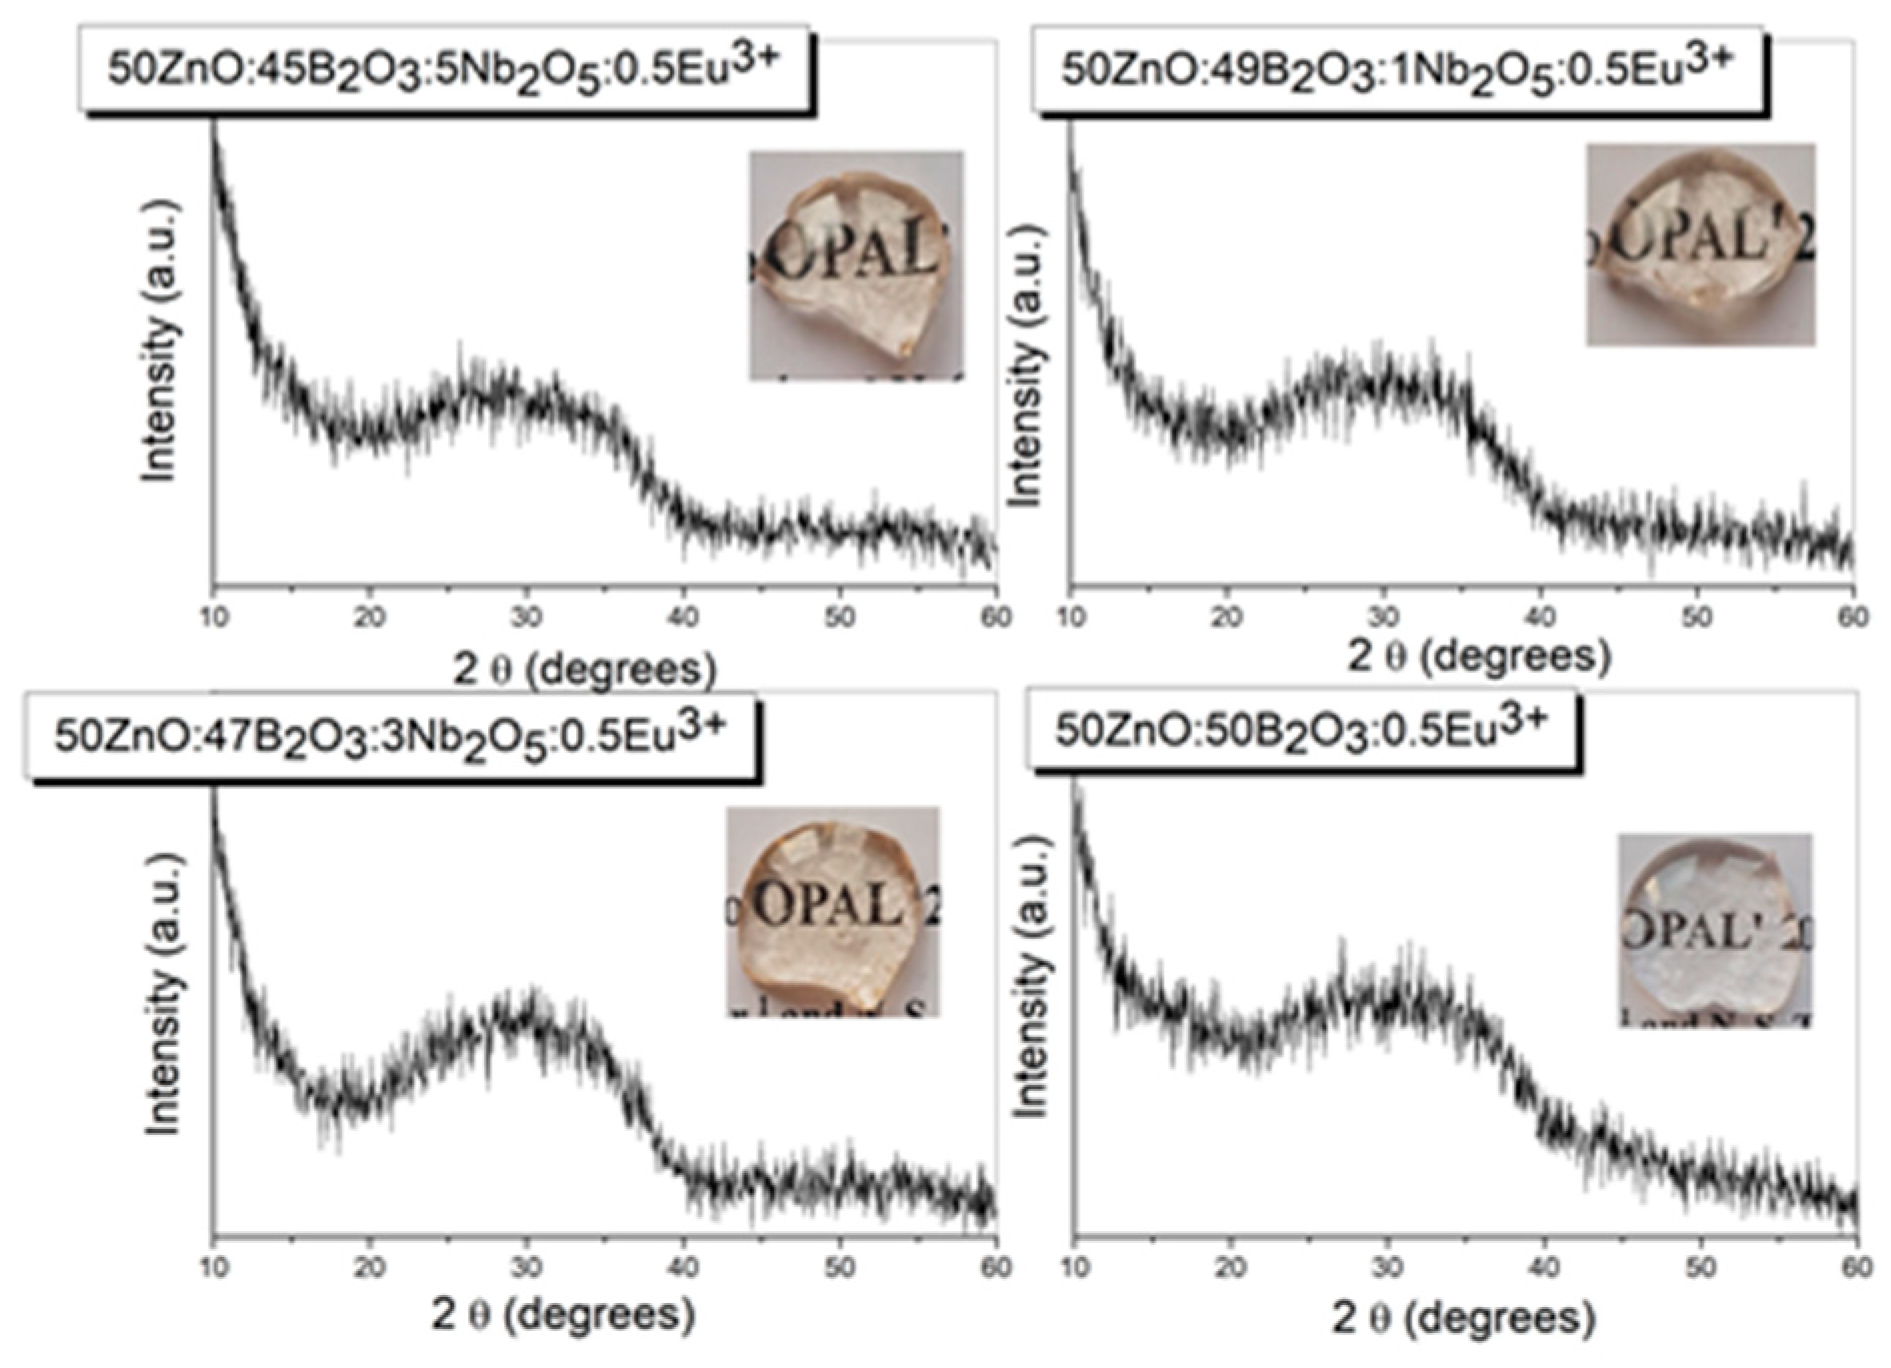
Figure 2.
DTA curves of glasses 50ZnO:(50-x)B2O3:0.5Eu2O3:xNb2O5, (x=0, 1, 3 and 5 mol %).
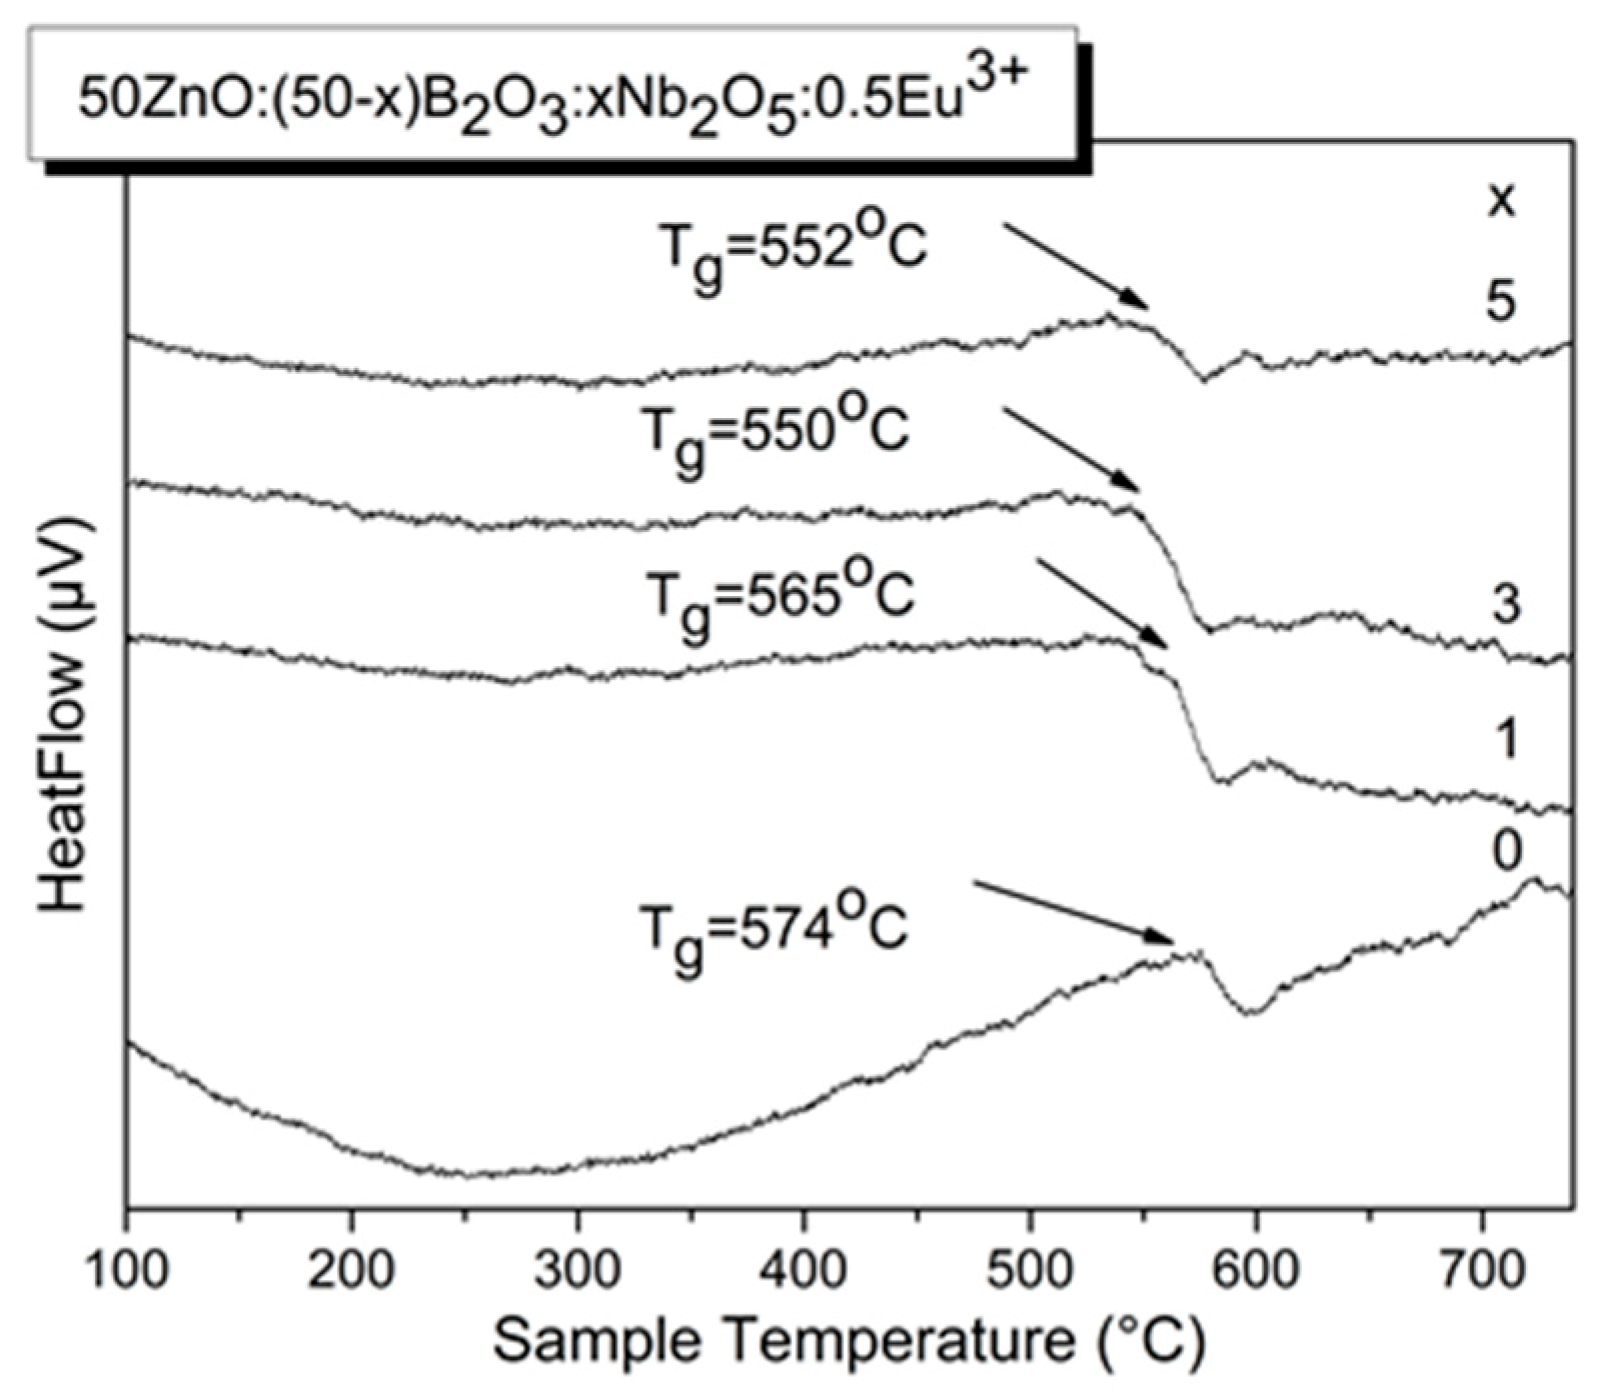
Figure 3.
Raman spectra of glasses 50ZnO:(50-x)B2O3:0.5Eu2O3:xNb2O5, (x=0, 1, 3 and 5 mol %).
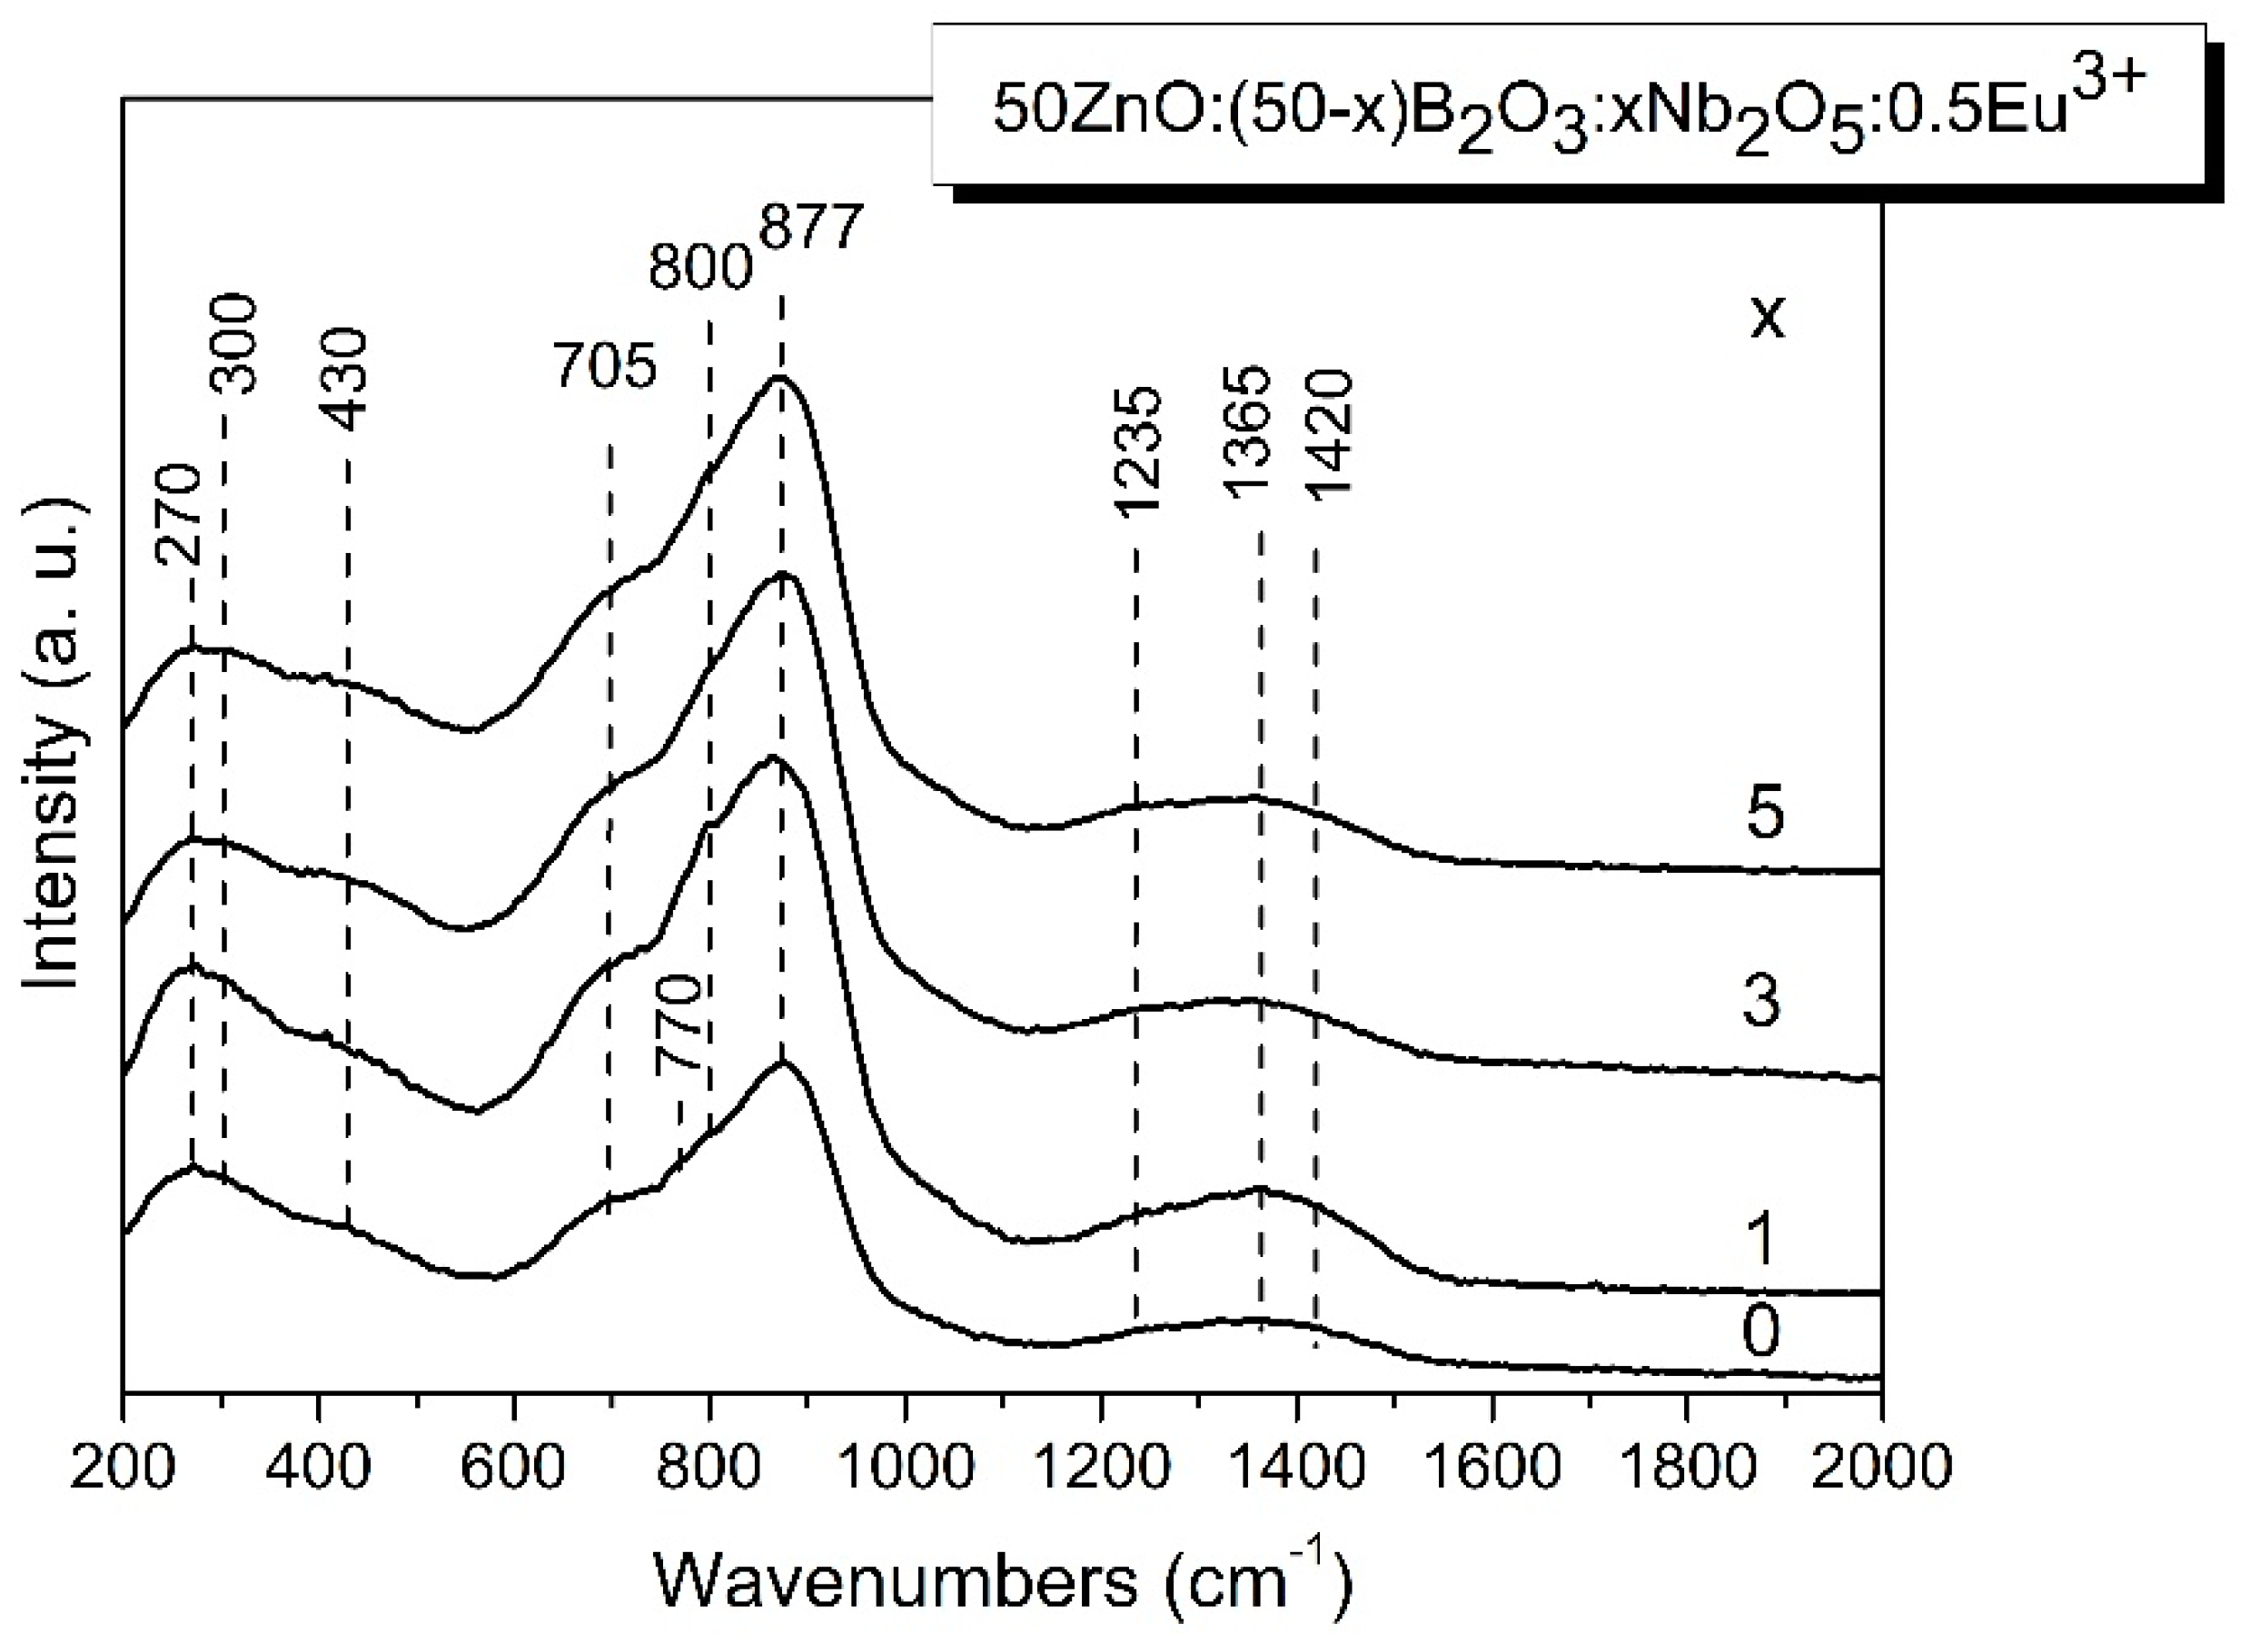
Figure 4.
IR spectra of glasses 50ZnO:(50-x)B2O3:0.5Eu2O3:xNb2O5, (x=0, 1, 3 and 5 mol %).
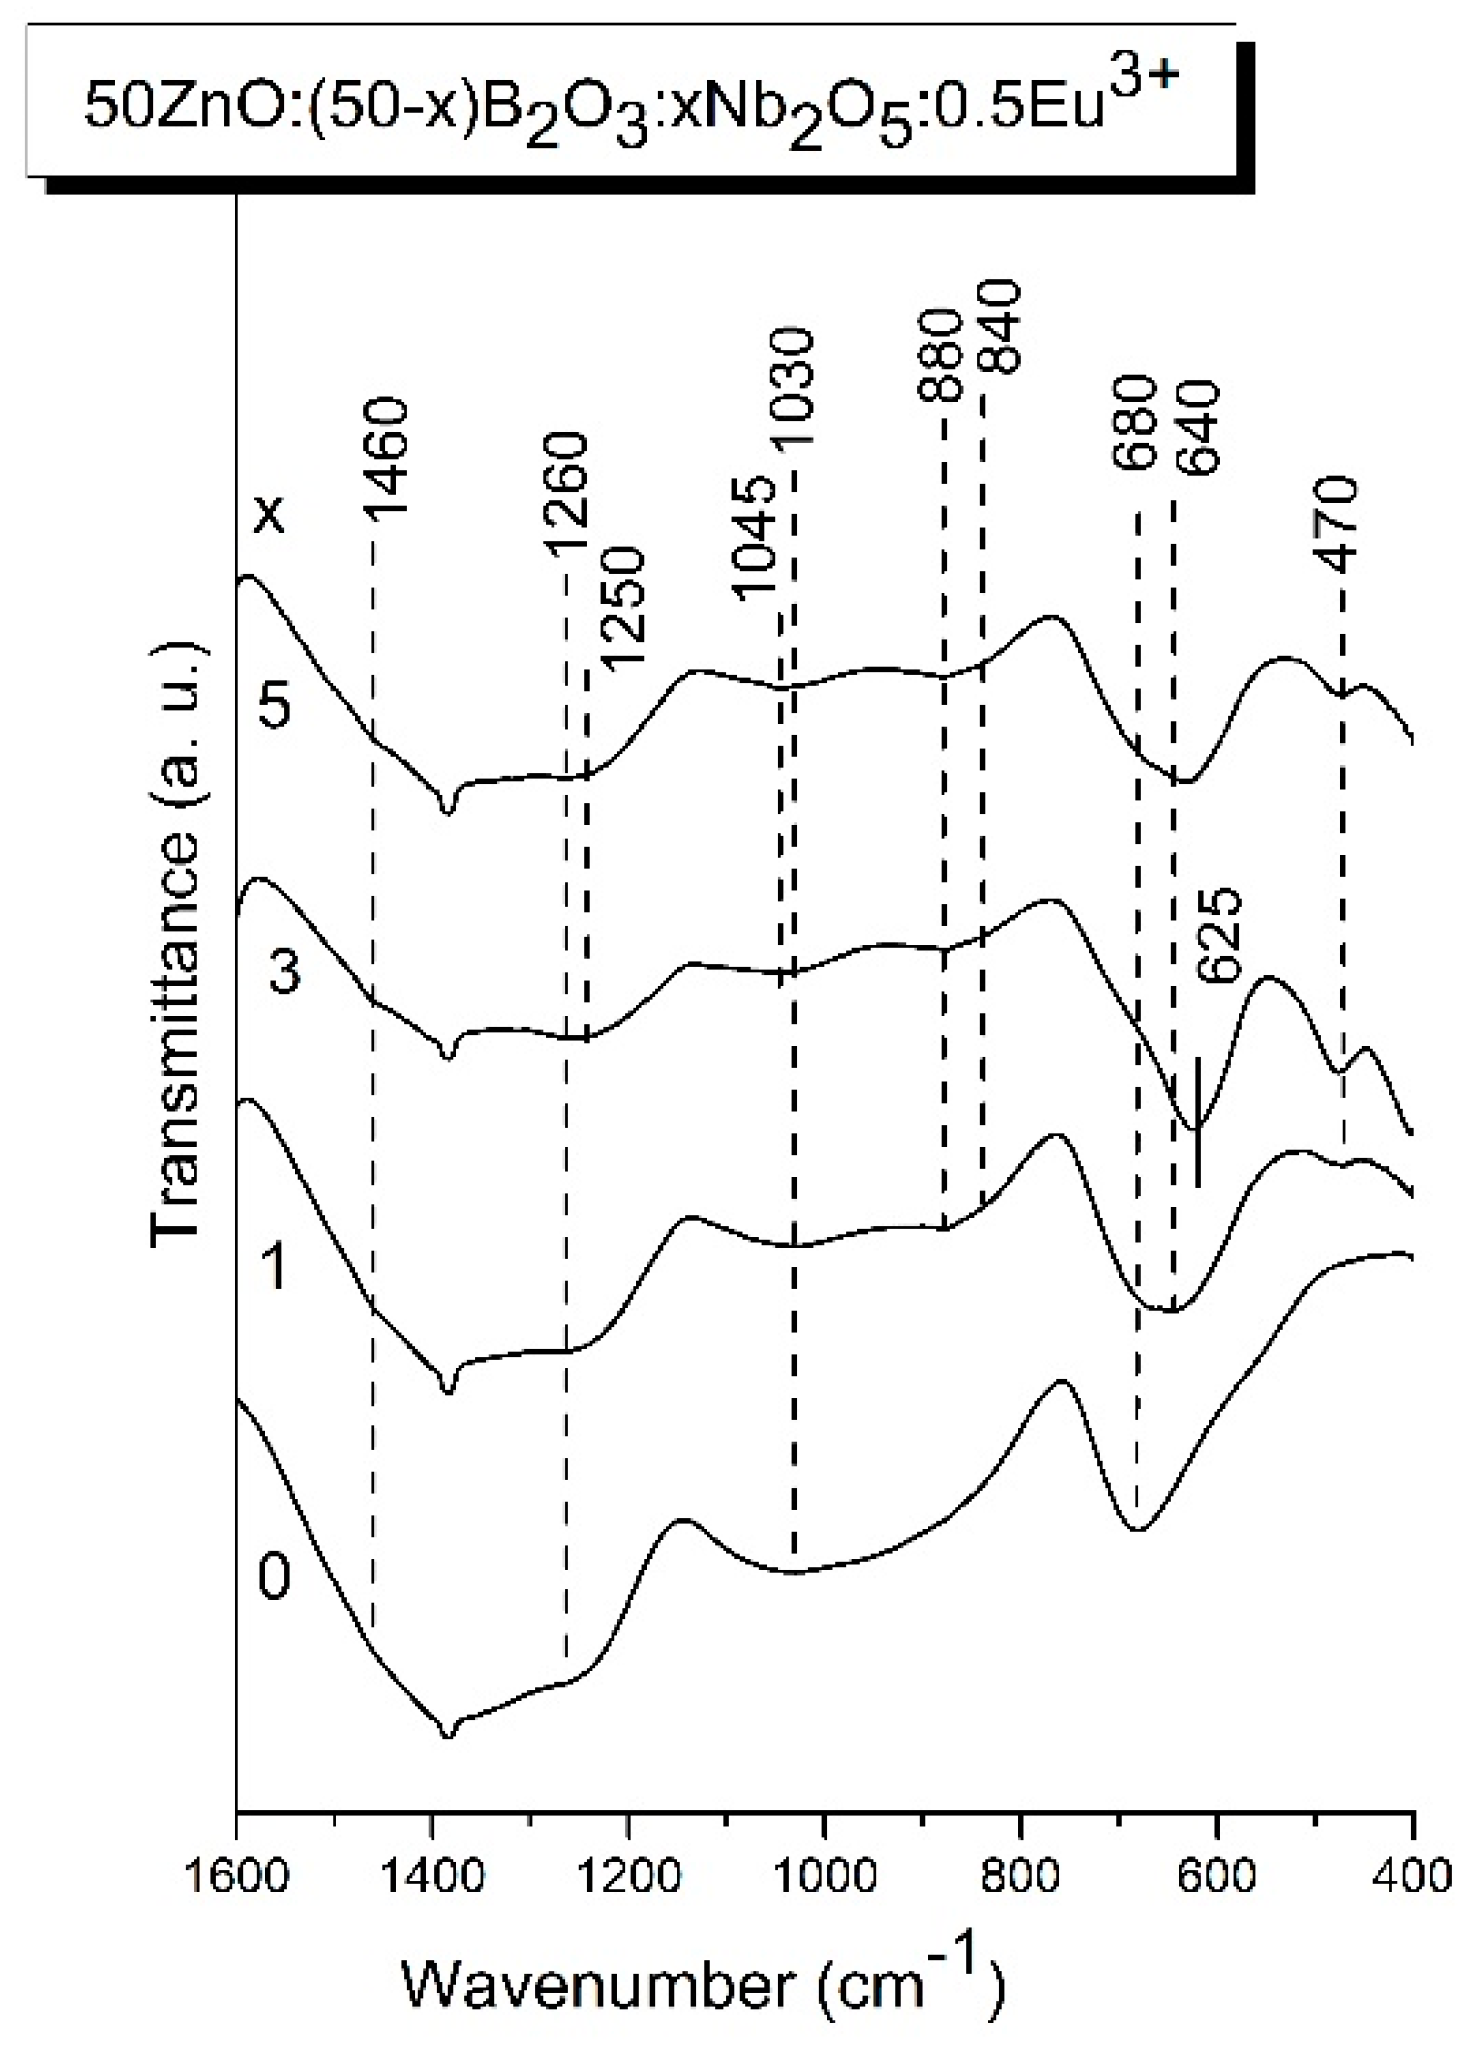
Figure 5.
Deconvoluted IR spectra of glasses 50ZnO:(50-x)B2O3:0.5Eu2O3:xNb2O5, (x=0, 1, 3 and 5 mol %).
Figure 5.
Deconvoluted IR spectra of glasses 50ZnO:(50-x)B2O3:0.5Eu2O3:xNb2O5, (x=0, 1, 3 and 5 mol %).

Figure 6.
Tauc’s plots of glasses 50ZnO:(50-x)B2O3:0.5Eu2O3:xNb2O5, (x=0, 1, 3 and 5 mol %).
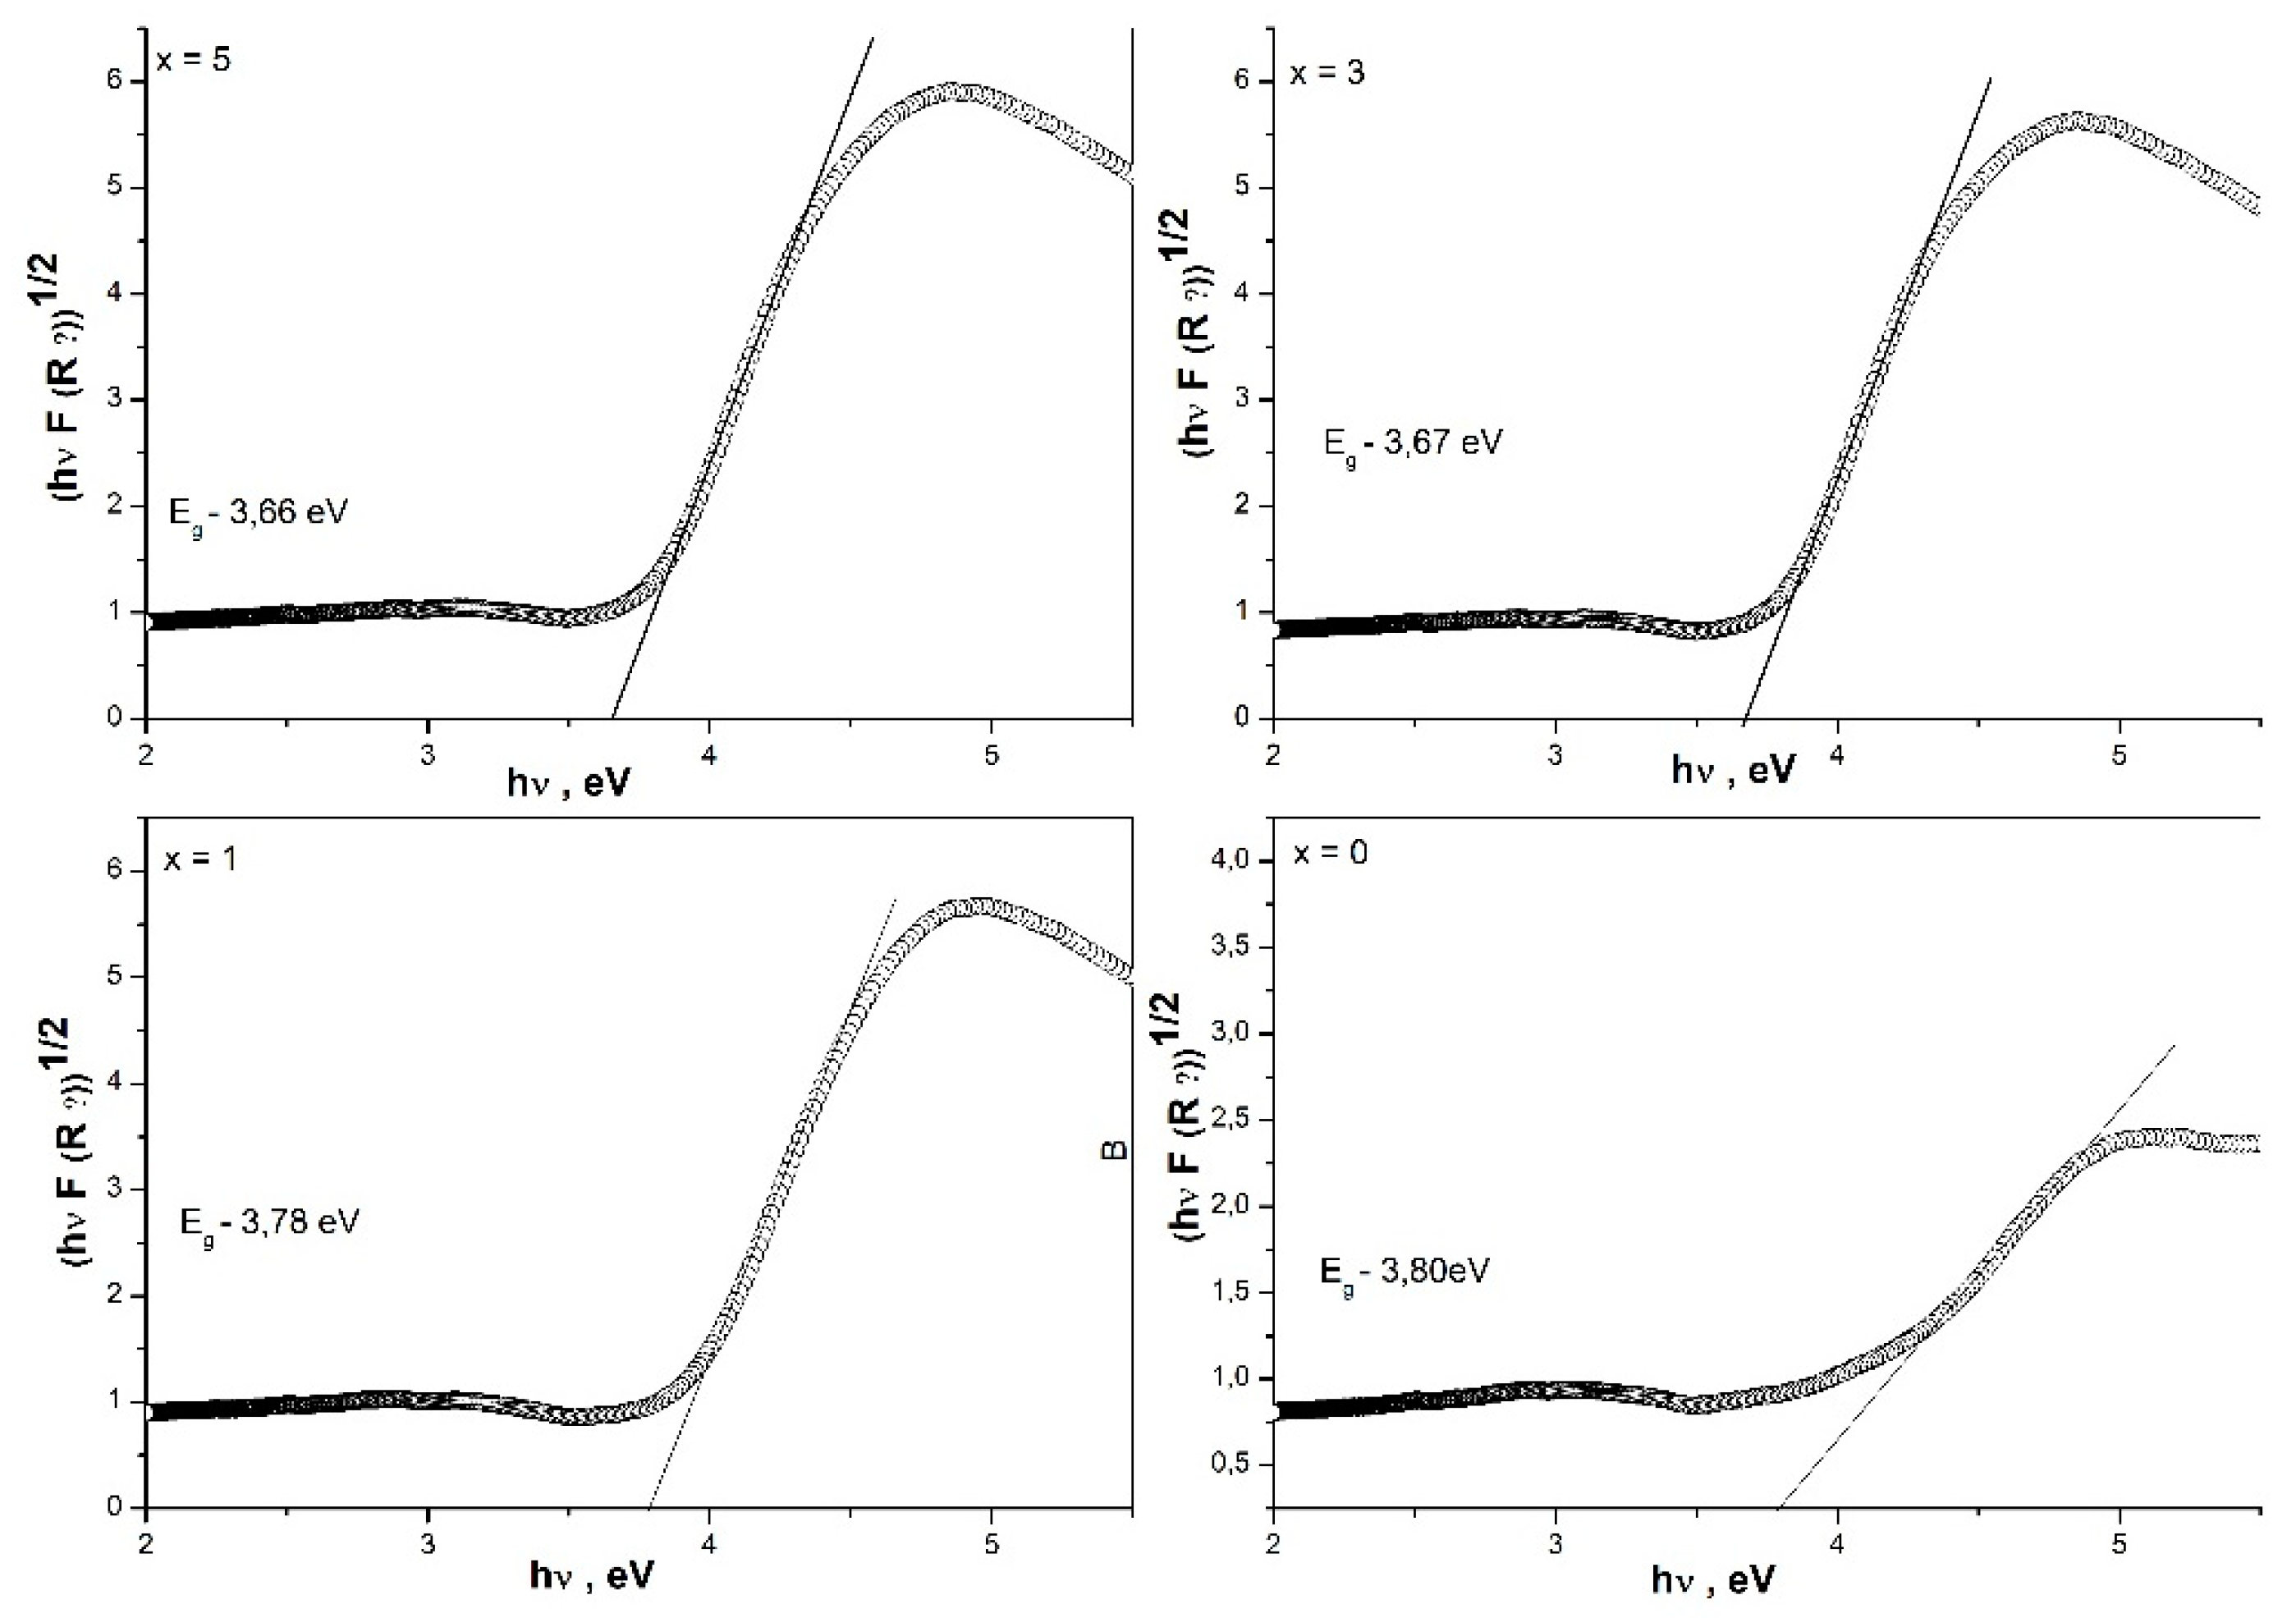
Figure 7.
EPR spectra of glasses 50ZnO:(50-x)B2O3:0.5Eu2O3:xNb2O5, (x= 3 and 5 mol %).
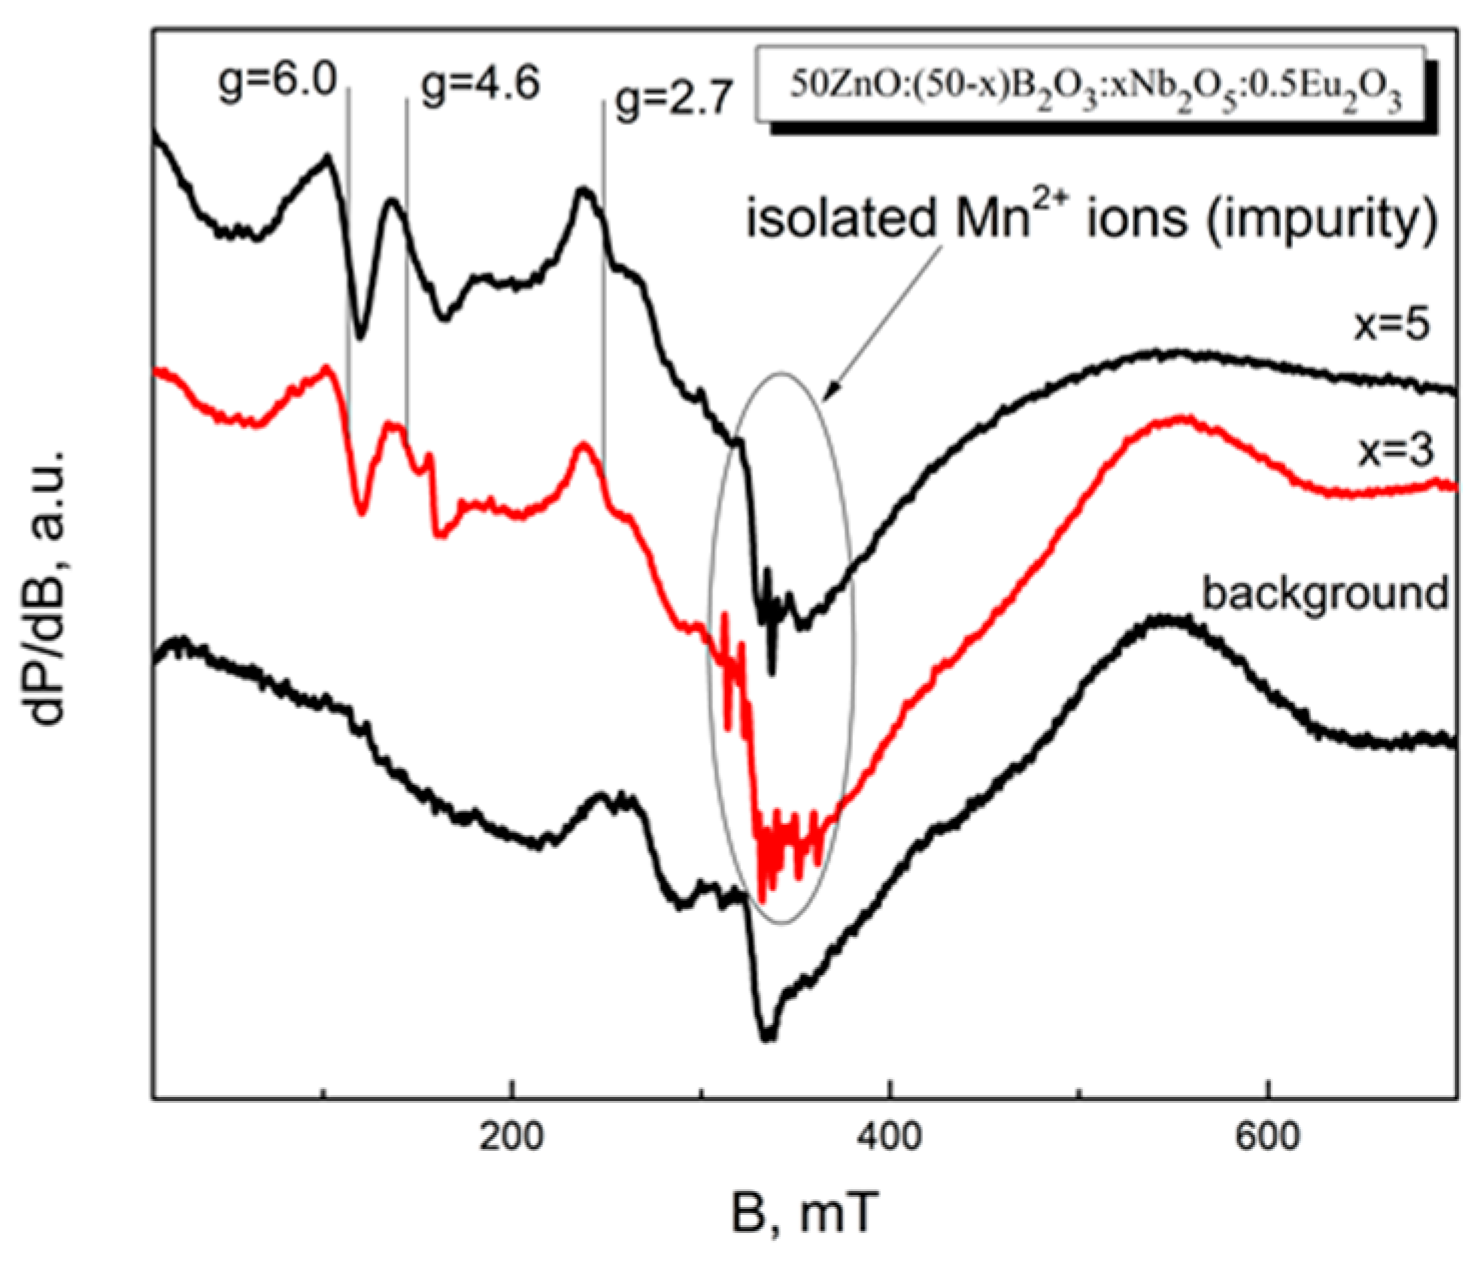
Figure 8.
Figure 5. Optical transmission spectra at room temperature in the range of 250 nm - 900 nm of glasses 50ZnO:(50-x)B2O3:0.5Eu2O3:xNb2O5, (x=0, 1, 3 and 5 mol %).
Figure 8.
Figure 5. Optical transmission spectra at room temperature in the range of 250 nm - 900 nm of glasses 50ZnO:(50-x)B2O3:0.5Eu2O3:xNb2O5, (x=0, 1, 3 and 5 mol %).
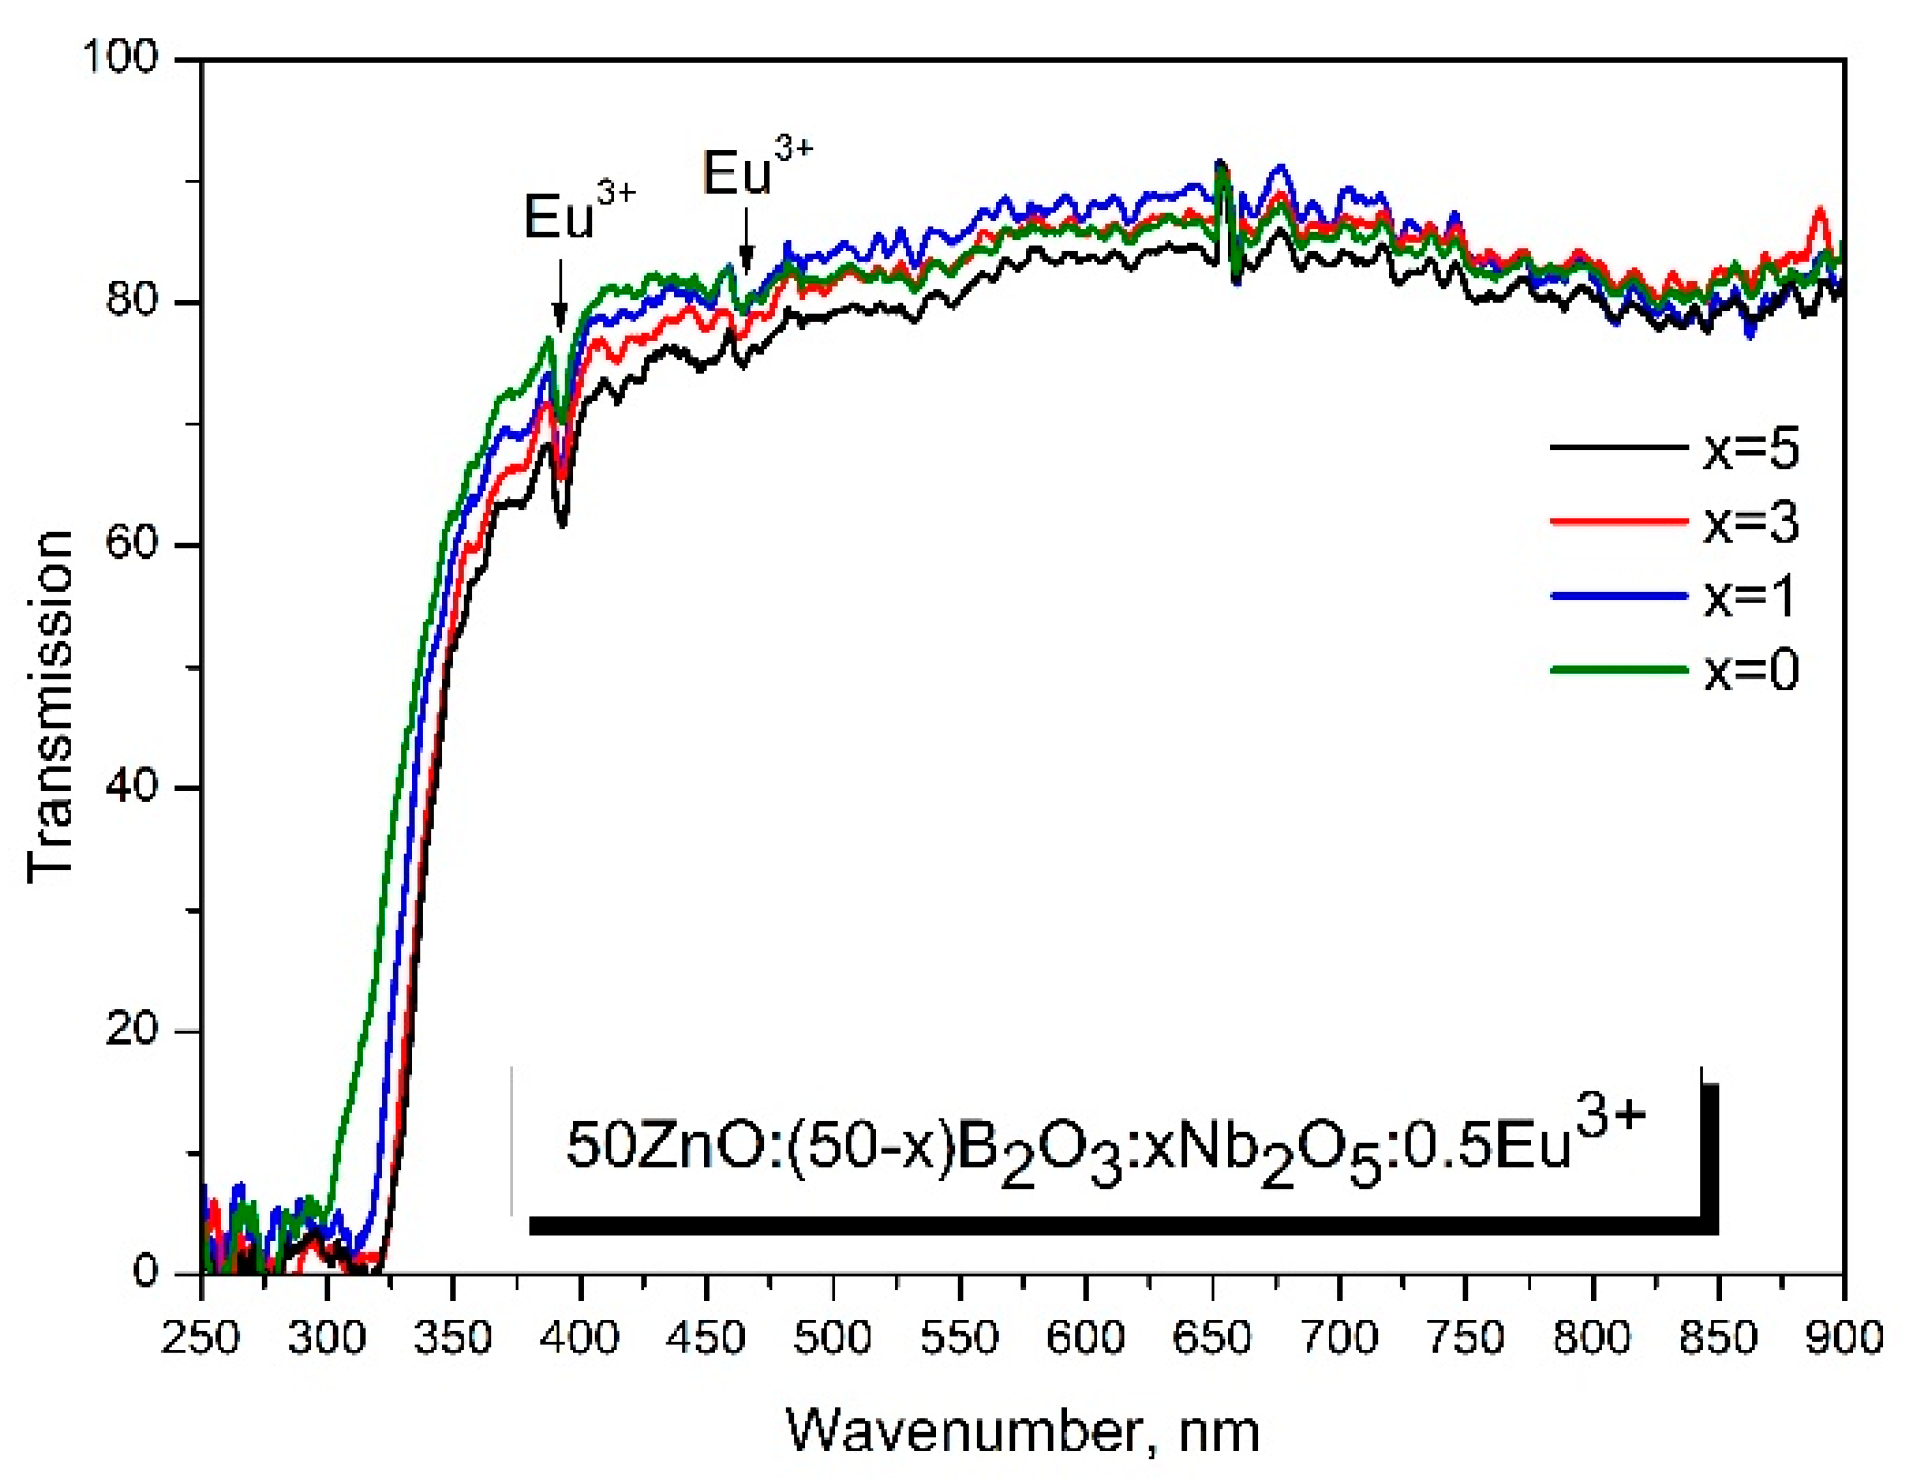
Figure 9.
Excitation spectra of 50ZnO:(50-x)B2O3: xNb2O5:0.5Eu2O3 (x= 0, 1, 3 and 5 mol%) glasses.
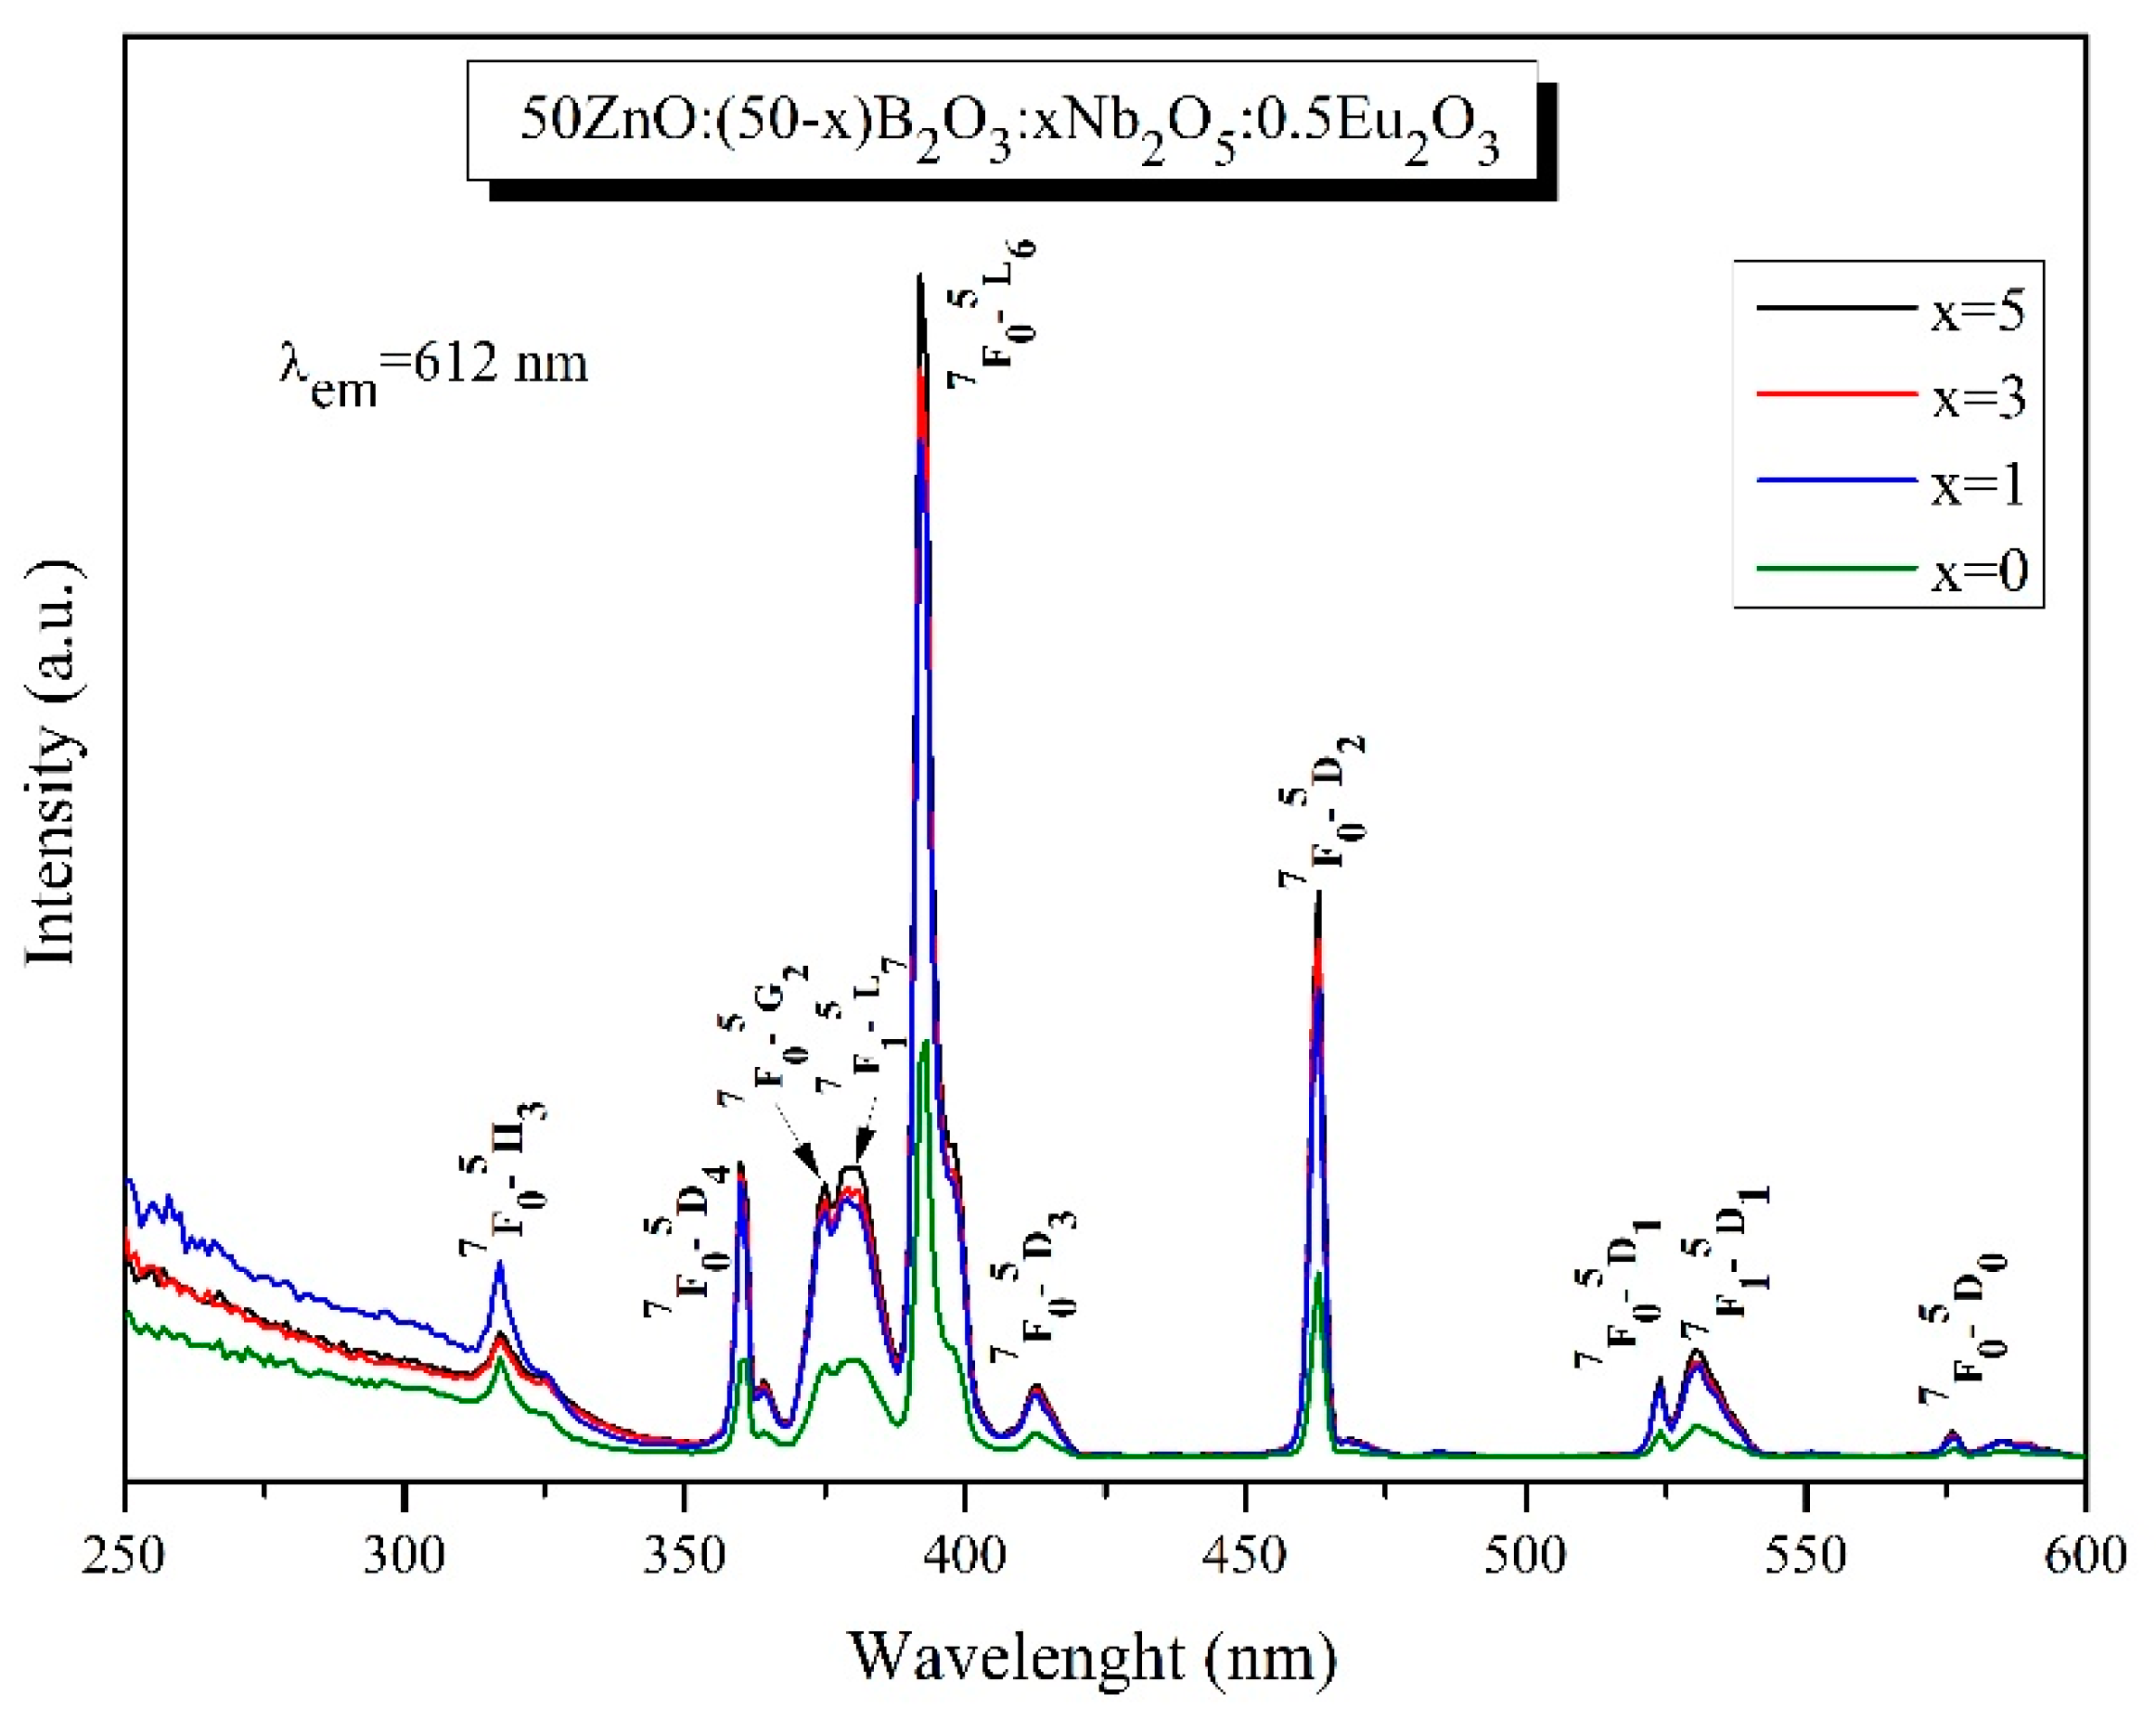
Figure 10.
Emission spectra of 50ZnO:(50-x)B2O3: xNb2O5:0.5Eu2O3:, x= 0, 1, 3 and 5 mol% glasses.
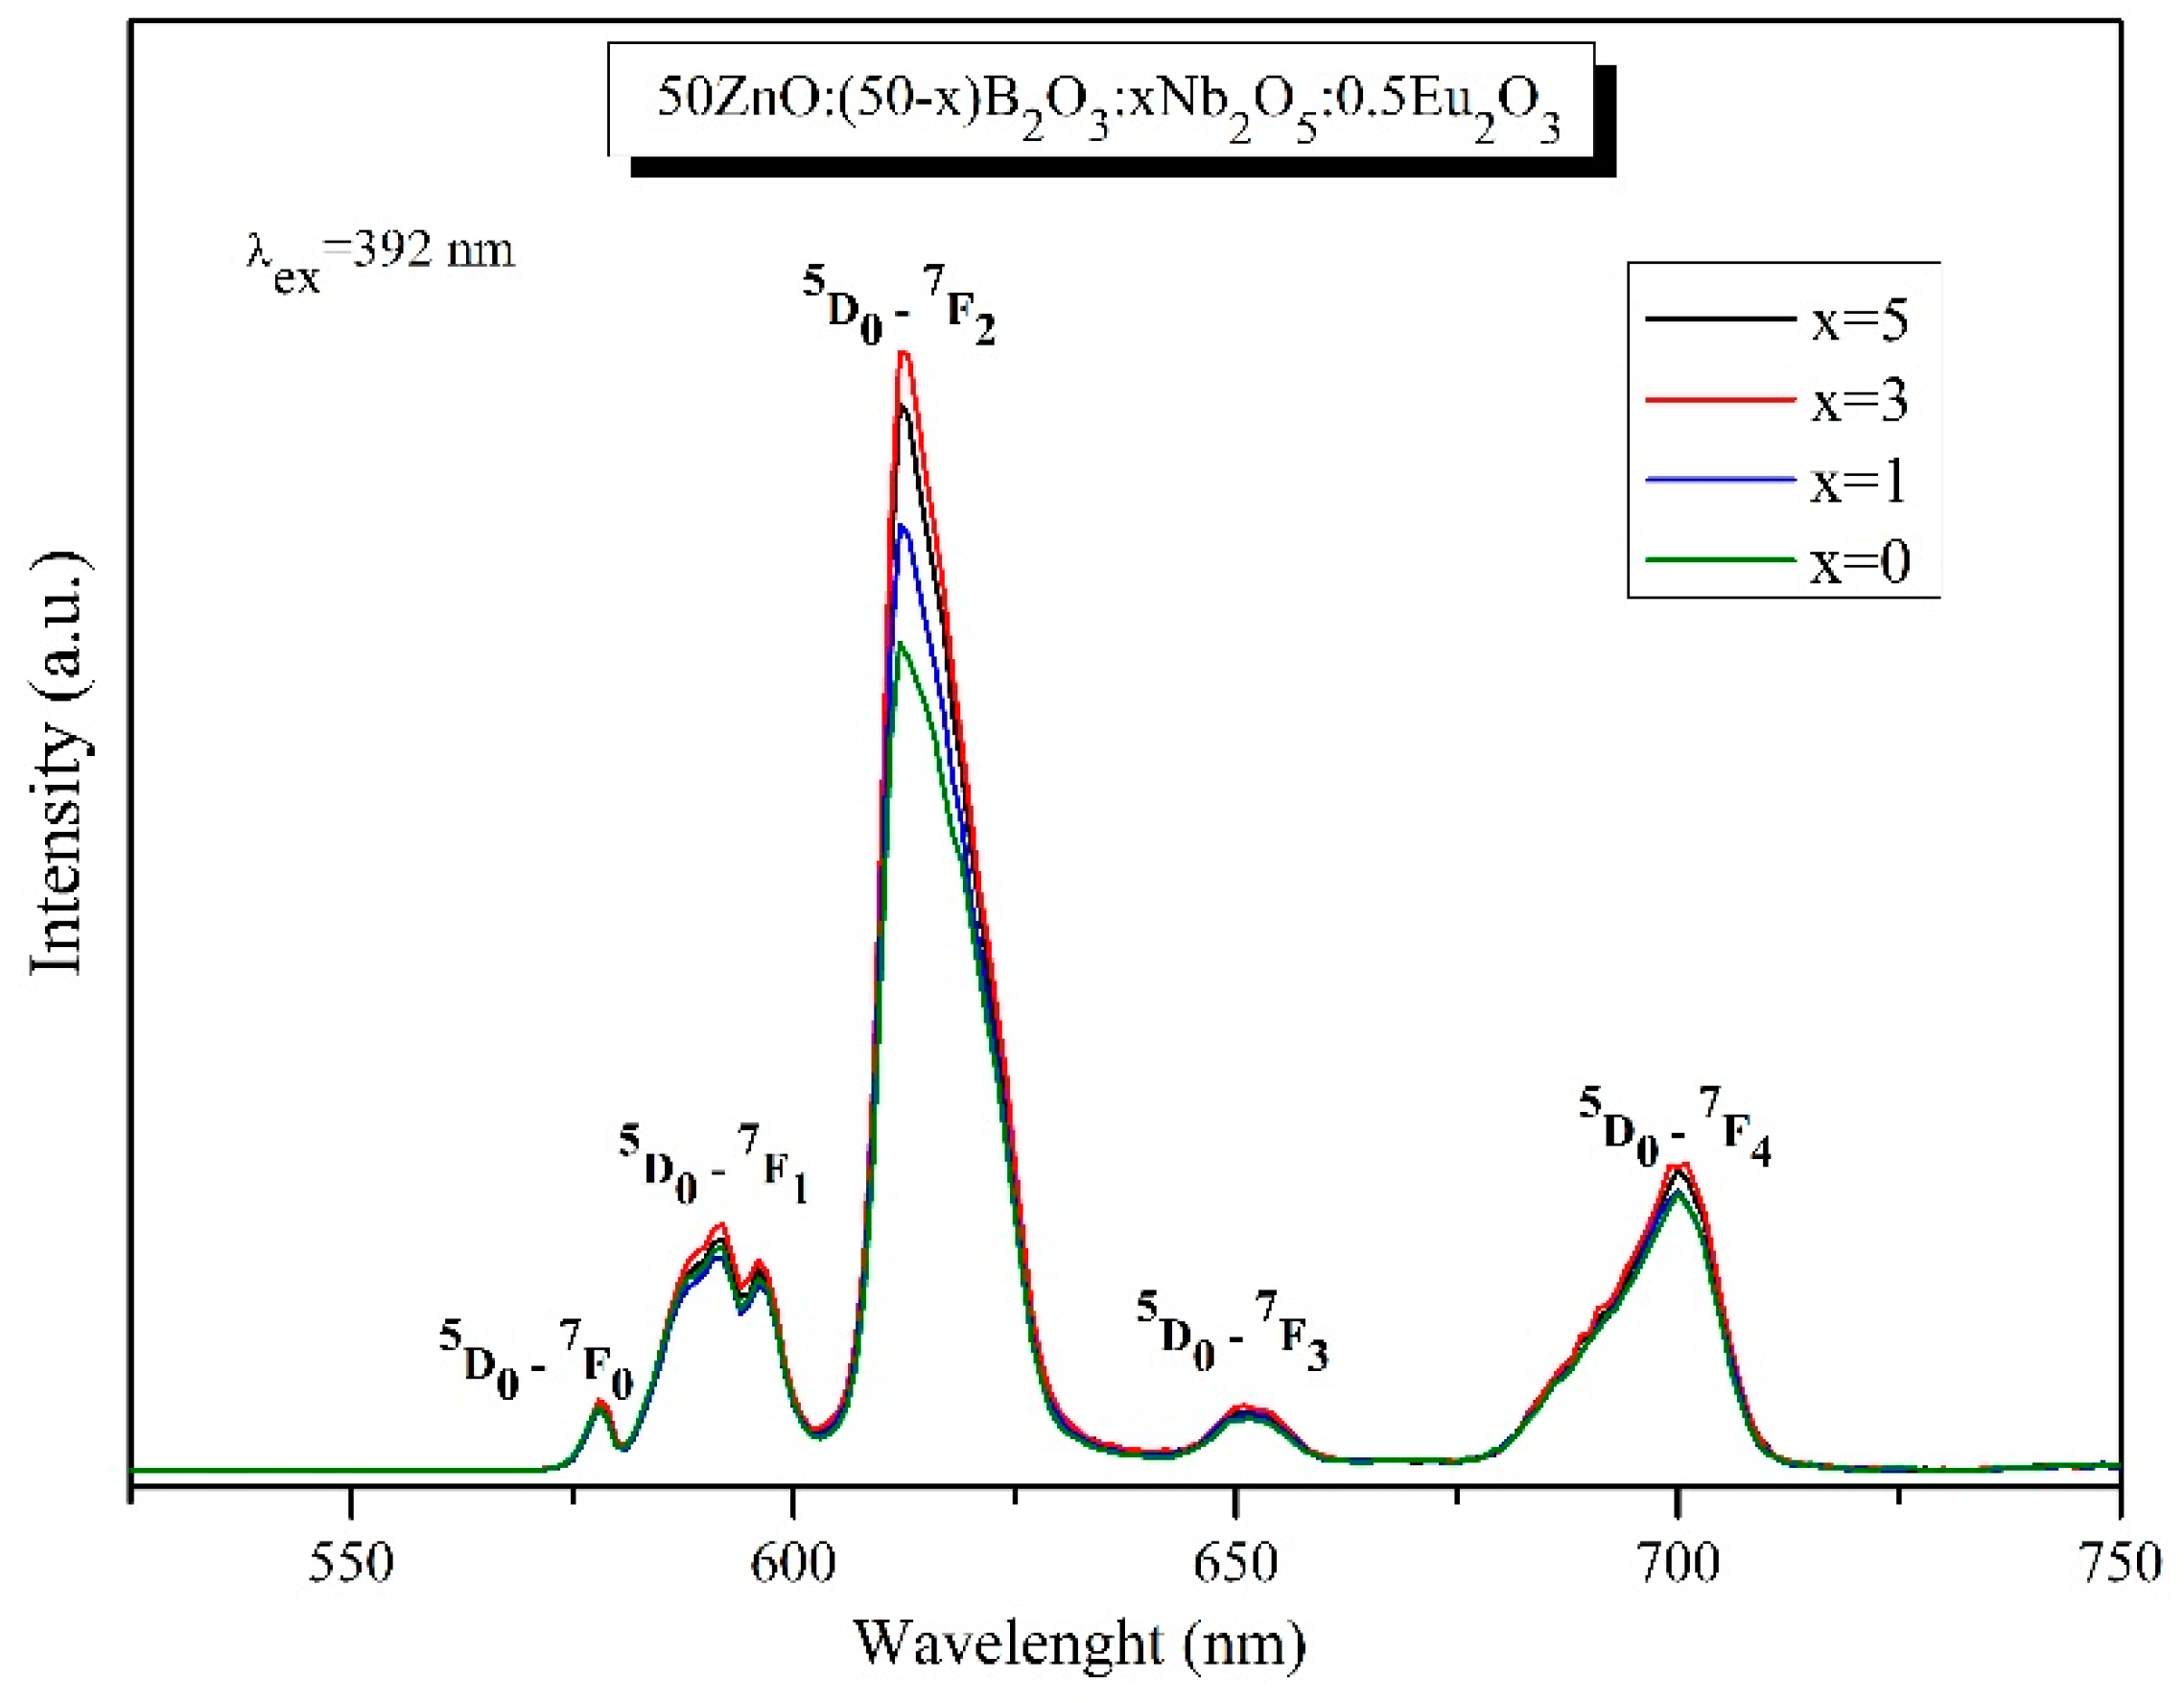
Figure 11.
CIE chromaticity diagram of 50ZnO:(50-x)B2O3: xNb2O5:0.5Eu2O3 (a) x= 0, (b) x=1, (c) x=3, (d) x=5 glasses.
Figure 11.
CIE chromaticity diagram of 50ZnO:(50-x)B2O3: xNb2O5:0.5Eu2O3 (a) x= 0, (b) x=1, (c) x=3, (d) x=5 glasses.
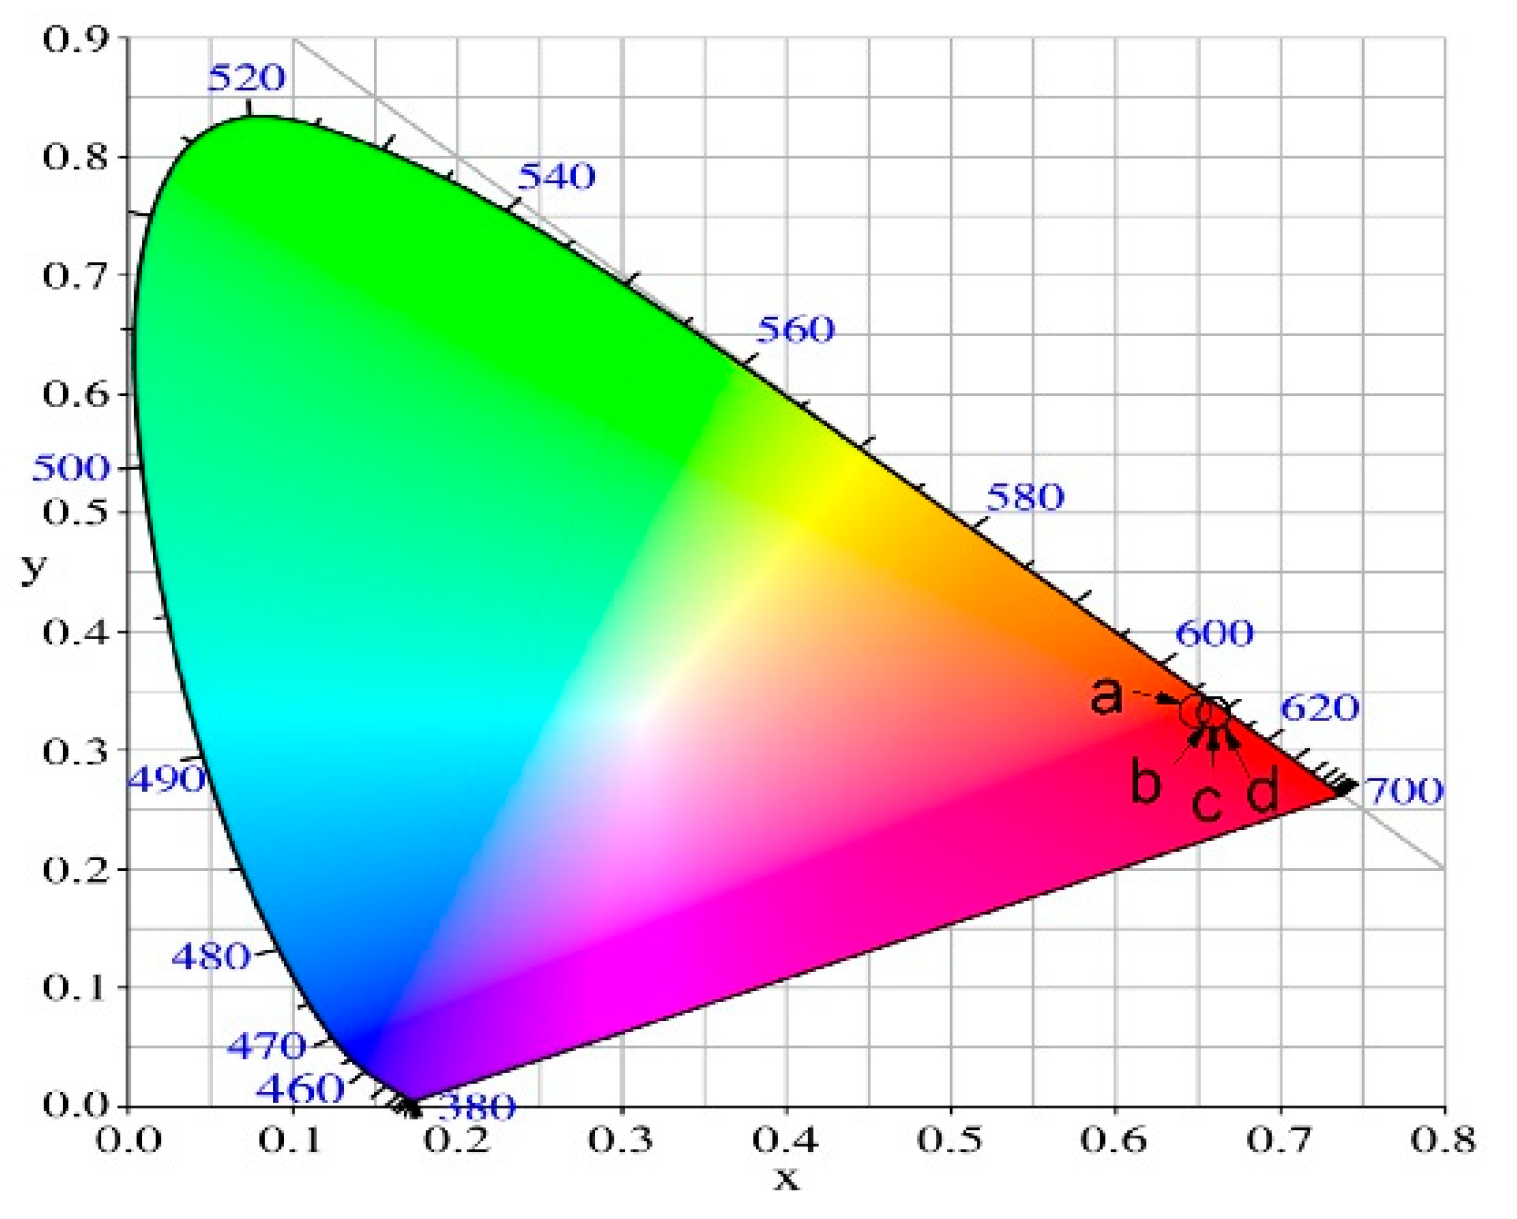
Table 1.
Values of physical parameters of glasses 50ZnO:(50-x)B2O3:0.5Eu2O3:xNb2O5, (x=0, 1, 3 and 5 mol %): density (ρg), molar volume (Vm), oxygen molar volume (Vo), oxygen packing density (OPD).
Table 1.
Values of physical parameters of glasses 50ZnO:(50-x)B2O3:0.5Eu2O3:xNb2O5, (x=0, 1, 3 and 5 mol %): density (ρg), molar volume (Vm), oxygen molar volume (Vo), oxygen packing density (OPD).
| Sample ID | ρg (g/cm3) |
Vm (cm3/mol) |
Vo (cm3/mol) |
OPD (g atom/L) |
|---|---|---|---|---|
| x = 0 | 3.413±0.001 | 22.634 | 11.261 | 88.804 |
| x = 1 | 3.567±0.001 | 22.208 | 10.940 | 91.408 |
| x = 3 | 3.663±0.001 | 22.697 | 10.965 | 91.201 |
| x = 5 | 3.665±0.001 | 23.755 | 11.258 | 88.823 |
Disclaimer/Publisher’s Note: The statements, opinions and data contained in all publications are solely those of the individual author(s) and contributor(s) and not of MDPI and/or the editor(s). MDPI and/or the editor(s) disclaim responsibility for any injury to people or property resulting from any ideas, methods, instructions or products referred to in the content. |
© 2024 by the authors. Licensee MDPI, Basel, Switzerland. This article is an open access article distributed under the terms and conditions of the Creative Commons Attribution (CC BY) license (http://creativecommons.org/licenses/by/4.0/).
Copyright: This open access article is published under a Creative Commons CC BY 4.0 license, which permit the free download, distribution, and reuse, provided that the author and preprint are cited in any reuse.


