
Submitted:
02 January 2025
Posted:
03 January 2025
You are already at the latest version
Abstract
The effects of biochar on heavy polymetallic contamination in Albic Glossic Retisols with varying humus content is evaluated using ecotoxicological and microbiological parameters. Soils were contaminated with elevated levels of Cu, Zn, and Pb at concentrations five and ten times higher than Russia's Approximate Allowable Concentrations (AAC). Biochar application significantly reduced ecotoxicity in low humus soil, or S2 (1.30% Corg), at 5 AAC, leading to a 25% increase in plant root length and a 54% rise in root biomass. However, at 10 AAC, heavy metals completely inhibited these test responses. In highly humified soil, or S1 (3.86% Corg), biochar did not significantly improve ecotoxicological or microbiological parameters regardless of contamination levels. A significant positive impact on microbial functional activity was observed only in the low humus soil (S2), with a 38% increase in microbial biomass carbon (Cmic), a 15% rise in basal respiration, and a 25% decrease in qCO2 under elevated heavy metal concentrations. Microbiome's functional diversity indicator, such as substrate utilization spectra, showed a 36% increase in S1 and a 54% increase in S2 due to biochar. The results suggest that the sensitivity of these indicators to biochar amendments depends on both soil contamination levels and humus content.
Keywords:
ecotoxicity
; pollution
; heavy metals
; microorganisms
; biodiversity
; community level physiological profiling (CLPP)
1. Introduction
The pollution by heavy metals is a serious threat to environmental ecosystem and human health because of its persistence and concealment. Therefore, the efficient elimination of heavy metals from water and soil has been a hot issue of the public for many years [1-6]. Because heavy metals are difficult to be biodegraded or transformed, adsorption and immobilization have become the focus of researchers as the most promising treatment methods in recent years [7].
Biochar is often used as an essential component of a cost-effective remediation strategy aimed at restoring the ecological functions of soils. Its primary roles include efficient adsorption of contaminants and improvement of the physical and agrochemical properties of the soil, particularly through moisture retention. Produced by the pyrolysis of biomass (plant residues, organic waste, and sewage sludge) at high temperatures in an oxygen-deficient environment, biochar is a porous carbon material characterized by a highly aromatic structure and a significant carbon content ranging from 70% to 99%. The remarkable sorption properties of biochar, which are primarily influenced by the pyrolysis temperature and feedstock composition, enable it to efficiently sequester organic and inorganic pollutants in soil and water systems [3,4,5,7].
The universal efficacy of biochar application across different soil conditions and contamination levels has not yet been conclusively established. With the escalating impact of anthropogenic activities and the resulting increase in soil stress, combined with the increasing exposure to contaminants such as heavy metals, there is an urgent need for a comprehensive and site-specific approach to restoring natural soil properties in disturbed environments [6].
Previous studies have investigated the efficacy of biochar, both individually and in combination with lignohumate, in soils contaminated with heavy metals at a concentration of 5 times the Approximate Allowable Concentration (AAC) [8,9]. However, there is limited data on its effectiveness at higher levels of contamination. Moreover, the lack of a federal certification system for products containing biochar in Russia highlights the importance of conducting thorough evaluations to assess their efficacy in specific soil conditions.
The main objective of this study was to investigate the remediation capacity of biochar under different soil conditions, specifically focusing on varying levels of polymetallic contamination and soil humus content. The effectiveness of the remediation was evaluated by examining the microbiological activity of the soils, the functional diversity of the microbiota, and the response of standardized test systems involving plants and invertebrates].
2. Materials and Methods
Soils. To study the effect of biochar on the biotic properties of soils, samples were collected from the arable horizon of agricultural sandy podzolic soils (Albic Glossic Retisols (Loamic, Aric, Cutanic, and Ochric) with varying humus content. The soil samples were collected from two geographically separate fields located in the Moscow region, specifically in the Solnechnogorsky District at the Lomonosov Moscow State University Educational and Experimental Soil-Ecological Center "Chashnikovo." One field, designated as S1 (56°02'01.9°N/37°10'04.9°E), had a high soil organic carbon content (Corg) of 3.86%, indicating strong humification. The other field, named S2 (56°01'41.7°N/37°11'04.3°E), had a lower soil humus content, approximately one-third of S1, with a Corg value of 1.30%.
For mesocosm experiments, the samples were freed from course plant fragments, sieved through a 5-mm sieve, and adjusted for moisture by distilled water to soil pressure of 300 kPa (pressure plate method) and subjected to pre-incubation at 22°C for five days prior to the addition of metal salts and remedial treatments. Duplicate 200 g soil samples were dosed with heavy metal salts. In this study, heavy metal salts (PbCl2, ZnSO4, and CuSO4) were used as model contaminants. A mixture of these salts was introduced as aqueous solutions to achieve a concentration equivalent to approximately five times the AAC for each of the three elements. The AAC values used were as follows: Cu – 132, Zn – 130, and Pb – 220 mg/kg according to SanPiN 1.2.3685-21 Hygienic standards and requirements for ensuring safety and (or) harmlessness to humans from environmental factors in Russian Federation. More details of the sampling scheme, sample preparation, and initial characterization procedures can be found in [8].
In an alternative variation, the same salts were added to the soils to obtain 10 times the AAC of the heavy metal (HM) cations. The selection of the doses was based on the tabulated values provided by the SanPiN 1.2.3685-21 - sanitary rules and norms for HM in near neutral, neutral loamy, and clayey soils (with pHKCI > 5.5), since the soils studied had near neutral pH values (S1 - 6.7, S2 - 6.3) and belonged to the category of medium loams according to their granulometric composition. The uncontaminated part of the soils served as a control. After a 7-day incubation period, biochar (B) was added at a rate of 5% of the soil sample weight, according to the manufacturer’s recommendations
The biochar used in our experiments was produced by pyrolysis of birch wood and had a particle size of 2-8 mm. The biochar, obtained from LLC "Metacom" in Russia, had the following composition: 88.2% fixed carbon, 0.44% nitrogen (N), 0.82% hydrogen (H), 0.19% sulfur (S), 2.8% ash, and 3% water content. The pHCaCl2 value was measured at 8.9, and the carbon-to-nitrogen (C/N) ratio was 21.4. The biochar contained minimal amounts of Cu, Zn, and Pb cations, not exceeding 0.02% of its total mass.
Aqueous extracts of 12 samples required for standard biotesting were prepared in the ratio the soil to distilled water 1:4. After shaking for 2 hours and filtering through a filter (pore diameter 3.5 microns), the extracts had the pH and mineralization characteristics presented in Table 1.
The chronic phytotoxicity of soils was assessed in pots according to ISO 22030-200. Plastic pots were filled with 250 g of air-dry soil, and 10 seeds of white mustard seeds Sinapis alba L. were sown. The duration of the exposure was 30 days; the temperature was from 22 to 28°C. We determined the shoots length and phytomass the test plant.
The acute phytotoxicity of the soils was assessed using the S. alba response according to the Phytotest kit protocol (manufactured by MicroBioTests Inc.) modified for the Russian Federation (according to ISO 18763). Each test plate had two identical compartments, upper and lower, for growing shoots and roots, respectively, measuring 13.5 × 8.5 × 0.8 cm (length × width × height). The lower compartment was fitted with filter paper impregnated with eluate and plant seeds were placed in it. Dicotyl white mustard (Sinapis alba L.) was used for test species, as is the international practice. The plates were incubated at 22–24°C for 96 h. At the end of the exposure, the length of roots was recorded.
Standard biotests of aqueous soil extracts on hydrobionts Ceriodaphnia affinis Lilljeborg were performed according to the guidelines provided in FR.1.39.2007.03221 as modification of ISO 6341:2012 Water quality — determination of the inhibition of the mobility of Daphnia magna Straus (Cladocera, Crustacea) — acute toxicity test). Aqueous extracts of the soil samples were prepared according to a standard method at a ratio of 1:4 (soil/water). The mixture was vigorously shaken for 2 hours on a Vortex apparatus and allowed to settle for 30 minutes. The resulting supernatant was then filtered through white tape ashless paper filters. The pH and salinity values of the extracts were adjusted to mimic freshwater conditions suitable for testing on aquatic organisms. The survival rate of 20 individuals of Ceriodaphnia was assessed after a 48-hour exposure period for each experimental variant.
A bacterial acute toxicity test was conducted as described previously [10]. Lyophilized bacteria of a designed genetically modified strain of luminous Escherichia coli K12 TG1 carrying lux-operon of luminous soil bacteria Photorhabdus luminescens ZM1 were used. A bioluminescent strain E. coli K-12 TG1hsdR17 hsdM thi relA1 supE44 Δ(lac-proAB) F’(traD36 proAB + lacIq lacΔZM15) (pXen7) was obtained by transformation with a multicopy hybrid plasmid vector pUC18 with an introduced EcoRIDNA fragment from Ph. luminescens ZM1 with the size of approximately 7 kb. This genetically modified strain of E. coli К12 TG1 encodes the entire lux-operon of Ph. luminescens ZM1 with luxCDABE structural genes [11]. The strain was produced and stored in the collection of the Microbiology Department of the Faculty of Biology, Moscow State University [12]. The lyophilized bacterial cells were used after rehydration for 30 min in 10 mL of cooled sterile distilled water (pH 7.4), and a suspension of 2.3–2.7 × 10⁷ cells mL−1 was used. The density of the bacterial suspension was measured using a photoelectric colorimeter (λ = 670 nm) and expressed as the number of cells in mL, according to the calibration curve constructed beforehand. Bacterial suspension (0.1 mL) and 0.9 mL of PE test solutions (or distilled water as control) were placed into vials, and the luminescence intensity (I) was measured after 30 min of exposure using a Biotoks-6MS luminometer (Russia) recording it in counts per second [12,13].
The functional responses of the microbial community were evaluated using gas chromatographic analysis, specifically by quantifying the basal respiration (BR) and substrate-induced respiration (SIR) intensities on a CrystalLux 4000M instrument. In addition, the carbon content of the microbial biomass (Cmic) and its specific respiration rate (qCO2) were determined. Calculation of Cmic (microbial biomass carbon) and BR was based on the weight of dry soil (dried at 105°C for 2 hours). For a full description of the methods used, the reader is referred to the detailed presentation in Terekhova et al. (2021а]
To assess the functional diversity of the microbiome, we employed Community Level Physiological Profiling (CLPP) assay - multisubstrate testing (MST) based on standard protocols (FR.1.37.2010.08619; PND FT 16.1.17-10 M., 2010). The samples were prepared and analyzed according to previously described methods [8,14]. Several indicators were used to assess the functional diversity of the microbiome. These parameters included diversity (N), which quantifies the number of consumed substrates in a range from 0 to 47; average metabolic work (W), calculated by summing the optical densities of cells with consumed substrates and dividing by their number; and the rank distribution coefficient of the substrate utilization spectra (d), which serves as a measure of system destabilization or perturbation, with values ranging from 0.01 to 2.00. In the microbial systems studied, the d coefficient serves as a valuable indicator of the health and stability of the soil microbial community, with lower values indicating a thriving and stable community. Conversely, higher values of the coefficient indicate the presence of a disruptive factor affecting the microbial system. Based on the d coefficient, microbial communities can be classified as either good (d = 0.01-0.4) depressed (d = 0.4-0.8), stressed (d = 0.8-1) or damaged (d >1) according to the classification proposed by Gorlenko in [14].
Data analysis and visualization were performed using Statistica 13.0 and Microsoft Excel 2013 software packages. The ECO-LOG software was used for the calculation and visualization of functional diversity indicators. Plant growth parameters and soil microbiological indicators were measured in triplicate, while hydrobiont survival was assessed in four replicates. Substrate testing was performed using mixed samples of each variant of the soils studied, with each variant represented by two containers. Statistical comparisons of SIR, Cmic, and BR values among experimental variants (biochar, HM) were performed using one-way analysis of variance (ANOVA) followed by pairwise multiple comparisons of means using Tukey's test. Cluster analysis of samples based on substrate utilization spectra was performed using the Euclidean distance metric and the Ward clustering procedure. Statistical hypotheses were tested at a significance level of 0.05.
3. Results
This section may be divided by subheadings. It should provide a concise and precise description of the experimental results, their interpretation, as well as the experimental conclusions that can be drawn.
3.1. Biochar's Impact on Phytotoxicity in Soils with Diverse Polymetallic Contamination Levels
In this chronic phytotoxicity study, the incorporation of biochar into both S1 and S2 soils contaminated with HM resulted in notable improvements in several plant growth parameters, including shoot length, and phytomass. In particular, in the S2 soil, the plant growth parameters surpassed those of the uncontaminated soil (control), with a notable 25% increase in shoot length and a remarkable 54% increase in crude phytomass (Figure 1
The level of heavy metal hazard was evaluated based on the phytotoxic effect, Ie (inhibition effect), calculated from the change in root length of S. alba in acute phytotoxicity test. In soils with high Corg content at a HM concentration of 5 AAC, Ie was determined to be 48.8%, and no remedial effect of biochar was observed. However, at a dose of 10 AAC, biochar application showed a positive effect in both soils, with a more pronounced effect observed in the weakly humified soil (S2 Ie: 48.9%, S1 Ie: 37.1%) (Table 2).
3.2. Biochar's Impact on Ecotoxicity of Aqueous Soil Extracts in Standard Bioassays
Analysis not only of solid soil mass, but also of water extracts of soil samples gives a more comprehensive comparative estimation of the detoxifying capacity of biochar. This is required by the standards on the safety of soil ecotechnologies because water migration pathway is the main in the spread of toxicants and xenobiotics in soils (sanitary regulations and standards SanPiN 1.2.3685-21 “Hygienic standards and requirements to environmental factors for provision of the safety and/or innocuousness for humans).
Biotests conducted on Ceriodaphnia revealed the presence of toxicity in samples with 5 and 10 AAC of HM in both soil types, with the weakly humified soil exhibiting significantly higher toxicity levels (Figure 2a). However, the addition of biochar resulted in a decrease in toxicity in the HM-contaminated S1 soil. In the presence of biochar, no toxicity was observed at the 5 AAC dose of HM. Although the detoxifying effect of biochar was less pronounced in the soil with 10 AAC of HM, it still resulted survival.
Biotests carried out on Ceriodaphnia revealed the presence of toxicity in samples with 5 and 10 AAС HMs in both types of soils, with weakly humified soil demonstrating significantly higher levels of toxicity (Figure 2a). The addition of biochar led to a decrease in toxicity in S1 soil at the 5 AAC dose of HM by 7%, and in the same soil S1 at a dose the 10 AAC biochar increased the survival rate Ceriodaphnia in a 15%.
The weakly humified S2 soil samples with HM exhibited the highest toxicity to Ceriodaphnia (Figure 2a). At a high dose of HM, the S2 soil samples resulted in 100% mortality of the test organisms. The addition of biochar improved survival only in the 5 AAC HM variant (from 25% to 65%).
Significant differences between the two soils were also observed in the bacterial biotests (Figure 2b). In the weakly humified soil S2, a dosage of 5 AAC HM resulted in a 50% reduction in luminescence, while 10 AAC HM completely suppressed the test function. The incorporation of biochar resulted in a marginal (5.8%) increase in luminescence at the highest contamination concentration, while its detoxifying effect at 5 AAC HM was minimal (0.6%).
In the highly humified soil S1, the initial luminescence of the bacteria was slightly lower than in soil S2. The high dose of HM inhibited bacterial development by over 30%, while the dose of 5 AAC HM had no effect on the luminescence in this soil. The introduction of biochar into the soil in the presence of both 5 and 10 AAC HM did not result in any discernable beneficial effects.
The lower toxicity of HM in highly humified soil can be attributed to its higher organic matter content, which provides a greater number of sorption sites capable of effectively binding HM. Similar observations have been reported in previous studies [8,9]. Furthermore, the bioavailability of HM is strongly influenced by soil acidity, which was lower in soil S2.
Thus, the toxicity assessment results obtained from the biotesting of aqueous extracts are consistent with the phytotoxicity data obtained from the seed germination tests on higher plants.
3.3. Biochar's Impact on Soil Microbiomes at Various Levels of Polymetallic Contamination
The efficacy of biochar under different doses of HM and soil humus content was evaluated using microbiological indicators such as basal respiration, microbial biomass, and metabolic coefficient.
The carbon content of microbial biomass Cmic (μg C/g soil) measured by substrate-induced respiration (SIR), showed a significant decrease with increasing HM concentration from 5 to 10 AAC in both soil types. Specifically, in the humus-rich soil (S1), the application of HM at 5 AAC resulted in a 19% reduction in microbial biomass, while in the humus-poor soil (S2), the reduction was 39%. With a HM dose of 10 AAC, the reductions in microbial biomass were even more pronounced, with reductions of 45% in S1 and 43% in S2 (Table 3).
The basal respiration rates in the original soils S1 and S2 were nearly identical, averaging 0.93 and 0.92 μg C-CO2/(g h), respectively (Table 3). The addition of HM in the S1 soil led to a decrease in the basal respiration rate by a factor of 1.3-1.5, whereas in the S2 soil, the decrease ranged from 1.3 to 1.8. Notably, in the HM-contaminated humus-rich S1 soils, the application of biochar resulted in a greater reduction in the basal respiration rate compared to the HM only variants. Conversely, in the humus-poor S2 soils, the application of biochar led to an increase in the basal respiration rate in the variant with 10 AAC of HM. In uncontaminated strongly humified S1 soils, biochar reduced the basal respiration rate by 1.2 times, whereas in the weakly humified S2 soils, no reduction in this indicator was observed.
The microbial metabolic quotient, calculated as the ratio of basal respiration to microbial biomass, is an inverse measure of the efficiency of substrate utilization by microbial biomass [15]. Numerous studies utilizing qCO2 as a sensitive indicator for HM toxicity have consistently demonstrated higher qCO2 ratios in HM-contaminated soils compared to uncontaminated soils [16,17].
The results obtained for the specific respiration of microbial biomass (qCO2) in the initial S1 soil were approximately 1.5 times lower than those in the S2 soil (qCO2 = 0.37 and 0.54 μg C-CO2/(mg Cmic h), respectively). The higher qCO2 value observed in the uncontaminated S2 soil compared to the S1 soil indicates a compromised functioning of the microbial community (Table 3). Previous international studies have investigated microbial indicators to detect shifts in soil quality [18] and identified a critical range of qCO2 values between 0.5 and 2.0 μg (CO2-C μg/mg Cmic h) for neutral soils.
The introduction of HM led to a significant increase in qCO2 in S1 soil variants with 10 times the AAC of HM, regardless of the presence or absence of biochar, compared to the control. This suggests that biochar had no effect on the microbial quotient. In the S2 soil, the microbial quotient increased by 28% at 5 AAC of HM compared to the control, but the addition of biochar to this sample resulted in a 6% decrease in the microbial quotient relative to the control. No significant changes in the microbial metabolic quotient were observed in the initial S2 soils with the addition of biochar. However, in S1 soils, the introduction of biochar caused a decrease in the specific respiration rate of microbial biomass in the variants without HM and with 5 AAC of HM, compared to the uncontaminated soil (from 0.37 in the control to 0.24 μg C-CO2/(mg Cmic h)).
The Tukey criterion (p) confirmed the validity of the measurements of substrate-induced respiration and, accordingly, the carbon content of microbial biomass. The assessment of substrate-induced respiration yielded more reliable data, as substantial deviations from the control values were generally absent in the majority of cases (data range: 0.066-1.00). However, for basal respiration, there was substantial variation in values in half of the cases (Table 3).
Principal component analysis (PCA) unveiled distinct patterns in the variations of soil microbiota properties resulting from the application of HM and biochar. The first two factors (principal components) were the most significant (eigenvalues > 1) and explained the majority of the variability observed in the experimental data (Figure 3).
Factor 1 mainly represents the continuum of Cmic and SIR variations among soils subjected to different treatments (R2 = 0.75), whereas Factor 2 corresponds to BR (R2 = 0.25). The S1+B and S2+10 AAC HM variants exhibited the most pronounced differences in Cmic and SIR, while contrasting patterns of basal respiration were observed between soil samples from highly humified soil (S1 +5 AAC HM) and weakly humified soil with added biochar (S2).
Thus, the presented graph reveals a clear differentiation between uncontaminated soils (on the left) and HM-amended soils (on the right) along Factor 1. However, the distribution of soil samples along Factor 2 is less conclusive and could be influenced by both the humus status of the soils and the addition of biochar.
3.4. Impact of Biochar on Functional Diversity Indicators of the Microbial Community
The cluster analysis performed on the substrate utilization spectra obtained by MST allowed for the differentiation of the microbial communities in the investigated soils (Figure 4 a,b). Two large, well-defined clusters were observed in soils with high organic carbon content (Figure 4a). These clusters corresponded to two different soil categories: HM-free soils and HM-amended soils. Next level dense separate subcluster forms with contaminated cases with addition of a remediation agent. Same first level clustering we can see in soils with low carbon content (Figure 4b), but in the second level we observe dense cluster with HM contaminated samples.
The quantitative indicators of functional diversity in soil microbial communities, characterized by different levels of soil organic carbon (Corg) and biochar amendments, are presented in Figure 4 с, d. All HM affected samples show worst functional diversity scores for both type of soils. They demonstrate lowest number of substrates consumed (N ) metabolical work (W) and highest level of disturbance (d).
Biochar amendment shows drastic fertilizing effect for control S1 soil shifting functional biodiversity parameters up to maximums. S2 soil not demonstrates such a changes at this case. This can be attributed to the adsorptive properties of biochar, which retains significant amounts of nutrients that can adversely affect the functioning and diversity of the microbial community in low humus soils. Previous research by international scientists has emphasized the importance of water-soluble carbon content and the C/N ratio as critical factors affecting the vitality of the microbial community. The application of biochar increases the C/N ratio, resulting in either enhancement or suppression of microbial activity, depending on the initial carbon content of the soil [19].
Biochar treatment shows meaningful remediating effect improves biodiversity indicators in all HM affected cases For S1 soil HM amendment induce the critical disturbance (d>1) only at 10 AAC but S2 soil been affected hard with both concentrations of pollutant that illustrates protective effect of soil organic.
In general, the application of biochar resulted in a significant reduction of the rank distribution coefficient d in the HM-containing variants of both soils, indicating an enhancing in stability of the microbial systems in the studied soils against external influences.
4. Discussion
Various types of biochar have been widely used to remediate soil contamination from HM and to reduce mobility and bioavailability in soils in recent years. Most researchers have paid attention to the beneficial effects of biochar during the remediation process, but few have emphasized their negative effects and the challenges for their applications.
Biochar is known as a good remediation material, but its effectiveness is not unlimited. Biochar application does not always produce a promising result [2,5,20, 21]. The content of humic substances is of decisive importance the impact of heavy metals, antibiotics, pesticides and other toxicants on biosensors [7,22,23]. The effect of biochar largely depends on the degree of humus content of the soil. In this work, this fact is clearly experimentally proven.
The effectiveness of biochar as a remediation agent was evaluated in agricultural sandy podzolic soil samples with varying levels of humus content and complex heavy metal contamination. A comprehensive set of biological parameters was utilized to evaluate the effectiveness of the remediation process. The selected biodiagnostic parameters represented organisms from three trophic levels: green plants (producers), invertebrates (consumers), and bacteria (decomposers), providing a holistic approach to assessing the ecological quality of the soil. Analysis of the information content of these biological indicators revealed remarkable differences in their responses to heavy metals and biochar application.
Significant differences were observed in the responses of different soil types to both contamination and biochar treatment, as indicated by all the evaluated indices. The application of biochar to agricultural sandy podzolic soil samples with different humus content and complex heavy metal contamination (5 AAC: Cu 660, Zn 1100, and Pb 650 mg/kg; 10 AAC: Cu 1320, Zn 2200, Pb 1300 mg/kg) resulted in changes in ecotoxicological and microbiological parameters.
Our results are consistent with the findings of the study by [8], which demonstrated variation in the response of test plants to polymetallic contamination based on the humus content of the soils. Particularly noteworthy is the greater negative impact of heavy metals on plants in poorly humified soils: at 5 AAC, test plants exhibited germination but experienced significant reductions in biomass and plant height, while at 10 AAC, no growth was observed. Conversely, biochar application had limited efficacy in highly humified soil, but increased biomass, plant height, and germination in weakly humified soils, even at 10 AAC of HM. These results are consistent with previous research conducted on mustard (Sinapis juncea L.), which demonstrated the ability of biochar to immobilize heavy metals such as Cd, Cu, and Pb, while increasing nutrient availability, particularly phosphorus (P) and potassium (K). The study conducted by [24] also documented a reduction in the bioavailability and phytotoxicity of heavy metals, with the most pronounced effects observed in soils characterized by low humus content and low acidity.
A two-factor analysis of variance was used to evaluate the acute phytotoxicity in uncontaminated soils. The results showed significant effects on shoot length attributed to both humus content and the application of the remediation agent. However, root length was found to be influenced solely by the soil humus content. In HM-contaminated soils, shoot length was significantly affected only by the level of humus content, with no noticeable effect of biochar application on this specific indicator of plant development.
Data analysis of root length variation in response to changes in humus content and the application of a remediation agent in HM-contaminated soils at concentrations of 5 and 10 AAC indicates that both factors, humus content and remediation agent, significantly influence root length. Importantly, the results highlight that biochar has a more pronounced effect on soils with lower levels of humus content.
The beneficial effect of biochar on plant development was observed primarily at high contamination levels (10 AAC), with the most significant effect observed in weakly humified soils.
The polymetallic contamination of agricultural sandy podzolic soils with HM led to changes in the functioning of the soil microbiome, characterized by a decrease in microbial biomass and basal respiration rate, and conversely, an increase in the microbial metabolic quotient (qCO2). It has been shown that heavy metals can inhibit sensitive components of the soil microbiota and lead to a decrease in soil respiration [25]. However, there are also observations of increased soil respiration in the presence of certain levels of heavy metals [26]. High values of the microbial metabolic quotient serve as a marker for the stressed state of the soil microbial community. In studies conducted by international researchers on representative soils, it was observed that the addition of cadmium significantly increased the microbial metabolic quotient (qCO2) with rising heavy metal concentrations. Conversely, the ratio of microbial biomass carbon to organic carbon (Cmic/Corg) decreases in soils contaminated with heavy metals, indicating a state of microbial stress induced by the toxicity of these metals [26]. It has been hypothesized that the metabolic quotient is more sensitive to elevated heavy metal concentrations than to microbial biomass. Other studies [27] have reported significant variations in indicators such as microbial biomass and soil activity (basal respiration, enzyme activity, C and N mineralization), highlighting their susceptibility to the toxic effects of heavy metals. The observed variations are influenced by several factors, including the pathways of heavy metal influx and the prevailing soil environmental conditions.
The effect of biochar on microbial community functioning resulted in an increase in carbon content within the microbial biomass in uncontaminated soils, with the most pronounced effect observed in humus-rich soils, which showed a substantial 30% increase compared to the control sample. The positive effect of biochar in mitigating HM contamination in weakly humified soils was found to be more pronounced at higher contamination levels (10 AAC) (Table 3).
The study showed that the influence of biochar on microbial biomass exposed to heavy metal contamination varied depending on the humus status of the soils.
Functional profiling of microbial communities of soils being investigated also demonstrates more drastic fertilizing and remediating in low organic soils there it leads to a positive shift in biodiversity indexes in all cases. For high organic soil biochar effect shows positive thread for contaminated cases but not for intact soil.
5. Conclusion
In the simulated heavy metal contamination of agricultural sandy podzolic soils, followed by biochar treatment of the samples, it was observed that the response of the studied biota to the remediation intervention depends on the level of contamination and the degree of soil humification. In the weakly humified soil, the most significant effect of biochar supplementation was observed in root length elongation of S. alba, while the most significant improvement in plant growth was observed in the highly humified soil at the highest contamination dose. At a lower dose, the viability of aquatic organisms in aqueous extracts from the highly humified soil proved to be a more sensitive test response.
Biochar played a significant role in improving the stability of microbial communities in the studied soils subjected to polymetallic contamination. The results of the principal component analysis, using the collective data of different parameters, showed that the effectiveness of biochar was primarily influenced by the concentration of heavy metals in the soils subjected to polymetallic contamination (R2 = 0.75).
Microbial functional Biodiversity indexes also demonstrate significant remediation effect of biochar in all HM polluted cases.
Given the influence of contamination level and soil humification on the sensitivity of biodiagnostic indicators to the remediation agent, a comprehensive assessment of the effectiveness of biochar-based remediation in soils with different degrees of humification requires the integration of a diverse set of biotic parameters. These parameters should include plant growth characteristics, microbial biomass indicators, and the functional diversity of the microbial community.
Author Contributions
Mikhail Gorlenko: Data collection, Data analysis and interpretation, Drafting the article. Irina Kozlova: Data collection, Data analysis and interpretation, Drafting the article. Svetlana Kulachkova: Data collection, Data analysis and interpretation. Vera Terekhova: Conception or design of the work, Data analysis and interpretation, Critical revision of the article, Final approval of the version to be publish. All authors have read and agreed to the published version of the manuscript.
Funding
This research received no external funding.
Ethics approval
Not applicable.
Competing interests
The authors declare that they have no known competing financial interests or personal relationships that might influence the research reported in this paper.
Availability of data and materials
Available.
Acknowledgments
The authors thank Andrei Tchourakov for his help in translation the text of article and Elisaveta Derevenets for correcting the list of references.
Conflicts of Interest
The authors declare no conflicts of interest.
References
- Yuan, P., Wang, J., Pan, Y., Shen, B., Wu, C. Review of biochar for the management of contaminated soil: Preparation, application and prospect. Science of the total environment 2019, 659, 473-490. [CrossRef]
- Wang, Y., Liu, Y., Zhan, W., Zheng, К., Wang, J., Zhang, Ch., Chen, R. Stabilization of heavy metal-contaminated soils by biochar: Challenges and recommendations. Science of the total environment 2020, 729. [CrossRef]
- Erdem, H. The effects of biochars produced in different pyrolsis temperatures from agricultural wastes on cadmium uptake of tobacco plant. Saudi Journal of Biol Sci 2021, 28, 3965-3971. [CrossRef]
- Tan, X. F., Zhu, S. S., Wang, R. P., Chen, Y. D., Show, P. L., Zhang, F. F., Ho, S. H. Role of biochar surface characteristics in the adsorption of aromatic compounds: Pore structure and functional groups. Chinese Chem Let 2021, 32, 2939-2946. [CrossRef]
- He, M., Xu, Z., Hou, D., Gao, B., Cao, X., Ok, Y. S., Rinklebe, J, Bolan, N. S, Tsang, D. C. Waste-derived biochar for water pollution control and sustainable development. Nat Rev Earth Environ 2022, 3, 444-460. [CrossRef]
- Kumar, A., Ramamoorthy, D., Kumar, N., Verma, R., Kumar, A., Verma, D. K., Jayabalan, I., Marwein, B. M., Jaiswal K. K. Investigation on the potential of eco-friendly bio-char for amendment in serpentine soils and immobilization of heavy metals contaminants: a review. Biomass Conv. Bioref. 2023, 13, 16585-16605. [CrossRef]
- Liu, Z., Xu, Z., Xu, L. et al. (2022). Modified biochar: synthesis and mechanism for removal of environmental heavy metals. Carbon res 2022, 1, 8. [CrossRef]
- Terekhova, V. A., Prudnikova, E. V., Kulachkova, S. A. et al Microbiological indicators of heavy metals and carbon-containing preparations applied to agrosoddy-podzolic soils differing in humus content. Eurasian Soil Sci. 2021a, 54, 448–458. [CrossRef]
- Terekhova, V. A., Prudnikova, E. V., Kiryushina, A. P., Karpukhin, M. M., Plekhanova, I. O., Yakimenko, O. S. Phytotoxicity of heavy metals in contaminated podzolic soils of different fertility levels. Eurasian Soil Sci 2021b, 54, 964–974. [CrossRef]
- Yakimenko, O., Ziganshina, A., Terekhova, V., Panova, I., Gladkova, I., Timofeev, M., Yaroslavov, A. Ecotoxicity of polyelectrolyte formulations in water and soil matrices. Environ Sci Pollut Res. 2022, 29, 65489–65499. [CrossRef]
- Manukhov, I.V., Rastorguev, S.M., Eroshnikov, G.E., Zarubina, A.P., and Zavil’gel’skii, G.B. Cloning and expression of the lux operon of Photorhabdus luminescens, strain Zm1: nucleotide sequence of luxAB genes and basic properties of luciferase. Russ. J. Genet. 2000, 36, 249–257.
- Danilov, V. S., Zarubina, A. P., Eroshnicov, G. E., Solov’eva, L. N., Kartashev, F. V., Zavil’gelsky, G. B. The biolumiscent sensor systems with lux-operons from various species of luminescent bacteria. Mosc Univ Biol Sci Bull 2022, 3, 20–24.
- Zarubina, A. P., Deev, L. I., Parkhomenko, I. M., Parshina, E. Y., Sarycheva, A.S., Novoselova, L. A., Lukashev, E. P., Netrusov, A. I, Rubin, A. B. Evaluation of toxicity of silver ions and nanoparticles using model bacteria with luminescent phenotype. Nanotechnol Russ 2015, 10, 475–483. [CrossRef]
- Gorlenko, M. V., Kozhevin, P. A. Multisubstrate Testing of Natural Microbial Communities; MAKS Press: Moscow, Russia, 2005.
- Anderson, T. H., Domsh, K. H. The metabolic quotient for CO2 (qCO2) as a specific activity parameter to assess the effects of environmental condition on the microbial biomass of forest soil. Soil Biol Biochem 1993, 25, 393-395.
- Berard, A., Capowiez, L., Mombo, S., Schreck, E., Dumat, C., Deola, F., Capowiez, Y. Soil microbial respiration and PICT responses to an industrial and historic lead pollution: a field study. Environ Sci Pollut Res 2016, 23, 4271–4281. [CrossRef]
- Xu, Y., Seshadria, B., Bolana, N., Sarkarc, B., Oke, Y. S., Zhangd, W., Rumpelg, C., Sparksh, D., Farrelli, M., Hallj, T., Dong, Z. Microbial functional diversity and carbon use feedback in soils as affected by heavy metals. Environment International 2019, 125, 478-488. [CrossRef]
- Anderson, T. H. Microbial eco-physiological indicators to asses soil quality. Agriculture Ecosystems & Environ 2003, 98, 285-293.
- Chen, Y., Liu, Y., Li, Y., Wu, Y., Chen, Y., Zeng, G., Zhang, J., Li, H. Influence of biochar on heavy metals and microbial community during composting of river sediment with agricultural wastes. Bioresour Technol 2017, 243, 347–355. [CrossRef]
- Cheng, Y., Ma, D., Zhao, J., Zhang, Q., Li, X., Zhao, Y., Zheng, W., Zhang, B., & Liu, Z. Biochar application does not improve crop growth and yield in a semi-humid region in the HuangHuaiHai Plain of China: A 7-year consecutive field experiment. Soil and Tillage Research, 2025, 247, 106367.
- Pan, Y., Chen, H., Bolan, N. et al. Both Sides of Coin: Benefits and Potential Negative Consequences of Biochar in Sediment Remediation. Reviews Env.Contamination (formerly:Residue Reviews) 2023, 261,4. [CrossRef]
- Bloor, M.C., Kiryushina, A., Kydralieva, K., Bondarenko, L., Pozdnyakov, L., Manucharova, N., Terekhova, V. Divergent Effects of Antibiotics on Plants and Microbiota in Soils with Contrasting Humus Content. Water Air Soil Pollut. 2021, 232, 518. [CrossRef]
- Alengebawy, A., Abdelkhalek, S. T., Qureshi, S. R., Wang, M. Q. Heavy metals and pesticides toxicity in agricultural soil and plants: Ecological risks and human health implications. Toxics 2021, 9, 42. [CrossRef]
- Park, J. H, Choppala, G. K, Bolan, N. S, Chung, J. W, Chuasavath, T. Biochar reduces the bioavailability and phytotoxicity of heavy metals. Plant Soil 2011, 348, 439–451. [CrossRef]
- Rajapaksha, R. M., Tobor-Kapłon, M.A., Bååth, E. Metal toxicity affects fungal and bacterial activities in soil differently. Applied and environmental microbiology 2004, 70, 2966–2973.
- Chander, K., Brookes, P. C. Residual effects of zinc, copper and nickel in sewage sludge on microbial biomass in a sandy loam. Soil Biology and Biochemistry, 1993, 25, 1231-1239.
- Valsecchi, G., Gigliotti, C., Farini, A. Microbial biomass, activity, and organic matter accumulation in soils contaminated with heavy metals. Biol Fertil Soils 1995, 20, 253–259.
Figure 1.
Influence of biochar on the growth of S. alba L. in agricultural sandy podzolic soils with strongly (1) and weak (2) humus content and levels of HM contamination: (a, b) shoot length and (c, d) phytomass during phytotesting conducted in containers.
Figure 1.
Influence of biochar on the growth of S. alba L. in agricultural sandy podzolic soils with strongly (1) and weak (2) humus content and levels of HM contamination: (a, b) shoot length and (c, d) phytomass during phytotesting conducted in containers.
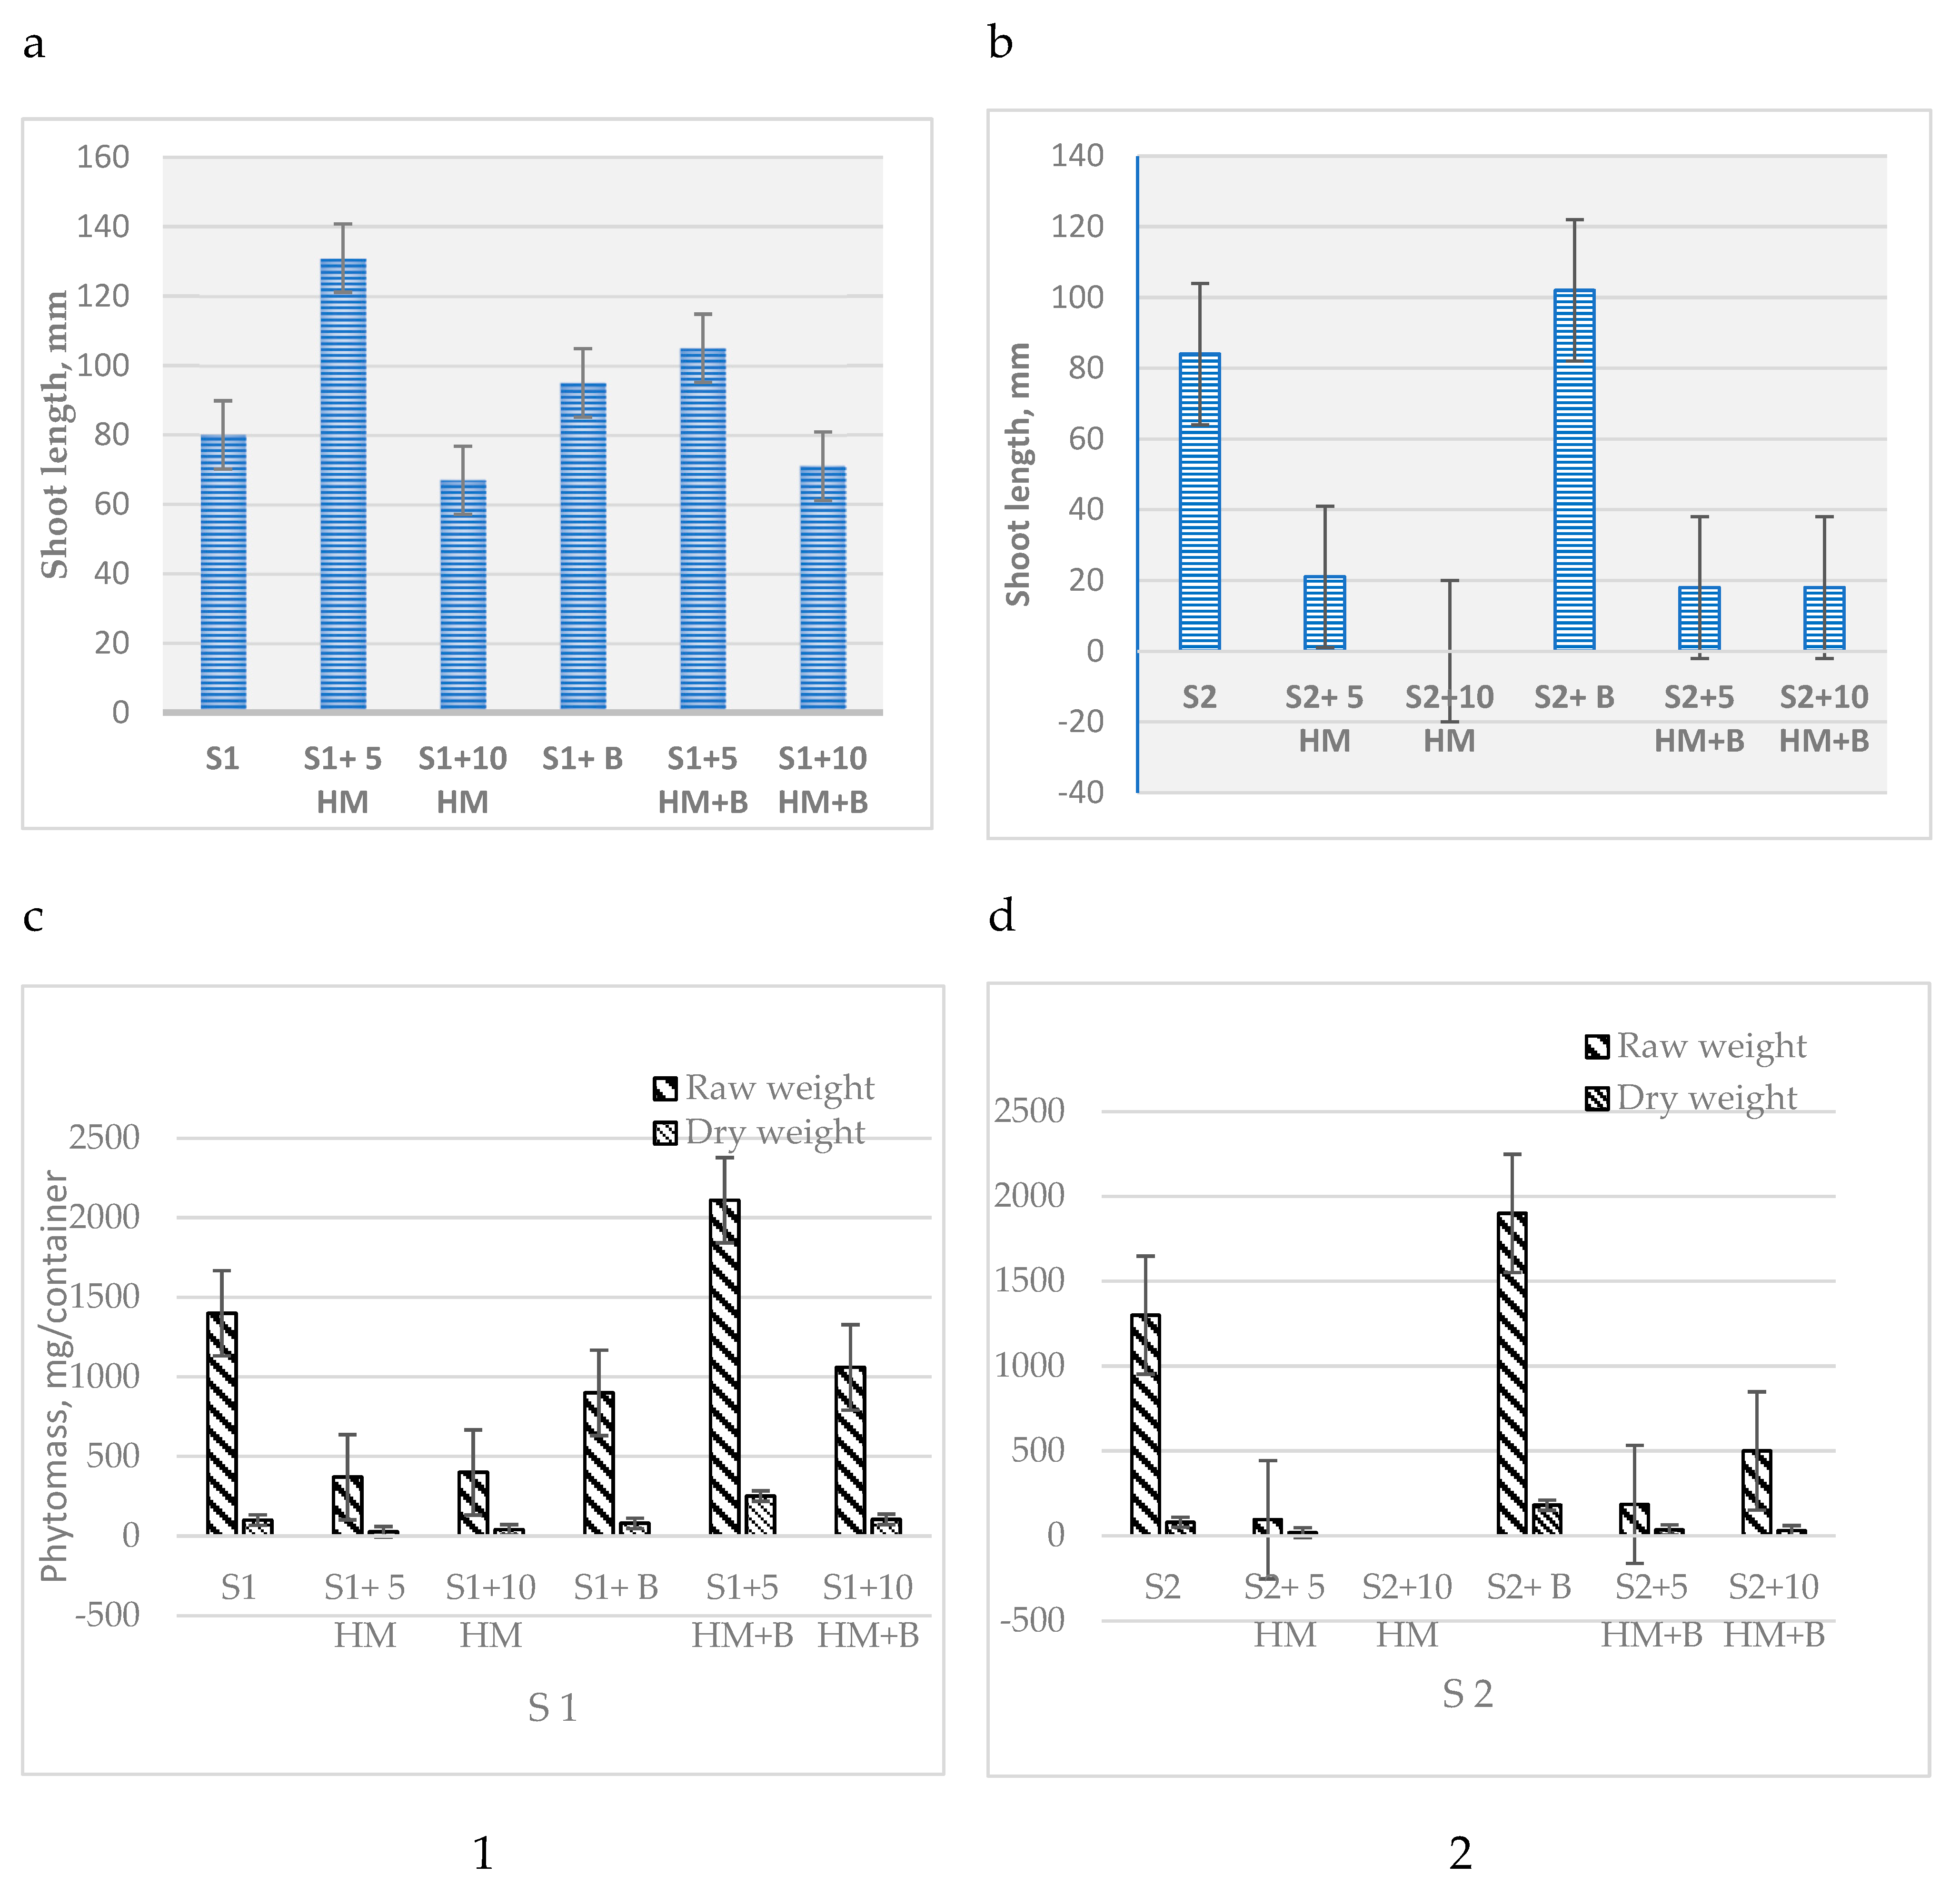
Figure 2.
Impact of HM and biochar application on Ceriodaphnia survival (a) and bacterial bioluminescence (b) in extracts of strongly humified soil (S1) and weakly humified soil (S2).
Figure 2.
Impact of HM and biochar application on Ceriodaphnia survival (a) and bacterial bioluminescence (b) in extracts of strongly humified soil (S1) and weakly humified soil (S2).
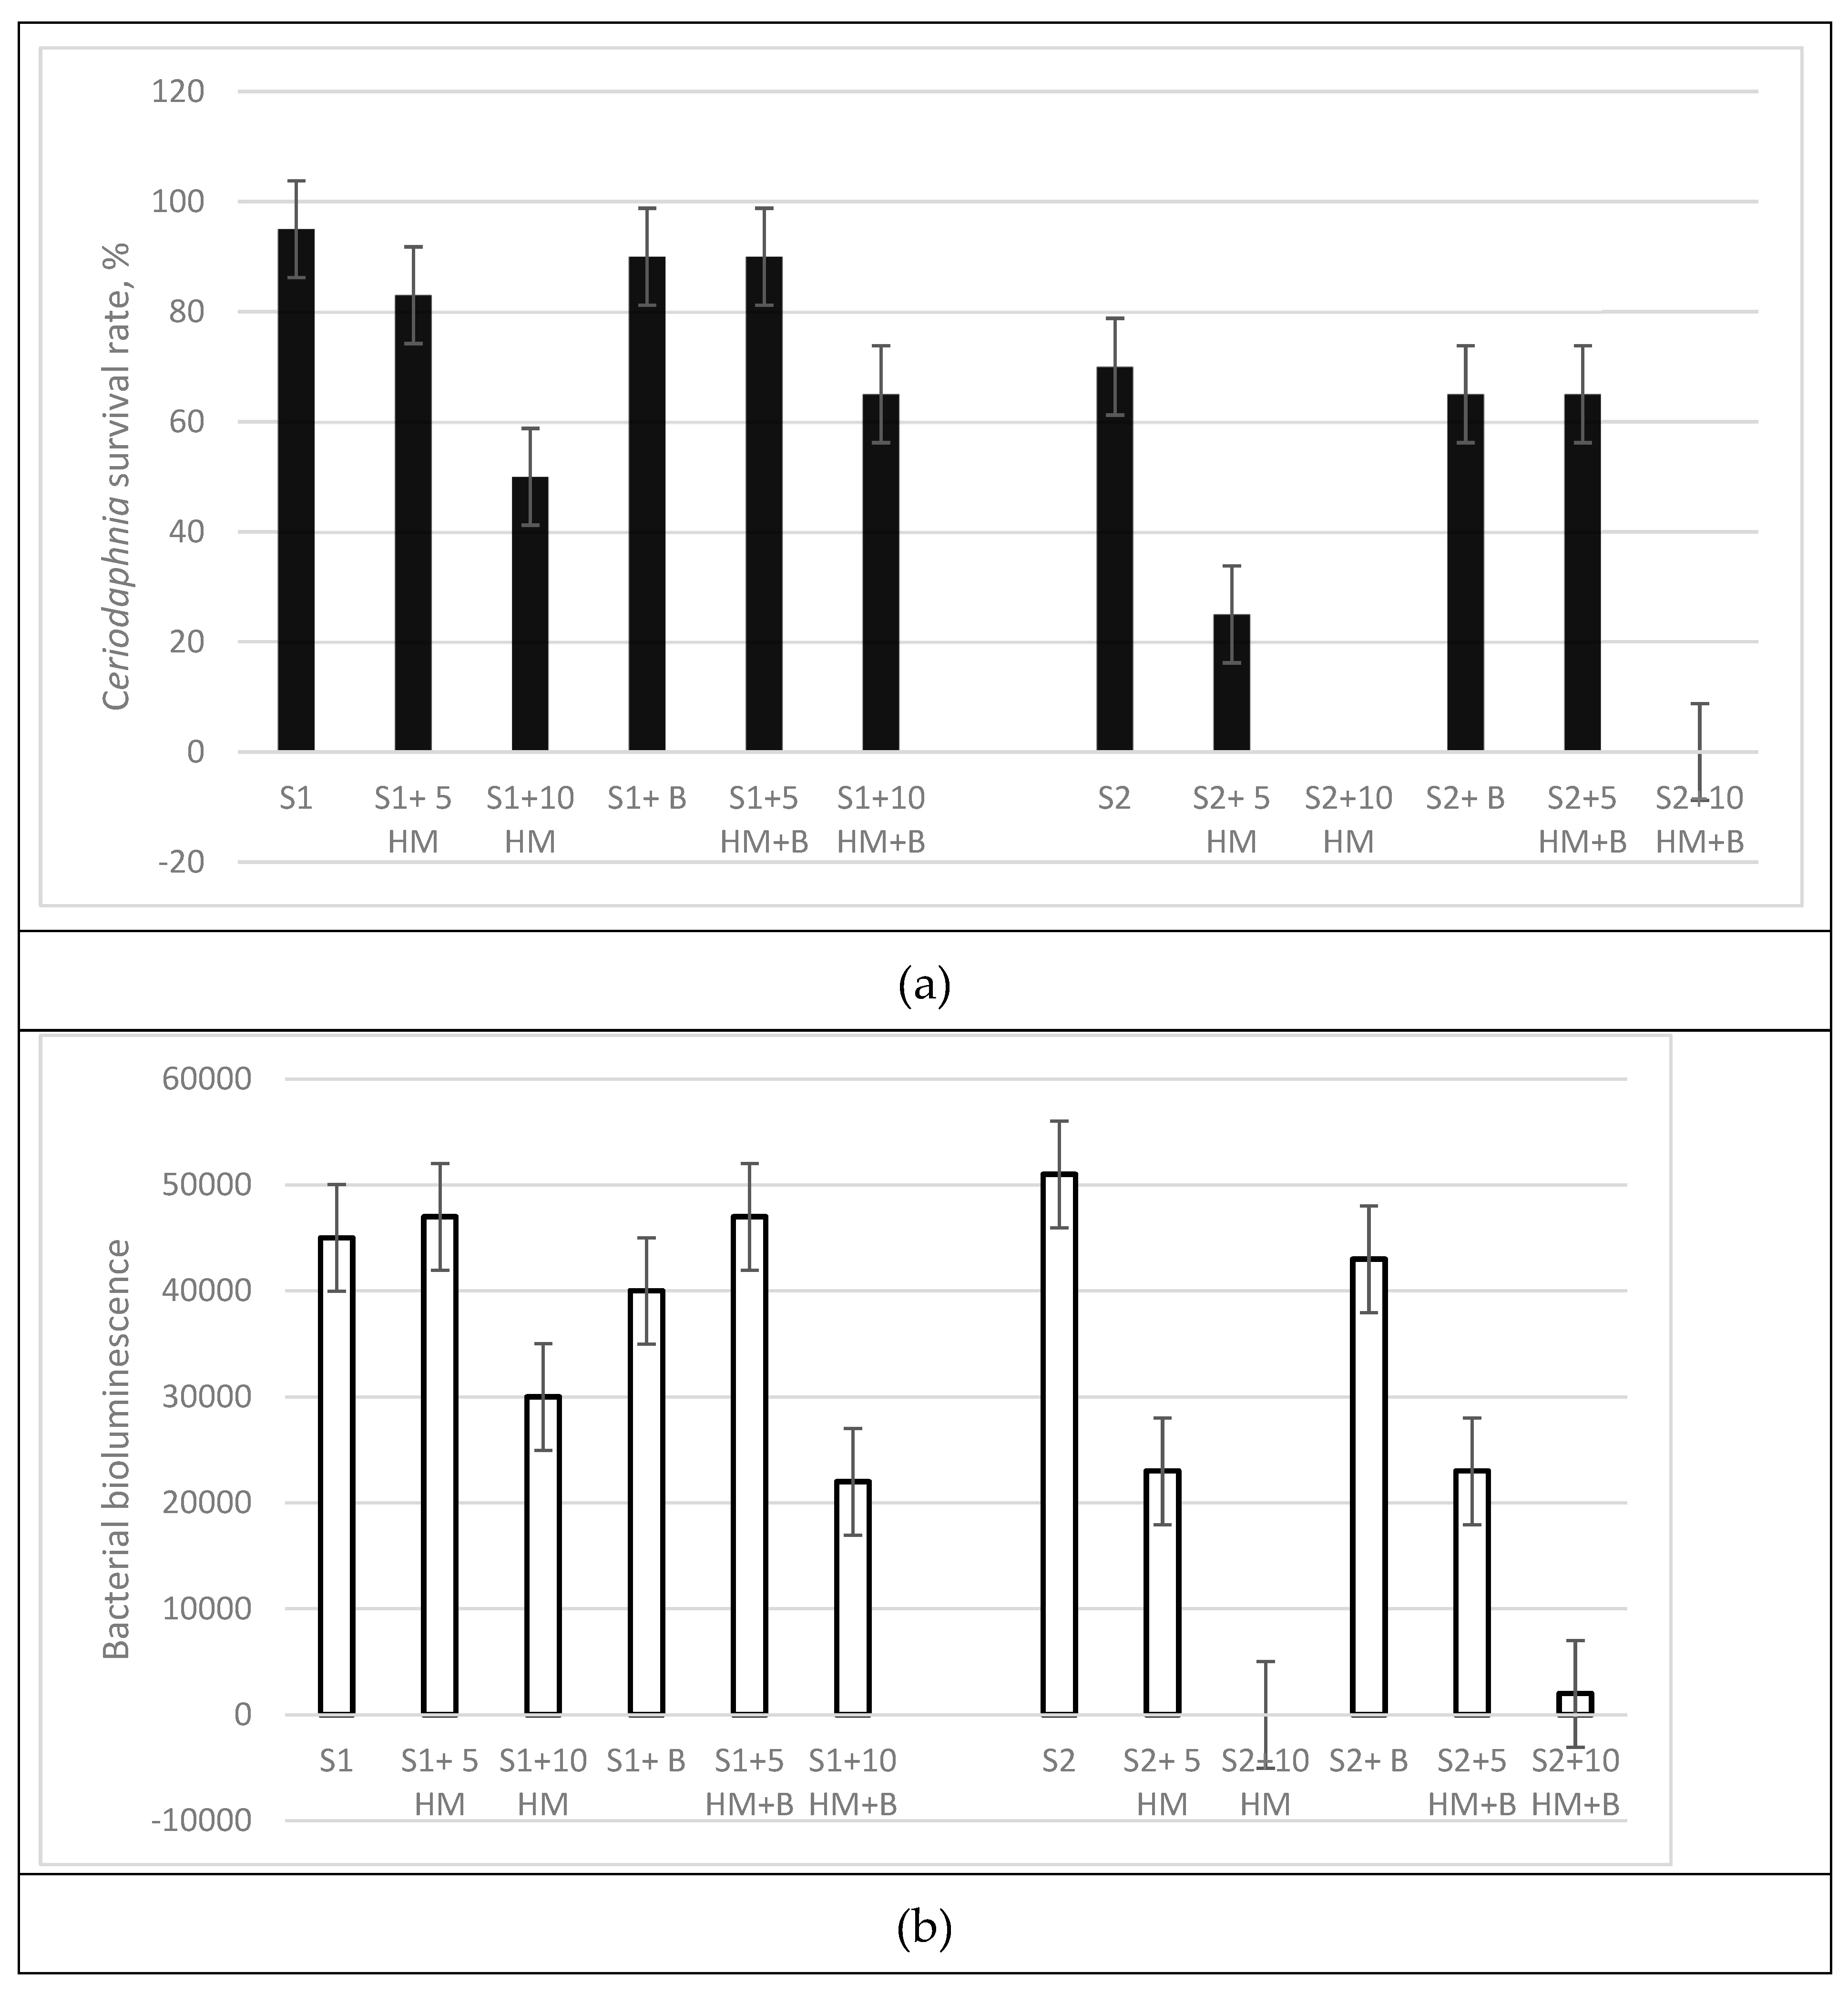
Figure 3.
Projection of indicators (Cmic = microbial biomass carbon, BR = basal respiration, SIR = substrate-induced respiration) of agricultural sandy podzolic soils with varying levels of humus content onto the first and second principal components (factors 1 and 2, respectively).
Figure 3.
Projection of indicators (Cmic = microbial biomass carbon, BR = basal respiration, SIR = substrate-induced respiration) of agricultural sandy podzolic soils with varying levels of humus content onto the first and second principal components (factors 1 and 2, respectively).
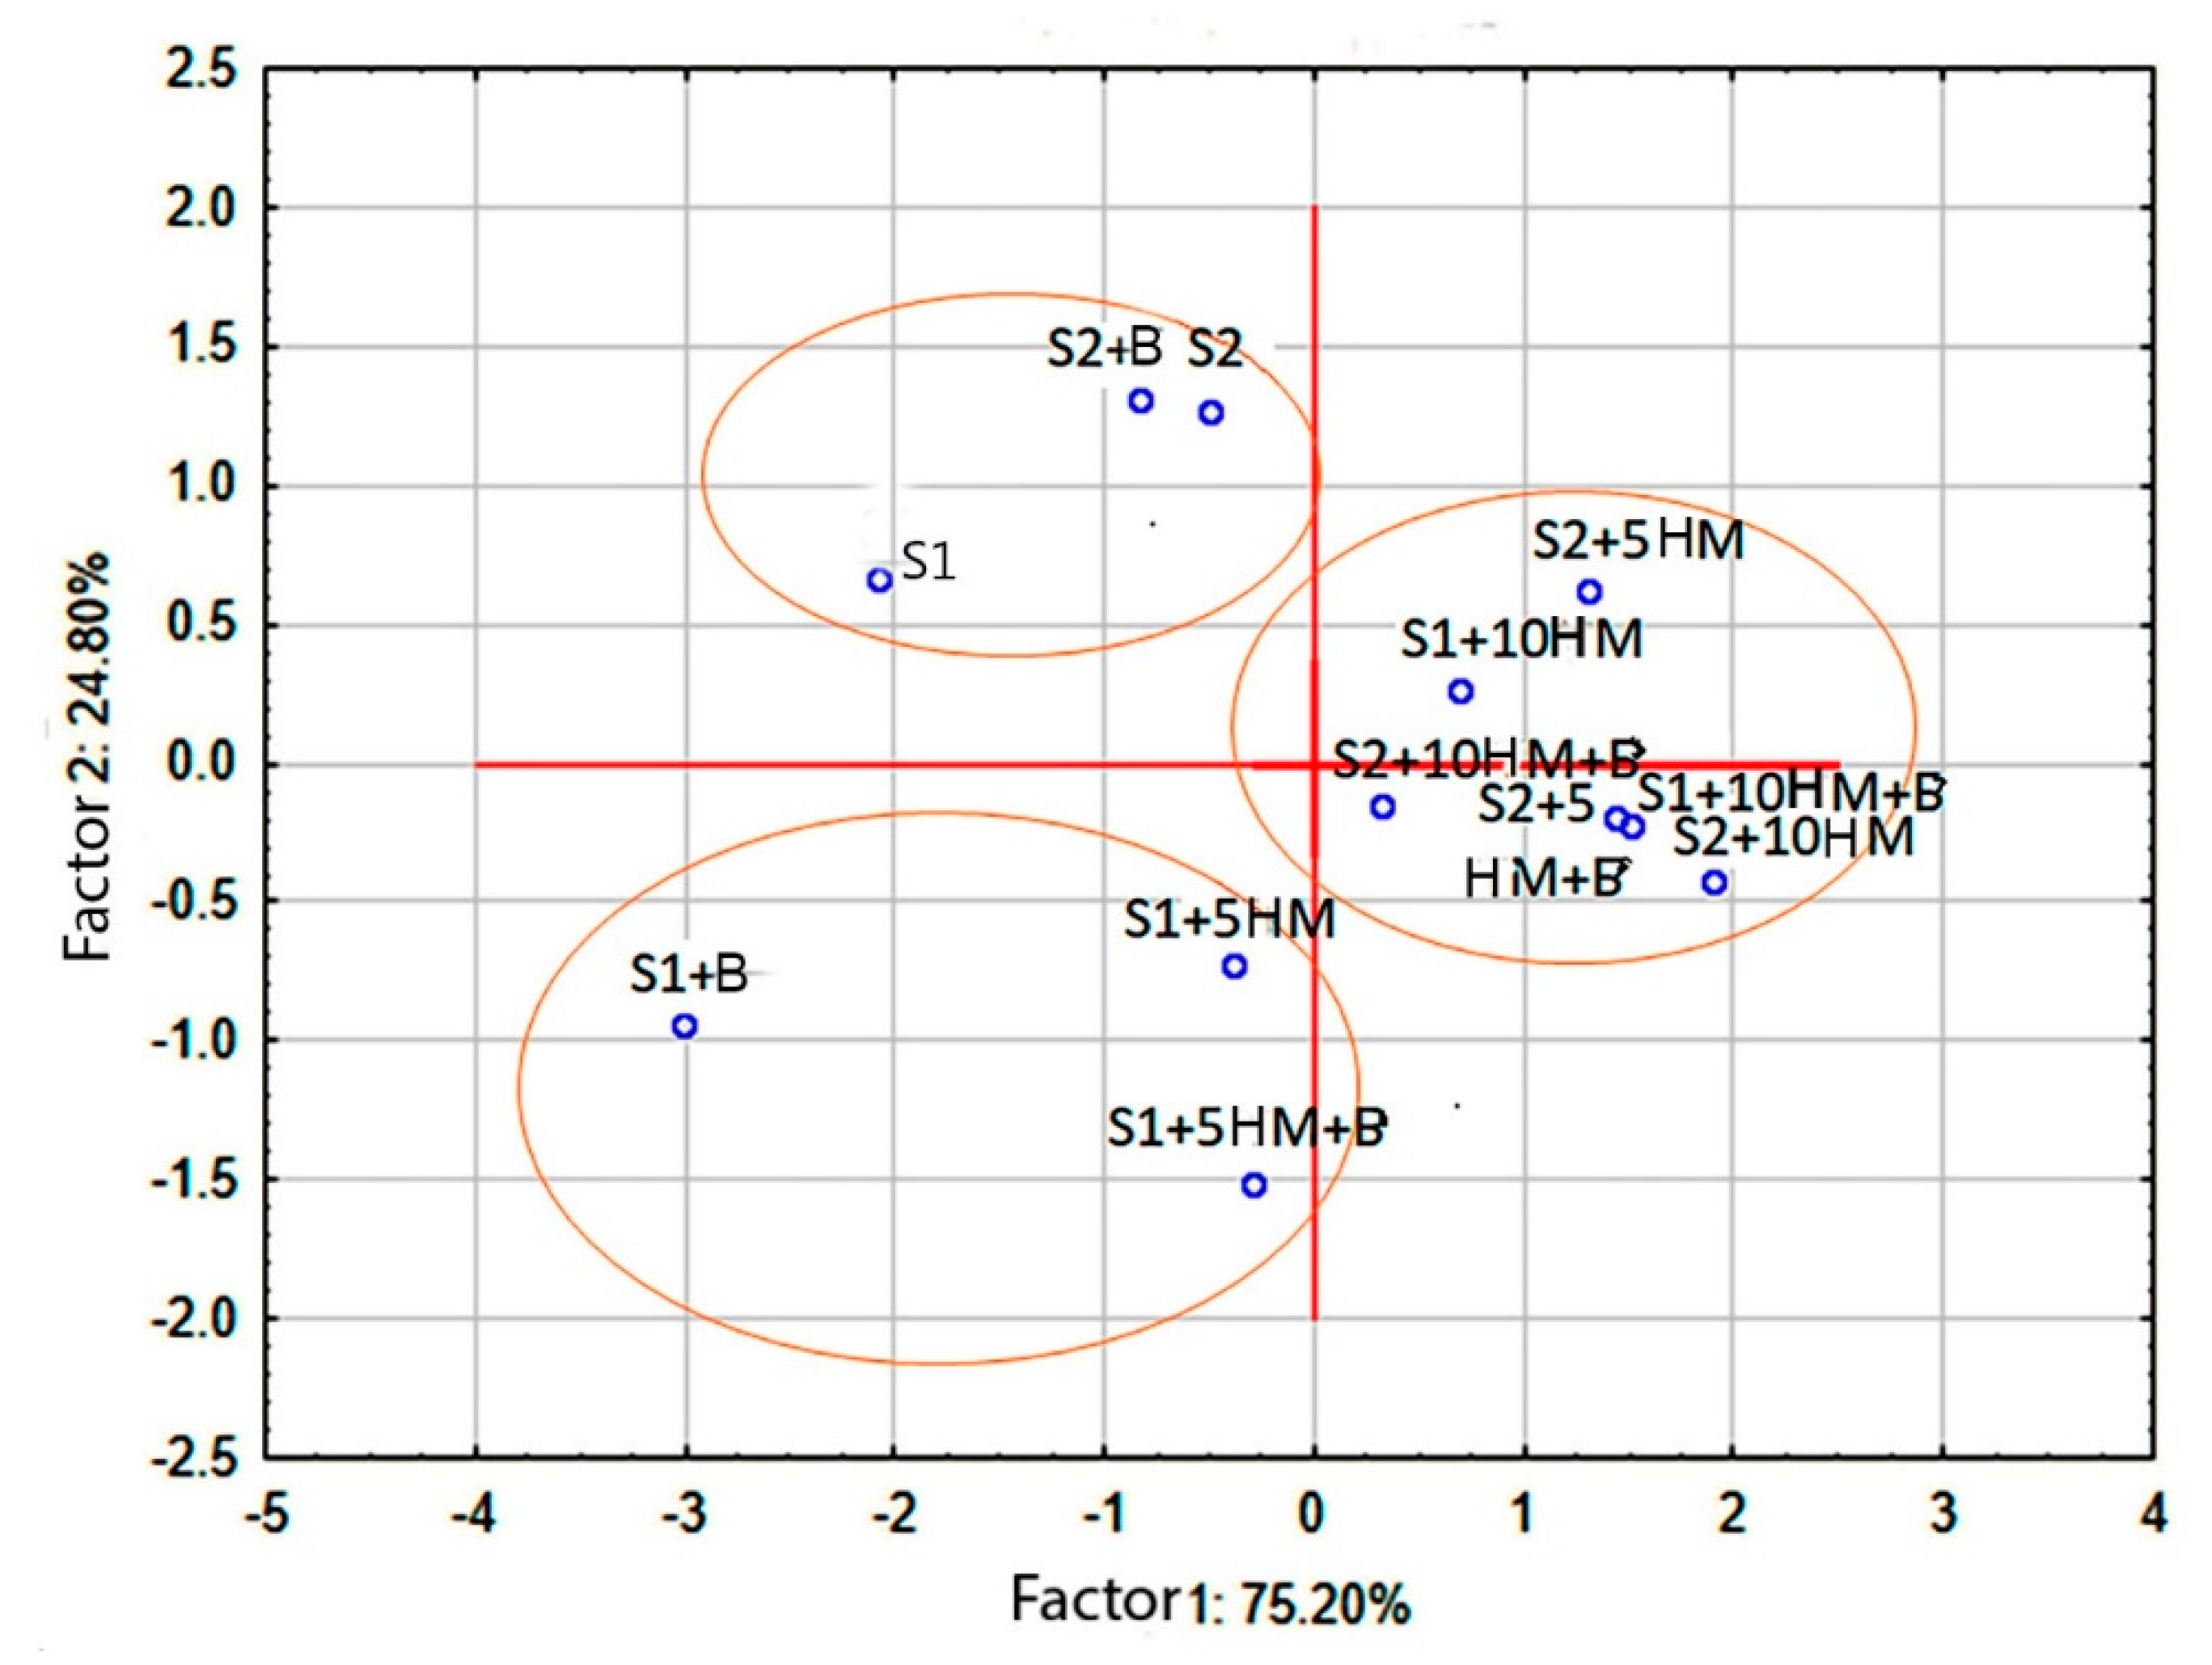
Figure 4.
Cluster analysis of soil samples based on substrate utilization spectra using Euclidean distance and Ward's Clustering, in conjunction with functional diversity indicators plot of agricultural sandy podzolic soils with high (a, c (S1)) and low (b,d (S2)) Corg content, treated with different doses of HM and biochar. Note: N - number of substrates consumed; W - total metabolic work, relative units; d - coefficient of stability (rank distribution of substrate utilization spectra shape coefficient).
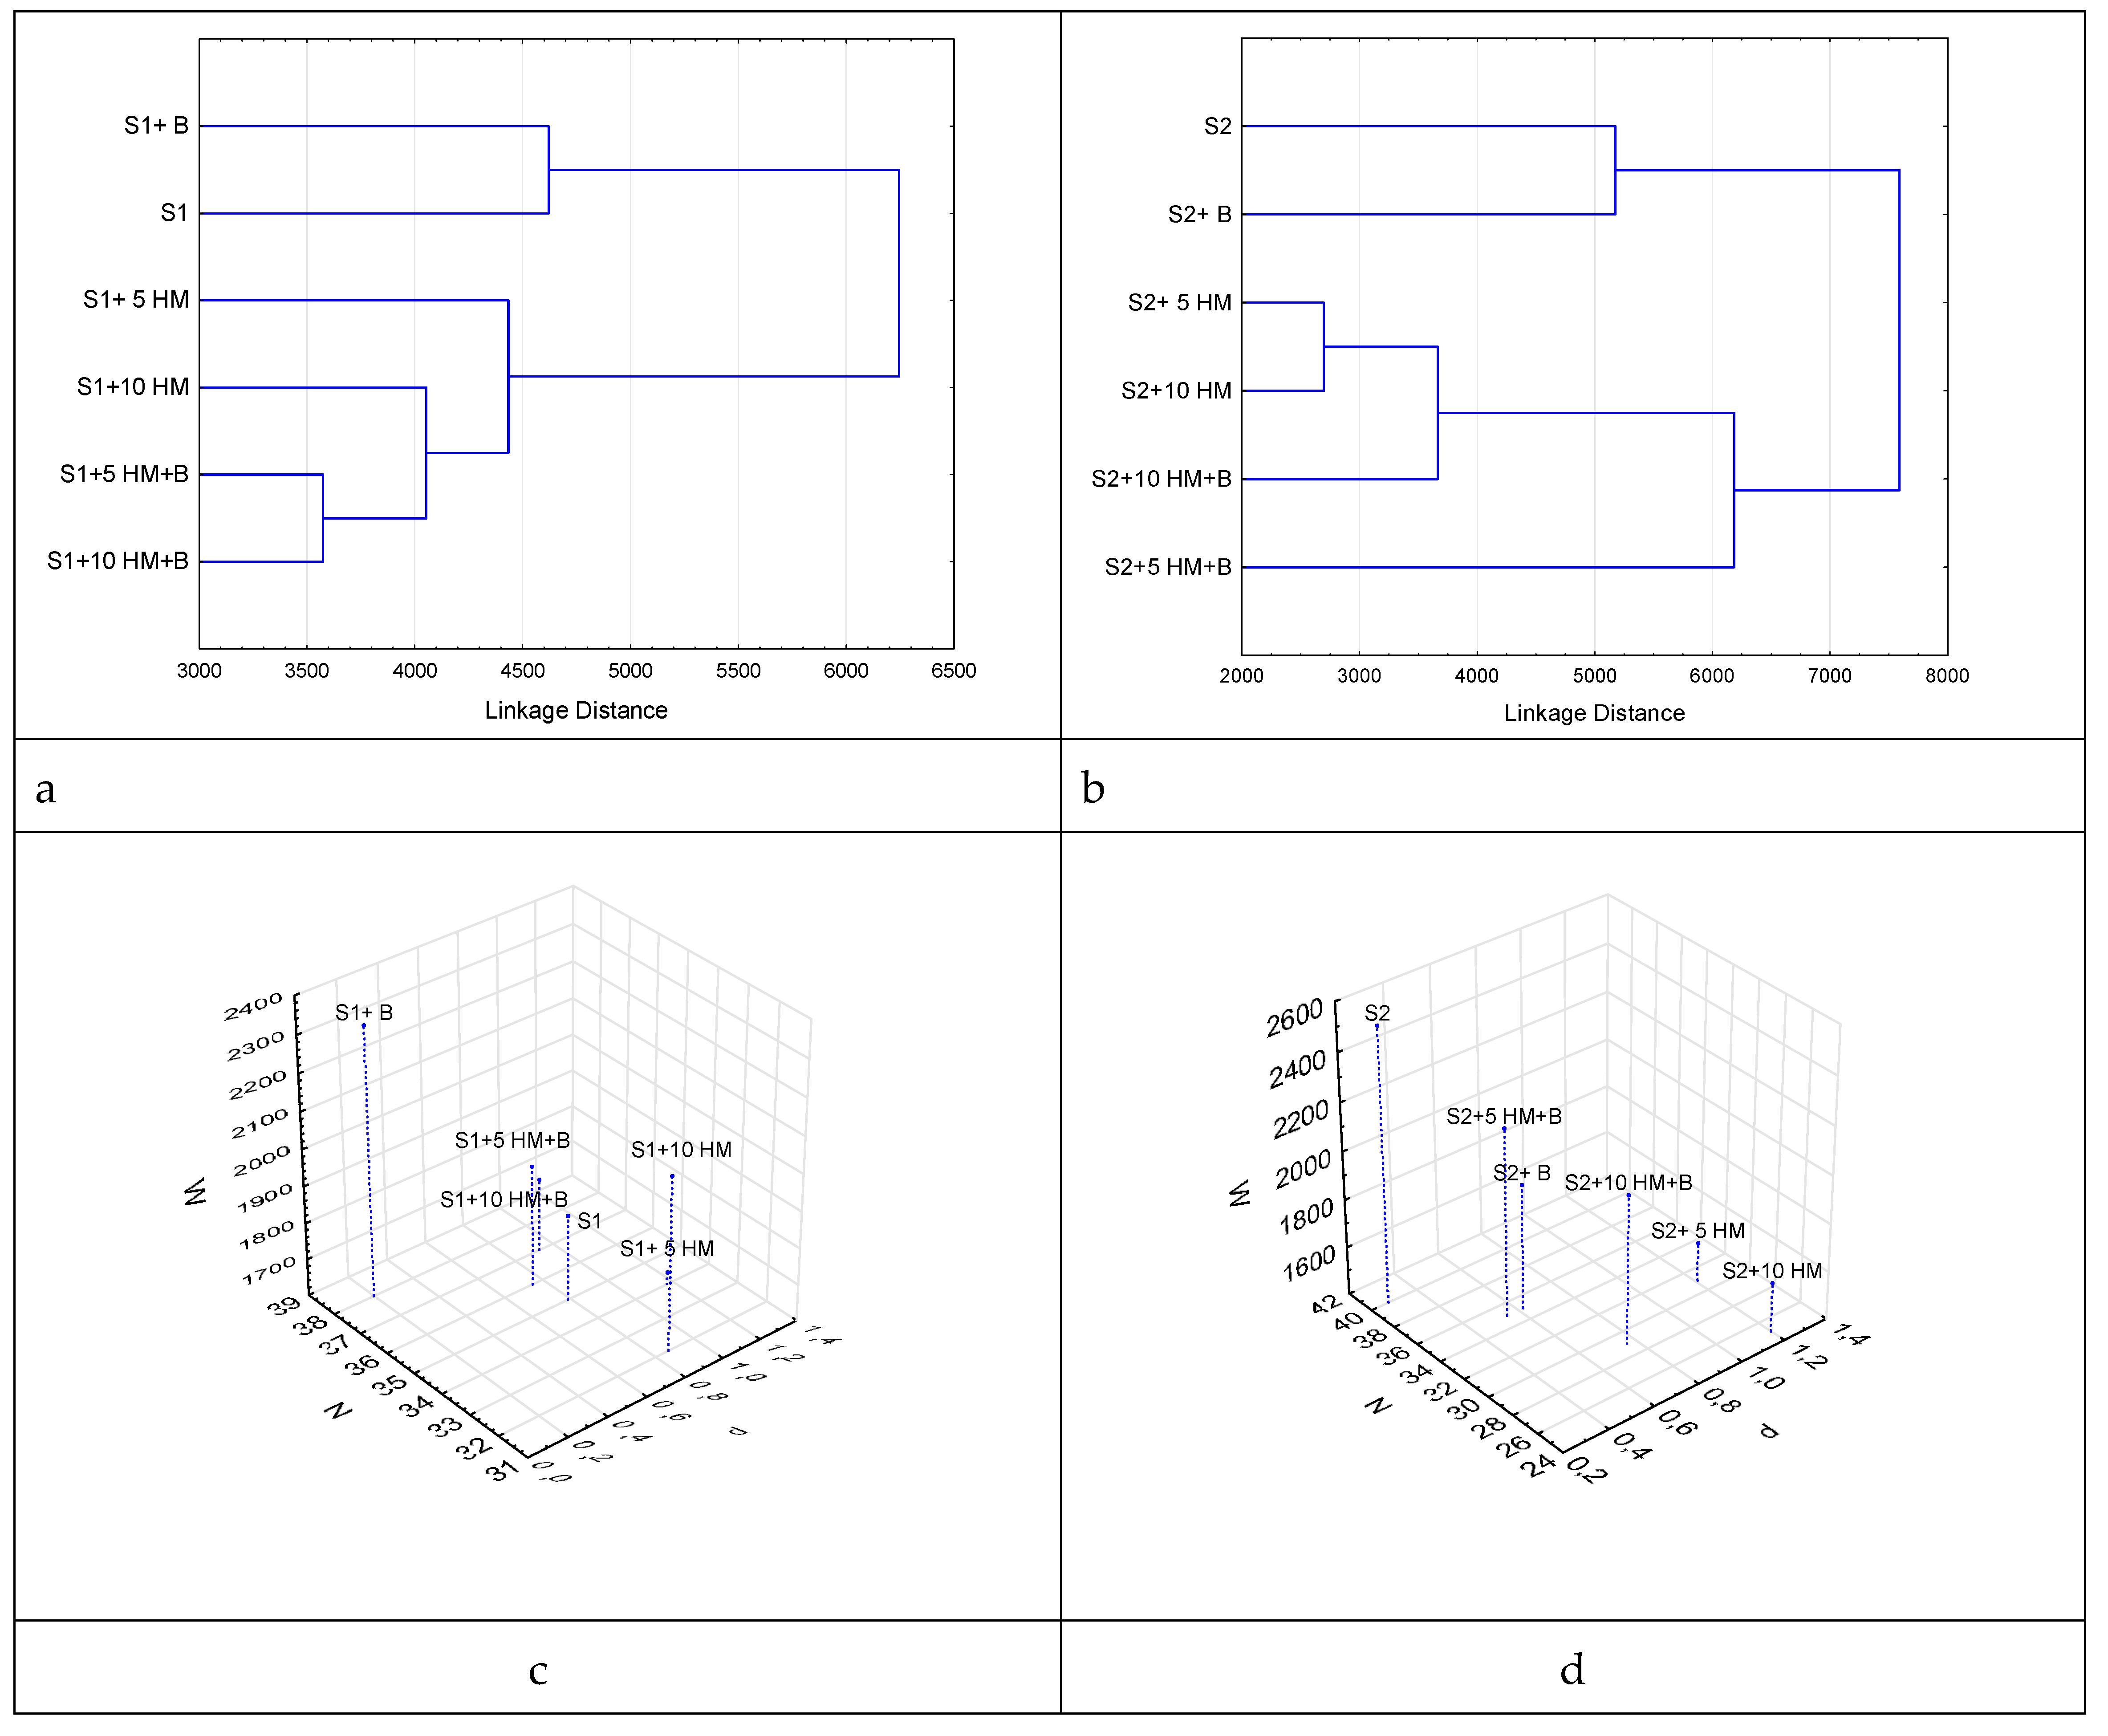

Table 1.
Soil sample variants, pH and mineralization of aqueous extracts.
| Soil Sample Variants | pH of Aqueous Extracts | Mineralization of Aqueous Extracts, g/dm³ |
|---|---|---|
| Highly humified agricultural sandy podzolic soil (S1) | ||
| S1: soil without additives (control) | 6.69 | 0.53 |
| S1+ B: soil with biochar | 7.02 | 0.12 |
| S1+ 5 HM: soil with 5 AAC of Cu, Zn, and Pb | 6.74 | 0.34 |
| S1+5 HM+B: soil with 5 AAC of Cu, Zn, Pb and biochar | 6.73 | 0.69 |
| S1+10 HM: soil with 10 AAC of Сu, Zn, and Pb | 6.82 | 0.32 |
| S1+10 HM+B: soil with 10 AAC of Cu, Zn, Pb and biochar | 6.91 | 0.30 |
| Weakly humified agricultural sandy podzolic soil (S2) | ||
| S2: soil without additives (control) | 6.16 | 0.46 |
| S2+ B: soil with biochar | 6.40 | 0.84 |
| S2+ 5 HM: soil with 5 AAC of Cu, Zn, and Pb | 6.30 | 0.28 |
| S2+5 HM+B: soil with 5 AAC of Cu, Zn, Pb and biochar | 6.71 | 0.57 |
| S2+ 5 HM: soil with 5 AAC of Cu, Zn, and Pb | 6.30 | 0.28 |
| S2+5 HM+B: soil with 5 AAC of Cu, Zn, Pb and biochar | 6.71 | 0.57 |
Table 2.
Phytotoxic effect (%) of biochar in strongly humified soil (S1) and weakly humified soil (S2) at different doses of HM.
Table 2.
Phytotoxic effect (%) of biochar in strongly humified soil (S1) and weakly humified soil (S2) at different doses of HM.
| Soil Sample | S. alba Root Length (Average, mm) in Sample | Inhibition, IeB, % | |
|---|---|---|---|
| Without Biochar | With Biochar | ||
| Strongly humified soil S1 | |||
| S1 | 111.6±24.5* | 56.9±31.7 | 49.0 |
| S1+ 5 HМ | 78.5±46.5 | 40.2±36.1 | 48,8 |
| S1+ 10 HМ | 53.6±33.01 | 73.5±34.4 | -37.1 |
| Weakly humified soil S2 | |||
| S2 | 20.7±5.9 | 23.4±21.6 | -13.0 |
| S2 +5 HМ | 20.8±22.8 | 22.7±21.9 | -9.1 |
| S2 +10 HМ | 10.8±10.5 | 16.1±17.4 | -48.9 |
*Note: ± denotes standard deviation, IeB represents phytotoxic effect with biochar.
Table 3.
Values of structural and functional indicators of the microbial community in soil samples of different humification levels, S1 and S2, under different treatment methods.
Table 3.
Values of structural and functional indicators of the microbial community in soil samples of different humification levels, S1 and S2, under different treatment methods.
| Microbiological Indicators | |||
|---|---|---|---|
| Soil Sample | Basal Respiration Rate (BR) (µg C-CO2/g h) | Microbial Biomass Carbon (Cmic) Content (µg C/g) | Specific Respiration of Microbial Biomass (qCO2) (µg C-CO2/(mg Cmic h)) |
| Strongly humified soil S1 | |||
| S1 | 0.93 | 187.8 | 0.37 |
| S1+5 HM | 0.63 (-32.3%)* | 152.5 (-18.8%) | 0.31 (-16.2%) |
| S1+10 HM | 0.70 (-24.7%) | 102.9 (-45.2%) | 0.51 (37.8%) |
| S1+B | 0.76 (-18.28%) | 242.3 (29%) | 0.24 (-35.1%) |
| S1+5 HM +B | 0.51 (-45.2%)* | 161.5 (-14%) | 0.24 (-35.1%) |
| S1+10 HM+B | 0.58 (-37.6%)* | 83.5 (-55.5%) | 0.52 (40.5%) |
| Weakly humified soil S2 | |||
| S2 | 0.92 | 127.1 | 0.54 |
| S2+5 HM | 0.71 (-22.8%) | 77.5 (-39%) | 0.69 (27.8%) |
| S2+10 HM | 0.52 (-43.5%)* | 73.0 (-42.6%) | 0.54 (0%) |
| S2+B | 0.94 (2.2%) | 137.7 (8.3%) | 0.51 (-5.5%) |
| S2+5 HM +B | 0.59 (-35.9%)* | 85.4 (-32.8%) | 0.52 (-3.7%) |
| S2+10 HM+B | 0.66 (-28.3%) | 121.3 (-4.6%) | 0.41 (-24.1%) |
Note: The value in parentheses represents the percentage relative to the control; * - p < 0.05 (5%) indicates a statistically significant difference compared to the control sample.
Disclaimer/Publisher’s Note: The statements, opinions and data contained in all publications are solely those of the individual author(s) and contributor(s) and not of MDPI and/or the editor(s). MDPI and/or the editor(s) disclaim responsibility for any injury to people or property resulting from any ideas, methods, instructions or products referred to in the content. |
© 2025 by the authors. Licensee MDPI, Basel, Switzerland. This article is an open access article distributed under the terms and conditions of the Creative Commons Attribution (CC BY) license (http://creativecommons.org/licenses/by/4.0/).
Copyright: This open access article is published under a Creative Commons CC BY 4.0 license, which permit the free download, distribution, and reuse, provided that the author and preprint are cited in any reuse.


