
Submitted:
18 June 2025
Posted:
19 June 2025
You are already at the latest version
Abstract
Tea plantations in Sichuan Province face significant soil degradation due to long-term over-fertilization, leading to severe acidification and nutrient depletion. This study investigated the potential of biochar as a soil amendment to mitigate these issues and promote sustainable tea production. Three types of biochar (corn stover, reed, and coconut shell) were applied at varying concentrations (0%, 0.5% and 1.0%) to tea plantation soils, and their effects on soil pH, enzyme activities, nutrient content, and microbial communities were evaluated over a 45-day incubation period. Results indicated that coconut shell biochar significantly increased soil pH and enhanced catalase and urease activities, particularly at higher application rates. Additionally, biochar application improved soil organic matter and available phosphorus content, with coconut shell biochar showing the most pronounced effects. Microbial community analysis revealed that biochar increased bacterial diversity and altered fungal community composition, favoring beneficial taxa such as Ascomycota and Mortierellomycota. These findings suggest that biochar, especially coconut shell-derived, can effectively ameliorate soil acidity, enhance nutrient availability, and improve microbial diversity in tea plantations. This research could contribute to integrating biochar into sustainable tea cultivation, presenting a promising strategy for soil remediation and long-term agricultural productivity.
Keywords:
tea plantation
; biochar
; soil properties
; enzyme activity
; microbial community
1. Introduction
Tea (Camellia sinensis (L.) O. Kuntze) is a globally significant cash crop, and it plays a pivotal role in agricultural economics. Rational fertilization practices are crucial for enhancing tea yield and ensuring the sustainable development of tea plantations. As the core region for the origin of Chinese tea germplasm, Sichuan has become a nationally vital intensive tea production hub with 363300 hectares of plantations by 2018, highlighting dual strategic value in both genetic conservation and agricultural economics development [1,2,3]. However, the long-term overemphasis on high yield has led to widespread irrational fertilization and mismanagement, resulting in severe soil degradation in certain tea-growing regions of Sichuan. Recent studies have highlighted the extent of this issue. For instance, the topsoil pH of 16 representative tea plantations in western Sichuan averages 4.3, while in 22 tea plantations across southern Sichuan, the minimum recorded pH was 3.4 [4]. These values fall significantly below the optimal pH range of 4.5–6.0 for tea plant growth (USEPA, 2008). Additionally, over 60% of the tea plantation soils exhibit potassium levels below 120 mg/kg [4], further exacerbating the challenges to sustainable tea production. These conditions collectively hinder the development of an environmentally friendly tea industry. Given these pressing issues, there is an urgent need to implement robust measures to remediate tea plantation soils and promote sustainable agricultural practices.
Biochar is a carbon-rich aromatic organic material produced through the incomplete combustion or anaerobic low-temperature pyrolysis of agricultural and forestry organic wastes, such as straw, rice husks, fruit shells, and wood residues [5,6]. It exhibits multiple beneficial properties, including soil nutrient and moisture retention, improved soil aeration, enhanced soil structure, and stimulation of microbial activity [7]. Due to these characteristics, biochar has been widely studied and applied in agricultural production. As a novel fertilizer and soil amendment, its potential for use in tea plantations is particularly promising. Recent studies have demonstrated the efficacy of biochar in improving tea plantation soils. For instance, in a 64-day incubation experiment, Oo et al. [8] applied varying concentrations of bamboo-derived biochar (N 300, N 600, and N 900) to acidified tea plantation soil. Their results showed that biochar amendment resulted in only slight increases in soil pH: 0.09 units for the N 300 treatment and 0.07 units for both the N 600 and N 900 treatments. Similarly, Zou et al. [9] investigated the impact of tea plants biochar on the physicochemical properties of soil in Camellia sinensis ‘Longjing 43′ tea plantations across varying applying methods, their findings revealed that biochar application enhanced total nitrogen, phosphorus, and potassium content, with a maximum increase at about 371 %, 1167 %, 960 %, respectively. Furthermore, Chen et al. [10] explored the effects of bamboo biochar on soil nitrogen cycling and enzyme activity dynamics in 20-year-old tea plantation and 60-year-old tea plantation separately, their study demonstrated that biochar application reduced nitrogen leaching at most 58.3 % and 62.1 % respectively and significantly stimulated the activities of N cycling related soil enzymes, including nitrite reductase, urease, and β-N-Acetylglucosaminidase. Wang et al. [11] investigated acidic soils from tea plantations and demonstrated that both lime and biochar amendments significantly reduced the abundance of bacterial and fungal denitrification genes after a 45-day microbial culture experiment. Similarly, Luo et al. [12] found that the addition of biochar, either alone or in combination with tea plantation pruning, significantly altered the diversity and composition of soil bacterial and fungal communities. Notably, the fungal community exhibited more pronounced increase changes, while the proportion of Nitrobacter in the soil remained relatively stable. In a 5-year field experiment, Wang et al. [13] applied varying doses of wheat straw biochar and observed an increase in the relative abundance of beneficial fungi such as Mortierella and Trichoderma, alongside a decrease in Melanconiella. Additionally, the combination of organic and inorganic fertilizers was shown to reduce the relative abundance of soil pathogenic fungi, thereby promoting soil health [14]. However, comprehensive studies investigating how different biochar types and application rates concurrently affect the physicochemical and biological properties of tea plantation soils are still limited.
Therefore, present study focuses on the soil of tea plantations. By applying various types and concentrations of biochar, this study aims to explore their impacts on soil physicochemical properties, key enzyme activities, and microbial community structure. These results are expected to provide a scientific basis for optimizing tea plantation management practices.
2. Materials and Methods
2.1. Experimental Materials
2.1.1. Soil and Biochar
Soils were collected from a tea plantation in Ya’an, Sichuan Province, where Camellia sinensis Fuding Dabaicha has been cultivated for over 7 years. And the soil of the tea plantation has a total nitrogen content of 1.66 g/kg, a total phosphorus content of 0.81 g/kg, a total potassium content of 9.92 g/kg, and an available phosphorus content of 82.74 mg/kg, an available potassium content was 280.58 mg/kg, an available nitrogen content was 118.32 mg/kg, and the organic matter content was 33.01 g/kg, and a pH of 5.0 , it was defined as the Yellow-brown earths, Luvisols.
The biochar utilized in the experimental setting was derived from corn stover, reed, and coconut shell. Details of the properties of the biochar see Table 1. And these materials were procured from Henan Lize Environmental Protection Technology Co.
2.2. Experimental Design
On December 19, 2023, soil samples were taken from two plots using the multipoint sampling method. Soil samples (0-20cm) were collected following the removal of plant material from the soil surface. Samples from the same profile were mixed and excessive soil was removed, using the diagonal quartering method. The incubation method employed was as follows: the experimental setup comprised 21 soil samples (200 g each of air-dried, <2 mm sieved soil) distributed in three biological replicates (n=3) across seven treatment groups, and these were recorded as CK, YM1, YM2, LW1, LW2, YK1, and YK2. The concentration of biochar addition was 0.5%, 1.0%(w/w) [15]. The treatments are outlined in Table 1. The biochar was utilized after passing through a 1-mm sieve. Then the soil was mixed with biochar, moisture was adjusted to reach 60% of the saturated water holding capacity of the soil, covered with tinfoil film to allow for air permeability, and then incubated in a thermostat at 25 °C for 45 days [11]. During the incubation period, every day each jar was weighed in order to compensate the water loss. Upon completion of the incubation period, the soil samples from each treatment group were divided into two parts: one part was stored in a −80 °C refrigerator for soil microbial DNA extraction and high-throughput sequencing analysis; one part was air-dried and sieved for the determination of soil physicochemical properties and enzyme activity.
2.3. Sampling and Laboratory Analysis
2.3.1. Determination of the Activities of Soil Enzymes
25 g of soil samples were collected from different wide-mouth bottles at day 1, 15, 30, and 45, and then air-dried and ground through a 40-mesh sieve. The urease activity was subsequently measured using a solid urease assay kit (#A121-1-1; Nanjing Jiancheng Bioengineering Institute, Nanjing, China) according to the manufacturer’s instructions. Briefly, the indophenol blue colorimetric method was used and the production of 1 µg NH3-N per g of soil sample per day is one enzyme activity, which was quantified colorimetrically at 578 nm, while the reduction of hydrogen peroxide was measured for catalase determination using the G0303W96 kit, provided by Geruisi-bio [16]. A unit (U) of CAT was equivalent to 1µmol of H2O2 degradation catalyzed per gram of soil sample per hour at 510 nm.
2.3.2. Analysis of Soil Chemical Properties
The soil samples were weighed in different wide-mouth bottles at 1, 15, 30, and 45 days to determine the basic physical and chemical properties of the soil.
The pH of the soil was determined using a pH meter (3310 SET 2 2AA312, Germany). The determination of total soil nitrogen was performed using the Kjeldahl method [17]. The total soil phosphorus was determined through NaOH alkali fusion with molybdenum blue method [18]. The total soil potassium was determined using the NaOH fusion method [19]. The soil organic matter was determined through the oxidation of potassium dichromate using the external heating method [20]. The determination of available phosphorus (AP) and available potassium (AK) was as follows: A quantity of 2.5 g of air-dried soil was weighed over 20 mesh, and the Mehlich3 leaching method was used, with a soil-to-water ratio of 1:10 leaching. The filtrate was diluted 5-fold and then determined by ICP-AES (Thermo, TJA, USA) [21]. The available nitrogen was determined by hydrolyzing and reducing ammonium and nitrate nitrogen to ammonia under alkaline conditions, absorbing it in boric acid solution, and titrating with standard acid to calculate content based on acid consumption [22].
2.3.3. Sequencing of Fungal and Bacterial Amplicons
Soil microbial DNA was extracted using the E.Z.N.A.® Soil DNA Kit (Omega Bio-tek, Norcross, GA, U.S.) following the manufacturer’s protocol. The integrity of the extracted DNA was assessed via 1% agarose gel electrophoresis, while its concentration and purity were quantified using a NanoDrop 2000 spectrophotometer (Thermo Fisher Scientific, Wilmington, DE, U.S.). For fungal, the ITS region was amplified using universal fungal primers ITS1f (5′-CTTGGTCATTTAGAGGAAGTAA-3′) an ITS2 (5′-GCTGCGTTCTTCATCGATGC-3′). The bacterial 16S V4 region was amplified by PCR using specific primers 515F:5′-GTGCCAGCMGCCGCG GTA A-3′ and 806R:5′-GGACTACHVGGGTWTCTAAT-3′. PCR products were recovered by using a gel recovery kit (Qiagen). PCR products were purified and recovered using standard protocols. A sequencing library was constructed using a commercial library preparation kit, and its quality was assessed using the QuantiFluor™-ST system (Promega, Madison, WI, U.S.). Qualified libraries were subjected to high-throughput sequencing on the Illumina NextSeq 2000 platform (Shanghai Meiji Biomedical Technology Co., Ltd., China) to generate paired-end reads for downstream analysis.
2.4. Statistical Analysis
Microsoft Excel 2021 software was employed to organize the preliminary data, and SPSS 27.0 software was utilized to conduct two-way ANOVA, with Duncan’s method being implemented to assess the significance of the observed differences (p < 0.05) [23]. Additionally, TBtools-II was employed for data plotting [24]. And the experimental data were analyzed using the cloud platform (https://cloud.majorbio.com, accessed on 22nd November, 2024) provided by Shanghai Meiji Biomedical Technology Co.
3. Results
3.1. Effect of Biochar Application on Soil pH in Tea Plantation
The application of three distinct types of biochar exhibited a variable impact on the soil pH of tea plantations (Figure 1). After a 15-day incubation period, except for 0.5% corn biochar treatment (YM1), the pH of the soil in the tea plantation of each treatment exhibited a significant increase in soil pH in the tea plantation (p < 0.05), among which 1.0% coconut shell biochar treatment (YK2) had the best effect, and the pH increased by 0.29 units compared with the control. At 30 days, the pH of the 1% coconut biochar treatment (YK2) remained significantly higher (p < 0.05) compared to the other treatments, with an increase at about 7.6 % compared to the control. While the 1% corn stover biochar treatment (YM2) showed no significant difference from the control, it maintained elevated pH levels, whereas all other treatments induced significant pH increases (p < 0.05). After 45 days of incubation, both reed biochar (LW1, LW2) and coconut husk biochar (YK1, YK2) treatments significantly enhanced soil pH (p < 0.05), with LW2 displaying the greatest improvement (0.12-unit increase). Conversely, corn biochar treatments (YM1 and YM2) reduced soil pH, particularly the 0.5% application (YM1), which decreased pH by 0.07 units.
3.2. Effect of Biochar Application on Soil Enzyme Activity in Tea Plantation
Catalase (CAT) is an important oxidoreductase found in all living things. It prevents the peroxidation of membrane lipids and mitigates the damage caused by hydrogen peroxide to the organism [25,26,27]. Biochar application significantly influenced CAT activity in tea plantation soil (Figure 2a). At 15 days post-application, all treatments increased CAT activity except the 0.5% coconut shell biochar (YK1), which showed no significant difference from the control. Notably, the 1.0% maize biochar treatment (YM2) induced a 3.94-fold increase in CAT activity compared to the control. By day 30, the 1.0% coconut shell biochar group (YK2) exhibited the highest CAT activity, surpassing other treatments with a 46.05% elevation relative to the control (p < 0.05). In contrast, neither corn stover biochar (YM1, YM2) nor reed biochar (LW1, LW2) applications demonstrated significant differences in CAT activity compared to the control at this stage. After 45 days, CAT activity increased significantly (p < 0.05) in soils amended with 0.5% reed biochar (LW1) and 0.5% coconut shell biochar (YK1), with YK1 showing exceptional efficacy—triggering a 104.12% surge in CAT activity versus the control.
Soil urease, a pivotal enzyme, facilitates the hydrolysis of carbon-hydrogen bonds in urea and organic matter, thereby potentially reflecting the nitrogen level of the soil to a certain extent [28,29]. Biochar amendments significantly enhanced soil urease activity in tea plantations during incubation (Figure 2b). At 15 days, the 1.0% corn stover biochar (YM2) and both coconut shell biochar concentrations (YK1, YK2) elevated urease activity significantly above control levels (p < 0.05). The YM2 treatment showed exceptional efficacy, inducing a 1.76-fold increase in urease activity compared to the control. This stimulatory effect persisted throughout the incubation period. At both 30 and 45 days of incubation, the application of biochar significantly increased urease activity (p < 0.05).
At 30 days, the 1.0% coconut shell biochar (YK2) outperformed other treatments, achieving a 164.83% increase in urease activity compared to the control (p < 0.05). By day 45, the 0.5% coconut shell biochar (YK1) demonstrated maximal enhancement, elevating urease activity to 3.81 times control values. Notably, coconut shell biochar treatments maintained consistent efficacy across concentrations at 45 days (p < 0.05), while other biochars exhibited concentration-dependent responses, indicating that as the concentration of biochar application increased, so did the urease activity.
3.3. Effects of Biochar Application on Soil Nutrient Content in Tea Plantation
Considering the data on changes in soil pH, catalase activity, and urease activity during the 45-day incubation, the following biochar were selected: LW1 (0.5% Reed biochar), YM1 (0. 5% Corn stover biochar), and YK1 (0.5% Coconut shell biochar) for further examination of the effects of biochar on the soil fertility indexes and microbial communities in Tea Plantation. Concurrently, to assess the impact of varying concentrations of a specific biochar type on tea plantation soils, a higher concentration of YK2 (1.0% coconut shell biochar) was incorporated.
As shown in Table 2, after a 45-day application, the four treatments (LW1, YM1, YK1, and YK2) showed no significant differences (p > 0.05) in total nitrogen (TN), total phosphorus (TP), and total potassium (TK) levels when compared to the control group (CK). However, the YK2 treatment (1.0% coconut shell biochar) demonstrated a more pronounced effect, elevating the total nitrogen, phosphorus, and potassium content by 8%, with recorded values of 50%, 3.80%, and 8.90%, respectively. Regarding the availability of readily available nutrients in the tea plantation soil, the application of 1.0% coconut shell biochar (YK2) and 0.5% corn stover biochar (YM1) significantly increased the AP content compared to the control group (CK) (p < 0.05). In contrast, the application of 0.5% reed biochar (LW1) resulted in a significant reduction in AP levels (p < 0.05). Notably, biochar application did not exert a significant influence on the AK or AN content (p > 0.05). Addtionally, the YK2 treatment increased the organic matter content to 1.45 times that of the control, significantly outperforming the YK1, YM1, and LW1 treatments. These results indicate that the YK2 treatment (1.0% coconut shell biochar) possesses a superior capacity to improve soil nutrient availability and organic matter content, making it as a promising amendment for enhancing soil fertility in tea plantation ecosystems.
3.4. Effects of Biochar on Microbial Community Richness and Diversity
In this study, a total of 12 samples were analyzed, producing 735,956 optimized bacterial 16S sequences and 748,955 fungal ITS sequences. The alpha diversity rarefaction curves demonstrated adequate sequencing depth, having reached saturation. This ensures the minimal underestimation of operational taxonomic unit (OTU) richness. Alpha diversity indices, including the ACE index, Chao1 index, Shannon index, and Simpson index, are critical metrics for evaluating species richness and diversity within ecosystems [30]. As presented in Table 3, the application of coconut shell biochar (YK2) significantly influenced the fungal community in tea plantation soil, as evidenced by an increase in the Shannon index and a corresponding decrease in the Simpson index. This trend suggests enhanced fungal community diversity following biochar treatment. In contrast, the application of reed biochar (LW1) exhibited an opposite trend, indicating a potential reduction in fungal diversity. Notably, high-concentration biochar treatments led to substantial increases in the ACE index (161.06%) and Chao1 index (163.95%), although these changes were not statistically significant (p > 0.05). Further analysis of operational taxonomic units (OTUs) revealed distinct patterns in fungal community composition (Figure 3 a). The number of OTUs in the CK (control), LW1, YK1, and YK2 treatments were 739, 649, 481, and 775, respectively, with the YK2 treatment exhibiting the highest OTU count. Among these, 206 OTUs (14.88% of the total) were shared across all four treatments. The number of unique OTUs specific to CK, LW1, YK1, and YK2 were 209, 176, 87, and 235, respectively, with YK2 harboring the highest proportion of unique OTUs (16.98%). Pairwise comparisons of shared OTUs revealed that CK and YK2 shared the highest number of OTUs (90), surpassing those shared between CK and YK1 (40) or CK and LW1 (52).
As shown in Table 4, the Shannon index of the soil bacterial community in the tea plantation increased and the Simpson index decreased after the application of biochar. This indicates that the diversity of the bacterial community increased. However, the application of biochar at high concentrations led to a decline in the ACE index and Chao index of the bacterial community, though these reductions did not attain statistical significance. The application of 0.5% coconut shell biochar (YK) and 0.5% reed biochar (LW) exhibited no significant difference in bacterial alpha diversity. As illustrated in Figure 3b, for soil bacteria in the tea plantation, the number of OTUs present in the samples from the CK, LW, YK1, and YK2 treatments at the OTU level were 3492, 3700, 3650, and 3384, respectively, with the LW treatment exhibiting the highest number of OTUs. The four treatments shared 43.45% of the OTUs (2283 OTUs). The number of OTUs unique to CK, LW, YK1, and YK2 were 384, 416, 474, and 270, respectively, with YK1 having the most OTUs unique to YK1 (9.02%) with more unique bacteria. The remaining OTUs were shared by both samples, and CK and YK1 alone shared the most OTUs (138), higher than YK1 (95), and YK2 (99).
3.5. Effects of Biochar on Microbial Community Composition
A total of 494 fungal operational taxonomic units (OTUs) were identified across 12 soil samples, classified into 15 phyla, 51 classes, 117 orders, 223 families, 368 genera, and 494 species. At the phylum level (Figure 4a), the dominant taxa included Ascomycota, Basidiomycota, Mortierellomycota, and unclassified fungi, collectively accounting for 97.87–98.85% of the relative abundance. Other phyla exhibited significantly lower representation. Compared to CK, the relative abundance of Mortierellomycota increased in the LW treatment, while Ascomycota showed an increase in the YK1 treatment. As shown in Figure 4b, at the class level, Bacilli, Alphaproteobacteria, Acidobacteriae, and Ktedonobacteria exhibited high relative abundances (>1%), collectively accounting for 46.79–64.66% of the total bacterial classes. Compared with CK, the LW, YK1, and YK2 treatments all led to a reduction in the relative abundance of Bacilli, particularly in the YK2 treatment, which showed a significant decrease (p < 0.05). Concurrently, these treatments increased the relative abundance of Alphaproteobacteria. Additionally, the YK2 treatment significantly enhanced the relative abundance of Gemmatimonadetes, demonstrating statistically significant differences compared to other treatments (p < 0.05). At the genus level (Figure 4 c), 88.56% of the soil fungal community was identified, while 11.44% remained unclassified. The proportion of unclassified fungi increased with biochar application, rising from 11.44% to 15.43%. The dominant fungal genera with relative abundances exceeding 1% included Saitozyma (18.14%), Trichoderma (10.52%), Mortierella (15.32%), Oidiodendron (5.90%), unclassified genera (5.38%), Exophiala (4.32%), and 16 others. Biochar application generally increased the relative abundance of unclassified fungal genera while reducing the abundance of Trichoderma. Specifically, the relative abundance of Trichoderma in the biochar-treated groups (LW, YK1, YK2) was significantly lower than in the control group (p < 0.05). Furthermore, the application of 0.5% reed biochar (LW) and coconut shell biochar (YK1) reduced the relative abundance of Saitozyma and Oidiodendron compared to CK.
As illustrated in Figure 5a, at the phylum level, the dominant taxa included Proteobacteria, Firmicutes, Chloroflexi, Acidobacteriota, and Actinobacteriota, collectively accounting for 80.73–83.50% of the relative abundance. Notably, the YK2 treatment significantly increased the relative abundance of Actinobacteriota and Gemmatimonadota while significantly decreasing the relative abundance of Firmicutes compared to the CK. At the class level (Figure 5b), Bacilli, Alphaproteobacteria, Acidobacteriae, and Ktedonobacteria were the most abundant groups, with a combined relative abundance ranging from 46.79% to 64.66%. The proportion of unidentified bacteria increased with biochar application. Compared to CK, the relative abundance of Bacilli decreased in the LW, YK1, and YK2 treatments, with the YK2 treatment showing a statistically significant reduction (p < 0.05). Conversely, the relative abundance of Alphaproteobacteria increased across all treatments. Additionally, the YK2 treatment significantly enhanced the relative abundance of Gemmatimonadetes compared to other treatments (p < 0.05). At the genus level (Figure 5 c), 64.68% of the soil bacterial community was identified. The dominant bacterial genera with relative abundances exceeding 1% included Bacillus (12.05%), unclassified Acidobacteria (6.08%), unclassified JG30-KF-AS9 (5.65%), Sphingomonas (3.59%), Tumebacillus (3.80%), and unclassified WPS-2 (3.63%). Biochar application generally reduced the relative abundance of Bacillus, unclassified Acidobacteria, Tumebacillus, and unclassified WPS-2. Specifically, the YK2 treatment significantly decreased the relative abundance of Bacillus, unclassified Acidobacteria, and unclassified WPS-2 compared to CK (p < 0.05). Furthermore, the application of 0.5% reed biochar (LW) increased the abundance of Ktedonobacteraceae by 4.54 times compared to CK, while significantly reducing the relative abundance of unclassified Acidobacteria (p < 0.05).
3.6. Differences in Microbial Community Populations in Tea Plantations
LEfSe analysis can be utilized to examine the disparities in bacterial and fungal communities among various treatments and to ascertain the prevalent species within each treatment [31]. Bacterial community composition in the four treatments was analyzed using LEfSe with a default LDA threshold of 2.0 (Figure 6a). The CK treatment group exhibited 2 key discriminant bacterial taxa (LDA > 2), while the LW (0.5% reed biochar), YK1 (0.5% coconut shell biochar), and YK2 (1.0% coconut shell biochar) treatments showed 5, 10, and 12 significantly discriminative taxa, respectively. These results indicate that biochar application increased the abundance of dominant bacterial populations in tea soil, with coconut shell biochar demonstrating superior efficacy compared to reed biochar. Notably, the higher application rate (1.0%) of coconut shell biochar yielded more pronounced effects than the 0.5% dosage. For fungal communities, LEfSe analysis was performed with a default LDA threshold of 3.5 (Figure 6b). The CK treatment contained 2 key discriminant fungal taxa (LDA > 3.5), whereas the LW, YK1, and YK2 treatments harbored 1, 4, and 2 discriminative taxa, respectively. Biochar amendments moderately enhanced fungal abundance in tea soil, with coconut shell biochar again outperforming reed biochar in efficacy.
3.7. Correlations Between Soil Environmental Factors and Microbial Community Structure
To explore the relationships between soil microbial communities and soil physicochemical properties, Spearman’s correlation analysis was conducted between key soil enzymes, physicochemical indices, and the top 10 phyla and 50 genera with the highest relative abundance (Figure 7). For the Soil Bacterial Community: At the phylum level (Figure 7 a), soil organic matter content exhibited a significant negative correlation with the Acidobacteriota. Total phosphorus content showed a significant positive correlation with the Myxomycota, while available nitrogen content was significantly positively correlated with the Firmicutes. At the genus level (Figure 7c), soil pH, catalase activity, soil organic matter, total nitrogen, total phosphorus, total potassium, available nitrogen, available phosphorus, and available potassium were significantly or highly significantly correlated (positively or negatively) with the relative abundance of 1, 5, 7, 2, 8, 7, 9, 2, and 1 bacterial genera, respectively. Notably, urease activity was significantly and positively correlated only with the genus Ramlibacter.
For the Soil Fungal Community: At the phylum level (Figure 7 b), total phosphorus and total potassium contents were significantly and positively correlated with the Chytridiomycota. Available nitrogen content showed a significant negative correlation with the Zoopagomycota, while available phosphorus content was significantly positively correlated with Fungi_phy_Incertae_sedis. At the genus level (Figure 7 d), soil pH, catalase, urease, soil organic matter, total nitrogen, total phosphorus, total potassium, available nitrogen, available phosphorus, and available potassium were significantly or highly significantly correlated (positively or negatively) with the relative abundance of 5, 3, 3, 4, 3, 4, 5, 2, 1, and 2 fungal genera, respectively. Among these, Metarhizium exhibited highly significant or significant positive correlations with urease activity, soil organic matter, and total nitrogen content.
4. Discussion
4.1. Effects of Biochar on Soil pH in Tea Plantations
Biochar is an effective means of resource utilization. Its well-developed surface pore structure, large specific surface area, and abundant oxygen-containing functional groups make it a valuable soil amendment. When applied to soil, biochar can enhance soil physicochemical properties, improve the soil microbiological environment, and serve as an excellent buffer for soil acidity and alkalinity [32,33]. In this study, the results demonstrated that biochar application could increase soil pH in tea plantations over a 45-day incubation period, consistent with findings from previous research [34,35,36]. Specifically, application of coconut shell biochar consistently and significantly increased soil pH by 0.08 to 0.29 units compared to the control (CK). While at 30 days of incubation, the application of 1.0% reed biochar (LW2) did not significantly alter soil pH compared to the control. And the application of corn stover biochar initially increased soil pH but subsequently decreased it. The increase in soil pH following biochar application can be attributed to its alkaline properties and the presence of saline ions such as Ca2⁺, Mg2⁺, and K⁺. These components neutralized soil acidity by reducing the concentration of H⁺ and exchangeable Al3⁺, thereby alleviating soil acidification [37,38]. And the differential effects of biochar types on soil pH were influenced by their physicochemical properties, which were determined by the raw materials and preparation conditions. For instance, coconut shell biochar was derived from fruit kernels and shells, this biochar had a larger specific surface area and more developed microporous structure compared to biochar produced from agricultural waste (e.g., reed stover, corn stover) [39], which retarded alkaline release via microporous confinement. And the properties of biochar, including its impact on soil pH, were also influenced by pyrolysis temperature and preparation methods [40,41], a higher temperature in producing coconut shell biochar made it had a higher pH and better ability in mitigating soil acidification. As for the biphasic regulation in corn stover biochar (YM), it might result from the water-soluble ashes at the beginning and following acidification due to carboxyl protonation. And the neutral effect in reed biochar (LW)could lie in its optimal CEC had a balance with the tea plantation soils. Detailed mechanisms need further investigations.
4.2. Effects of Biochar on Soil Enzyme Activity and Chemical Properties in Tea Plantationls
Soil enzymes are utilized across diverse agro-ecosystems as critical indicators of soil quality, playing a pivotal role in catalyzing and promoting material decomposition, nutrient cycling, and microbial functioning. [42,43]. Consequently, the findings of Chen et al. [44] demonstrated that biochar application enhanced biochemical reactions in soil, resulting in a substantial increase in enzyme activities, including urease and catalase. In this study, the findings demonstrated that the application of 0.5% biochar enhanced soil catalase activity, and the application of 0.5% and 1.0% biochar augmented urease activity. That might due to the high proportion of SOM and TN the biochar provided for the microbials (Table 3). At the 15-day incubation stage, the catalase activity of the YM2 treatment exhibited a 3.94-fold increase compared to the control treatment, while at the 45-day incubation stage, the CAT activity was lower (Figure 2a). This decline in CAT activity was concomitant with the initial increase and subsequent decrease in soil pH following the application of corn stover biochar (Figure 1), which held a positive relationship with the CAT activity [45]. After 30 days of incubation, the UE activity of YK2 was 1.30 times higher than that of YK1. However, at 45 days of incubation, the advantage was observed to revert to YK1 as a consequence of lower pH as well as AN content [46]. This reduction was likely due to the elevated soil C/N ratio resulting from excessive biochar application, which enhanced biological nitrogen fixation by soil microorganisms [47]. This finding indicated that moderate application of biochar, under specific conditions, might promote enzyme activity. Conversely, excessive application may yield undesirable outcomes. Additionally, the YK2 treatment significantly increased soil available phosphorus, which might link with the elevation of phosphatase activity that hadn’t been tested in this experiment.
4.3. Effects of Biochar on Microbial Communities in Tea Plantation Soils
It has been demonstrated that as the duration of tea plantation increases, the degree of soil acidification concomitantly rises, while the number and species of soil microorganisms decrease dramatically [48]. The results showed that the Shannon index and microbial community diversity increased after biochar application might due to increased SOC, AP and pH in the nutrient levels that provided a favorable environment for microbial growth and reproduction, thereby affecting the structure and function of the soil microbial community and enzyme activities. [49,50]. In that case, biochar application can reduce the loss of microbial diversity due to increasing tea planting age to some extent.
The application of biochar has been demonstrated to induce alterations in the composition of soil microbial communities, thereby impacting nitrifying, denitrifying, and nitrogen-fixing microbial activities [50]. The YK2 treatment (1.0% coconut shell biochar) significantly increased the relative abundances of Actinobacteriota and Gemmatimonadota while reducing Firmicutes compared to controls. This microbial restructuring aligns with biochar’s high carbon content promoted Actinobacteriota proliferation—a phylum enriched with nitrogen-fixing taxa reliant on small-molecule substrates [51,52]. And the pH elevation enhanced Gemmatimonadota dominance, a phylum linked to nutrient cycling efficiency and stress resilience under neutral conditions [53]. Additionally, while a significant positive correlation existed between available nitrogen and Firmicutes abundance, YK2 treatment reduced both available nitrogen (13.09%) and Firmicutes levels compared to controls. Concurrently, both YK2 and LW treatments led to a substantial decrease in the number of unclassified genera within the Acidobacteriota compared to the control group, a finding that was replicated by Xu et al. [54]. The acidophilic Acidobacteriota phylum, known for carbon metabolism and iron cycling functions [55], exhibited reduced abundance correlating with biochar-induced increases in soil organic matter and pH, suggesting niche modification favoring other microbial communities. Moreover, the application of 0.5% coconut shell biochar (YK1) significantly increased the abundance of Clostridium_sensu_stricto_13 compared to other treatments (p < 0.05), which was known for its non-symbiotic nitrogen fixation capacity that enhanced soil nitrogen availability and benefited plant growth [56]. The enrichment of this genus highlighted the potential of biochar to promote beneficial microbial functions that supported soil fertility and plant health.
This study also demonstrated that the application of biochar significantly influenced the composition of soil fungal communities in tea plantations. Specifically, the LW and YK treatments increased the relative abundance of the phyla Mortierellomycota and Ascomycota, respectively, compared to the control group. These findings aligned with previous research by Zhang et al. [23]. Mortierellomycota, a phylum consisted mainly of soil saprophytes that can dissolve soil mineral phosphorus and increase soil nutrient content by synthesizing and secreting oxalic acid.[57] The trend of its increase might result in the augment of AP. Though they didn’t show significant relationship that needed further investigation. Notably, the application of 1.0% coconut shell biochar (YK2) significantly increased the abundance of Metarhizium, which exhibited highly significant or significant positive correlations with urease activity, soil organic matter, and total nitrogen content. Metarhizium were insect endoparasitic pathogens with a broad host range and high pathogenicity, yet they were non-toxic to humans and plants [58]. The increased abundance of Metarhizium suggested its potential as an effective biological control agent against common tea tree pests, such as the E.obliqua and Helopeltis theivora [59,60], which can improve tea’s insect resistance.
5. Conclusions
This study demonstrated that biochar application significantly improved soil quality in Camellia sinensis ’Fuding Dabaicha’ tea plantations, particularly in mitigating soil acidification and enhancing microbial activity. Coconut shell biochar (YK) exhibited superior acid-neutralizing capacity (up to 0.29 units), attributed to its large pore structure enabling gradual release of alkaline minerals, while corn stover biochar (YM) showed biphasic pH modulation due to initial ash dissolution followed by carboxyl protonation highlighting feedstock-specific alkalinity effects. Meanwhile, the 1.0% YK treatment enhanced urease activity by 164.83% through microporous confinement effects promoting enzyme-substrate complexation, whereas excessive application (YK2) reduced catalase activity via C/N ratio elevation altering microbial electron transfer chains. Additionally, YK2 increased Actinobacteriota and Gemmatimonadota through carbon provision and pH increase, respectively, strengthening soil’s ability in nutrient cycling. And YK2 also improved tea plantations’ ability to resist pests by going up the abundance of Metarhizium. In conclusion, the 0.5–1.0% coconut shell biochar (YK) is recommended as the optimal amendment for acidic soil remediation in Sichuan tea plantations, which is beneficial for acidification mitigation, nutrient retention, and microbial health. However, further field trials are warranted to validate long-term efficacy and multi-omics integration in specific genes to decipher microbial functional networks should been taken into account in the near future.
Author Contributions
Conceptualization, D.T. and M.L.; Investigation, D.T., L.P. and M.L.; data curation, visualization, and writing—original draft preparation, M.L.; data acquisition, analysis, and validation, M.L., L.L., Y.A. ,L.P. and W.C; writing—review and editing, D.T. and M.L. Supervision, W.C and L.T. Project administration and funding acquisition, D.T., Q.T, and L.T. All authors have read and agreed to the published version of the manuscript.
Funding
This research was funded by the National Natural Science Foundation of China (32202538), the Department of Science and Technology of Sichuan Province (2024YFHZ0179, 2024NSFSC0402), and the Sichuan Innovation Team of National—Modern Agricultural Industry System (sccxtd-2024-10).
Data Availability Statement
The data that support the findings of this study are available on request from the corresponding authors.
Conflicts of Interest
The authors declare no conflicts of interest.
Abbreviations
The following abbreviations are used in this manuscript:
TN, Total Nitrogen; TP, Total Phosphorus; TK, Total Potassium; AP, Available Phosphorus; AK, Available Potassium; AN, Available Nitrogen. CK, no biochar application as control; YM1, 0.5%Corn stover biochar; YM2, 1.0% Corn stover biochar; LW1, 0.5% Reed biochar; LW2, 1.0% Reed biochar; YK1, 0.5% Coconut shell biochar; YK2, 1.0% Coconut shell biochar.
References
- Wang, X.P.; Sun, M.S.; Xiong, Y.Y.; Liu, X.; Li, C.H.; Wang, Y.; Tang, X.B. Restriction site-associated DNA sequencing (RAD-seq) of tea plant (Camellia sinensis) in Sichuan province, China, provides insights into free amino acid and polyphenol contents of tea. PLoS ONE 2024, 19(12), e0314144. [CrossRef]
- Xiao, Z.; Huang, X.J.; Zang, Z. Spatio-temporal variation and driving forces of tea production in China over the last 30 years. J. Geogr. Sci. 2018, 28(3), 275-290. [CrossRef]
- Wu, Q.Y.; Yang, J.F. Economic analysis of the change of tea production layout in China. J. Phys. Conf. Ser. 2020, 1629, 012048. [CrossRef]
- Zhang, T.; Liu, X.; Tang, X.B.; Zeng, X.Z.; Wang, Y.; Li, C.H. Analysis of Fertilization Status and Measures in Tea Plantations in Sichuan. Sichuan Agricultural Science and Technology 2021, 9, 39–40.
- Afshar, M.; Mofatteh, S. Biochar for a sustainable future: Environmentally friendly production and diverse applications. Results Eng. 2024, 23, 102433. [CrossRef]
- Tomczyk, A.; Sokołowska, Z.; Boguta, P. Biochar physicochemical properties: pyrolysis temperature and feedstock kind effects. Rev. Environ. Sci. Biotechnol. 2020, 19, 191–215. [CrossRef]
- Yadav, S.P.S.; Bhandari, S.; Bhatta, D.; Poudel, A.; Bhattarai, S.; Yadav, P.; Ghimire, N.; Paudel, P.; Paudel, P.; Shrestha, J.; Oli, B. Biochar application: A sustainable approach to improve soil health. J. Agric. Food Res. 2023, 11, 100498. [CrossRef]
- Oo, A.Z.; Sudo, S.; Akiyama, H.; Win, K.T.; Shibata, A.; Yamamoto, A.; Sano, T.; Hirono, Y. Effect of dolomite and biochar addition on N₂O and CO₂ emissions from acidic tea field soil. PLOS One 2018, 13, e0192235. [CrossRef]
- Zou, Z.H.; Mi, W.H.; Li, X.; Hu, Q.; Zhang, L.P.; Zhang, L.; Fu, J.Y.; Li, Z.Z.; Han, W.Y.; Yan, P. Biochar application method influences root growth of tea (Camellia sinensis L.) by altering soil biochemical properties. Sci. Hortic. 2023, 315, 111960. [CrossRef]
- Chen, P.F.; Liu, Y.Z.; Mo, C.Y.; Jiang, Z.H.; Yang, J.P.; Lin, J.D. Microbial mechanism of biochar addition on nitrogen leaching and retention in tea soils from different plantation ages. Sci. Total Environ. 2021, 757, 143817. [CrossRef]
- Wang, Z.; Liu, S.; Ruan, Y.; Wang, Q.; Zhang, Z. Comparison of Biochar- and Lime-Adjusted pH Changes in N2O Emissions and Associated Microbial Communities in a Tropical Tea Plantation Soil. Agronomy 2023, 13, 1144. [CrossRef]
- Luo, Y.; Zhang, Y.; Wang, Y.; Sun, Y.; Xia, X.; Su, Y.; Liao, W. Combined Application of Biochar and Pruned Tea Plant Litter Benefits Nitrogen Availability for Tea and Alters Microbial Community Structure. Agronomy 2023, 13, 1465. [CrossRef]
- Wang, Y.X.; Huang, J.Q.; Ye, J.; Li, Y.C.; Lin, Y.; Liu, C.W. Effects of Biochar Application on Soil Properties and Fungi Community Structure in Acidified Tea Garden. Journal of Tea Science 2021, 41, 419-429. [CrossRef]
- Wang, F.; Chen, Y.Z.; Wu, Z.D.; Jiang, F.Y.; Yu, W.Q.; You, Z.M. Effects of Reduced Chemical Fertilizer Applications on Fungal Community and Functional Groups in Tea Plantation Soil. Acta Tea Sinica 2021, 62, 170-178.
- Kuang, C.T.; Jiang, C.Y.; Li, Z.P.; Hu, F. Effects of Biochar Amendments on Soil Organic Carbon Mineralization and Microbial Biomass in Red Paddy Soils. Soils 2012, 44, 570-575. [CrossRef]
- Trasar-Cepeda, C.; Camiña, F.; Leirós, M.C.; Gil-Sotres, F. An improved method to measure catalase activity in soils. Soil Biol. Biochem. 1999, 31(3), 483-485. [CrossRef]
- Bremner, J.M. Determination of nitrogen in soil by the Kjeldahl method. J. Agric. Sci. 1960, 55(1), 11-33. [CrossRef]
- Dick, W.A.; Tabatabai, M.A. An Alkaline Oxidation Method for Determination of Total Phosphorus in Soils†. Soil Sci. Soc. Am. J. 1977, 41(3), 511-514. [CrossRef]
- Wang, F.; Liang, Y.; Jiang, Y.; et al. Planting increases the abundance and structure complexity of soil core functional genes relevant to carbon and nitrogen cycling. Sci. Rep. 2015, 5, 14345. [CrossRef]
- Nelson, D.L.; Crandall, S.H. Power Flow and Energy Relations in a Cello-Stage-Air System. J. Acoust. Soc. Am. 1974, 55(2_Supplement), 456–457. [CrossRef]
- Mehlich, A. Mehlich 3 soil test extractant: A modification of Mehlich 2 extractant. Commun. Soil Sci. Plant Anal. 1984, 15(12), 1409–1416. [CrossRef]
- Inorganic Forms of Nitrogen. In Handbook of Soil Analysis; Springer: Berlin, Heidelberg, 2006; pp 767–792. https://doi.org/10.1007/978-3-540-31211-6_28. [CrossRef]
- Zhang, Y.; Yang, W.H.; Zhou, B.Q.; Yang, J.; Xing, S.H. Effect of Biochar-based fertilizer on soil bacteria and fungi quantity and community structure in acidified tea garden. J. Fujian Agric. Forest. Univ. (Nat. Sci. Ed.) 2023, 52, 247-257. [CrossRef]
- Chen, C.J.; Wu, Y.; Li, J.W.; Wang, X.; Zeng, Z.H.; Xu, J.; Liu, Y.L.; Feng, J.T.; Chen, H.; He, Y.H.; Xia, R. TBtools-II: A “one for all, all for one” bioinformatics platform for biological big - data mining. Mol. Plant 2023, 16, 1733 - 1742. [CrossRef]
- Jia, Q.; Sun, J.H.; Gan, Q.Y.; Shi, N.N.; Fu, S.L. Zea mays cultivation, biochar, and arbuscular mycorrhizal fungal inoculation influenced lead immobilization. Microbiol. Spectrum 2024, 12(4). [CrossRef]
- Stpniewska, Z.; Wolińska, A.; Ziomek, J. Response of soil catalase activity to chromium contamination. J. Environ. Sci. 2009, 21(8), 1142-1147. [CrossRef]
- Wang, H.Y.; Wu, J.Q.; Li, G.; Yan, L.J. Changes in soil carbon fractions and enzyme activities under different vegetation types of the northern Loess Plateau. Ecol. Evol. 2020, 10(21), 12211-12223. [CrossRef]
- Xu, Y.X.; He, L.L.; Liu, Y.X.; Lü, H.H.; Wang, Y.Y.; Chen, J.Y.; Yang, S.M. Effects of biochar addition on enzyme activity and fertility in paddy soil after six years. Chin. J. Appl. Ecol. 2019, 30, 1110-1118. [CrossRef]
- Pettit, N.M.; Smith, A.R.J.; Freedman, R.B.; Burns, R.G. Soil urease: Activity, stability and kinetic properties. Soil Biol. Biochem. 1976, 8(6), 479-484. [CrossRef]
- Walters, K.E.; Martiny, J.B.H. Alpha-, beta-, and gamma-diversity of bacteria varies across habitats. PLoS ONE 2020, 15(9), e0233872. [CrossRef]
- Lin, H.; Peddada, S.D. Analysis of microbial compositions: a review of normalization and differential abundance analysis. npj Biofilms Microbiomes 2020, 6, 60. [CrossRef]
- Yang, X.C.; Hou, R.J.; Fu, Q.; Li, T.X.; Li, M.; Cui, S.; Li, Q.L.; Liu, M.X. A critical review of biochar as an environmental functional material in soil ecosystems for migration and transformation mechanisms and ecological risk assessment. J. Environ. Manag. 2024, 360, 121196. [CrossRef]
- Kuryntseva, P.; Karamova, K.; Galitskaya, P.; Selivanovskaya, S.; Evtugyn, G. Biochar Functions in Soil Depending on Feedstock and Pyrolyzation Properties with Particular Emphasis on Biological Properties. Agriculture 2023, 13, 2003. [CrossRef]
- Yan, P.; Shen, C.; Zou, Z.H.; Fu, J.Y.; Li, X.; Zhang, L.P.; Zhang, L.; Han, W.Y.; Fan, L.C. Biochar stimulates tea growth by improving nutrients in acidic soil. Sci. Hortic. 2021, 283, 110078. [CrossRef]
- Wang, H., Hu, T., Wang, M. et al. Biochar addition to tea garden soils: effects on tea fluoride uptake and accumulation. Biochar 5, 37 (2023). [CrossRef]
- Chu, L.; Hennayake, H.M.K.D.; Sun, H. Biochar effectively reduces ammonia volatilization from nitrogen - applied soils in tea and bamboo plantations. Phyton - Int. J. Exp. Bot. 2019, 88, 261–267. [CrossRef]
- Bolan, N.; Sarmah, A.K.; Bordoloi, S.; Bolan, S.; Padhye, L.P.; Van Zwieten, L.; Sooriyakumar, P.; Khan, B.A.; Ahmad, M.; Solaiman, Z.M.; Rinklebe, J.; Wang, H.L.; Singh, B.P.; Siddique, K.H.M. Soil acidification and the liming potential of biochar. Environ. Pollut. 2023, 317, 120632. [CrossRef]
- Shi, R.Y.; Li, J.Y.; Ni, N.; Xu, R.K. Understanding the biochar's role in ameliorating soil acidity. J. Integr. Agric. 2019, 18(7), 1508-1517. [CrossRef]
- Ighalo, J.O.; Conradie, J.; Ohoro, C.R.; Amaku, J.F.; Oyedotun, K.O.; Maxakato, N.W.; Akpomie, K.G.; Okeke, E.S.; Olisah, C.; Malloum, A.; Adegoke, K.A. Biochar from coconut residues: An overview of production, properties, and applications. Ind. Crops Prod. 2023, 204(Pt A), 117300. [CrossRef]
- Guo, S.S.; Awasthi, M.K.; Wang, Y.F.; Xu, P. Current understanding in conversion and application of tea waste biomass: A review. Bioresour. Technol. 2021, 338, 125530. [CrossRef]
- Jian, M.F.; Gao, K.F.; Yu, H.P. Effects of different pyrolysis temperatures on the preparation and characteristics of biochar from rice straw. Acta Sci. Circumstantiae 2016, 36(05), 1757-1765. [CrossRef]
- Tiwari, R.; Dwivedi, B.S.; Sharma, Y.M.; Sharma, A.; Dwivedi, A.K. Activities of β - glucosidase, Phosphatase and Dehydrogenase as Soil Quality Indicators: A Review. Int. J. Curr. Microbiol. Appl. Sci. 2019, 8(06), 834-846. [CrossRef]
- Liu, M.; Gan, B.; Li, Q.; Xiao, W.; Song, X. Effects of Nitrogen and Phosphorus Addition on Soil Extracellular Enzyme Activity and Stoichiometry in Chinese Fir (Cunninghamia lanceolata) Forests. Front. Plant Sci. 2022, 13, 834184. [CrossRef]
- Chen, X.X.; Geng, Z.C.; Wang, S.; Zhao, H.F. Effects of Biochar Amendment on Microbial Biomass and Enzyme Activities in Loess Soil. J. Agro-Environ. Sci. 2014, 33, 751-758.
- Liu, J.; Li, X.Y.; Zhu, Q.L.; Zhou, J.W.; Shi, L.F.; Lu, W.H.; Bao, L.; Meng, L.; Wu, L.H.; Zhang, N.M.; Christie, P. Differences in the activities of six soil enzymes in response to cadmium contamination of paddy soils in high geological background areas. Environ. Pollut. 2024, 346, 123704. [CrossRef]
- Jiao, X.G.; Gao, C.S.; Lü, G.H.; Sui, Y.Y. Effect of Long-Term Fertilization on Soil Enzyme Activities Under Different Hydrothermal Conditions in Northeast China. Agric. Sci. China 2011, 10(3), 412-422. [CrossRef]
- Li, Y.C.; Li, Z.; Li, Z.W.; Jiang, Y.H.; Weng, B.Q.; Lin, W.X. Variations of rhizosphere bacterial communities in tea (Camellia sinensis L.) continuous cropping soil by high - throughput pyrosequencing approach. J. Appl. Microbiol. 2016, 121, 787-799. [CrossRef]
- Wang, S.Q.; Li, T.X.; Zheng, Z.C. Response of soil aggregate-associated microbial and nematode communities to tea plantation age. Catena 2018, 171, 475-484. [CrossRef]
- Han, Z.Q.; Xu, P.S.; Li, Z.T.; Lin, H.Y.; Zhu, C.; Wang, J.Y.; Zou, J.W. Microbial diversity and the abundance of keystone species drive the response of soil multifunctionality to organic substitution and biochar amendment in a tea plantation. GCB Bioenergy 2022, 14(4), 481-495. [CrossRef]
- Feng, H.L.; Xu, C.S.; He, H.H.; Zeng, Q.; Chen, N.; Li, X.L.; Liu, G.S. Effects of Biochar on Soil Enzyme Activity & the Bacterial Community and Its Mechanism. Environ. Sci. 2021, (01), 422-432. [CrossRef]
- Wang, H.K.; Wu, Y.B.; Liu, J.P.; Xue, J.H. A Review of Research Advances in the Effects of Biochar on Soil Nitrogen Cycling and Its Functional Microorganisms. J. Ecol. Rural Environ. 2022, (06), 689-701. [CrossRef]
- Zheng, W.L.; Zhao, H.B.; Han, B.; Fan, Y.F.; Zhang, T.; Zhang, X.F.; Bai, X. Changes of Soil Microbial Community Structure and Diversity in Plant Growing Season of Degraded Grassland. Chin. J. Grassl. Sci. 2021, (10), 46-54. [CrossRef]
- Mujakić, I.; Piwosz, K.; Koblížek, M. Phylum Gemmatimonadota and Its Role in the Environment. Microorganisms 2022, 10, 151. [CrossRef]
- Xu, W.H.; Xu, H.M.; Delgado-Baquerizo, M.; Gundale, M.J.; Zou, X.M.; Ruan, H.H. Global meta - analysis reveals positive effects of biochar on soil microbial diversity. Geoderma 2023, 436, 116528. [CrossRef]
- Kielak, A.M.; Barreto, C.C.; Kowalchuk, G.A.; van Veen, J.A.; Kuramae, E.E. The Ecology of Acidobacteria: Moving beyond Genes and Genomes. Front. Microbiol. 2016, 7, 744. [CrossRef]
- Li, C.J.; Zhang, Z.; Zhan, P.C.; Lv, A.P.; Li, P.P.; Liu, L.; Li, W.J.; Yang, L.L.; Zhi, X.Y. Comparative genomic analysis and proposal of Clostridium yunnanense sp. nov., Clostridium rhizosphaerae sp. nov., and Clostridium paridis sp. nov., three novel Clostridium sensu stricto endophytes with diverse capabilities of acetic acid and ethanol production. Anaerobe 2023, 79, 102686. [CrossRef]
- Wang, S.; Cheng, J.; Li, T.; Liao, Y. Response of soil fungal communities to continuous cropping of flue-cured tobacco. Sci. Rep. 2020, 10, 19911. [CrossRef]
- Sheng, H.Y.; McNamara, P.J.; St. Leger, R.J. Metarhizium: an opportunistic middleman for multitrophic lifestyles. Curr. Opin. Microbiol. 2022, 69, 102176. [CrossRef]
- Zhao, J.; Chen, Y.; Keyhani, N.O.; Wang, C.; Li, Y.; Pu, H.; Li, J.; Liu, S.; Lai, P.; Zhu, M.; He, X.; Cai, S.; Guan, X.; Qiu, J. Isolation of a highly virulent Metarhizium strain targeting the tea pest, Ectropis obliqua. Front. Microbiol. 2023, 14, 1164511. [CrossRef]
- Bhattacharyya, P.N.; Nath, B.C.; Sarma, B.; Al-Ani, L.K.T.; Borgohain, D.J.; Garganese, F.; Ahmed, S.; Batsya, S.; Mudoi, A.; Kumari, R. Interaction of Metarhizium anisopliae Against Emergent Insect Pest Problems in the North-Eastern Tea Industry. In Entomopathogenic Fungi; Deshmukh, S.K., Sridhar, K.R., Eds.; Springer: Singapore, 2024; pp. 319–357. [CrossRef]
Figure 1.
Effect of application of different biochar treatments on soil pH changes in tea plantation during 45 days incubation. Different lowercase letters indicate significant differences between treatments after the same treatment time (p < 0.05). CK, no biochar application as control; YM1, 0.5% Corn stover biochar; YM2, 1.0% Corn stover biochar; LW1, 0.5% Reed biochar; LW2, 1.0% Reed biochar; YK1, 0.5% Coconut shell biochar; YK2, 1.0% Coconut shell biochar.
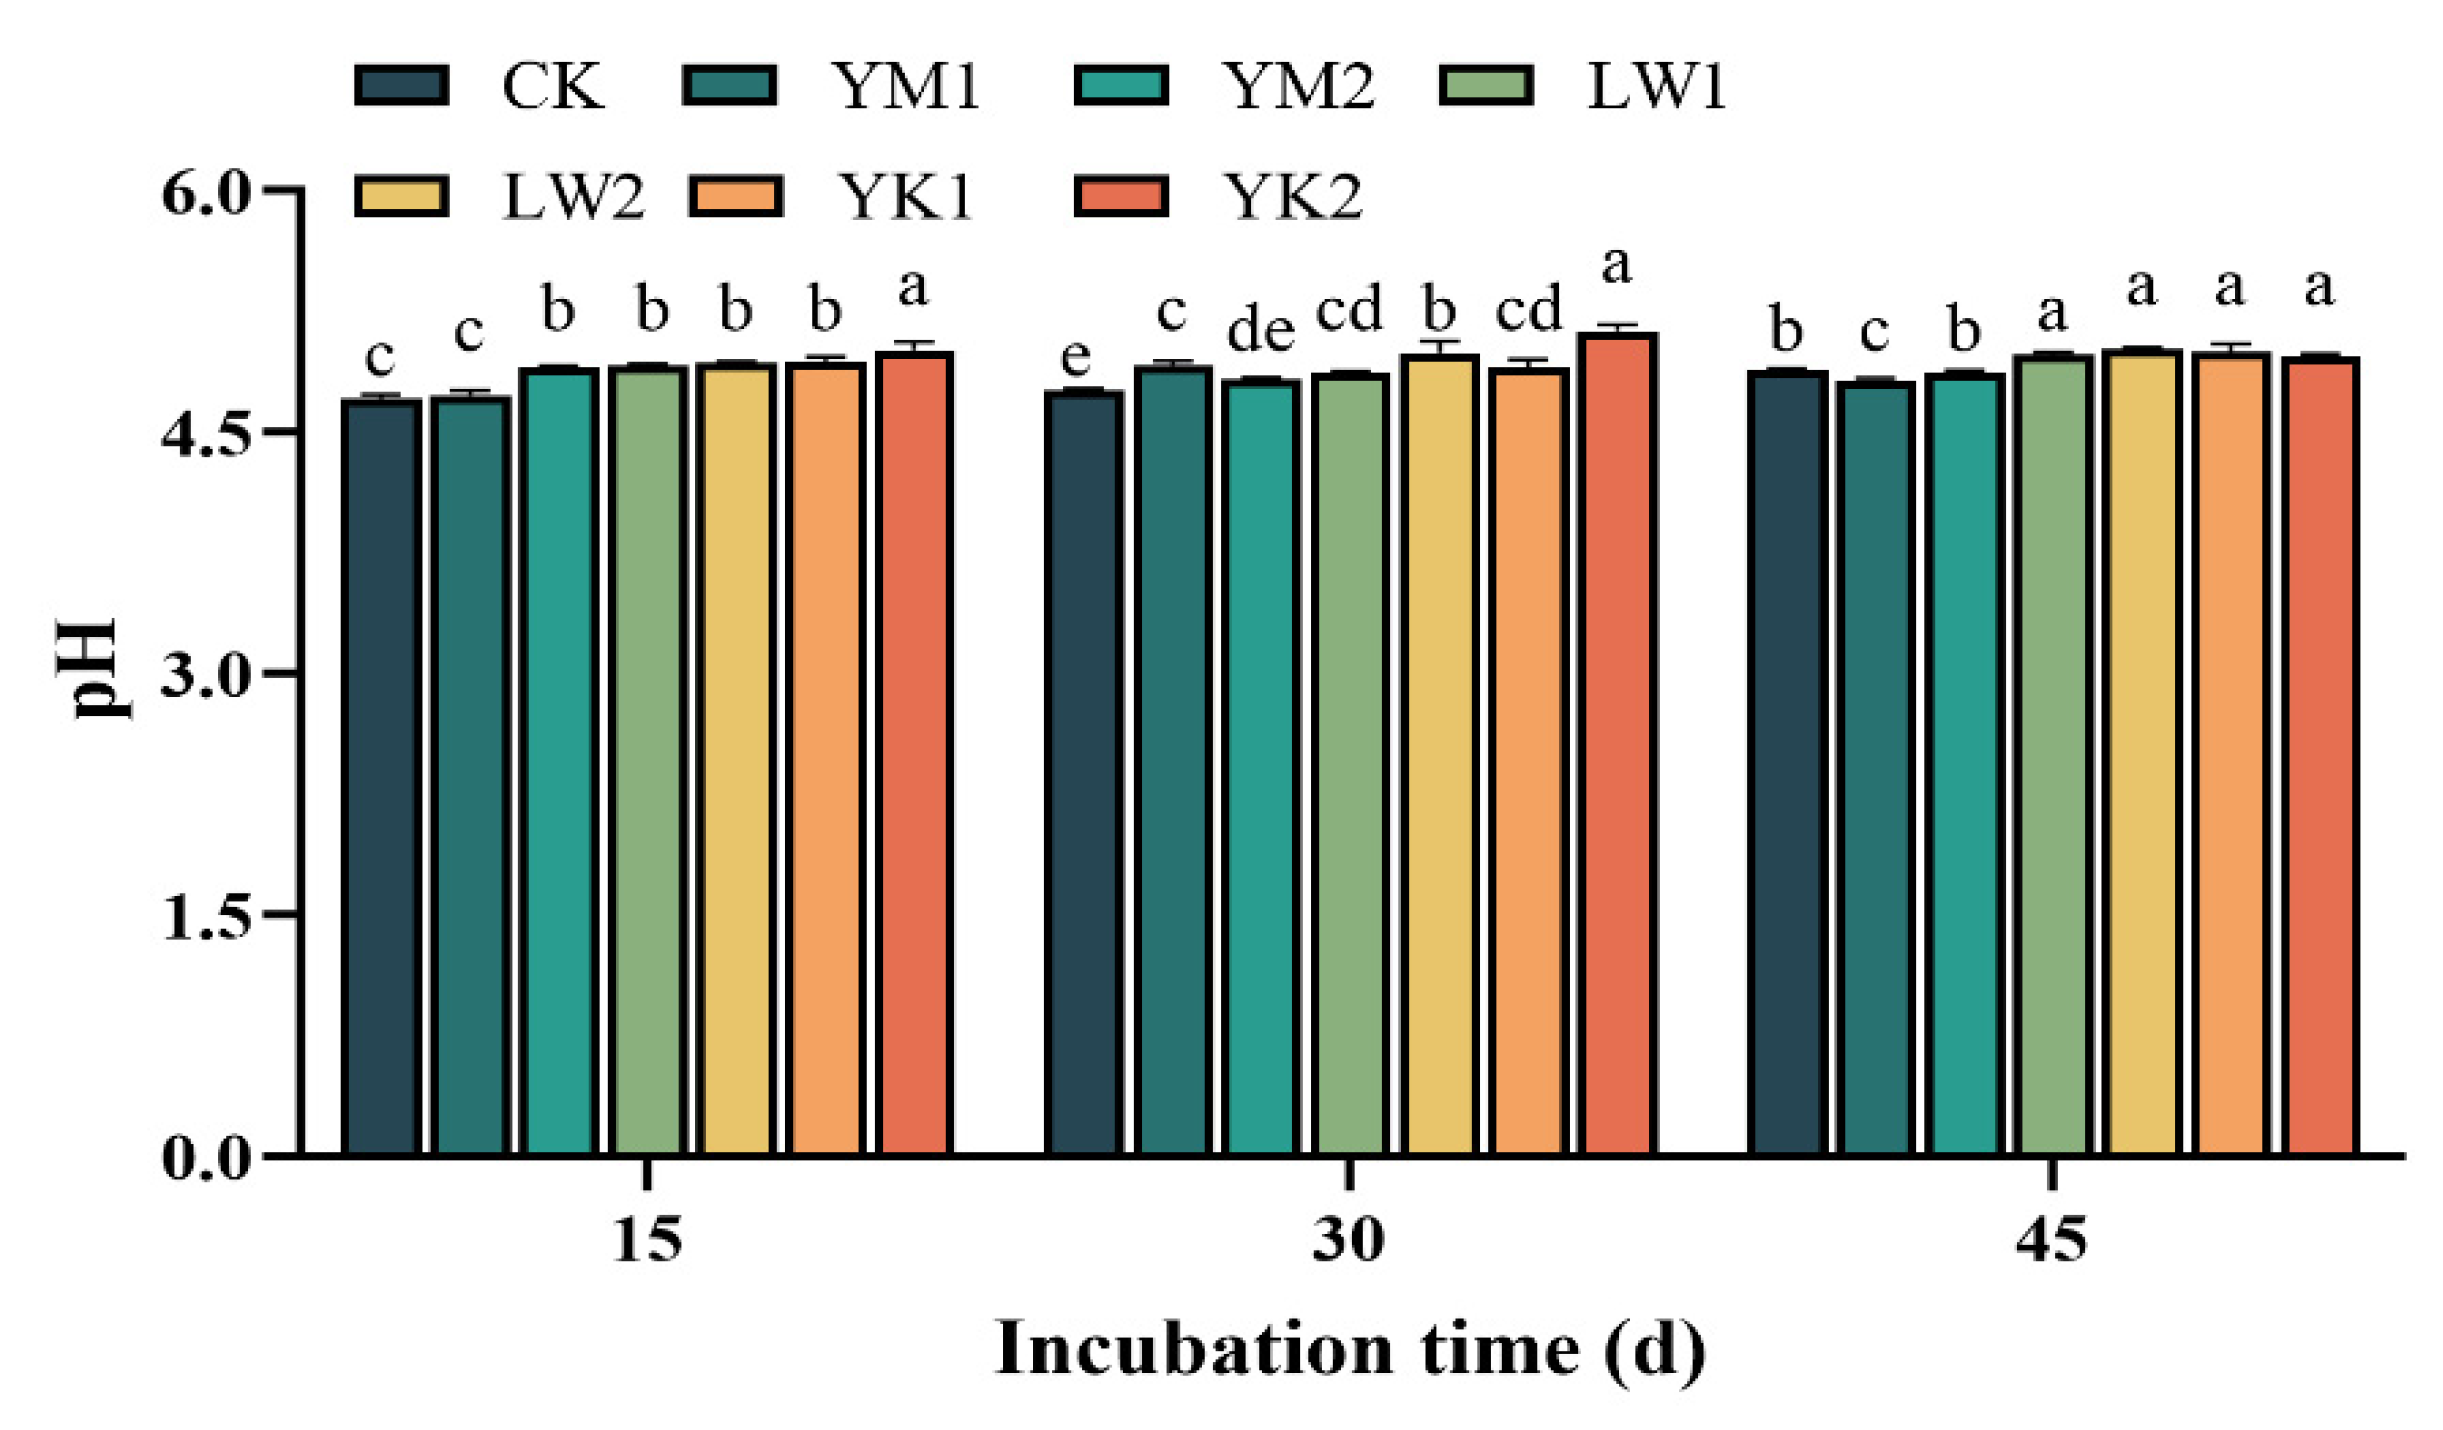
Figure 2.
Effects of application of different biochar treatments on soil enzyme activity variations on catalase (a) and urease (b). Different lowercase letters indicate significant differences between treatments after the same treatment time (p < 0.05). CK, no biochar application as control; YM1, 0.5% Corn stover biochar; YM2, 1.0% Corn stover biochar; LW1, 0.5% Reed biochar; LW2, 1.0% Reed biochar; YK1, 0.5% Coconut shell biochar; YK2, 1.0% Coconut shell biochar.
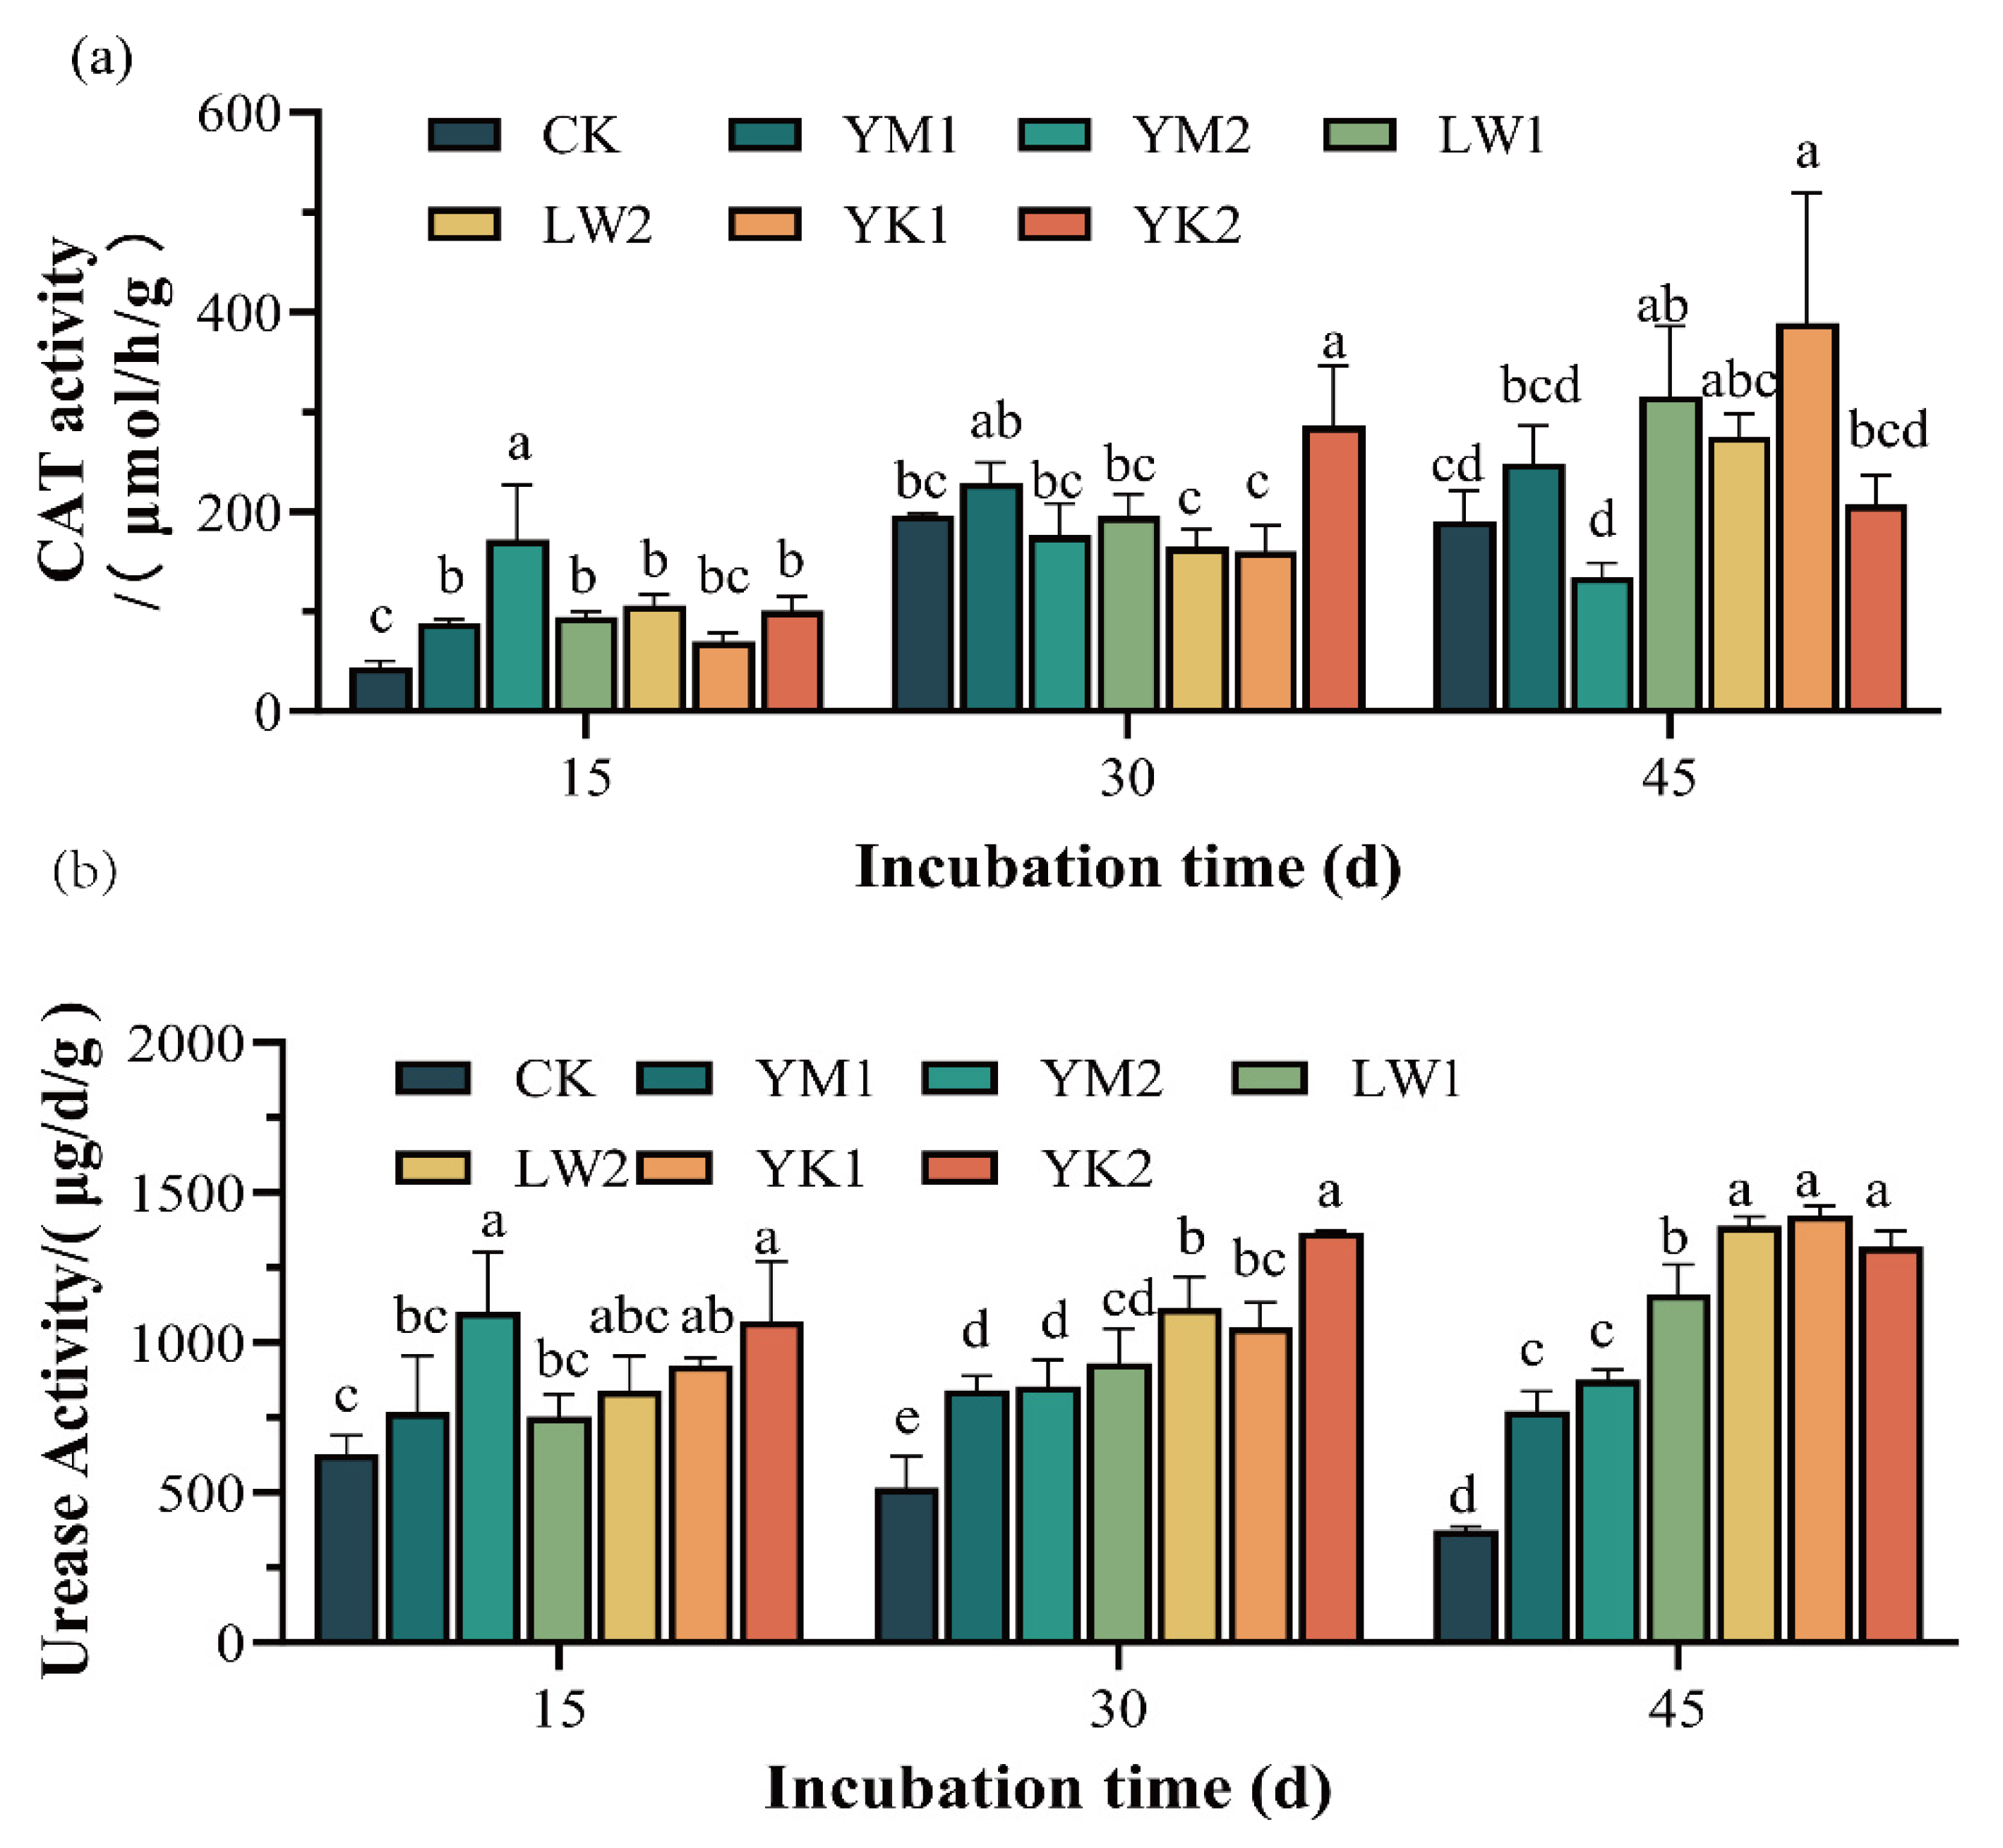
Figure 3.
Venn Diagram Illustrating Operational Taxonomic Unit (OTU) of Soil Fungal (a) and Bacterial(b) Communities in Tea Plantations under Diverse Biochar Application Levels. CK, no biochar application as control; YM1, 0.5% Corn stover biochar; YM2, 1.0% Corn stover biochar; LW1, 0.5% Reed biochar; LW2, 1.0% Reed biochar; YK1, 0.5% Coconut shell biochar; YK2, 1.0% Coconut shell biochar.
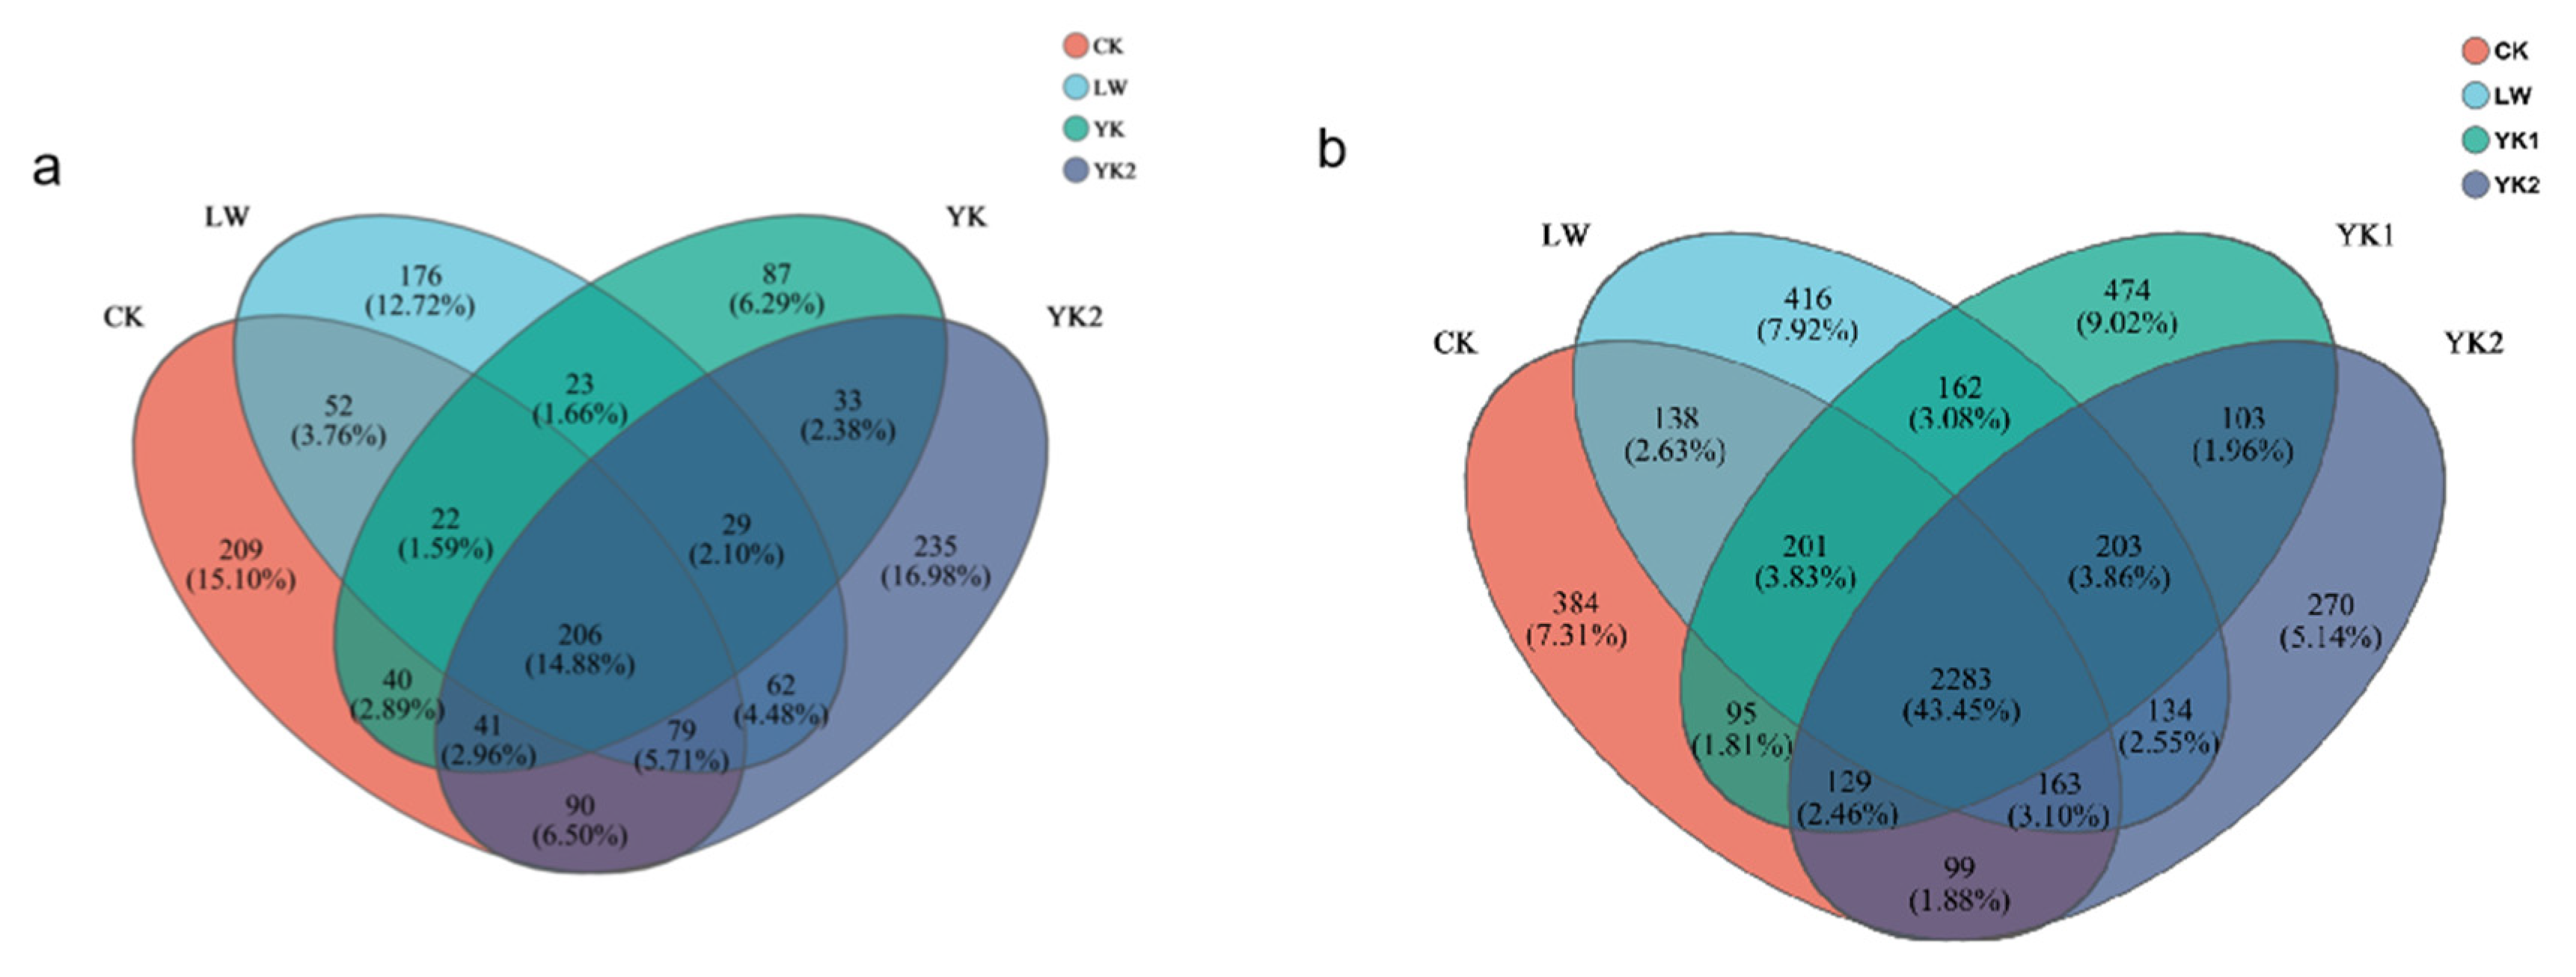
Figure 4.
The changes in phylum(a), class (b) and genus (c) level fungal community diversity in tea plantation soil under different treatments. CK, no biochar application as control; YM1, 0.5% Corn stover biochar; YM2, 1.0% Corn stover biochar; LW1, 0.5% Reed biochar; LW2, 1.0% Reed biochar; YK1, 0.5% Coconut shell biochar; YK2, 1.0% Coconut shell biochar.
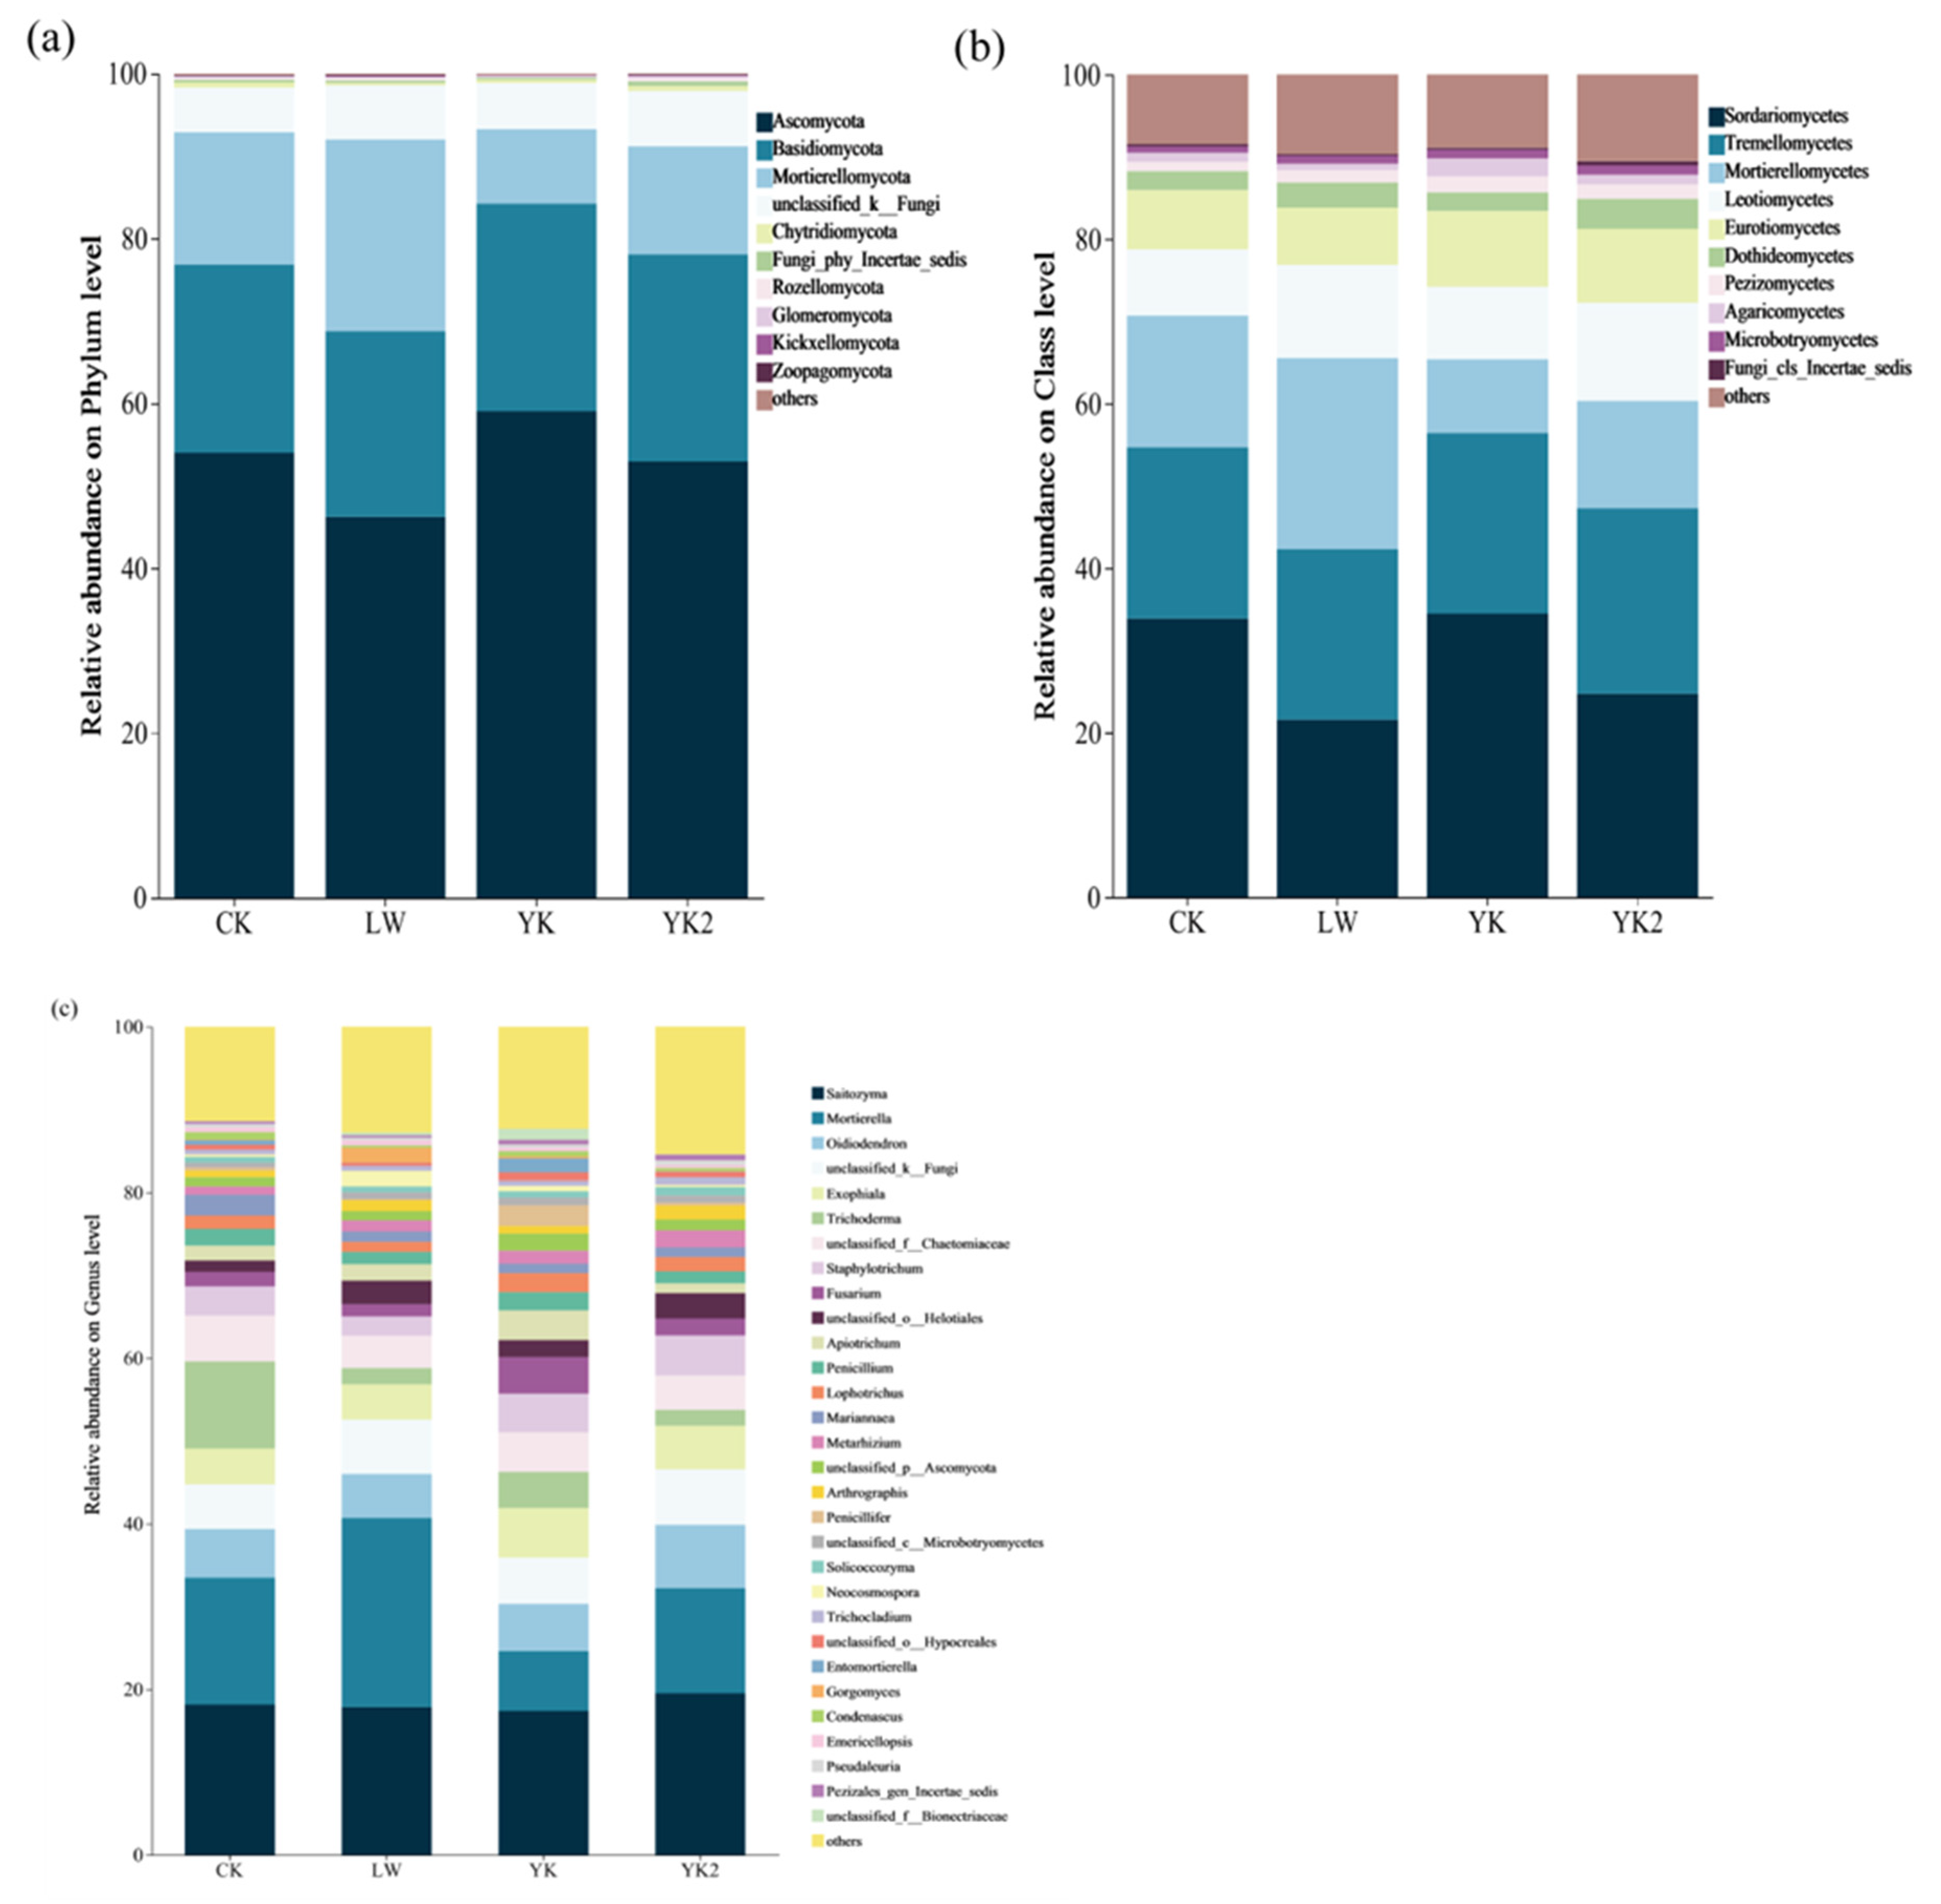
Figure 5.
The changes in phylum(a), class (b) and genus (c) level Bacterial community diversity in tea plantation soil. CK, no biochar application as control; YM1, 0.5% Corn stover biochar; YM2, 1.0% Corn stover biochar; LW1, 0.5% Reed biochar; LW2, 1.0% Reed biochar; YK1, 0.5% Coconut shell biochar; YK2, 1.0% Coconut shell biochar.
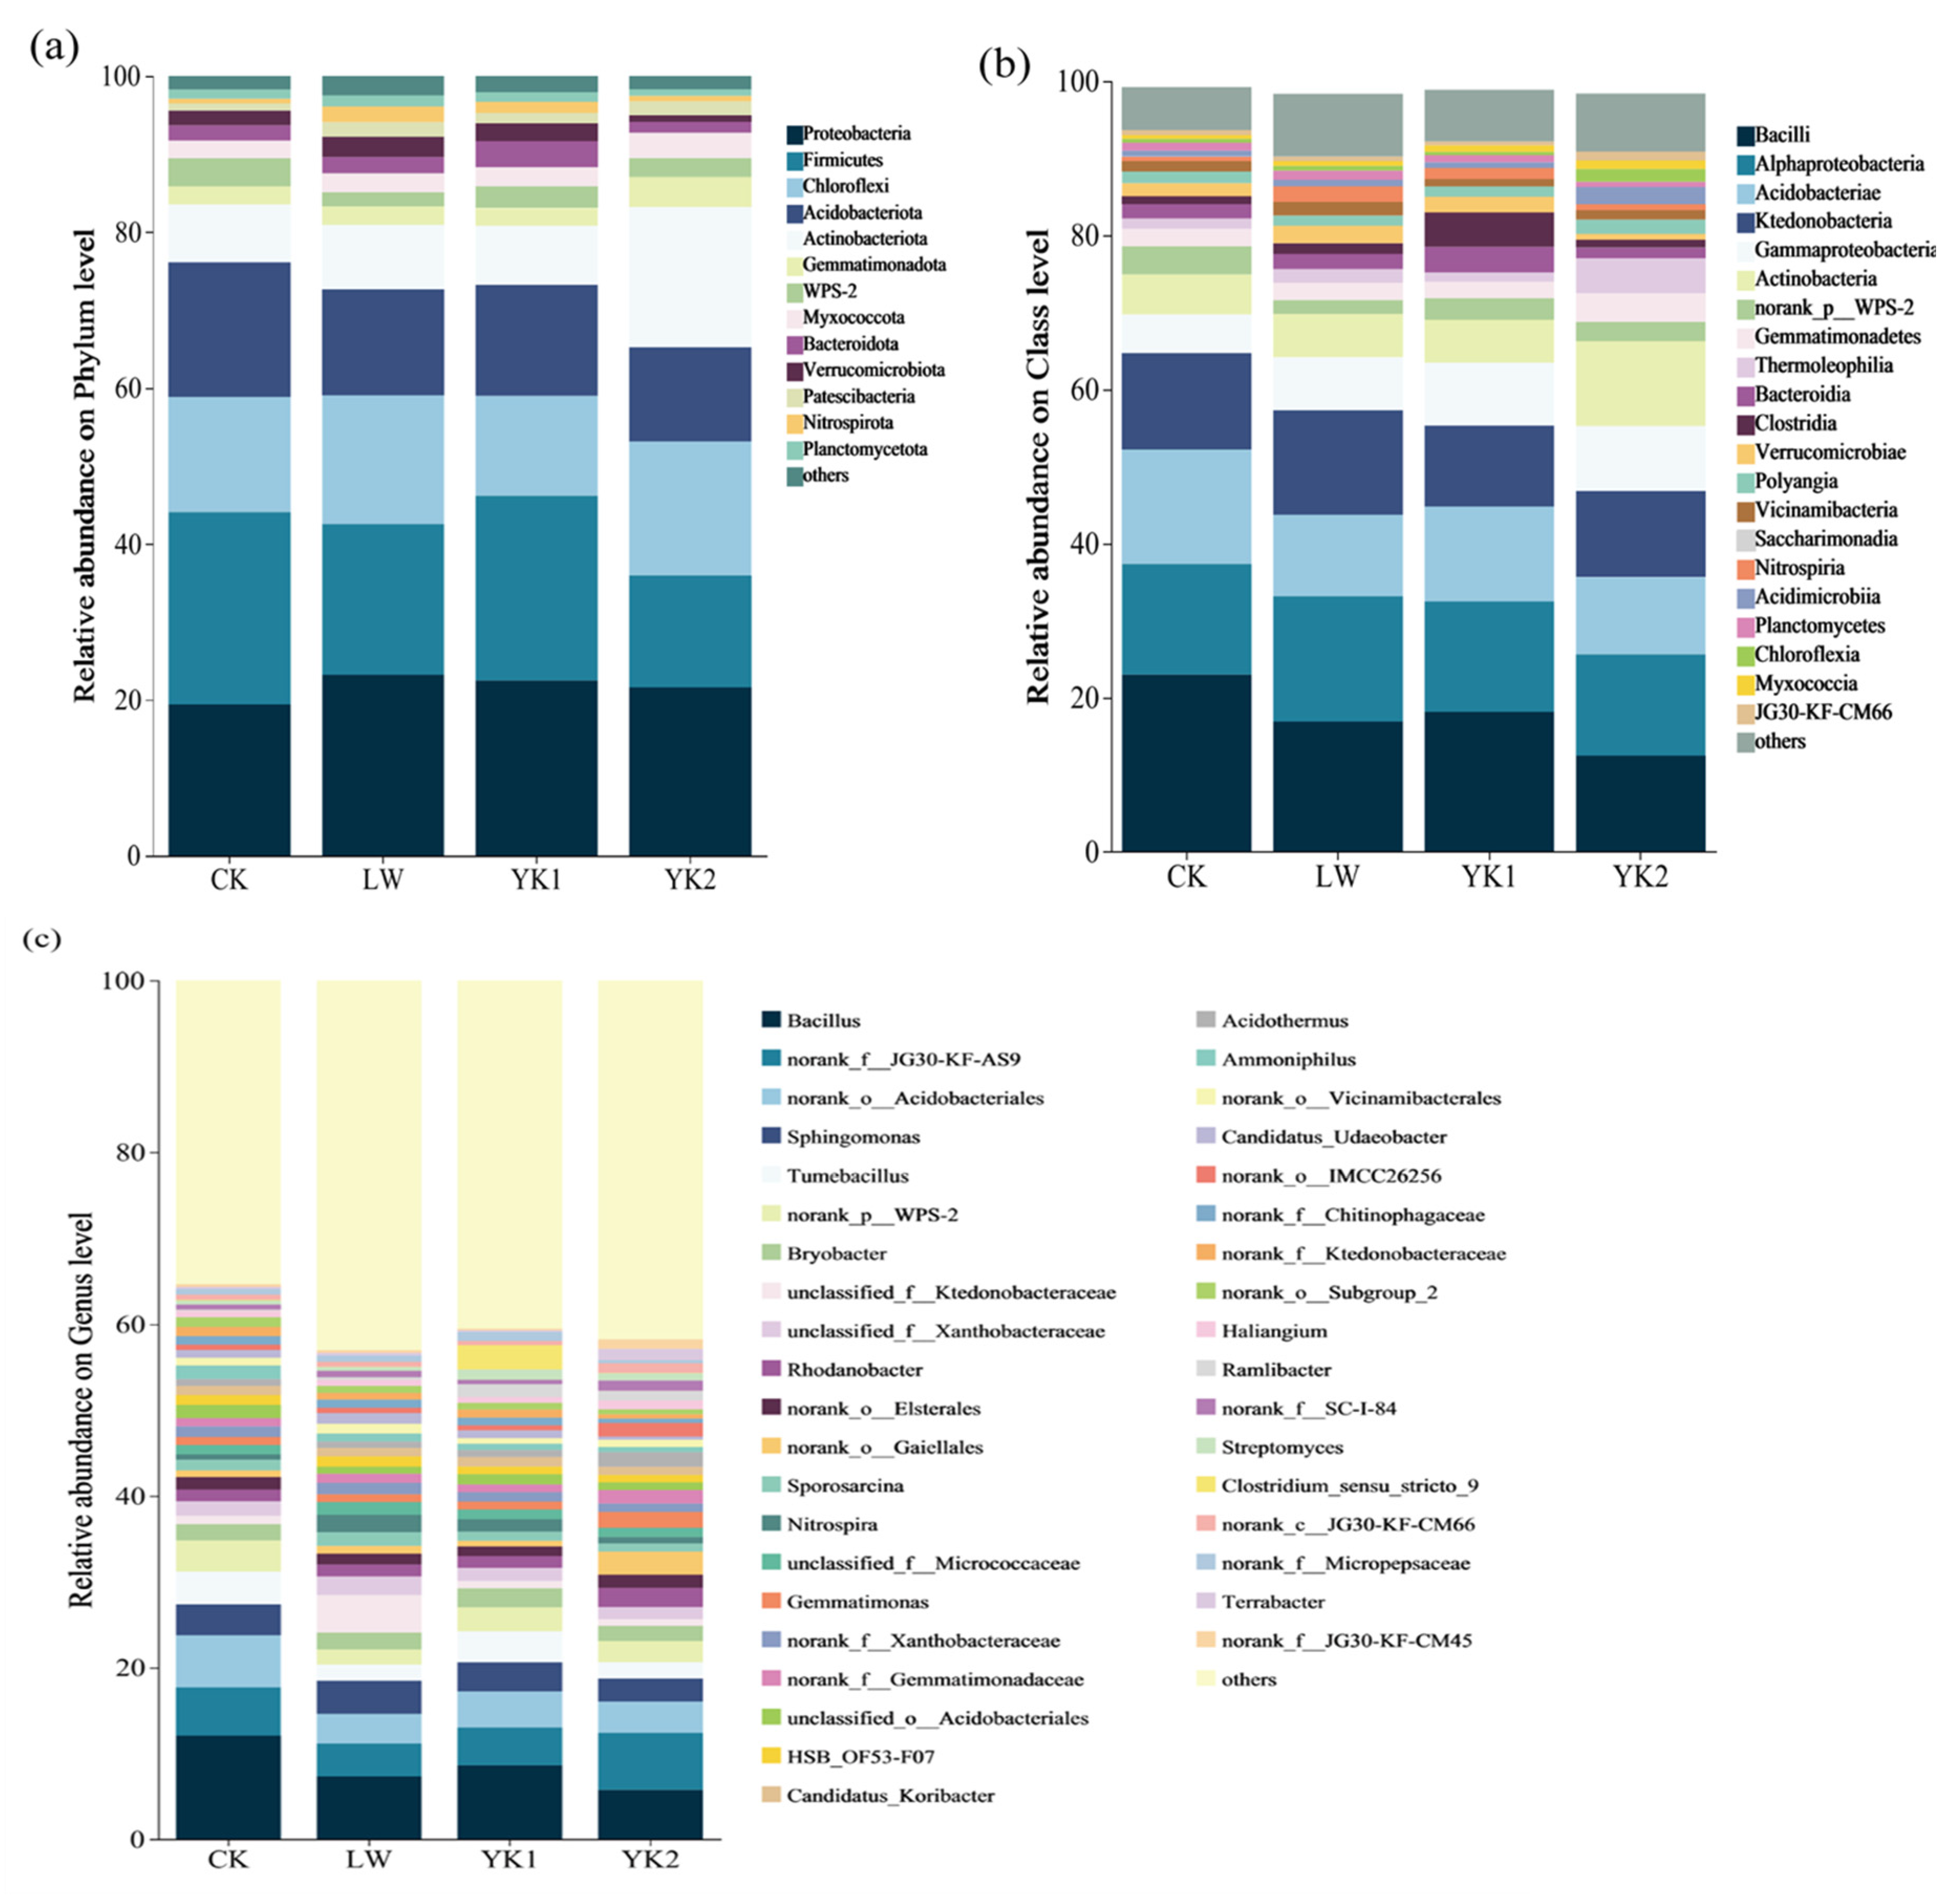
Figure 6.
Histogram of the Linear Discriminant Analysis (LDA) score computed for differentially abundant taxa (genus level) in bacteria(a) and fungi(b). CK, no biochar application as control; YM1, 0.5% Corn stover biochar; YM2, 1.0% Corn stover biochar; LW1, 0.5% Reed biochar; LW2, 1.0% Reed biochar; YK1, 0.5% Coconut shell biochar; YK2, 1.0% Coconut shell biochar.
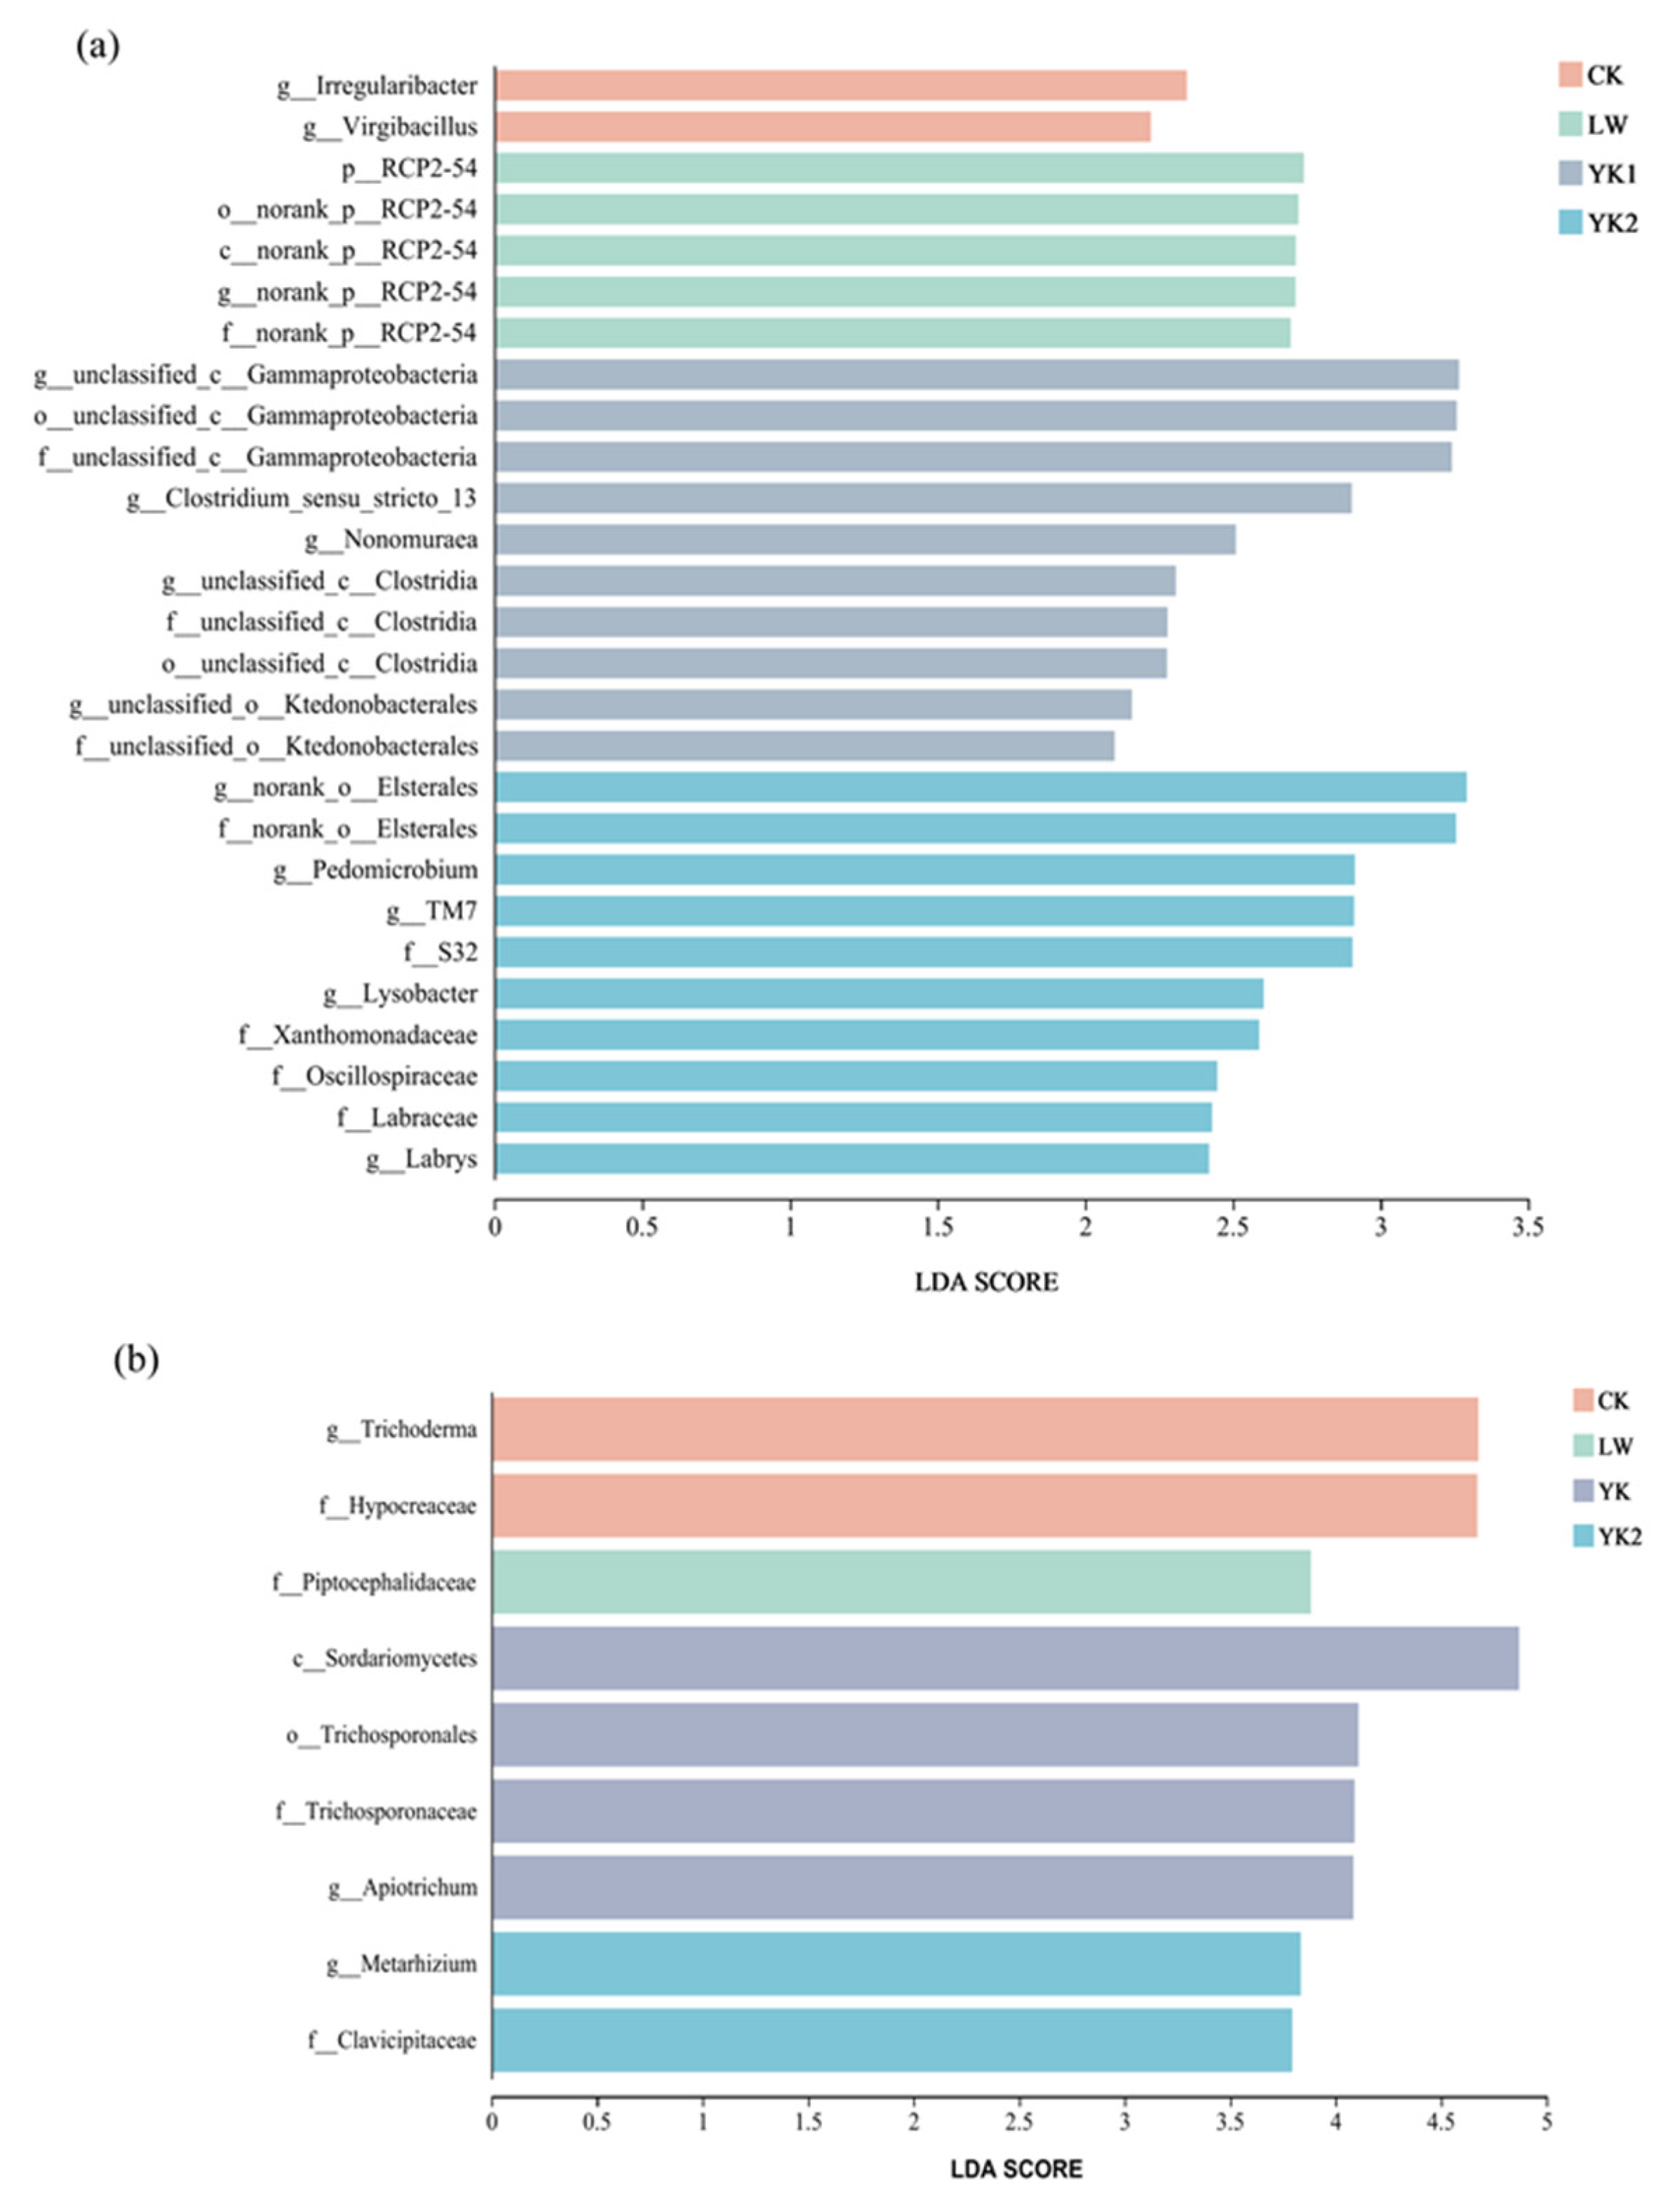
Figure 7.
Spearman heatmap of correlation between relative abundance at the phylum and genus level for both bacterial (a) (c) and fungal (b) (d) communities and soil environmental factors.
Figure 7.
Spearman heatmap of correlation between relative abundance at the phylum and genus level for both bacterial (a) (c) and fungal (b) (d) communities and soil environmental factors.
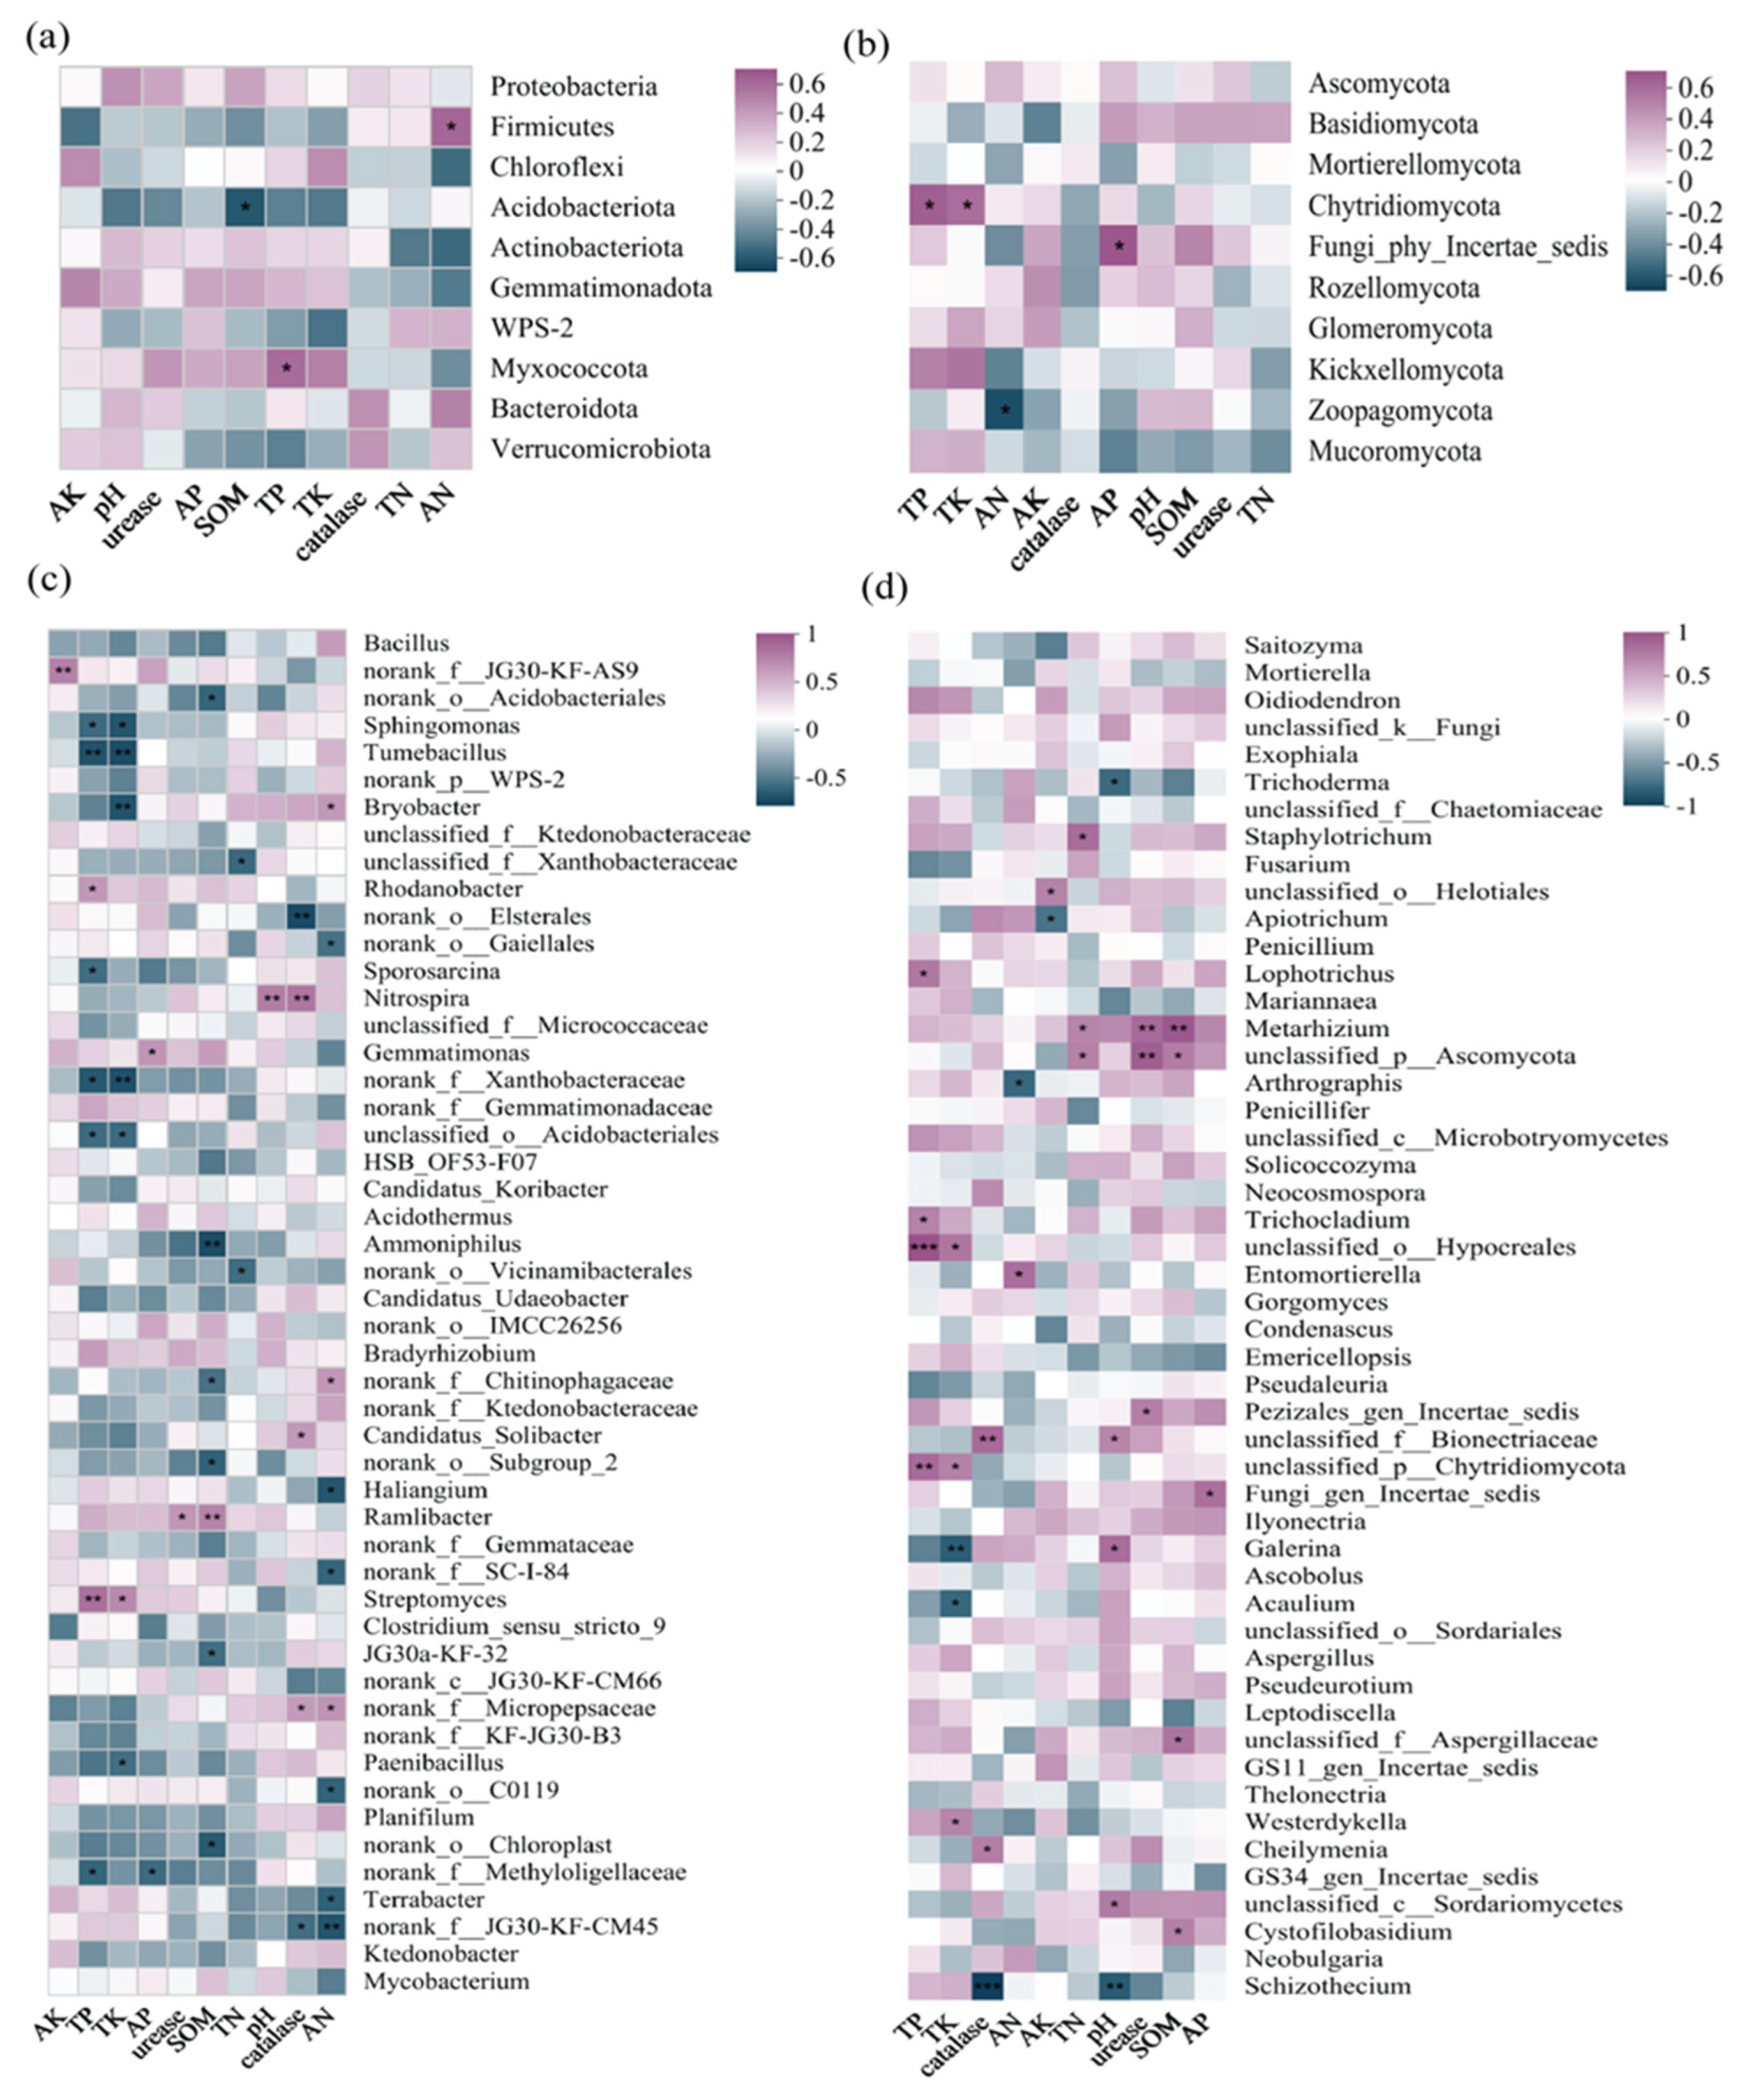

Table 1.
Basic physical and chemical properties of 3 kinds of biochar.
| Biochar types | YM | LW | YK |
|---|---|---|---|
| pH | 9.5 | 9.5 | 9.7 |
| C (%) | 42.08 | 58.34 | 94.80 |
| Ash (%) | 8.43 | 7.50 | 4.60 |
| Pyrolysis Temperature(℃) | 500 | 500 | 700 |
| Specific Surface Area(m2/g) | 68 | 41 | 1150 |
Note: YM represents for corn stover biochar, LW represents for reed biochar, YK represents for coconut shell biochar.
Table 2.
The treatments adopted in the experiment.
| Treatments | The application level of biochar |
|---|---|
| CK | No biochar application (0%) |
| YM1 | Corn stover biochar (0.5%) |
| YM2 | Corn stover biochar (1.0%) |
| LW1 | Reed biochar (0.5%) |
| LW2 | Reed biochar (1.0%) |
| YK1 | Coconut shell biochar (0.5%) |
| YK2 | Coconut shell biochar (1.0%) |
Table 3.
Effect of different types of biochar on soil nutrient content in tea plantation.
| Treatments | TN/(g/kg) | TP/(g/kg) | TK/(g/kg) | AP/(mg/kg) | AK/(mg/kg) | AN/(mg/kg) | SOC/(g/kg) |
|---|---|---|---|---|---|---|---|
| CK | 1.53 ± 0.13a | 0.79 ± 0.05a | 10.56 ± 1.23a | 61.12 ± 4.10b | 333.28 ± 20.21ab | 139.90 ± 18.53ab | 32.68 ± 0.51d |
| LW1 | 1.53 ± 0.15a | 0.76 ± 0.00a | 10.92 ± 0.35a | 52.87 ± 3.14c | 327.28 ± 10.13b | 124.91 ± 16.16ab | 35.28 ± 0.76c |
| YM1 | 1.69 ± 0.01a | 0.78 ± 0.02a | 10.28 ± 0.84a | 73.28 ± 3.10a | 356.30 ± 0.44a | 144.33 ± 9.82ab | 36.72 ± 0.73c |
| YK1 | 1.67 ± 0.02a | 0.80 ± 0.05a | 10.55 ± 1.00a | 68.17 ± 6.26ab | 327.22 ± 10.22b | 151.79 ± 7.55a | 39.47 ± 1.81b |
| YK2 | 1.66 ± 0.03a | 0.82 ± 0.08a | 11.50 ± 1.52a | 70.09 ± 1.54a | 350.42 ± 20.04ab | 121.59 ± 14.87b | 47.26 ± 1.12a |
Notes: Different lowercase letters indicate significant differences between different biochar treatments (p < 0.05). CK, no biochar application as control; YM1, 0.5% Corn stover biochar; YM2, 1.0% Corn stover biochar; LW1, 0.5% Reed biochar; LW2, 1.0% Reed biochar; YK1, 0.5% Coconut shell biochar; YK2, 1.0% Coconut shell biochar.
Table 4.
Alpha diversity of fungi in tea plantation by different application of biochar.
| Treatments | ACE | Chao | Shannon | Simpson | Sobs |
|---|---|---|---|---|---|
| CK | 397.44 ± 16.70a | 402.48 ± 15.66a | 3.67 ± 0.13a | 0.0709 ± 0.01a | 387 ± 16.83a |
| LW | 323.44 ± 74.39a | 326.67 ± 75.79a | 3.57 ± 0.27a | 0.0917 ± 0.02a | 312 ± 72.26a |
| YK1 | 249.59 ± 19.34a | 248.63 ± 19.12a | 3.78 ± 0.03a | 0.0564 ± 0.00a | 243 ± 17.36a |
| YK2 | 402 ± 91.46a | 407.63 ± 93.11a | 3.9 ± 0.07a | 0.0643 ± 0.00a | 390 ± 88.40a |
Notes: Different lowercase letters indicate significant differences between different biochar treatments (p < 0.05). CK, no biochar application as control; YM1, 0.5% Corn stover biochar; YM2, 1.0% Corn stover biochar; LW1, 0.5% Reed biochar; LW2, 1.0% Reed biochar; YK1, 0.5% Coconut shell biochar; YK2, 1.0% Coconut shell biochar.
Table 5.
Alpha diversity of bacteria in tea plantation by different application of biochar.
| Treatments | ACE | Chao | Shannon | Simpson | Sobs |
|---|---|---|---|---|---|
| CK | 2952.24 ± 61.13a | 2852.2 ± 49.90a | 5.91 ± 0.03a | 0.0126 ± 0.00a | 2391 ± 43.24a |
| LW | 3106.68 ± 77.37a | 3008.16 ± 67.79a | 6.15 ± 0.13a | 0.0102 ± 0.00a | 2560 ± 54.48a |
| YK1 | 3117.77 ± 30.74a | 3018.05 ± 28.17a | 5.99 ± 0.16a | 0.0111 ± 0.00a | 2476 ± 75.45a |
| YK2 | 2805.04 ± 195.27a | 2749.48 ± 170.77a | 6.22 ± 0.05a | 0.0064 ± 0.00a | 2304 ± 133.23a |
Notes: Different lowercase letters indicate significant differences between different biochar treatments (p < 0.05). CK, no biochar application as control; YM1, 0.5% Corn stover biochar; YM2, 1.0% Corn stover biochar; LW1, 0.5% Reed biochar; LW2, 1.0% Reed biochar; YK1, 0.5% Coconut shell biochar; YK2, 1.0% Coconut shell biochar.
Disclaimer/Publisher’s Note: The statements, opinions and data contained in all publications are solely those of the individual author(s) and contributor(s) and not of MDPI and/or the editor(s). MDPI and/or the editor(s) disclaim responsibility for any injury to people or property resulting from any ideas, methods, instructions or products referred to in the content. |
© 2025 by the authors. Licensee MDPI, Basel, Switzerland. This article is an open access article distributed under the terms and conditions of the Creative Commons Attribution (CC BY) license (http://creativecommons.org/licenses/by/4.0/).
Copyright: This open access article is published under a Creative Commons CC BY 4.0 license, which permit the free download, distribution, and reuse, provided that the author and preprint are cited in any reuse.


