
Submitted:
01 January 2025
Posted:
02 January 2025
You are already at the latest version
Abstract
Honeybee foraging is a well-organized behavior that has been studied in detail. During foraging, foraging bees search for food, interact, communicate, and collect food for the colony. Learning, remembering, and locating food source at far distance from the hive and able to communicate with each other and complete the task of food collection would not be simple for these small insects. This mysterious highly intelligent behavior of bees has attracted several scientists and interpretation of honeybee dance language was Nobel prize winning research a thing to be always remembered. To understand further the underlying mechanism is a subsequent excitement. Recent studies have taken great importance on understanding the molecular and cellular modulators of honeybee foraging. Some studies have revealed that immediate early genes (IEGs) can be used as neural markers for understanding honeybee brain functions and its behaviors. Our recent studies have shown that three IEGs Egr-1, Hr38 and Kakusei have potential roles in honeybee foraging and learning and memory (Singh et al., 2018; Singh & Takhellambam, 2021; Singh et al., 2020). This piece of work is an extension of the earlier study and investigate whether gene expression continue to increase for longer time during the food reward foraging. We found that the gene expression level continued to remain upregulated throughout the entire time 3 hours foraging duration revealing the role of Egr-1, Hr38, Kakusei during the entire time of foraging.
Keywords:
Honeybee
; foraging
; immediate early genes
; Egr-1
; Hr38
; Kakusei
Introduction
Honeybees are one of the most admirable creatures of this planet. A bee colony behaves like a kingdom ruled by a king or a queen under whose command several classes/groups of people who strictly performed different tasks with great discipline that had been assigned to them. Thanks to the various researchers who have devoted themselves in digging out this hidden magical beauty and miraculously intelligent and highly respectful, well-mannered lifestyle of honeybees. Since time immemorial, honeybees shared indispensable role in lives of human serving as pollinators for better crop yield and in manufacturing and producing honey in their own tiny bodies that has been used as delicious food item as well as medicine (Singh & Chanu, 2021). Another astonishing characteristic of honeybee is the division of labor among the worker bees of the colony based on age difference (Johnson, 2010; Sagili et al., 2011; Siegel et al., 2013). Over the past several decades, foraging of honeybees has been extensively studied to understand the various intelligent characters of honeybee behavior. In 1973, Karl von Frisch was awarded Nobel Prize in Physiology or Medicine in recognition of his exceptional contribution in behavioral research in honeybees, in that he interpreted that waggle dance which looks like the alphabet number 8, is used by the honeybees as a symbolic language to communicate the location of food sources (Michelsen, 2003; Singh & Takhellambam, 2021).
One of the most interesting and fascinating part of observing and studying honeybee foraging is the variety of dynamic behavioral components that accomplishes the tasks of foraging. These behavioral components comprise of food search, location of food source, identification of food, taste of food, memorization of food location, interaction and communication among the foraging bees, recruitment among foragers to collect a large amount of nectar/pollen, then stored the food to the hive for the colony (Frisch, 1965; Seeley, 1995; Singh et al., 2018). These are the kinds of intelligent behaviors exists among various intelligent animals and is common to humans, and to see such dynamic intelligent behaviors in such small insects like honeybees is wonderfully fascinating. Therefore, honeybee can be one of the best choice model animals to study such intelligent behaviors and understand the regulatory mechanisms. Very interestingly one can observe all these behaviors by just placing sugar solution on a plate and allow the honeybees to come and drink. This is pretty much the same method we used for studying the genes that participates in the regulation of foraging (Singh, 2019; Singh & Takhellambam, 2021). Our previous studies have demonstrated potential roles of three IEGs Egr-1, Hr-38 and Kakusei in the daily foraging of honeybees (Singh et al., 2018; Singh & Takhellambam, 2021; Singh et al., 2020).
It may be noted that IEGs have persistent roles from the first stages of brain development unto the adulthood and indicates possible inherent features in everyday functions of brain (Loebrich & Nedivi, 2009; Perez-Cadahia et al., 2011). They also play an essential role in short- or long-lasting phenotypic changes that occur in neurons in response to different stimuli and cellular circumstances (Dijkmans et al., 2009; Perez-Cadahia et al., 2011; Singh & Takhellambam, 2021). Following a stimulation, the early response neurons reacted within milliseconds/minutes, whereases late response may continue for hours to days even leading to permanent changes that requires changes in gene expression (Clayton, 2013; Hughes & Dragunow, 1995). Moreover, late response is linked to learning, memory and sensitization processes and even to drug tolerance habits etc. (Clayton, 2013; Clayton et al., 2020) and involvement of IEGs in the regulation of neurotransmitter regulated genes within neurons is documented (Hughes & Dragunow, 1995). In the process of nerve stimulation, IEGs are first activated linking to membrane events and nucleus and thereby considered as first part in general neuron response to a natural stimulus (Beckmann & Wilce, 1997). Moreover, depending on the stimulus type IEGs encoded proteins may be individually regulated in different regions of the brain (Beckmann & Wilce, 1997); this indicates same/different IEGs at different parts of the brain following stimulation, may pass different signals to perform different behavioral tasks depending on the type of the stimulus. Our recent findings have shown potential involvement of IEGs Egr-1, Hr-38 and Kakusei in the foraging of Western honeybees Apis Melifera, in learning and memory (Singh et al., 2018; Singh & Takhellambam, 2021; Singh et al., 2020). The present work is a piece of extension of the previous studies to examine the length of time of overexpression of these genes during foraging, by collecting the samples during a long 3 hours of foraging.
Methods
Behavioral Experiment
Behavioral experiment was conducted inside the bee house at National Centre for Biological Sciences (NCBS), Tata Institute of Fundamental Research (TIFR), Bangalore. This is an outdoor flight cage that allows to perform the behavioral tests and sample collection in semi natural environment allowing the bees to forage freely from the hive to the feeder with minimal disturbance. The honeybees (Apis Melifera) were given with pollen and 1 M sucrose solution every day from 14:00 hr. to 15:00 hr. About two weeks before the sample collection began, feeder was presented every day at the same time making sure that the foraging bees learned, remembered and visited the feeders every day about the same time. Based on the time we collected the samples; the study groups are categorized as bellow. About 1 to 2 bees were collected at each time points on each day of collection and each group consists of 5 bees. Further details are available in our previous reports (Singh et al., 2018; Singh & Takhellambam, 2021; Singh et al., 2020).
Sample Collection
Before and After Foraging:
Before foraging group consists of honeybees collected in the morning at 9:00 hr. in the hive before the they flew out to forage. After foraging group consists of honeybees collected in the hive at 18:00 hr. in the evening after bees completed foraging and remained in the hive. The collected bees were marked by pen (Uni POSCA Paint Markers, Uni Mitsubishi Pencil, UK) on the head during foraging while they were to drinking sucrose solution. The marked bees on the feeder plate are shown in Figure 1. 50 mL falcon tubes with several holes made on it were used for the collection of bees and the bees were immediately flash frozen after collection then stored at -80°C (Singh et al., 2018; Singh & Takhellambam, 2021; Singh et al., 2020).
Sample Collection During Foraging:
Samples collected during foraging are categorized into 14 time point groups which were collected for a long span of 3 hours duration starting at 14:00 hr. and ending at 17:00 hr. keeping 15 min intervals between two time points. The time points are 14:00 hr., 14:15 hr., 14:30 hr., 14:45 hr., 15:00 hr., 15:15 hr., 15:30 hr., 15:45 hr., 16:00 hr., 16:00 hr., 16:15 hr., 16:30 hr., 16:45 hr., and 17:00 hr. respectively. The 14:00 hr. group was collected on the feeder plate before presenting the sucrose solution and the rest of the time point samples were collected after presenting sucrose solution when the bees landed at the feeder at those specific set time points. The detail procedures were described in our previous articles (Singh et al., 2018; Singh & Takhellambam, 2021; Singh et al., 2020).
Brain dissection: The frozen bees from the -80˚C were lyophilized for 20 min at -50˚C with vacuum condition 0.420 mBar using lyophilizer (Freeze Zone1 PlusTM 4.5-liter cascade Freeze Dry System, Labconco Corporation, Kanas City). Brain dissection was carried out in a glass chamber with 100% ethanol placed on dry ice under the light microscope using surgical instruments. The dissected whole brain was immediately transferred into 1.5 mL Eppendorf tube on dry ice, and 500 μL Trizol (Trizol Reagent, ambion RNA, life technology) was added.
RNA and cDNA preparation: The frozen brain was thawed on ice, then homogenized using electronic homogenizer (Micro-Grinder Pestle Mixer, RPI Research Products International) with pestle (Micro-Tube Sample Pestles, Research Products International). Centrifugation was carried out at 10000g for 5min at 40C. The upper clear portion which contained RNA was gently removed gently without disturbing the lower DNA, tissue debris and the protein fractions, then transferred into another tube. The total RNA was used for cDNA preparation using the cDNA kit SuperScriptTMIII First-Strand Synthesis System supplied by Invitrogen (Thermo Fisher Scientific); manufacturer’s protocol was followed in the preparation.
Quantitative real time PCR (qPCR): The cDNA from each brain sample was amplified by qPCR for each target genes and three replicates were prepared for each sample, using 7900HT Fast Real Time PCR System (Applied Biosystem, Singapore). Final reaction volume of each sample was 10μl with cDNA, oligonucleotide primers (Sigma Aldrich) of the specific target genes and SYBR Green (KAPA Syber1 FAST PCR Master Mix (2X) ABI Prism1). For endogenous control Rp49 was used. We followed the same procedures described in our previous publications (Singh et al., 2018; Singh & Takhellambam, 2021; Singh et al., 2020). The details of the primers are provided in Table 1.
Statistical Analysis for Relative Gene Expression Changes
The expression level of each gene at each time point was calculated with the help of relative standard curve method estimated by SDS 2.4 software supplied with the 7900HT Fast Real system (Applied Biosystem, Singapore). We calculated the fold changes at each time point relative to the gene expression level at time 4pm. Gene expression level difference between different time points was examined by one-way ANOVA with Sidak’s test for correction of multiple comparison analyses, using GraphPad Prism Version 10.4.1 (Motulsky, 2016) (http://www.graphpad.com). Normal distribution of each group was also checked by the D’Agostino & Pearson omnibus normality test.
To further compare the gene expression level among the three genes Egr-1, Hr38 and Kakusei across the study time points two-way Anova was used. The statistics were carried out, analyzed and interpreted with the help of GraphPad Prism Version 10.4.1 and the Handbook of Parametric and Nonparametric Statistical Procedures by David J. Sheskin (Handbook of Parametric and Nonparametric Statistical Procedures: Third Edition IBSN: 1584884401) described in GraphPad Prism (http://www.graphpad.com). Two-way Anova formulate the percentage of the variability of gene expression among the comparing genes resulted by four components 1) interaction between the row and column factor, 2) row factor, 3) column factor and 4) remainder of the variation also called residual variation. The null hypothesis indicates no interaction between columns (data sets) and rows whereas alternate hypothesis indicates existence of interaction. The column factor p-value provides the statistical difference between means of each column while totally omitting the rows. Subsequently row factor p-values revealed the statistical difference between the means of each row while totally omitting the columns. The p values produced by Two-way Anova is not corrected in these comparisons as of present available formulations in the Graphpad Prism.
Result:
Our previous studies have reported potential roles of IEGs Egr-1, Hr-38 and Kakusei and few downstream genes (Singh et al., 2018; Singh & Takhellambam, 2021; Singh et al., 2020). In the previous studies transient overexpression and persistent higher level during foraging compared to the levels of before foraging, after foraging and before food reward foraging was reported. The transient upregulation was recoreded during two hours of food reward foraging. We are further interested in knowing whether the expression levels of Egr-1, Hr-38 and Kakusei remained overexpressed until the end of foraging. This can reveal us whether roles these genes contained only a limited period during foraging or over the entire period of foraging. To examine this, we collected the samples from 16:15 hr to 17:00 after the bees have already foraged for 2 hours collecting the sucrose solution to and fro from feeder to the hive, further extending 1 hour from the previous study; we presented the sucrose solution at 14:00 hr. every day and the feeder was removed at 17:00 hr. and we followed the same patten in this study. It may be noted about 17:00 hr. bees also stopped foraging as the winter sun set began. In our observation a bee made about 20 trips in our set up during the entire foraging of the day and the trip became slower and slower as the bee continued foraging. We combine the data of previous study 14:00 hr to 16:00 hr with the present data of 16:15 hr to 17:00 hr as well as the before and after foraging data of the previous study, then analyzed. Hence, in this study we provide the gene expression profile of Egr-1, Hr-38 and Kakusei during the three hours of foraging 14:00 hr. to 17:00 hr. as well as before and after foraging. And the result showed prolong upregulation of Egr-1, Hr-38 and Kakusei during the 3 hours of food reward foraging which indicates the participation of these genes to be indispensable throughout the entire period of foraging; the result is summarized in Figure 2 (A, B and C) and Table 2. When we compare the three genes, the level of Hr-38 remain much higher than the Egr-1 and Kakusei throughout the entire time of foraging, while the level of Kakusei is lower than the Hr-38 and after two hours Kakusei and Hr-38 level came very close, as shown in Figure 2D as well as p values of interaction/ column factor/ raw factor is less than 0.0001 (supplementary Table for further details).
Discussion:
The potential roles of IEGs in honeybee foraging have been evidenced in many research reports. Their immediate expression following induction by environmental stimuli in the central nervous system serves as markers for neuronal activity and a powerful tool for finding neuronal pathways link to behaviors in insects as well as vertebrates (Singh et al., 2018; Singh & Takhellambam, 2021; Singh et al., 2020; Sommerlandt et al., 2019). Our recent studies have revealed the involvement of three IEGs Egr-1, Hr38 and Kakusei in honeybee foraging and associative learning and memory during foraging (Singh et al., 2018; Singh & Takhellambam, 2021; Singh et al., 2020). And the continuous foraging and expression of these IEGs were induced by food reward and the expression of these genes were independent of the time of foraging, whether morning, or noon or evening, but the food reward. In the previous studies we investigated the expression of those genes in two hours period of foraging and gene expression dropped to basal level after foraging. In this study we added one more hour to check whether the three genes continue to involve during the entire time of foraging. The result showed yes, all the three genes are involved during the entire time of rewarded foraging which was of three hours period. We also observed that the three genes are not expressed at the same level during foraging. The Hr38 level remained much higher than Egr-1 and Kakusei, indicating a greater role of Hr38 compared to the other two genes during foraging. While the previous studies have already evidenced the role of these genes during foraging of honeybees, this study further added that the three genes are indispensable during the entire period of rewarded foraging. This finding makes it even more promising to use these IEGs, Egr-1, Hr38 and Kakusei to explore the foraging regulatory genes and enable us to find out the regulatory pathways that monitor specific behaviors observed during foraging such as learning and memorizing of food source location, food identification, food quality, social interaction and social communication etc.
Our previous study has also briefly demonstrated that Egr-1 downstream genes like ecdysone receptor (EcR), dopamine/ecdysteroid receptor (DopEcR), dopamine decarboxylase and dopamine receptor 2 (DopR2), which are components of ecdysteroid signalling pathway, are involved in honeybee foraging (Singh et al., 2018). This indicates possible involvement of Egr-1 regulatory pathway probably involved in learning and memory processes in honeybee foraging. Studies in vertebrates showed that neural activity is induced by the expression changes of IEGs, and the products of IEGs regulate the expression of downstream genes that are involved in neural homeostasis and synaptic plasticity (Beckmann & Wilce, 1997; Clayton, 2000; Loebrich & Nedivi, 2009). Further, different IEG expressions reach their pick levels at different times even though upon the stimulation (Bottai et al., 2002; Vazdarjanova et al., 2002), reveal involvement of different IEGs in the different behavioral tasks. Therefore, understanding the details of regional wise IEG expression pattern in the brain could provide a remarkable tool in finding various cellular and molecular paths that link to specific behavioral features, precisely. And our finding in this study further strengthens importance and promising outcomes of using IEGs in exploring the underlying regulatory mechanisms of specific behaviors using honeybee as model system.
Supplementary Materials
The following supporting information can be downloaded at the website of this paper posted on Preprints.org.
Funding
None.
Conflict of Interest
Authors declare no conflict of interest
References
- Beckmann, A. M., & Wilce, P. A. (1997). Egr transcription factors in the nervous system. Neurochem Int, 31(4), 477-510; discussion 517-476. [CrossRef]
- Bottai, D., Guzowski, J. F., Schwarz, M. K., Kang, S. H., Xiao, B., Lanahan, A., Worley, P. F., & Seeburg, P. H. (2002). Synaptic activity-induced conversion of intronic to exonic sequence in Homer 1 immediate early gene expression. J Neurosci, 22(1), 167-175. [CrossRef]
- Clayton, D. F. (2000). The genomic action potential. Neurobiol Learn Mem, 74(3), 185-216. [CrossRef]
- Clayton, D. F. (2013). The genomics of memory and learning in songbirds. Annu Rev Genomics Hum Genet, 14, 45-65. [CrossRef]
- Clayton, D. F., Anreiter, I., Aristizabal, M., Frankland, P. W., Binder, E. B., & Citri, A. (2020). The role of the genome in experience-dependent plasticity: Extending the analogy of the genomic action potential. Proc Natl Acad Sci U S A, 117(38), 23252-23260. [CrossRef]
- Dijkmans, T. F., van Hooijdonk, L. W., Schouten, T. G., Kamphorst, J. T., Fitzsimons, C. P., & Vreugdenhil, E. (2009). Identification of new Nerve Growth Factor-responsive immediate-early genes. Brain Res, 1249, 19-33. [CrossRef]
- Frisch, K. (1965). Tanzsprache und Orientierung der Bienen. Berlin; Heidelberg. Springer Verlag. [CrossRef]
- Hughes, P., & Dragunow, M. (1995). Induction of immediate-early genes and the control of neurotransmitter-regulated gene expression within the nervous system. Pharmacol Rev, 47(1), 133-178. https://www.ncbi.nlm.nih.gov/pubmed/7784478.
- Johnson, B. R. (2010). Division of labor in honeybees: form, function, and proximate mechanisms. Behav Ecol Sociobiol, 64(3), 305-316. [CrossRef]
- Loebrich, S., & Nedivi, E. (2009). The function of activity-regulated genes in the nervous system. Physiol Rev, 89(4), 1079-1103. [CrossRef]
- Michelsen, A. (2003). Karl von Frisch lecture. Signals and flexibility in the dance communication of honeybees. J Comp Physiol A Neuroethol Sens Neural Behav Physiol, 189(3), 165-174. [CrossRef]
- Perez-Cadahia, B., Drobic, B., & Davie, J. R. (2011). Activation and function of immediate-early genes in the nervous system. Biochem Cell Biol, 89(1), 61-73. [CrossRef]
- Sagili, R. R., Pankiw, T., & Metz, B. N. (2011). Division of labor associated with brood rearing in the honey bee: how does it translate to colony fitness? PLoS One, 6(2), e16785. [CrossRef]
- Seeley, T. (1995). Wisdom of the Hive. Cambridge, MA. Harvard University Press. [CrossRef]
- Siegel, A. J., Fondrk, M. K., Amdam, G. V., & Page, R. E., Jr. (2013). In-hive patterns of temporal polyethism in strains of honey bees (Apis mellifera) with distinct genetic backgrounds. Behav Ecol Sociobiol, 67(10), 1623-1632. [CrossRef]
- Singh, A. S. (2019). Immediate Early Genes as Search Tool for Finding Cellular and Molecular Events Underlying Social Behaviors of Honeybees: A Brief Commentary. Nova Medicine and Health, 2020, Advances in Medicine and Biology, 153.
- Singh, A. S., & Chanu, M. T. (2021). Honey Bee Products: Honey And Royal Jelly And Their Nutritional And Medicinal Values To Humans. British Journal of Biomedical Research.
- Singh, A. S., Shah, A., & Brockmann, A. (2018). Honey bee foraging induces upregulation of early growth response protein 1, hormone receptor 38 and candidate downstream genes of the ecdysteroid signalling pathway. Insect Mol Biol, 27(1), 90-98. [CrossRef]
- Singh, A. S., & Takhellambam, M. C. (2021). A Method to Study Honey Bee Foraging Regulatory Molecules at Different Times During Foraging. Front Insect Sci, 1, 723297. [CrossRef]
- Singh, A. S., Takhellambam, M. C., Cappelletti, P., & Feligioni, M. (2020). Immediate early gene kakusei potentially plays a role in the daily foraging of honey bees. PLoS One, 15(5), e0222256. [CrossRef]
- Sommerlandt, F. M. J., Brockmann, A., Rossler, W., & Spaethe, J. (2019). Immediate early genes in social insects: a tool to identify brain regions involved in complex behaviors and molecular processes underlying neuroplasticity. Cell Mol Life Sci, 76(4), 637-651. [CrossRef]
- Vazdarjanova, A., McNaughton, B. L., Barnes, C. A., Worley, P. F., & Guzowski, J. F. (2002). Experience-dependent coincident expression of the effector immediate-early genes arc and Homer 1a in hippocampal and neocortical neuronal networks. J Neurosci, 22(23), 10067-10071. [CrossRef]
Figure 1.
Honeybee foraging and sample collection overview. (A) honeybees feeding on 1M sucrose, (B) honeybees in the hive, (C) honeybees feeding on artificial pollen, and (D) honeybees on the honeycomb in the hive.
Figure 1.
Honeybee foraging and sample collection overview. (A) honeybees feeding on 1M sucrose, (B) honeybees in the hive, (C) honeybees feeding on artificial pollen, and (D) honeybees on the honeycomb in the hive.
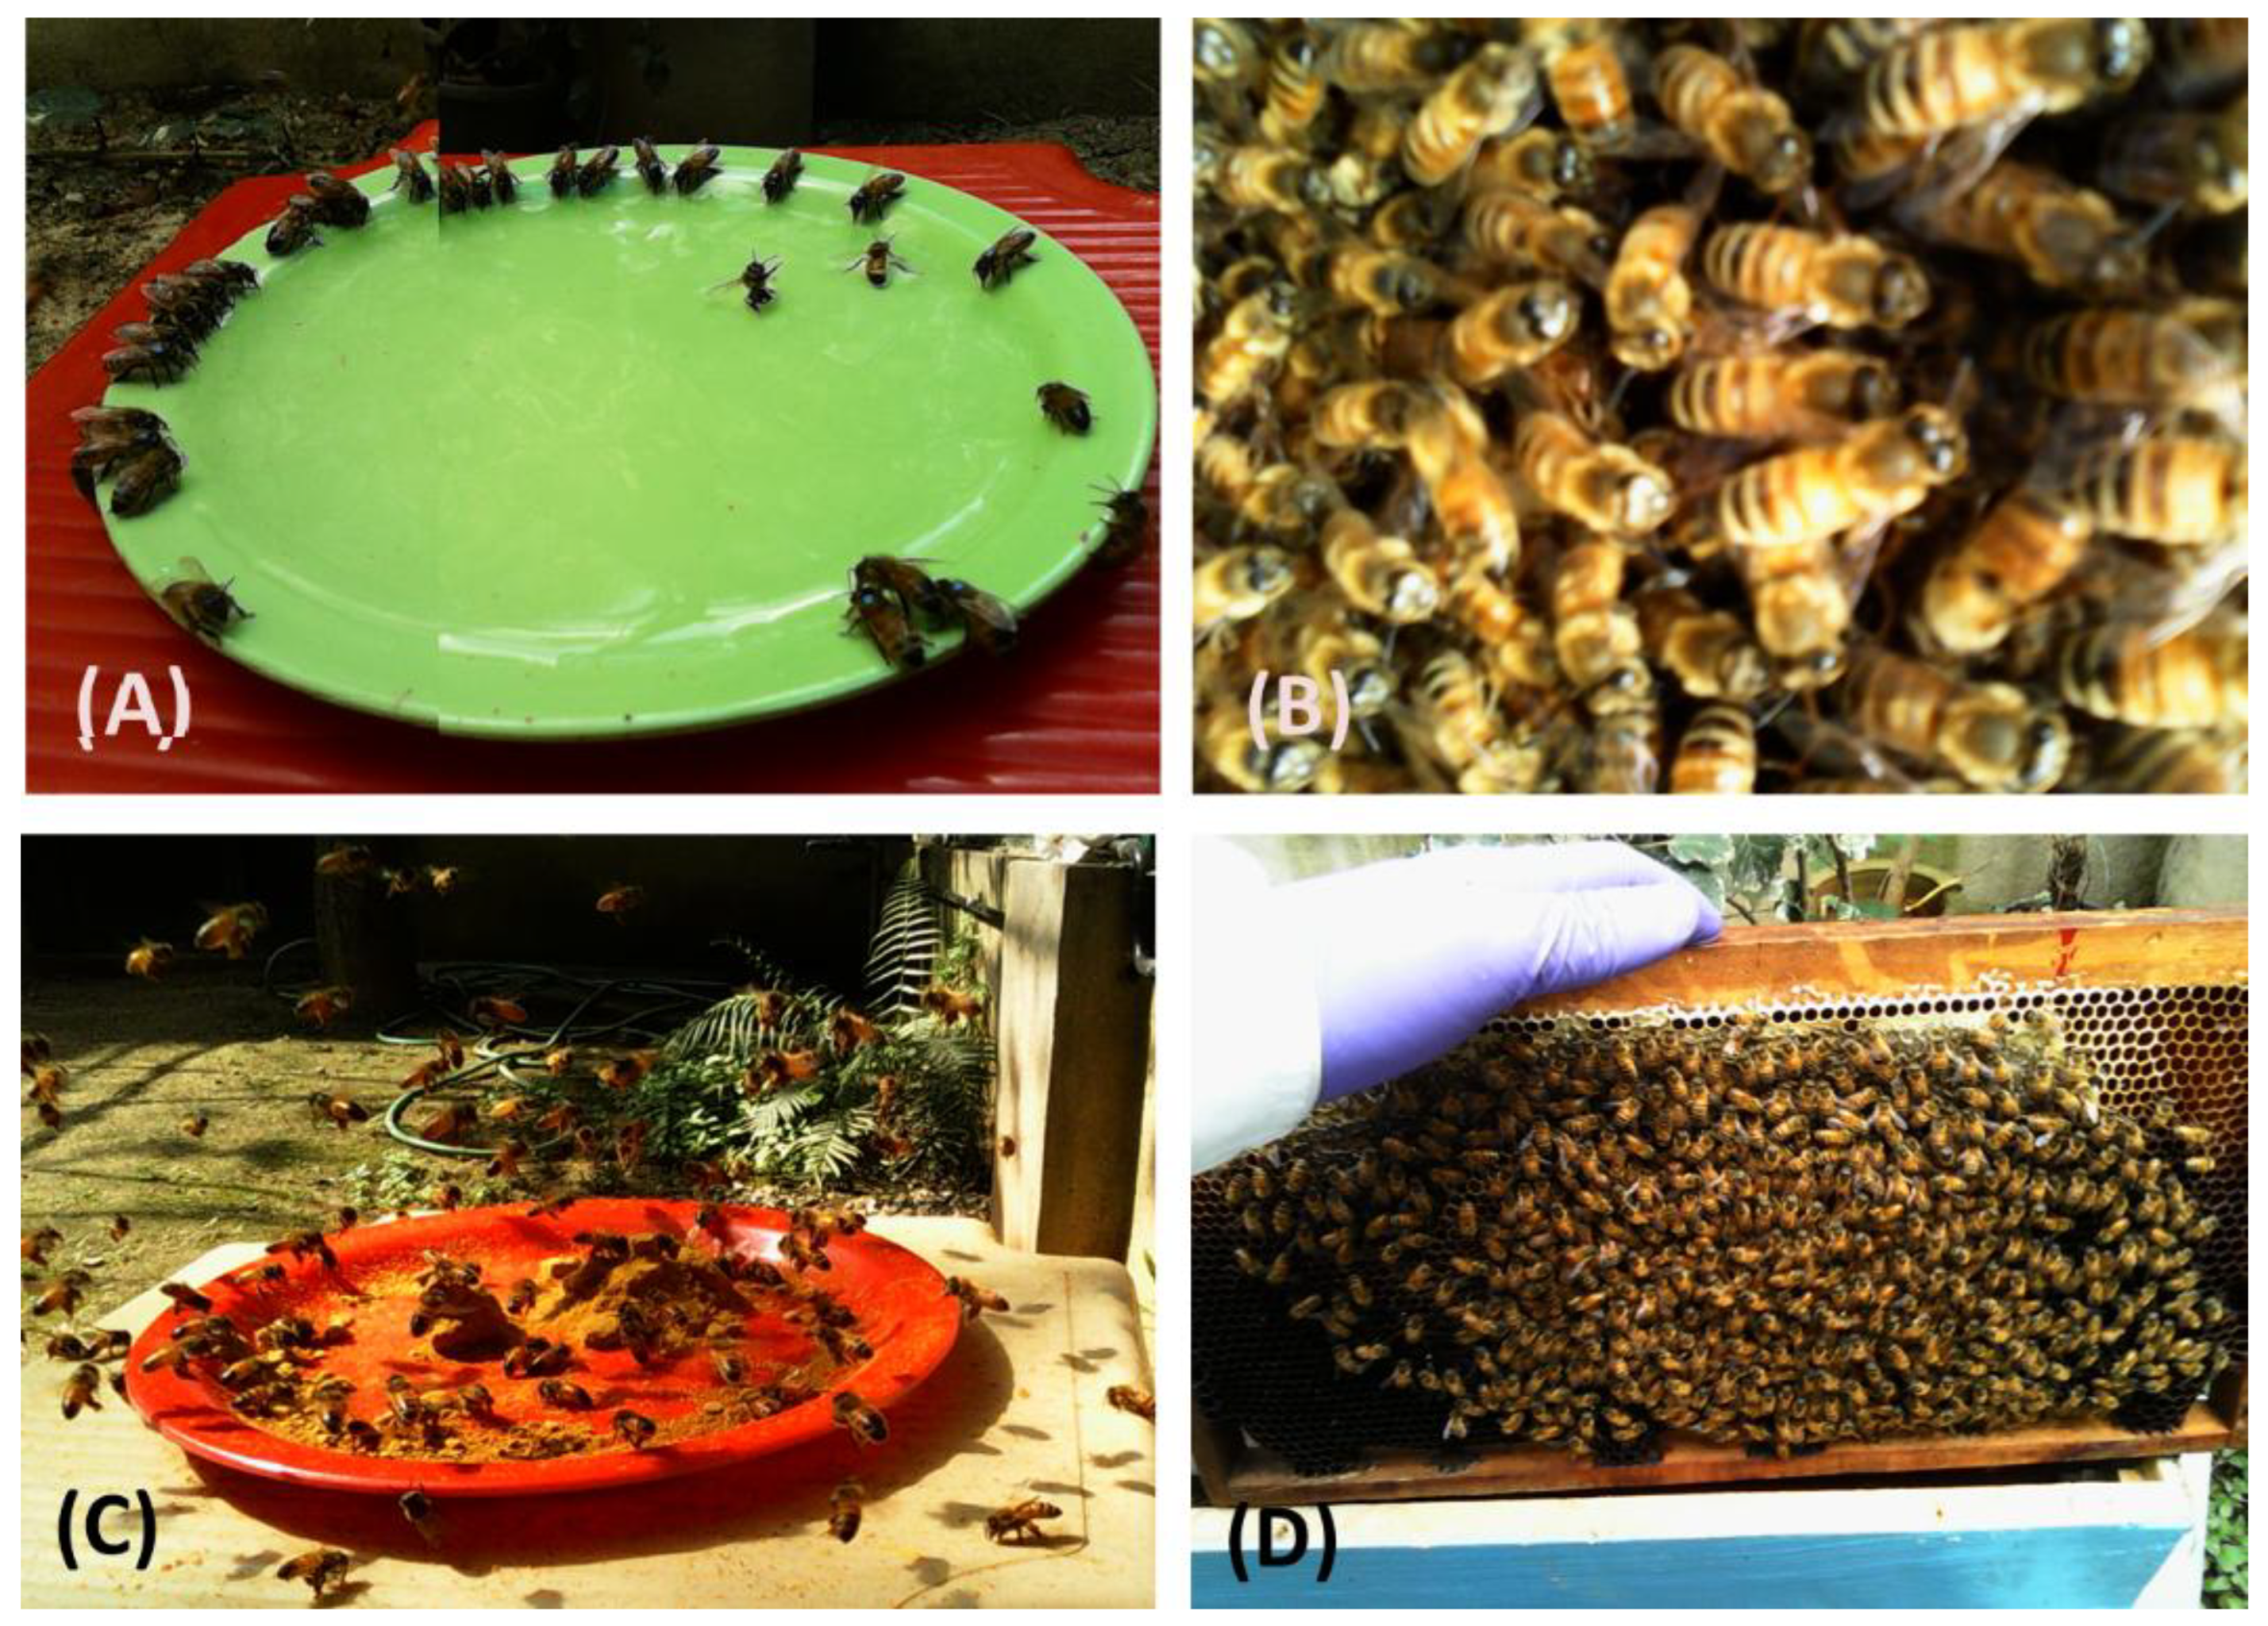
Figure 2.
Summary of genetic profiling of Immediate early genes. (A) represents Egr-1 (B) represents Hr38 (C) represents Kakusei (D) represents Egr-1, Hr38 and Kakusei interaction summery. Data are shown as fold changes with respect to 14:00 hr. (mean value was set as 1) the time point at which the bees began foraging. BF stands for before foraging and after foraging respectively. The A, C and D was analyzed using One-way ANOVA with Sidak's multiple comparisons test and D was analyzed by Two-way ANOVA with Tukey's multiple comparisons test. The p-values greater than 0.05 are considered statiscally not significant and * indicates P< 0.05, ** indicates P< 0.01, *** indicates P < 0.001, **** indicates P < 0.0001.
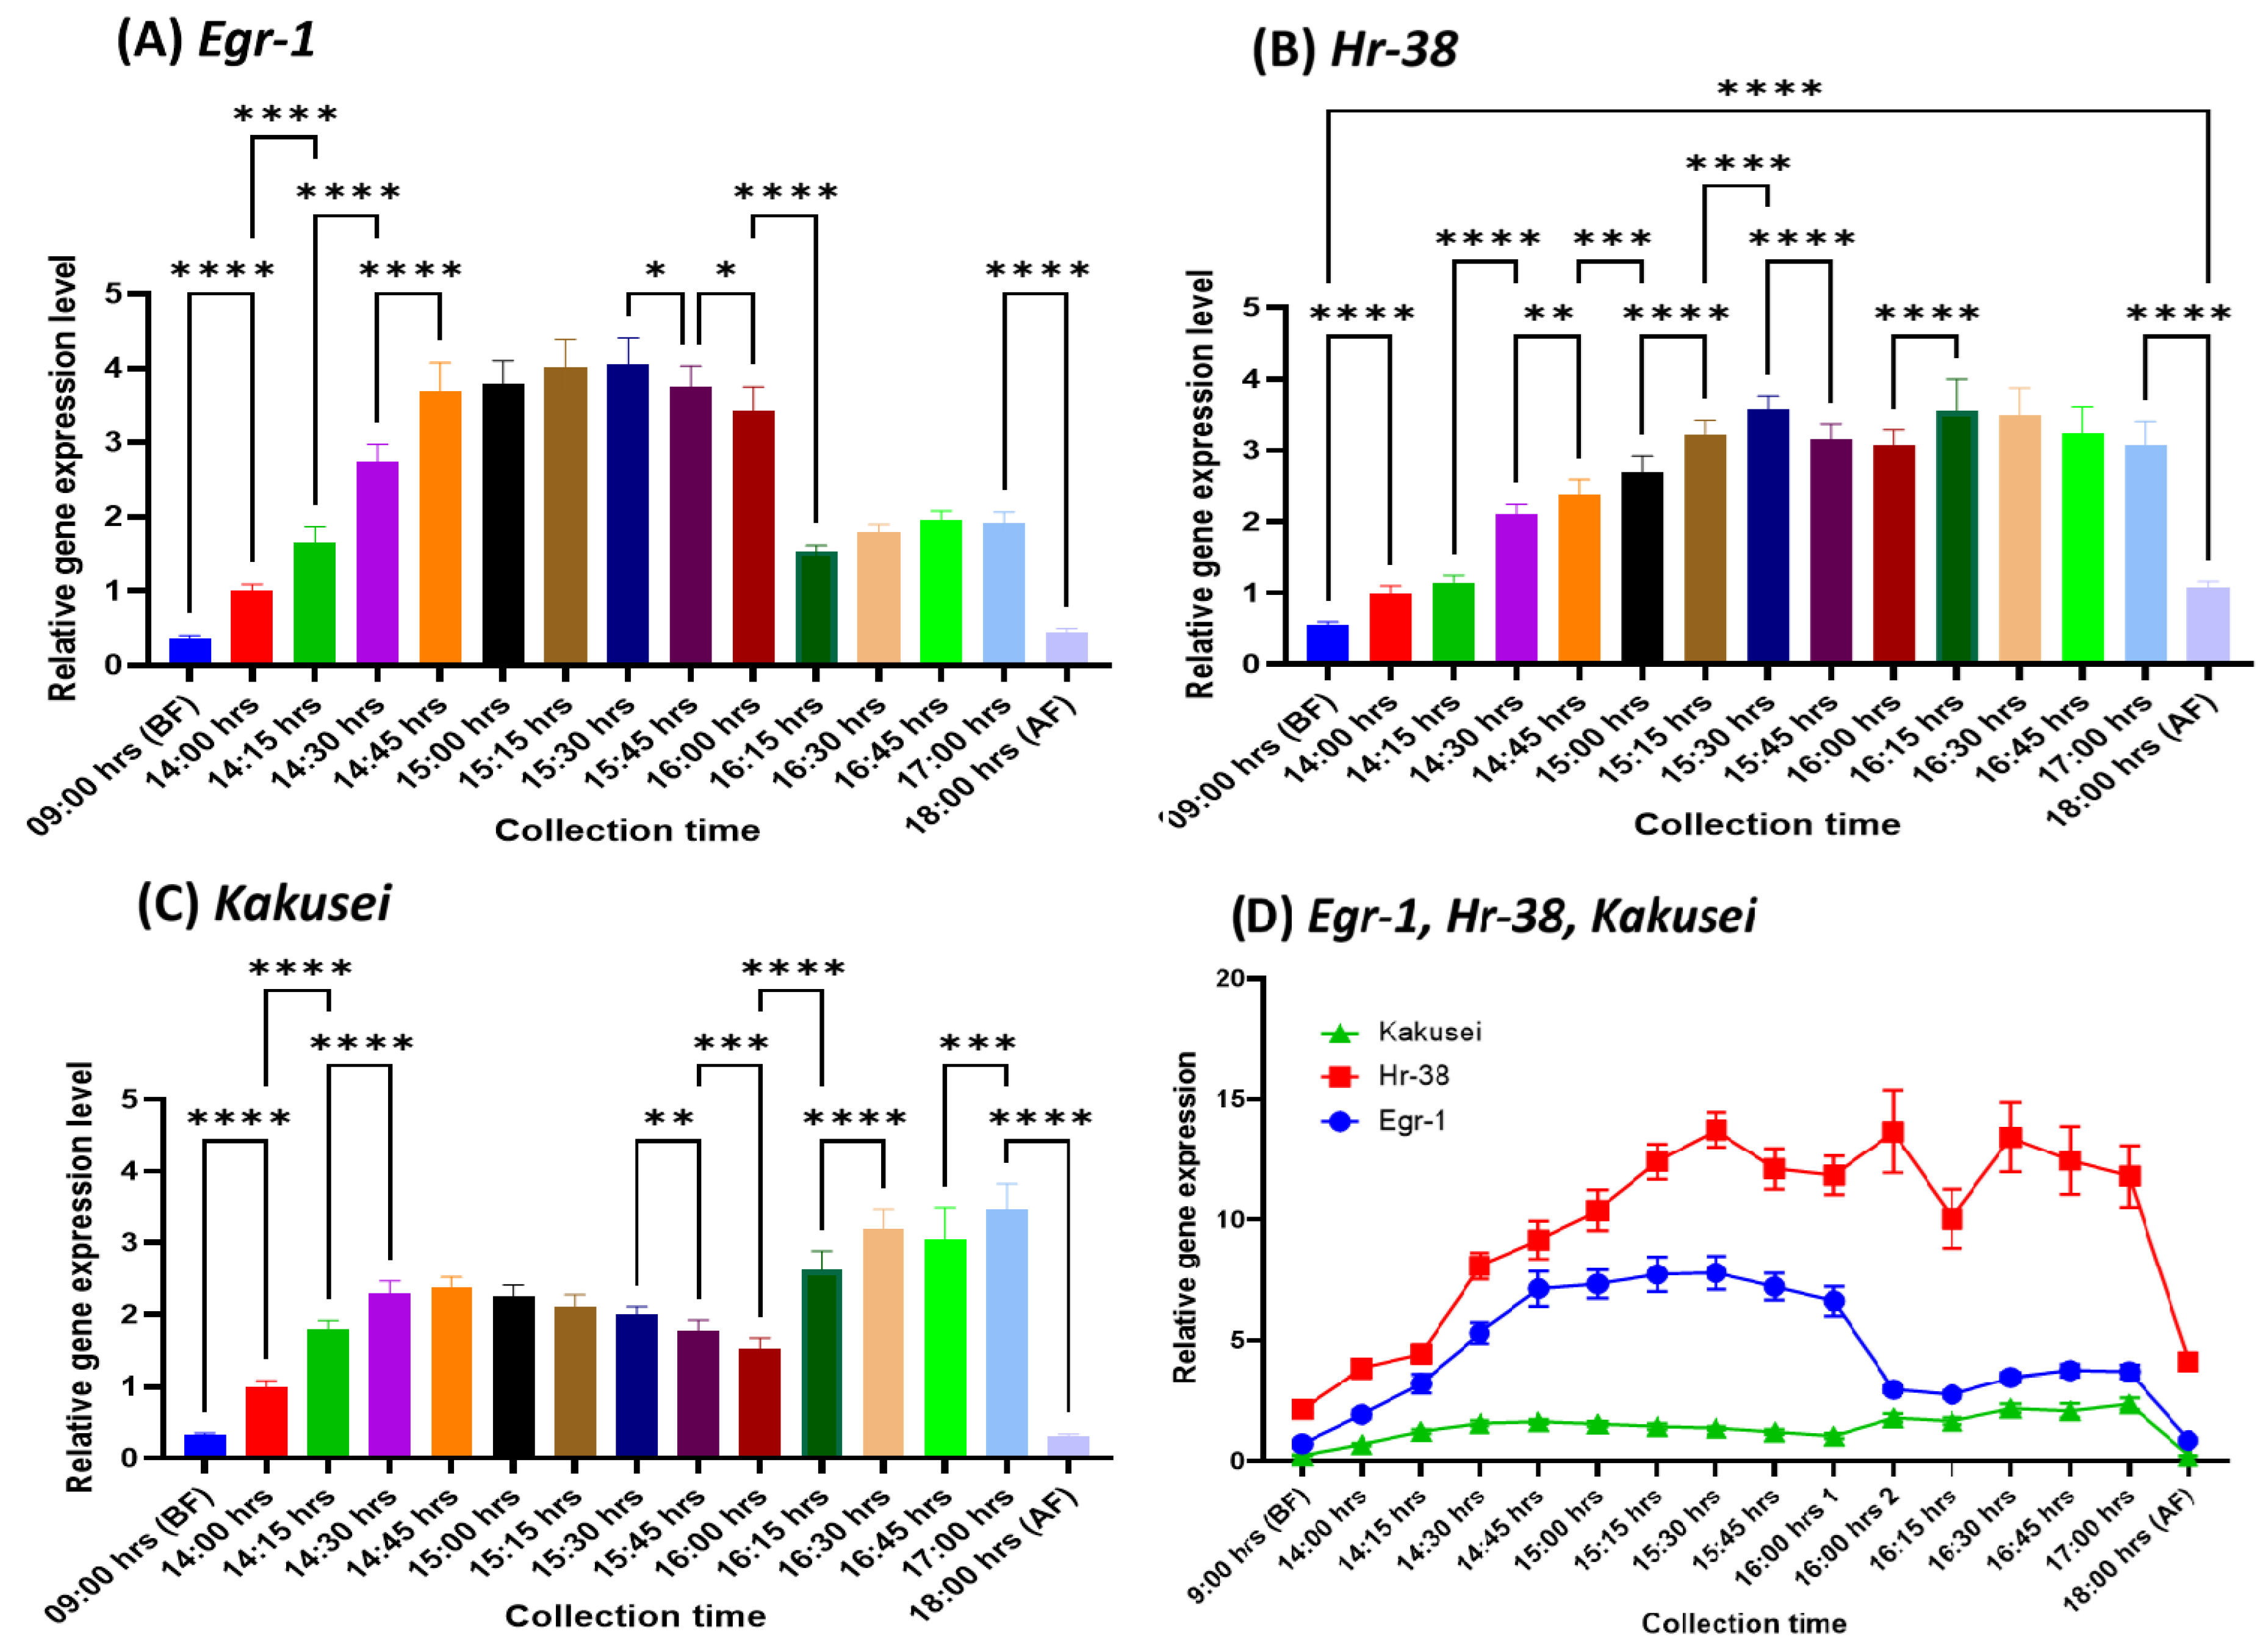

Table 1.
Gene locations in the chromosome, oligonucleotide primers.
| Gene Name | NCBI Gene ID | Chromosome No. & location | Oligonucleotide primer sequence 5´ - 3´ |
|---|---|---|---|
| Egr-1 | 726302 | LG15 | F- GCTCTGAGGGTGATTTCTCG |
| NC_007084.3 | R- GAGAAACCGTTCTGCTGTGA | ||
| Hr-38 | 551592 | LG13 | F- GCACGAATCAATCTTCTACAACC |
| NC_007082.3 | R- AATCCGCCAGGGTACTACATC | ||
| Kakusei | 100049563 | LG2 | F- TGGGTAGGGTTGGTAAGGGAA |
| NC_007071.3 | R- ACACGAAACCATCCTGCCAC | ||
| Rp49 | 406099 | LG11 | F- CAGTTGGCAACATATGACGAG |
| NC_007080.3 | R- AAAGAGAAACTGGCGTAAACC |
LG: Linkage Group.
Table 2.
One-way Anova Sadak’s multiple comparisons test for examining statistical difference between different time points for Egr-1, Hr38 and Kakusei, showing adjusted P values.
Table 2.
One-way Anova Sadak’s multiple comparisons test for examining statistical difference between different time points for Egr-1, Hr38 and Kakusei, showing adjusted P values.
| Comparing groups | Egr-1 P- Value | Hr38 P-Value | Kakusei P-Value |
|---|---|---|---|
| 14:00 vs. BF | <0.0001 | <0.0001 | <0.0001 |
| 14:15 vs. 14:00 hrs. | <0.0001 | 0.4231 | <0.0001 |
| 14:30 vs. 14:15 hrs. | <0.0001 | <0.0001 | <0.0001 |
| 14:45 vs. 14:30 hrs. | <0.0001 | 0.0019 | 0.7983 |
| 15:00 vs. 14:45 hrs. | 0.994 | 0.0003 | 0.3612 |
| 15:15 vs. 15:00 hrs. | 0.3239 | <0.0001 | 0.1066 |
| 15:30 vs. 15:15 hrs. | >0.9999 | <0.0001 | 0.6966 |
| 15:45 vs. 15:30 hrs. | 0.0238 | <0.0001 | 0.0022 |
| 16:00 vs. 15:45 hrs. | 0.0183 | 0.9971 | 0.0006 |
| 16:15 vs. 16:00 hrs. | <0.0001 | <0.0001 | <0.0001 |
| 16:30 vs. 16:15 hrs. | 0.8554 | >0.9999 | <0.0001 |
| 16:45 vs. 16:30 hrs. | 0.9988 | 0.5005 | 0.9199 |
| 17:00 vs. 16:45 hrs. | >0.9999 | 0.9402 | 0.001 |
| AF vs. 17:00 hrs. | <0.0001 | <0.0001 | <0.0001 |
| AF vs. BF | 0.9998 | <0.0001 | >0.9999 |
N.B: The p-values less than 0.05 is considered statically not significant.
Disclaimer/Publisher’s Note: The statements, opinions and data contained in all publications are solely those of the individual author(s) and contributor(s) and not of MDPI and/or the editor(s). MDPI and/or the editor(s) disclaim responsibility for any injury to people or property resulting from any ideas, methods, instructions or products referred to in the content. |
© 2025 by the authors. Licensee MDPI, Basel, Switzerland. This article is an open access article distributed under the terms and conditions of the Creative Commons Attribution (CC BY) license (http://creativecommons.org/licenses/by/4.0/).
Copyright: This open access article is published under a Creative Commons CC BY 4.0 license, which permit the free download, distribution, and reuse, provided that the author and preprint are cited in any reuse.


