
Submitted:
26 December 2024
Posted:
27 December 2024
You are already at the latest version
Abstract
External and internal changes in tomato fruit harvested at various ripening stages (from mature green to red ripe) were monitored during postharvest storage at 22 oC for 12 days. Non-destructive measurements of color, compression firmness and spectral reflectance data were captured with two portable, but differently technologically advanced spectroradiometers (a PSR+ 3500, Spectral Evolution and a DLP NIR Nano Scan, Texas Instruments) spectroradiometers in the visible-near infrared (visNIR) (340-2500 nm) or only the NIR (900-1700 nm) region. Significant changes in color, firmness, pH and soluble solids to titratable acidity ratio were observed during storage, especially in the less ripe fruits and were reliably assessed by all nondestructive techniques, especially by the spectral reflectance data captured at the 340-2500 nm part with the most sophisticated device. In general, visNIR spectroscopy, combined with chemometric techniques, is a powerful non-destructive method for assessing tomato quality and predicting shelf life. Although using both the visible and the near infrared part of the spectrum (340-2500 nm) provides more accurate assessments, the NIR part (900-1700 nm) alone can support reliable predictions, while the consumers are not capable of perceiving most of the changes that accompany postharvest ripening before consuming the products.
Keywords:
postharvest
; spectroscopy
; chemometrics
; partial least squares regression
; compression
; ripening stage
1. Introduction
Tomato (Solanum lycopersicum L.) is a globally consumed fruit, prized for its nutritional richness, including essential vitamins, antioxidants, and carotenoids such as lycopene and β-carotene [1]. However, its perishable nature exhibits significant challenges for postharvest management, with quality and shelf life significantly affected by the ripening stage of fruits at harvest and postharvest storage conditions [2], as long as the ripening stage has been reported to impose the most significant effect in firmness, pH and in the ratio soluble solids to TA and the storage duration in pigments’ content (chlorophyll, total carotenoids, lycopene and β-carotene). These quality parameters, namely color, firmness, soluble solids content (SSC), and titratable acidity (TA) are critical for both consumer satisfaction and market value. Traditionally most of them have been determined using destructive analytical methods, which, although reliable, are time-consuming and unsuitable for large-scale applications.
Recent advancements have highlighted the value of non-destructive methods, particularly visible and near-infrared (visNIR) spectroscopy, for their ability to efficiently and accurately assess fruit quality without inducing any damage. Vis-NIR spectroscopy has emerged as a powerful tool, capable of evaluating a range of physical and chemical properties through reflectance measurements across a broad spectral range, particularly during the postharvest processing of fruits and vegetables [3,4,5].
For instance, Alenazi et al., (2020) successfully used NIR spectroscopy to predict the antioxidant content of tomatoes, demonstrating reasonable accuracy for commercial applications. Likewise, other recent studies have demonstrated its capability in predicting firmness [7,8], and monitoring carotenoid content of tomatoes [9], across various varieties, ripening stages and ripening conditions [10]. Such applications extend even beyond tomatoes, with demonstrated effectiveness in citrus, apples, and kiwifruit, highlighting the versatility of this technology [3,11].
Additionally, affordable portable devices have facilitated real-time, non-destructive evaluations, such as predicting lycopene content in tomatoes, demonstrating practicality in commercial environments while reducing the need for traditional, time-consuming analytical methods [12].
Chandrasekaran et al., (2019) investigated the use of machine learning algorithms alongside NIR spectral data to enhance the accuracy of SSC predictions under different conditions. Funsueb et al., (2023) developed fruit quality indices combining spectral and chemical data, offering a comprehensive approach for non-destructive evaluations, while Chaarmart et al. (2021) expanded NIR spectroscopy applications to chemical quality assessments in juices, linking spectral patterns with flavor attributes.
Recently, visNIR spectroscopy methods, focusing on improved calibration techniques and algorithm enhancements were reviewed [7], while the effectiveness of interval-based models and deep learning algorithms for optimizing quality assessments has also been demonstrated [15].
The integration of chemometric methods, such as partial least squares regression (PLSR) and principal component regression (PCR) analyses, has further enhanced predictive accuracy, allowing for reliable assessment across diverse tomato cultivars and ripening conditions [16,17] and providing accurate predictions even of the internal composition of fruits [6]. Moreover, Shao et al. (2022) and Funsueb et al. (2023) developed comprehensive quality indices (CQI) by aggregating spectral and chemical data, providing a robust framework for monitoring ripening and shelf-life changes. Such a method illustrates the potential of integrating various wavelengths and advanced algorithms to predict complex quality parameters that would otherwise require extensive laboratory testing ([10].
Despite these advancements, challenges persist in optimizing calibration models to accommodate variations in environmental conditions, fruit heterogeneity, and measurement setups. Addressing these issues requires a concerted effort to integrate data fusion techniques, refine machine learning algorithms, and expand the spectral range for comprehensive analyses [5,18,19].
The aim of this study was to evaluate the efficacy of NIR spectroscopy at 900-1700 nm combined with chemometrics and machine learning approaches for assessing tomato quality attributes and shelf life, in comparison to the well-known accuracy of visNIR spectroscopy using data captured from devices of different technology and affordability, as an intermediate step to leverage non-destructive techniques in enhancing postharvest management practices.
2. Materials and Methods
Tomato plants cv. HM1823 were grown during the Fall season of 2023 in Immokalee at the Southwest Research and Education Center and fruits were harvested 14 weeks after transplanting. The fruits were graded in the field on a grading table and all the sound and uniform in size fruit were transferred to the Vegetable Horticulture laboratory in open plastic baskets where they had their pericarp wiped with a cloth to remove any foreign materials. Eventually, 1280 of these fruits were classified into 4 different ripening stages: mature green (MG), turning (T), pink (P), and red ripe (RR), as assessed visually. Eighty tomato fruits were selected in each ripening stage and were left in room temperature at 22 °C, simulating common retail market conditions. Starting from day 0 and every 4 days until day 12, twenty fruits per stage, per storage day and per replicate (4 reps in total) were subjected to non-destructive measurements before the analytical determination of the main nutritional components.
The color was determined at two diametrically opposite spots at the equatorial diameter of the tomato fruit using a colorimeter (Minolta CR-410, Minolta, Osaka, Japan), equipped with an 8-mm measuring head and a C illuminant (6774 K). The measuring head was in contact with fruit at the time of measurement. The colorimeter was calibrated using the manufacturer’s standard white calibration plate CR-A43. Color changes were quantified in the L*, a*, and b* color space and hue angle (ho) were later calculated from the equation ho= 180+ tan-1(b*/a*), when a*< 0, b*> 0).
Compression of individual fruit was determined by a pressure tester (Mitutoyo Gauge, Tokyo, Japan). Fruit was held between the flat surfaces of the tester base and an aluminum plate probe, and the gauge was manually set to zero. A 1000-g weight was placed above the tester probe when it was brough in contact with the fruit pericarp and the degree of compression (in mm) registered on the gauge was recorded after 5 seconds. Two measurements were taken on each fruit at the equatorial zone and were averaged into a mean value.
A portable spectroradiometer (PSR+ 3500 Spectral Evolution, Haverhill, MA, USA) was used in order to capture the reflectance spectra of the tomato fruits at the 340-2500 nm region of the electromagnetic spectrum consisting of 2150 bands with resolution ranging from 2.8 to 8 nm. A white plate (spectralon diffuse reflectance standard) was used as a standard, providing 100% reflectance. A miniature handheld and significantly less expensive DLP NIRscan Nano (Texas Instruments, Dallas, Texas, USA) spectrometer that provides a spectral signal output consisting of 228 bands between 900 and 1700 nm with widths ranging from 8 to 20 nm was also used. A white plate CR-A43 (Minolta, Osaka, Japan) was used to calibrate the reflectance. Two scans were acquired per fruit at the equatorial zone with both devices
Five out of the twenty fruits were grouped into one batch and were blended and filtered for nutritional composition analyses. In particular, soluble solids content (SSC) was measured in the juice of the blended material using a portable Atago PR-1 refractometer (Atago Co. Ltd., Tokyo, Japan). The pH and the titratable acidity were determined in the filtered extract, using the 719 S Titrino (Metrohm, Herisau, Switzerland). The pH of the extract was recorded and then it was titrated to pH 8.2 with 0.1 N NaOH. The titratable acidity was expressed in % malic acid. The ratio SSC/TA, which is an index that is strongly associated with human taste was calculated from the measurements above.
Analysis of variance was performed to assess the effects of ripening stage at harvest and shelf-life period on fruit color, firmness, pH and SSC/TA components (two-way ANOVA). Means were separated by an LSD test at the 0.05 level. The effect size of each factor was calculated based on the η2 index, where η2= [Sum of squares of each factor] / [Total sum of squares]. Linear regression analyses were also implemented to assess shelf life and nutritional composition based on color and firmness, while principal component regression (PCR) and partial least squares regression (PLSR) analyses were used for the spectra reflectance data that were previously preprocessed with the standard normal variate (SNV) method that performs a normalization of the data. Both are advanced modern regression methods that are recommended for analysis of highly collinear data. The principal components (PCs) of PCR and the latent variables (LVs) of PLSR were selected based on the lowest root mean square cross validation error (RMSECV) using the ‘random subsets’ with five data splits, five iterations, and ‘20% left-out data’ method. Each analysis was repeated several times (~20 times) in order to assess the variability of the results, in terms of root mean square error cross-validation (RMSECV) and verify that the percentage deviation was <5%. Data analyses were carried out using Microsoft Excel 2016, SPSS v. 25, MATLAB (Version R2017, The Math-works Inc., Natick, MA, USA) and PLS Toolbox 8.6 (Eigenvector Research Inc., Manson, WA, USA).
3. Results
3.1. External and Internal Compositional Changes During Storage
According to the analysis of variance, both the ripening stage at harvest, the shelf-life period and their interaction had a significant effect on ho, compression, pH and SSC/TA (Table 1). Indeed, the ripening stage at harvest significantly affected the traits above by 20, 31, 26 and 25%, followed by shelf-life (by 16, 10, 14 and 14%, respectively).
In particular, the red ripe (RR) harvested fruit had the lowest ho values since harvest and until 12 days at 22 oC, without significant changes during shelf life (Figure 1A). In the other 3 ripening stages (RS), the ho was reduced during shelf life and indeed, there were significant differences between the red ripe stage and the other 3 ones, until the 4th day in pink (P) harvested fruits, 8th day in turning (T) stage and 12th day in the mature green (MG) one.
When firmness of fruit was assessed non-destructively, using the compression method, the pattern was not identical. Interestingly, after 12 days of storage at 22 oC, the firmness of red ripe fruit remained at the initial levels as during harvest, while compression was increased in the 3 other stages until the last day (Figure 1B). Eventually, fruits that were harvested pink became as soft as the RR ones, contrary to the turning and mature green ones. Indeed, the MG fruits were significantly more firm than all stages even at the end of shelf life period.
Unlike the external changes, the nutritional composition (pH and SSC/TA) in the red ripe fruits significantly increased during storage (Figure 2A&B). The pH and the SSC/TA both increased in the 3 other groups of tomatoes but they never reached the levels that the RR obtained after 12 days. At the last day of shelf-life period, the pH and SSC/TA of MG and T tomato fruits were significantly lower than the pink ones (Figure 2A&B). Interestingly though, eventually the pink harvested fruits developed the same levels with the RR harvested ones, while the MG and T only reached the levels of the P ones on the 8th day but never the optimal of the RR fruits
3.2. Assessment of Shelf Life
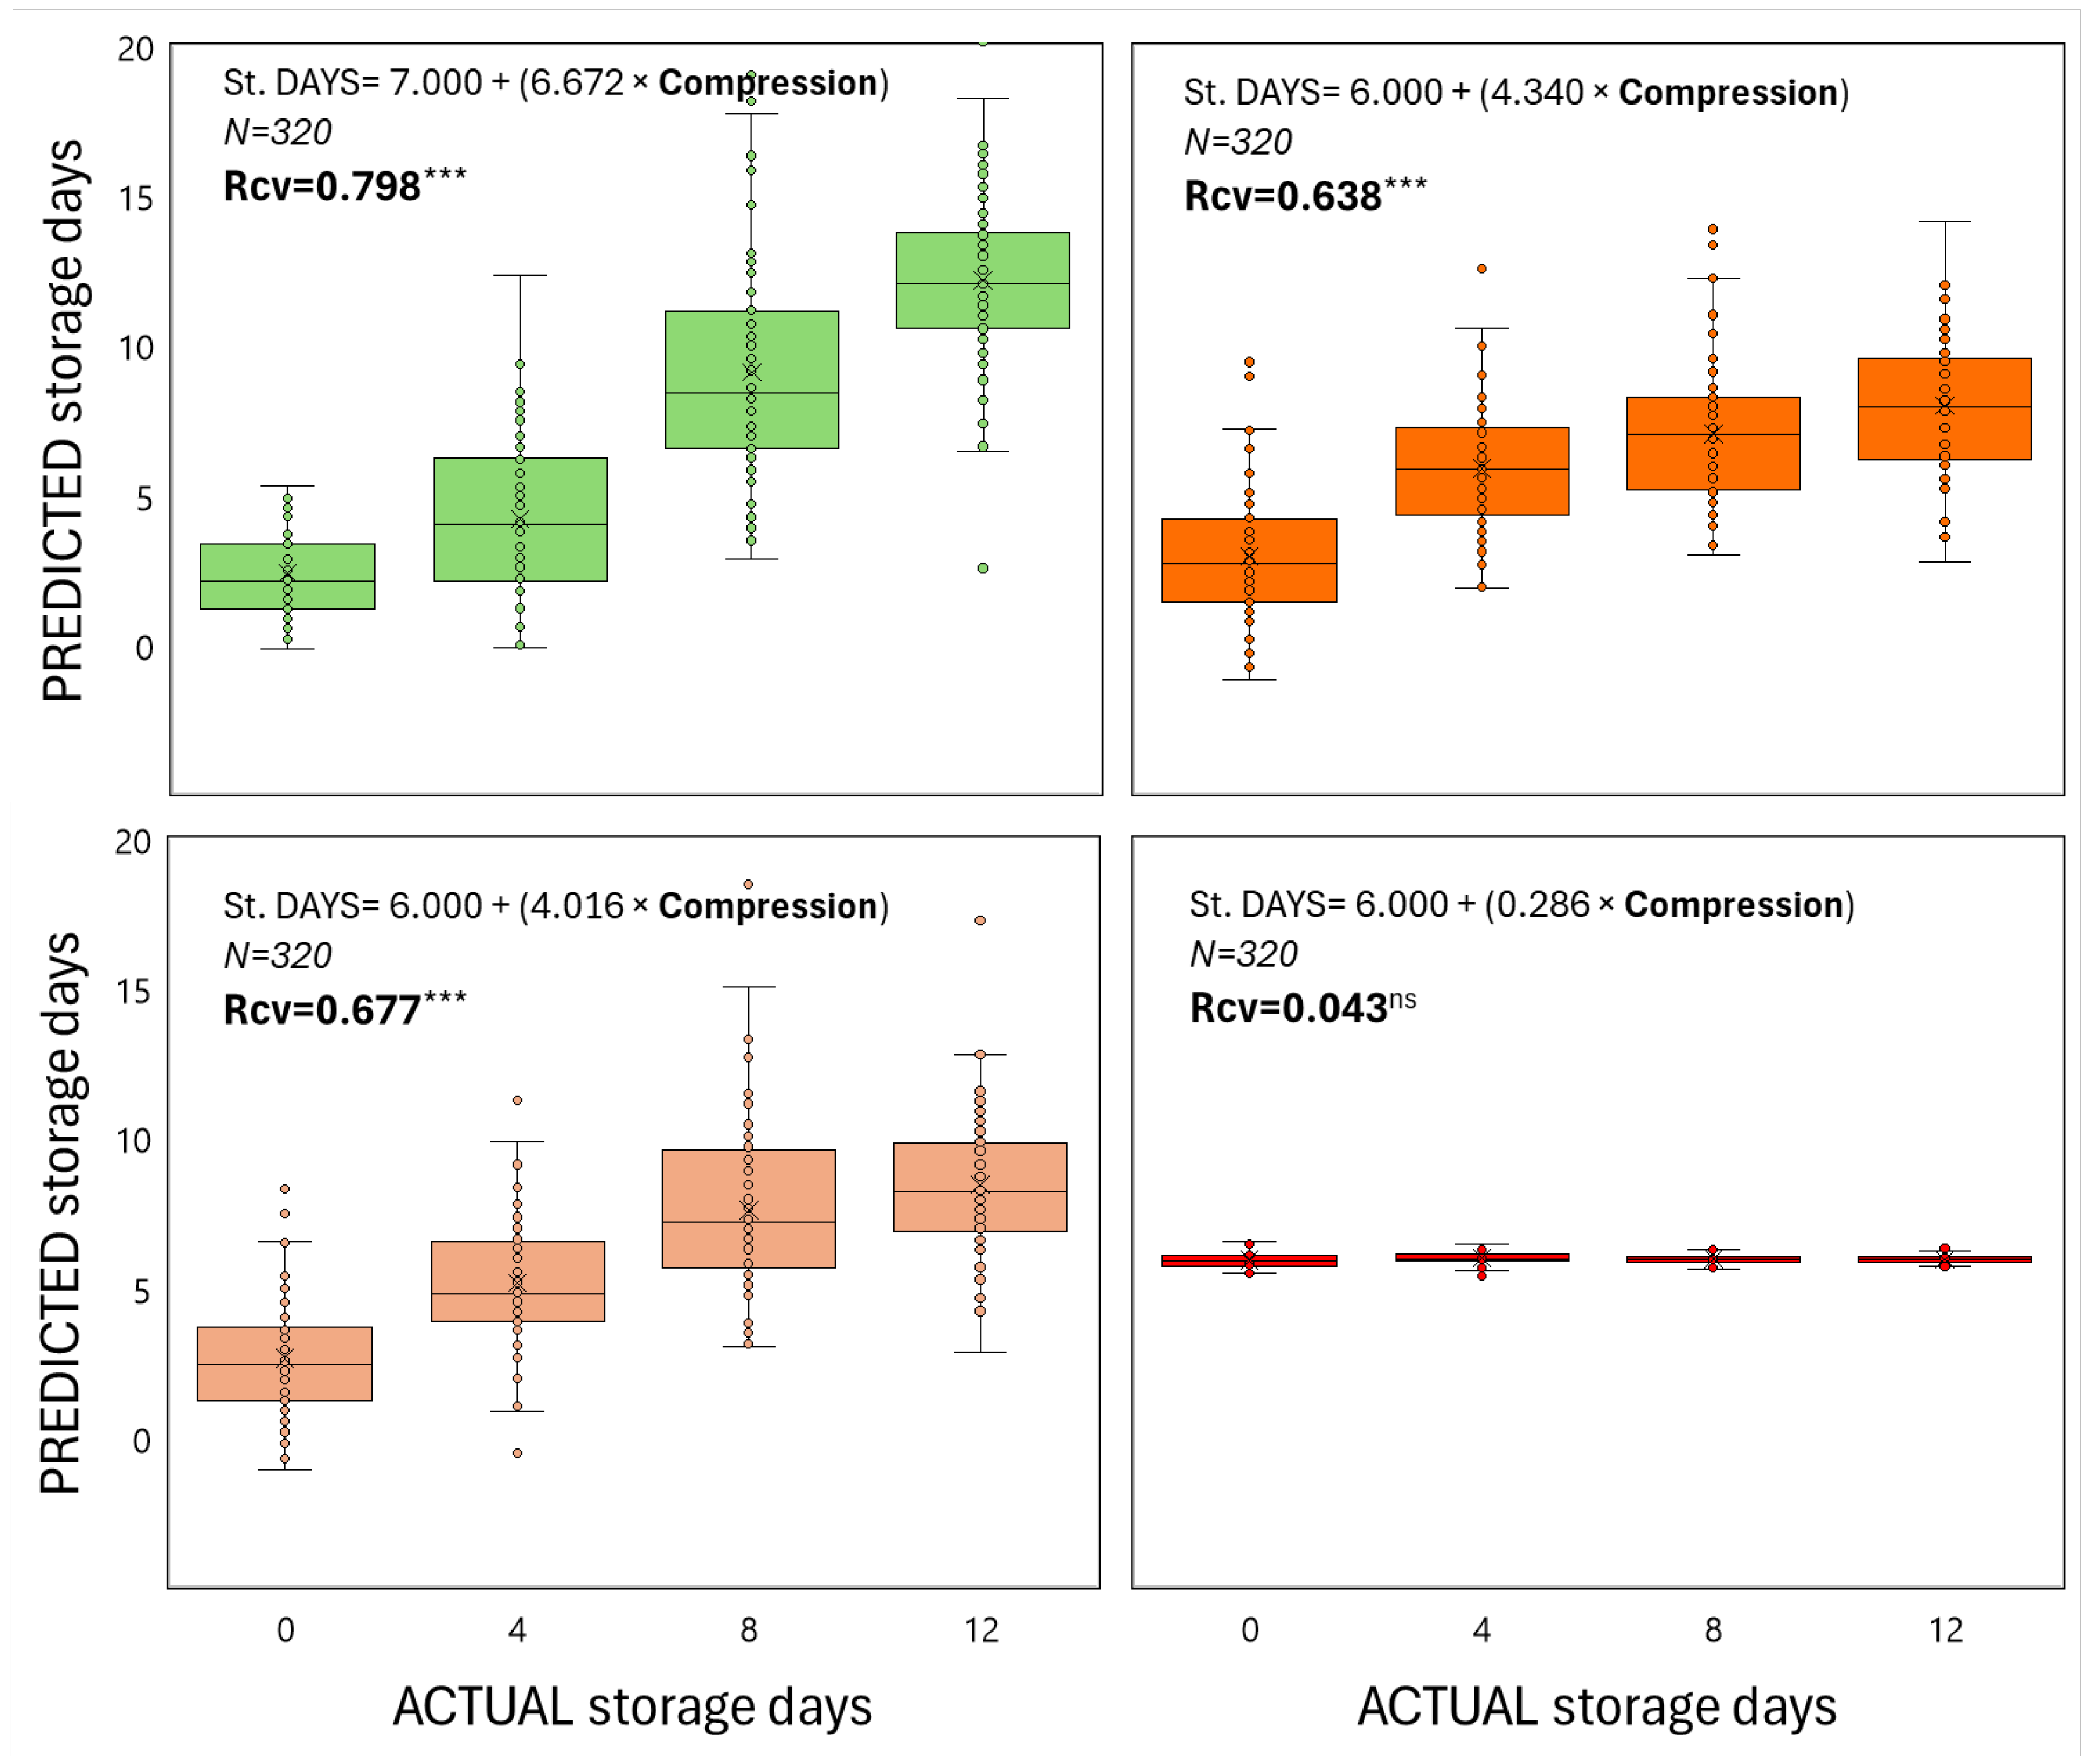
When both color and compression, as non-destructive techniques, were used as inputs in order to predict shelf-life duration in relation to the ripening stage of fruit at harvest, it is apparent that strong linear correlations were generated in most cases (Figs 3 & 4), meaning that color and firmness of tomato fruit can be reliably predicted during storage at 22 oC for up to 12 days. According to the regression coefficients, the less ripe the fruit is harvested, the better the regression model is (Figs 3 & 4). In particular, for RR, P, T and MG harvested fruits, the regression coefficients were (0.891, 0.798), (0.781, 0.677), (0.645, 0.638) and (0.400, 0.043) for ho and compression levels, respectively.
Figure 3.
The predicted storage duration in relation to the actual one of tomato fruits that were harvested at 4 ripening stages and stored at shelf-life conditions for 12 days, based on color (ho). Each box shows the interquartile range of the predicted data based on the liner regression of color (ho) versus storage period. The vertical line that splits the box in half is the median, which shows where 50% of the data falls and the single points on the plot indicate outliers. Each box results from data captured on 80 fruits within each ripening stage and storage day. The equation represents a linear regression between predicted and actual storage period and the Rcv is the regression coefficient of the cross-validated data based on the random subsets algorithm. The *** represents the significance of the regression analysis (P<0.001).
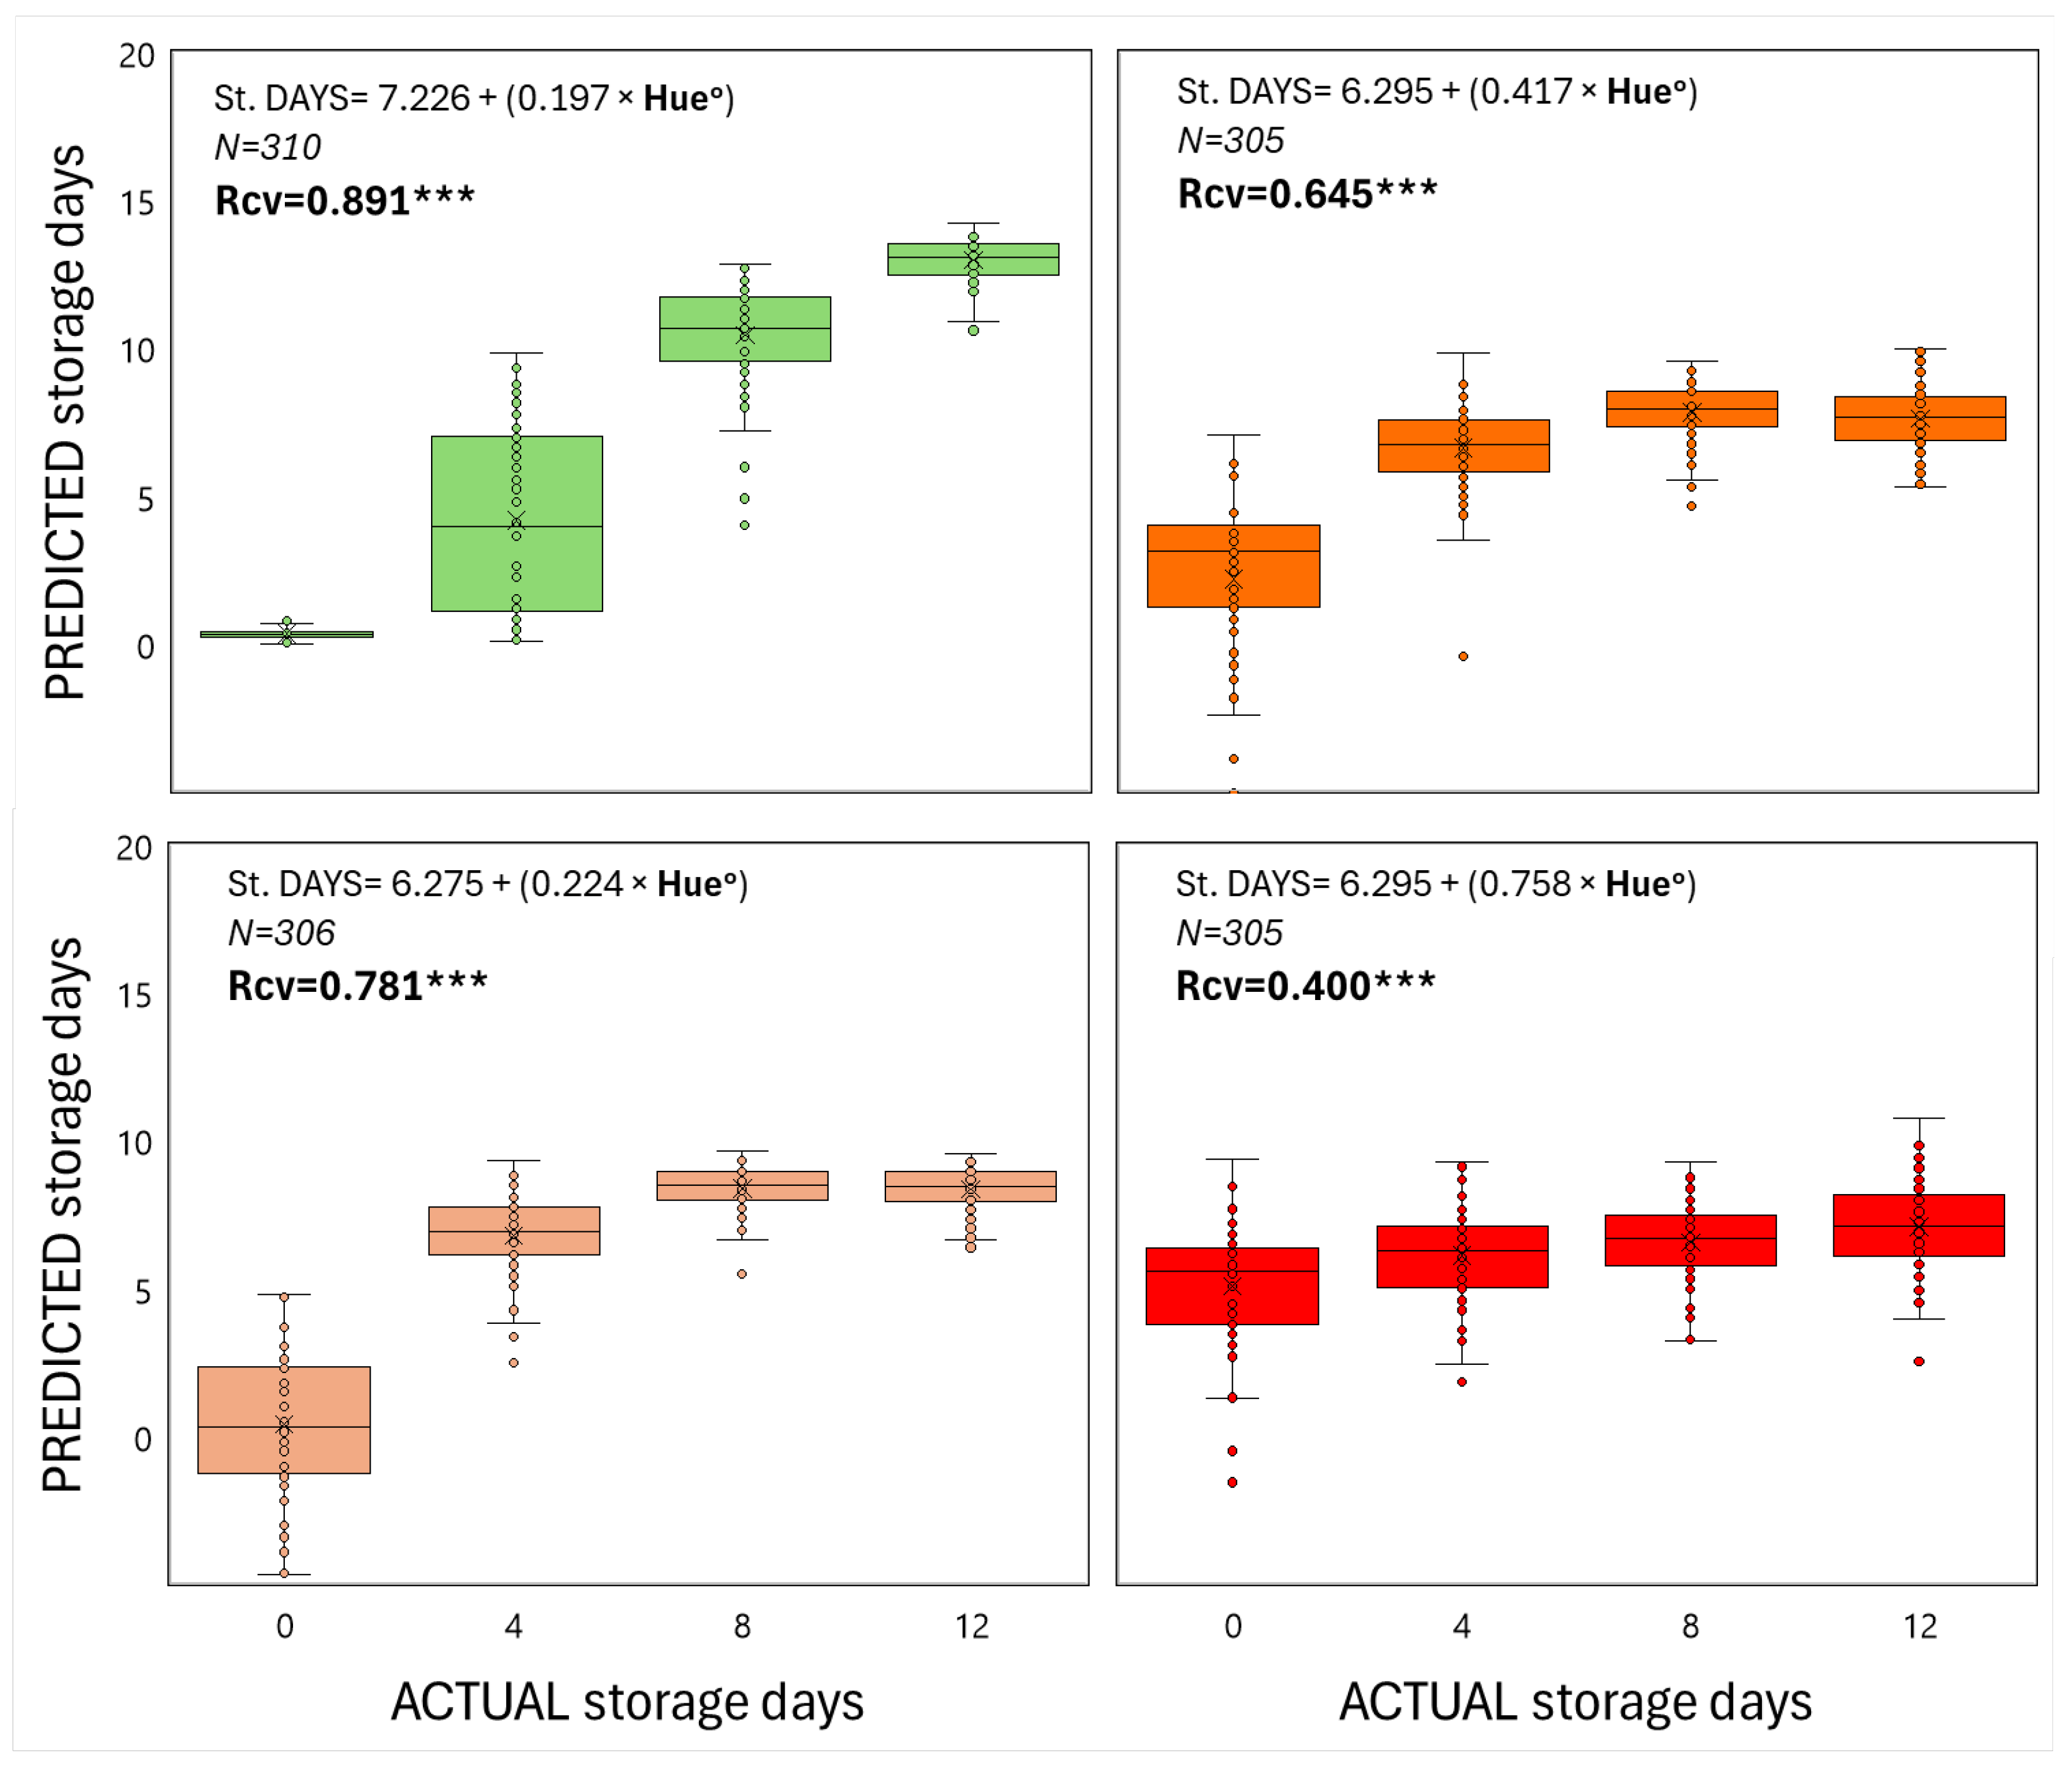
Figure 4.
The predicted storage duration in relation to the actual one of tomato fruits that were harvested at 4 ripening stages and stored at shelf-life conditions for 12 days, based on firmness (compression). Each box shows the interquartile range of the predicted data based on the liner regression of compression versus storage period. The vertical line that splits the box in half is the median, which shows where 50% of the data falls and the single points on the plot indicate outliers. Each box results from data captured on 80 fruits within each ripening stage and storage day. The equation represents a linear regression between predicted and actual storage period and the Rcv is the regression coefficient of the cross-validated data based on the random subsets algorithm. The *** represents the significance of the regression analysis (P<0.001).
The spectra reflectance at the 350-2500 nm region of the fruits during shelf-life storage, in relation to the ripening stage at harvest is shown in Figure 5. In the visible part (350-725 nm), there is a great variability of the pattern, especially in the less ripe fruit, which is in accordance with the color changes that are observed in these groups of tomato fruits and were commented above (Figure 1A). In that part of the electromagnetic spectrum, pigments that are responsible for the green (chlorophylls) or red color (carotenoids such as b-carotene and lycopene) and their mixtures reflect the incident light and are responsible for the characteristic pattern of these spectral signatures.
The next step targeted to assess the shelf-life period or even internal nutritional components, using only the information that is included in the near and short-wave infrared part of the reflected energy that is invisible to the human eye. For that reason, only the 900-1700 nm part was selected from the spectral data captured with the PSR 3500+ and a miniature portable spectroradiometer, NIR Scan Nano. Based on Figure 6 and Figure 7, it is apparent that the pattern of the spectral signatures between the 2 devices are similar because the spectral peaks and valleys coincide in the precise wavelength regions, although the absolute values are not exactly the same. This last observation must be related to the different calibration plates that were used during measurements.
Both devices were used in order to assess the storage period using 2 different regression model algorithms: an unsupervised one- PCR and a supervised one- PLSR. According to Table 2, the highest regression coefficients were obtained when reflectance data from the 340-2500 nm spectrum were used as inputs for the prediction models and indeed, the less advanced the ripening stage at harvest (i.e., mature green) the strongest the regression was (Table 2). In addition, the PLSR algorithm generated more accurate results than PCR (0.647-0.939 than 0.519-0.880, respectively). Interestingly, the miniature NIR Nano Scan spectroradiometer performed satisfactorily, in comparison to the most technologically advanced PSR+ 3500 especially in the mature green and turning stage harvested fruits, which are indeed the most common ripening stages during tomato harvesting in field grown tomato.
3.3. Assessment of pH and SSC/TA
The PLSR algorithm was selected to assess the pH and SSC/TA of tomato fruits based on all the non-destructive methods mentioned above, including data from all ripening stages at harvest. Interestingly, firmness data predicted more reliably the pH and SSC/TA than color (0.840 and 0.799 for firmness and 0.739 and 0.716 for ho, respectively) (Table 3). As expected, spectra reflectance data at 340-2500 nm proved to be the best technique to assess these nutritional components (R> 0.847) and it is interesting to note that NIR data from both devices (PSR+ 3500 and DLP NIR Scan Nano) could also reliably predict pH and SSC/TA (0.743-0.771 and 0.729-0.790, respectively) (Table 3).
4. Discussion
Color changes during storage were mostly evident in less ripe tomato fruits, with a gradual reddening as confirmed by ho increases (Figure 1). In other words, the red coloration in ripe tomatoes was not altered during shelf life, but in all the other ripening stages, eventually the fruits became equally red as the RR one, as also noted by a previous study [2] using a different tomato cultivar and a lower storage temperature (12oC) for longer period (16 days). This finding implies that after 12 days of shelf-life storage at 22 oC it is impossible for the human eye to perceive the initial ripening stage that a tomato fruit was at harvest.
Firmness trends, as expressed by compression tests, revealed a decline in MG, T and P fruits during storage, with RR tomatoes maintaining initial levels, consistent with the work of Cannata et al. (2024) and Funsueb et al. (2023). This means that the red ripe harvested tomatoes did not soften during shelf-life period, whereas the MG harvested ones, remained harder than all the other fruits although having obtained the same red coloration. Similar to compression, as a method to non-destructively assess the firmness of tomato fruit, Prasetyo et al. (2024) and Tan et al. (2022), demonstrated the effectiveness of visNIR spectroscopy in tracking textural changes. Kumar et al. (2022) found that firmness measurements correlated well with ripeness, but when combined with visNIR spectral data, the predictive accuracy for SSC/TA and other internal quality attributes significantly increased, emphasizing the potential of integrating these methods for comprehensive quality assessments.
Similarly to firmness and contrary to color changes, the pH and the ratio SSC/TA of mature green and turning ripe tomato fruits never obtained the levels of the red ripe fruits (Figure 2). Indeed, even the P fruit eventually, after 12 days, had lower pH and SSC/TA values than the RR fruits, although they reached the initial levels of the red ripe fruits at harvest. In other words, the taste of the RR harvested fruit was always superior to the other 3 ripening stages and consequently, this implies that upon purchase, taste is the only way that humans may perceive if a tomato fruit was harvested at the physiologically ripe stage, when the synthesis of most sugars and decomposition of acids had almost been completed.
The findings of this study reaffirm the potential of visNIR spectroscopy as a non-destructive tool for assessing tomato quality and predicting shelf life. Spectral data, particularly in the 350-1700 nm range, demonstrated strong correlations with critical quality parameters such as firmness, color, and SSC/TA. These results are consistent with earlier studies [1,6], which highlighted the accuracy of visNIR models in evaluating firmness and internal quality attributes like SSC, TA and antioxidant content across various ripening stages.
The hue angle (hº) results demonstrated distinct patterns across ripening stages, with red ripe (RR) fruits exhibiting stable color levels during storage, whereas less ripen fruits (mature green, MG; turning, T; and pink, P) progressively developed red coloration. Firmness measurements revealed a steady decline in compression resistance for less ripe fruits during storage, contrasting with the stability observed in RR fruits. These findings echo the work of Alenazi et al. (2020), who demonstrated the efficacy of NIR spectroscopy in monitoring firmness and antioxidant content, supporting its suitability for shelf-life evaluation. Similar results were noted by Cannata et al. (2024) and Funsueb et al. (2023), who proposed quality indices for postharvest firmness monitoring. This progression also aligns with previous studies, such as Shao et al. (2022) and Camps & Christen (2009), which reported that visNIR hyperspectral imaging effectively tracks carotenoid pigments changes related to ripening. The distinct spectral patterns observed in the visible range (350–725 nm) further validate the sensitivity of visNIR spectroscopy to pigment composition and structural changes in tomatoes [3,12] and its ability to predict internal attributes, including SSC and TA, further validates its use for comprehensive quality assessment [4].
The spectral reflectance data, particularly in the near-infrared range (900-1700 nm), highlights the robustness of the PSR3500+ and NIR Nano Scan devices in capturing shelf-life dynamics. These findings confirm studies by Zhao et al., (2024) and Anderson & Walsh (2022), that emphasized the importance of spectral calibration and advanced modeling techniques to enhance predictive accuracy. Reflectance variations mirrored the progression of color and firmness changes, confirming observations by Cattaneo & Stellari (2019) regarding the sensitivity of Vis-NIR spectroscopy to pigment and structural alterations in fruits. These results support the integration of spectral data into predictive models for shelf-life estimation, as demonstrated by Kumar et al. (2023) and Bureau et al. (2009).
The integration of advanced machine learning algorithms has further strengthened the reliability of Vis-NIR spectroscopy models. The importance of preprocessing techniques, such as Savitzky-Golay smoothing and baseline correction, was also noted in studies by Magwaza et al. (2012), emphasizing their role in enhancing model performance, while the use of chemometric methods, such PLSR coupled with wavelength selection techniques further enhanced predictive accuracy, as evidenced by studies of Walsh et al. (2023). The superior performance of PLSR algorithms in our study over principal component regression (PCR) underlines the need for targeted data preprocessing and algorithm selection in Vis-NIR applications. Future research, as proposed by Zhao et al. [2024), should refine algorithms and calibration models to address variations in fruit structure and storage conditions. Studies by Chandrasekaran et al. (2019) and Li et al. (2021) emphasize the need for machine learning enhancements, focusing on variable interactions and external validation.
Moreover, addressing variability arising from cultivar differences, environmental factors, and storage conditions is also crucial for model accuracy concerns. Integrating machine learning models with domain knowledge, as demonstrated by Yang et al. (2024) and can enhance prediction reliability and generalizability.
Additionally, future advancements, as proposed by Anderson & Walsh (2022), include the use of artificial intelligence and data fusion techniques to further improve accuracy and robustness. Studies by Sarkar et al. (2020) focused on integrating spatial and spectral data to refine predictive models having the potential to further refine quality assessments and expand the applicability of these technologies to diverse horticultural products [5,13].
Similarly, Yang et al. (2024) highlighted the importance of multispectral imaging for detailed texture analysis, complementing firmness measurements. Incorporating complementary technologies, such as Raman and ATR-FTIR spectroscopy, could provide more detailed molecular-level insights into quality changes, as suggested by Skolik et al. (2019). Simultaneously, the development of portable, cost-effective devices for real-time applications remains a critical area for innovation [19].
Overall, the integration of visNIR spectroscopy with chemometric modeling presents a transformative approach for postharvest quality assessment. By enabling precise, non-destructive evaluations of key attributes, these methods hold promise for optimizing tomato supply chains, minimizing waste, and enhancing consumer satisfaction. The adoption of these technologies in commercial settings will be instrumental in achieving sustainable agricultural practices.
5. Conclusions
Postharvest shelf-life storage of tomato is challenging due to rapid changes in terms of color, firmness and internal composition, especially in relation to the ripening stage of fruits at harvest. It is worth mentioning that consumers are not capable of sensing these changes before consuming the products. VisNIR spectroscopy, combined with chemometric techniques, is a powerful non-destructive method for assessing tomato quality and predicting shelf life. Using both the visible and the near infrared part of the spectrum (340-2500 nm) provides more accurate assessments, whereas even only the NIR part (900-1700 nm) can support reliable predictions. Indeed, even affordable miniature spectroradiometers are efficient in postharvest management practices of tomatoes when budget compromise is highly appreciated by the stakeholders. While effective, challenges like cultivar variability and environmental factors highlight the need for better calibration models. Addressing these will broaden adoption, enhance sustainability, and reduce postharvest losses, supporting efficient supply chains and high-quality produce.
Author Contributions
Conceptualization, P.T. and S.T.; methodology, P.T., S.T. and J.W.; software, P.T., S.T. and D.K.; validation, S.T., J.W. and D.K.; formal analysis, P.T. and J.W.; investigation, S.T. and D.K.; data curation, S.T. and D.K.; writing—original draft preparation, P.T and S.T.; writing—review and editing, J.W., S.T., D.K. and P.T.; visualization, S.T. and D.K.; supervision, P.T. All authors have read and agreed to the published version of the manuscript.
Funding
This research received no external funding.
Data Availability Statement
Data can be provided upon formal request to the authors.
Conflicts of Interest
The authors declare no conflicts of interest.
References
- Kumar, R.; Paul, V.; Pandey, R.; Sahoo, R.N.; Gupta, V.K. Reflectance Based Non-Destructive Determination of Colour and Ripeness of Tomato Fruits. Physiology and Molecular Biology of Plants 2022, 28, 275–288. [Google Scholar] [CrossRef]
- Kasampalis, D.S.; Tsouvaltzis, P.I.; Siomos, A.S. Tomato Fruit Quality in Relation to Growing Season, Harvest Period, Ripening Stage and Postharvest Storage. Emir J Food Agric 2021, 33. [Google Scholar] [CrossRef]
- Cattaneo, T.M.P.; Stellari, A. Review: NIR Spectroscopy as a Suitable Tool for the Investigation of the Horticultural Field. Agronomy 2019, 9. [Google Scholar] [CrossRef]
- Kumar, R.; Paul, V.; Pandey, R.; Sahoo, R.N.; Gupta, V.K.; Asrey, R.; Jha, S.K. Reflectance Based Non-Destructive Assessment of Tomato Fruit Firmness. Plant Physiology Reports 2022, 27, 374–382. [Google Scholar] [CrossRef]
- Chandrasekaran, I.; Panigrahi, S.S.; Ravikanth, L.; Singh, C.B. Potential of Near-Infrared (NIR) Spectroscopy and Hyperspectral Imaging for Quality and Safety Assessment of Fruits: An Overview. Food Anal Methods 2019, 12, 2438–2458. [Google Scholar] [CrossRef]
- Alenazi, M.M.; Shafiq, M.; Alsadon, A.A.; Alhelal, I.M.; Alhamdan, A.M.; Solieman, T.H.I.; Ibrahim, A.A.; Shady, M.R.; Saad, M.A.O. Non-Destructive Assessment of Flesh Firmness and Dietary Antioxidants of Greenhouse-Grown Tomato (Solanum Lycopersicum L.) at Different Fruit Maturity Stages. Saudi J Biol Sci 2020, 27, 2839–2846. [Google Scholar] [CrossRef] [PubMed]
- Zhao, Y.; Zhou, L.; Wang, W.; Zhang, X.; Gu, Q.; Zhu, Y.; Chen, R.; Zhang, C. Visible/near-Infrared Spectroscopy and Hyperspectral Imaging Facilitate the Rapid Determination of Soluble Solids Content in Fruits. Food Engineering Reviews 2024, 16, 470–496. [Google Scholar] [CrossRef]
- Prasetyo, E.W.; Amanah, H.Z.; Farras, I.; Pahlawan, M.F.R.; Masithoh, R.E. Partial Least Square Regression for Nondestructive Determination of Sucrose Content of Healthy and Fusarium Spp. Infected Potato (Solanum Tuberosum L.) Utilizing Visible and Near-Infrared Spectroscopy. Int J Adv Sci Eng Inf Technol, 2024; 14, 1001–1009. [Google Scholar] [CrossRef]
- Tan, B.; You, W.; Huang, C.; Xiao, T.; Tian, S.; Luo, L.; Xiong, N. An Intelligent Near-Infrared Diffuse Reflectance Spectroscopy Scheme for the Non-Destructive Testing of the Sugar Content in Cherry Tomato Fruit. Electronics (Switzerland) 2022, 11. [Google Scholar] [CrossRef]
- Kumar, R.; Paul, V.; Pandey, R.; Sahoo, R.N.; Gupta, V.K. Reflectance-Based Non-Destructive Assessment of Total Carotenoids in Tomato Fruits. Plant Physiology Reports 2023, 28, 152–160. [Google Scholar] [CrossRef]
- Amanah, H.Z.; Pratiwi, E.Z.D.; Rahmi, D.N.; Pahlawan, M.F.R.; Masithoh, R.E. Non-Destructive Determination of Water Content in Fruits Using Vis-NIR Spectroscopy. Food Res 2024, 8, 9–14. [Google Scholar] [CrossRef] [PubMed]
- Goisser, S.; Wittmann, S.; Fernandes, M.; Mempel, H.; Ulrichs, C. Comparison of Colorimeter and Different Portable Food-Scanners for Non-Destructive Prediction of Lycopene Content in Tomato Fruit. Postharvest Biol Technol 2020, 167. [Google Scholar] [CrossRef]
- Funsueb, S.; Thanavanich, C.; Theanjumpol, P.; Kittiwachana, S. Development of New Fruit Quality Indices through Aggregation of Fruit Quality Parameters and Their Predictions Using Near-Infrared Spectroscopy. Postharvest Biol Technol 2023, 204. [Google Scholar] [CrossRef]
- Chaarmart, K.; Narongwongwattana, S.; Rittiron, R.; Sa-Ngiamvibool, W. Evaluation of Chemical Quality on Juices and Wine Produced from Mamao Fruit (Antidesma Puncticulatum Miq.) within near-Infrared Spectroscopy. Instrumentation Mesure Metrologie 2021, 20, 255–260. [Google Scholar] [CrossRef]
- Li, M.; Lu, L.; Zhang, X. Qualitative Determination of Pesticide Residues in Purple Cabbage Based on near Infrared Spectroscopy. In Proceedings of the Journal of Physics: Conference Series; IOP Publishing Ltd., April 27 2021; Vol. 1884.
- Yang, J.; Sun, Z.; Tian, S.; Jiang, H.; Feng, J.; Ting, K.C.; Lin, T.; Ying, Y. Enhancing Spectroscopy-Based Fruit Quality Control: A Knowledge-Guided Machine Learning Approach to Reduce Model Uncertainty. Postharvest Biol Technol 2024, 216. [Google Scholar] [CrossRef]
- Shao, Y.; Shi, Y.; Qin, Y.; Xuan, G.; Li, J.; Li, Q.; Yang, F.; Hu, Z. A New Quantitative Index for the Assessment of Tomato Quality Using Vis-NIR Hyperspectral Imaging. Food Chem 2022, 386. [Google Scholar] [CrossRef] [PubMed]
- Anderson, N.T.; Walsh, K.B. Review: The Evolution of Chemometrics Coupled with near Infrared Spectroscopy for Fruit Quality Evaluation. J Near Infrared Spectrosc 2022, 30, 3–17. [Google Scholar] [CrossRef]
- Santos, Y.J.S.; Malegori, C.; Colnago, L.A.; Vanin, F.M. Application on Infrared Spectroscopy for the Analysis of Total Phenolic Compounds in Fruits. Crit Rev Food Sci Nutr 2024, 64, 2906–2916. [Google Scholar] [CrossRef]
- Cannata, C.; Mauro, R.P.; Rutigliano, C.A.C.; Basile, F.; Muratore, G.; Restuccia, C.; Sabatino, L.; Leonardi, C. Exploring the Evolution of Postharvest Quality and Composition in Novel Mini Plum Tomatoes with Different Fruit Pigmentations. Agronomy 2024, 14. [Google Scholar] [CrossRef]
- Camps, C.; Christen, D. Non-Destructive Assessment of Apricot Fruit Quality by Portable Visible-near Infrared Spectroscopy. LWT 2009, 42, 1125–1131. [Google Scholar] [CrossRef]
- Bureau, S.; Ruiz, D.; Reich, M.; Gouble, B.; Bertrand, D.; Audergon, J.-M.; Renard, C.M.G.C. Rapid and Non-Destructive Analysis of Apricot Fruit Quality Using FT-near-Infrared Spectroscopy. Food Chem 2009, 113, 1323–1328. [Google Scholar] [CrossRef]
- Magwaza, L.S.; Opara, U.L.; Nieuwoudt, H.; Cronje, P.J.R.; Saeys, W.; Nicolaï, B. NIR Spectroscopy Applications for Internal and External Quality Analysis of Citrus Fruit-A Review. Food Bioproc Tech 2012, 5, 425–444. [Google Scholar] [CrossRef]
- Walsh, J.; Neupane, A.; Koirala, A.; Li, M.; Anderson, N. Review: The Evolution of Chemometrics Coupled with near Infrared Spectroscopy for Fruit Quality Evaluation. II. The Rise of Convolutional Neural Networks. J Near Infrared Spectrosc 2023, 31, 109–125. [Google Scholar] [CrossRef]
- Sarkar, M.; Assaad, M.; Gupta, N. Phase Based Time Resolved Reflectance Spectroscopy Using Time-of-Flight Camera for Fruit Quality Monitoring. In Proceedings of the 2020 IEEE Sensors Applications Symposium, SAS 2020 - Proceedings; 2020.
- Skolik, P.; Morais, C.L.M.; Martin, F.L.; McAinsh, M.R. Determination of Developmental and Ripening Stages of Whole Tomato Fruit Using Portable Infrared Spectroscopy and Chemometrics. BMC Plant Biol 2019, 19. [Google Scholar] [CrossRef] [PubMed]
Figure 1.
Color (ho) and firmness (compression) of tomato fruits that were harvested at 4 ripening stages and stored at shelf-life conditions for 12 days. Each value represents the mean of 80 fruits in each ripening stage and storage day. The vertical bar represents the least significant difference (LSD) at P<0.05.
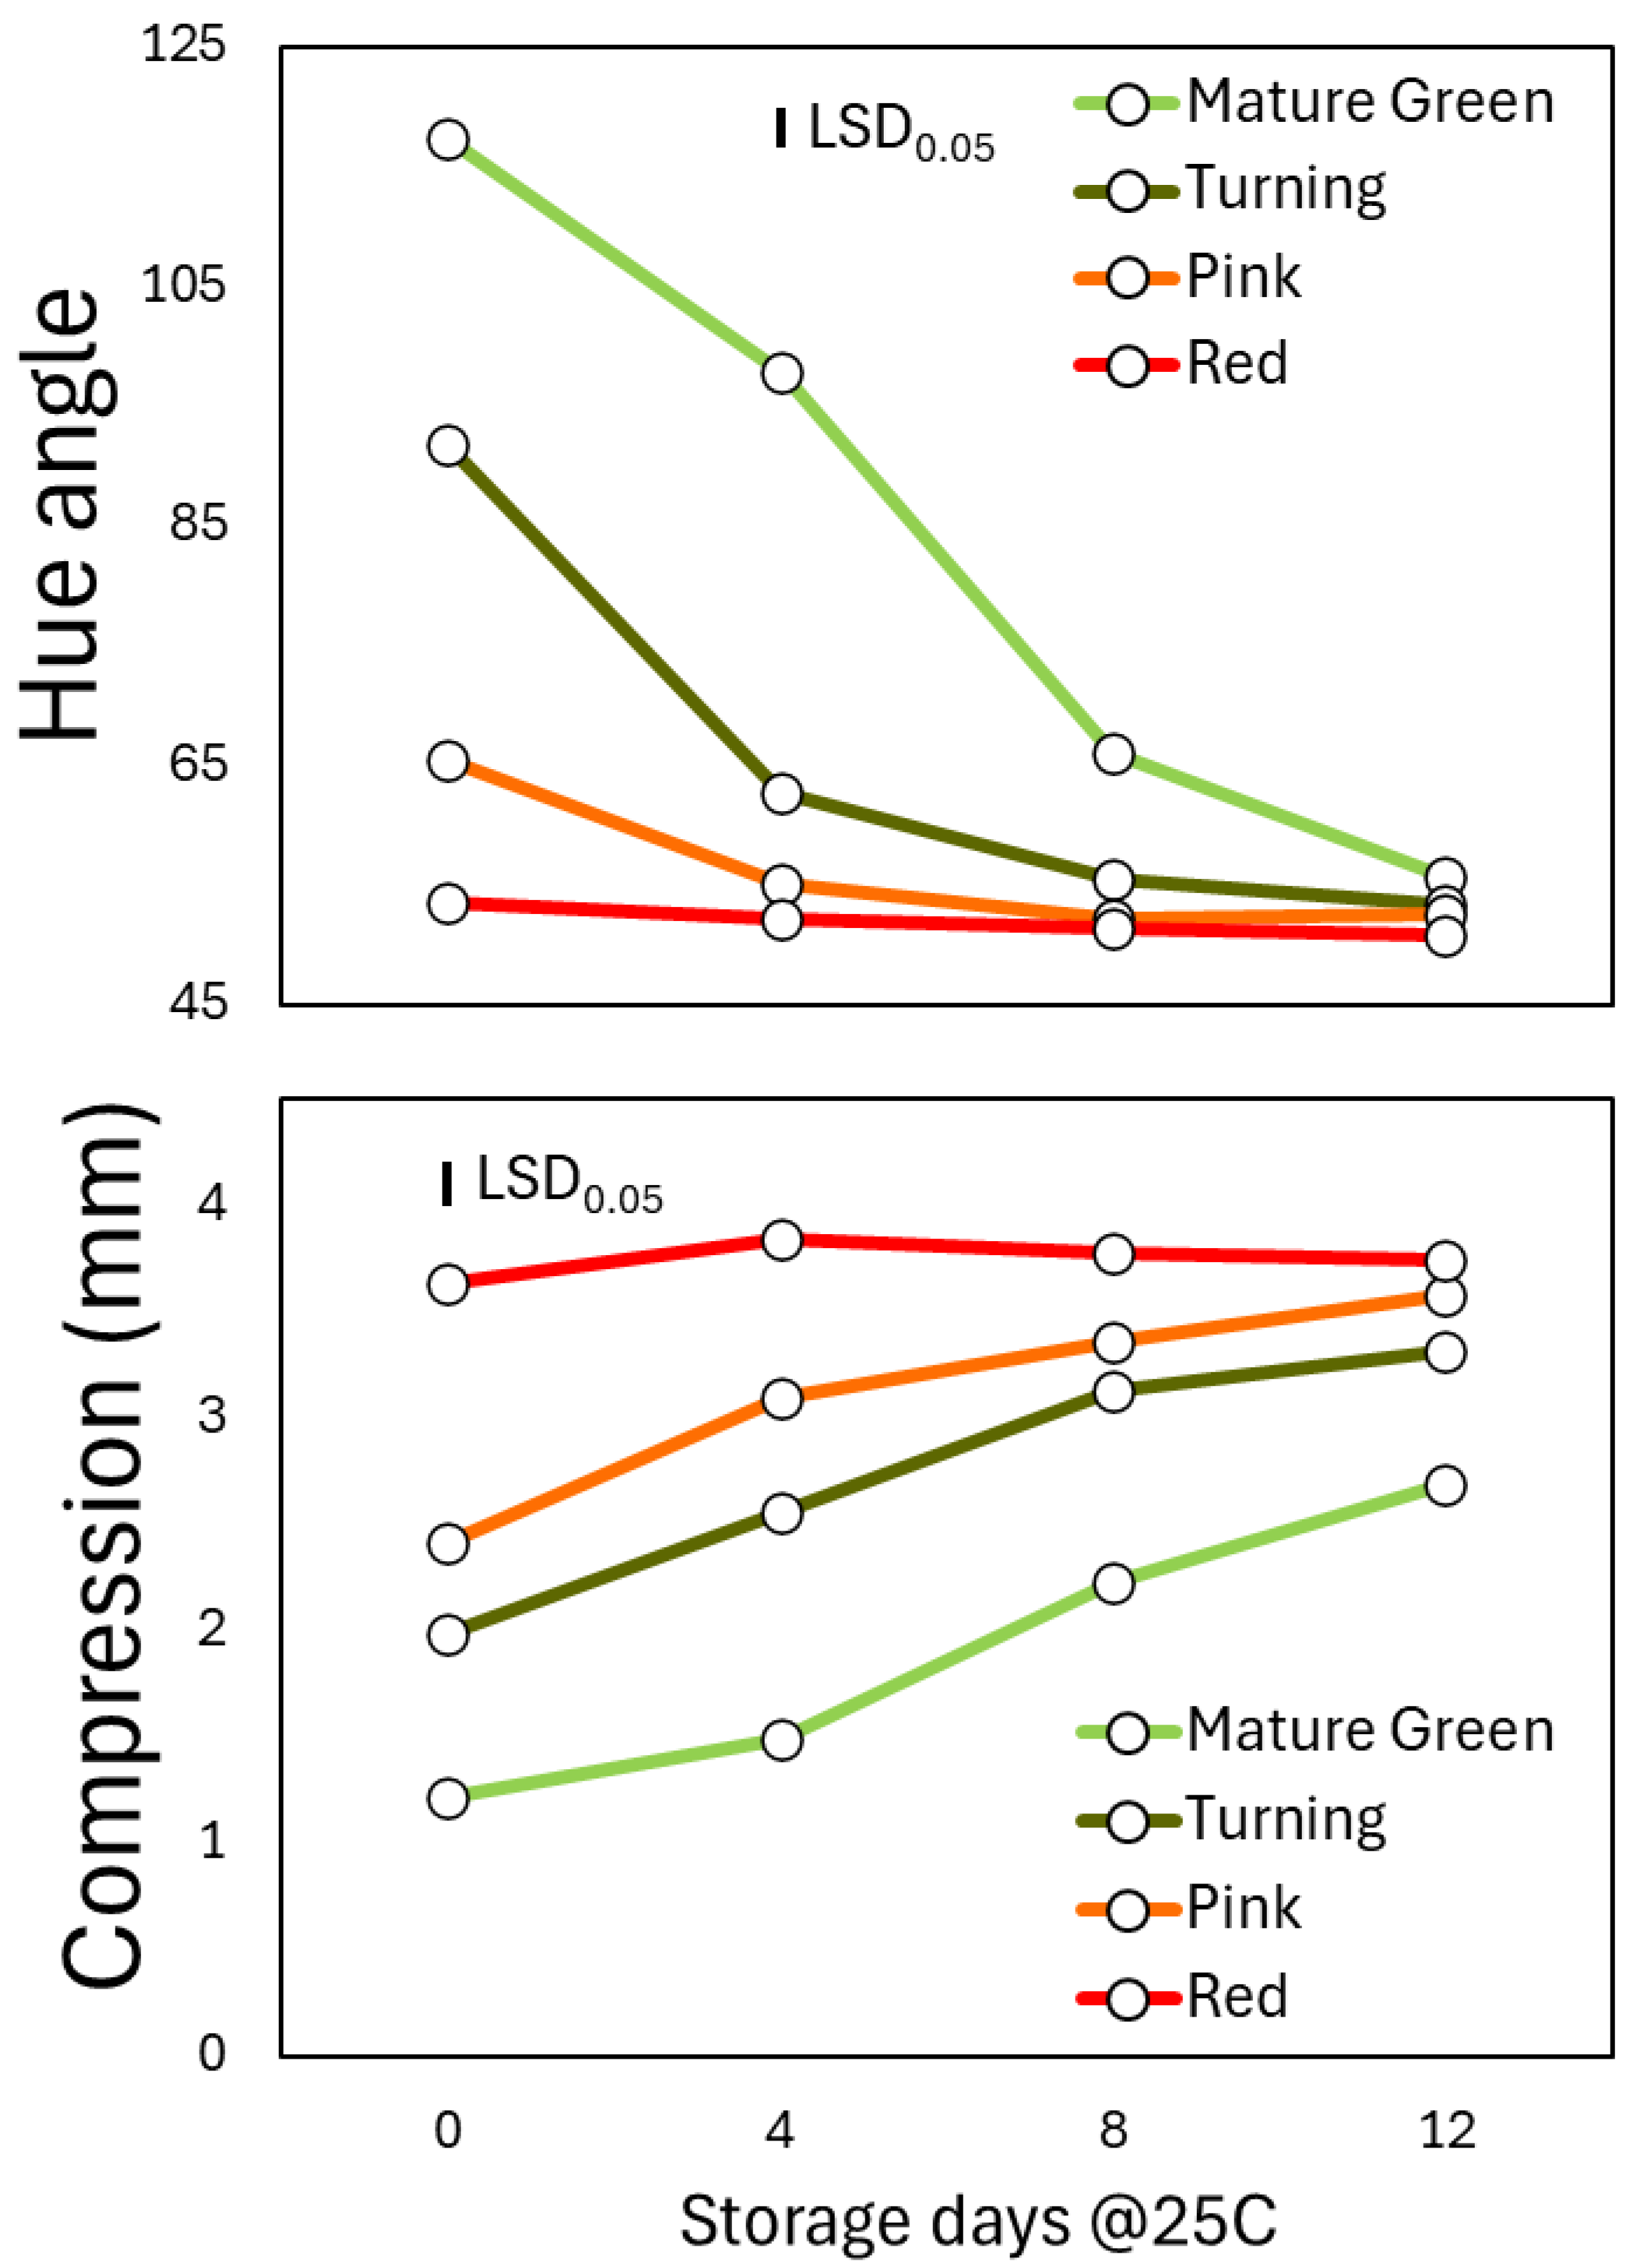
Figure 2.
The pH and the ratio of soluble solids content to titratable acidity (SSC/TA) of tomato fruits that were harvested at 4 ripening stages and stored at shelf-life conditions for 12 days. Each column represents the mean of 4 replications with 5 fruits in each replication within each ripening stage and storage day. The vertical bar represents the least significant difference (LSD) at P<0.05.
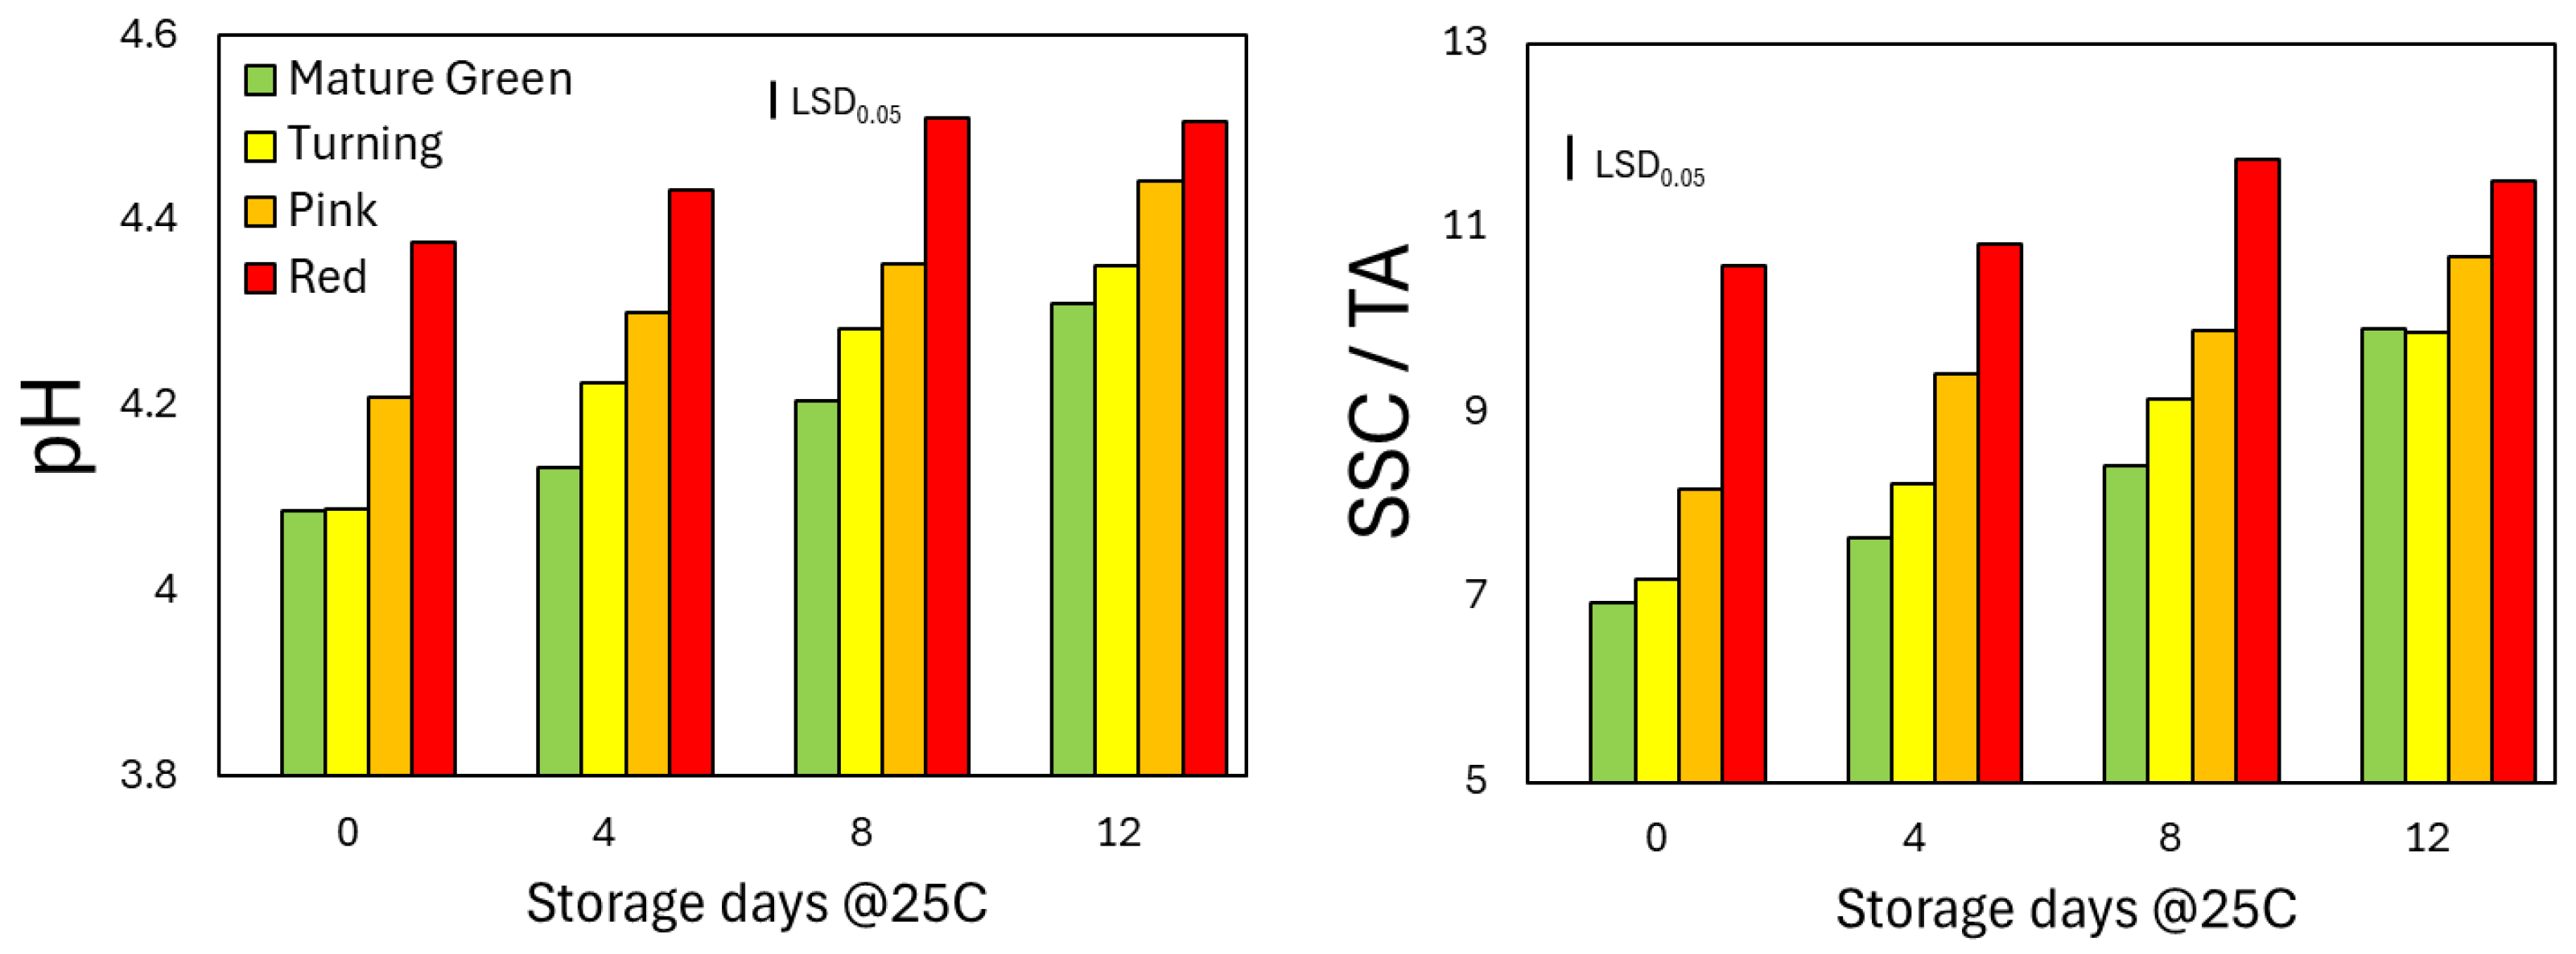
Figure 5.
The spectral reflectance that was measured with a portable spectroradiometer (PSR+ 3500) in the region 350-2500nm on tomato fruits that were harvested at 4 ripening stages and stored at shelf-life conditions for 12 days. Each line represents the mean of 80 fruits in each ripening stage and storage day.
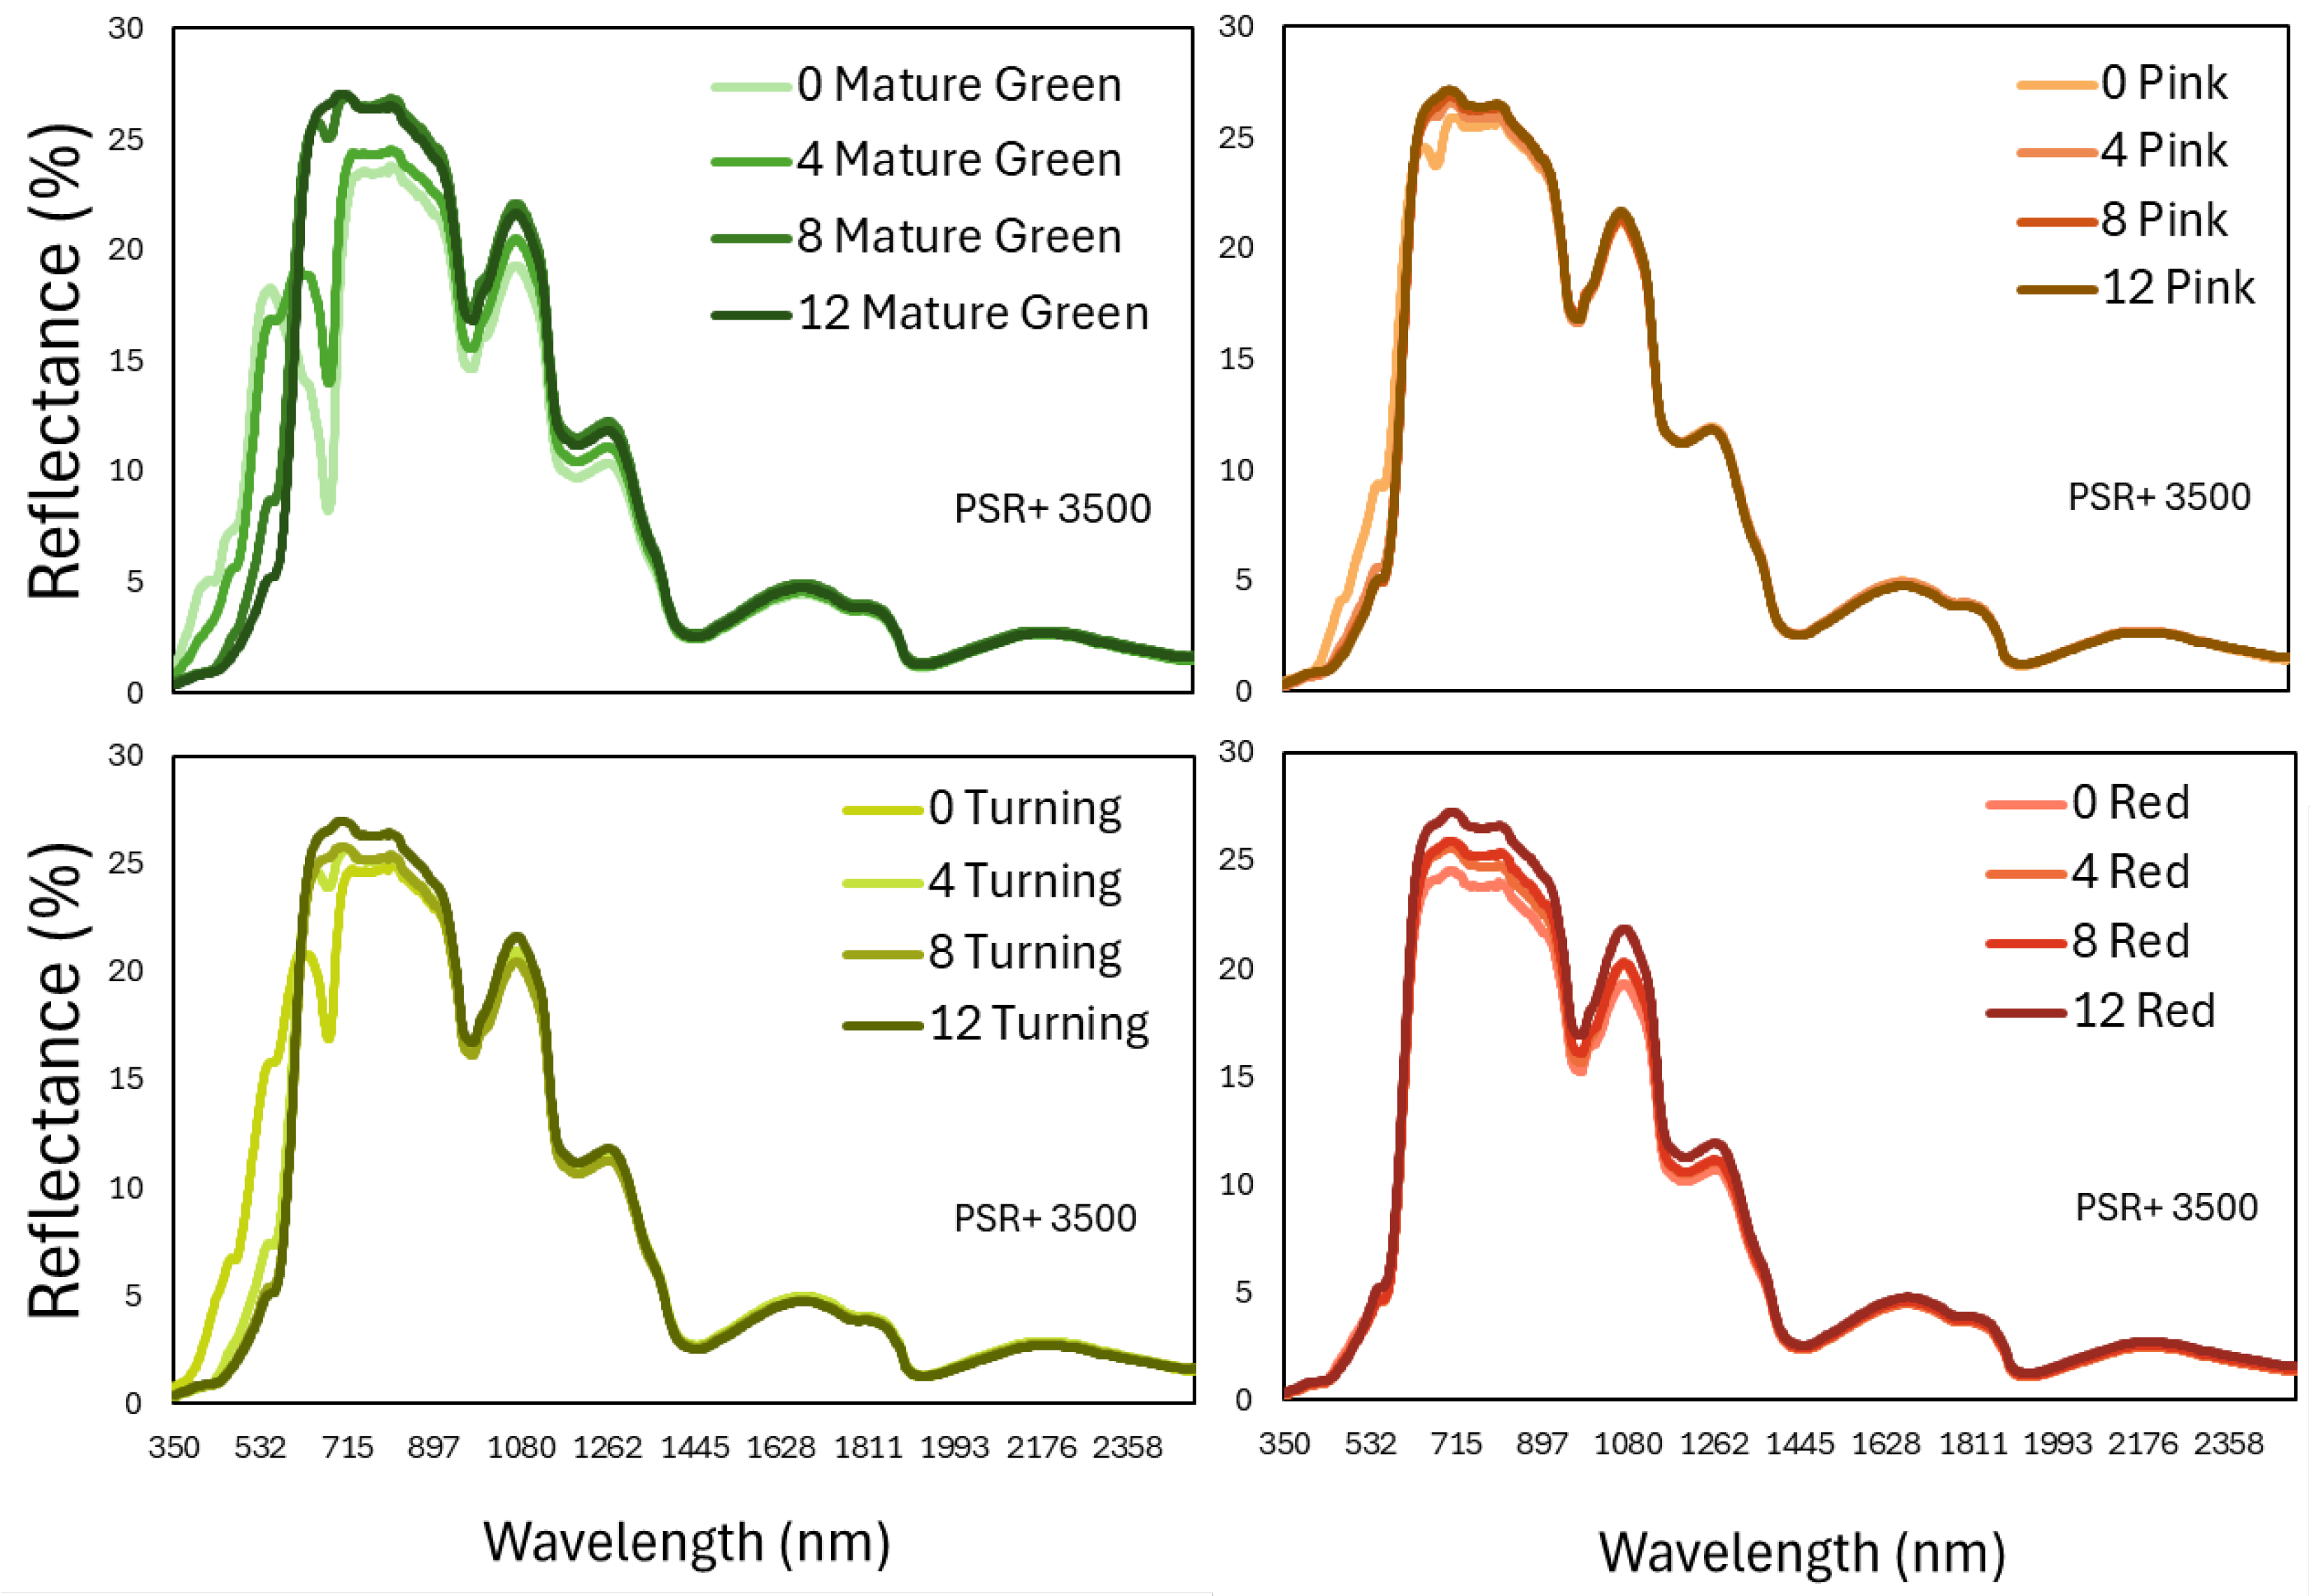
Figure 6.
The spectral reflectance that was measured with a portable spectroradiometer (PSR+ 3500) in the region 900-1700nm on tomato fruits that were harvested at 4 ripening stages and stored at shelf-life conditions for 12 days. Each line represents the mean of 80 fruits in each ripening stage and storage day.
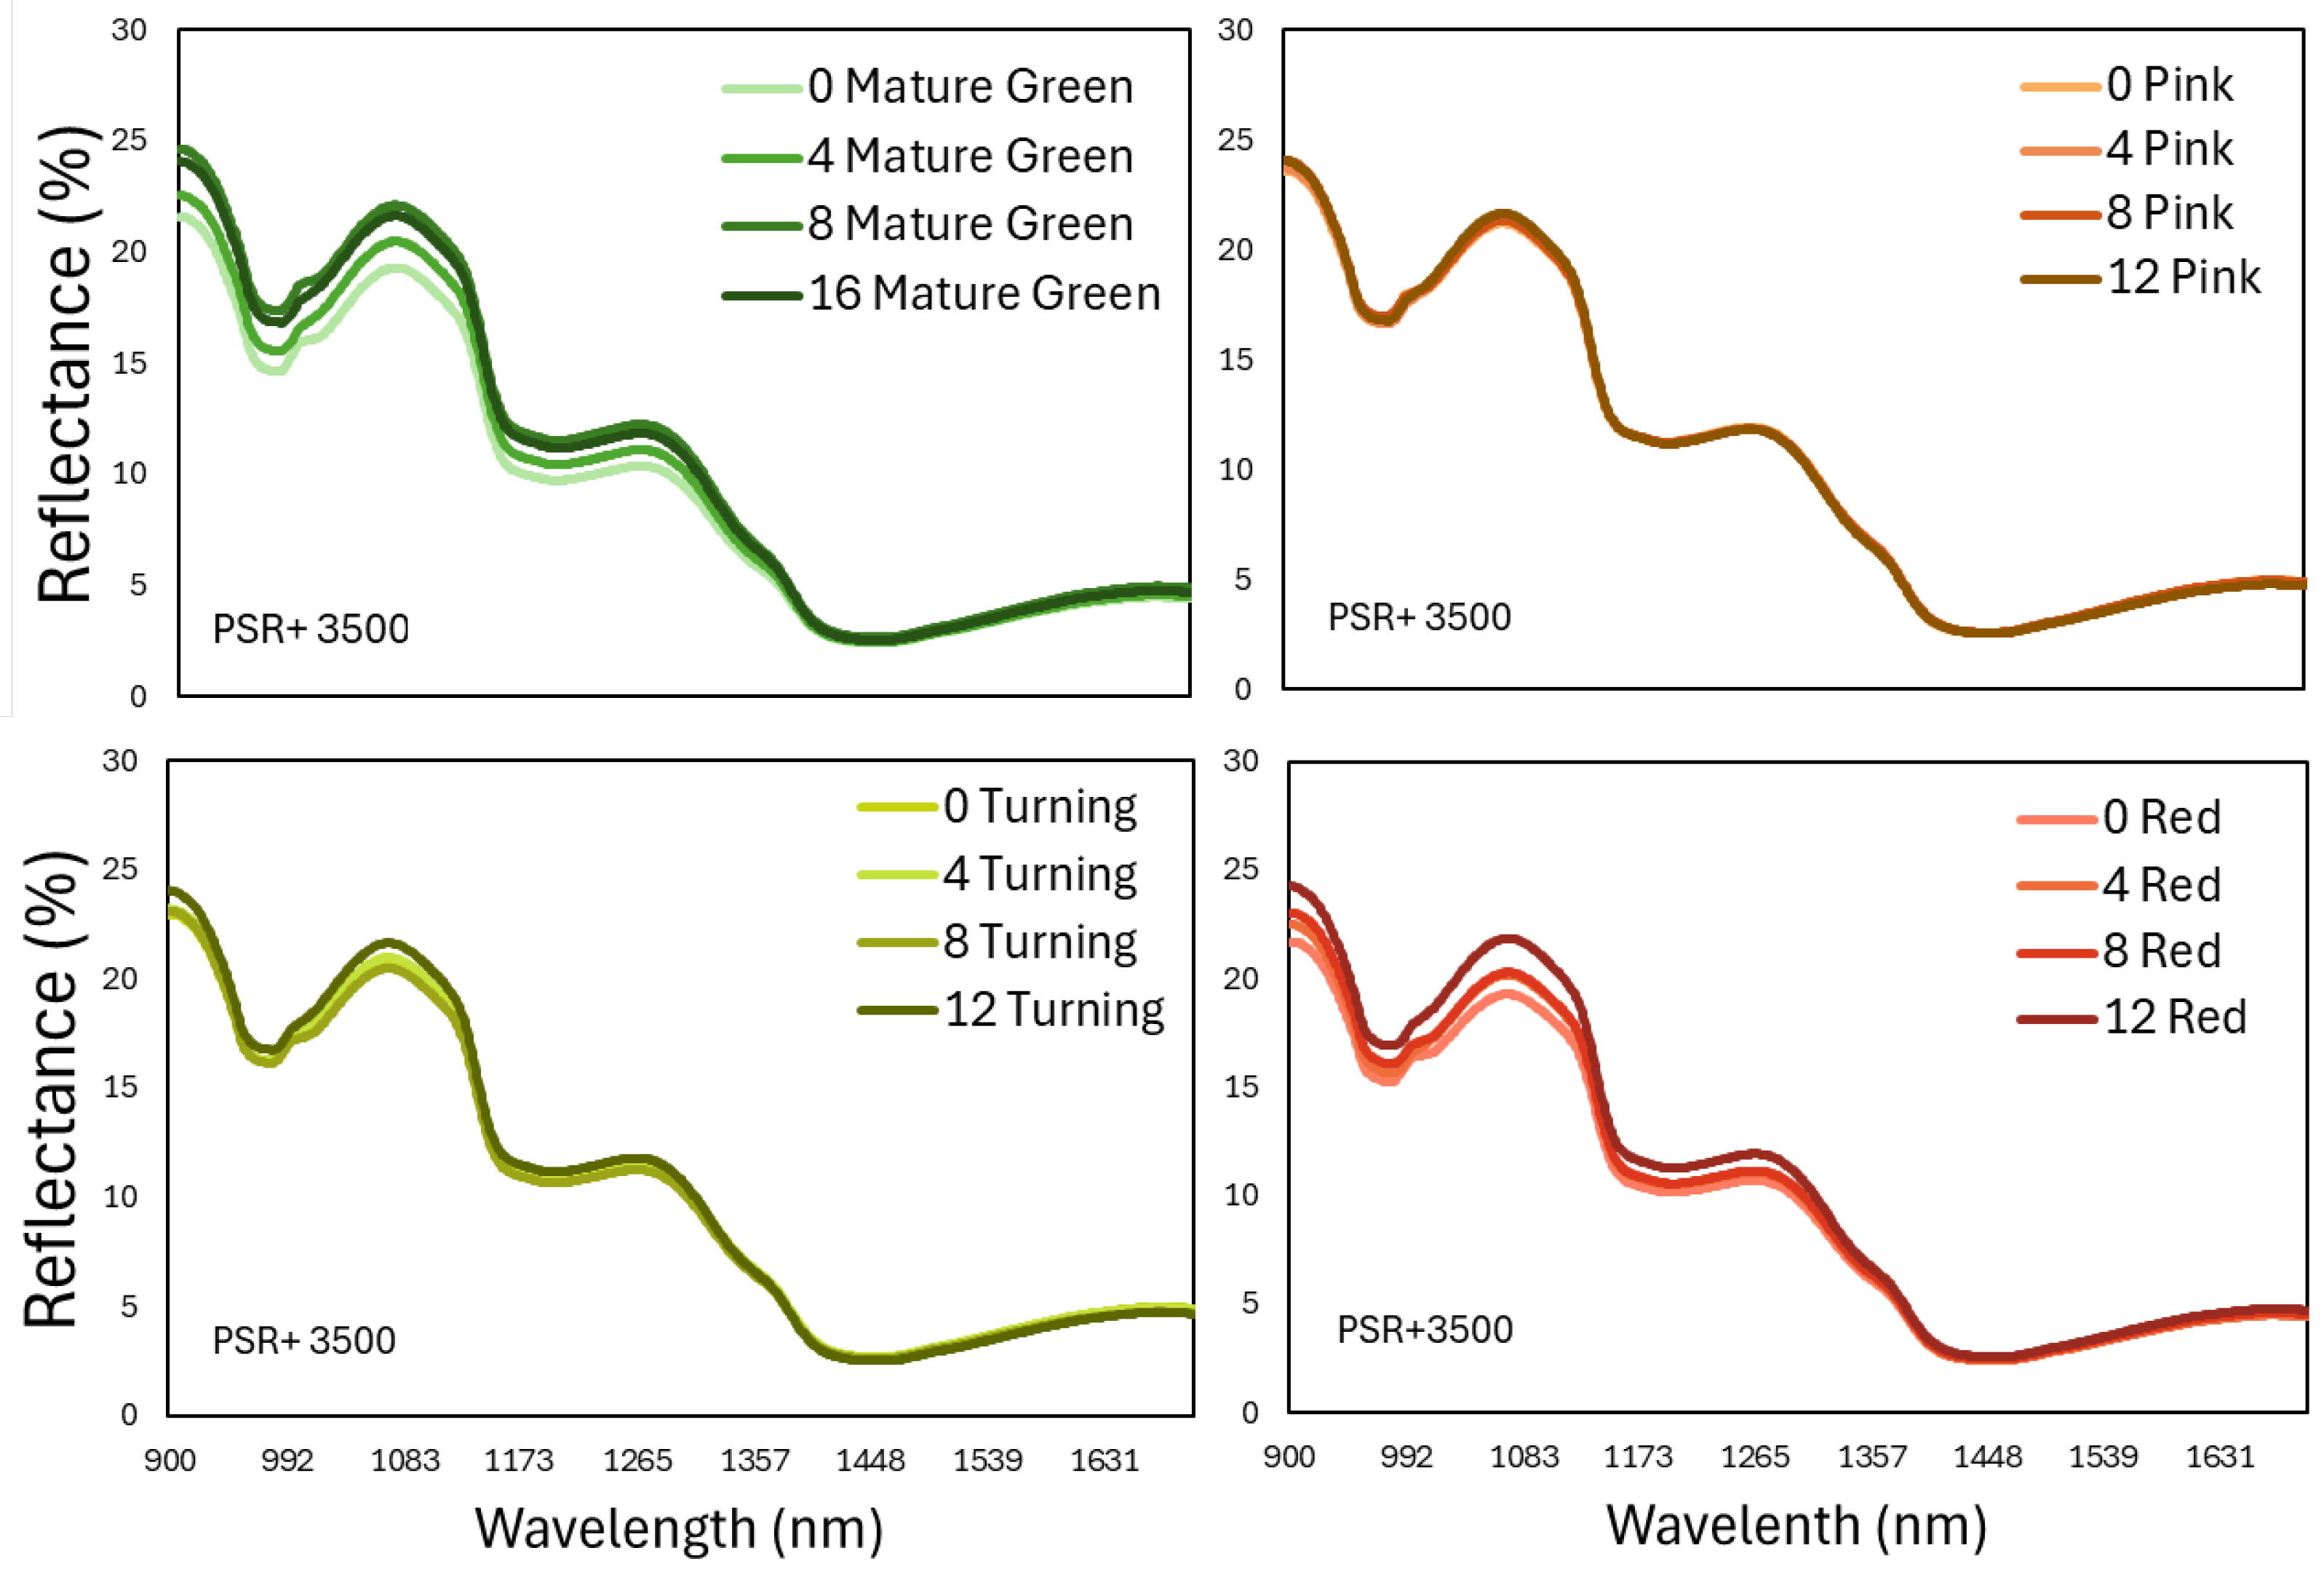
Figure 7.
The spectral reflectance that was measured with a portable spectroradiometer (DLP NIR Nano Scan) in the region 900-1700 nm on tomato fruits that were harvested at 4 ripening stages and stored at shelf-life conditions for 12 days. Each line represents the mean of 80 fruits in each ripening stage and storage day.
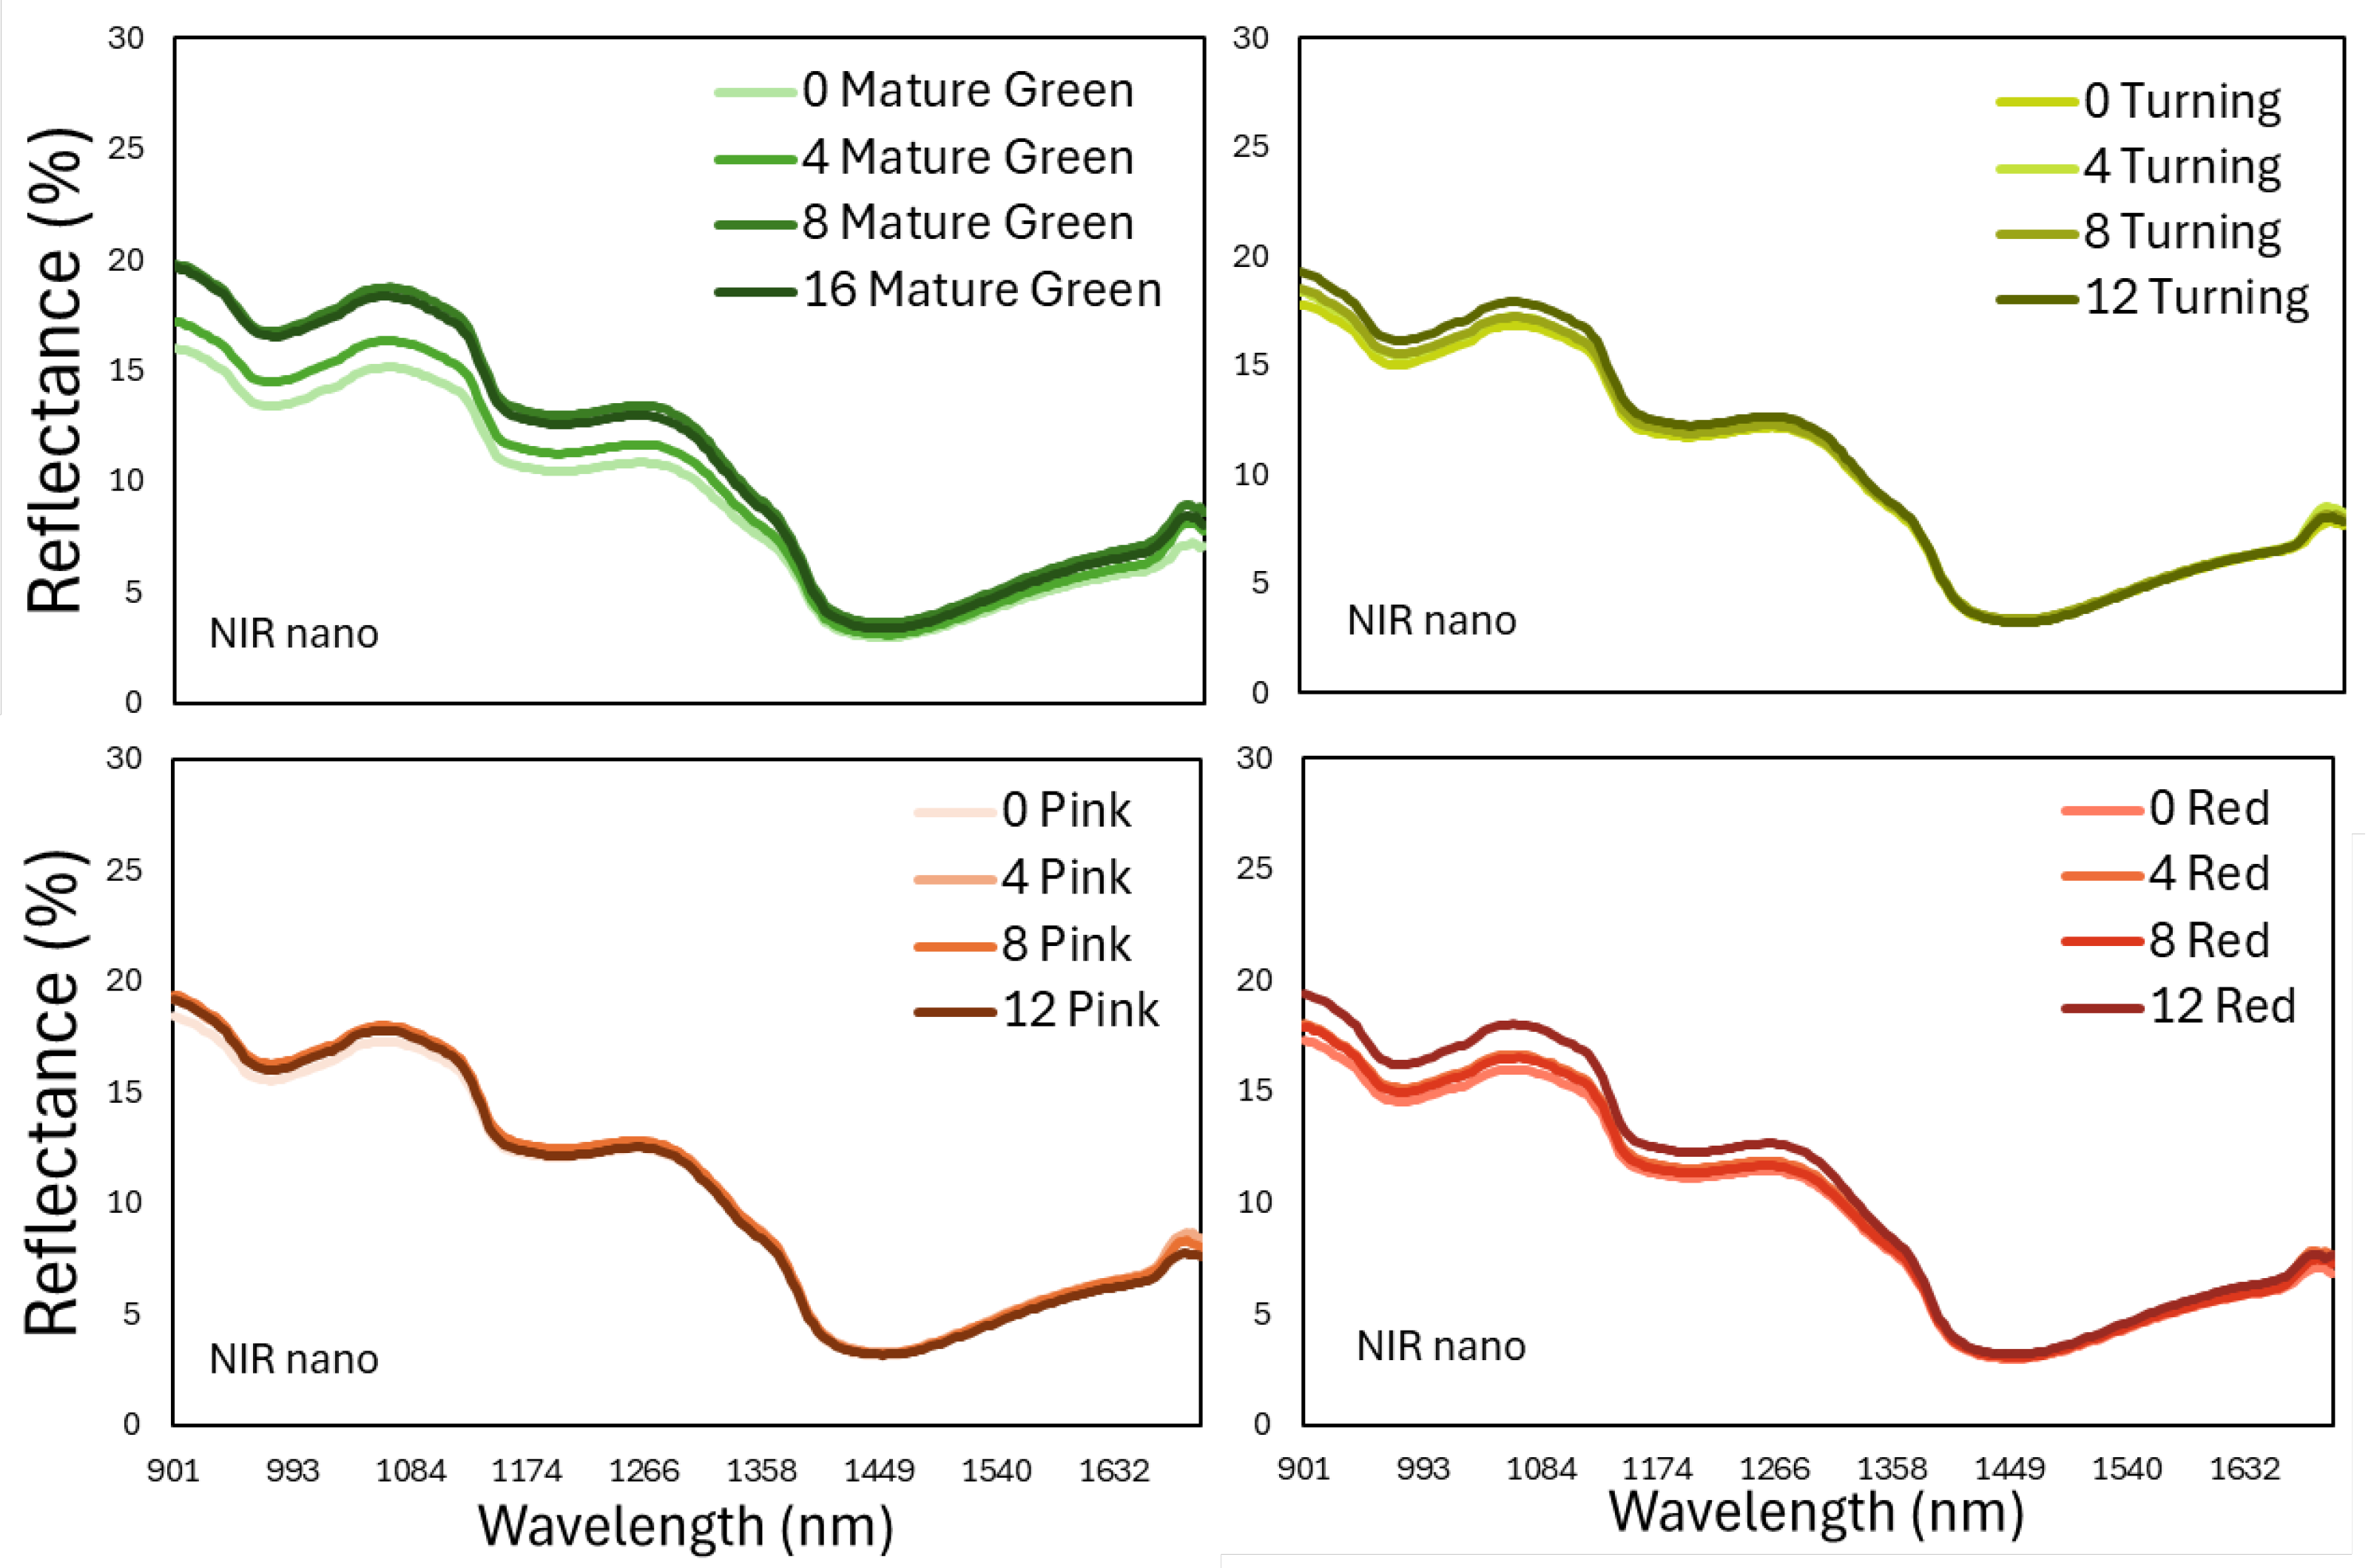

Table 1.
Analysis of variance, probability (P) and eta squared (η2), of color parameter ho, compression firmness, pH and soluble solids to titratable acidity ratio (SSC/TA) of tomato fruits harvested at the mature green, turning, pink and red ripe stage and stored for 0, 4, 8 or 12 days at 22 oC.
Table 1.
Analysis of variance, probability (P) and eta squared (η2), of color parameter ho, compression firmness, pH and soluble solids to titratable acidity ratio (SSC/TA) of tomato fruits harvested at the mature green, turning, pink and red ripe stage and stored for 0, 4, 8 or 12 days at 22 oC.
| Hue angle | Compression | ||||||||
| Source of Variation | DFx | SSy | P | η2 | SS | P | η2 | ||
| Shelf-Life (SL) | 3 | 29592.0 | ***z | 16 | 38.4 | *** | 10 | ||
| Ripening Stage (RS) | 3 | 36386.4 | *** | 20 | 113.3 | *** | 31 | ||
| SL ✕ RS | 9 | 22833.3 | *** | 12 | 13.1 | *** | 4 | ||
| pH | SSC/TA | ||||||||
| Source of Variation | DF | SS | P | η2 | SS | P | η2 | ||
| Shelf-Life (SL) | 3 | 1.592 | *** | 15 | 185.3 | *** | 14 | ||
| Ripening Stage (RS) | 3 | 2.751 | *** | 26 | 328.4 | *** | 25 | ||
| SL ✕ RS | 9 | 0.126 | *** | 1 | 25.5 | *** | 2 | ||
| x degrees of freedom | |||||||||
| y sum of squares | |||||||||
| z *** significant effect at P<0.001 | |||||||||
Table 2.
Regression coefficients of cross validated data as calculated using the random subset algorithm during principal component regression (PCR) and partial latent vector regression (PLSR) techniques between the storage period (in days) and spectral data that was measured with 2 portable spectroradiometers (PLSR3500+ and NIR Nano Scan) in the region 350-2500 nm and 900-1700 nm, respectively, on tomato fruits that were harvested at 4 ripening stages and stored at shelf-life conditions for 12 days.
| Shelf-Life period | |||||||||
| PCR with 5 principal components | MG | TUR | PINK | RED | |||||
| PSR+ 3500 | 340-2500 nm | 0.880 | 0.799 | 0.774 | 0.519 | ||||
| 900-1700 nm | 0.671 | 0.598 | 0.513 | 0.503 | |||||
| NIR Nano Scan | 900-1700 nm | 0.770 | 0.727 | 0.567 | 0.160 | ||||
| Shelf-Life period | |||||||||
| PLSR with 4 latent vectors | MG | TUR | PINK | RED | |||||
| PSR+ 3500 | 340-2500 nm | 0.939 | 0.852 | 0.782 | 0.647 | ||||
| 900-1700 nm | 0.850 | 0.791 | 0.734 | 0.575 | |||||
| NIR Nano Scan | 900-1700 nm | 0.803 | 0.707 | 0.578 | 0.456 | ||||
Table 3.
Regression coefficients of cross validated data as calculated using the random subset algorithm during partial least square regression (PLSR) technique between the pH and the ratio soluble solids content to titratable acidity (SSC/TA) and color (ho), firmness (compression), and spectral data that was measured with 2 portable spectroradiometers (PSR+ 3500 and NIR Nano Scan) in the region 350-2500 nm and 900-1700 nm, respectively, on tomato fruits that were harvested from mature green to red rip stage and stored at shelf-life conditions for 12 days.
| pH | SSC/TA | ||||
| Hueo | 0.739 | 0.716 | |||
| Compression | 0.840 | 0.799 | |||
| PSR+ 3500 | 340-2500 nm | 0.863 | 0.847 | ||
| 900-1700 nm | 0.771 | 0.790 | |||
| NIR Nano Scan | 900-1700 nm | 0.743 | 0.729 |
Disclaimer/Publisher’s Note: The statements, opinions and data contained in all publications are solely those of the individual author(s) and contributor(s) and not of MDPI and/or the editor(s). MDPI and/or the editor(s) disclaim responsibility for any injury to people or property resulting from any ideas, methods, instructions or products referred to in the content. |
© 2024 by the authors. Licensee MDPI, Basel, Switzerland. This article is an open access article distributed under the terms and conditions of the Creative Commons Attribution (CC BY) license (http://creativecommons.org/licenses/by/4.0/).
Copyright: This open access article is published under a Creative Commons CC BY 4.0 license, which permit the free download, distribution, and reuse, provided that the author and preprint are cited in any reuse.


