
Submitted:
24 April 2025
Posted:
24 April 2025
You are already at the latest version
Abstract
The objective of this study was to evaluate the feasibility of using visible, near-infrared and short-wave infrared (VIS/NIR/SWIR) spectroscopy coupled with chemometrics for non-destructive prediction of nutritional components in Galia-type melon fruit. A total of 175 fully ripened melons were analyzed for soluble solids content (SSC), dry matter (DM), pH, and titratable acidity (TA) using partial least squares regression (PLSR), principal components regression (PCR), and multilinear regression (MLR) models. Reflectance spectra were captured at three fruit locations (pedicel, equatorial, blossom end) in the 350–2500 nm range. PLSR models yielded the highest accuracy, particularly for SSC (R= 0.80) and SSC/TA (R= 0.79) using equatorial zone data. Genetic algorithm and variable importance in projection (VIP) analyses identified critical wavelengths around 680–720 nm and 900–1000 nm. The study demonstrates the potential of VIS/NIR/SWIR spectroscopy for rapid, non-destructive melon quality assessment, with implications for commercial postharvest management.
Keywords:
chemometrics
; PLS
; spectroscopy
; quality
; flavor
; non-destructive techniques
1. Introduction
The assessment of fruit quality is a critical objective within the agricultural sector, essential for ensuring consumer satisfaction, maintaining market competitiveness, and minimizing postharvest losses. Traditional methodologies employed for quality assessment have often been characterized by their destructive nature, time-consuming procedures, and unsuitability for rapid, large-scale analysis, thus presenting significant limitations in modern agricultural practices. In response to these challenges, visible-near infrared (VIS/NIR) spectroscopy has emerged as a promising non-destructive alternative, offering a more efficient and effective means of evaluating fruit quality across a broad spectrum of applications.
VIS/NIR spectroscopy provides a rapid and accurate method for determining fruit soluble solids content (SSC) without causing damage to the fruit, addressing a key parameter in quality assessment. This technique's effectiveness and applicability for large-scale detection make it particularly valuable in the fruit industry, contributing to enhanced consumer satisfaction and reduced waste. The application of spectral technology is increasingly important for non-destructive testing (NDT) of fruits [1], highlighting its growing role in ensuring fruit safety by assessing various attributes such as size, weight, and internal components, all without compromising the fruit's integrity.
Several studies have demonstrated the effectiveness of VIS/NIR spectroscopy for assessing various quality parameters in fruits. For instance, VIS/NIR spectroscopy has been used for non-destructive measurement of water content in fruits such as dragon fruit, guava, sapodilla, and banana [2] or for predicting sucrose content in healthy and Fusarium spp. infected potatoes [3], non-destructive assessment of tomato fruit firmness [4] and total phenolics and carotenoids in tomato fruits [5] among others. The advantages of VIS/NIR spectroscopy extend beyond its non-destructive nature, as it not only allows non-invasive measurement of chemical composition in intact citrus fruit [6] but has shown effectiveness in evaluating chemical quality in fruit products like juices and wine [7,8].
Although most of the spectroscopy studies use the VIS/NIR (400-1700 nm) part of the electromagnetic spectrum, there is evidence that capturing reflectance data at wavelengths beyond 1700 nm- in the short-wave infrared region (SWIR)- also plays a crucial role in improving the accuracy of non-destructive quality assessments in horticultural products. Despite being limited in number, these studies have demonstrated the value of including these longer wavelengths, as this spectral region contains key absorption features related to chemical bonds such as O-H, C-H, and N-H, which are associated with moisture, sugars, acids, and other internal quality attributes. In particular, Zhao et al. (2024) [9] and Zhang et al. (2024) [10] reported that extending the spectral range up to 2500 nm significantly enhanced the prediction of soluble solids content and firmness in fruits. Similarly, Chen et al. (2023) [11] and Liu et al. (2022) [12] showed that reflectance data beyond 1700 nm improved the discrimination of internal quality traits, reducing prediction errors, while Sun et al. (2021) [13] and Wang et al. (2009) [14] found that including the 1700–2500 nm range increased the R² values and reduced RMSE in models predicting moisture and sugar content in apricots and juices. Furthermore, studies by Li et al. (2012) [15] and Huang et al. (2025) [16] confirmed that the 1700–2500 nm range contributed critical spectral information for robust non-destructive evaluation of tropical fruits and mangoes. Collectively, these findings underline the importance of capturing reflectance data beyond 1700 nm for developing sensitive, reliable models in postharvest quality assessment.
There is a need for more fundamental research to understand the complex interaction between light and fruits, which is crucial for developing more accurate and robust detection models. This research should aim to enhance the accuracy and robustness of detection models for commercial applications, facilitating wider adoption and greater impact in the fruit industry [1].
The main objective of this study was to determine whether it is feasible to develop reliable models for assessing the internal composition of melon fruit, specifically dry matter, soluble solids, pH, and titratable acidity, by using VIS/NIR spectroscopy coupled with chemometric analyses. The study aims to contribute to the wider application of non-destructive testing techniques in the melon industry by addressing these challenges and advancing quality assessment methodologies.
2. Materials and Methods
Plant material
Galia type melon plants (cv. Espartan F1) were grown in an open field, at the farm of Aristotle University in Thessaloniki, following the usual production practices. One hundred and seventy-five fully ripened melon fruits, as assessed visually based on the uniform yellow color of the skin, were harvested by hand on the same day, were transferred to the laboratory within 15 min and were wiped with dry paper to remove dust and foreign particles from the surface. All fruit were subjected to nondestructive measurements and were immediately frozen for further nutritional composition determinations.
VIS/NIR Spectroscopy
A portable spectroradiometer (PSR+ 3500, Spectra Evolution, MA, USA) was used in order to capture the reflectance spectra of the skin in melon fruits. Three scans were acquired per fruit, one near the pedicel (P), one at the equatorial diameter (D) and one near the end blossom end (B) of each fruit (Figure 1). The internal sensor has a 4° field of view under controlled laboratory conditions capable of capturing the reflectance of fruit tissue at the 350-2500 nm region of the electromagnetic spectrum, from visible (VIS; 350-725 nm) to near infrared (NIR; 725-1700 nm) and short-wave infrared (SWIR; 1700-2500 nm). A white plate (spectralon diffuse reflectance standard) was used as the reference reflectance spectra, capturing almost 100% reflectance in the 350-2500 nm range.
Nutritional composition
The inner flesh of all the melon fruit were individually homogenized in a waring blender and the tissue was used to determine the nutritional composition.
Dry matter was determined after drying 50 g of homogenized tissue at 105 oC for 24 h. Total soluble solids were determined with the use of a portable electronic refractometer (PAC-1, Atago Co Ltd., Tokyo, Japan) in juice obtained after squeezing the homogenized sample.
The pH and the titratable acidity were determined in the filtered extract by adding 100 mL distilled water into 10 g of blended material. The extract was titrated to pH 8.2 with 0.1N NaOH, and the titratable acidity was expressed as percentage of citric acid.
Statistical analysis
Various regression models between spectra reflectance data and nutritional components were generated using several chemometric techniques, such as principal components regression (PCR), partial linear squares regression (PLSR) and multilinear regression (MLR) analyses. PCR and PLSR are advanced modern regression methods that in contrary to MLR are recommended for analysis of highly collinear data, as are the spectra reflectance ones. The principal components (PCs) of PCR model and the latent vectors (LVs) of PLSR are features of these two methods of high importance in the generation of the regression models. The number of PCs and LVs were selected based on the lowest root mean square cross validation error (RMSECV) using the ‘random subset’ method. The extracted PCs and LVs were later used as inputs in multiple linear regressions (MLR), in order to test the probability to assess the nutritional components’ content in the melon fruits. MLR is the linear modeling of the relationship between a dependent and more than one independent variable, as well as the simplest linear regression method. However, it often encounters multicollinearity issues among the variables and needs to be used with caution, in order to avoid model overfitting. Therefore, only models with variance inflation factor (VIF), an indicator of the severity of multicollinearity, values lower than 4 were selected in the present study. Data analyses were carried out using Microsoft Excel 2016, SPSS v. 25, MATLAB (Version R2017, The Math-works Inc., Natick, MA, USA) and PLS Toolbox 8.6 (Eigenvector Research Inc., Manson, WA, USA).
3. Results
The nutritional composition of the 175 melon fruits at harvest is presented in Figure 2. The average values were 8.75 °Brix for soluble solids content (SSC), 6.12 for pH, 1.17% for titratable acidity (TA), 7.01% for dry matter (DM), and 8.78 for the SSC/TA ratio. The standard error values were 0.18 for SSC, 0.05 for pH, 0.03% for TA, 0.14% for DM, and 0.34 for SSC/TA, indicating noticeable variability among the individual melon fruits, especially for the latter component.
Partial least squares regression (PLSR) analysis yielded promising results for predicting melon nutritional components based on reflectance spectra (Table 1). Table 1 presents the regression coefficients (Rcv) and root mean square errors of cross-validation (RMSECV) for SSC, pH, SSC/TA, and DM predictions using reflectance data captured at the pedicel, equatorial, and blossom end areas. Among the three fruit areas, the equatorial zone consistently provided the highest prediction performance for all parameters. Specifically, the highest R was achieved for pH prediction at the equatorial zone (R = 0.835, RMSECV = 0.35 °Brix), followed by SSC (R = 0.815, RMSECV = 1.35 oBrix). The prediction accuracy for SSC/TA ratio and DM pH was comparatively lower, with R values of 0.79 and 0.77, respectively. At the pedicel and blossom end areas, the predictive performance was generally lower for all parameters compared to the equatorial zone. In addition to overall predictive performance, the regression coefficients and root mean square errors for cross-validation (RMSECV) for each component in Table 2 further support the robustness of the PLSR models in the pooled datasets, where the regression coefficients exceeded the value of 0.800 (R= 0.820-0.831), significantly higher that the individual fruit locations or the other regression,methods (PCR and MLR on the specific wavelengths) (Table 2), also highlighting the advantage of combining multiple measurement areas.
Principal Component Regression (PCR) performance was slightly lower overall, as shown in Figure 3, which illustrates the prediction results for SSC, pH, SSC/TA, and DM using PCR models based on pooled reflectance data captured at the pedicel, equatorial, and blossom end areas. Predictions for SSC, SCC/TA and pH yielded R values of 0.81, 0.80 and 0.85, respectively, and slightly lower for dry matter (R= 0.78). According to Table 1, it turned out that the prediction of these components using the PCR model is not significantly different than the measurements on the individual areas on fruit.
When combining data measurements from all fruit areas into a pooled dataset (Figure 4), PLSR models consistently improved prediction accuracy for all components; SSC (R = 0.83, RMSECV = 1.30 °Brix), SSC/TA (R = 0.76, RMSECV= 2.62), pH (R = 0.85, RMSECV = 0.34) and dry matter (R = 0.83, RMSECV= 1.05%). Figure 3 displays these results graphically, highlighting the superior performance of PLSR in the pooled dataset compared to single-area models (Table 1), as well as to PCR model-based assessments (Figure 3).
Figure 5 presents the regression coefficients linking principal components (PCs) to specific wavelengths across the three fruit zones: pedicel, equatorial, and blossom end. These coefficients provide insight into how different spectral regions contribute to the prediction of each nutritional component in melon fruit. Each subplot highlights the spectral loadings corresponding to the most influential principal components retained in the PCR models. Distinct wavelength bands showed strong associations with individual components. For instance: for soluble solids content (SSC), the highest coefficient peaks were observed near 680–720 nm, 970–980 nm, and 1450–1500 nm, which correspond to absorption features related to pigments and water-soluble compounds. Dry matter (DM) was primarily influenced by the 900–1000 nm and 1900–1950 nm regions, indicative of complex carbohydrate and moisture content absorptions. Titratable acidity (TA) and pH exhibited less distinct but still meaningful associations, especially within the 1050–1150 nm and 1350–1450 nm bands, reflecting possible associations with organic acid content and related molecular structures.
The variation in regression coefficients across the three fruit areas underscores spatial heterogeneity within melon fruits. Notably, the equatorial zone consistently exhibited stronger and more coherent coefficient profiles, reinforcing earlier findings that this region offers the most stable predictive capacity for all measured traits.
Variable selection using genetic algorithm (GA) successfully identified spectral regions critical for each nutritional parameter. Figure 6, Figure 7 and Figure 8 display the specific wavelength regions selected by GA for SSC, pH, SSC/TA, and DM predictions at the pedicel, equatorial, and blossom end areas, respectively. At the pedicel area (Figure 6), key wavelengths for SSC were found around 670–700 nm and 1050–1100 nm, with important wavelengths for pH prediction located near 1450 nm, and for dry matter in the ranges 1900–1950 nm. At the equatorial zone (Figure 7), SSC prediction was most influenced by reflectance in the 680–720 nm and 900–1000 nm regions. Similar ranges were influential for dry matter and SSC/TA ratio predictions. At the blossom end (Figure 8), similar regions showed importance for SSC and DM, though overall predictive performance was slightly lower than the equatorial zone.
Variable importance in projection (VIP) analysis (Figure 9) confirmed that specific wavelengths between 680–720 nm, 900–1000 nm, 1400–1500 nm, and 1900–2000 nm were consistently critical in predicting SSC, DM, and SSC/TA ratio, with peaks approaching or exceeding the significance threshold. The highest VIP scores for SSC prediction were noted around 690 nm and 950 nm, while dry matter prediction was influenced most by wavelengths in the 1450 nm and 1950 nm ranges. The 1400–1500 nm region was particularly important for predicting pH and SSC/TA, likely due to its sensitivity to water and acid contents.
4. Discussion
The findings of this study confirm the high potential of VIS/NIR/SWIR spectroscopy combined with chemometric analysis for predicting internal quality attributes of melon fruit. The quality assessment of fruits is a critical aspect of postharvest management, influencing consumer satisfaction, market value, and agricultural sustainability. As noted above, while the traditional methods for evaluating fruit quality, such as refractometry, titratable acidity measurements, and destructive texture analysis, are often time-consuming, labor-intensive, and impractical for large-scale applications [9], the visible and near-infrared (VIS-NIR) spectroscopy has emerged in recent decades as a powerful non-destructive tool for rapid and accurate quality assessment across a wide range of fruits, including melons [2,17,18]. Unlike destructive methods, spectroscopy enables rapid, non-invasive measurements, making it ideal for high-throughput quality control in packinghouses and supply chains [19,20,21]. This technology leverages the interaction of light with organic molecules to predict internal quality attributes such as soluble solids content (SSC), firmness, acidity, moisture content and other components without damaging the produce [22,23].
The application of spectroscopy in fruit quality evaluation has been extensively studied, with notable success in species like apples [24,25], tomatoes [26,27], citrus [28,29], and stone fruits [30,31]. However, melons present unique challenges due to their thick rinds, internal structural variability, and the need for precise maturity assessment at harvest [32,33,34]. Despite these challenges, recent advancements in spectroscopic techniques and machine learning algorithms have demonstrated the feasibility of using spectroscopy for melon quality assessment with high accuracy [16,35,36]. In our study, the PLSR models demonstrated excellent predictive ability for soluble solids content and dry matter, especially when using reflectance data from the equatorial zone. This is consistent with previous research on other fruits, where equatorial measurements often offer the most representative spectral information due to reduced rind interference and uniform tissue structure [37].
VIS/NIR/SWIR spectroscopy operates on the principle that different chemical bonds in organic molecules absorb and scatter light at specific wavelengths, producing spectral signatures that correlate with fruit composition [38]. The 680–720 nm range corresponds to chlorophyll absorption, while the 900–1000 nm region is associated with water and sugar absorptions, explaining their strong influence on SSC and dry matter prediction [39]. The identification of critical wavelength regions through both genetic algorithm and VIP scores analyses aligned with reported studies in fruits such as apples, peaches, and citrus [28,30,31]. Several studies have demonstrated the effectiveness of spectroscopy in predicting key melon quality parameters. For instance, Sun et al., (2017) [34] utilized hyperspectral imaging (400–1000 nm) to assess SSC and titratable acidity in Hami melons, achieving robust predictive accuracy (R² > 0.90) using partial least squares (PLS) regression. Similarly, Bureau et al. (2009) [30] and Camps & Christen (2009) [31] applied portable NIR spectroscopy to evaluate apricot fruit quality, highlighting the potential for similar applications in melons. The non-destructive nature of these techniques allows for repeated measurements on the same fruit, facilitating dynamic quality monitoring during storage and ripening [37].
Despite its advantages, the application of VIS/NIR/SWIR spectroscopy for melon quality assessment faces several challenges. These challenges include issues related to data acquisition, model performance, and the influence of external and internal interferences that can affect the accuracy and reliability of measurements [1]. Biological variability, environmental influences, differences between cultivars, growing conditions, and postharvest handling [33], can limit model generalizability. Probably the major limitation in melons is the thick rind of certain melon varieties (e.g., watermelon, cantaloupe), which can impede light penetration and reduce the accuracy of internal quality predictions [32,40]. The latter authors investigated dielectric spectroscopy for melon quality sensing but found that surface measurements provided limited correlation with internal sweetness, emphasizing the need for deeper-penetrating optical techniques. However, traditional calibration models developed for one melon variety may not generalize well to others, necessitating cultivar-specific adjustments [41]. Additionally, environmental factors such as temperature fluctuations and sample moisture content can influence spectral readings, requiring robust preprocessing techniques to enhance model stability [42,43].
To address these challenges, researchers have explored advanced chemometric and machine learning approaches to improve the robustness of VIS/NIR models. Partial least squares regression (PLSR) remains the most widely used algorithm due to its ability to handle multicollinearity in spectral da [6,44]. The superior performance of PLSR over PCR and MLR models in our study reflects its capacity to handle collinearity and capture latent relationships within spectral data. According to our findings, PLSR models yielded the highest accuracy, particularly for SSC (R= 0.80) and pH (R= 0.83) when using equatorial zone data, further supporting the effectiveness of this method. Additionally, combining measurements from multiple fruit areas into pooled datasets improved model accuracy, reinforcing the value of multi-point sampling for fruits with internal heterogeneity [35]. Indeed, our results confirmed that combining data from all fruit areas into a pooled dataset improved prediction accuracy for all components, with PLSR models consistently outperforming single-area models.
Newer techniques such as support vector machines (SVM), artificial neural networks (ANN), and convolutional neural networks (CNN) have shown promise in enhancing prediction accuracy, particularly for complex datasets [45]. For example, Minas et al. (2021) [46] developed non-destructive tools for peach quality assessment using VIS/NIR spectroscopy combined with machine learning, achieving high accuracy for dry matter content (R² = 0.92) and SSC (R² = 0.88). Similarly, Yang et al. (2024) [47] proposed a knowledge-guided convolutional neural network (KGCNN) to reduce predictive uncertainty in fruit quality assessment, demonstrating superior performance compared to traditional PLS models. These advancements suggest that hybrid modeling approaches—combining spectral data with environmental and agronomic variables—could further improve melon quality prediction [36].
Furthermore, it is also important that these non-destructive methods are embedded with devices that combine prediction accuracy and ease of use. In that sense, the development of portable NIR spectrometers and hyperspectral imaging systems has expanded the potential for real-time, on-field quality assessment. Portable devices, such as those tested by Lamptey et al., 2023 [19] and Kusumiyati et al. (2020) [48], allow for rapid in-situ measurements of SSC and acidity in fruits, reducing reliance on laboratory-based analyses. Hyperspectral imaging, which captures both spatial and spectral information, has been particularly effective in detecting internal defects and maturity gradients in fruits like tomatoes and apple [4,49,50].
The integration of VIS/NIR spectroscopy into commercial fruit supply chains is still evolving, with several barriers to widespread adoption. Cost remains a limiting factor, as these high-end hyperspectral systems and portable NIR devices can be expensive for small-scale producers [51] However, the decreasing cost of spectroscopic hardware and the development of open-source machine learning tools are making technology more accessible [52] future research should focus on i) multi-sensor fusion that will combine VIS-NIR spectroscopy with other non-destructive techniques (e.g., acoustic resonance, X-ray imaging) to improve prediction robustness [53] ii) real-time processing to enhance computational efficiency for inline sorting systems in packinghouses [17] and iii) on the development of standardized protocols that will integrate universal calibration models which account for varietal differences and environmental effects [54].
5. Conclusions
This study underscores the value of VIS/NIR/SWIR spectroscopy combined with advanced chemometric modeling for rapid, non-destructive quality assessment of melons, particularly for SSC and dry matter, where PLSR analyses consistently outperformed PCR and MLR in all cases. In addition, the equatorial region of the fruit was proven to be the most reliable measurement point for quality assessment, although combining measurements from multiple fruit areas enhanced prediction performance, particularly for SSC and dry matter. At last, the 680–720 nm and 900–1000 nm ranges were repeatedly identified as key wavelengths for melon quality prediction, and indeed specific wavelength ranges determined by the genetic algorithm and VIP analysis align with known absorption features associated with sugars, water, and organic acids.
VIS-NIR spectroscopy represents a transformative tool for non-destructive melon quality assessment, offering rapid, accurate, and scalable solutions for the horticultural industry. While challenges related to light penetration, biological variability, and model generalizability persist, advancements in machine learning, portable devices, and hyperspectral imaging are paving the way for broader adoption. As demand for high-quality, sustainably produced fruits grows, VIS-NIR spectroscopy will play an increasingly vital role in optimizing postharvest management and reducing food waste.
Author Contributions
Conceptualization, D.S.K. and P.T.; methodology, D.S.K. and P.I.T.; software, D.S.K. and P.I.T.; formal analysis, P.T. and A.S.S.; data curation, D.S.K. and P.T.; writing—original draft preparation, D.S.K. and P.I.T.; writing—review and editing, A.S.S.; supervision, P.T.; project administration, P.T. and A.S.S. All authors have read and agreed to the published version of the manuscript.
Funding
This research received no external funding.
Data Availability Statement
The raw data supporting the conclusions of this article will be made available by the authors on request.
Acknowledgments
During the preparation of this manuscript, the authors used SciSPace for summarizing information from the collected literature. The authors have reviewed and edited the output and take full responsibility for the content of this publication.
Conflicts of Interest
The authors declare no conflicts of interest.
Abbreviations
The following abbreviations are used in this manuscript:
| PLSR | Partial least squares regression |
| VIS/NIR | Visible-near infrared |
| SWIR | Short wave infrared |
| PCR | Principal components regression |
| MLR | Multilinear regression |
| LV | Latent vectors |
| GA | Genetic algorithm |
| VIP | Variable importance in projection |
| VIF | Variable inflation factor |
| SSC | Soluble solids content |
| TA | Titratable acidity |
| DM | Dry matter |
| Rcv | Regression coefficient of cross-validation |
| PMSECV | Root mean squares error in cross-validation |
References
- Wang, Q.; Lu, J.; Wang, Y.; Gao, J. Research on Nondestructive Inspection of Fruits Based on Spectroscopy Techniques: Experimental Scenarios, ROI, Number of Samples, and Number of Features. Agriculture (Switzerland) 2024, 14. [Google Scholar] [CrossRef]
- Amanah, H.Z.; Pratiwi, E.Z.D.; Rahmi, D.N.; Pahlawan, M.F.R.; Masithoh, R.E. Non-Destructive Determination of Water Content in Fruits Using Vis-NIR Spectroscopy. Food Res 2024, 8, 9–14. [Google Scholar] [CrossRef]
- Prasetyo, E.W.; Amanah, H.Z.; Farras, I.; Pahlawan, M.F.R.; Masithoh, R.E. Partial Least Square Regression for Nondestructive Determination of Sucrose Content of Healthy and Fusarium Spp. Infected Potato (Solanum Tuberosum L.) Utilizing Visible and Near-Infrared Spectroscopy. Int J Adv Sci Eng Inf Technol 2024, 14, 1001–1009. [Google Scholar] [CrossRef]
- Kumar, R.; Paul, V.; Pandey, R.; Sahoo, R.N.; Gupta, V.K. Reflectance Based Non-Destructive Determination of Colour and Ripeness of Tomato Fruits. Physiology and Molecular Biology of Plants 2022, 28, 275–288. [Google Scholar] [CrossRef]
- Kumar, R.; Paul, V.; Pandey, R.; Sahoo, R.N.; Gupta, V.K. Reflectance-Based Non-Destructive Assessment of Total Carotenoids in Tomato Fruits. Plant Physiology Reports 2023, 28, 152–160. [Google Scholar] [CrossRef]
- Anderson, N.T.; Walsh, K.B. Review: The Evolution of Chemometrics Coupled with near Infrared Spectroscopy for Fruit Quality Evaluation. J Near Infrared Spectrosc 2022, 30, 3–17. [Google Scholar] [CrossRef]
- Chaarmart, K.; Narongwongwattana, S.; Rittiron, R.; Sa-Ngiamvibool, W. Evaluation of Chemical Quality on Juices and Wine Produced from Mamao Fruit (Antidesma Puncticulatum Miq.) within near-Infrared Spectroscopy. Instrumentation Mesure Metrologie 2021, 20, 255–260. [Google Scholar] [CrossRef]
- Gehlken, J.; Nikfardjam, M.P.; Kleb, M.; Zörb, C. Near-Infrared Spectroscopy in Process Control and Quality Management of Fruits and Wine. Journal of Applied Botany and Food Quality 2021, 94, 26–38. [Google Scholar] [CrossRef]
- Zhao, Y.; Zhou, L.; Wang, W.; Zhang, X.; Gu, Q.; Zhu, Y.; Chen, R.; Zhang, C. Visible/near-Infrared Spectroscopy and Hyperspectral Imaging Facilitate the Rapid Determination of Soluble Solids Content in Fruits. Food Engineering Reviews 2024, 16, 470–496. [Google Scholar] [CrossRef]
- Zhang, L.; Zhang, M.; Mujumdar, A.S.; Wu, C.; Wang, D. Advanced Model Predictive Control Strategies for Nondestructive Monitoring Quality of Fruit and Vegetables during Supply Chain Processes. Comput Electron Agric 2024, 225. [Google Scholar] [CrossRef]
- Lan, W.; Ge, Y.; Ma, H.; Chen, S.; Tu, K.; Pan, L. Principies, Théories and Applications of near-Infrared Spectroscopy for Food Quality and Safety Control; 2023; ISBN 9798886979688.
- Tao, M.; Fang, H.; Feng, X.; He, Y.; Liu, X.; Shi, Y.; Wei, Y.; Hong, Z. Rapid Trace Detection of Pesticide Residues on Tomato by Surface-Enhanced Raman Spectroscopy and Flexible Tapes. J Food Qual 2022, 2022. [Google Scholar] [CrossRef]
- Lu, Y.; Li, X.; Li, W.; Shen, T.; He, Z.; Zhang, M.; Zhang, H.; Sun, Y.; Liu, F. Detection of Chlorpyrifos and Carbendazim Residues in the Cabbage Using Visible/near-Infrared Spectroscopy Combined with Chemometrics. Spectrochim Acta A Mol Biomol Spectrosc 2021, 257. [Google Scholar] [CrossRef] [PubMed]
- Wang, H.; Peng, J.; Xie, C.; Bao, Y.; He, Y. Fruit Quality Evaluation Using Spectroscopy Technology: A Review. Sensors (Switzerland) 2015, 15, 11889–11927. [Google Scholar] [CrossRef] [PubMed]
- Li, Y.; Sun, Y.; Peng, Y.; Dhakal, S.; Chao, K.; Liu, Q. Rapid Detection of Pesticide Residue in Apple Based on Raman Spectroscopy. In Proceedings of the Sensing for Agriculture and Food Quality and Safety IV; SPIE, May 1 2012; Vol. 8369; p. 83690. [Google Scholar]
- Huang, Z.; Saito, Y.; Gao, T.; Al Riza, D.F.; Lu, R.; Cen, H.; Kondo, N.; Omwange, K.A. A Review of Fluorescence Imaging System Supported by Excitation-Emission Matrix for Fruit and Vegetable Quality Estimation. Food Control 2025, 169. [Google Scholar] [CrossRef]
- Jiang, W.; Goncalves, J.; Kostakos, V. Mobile Near-Infrared Sensing - A Systematic Review on Devices, Data, Modeling, and Applications. ACM Comput Surv 2024, 56. [Google Scholar] [CrossRef]
- Patel, K.K.; Pathare, P.B. Principle and Applications of Near-Infrared Imaging for Fruit Quality Assessment—An Overview. Int J Food Sci Technol 2024, 59, 3436–3450. [Google Scholar] [CrossRef]
- Lamptey, F.P.; Teye, E.; Abano, E.E.; Amuah, C.L.Y. Application of Handheld NIR Spectrometer for Simultaneous Identification and Quantification of Quality Parameters in Intact Mango Fruits. Smart Agricultural Technology 2023, 6. [Google Scholar] [CrossRef]
- Munawar, A.A.; Hayati, R.; Fachruddin, F. Rapid Determination of Inner Quality Parameters of Intact Mango Fruits Using Portable near Infrared Spectroscopy. In Proceedings of the IOP Conference Series: Earth and Environmental Science; 2021; Vol. 711. [Google Scholar]
- Kusumiyati, *!!! REPLACE !!!*; Munawar, A.A.; Suhandy, D. Kusumiyati; Munawar, A.A.; Suhandy, D. Fast and Contactless Assessment of Intact Mango Fruit Quality Attributes Using near Infrared Spectroscopy (NIRS). In Proceedings of the IOP Conference Series: Earth and Environmental Science; 2021; Vol. 644.
- Li, L.; Hu, D.-Y.; Tang, T.-Y.; Tang, Y.-L. Non-Destructive Detection of the Quality Attributes of Fruits by Visible-near Infrared Spectroscopy. Journal of Food Measurement and Characterization 2023, 17, 1526–1534. [Google Scholar] [CrossRef]
- Minas, I.S.; Anthony, B.M.; Pieper, J.R.; Sterle, D.G. Large-Scale and Accurate Non-Destructive Visual to near Infrared Spectroscopy-Based Assessment of the Effect of Rootstock on Peach Fruit Internal Quality. European Journal of Agronomy 2023, 143. [Google Scholar] [CrossRef]
- Walsh, K.B.; Blasco, J.; Zude-Sasse, M.; Sun, X. Visible-NIR ‘Point’ Spectroscopy in Postharvest Fruit and Vegetable Assessment: The Science behind Three Decades of Commercial Use. Postharvest Biol Technol 2020, 168. [Google Scholar] [CrossRef]
- Nicolaï, B.M.; Beullens, K.; Bobelyn, E.; Peirs, A.; Saeys, W.; Theron, K.I.; Lammertyn, J. Nondestructive Measurement of Fruit and Vegetable Quality by Means of NIR Spectroscopy: A Review. Postharvest Biol Technol 2007, 46, 99–118. [Google Scholar] [CrossRef]
- Alenazi, M.M.; Shafiq, M.; Alsadon, A.A.; Alhelal, I.M.; Alhamdan, A.M.; Solieman, T.H.I.; Ibrahim, A.A.; Shady, M.R.; Saad, M.A.O. Non-Destructive Assessment of Flesh Firmness and Dietary Antioxidants of Greenhouse-Grown Tomato (Solanum Lycopersicum L.) at Different Fruit Maturity Stages. Saudi J Biol Sci 2020, 27, 2839–2846. [Google Scholar] [CrossRef]
- Goisser, S.; Wittmann, S.; Fernandes, M.; Mempel, H.; Ulrichs, C. Comparison of Colorimeter and Different Portable Food-Scanners for Non-Destructive Prediction of Lycopene Content in Tomato Fruit. Postharvest Biol Technol 2020, 167. [Google Scholar] [CrossRef]
- Magwaza, L.S.; Opara, U.L.; Nieuwoudt, H.; Cronje, P.J.R.; Saeys, W.; Nicolaï, B. NIR Spectroscopy Applications for Internal and External Quality Analysis of Citrus Fruit-A Review. Food Bioproc Tech 2012, 5, 425–444. [Google Scholar] [CrossRef]
- Cattaneo, T.M.P.; Stellari, A. Review: NIR Spectroscopy as a Suitable Tool for the Investigation of the Horticultural Field. Agronomy 2019, 9. [Google Scholar] [CrossRef]
- Bureau, S.; Ruiz, D.; Reich, M.; Gouble, B.; Bertrand, D.; Audergon, J.-M.; Renard, C.M.G.C. Rapid and Non-Destructive Analysis of Apricot Fruit Quality Using FT-near-Infrared Spectroscopy. Food Chem 2009, 113, 1323–1328. [Google Scholar] [CrossRef]
- Camps, C.; Christen, D. Non-Destructive Assessment of Apricot Fruit Quality by Portable Visible-near Infrared Spectroscopy. LWT 2009, 42, 1125–1131. [Google Scholar] [CrossRef]
- Nelson, S.O.; Sc, D.; Trabelsi, S.; Electronics Engineer, P.D.; House Louisville, G. Examination of Dielectric Spectroscopy Data for Correlations with Melon Quality Written for Presentation at the 2011 ASABE Annual International Meeting Sponsored by ASABE.
- Sun, T.; Huang, K.; Xu, H.; Ying, Y. Research Advances in Nondestructive Determination of Internal Quality in Watermelon/Melon: A Review. J Food Eng 2010, 100, 569–577. [Google Scholar] [CrossRef]
- Sun, J.; Ma, B.; Dong, J.; Zhu, R.; Zhang, R.; Jiang, W. Detection of Internal Qualities of Hami Melons Using Hyperspectral Imaging Technology Based on Variable Selection Algorithms. J Food Process Eng 2017, 40. [Google Scholar] [CrossRef]
- Fass, E.; Shlomi, E.; Ziv, C.; Glikman, O.; Helman, D. Machine Learning Models Based on Hyperspectral Imaging for Pre-Harvest Tomato Fruit Quality Monitoring. Comput Electron Agric 2025, 229. [Google Scholar] [CrossRef]
- Gu, Q.; Li, T.; Hu, Z.; Zhu, Y.; Shi, J.; Zhang, L.; Zhang, X. Quantitative Analysis of Watermelon Fruit Skin Phenotypic Traits via Image Processing and Their Potential in Maturity and Quality Detection. Comput Electron Agric 2025, 230. [Google Scholar] [CrossRef]
- Minas, I.S.; Blanco-Cipollone, F.; Sterle, D. Accurate Non-Destructive Prediction of Peach Fruit Internal Quality and Physiological Maturity with a Single Scan Using near Infrared Spectroscopy. Food Chem 2021, 335. [Google Scholar] [CrossRef] [PubMed]
- Chandrasekaran, I.; Panigrahi, S.S.; Ravikanth, L.; Singh, C.B. Potential of Near-Infrared (NIR) Spectroscopy and Hyperspectral Imaging for Quality and Safety Assessment of Fruits: An Overview. Food Anal Methods 2019, 12, 2438–2458. [Google Scholar] [CrossRef]
- Si, W.; Xiong, J.; Huang, Y.; Jiang, X.; Hu, D. Quality Assessment of Fruits and Vegetables Based on Spatially Resolved Spectroscopy: A Review. Foods 2022, 11. [Google Scholar] [CrossRef]
- Nelson, S.O.; Trabelsi, S.; Kays, S.J. DIELECTRIC SPECTROSCOPY OF MELONS FOR POTENTIAL QUALITY SENSING. Trans ASABE 51, 2214. [Google Scholar]
- Camps, C.; Christen, D. Non-Destructive Assessment of Apricot Fruit Quality by Portable Visible-near Infrared Spectroscopy. LWT 2009, 42, 1125–1131. [Google Scholar] [CrossRef]
- Mishra, P.; Rutledge, D.N.; Roger, J.-M.; Wali, K.; Khan, H.A. Chemometric Pre-Processing Can Negatively Affect the Performance of near-Infrared Spectroscopy Models for Fruit Quality Prediction. Talanta 2021, 229. [Google Scholar] [CrossRef]
- Hemrattrakun, P.; Nakano, K.; Boonyakiat, D.; Ohashi, S.; Maniwara, P.; Theanjumpol, P.; Seehanam, P. Comparison of Reflectance and Interactance Modes of Visible and Near-Infrared Spectroscopy for Predicting Persimmon Fruit Quality. Food Anal Methods 2021, 14, 117–126. [Google Scholar] [CrossRef]
- Walsh, J.; Neupane, A.; Koirala, A.; Li, M.; Anderson, N. Review: The Evolution of Chemometrics Coupled with near Infrared Spectroscopy for Fruit Quality Evaluation. II. The Rise of Convolutional Neural Networks. J Near Infrared Spectrosc 2023, 31, 109–125. [Google Scholar] [CrossRef]
- Xu, Y.; Luo, J.; Xue, S.; Jin, Q.; Zhu, J.; Lu, S.; Meng, Q.; Du, H.; Fu, M.; Zhong, Y. Development of Comprehensive Prediction Models for Pumpkin Fruit Sensory Quality Using Physicochemical Analysis, near-Infrared Spectroscopy, and Machine Learning. Journal of Food Composition and Analysis 2024, 134. [Google Scholar] [CrossRef]
- Minas, I.S.; Blanco-Cipollone, F.; Sterle, D. Accurate Non-Destructive Prediction of Peach Fruit Internal Quality and Physiological Maturity with a Single Scan Using near Infrared Spectroscopy. Food Chem 2021, 335. [Google Scholar] [CrossRef]
- Yang, J.; Sun, Z.; Tian, S.; Jiang, H.; Feng, J.; Ting, K.C.; Lin, T.; Ying, Y. Enhancing Spectroscopy-Based Fruit Quality Control: A Knowledge-Guided Machine Learning Approach to Reduce Model Uncertainty. Postharvest Biol Technol 2024, 216. [Google Scholar] [CrossRef]
- Kusumiyati, *!!! REPLACE !!!*; Hamdani, J.S.; Sutari, W.; Mubarok, S.; Kurniasari, I. Kusumiyati; Hamdani, J.S.; Sutari, W.; Mubarok, S.; Kurniasari, I. Non-Destructive Detection of Two Cucumber Cultivars Fruit Quality Using NIR Spectroscopy. In Proceedings of the IOP Conference Series: Earth and Environmental Science; 2020; Vol. 583.
- Shao, Y.; Shi, Y.; Qin, Y.; Xuan, G.; Li, J.; Li, Q.; Yang, F.; Hu, Z. A New Quantitative Index for the Assessment of Tomato Quality Using Vis-NIR Hyperspectral Imaging. Food Chem 2022, 386. [Google Scholar] [CrossRef] [PubMed]
- Kumar, R.; Paul, V.; Pandey, R.; Sahoo, R.N.; Gupta, V.K. Reflectance-Based Non-Destructive Assessment of Total Carotenoids in Tomato Fruits. Plant Physiology Reports 2023, 28, 152–160. [Google Scholar] [CrossRef]
- Gehlken, J.; Nikfardjam, M.P.; Kleb, M.; Zörb, C. Near-Infrared Spectroscopy in Process Control and Quality Management of Fruits and Wine. Journal of Applied Botany and Food Quality 2021, 94, 26–38. [Google Scholar] [CrossRef]
- Li, L.; Hu, D.Y.; Tang, T.Y.; Tang, Y.L. Non-Destructive Detection of the Quality Attributes of Fruits by Visible-near Infrared Spectroscopy. Journal of Food Measurement and Characterization 2023, 17, 1526–1534. [Google Scholar] [CrossRef]
- Sarkar, M.; Assaad, M.; Gupta, N. Phase Based Time Resolved Reflectance Spectroscopy Using Time-of-Flight Camera for Fruit Quality Monitoring. In Proceedings of the 2020 IEEE Sensors Applications Symposium, SAS 2020 - Proceedings; 2020. [Google Scholar]
- Magwaza, L.S.; Opara, U.L.; Nieuwoudt, H.; Cronje, P.J.R.; Saeys, W.; Nicolaï, B. NIR Spectroscopy Applications for Internal and External Quality Analysis of Citrus Fruit-A Review. Food Bioproc Tech 2012, 5, 425–444. [Google Scholar] [CrossRef]
Figure 1.
The locations on the melon fruit that spectral reflectance was measured using the portable PSR+ 3500 spectroradiometer.
Figure 1.
The locations on the melon fruit that spectral reflectance was measured using the portable PSR+ 3500 spectroradiometer.
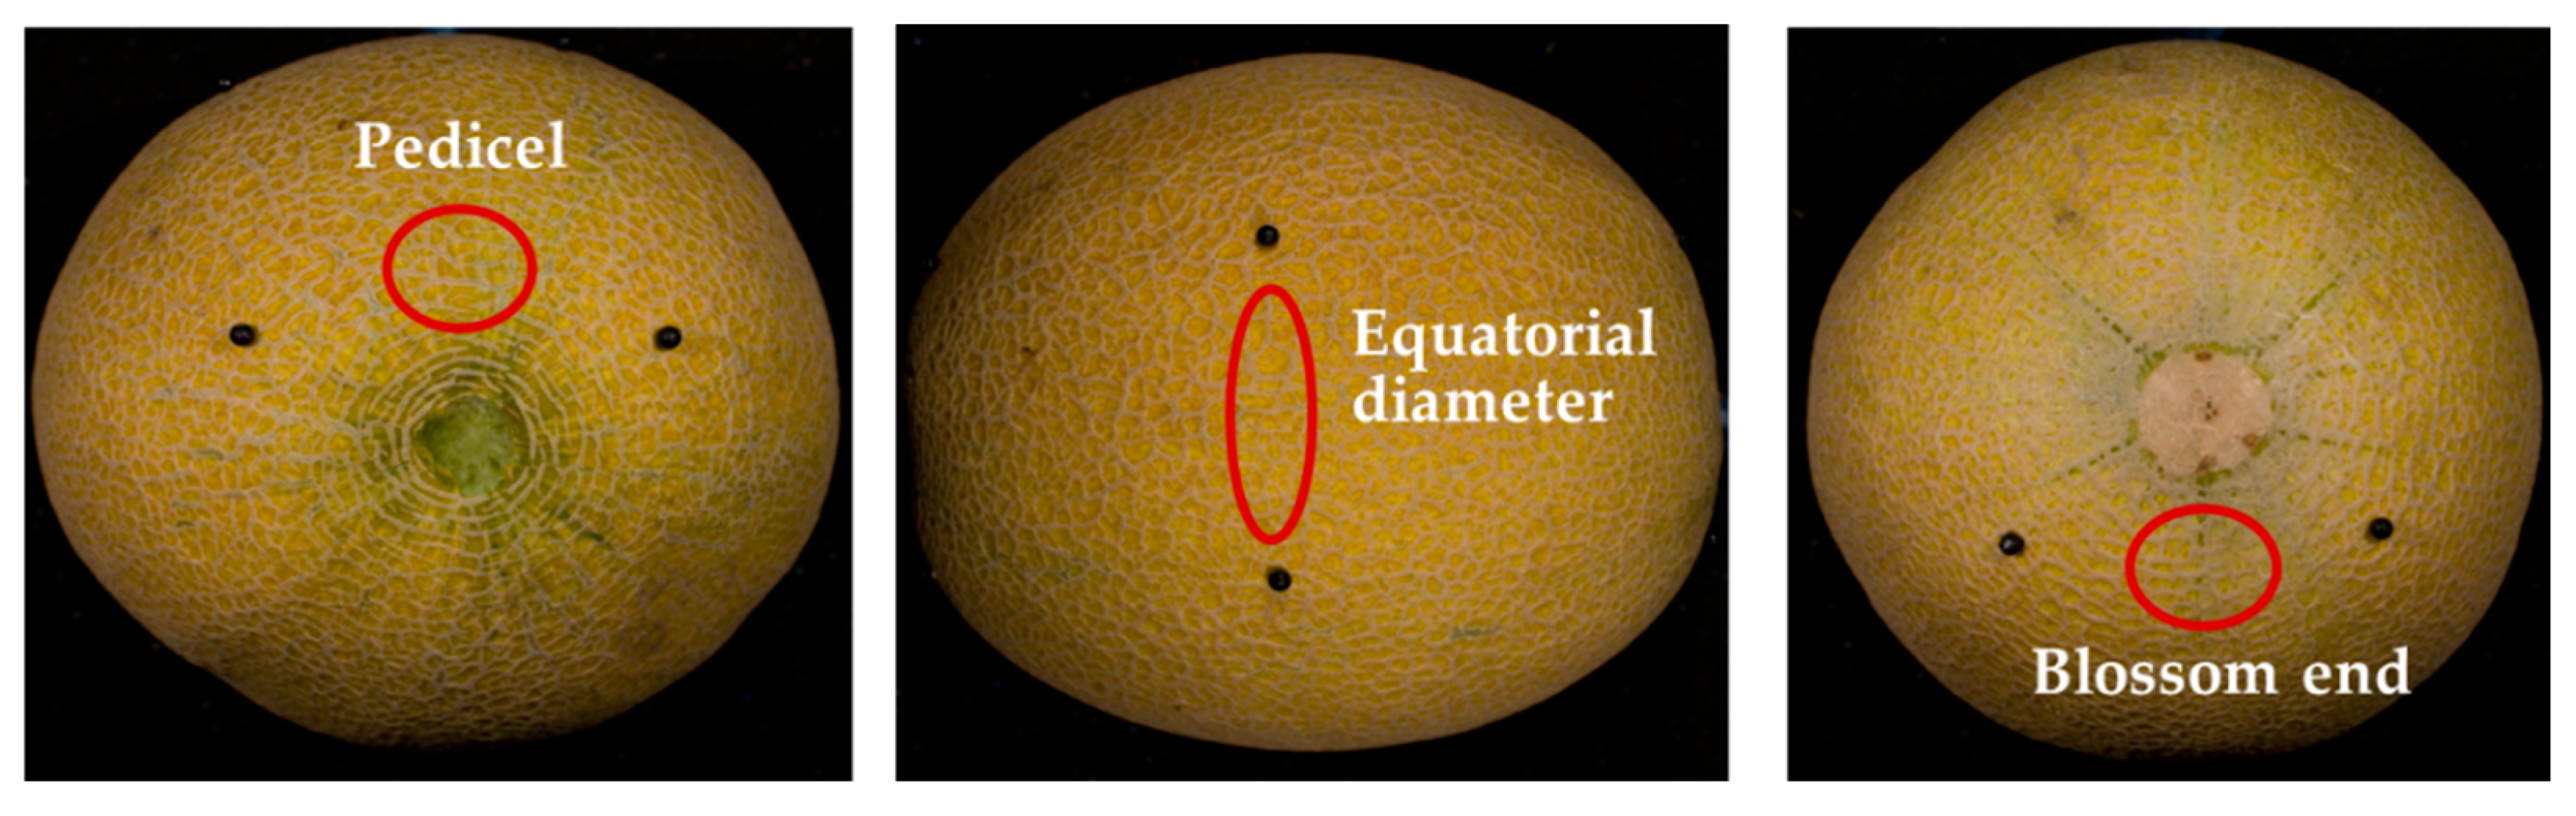
Figure 2.
The average (X), the median (horizontal line in the box) and maximum and minimum values of soluble solids content (SSC), pH, the ratio SSC to titratable acidity (SSC/TA), dry matter (DM) and titratable acidity (TA) of 175 melon fruit that were harvested at the ripe stage.
Figure 2.
The average (X), the median (horizontal line in the box) and maximum and minimum values of soluble solids content (SSC), pH, the ratio SSC to titratable acidity (SSC/TA), dry matter (DM) and titratable acidity (TA) of 175 melon fruit that were harvested at the ripe stage.
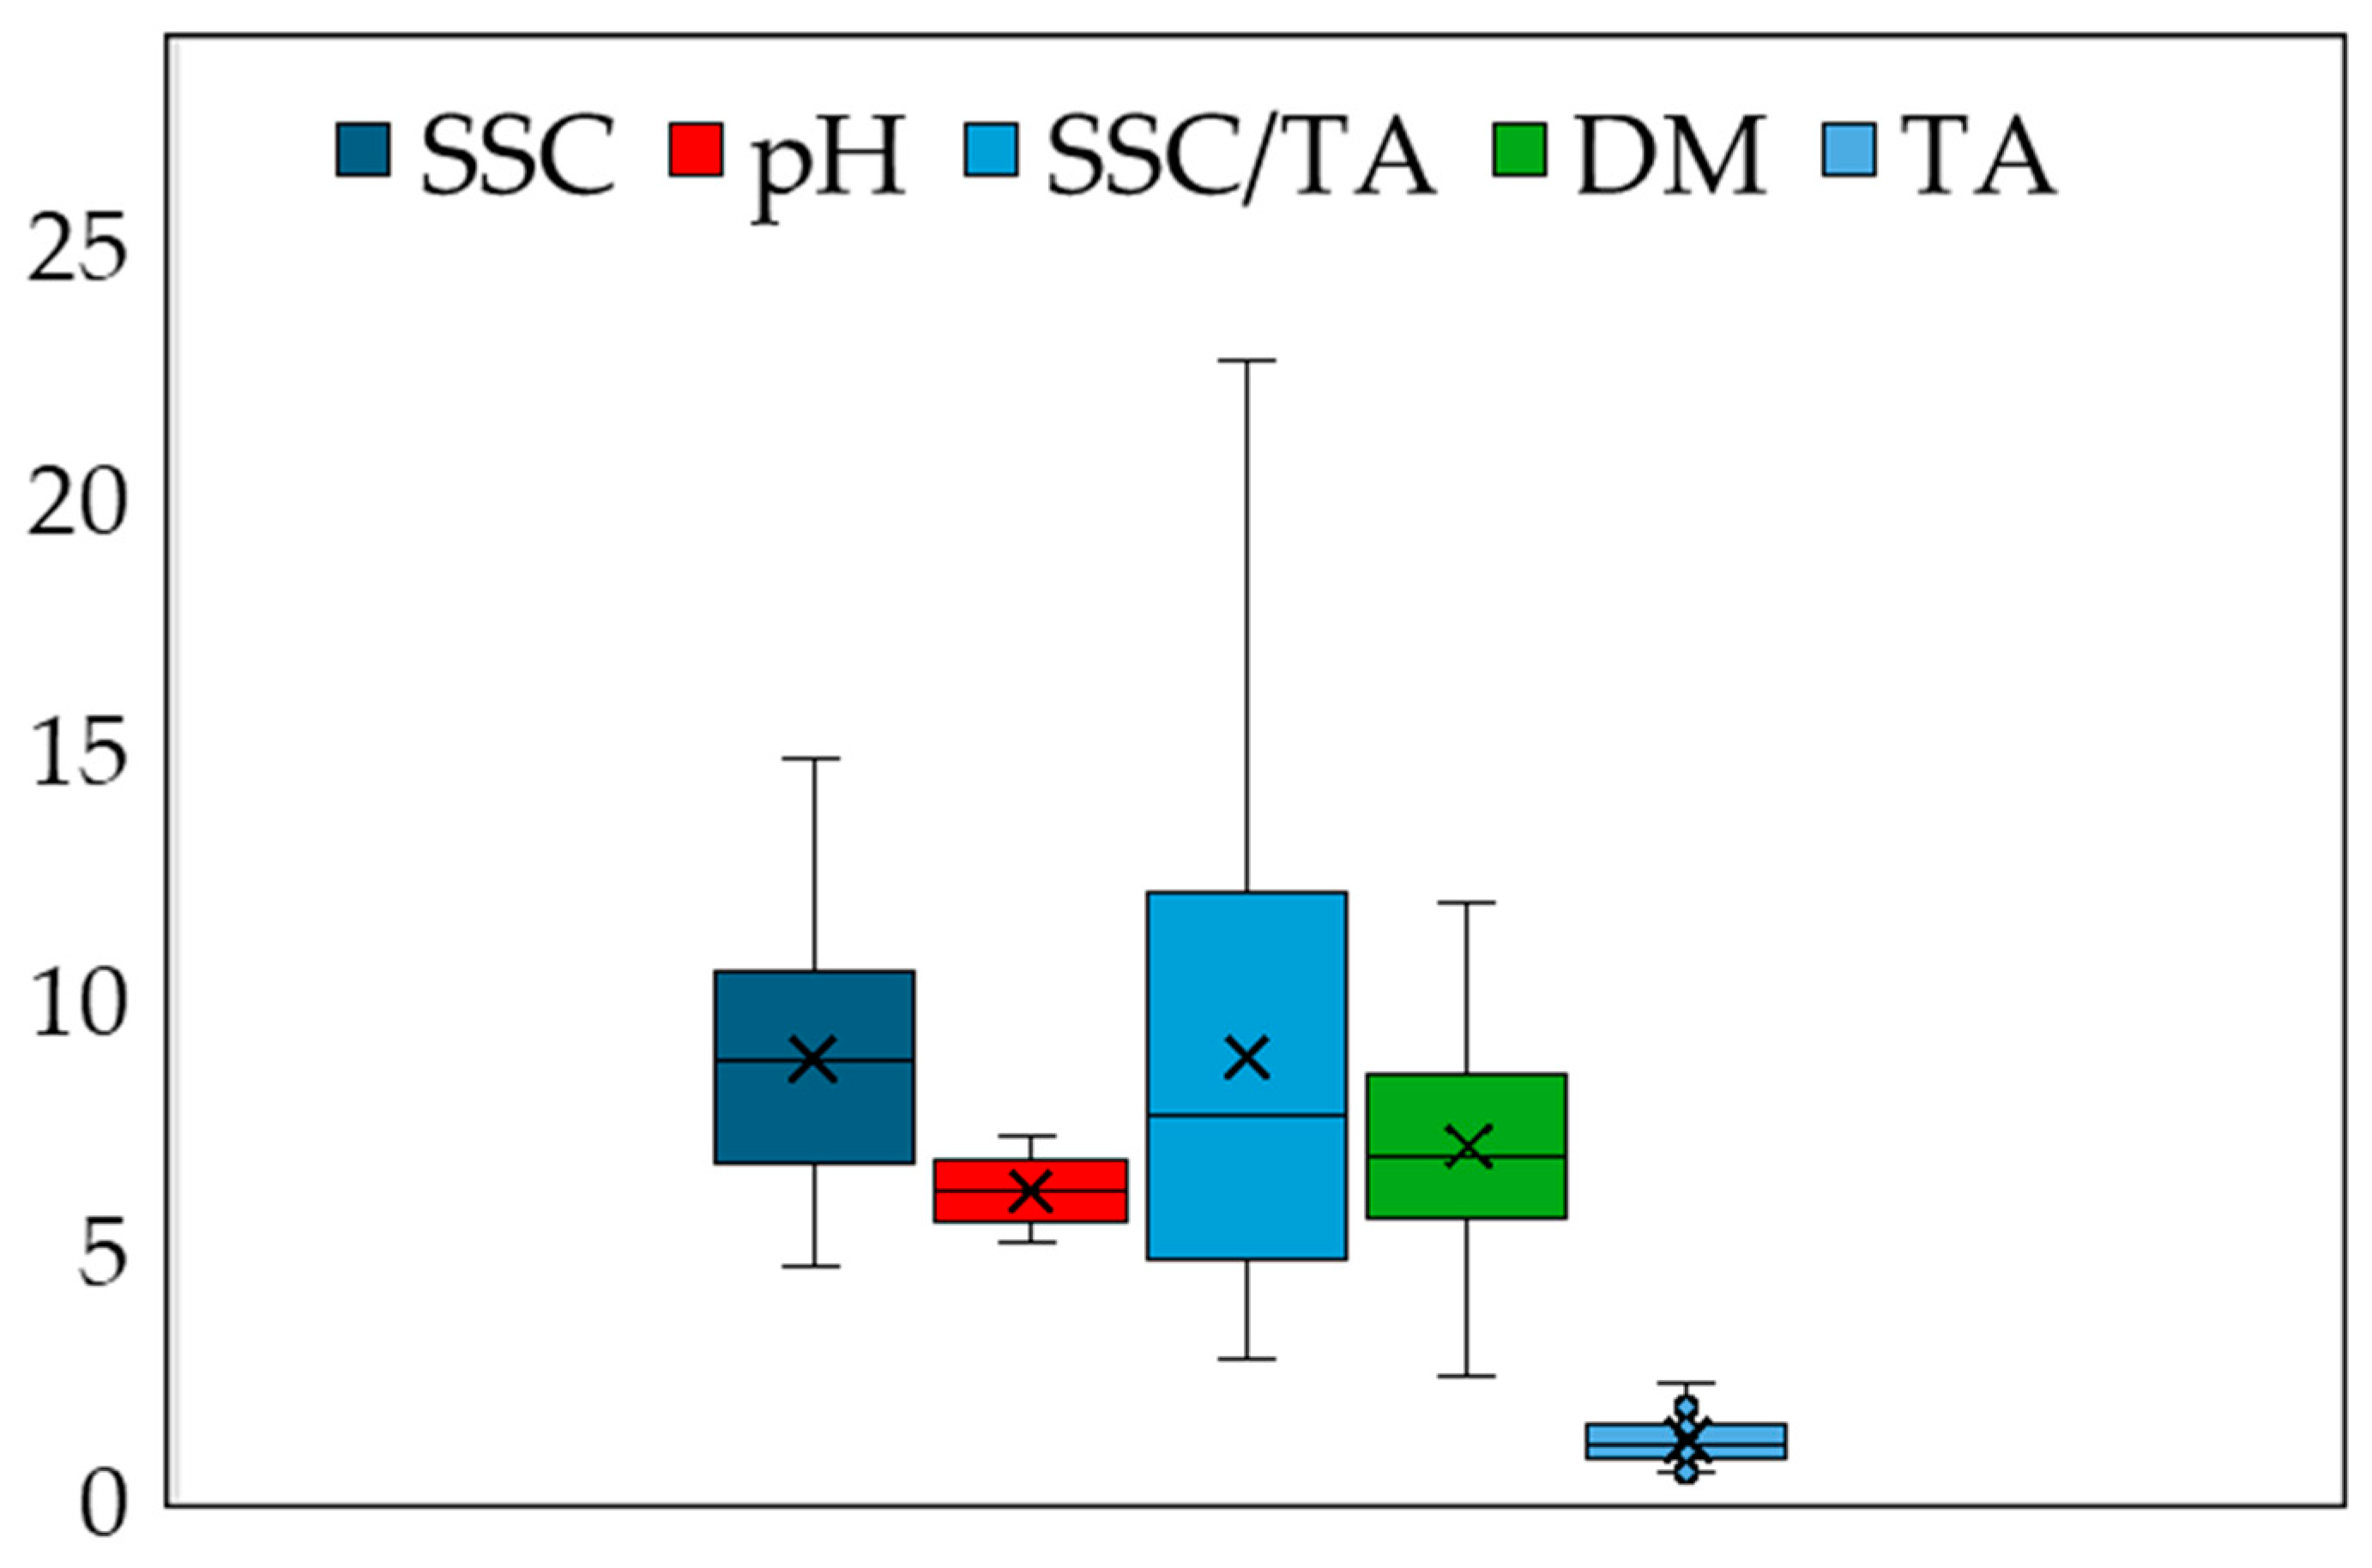
Figure 3.
Prediction of soluble solids content (SSC), pH, the ratio SSC to titratable acidity (SSC/TA) and dry matter (DM) based on principal component (PC) regression analyses of reflectance data captured initially at the pedicel, equatorial zone and blossom end area of 175 melon fruit at 350-2500 nm and later being integrated into a pooled data set.
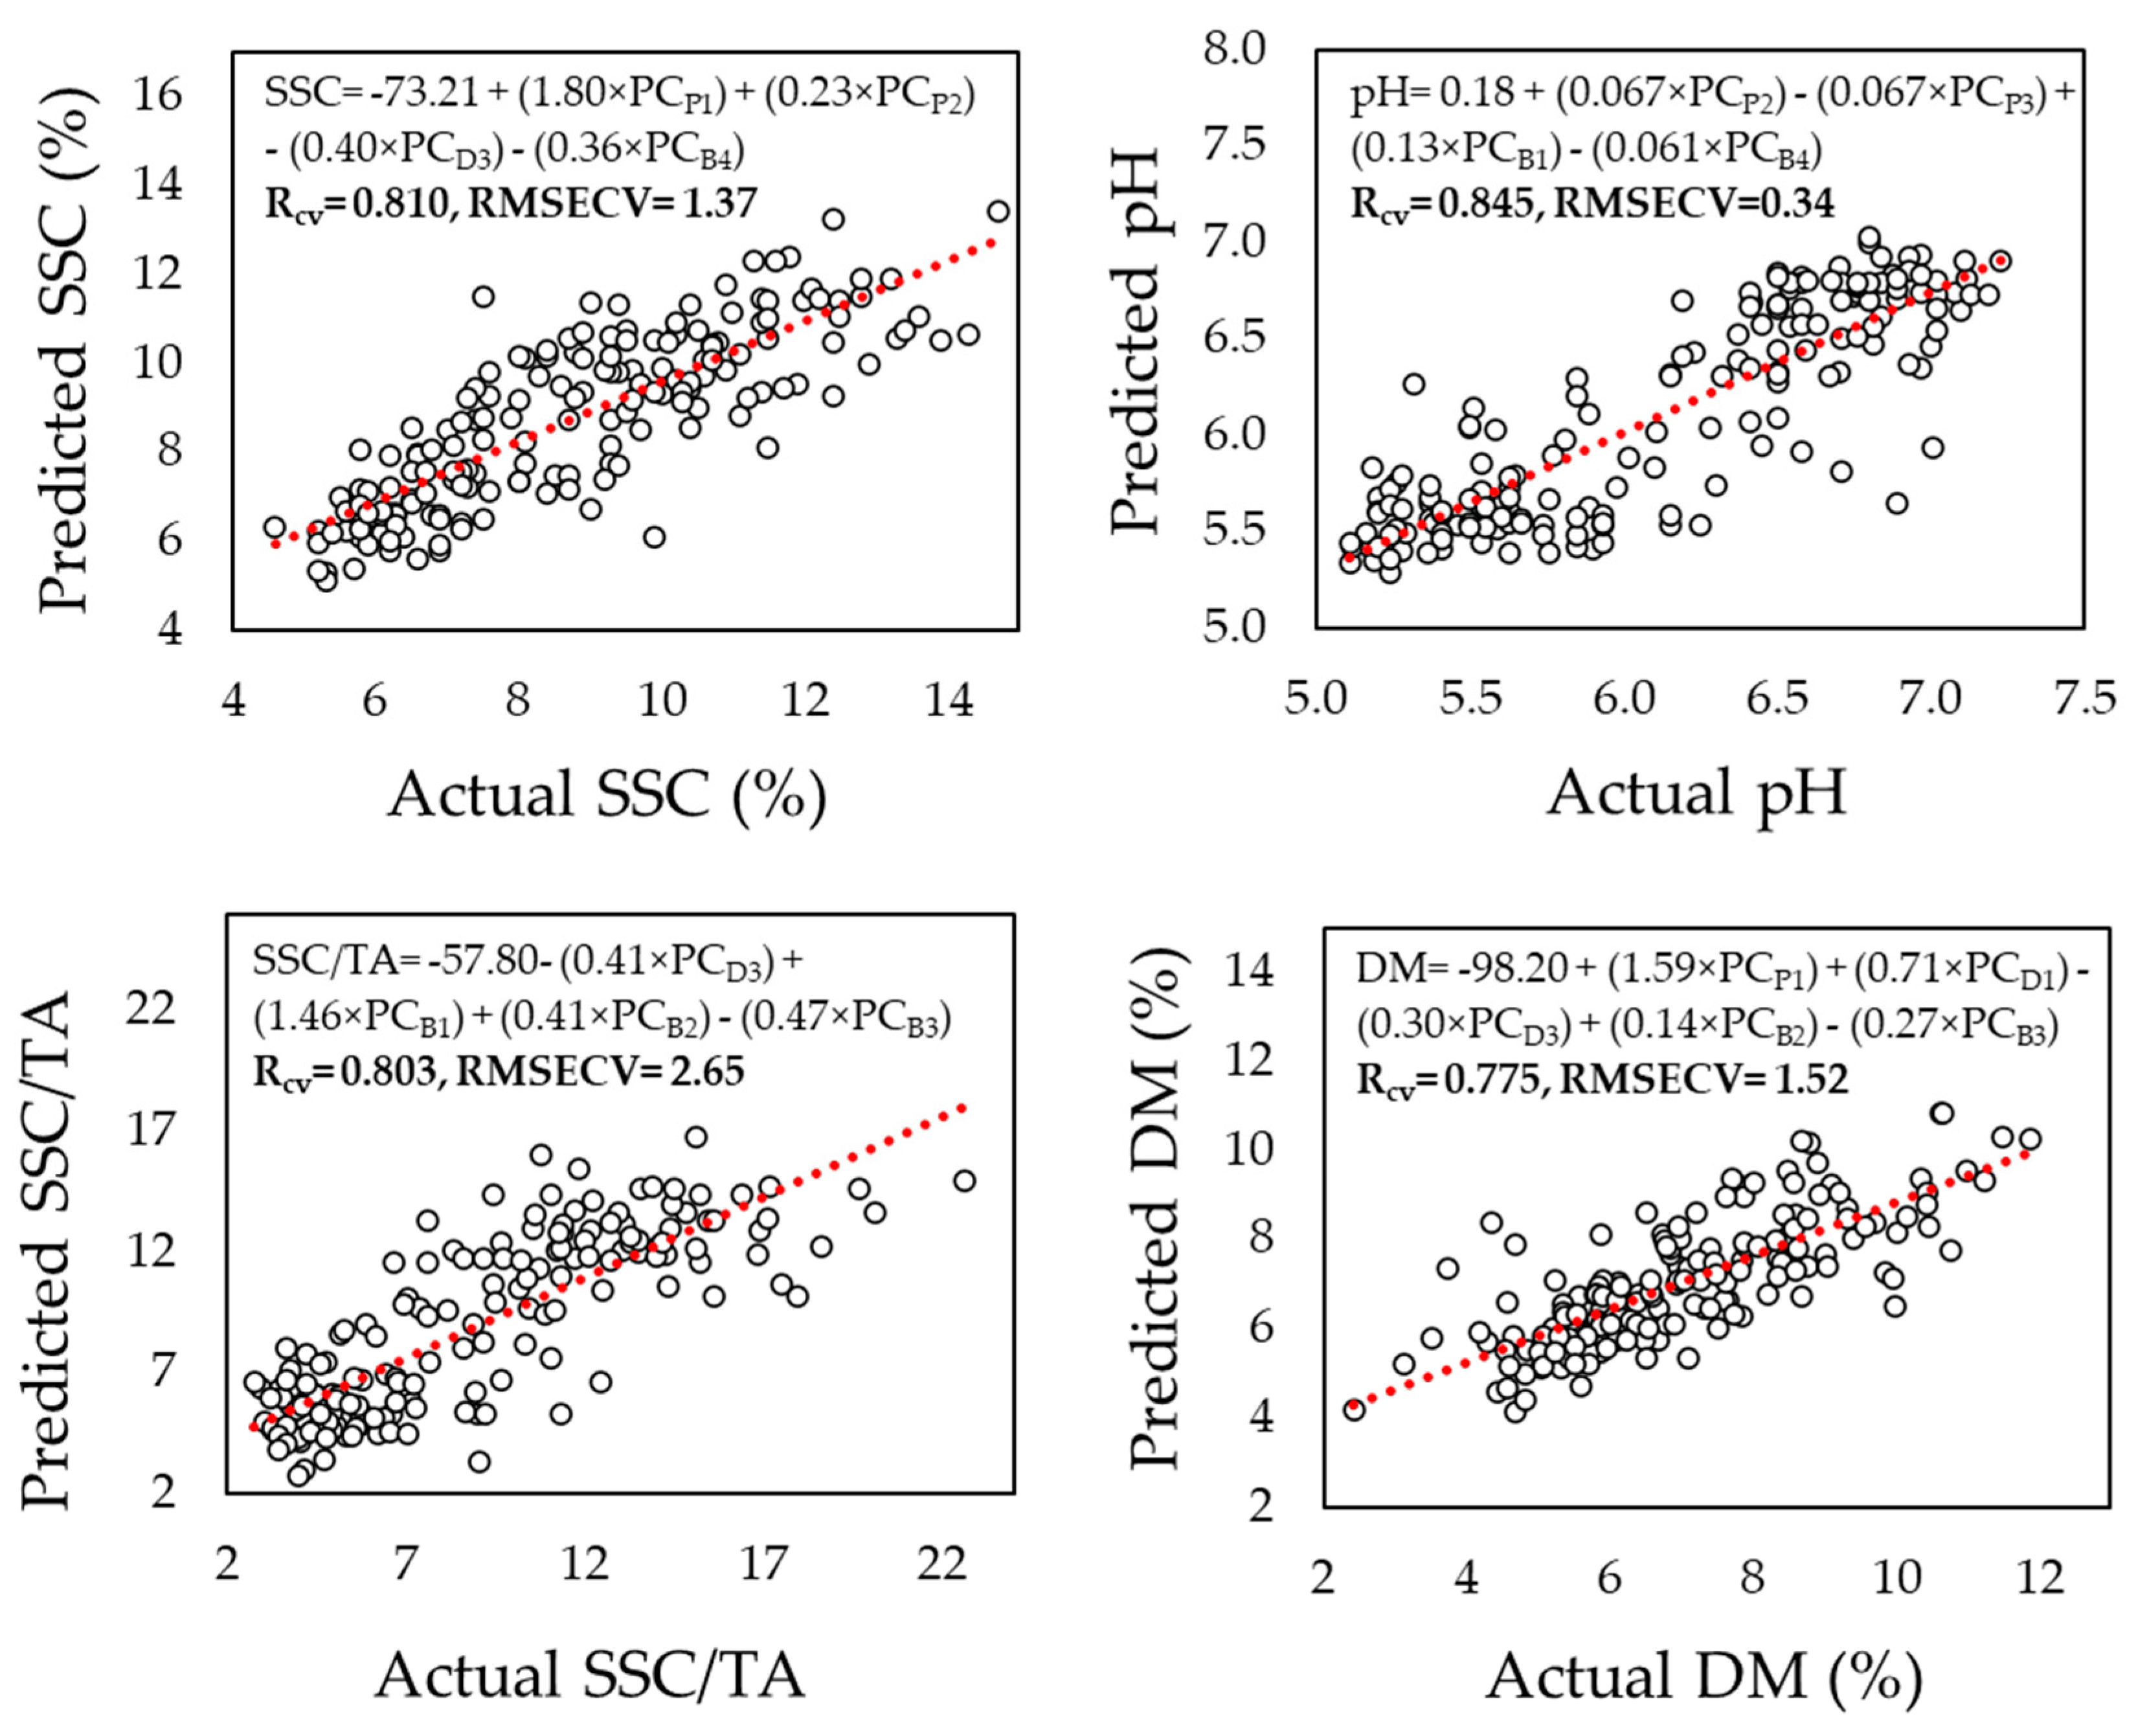
Figure 4.
Prediction of soluble solids content (SSC), pH, the ratio SSC to titratable acidity (SSC/TA) and dry matter (DM) based on partial least squares (PLS) regression analyses of reflectance data captured initially at the pedicel, equatorial zone and blossom end area of 175 melon fruit at 350-2500 nm and later being integrated into a pooled data set.
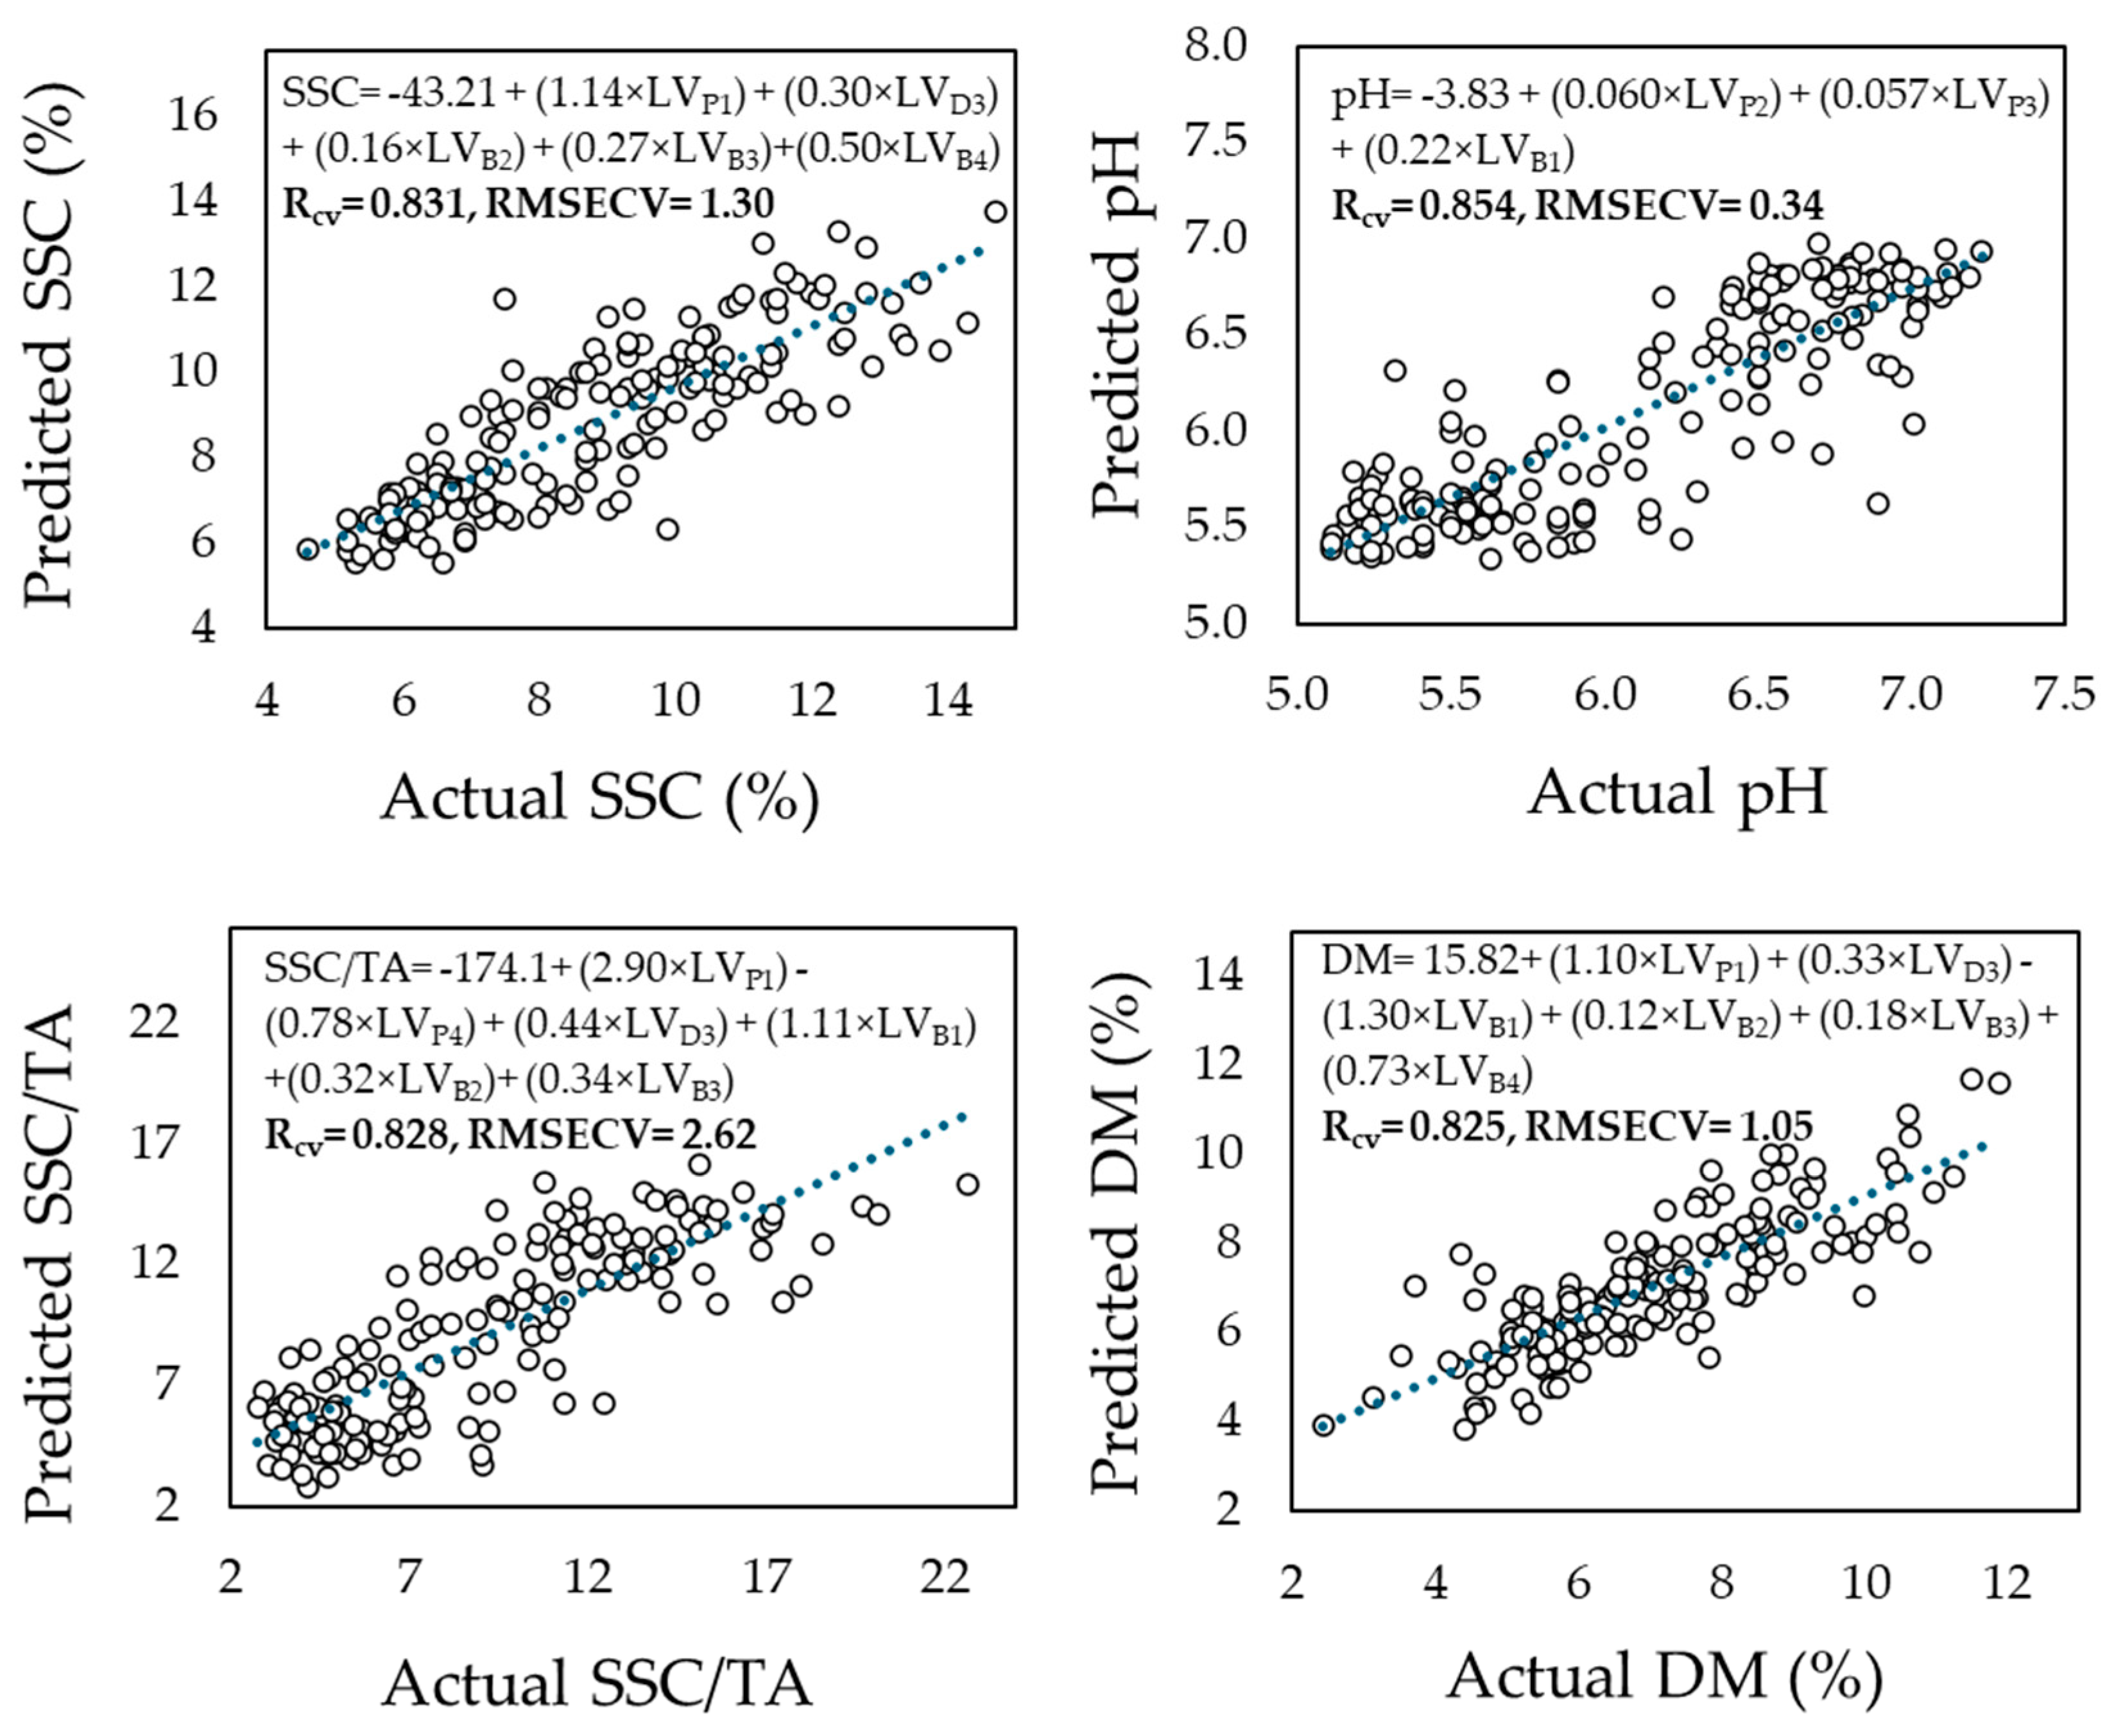
Figure 5.
Regression coefficients between the principal components (PCs) and the specific wavelengths for each of the measurement area upon 175 melon fruit that were harvested at the ripe stage.
Figure 5.
Regression coefficients between the principal components (PCs) and the specific wavelengths for each of the measurement area upon 175 melon fruit that were harvested at the ripe stage.
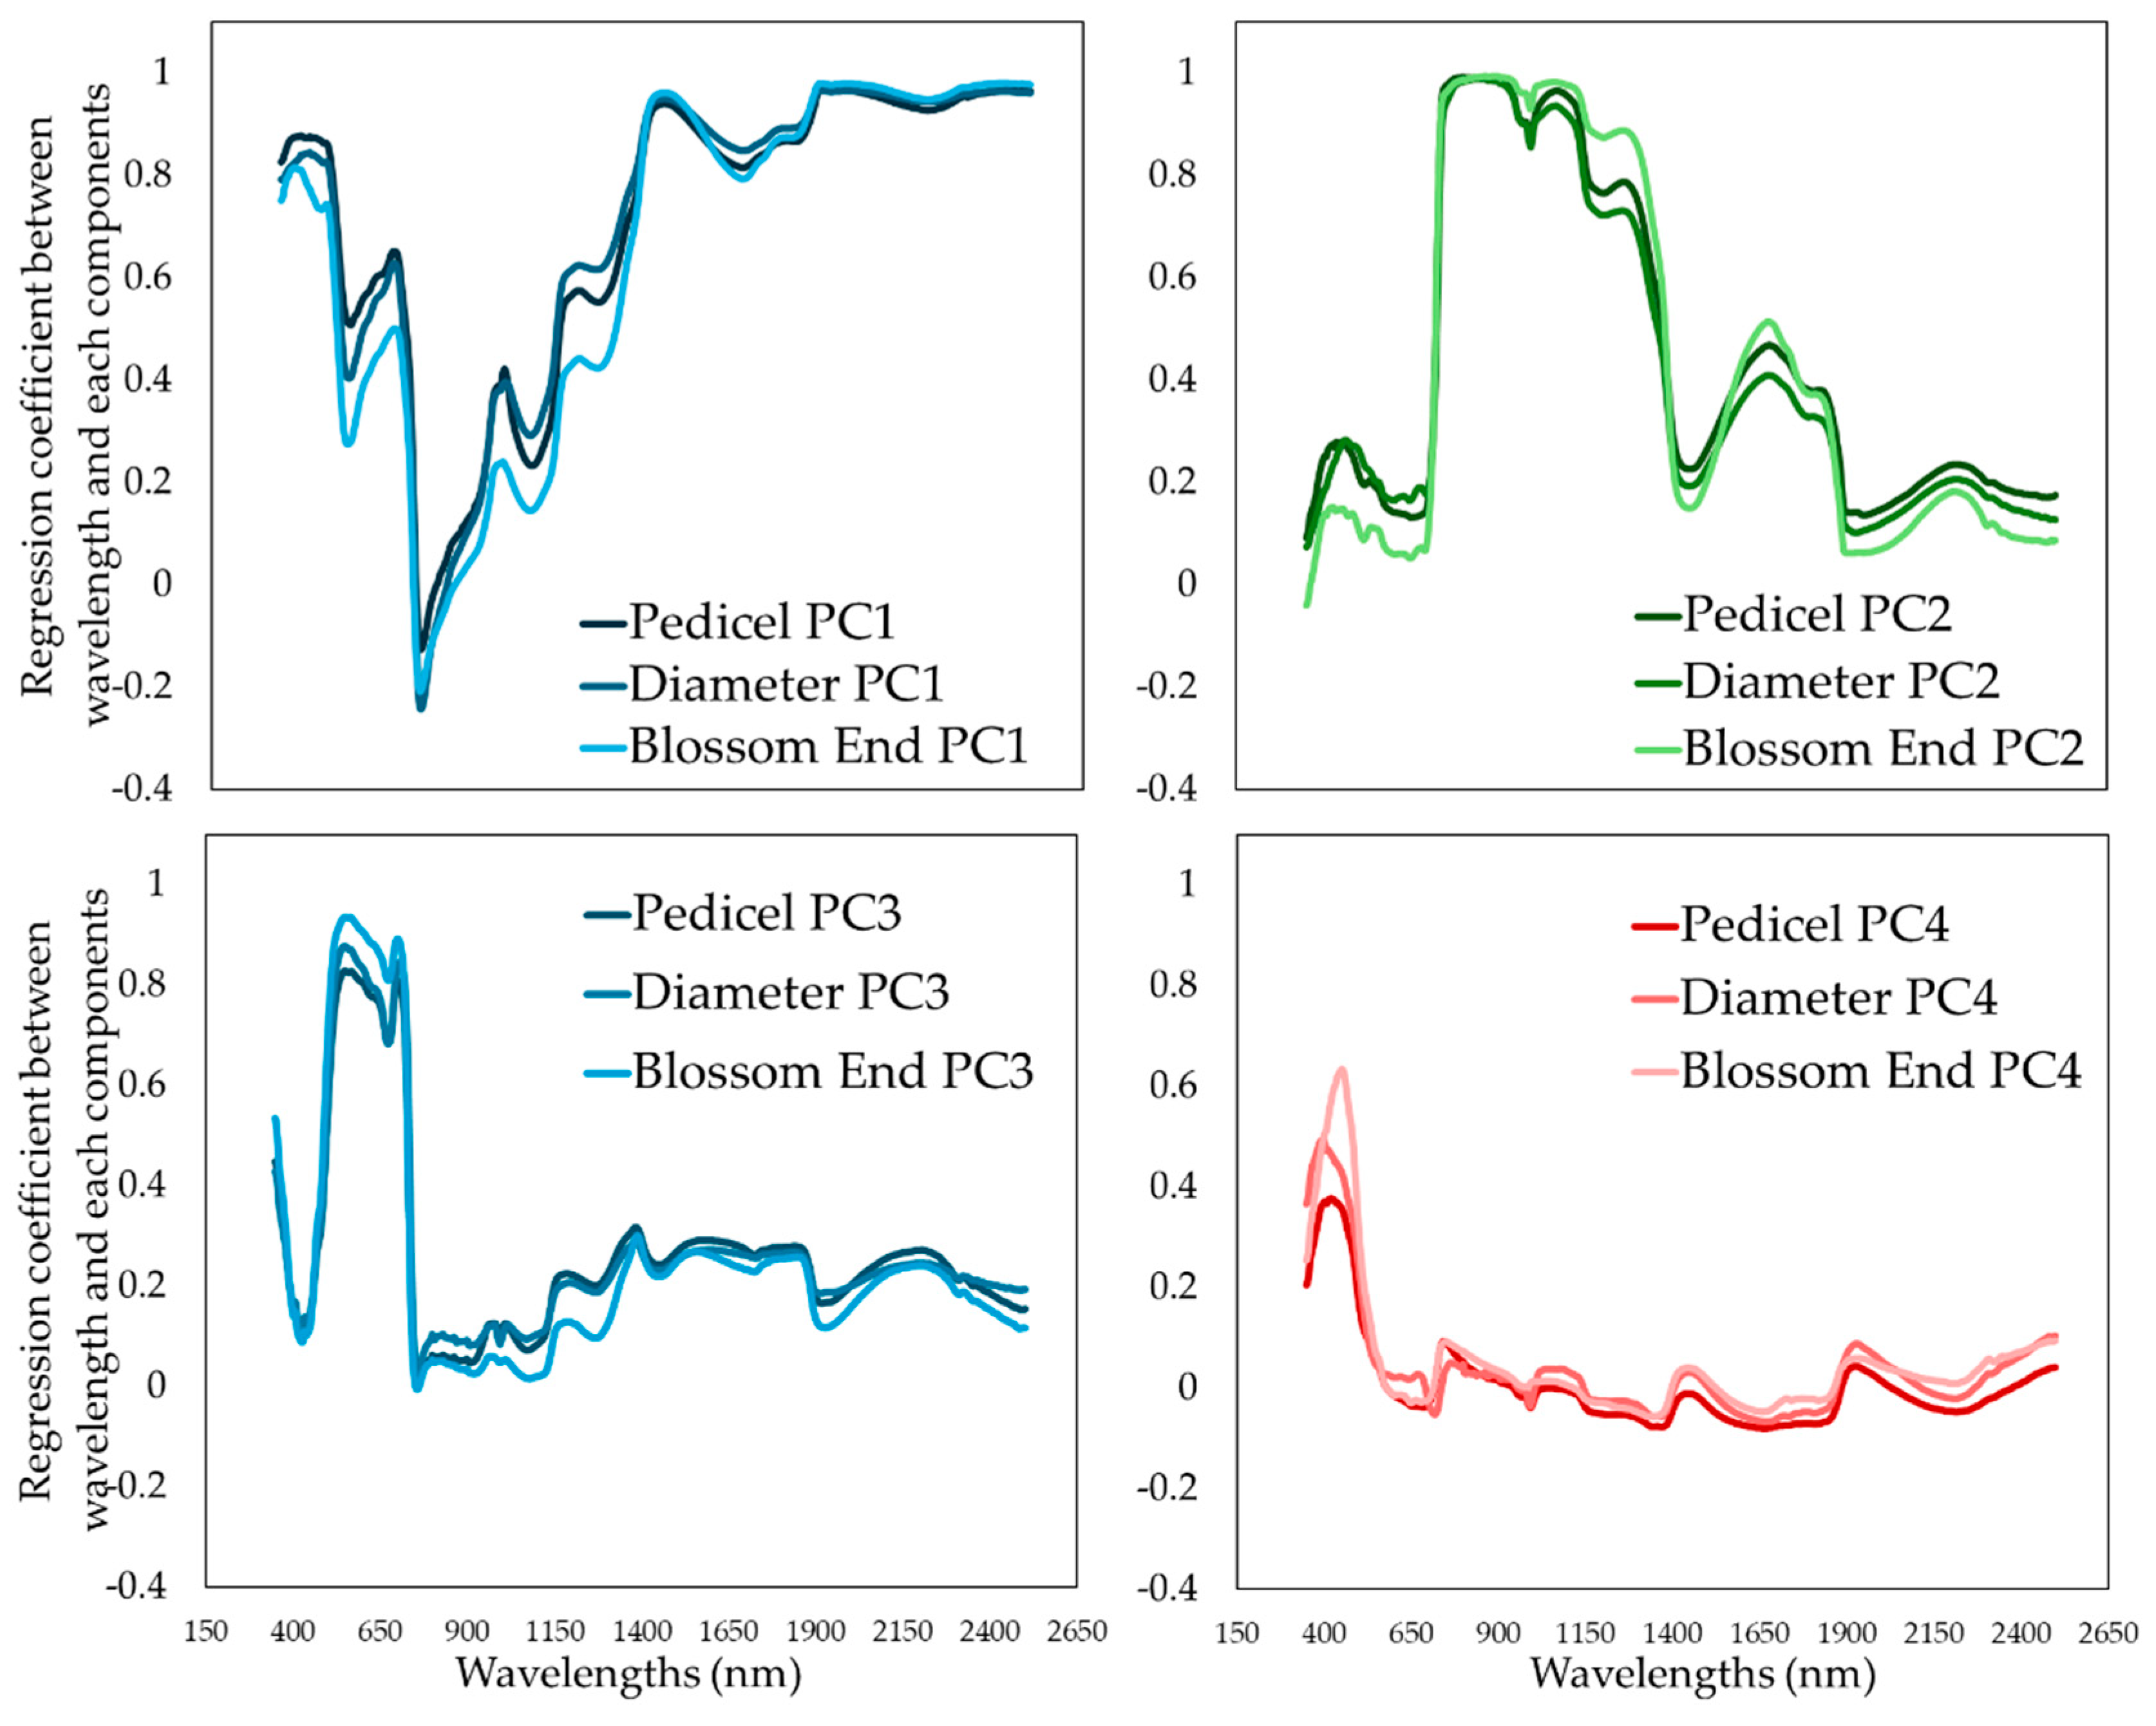
Figure 6.
Specific wavelength regions from the reflectance data that were captured on the pedicel area of melon fruit and were identified using the genetic algorithm (GA) that exhibit the most significant importance in nutritional components predictions, in each of the components; soluble solids content (SSC) (in blue), pH (in yellow), the ratio SSC to titratable acidity (in green) and dry matter (DM) (in red).
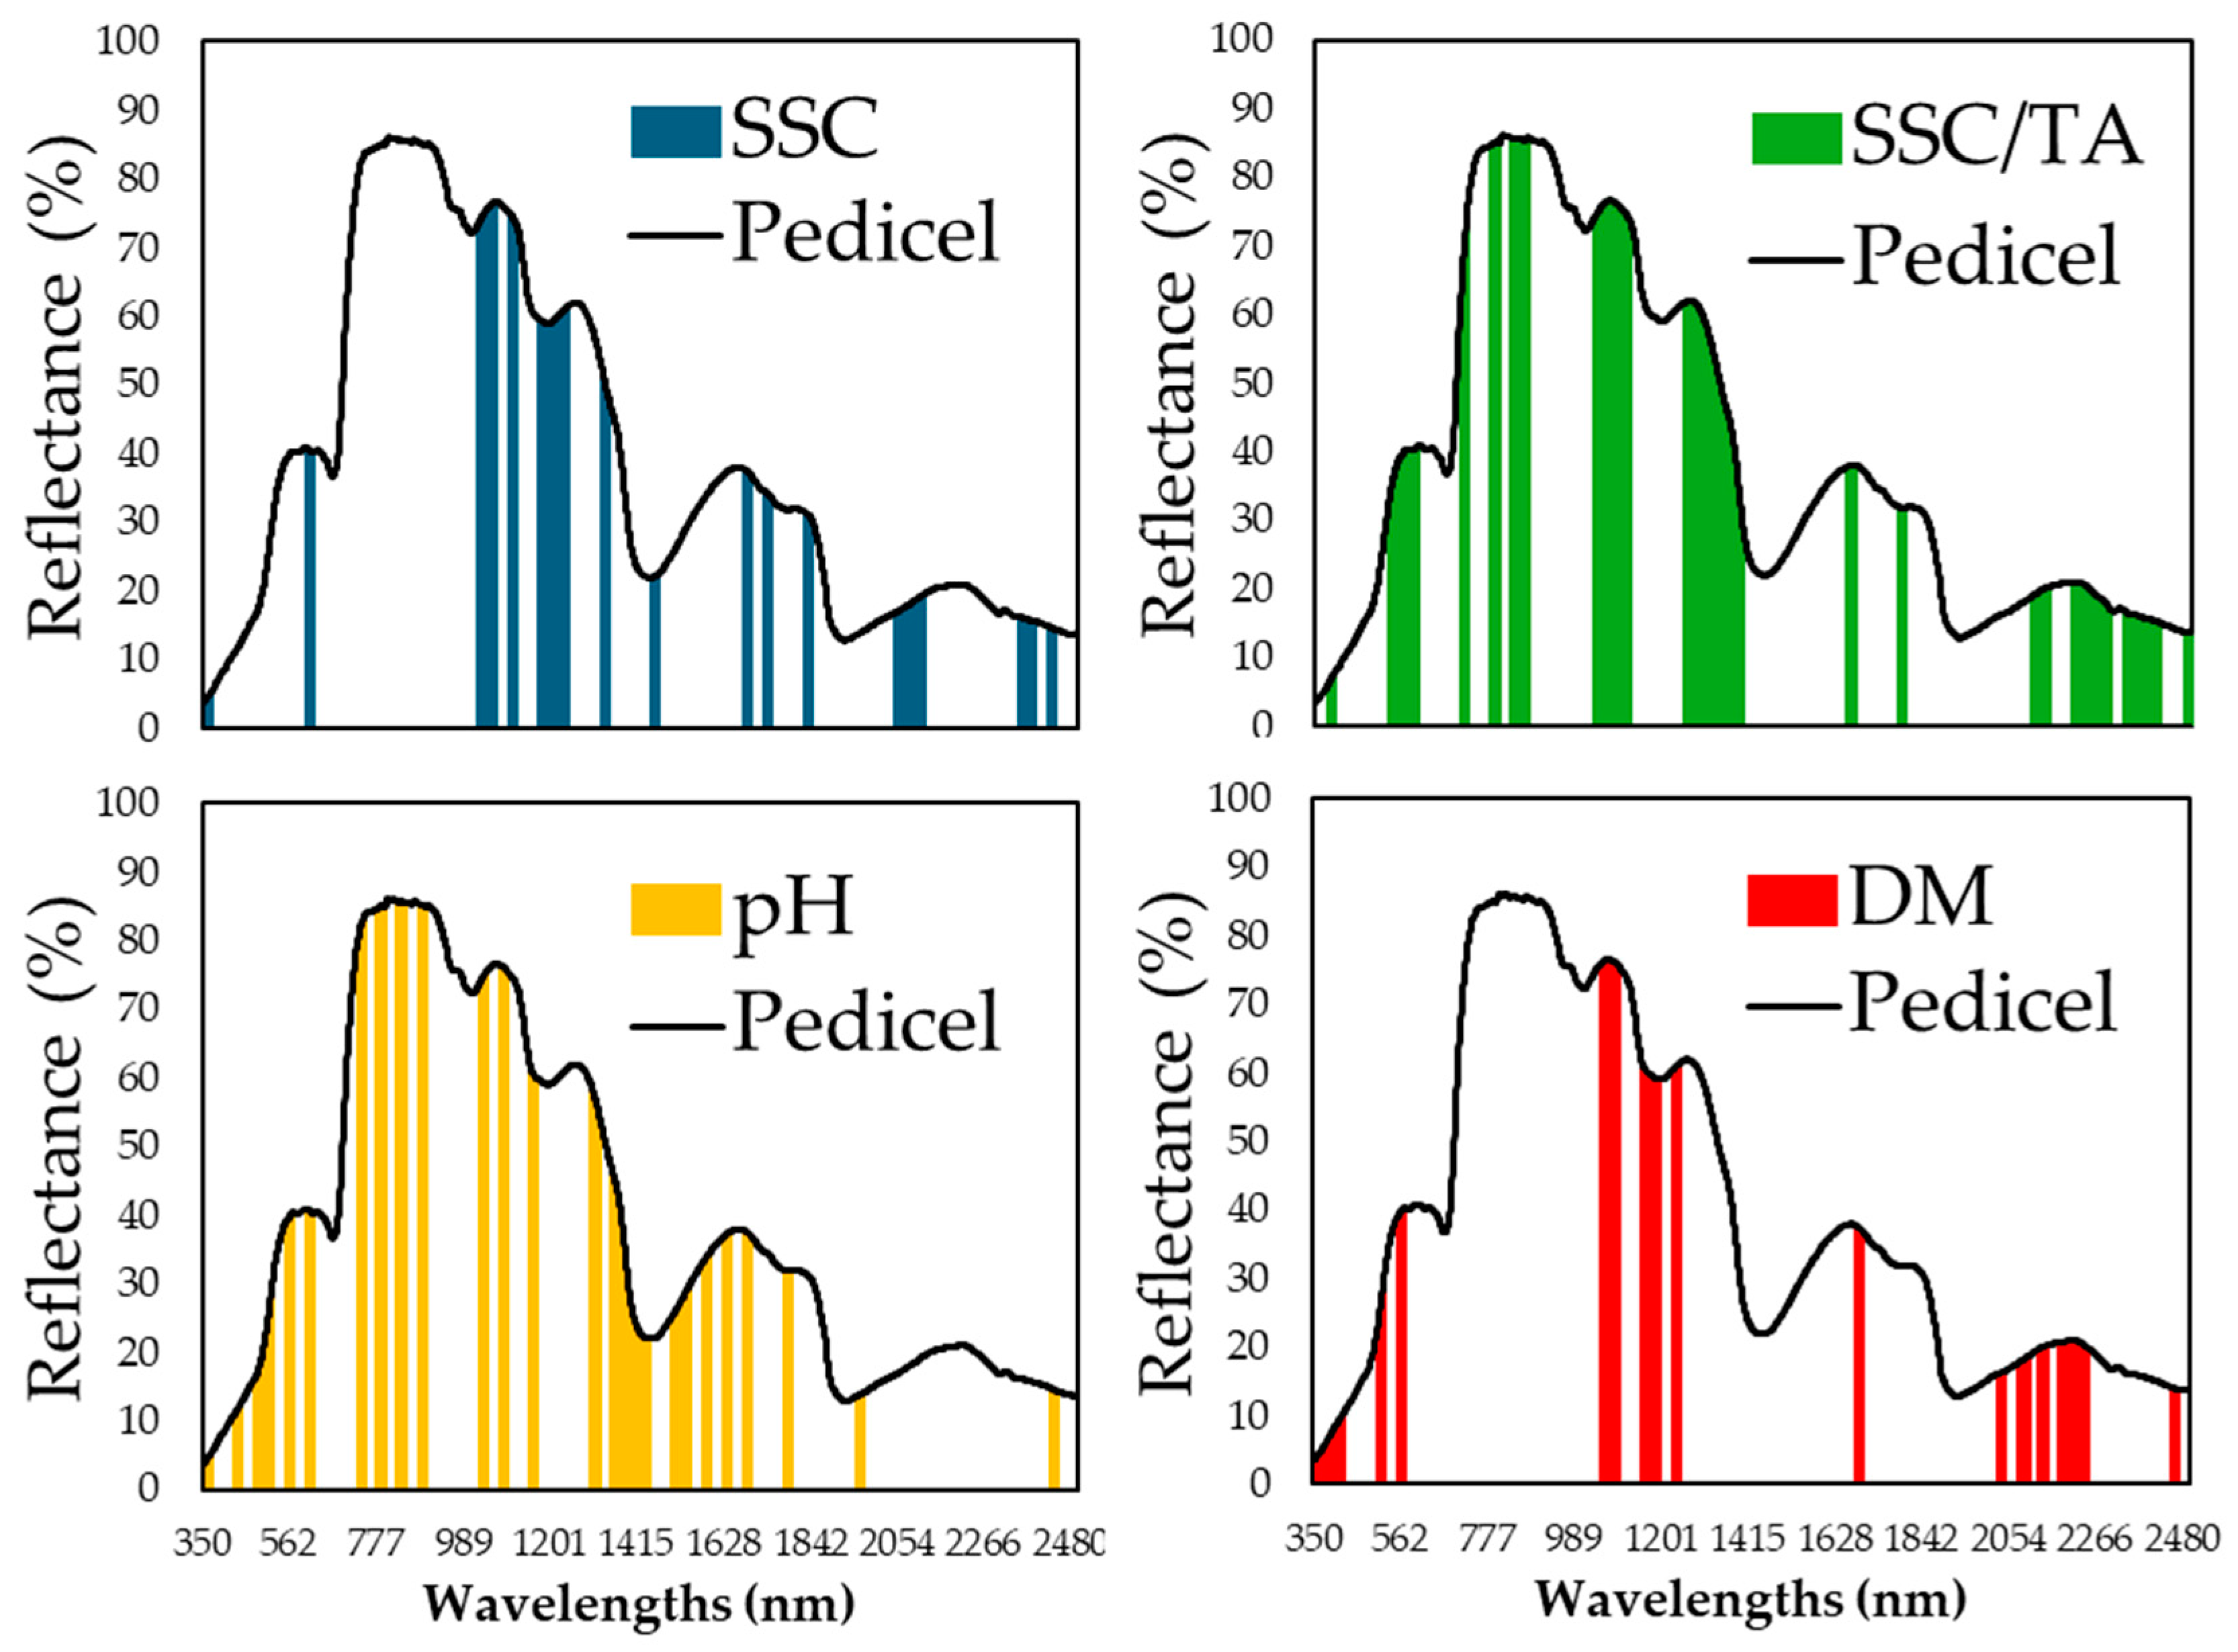
Figure 7.
Specific wavelength regions from the reflectance data that were captured on the equatorial zone area of melon fruit and were identified using the genetic algorithm (GA) that exhibit the most significant importance in nutritional components predictions, in each of the components; soluble solids content (SSC) (in blue), pH (in yellow), the ratio SSC to titratable acidity (in green) and dry matter (DM) (in red).
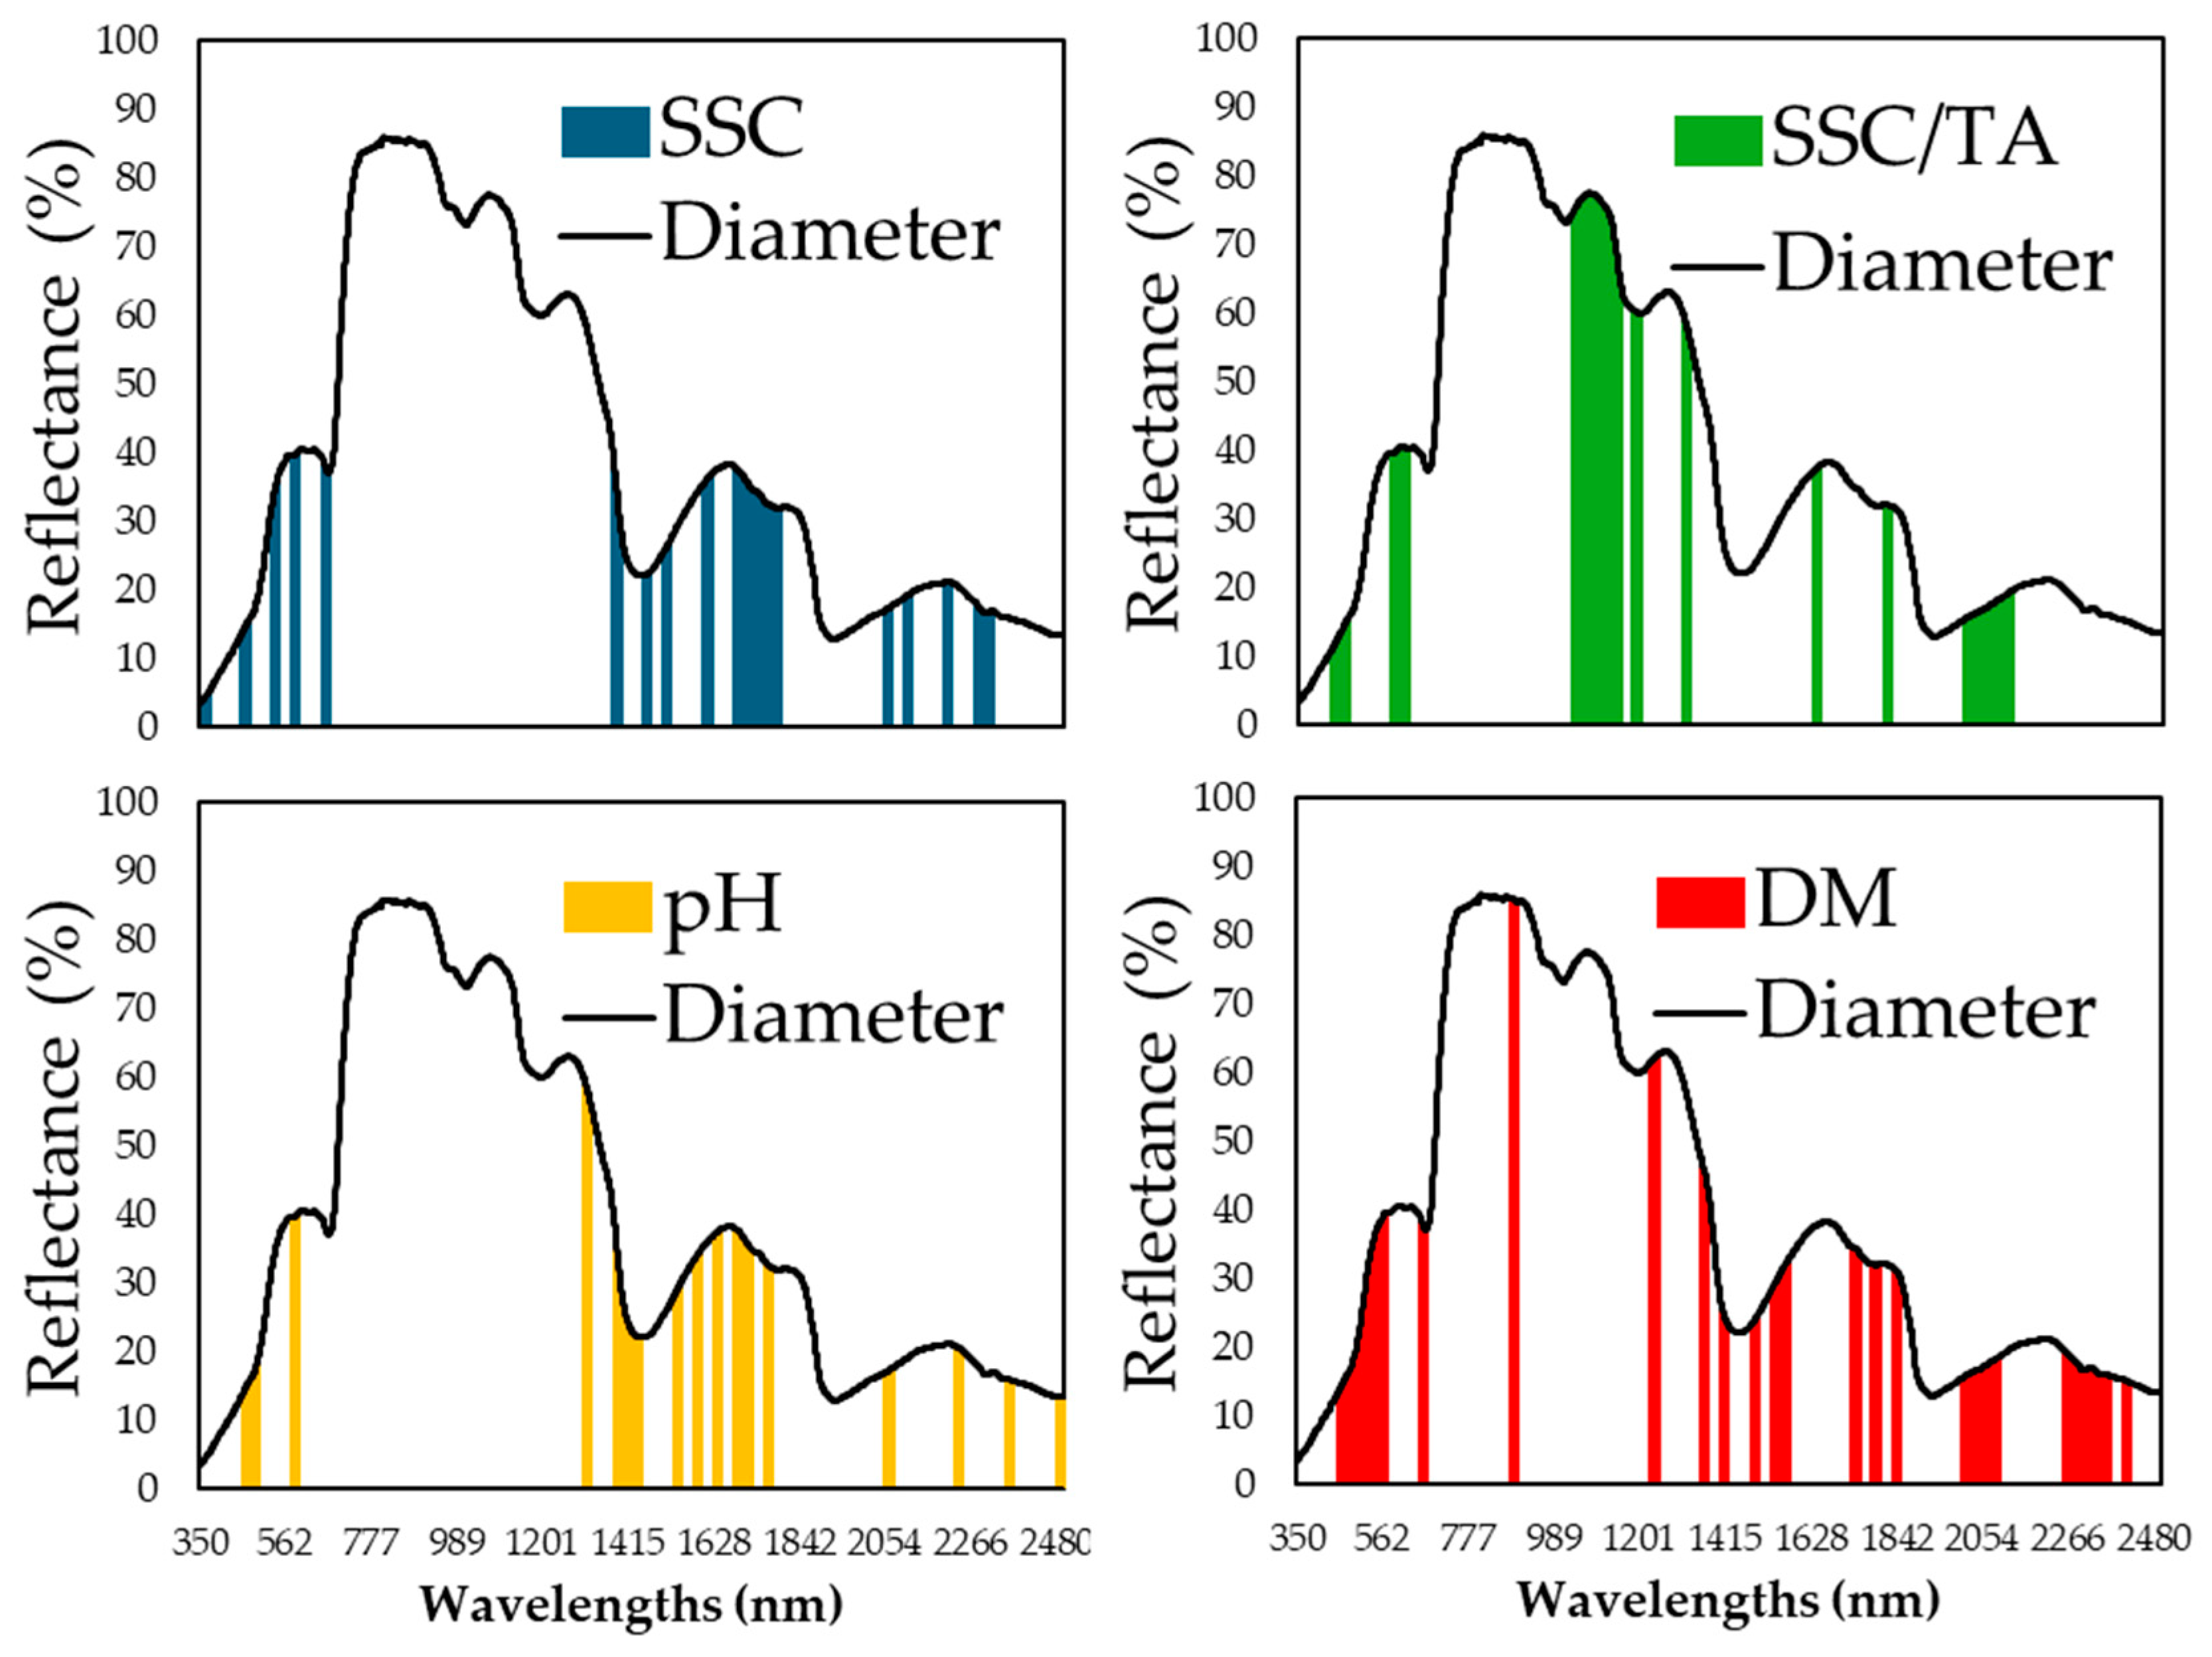
Figure 8.
Specific wavelength regions from the reflectance data that were captured on the blossom end area of melon fruit and were identified using the genetic algorithm (GA) that exhibit the most significant importance in nutritional components predictions, in each of the components; soluble solids content (SSC) (in blue), pH (in yellow), the ratio SSC to titratable acidity (in green) and dry matter (DM) (in red).

Figure 9.
Specific wavelengths that were identified using the variable importance in projection (VIP) scores, with peaks that exhibit the greatest importance in nutritional component predictions; soluble solids content (SSC) (in blue line), pH (in red line), the ratio SSC to titratable acidity (in yellow line) and dry matter (DM) (in purple line). The red dotted line represents the significant threshold, above of which reflectance is strongly associated with the nutritional components.
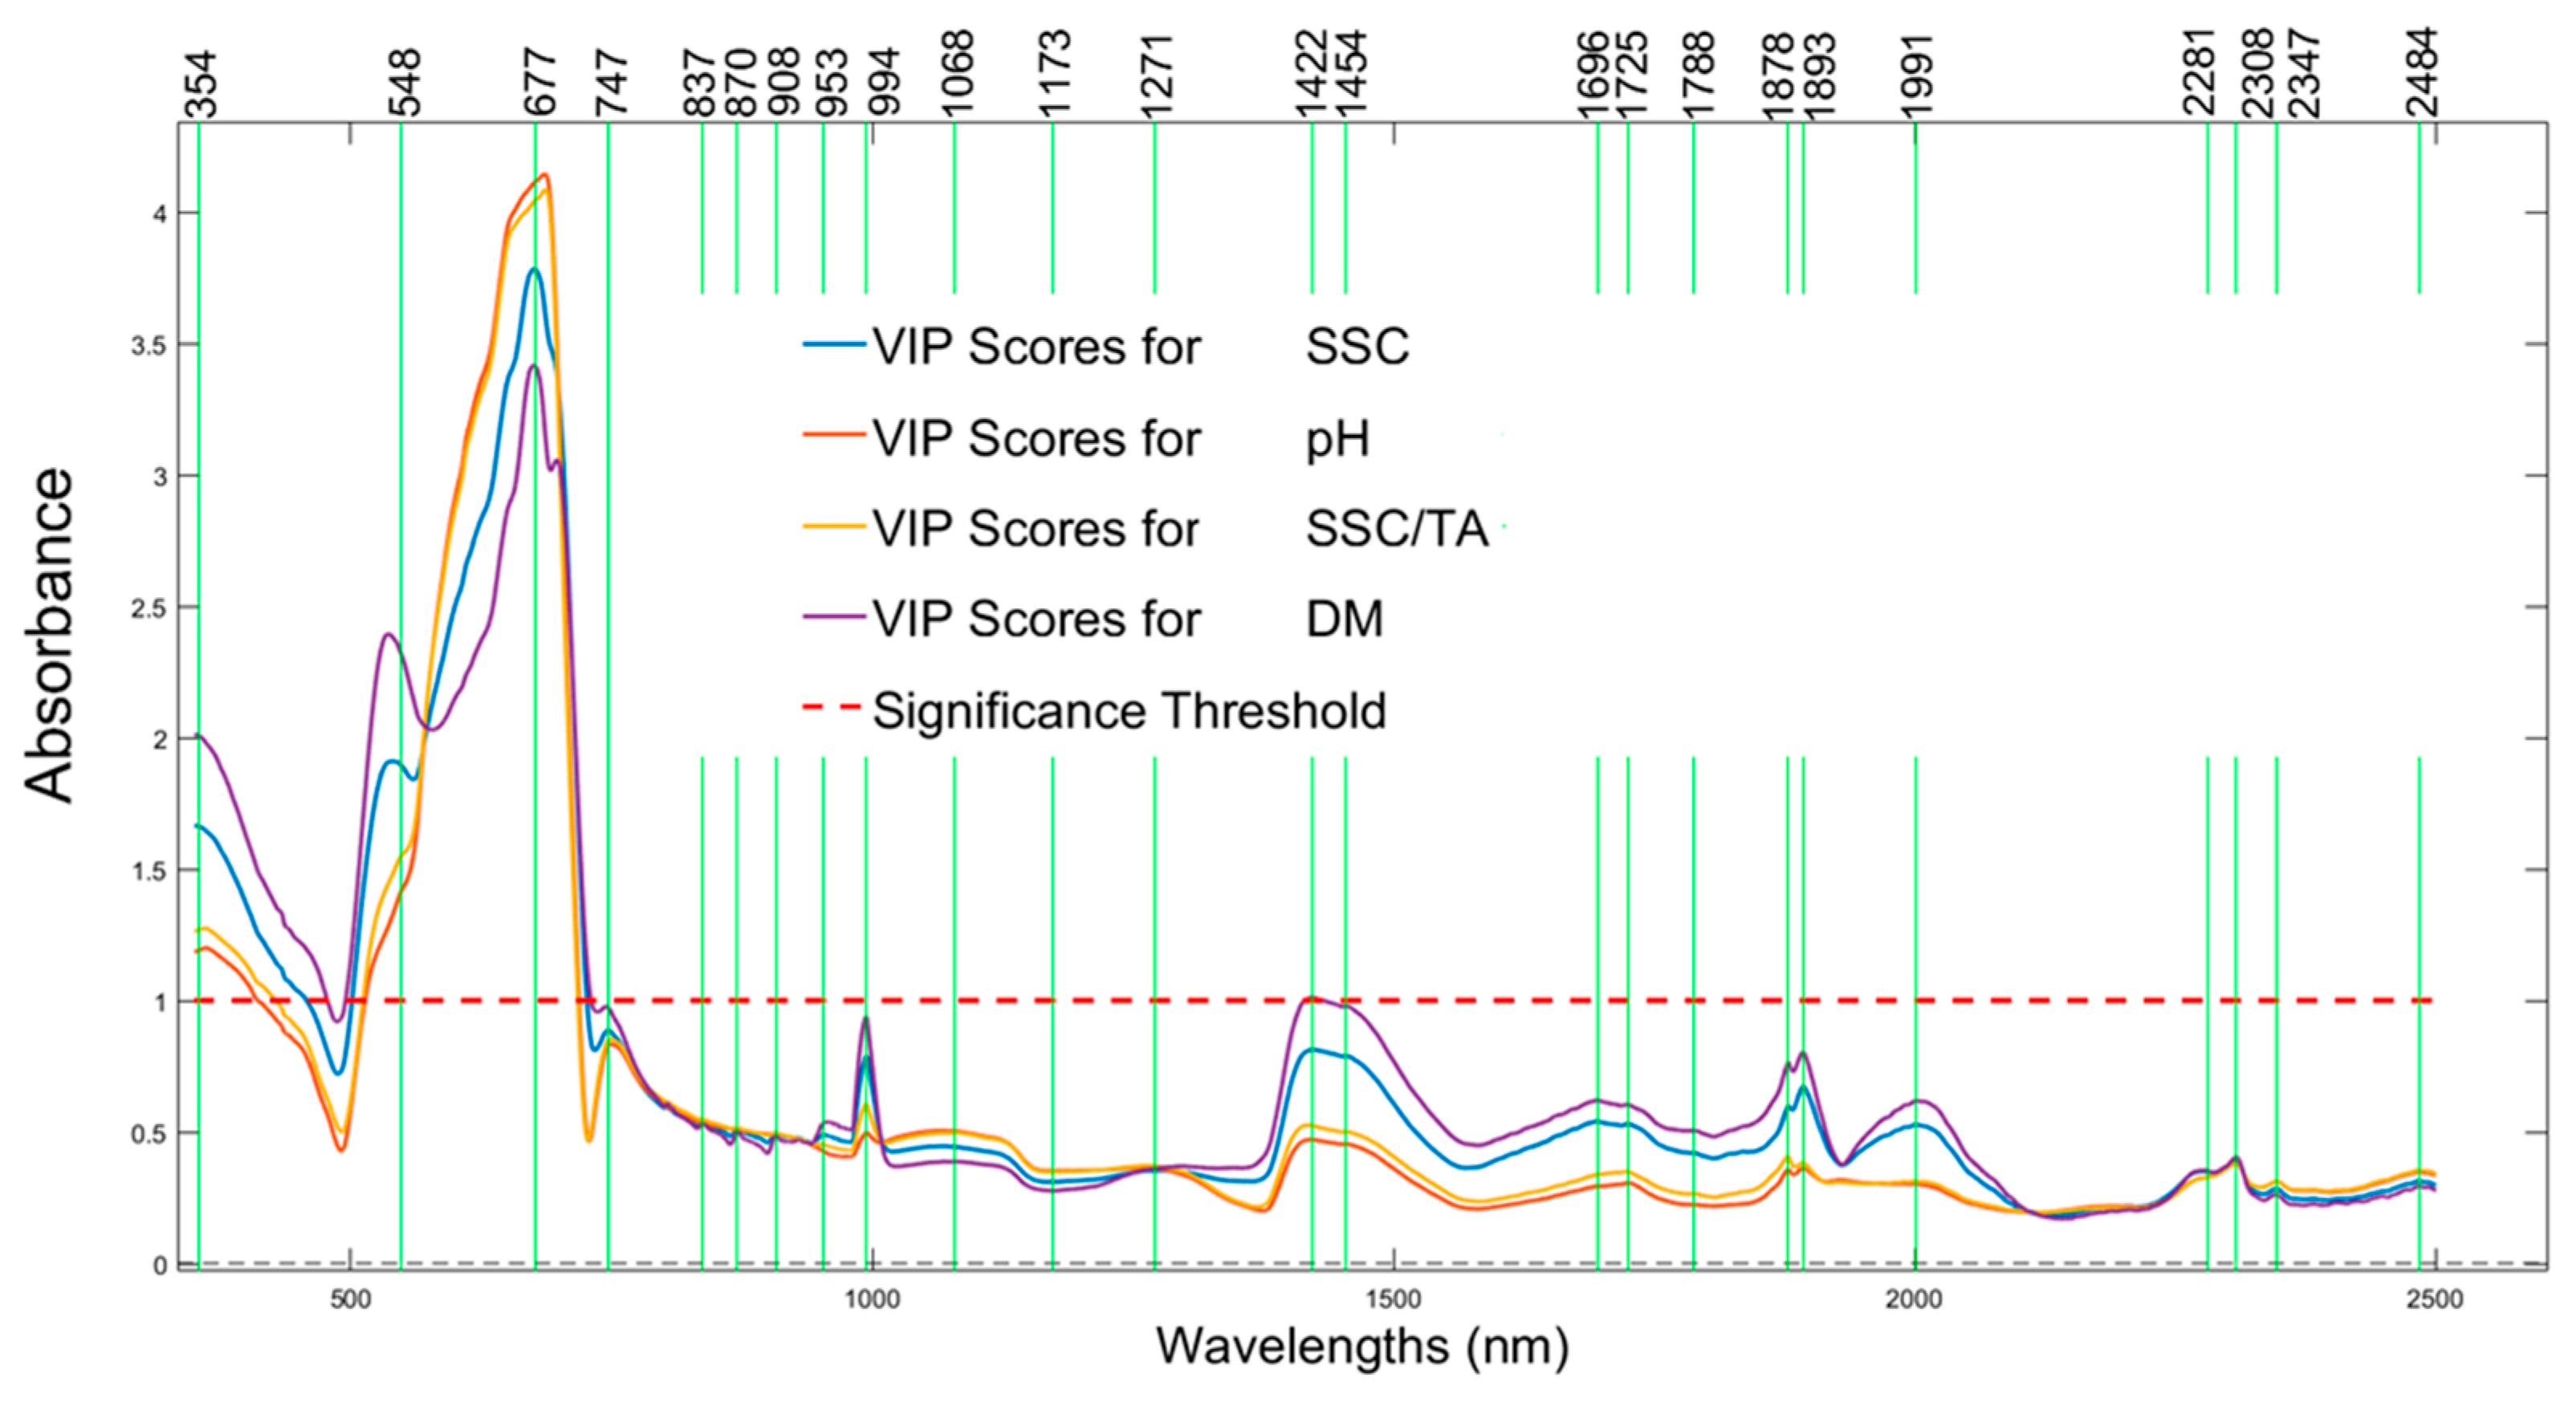

Table 1.
Regression coefficients and root mean square errors of prediction of soluble solids (SSC), pH, the ratio SSC to titratable acidity (SSC/TA) and of dry matter in melon fruit based on reflectance data that were captured on the pedicel, equatorial zone and blossom end area of 175 fruit. The predictions were based on partial least square regression analyses of all reflectance data in the 340-2500 nm part of the spectrum, followed by analyses of data from specific regions that were detected using the genetic algorithm and finally based on individual wavelengths with significant VIP scores within each fruit area.
Table 2.
Regression coefficients and root mean square errors of prediction of soluble solids (SSC), pH, the ratio SSC to titratable acidity (SSC/TA) and of dry matter in melon fruit based on the integrated reflectance data that were captured on the pedicel, equatorial zone and blossom end are of 175 fruit. The predictions were based on principal component (PC) or partial least square (PLS) regression analyses of all reflectance data in the 340-2500 nm part of the spectrum, followed by multilinear regression analyses using data from individual wavelengths that were extracted using the VIP scores criterium within each fruit area.
Disclaimer/Publisher’s Note: The statements, opinions and data contained in all publications are solely those of the individual author(s) and contributor(s) and not of MDPI and/or the editor(s). MDPI and/or the editor(s) disclaim responsibility for any injury to people or property resulting from any ideas, methods, instructions or products referred to in the content. |
© 2025 by the authors. Licensee MDPI, Basel, Switzerland. This article is an open access article distributed under the terms and conditions of the Creative Commons Attribution (CC BY) license (https://creativecommons.org/licenses/by/4.0/).
Copyright: This open access article is published under a Creative Commons CC BY 4.0 license, which permit the free download, distribution, and reuse, provided that the author and preprint are cited in any reuse.


