1. Introduction
In contemporary society, electricity has emerged as an indispensable resource for ensuring a decent standard of living in both urban and rural regions [
1,
2,
3]. It is crucial for the most vital tasks in our daily lives, including entertainment, transportation, education, and healthcare [
4,
5,
6,
7]. In 2019, the International Energy Agency (IEA) reported that 760 million individuals, accounting for 10% of the global population, had no electricity access [
8].
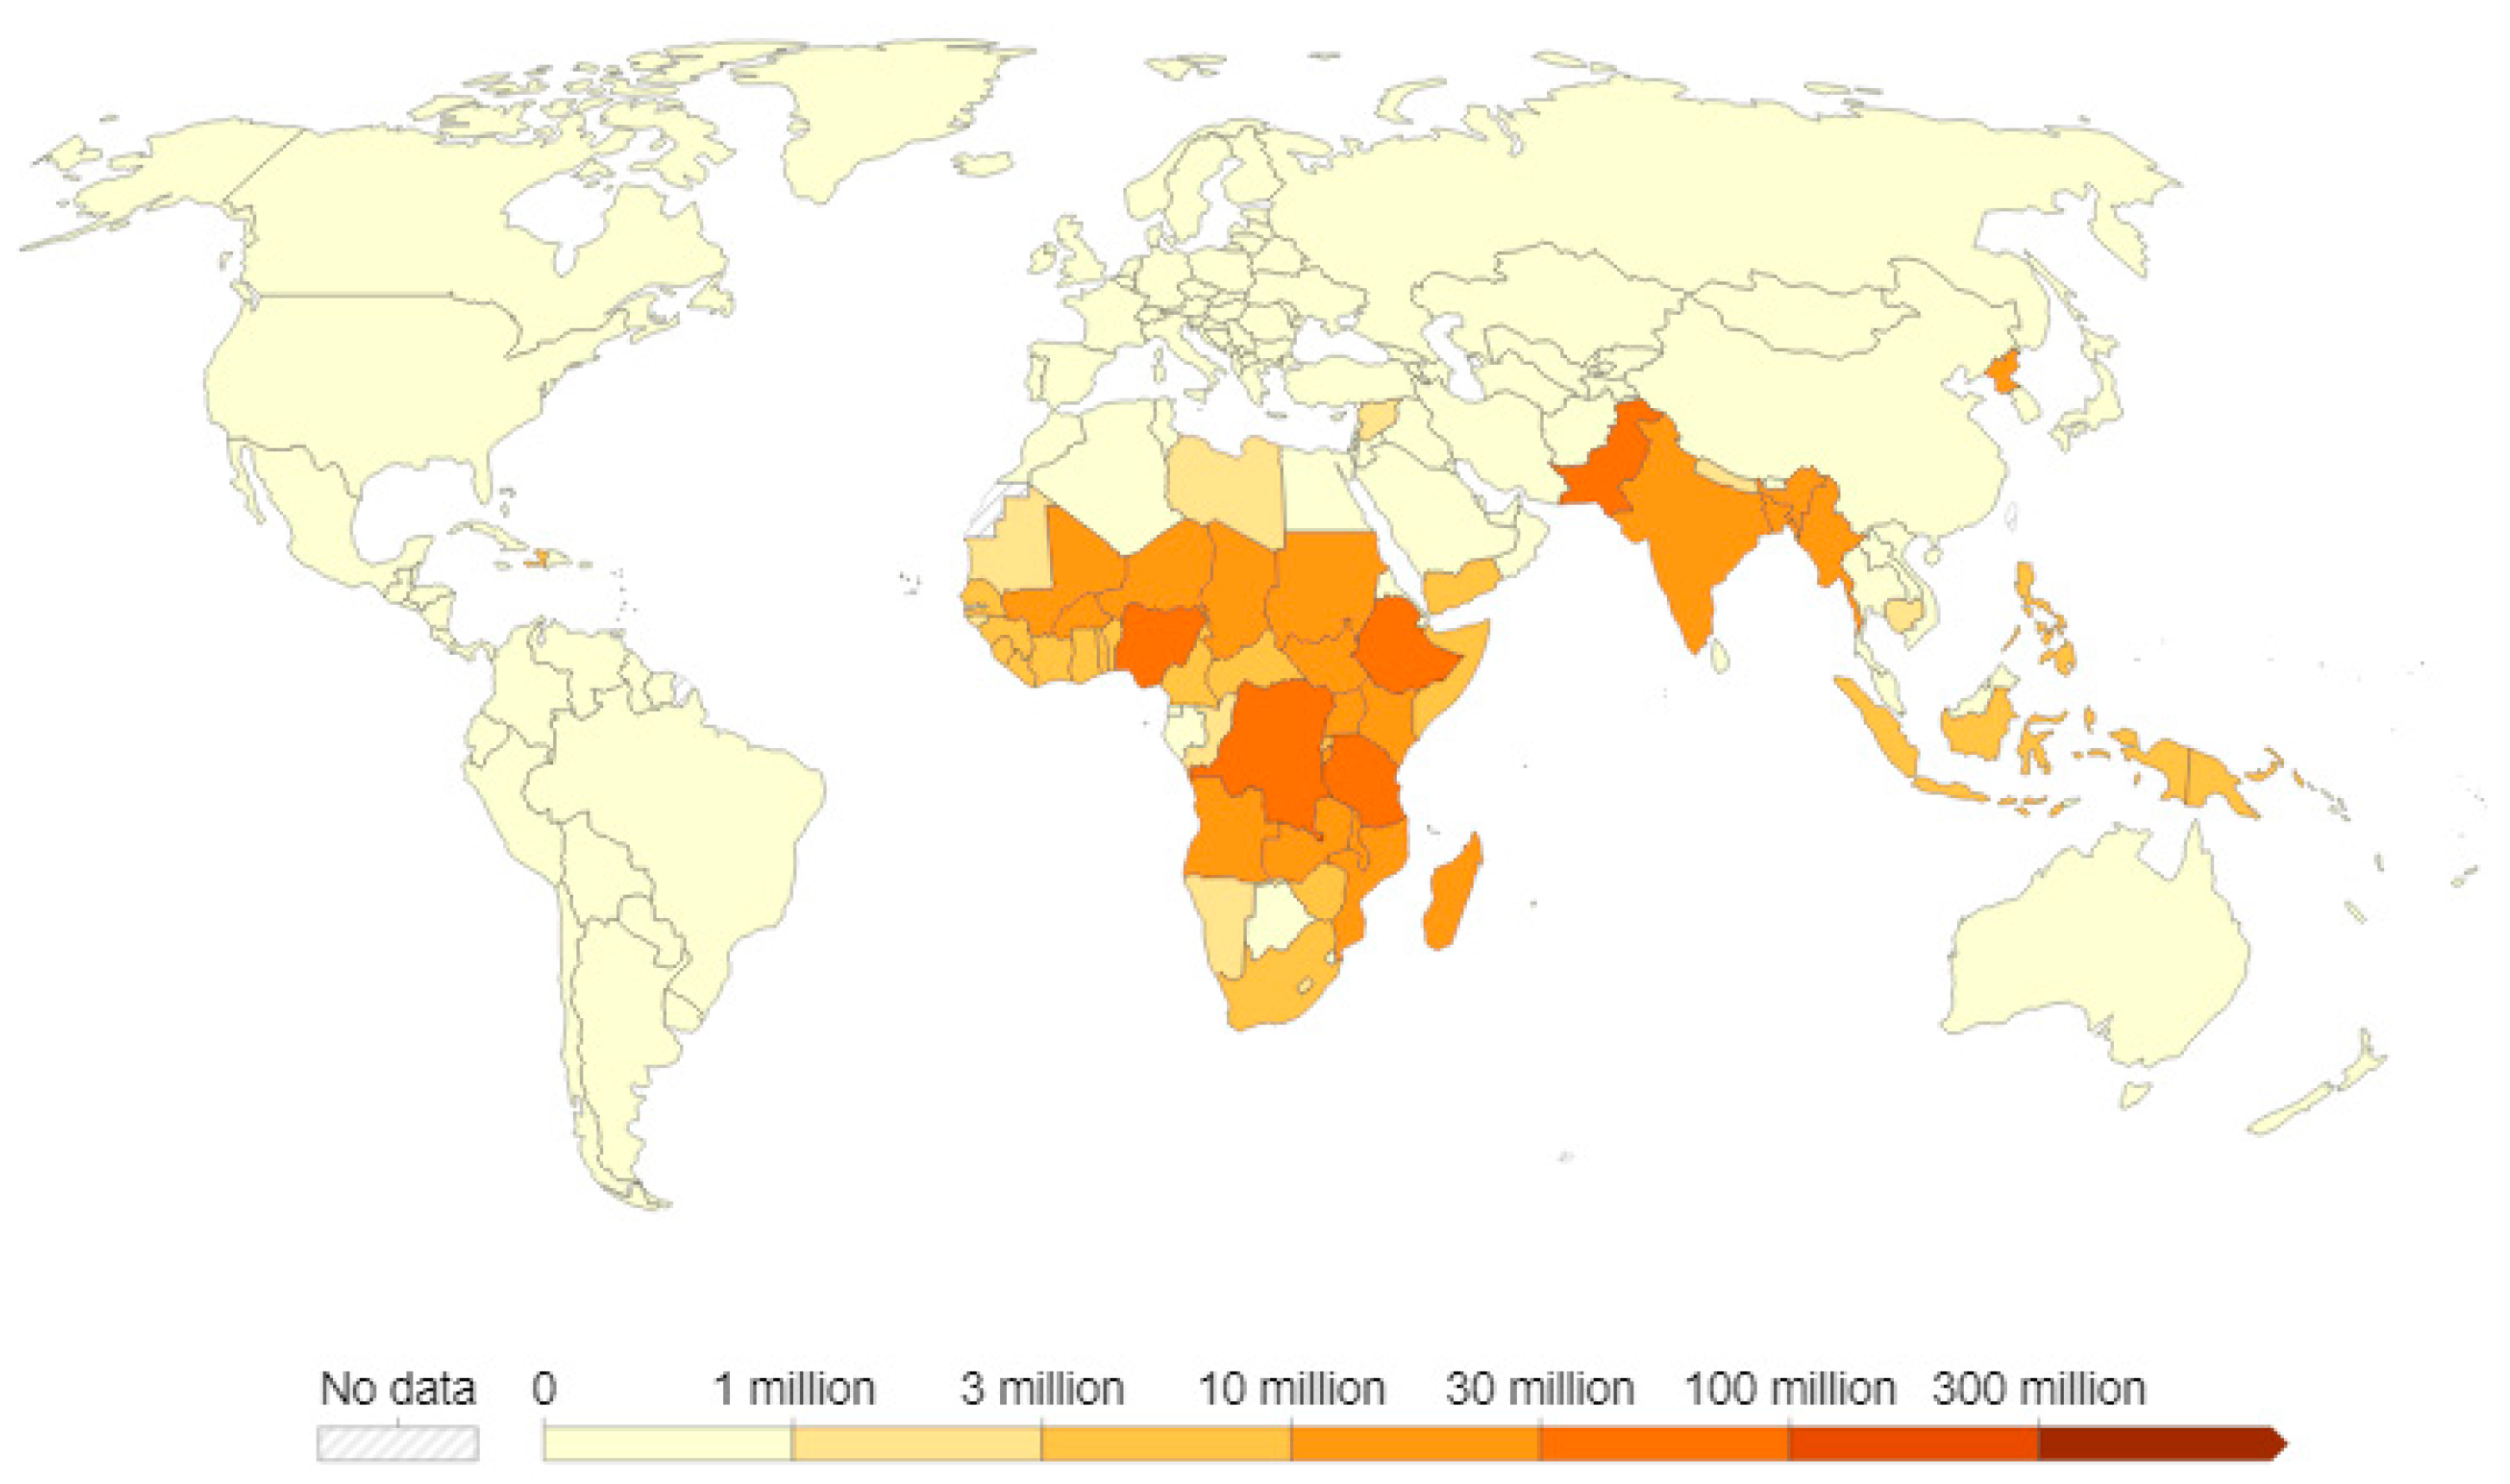
Figure 1 depicts the global distribution of those lacking access to electricity. They are mainly concentrated in developing nations, particularly in sub-Saharan Africa and South Asia [
9].
Most of these nations exhibit a disparity in the pace of electricity between rural and urban regions [
10,
11,
12]. In this instance, Cameroon, a sub-Saharan country in Central Africa, achieved a nationwide electricity access rate of 65% in 2021, with a notable disparity between urban regions, where the rate was 95%, and rural areas, where it was only 25% [
13,
14]. The challenges of rural electrification in sub-Saharan Africa often stem from economic, geographical, and social factors. Significant obstacles include low population density, extensive and rugged terrain, and insufficient financial resources [
15].
As a result, most individuals living in rural regions depend on alternate sources, primarily diesel generators, to meet their electrical needs. This approach is characterized by the drawbacks of noise pollution, greenhouse gas emissions, and the need for regular maintenance, which comes with a significant fuel expense.
Recently, hybrid renewable energy systems (HRESs) have been touted as an efficient way to generate electricity in rural areas of sub-Saharan Africa. An HRES consists of many power plants that utilize diverse fuels, including fossil fuels and renewable sources. Compared to single-source renewable energy systems, HRESs are characterized by higher reliability, greater efficiency, and the ability to generate power at lower costs [
16,
17,
18]. There are several forms of energy storage in HRESs, with the two most frequently employed being batteries [
19,
20,
21,
22,
23,
24,
25,
26,
27,
28] and pumped-hydro storage (PHS) [
29,
30,
31,
32,
33,
34,
35,
36,
37,
38,
39]. Nevertheless, the utilization of batteries is restricted because of environmental apprehensions and their limited duration of usage [
40]. PHS, however, may significantly affect the terrain and hydrology and must be situated in places with substantial variations in elevation [
41]. Hence, the objective of adopting an alternative energy storage system that overcomes the limitations of conventional energy storage devices is becoming a vital pursuit for improving the viability of HRESs in SSA.
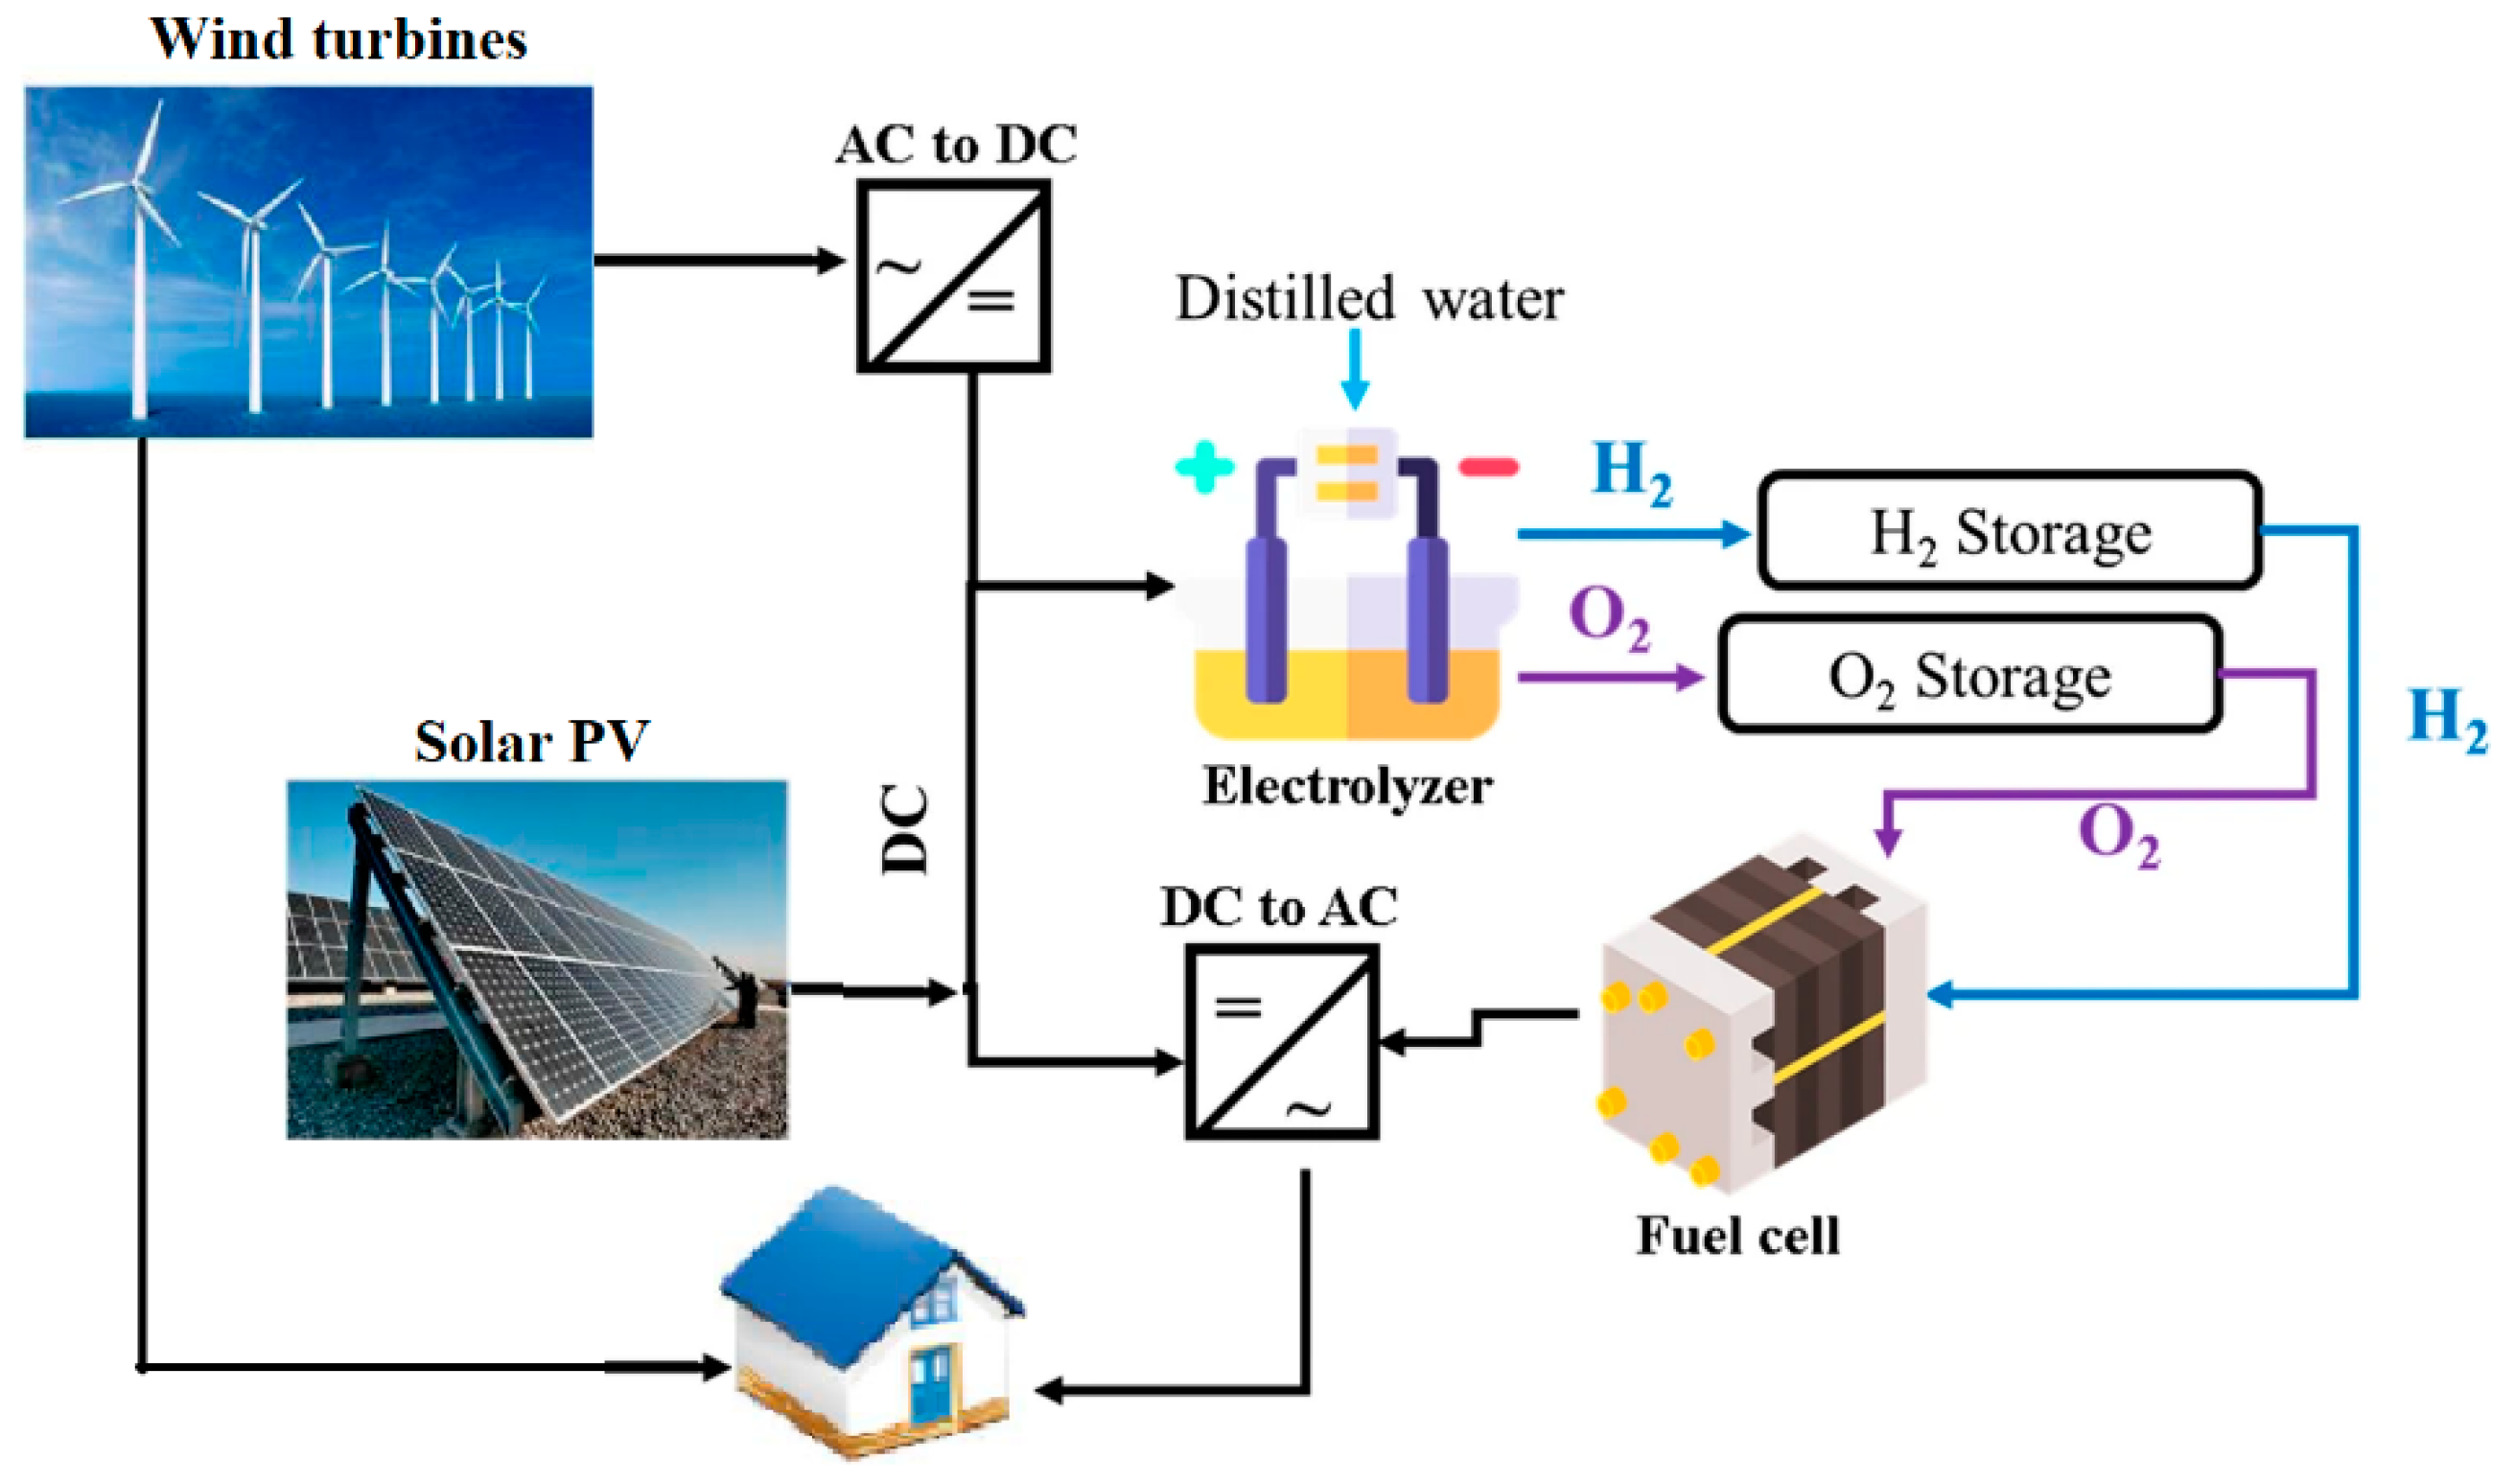
On the other hand, hydrogen has a greater energy density than batteries, indicating its ability to store more energy per unit of weight [
42,
43,
44]. It may be produced from several sources, including renewable energy sources, which makes it a potentially more sustainable choice for storing energy [
45]. Hydrogen storage is adaptable to different requirements, allowing for both expansion and reduction in size to cater to a wide range of applications, spanning from individual household setups to extensive grid storage facilities. Hydrogen energy storage uses electrolysis. An electric current splits water (H2O) into hydrogen (H) and oxygen (O) gases during electrolysis (2H
2O ⇾ 2H
2 + O
2) [
46]. Hydrogen gas may be stored in tanks or subterranean caves for later use. Gas turbines or fuel cells may turn stored hydrogen into power when needed. Florian Klumpp [
47] highlighted that by 2030, hydrogen storage will clearly be the most favorable technology for all storage-discharge routes. The features described above are the main reasons for the continued popularity of integrating hydrogen-based energy storage in HRESs.
The hydrogen-based hybrid renewable energy systems (HRESs) literature primarily focusses on optimal design-related research. These studies aim to establish the optimal number or size of system components that satisfy all constraints and either minimize or maximize the objective function(s). Conducting an exhaustive review of all research undertaken on this topic is beyond the scope of this article. For example, we will highlight a few studies, including the study by Zhang et al. [
48], which focused on the optimal sizing of a standalone solar/wind/hydrogen hybrid energy system in Khorasan, Iran. The study employed a hybrid search optimization technique to minimize the total life cycle cost of the HRES while considering the system's reliability. The findings demonstrated that the suggested technique outperformed previous methods in terms of performance. Using the GRHYSO software, Rodolfo et al. [
49] designed and conducted a techno-economic study of grid-connected hybrid photovoltaic/wind systems for intermittent hydrogen generation. They considered the net present value (NPV) of the system as an evaluation criterion and established that in locations with high wind speed, the selling price of hydrogen should be about 10 €/kg to make economically feasible systems. Pablo et al. [
50] applied a fuzzy logic-based energy management system (EMS) to optimize a standalone hybrid system that combines solar, wind, hydrogen, and battery technologies. The study spanned 25 years and demonstrated that the proposed control system successfully achieved the objectives set for the HRES's EMS. Furthermore, it resulted in a significant 13% cost reduction compared to other less advanced EMS systems based on control states. Akyuz et al. [
51] studied a hybrid wind (10 kW)-photovoltaic (1 kWc) system designed for a partridge farm with an average energy consumption of 20.33 kWh/day. The study evaluated performance, energy efficiency, and hydrogen production from excess energy. The results showed a state of charge ranging from 56.6% to 88.3% from April to July, with hydrogen production of 14.4 kg in July. The electrolyzer efficiency varied from 64% to 70%, the wind-electrolyzer system efficiency from 5% to 14%, and the photovoltaic-electrolyzer system efficiency from 7.9% to 8.5%.
Torreglosa et al. [
52] introduced an innovative approach for energy dispatching in off-grid photovoltaic/wind turbine/hydrogen/battery hybrid systems in Algeciras, Spain. The technique was based on Model Predictive Control (MPC), and MATLAB-Simulink was used to model the HRESs, including information from datasheets of commercially available components. Alonso et al. [
53] employed the HOMER (Hybrid Optimization Model for Electric Renewable) software to assess three energy storage technology setups: the battery energy storage system (BESS), the hydrogen energy storage system (H2ESS), and the hybrid energy storage system (HESS) in both grid-connected and off-grid scenarios. The findings indicated that BESS had the highest competitiveness among the three alternative storage methods when the electric grid was accessible. According to the study, hydrogen has a complementary function when used in conjunction with batteries, enhancing the flexibility of microgrids and facilitating more extensive decarbonization. Turkdogan et al. [
54] applied the HOMER software to model, simulate, and optimize an HRES consisting of solar, wind, hydrogen, and battery components. This HRES was designed to fulfil a single-family household's energy requirements, including utility and transportation loads. The results indicated that the most efficient system could produce energy and hydrogen at
$0.685 per kilowatt-hour and
$6.85 per kilogram, respectively. The study by Basu et al. [
55] broadly examined the intermittent characteristics of renewable energy sources through hydrogen energy storage. Three energy system combinations were investigated: a hybrid system that combines solar and hydrogen, a system that combines wind and hydrogen, and a system that combines solar, wind, and hydrogen. The hybrid system was determined to have the most cost-effective levelized cost of energy (LCOE) at
$0.3387 per kilowatt-hour (kWh).
The research conducted by Ramin et al. [
56] applied a computer program to model and optimize HRESs that integrate wind turbines (WT), photovoltaic systems (PV), and fuel cells (FC) in four distinct sites in Iran. The study revealed that hydrogen-based hybrid renewable energy systems (HRESs) are more economically viable for off-grid applications in most locations nationwide. Jahangir et al. [
57] employed the HOMER software to conduct an economic assessment of substituting conventional diesel-only backup systems with a hydrogen-only system and a hybrid hydrogen and diesel backup system in hybrid photovoltaic/wind systems. The findings indicated that the integrated diesel/hydrogen backup system has advantages in terms of cost-effectiveness and environmental impact. Rodolfo et al. [
58] deployed a multi-objective evolutionary algorithm (MOEA) and a genetic algorithm (GA) to achieve the optimal design of a hybrid renewable energy system (HRES) that incorporates solar, wind, diesel, hydrogen, and battery components. The objective was to minimize the total cost, pollutant emissions (CO
2) (specifically CO
2), and unmet load. The researchers concluded that the multi-objective design technique was superior to mono-objective approaches because it enables the designer to choose the optimal solution based on cost, reliability, and pollution emissions. Askarzadeh et al. [
59] adopted the multi-objective Crow search algorithm (MOCSA) to optimise a grid-connected photovoltaic/diesel/fuel-cell hybrid energy system. The optimization process focused on three primary objectives: levelized cost of energy (LCOE), loss of power supply probability (LPSP), and renewability. The analysis determined that the hybrid system could sell and purchase energy from the grid. Caliskan et al. [
60] conducted a study using the HOMER software to simulate and optimize a hybrid system (solar and wind energy) to evaluate its technical and economic viability in Elazig, Turkey. The study's conclusions revealed that a system combining wind and solar energy connected to the grid was economically viable and capable of meeting electricity and hydrogen needs. The system could produce 2,156,664 kWh of electricity yearly at a cost energy cost at
$0.0232/kWh and a total net present cost of
$7,668,500.
Table 1 provides a summary of all the research described above. This summary highlights that most research has been conducted in developed countries and rarely in developing nations, particularly in sub-Saharan Africa. Despite the high cost of hydrogen energy storage, significant cost reductions are expected, which bodes well for the future of this technology in sub-Saharan Africa.
Furthermore, none of these studies considered load demand in the agriculture sector. Most agricultural operations in sub-Saharan Africa occur in rural areas, where they serve as the primary means of sustenance, employing over 50% of the working population [
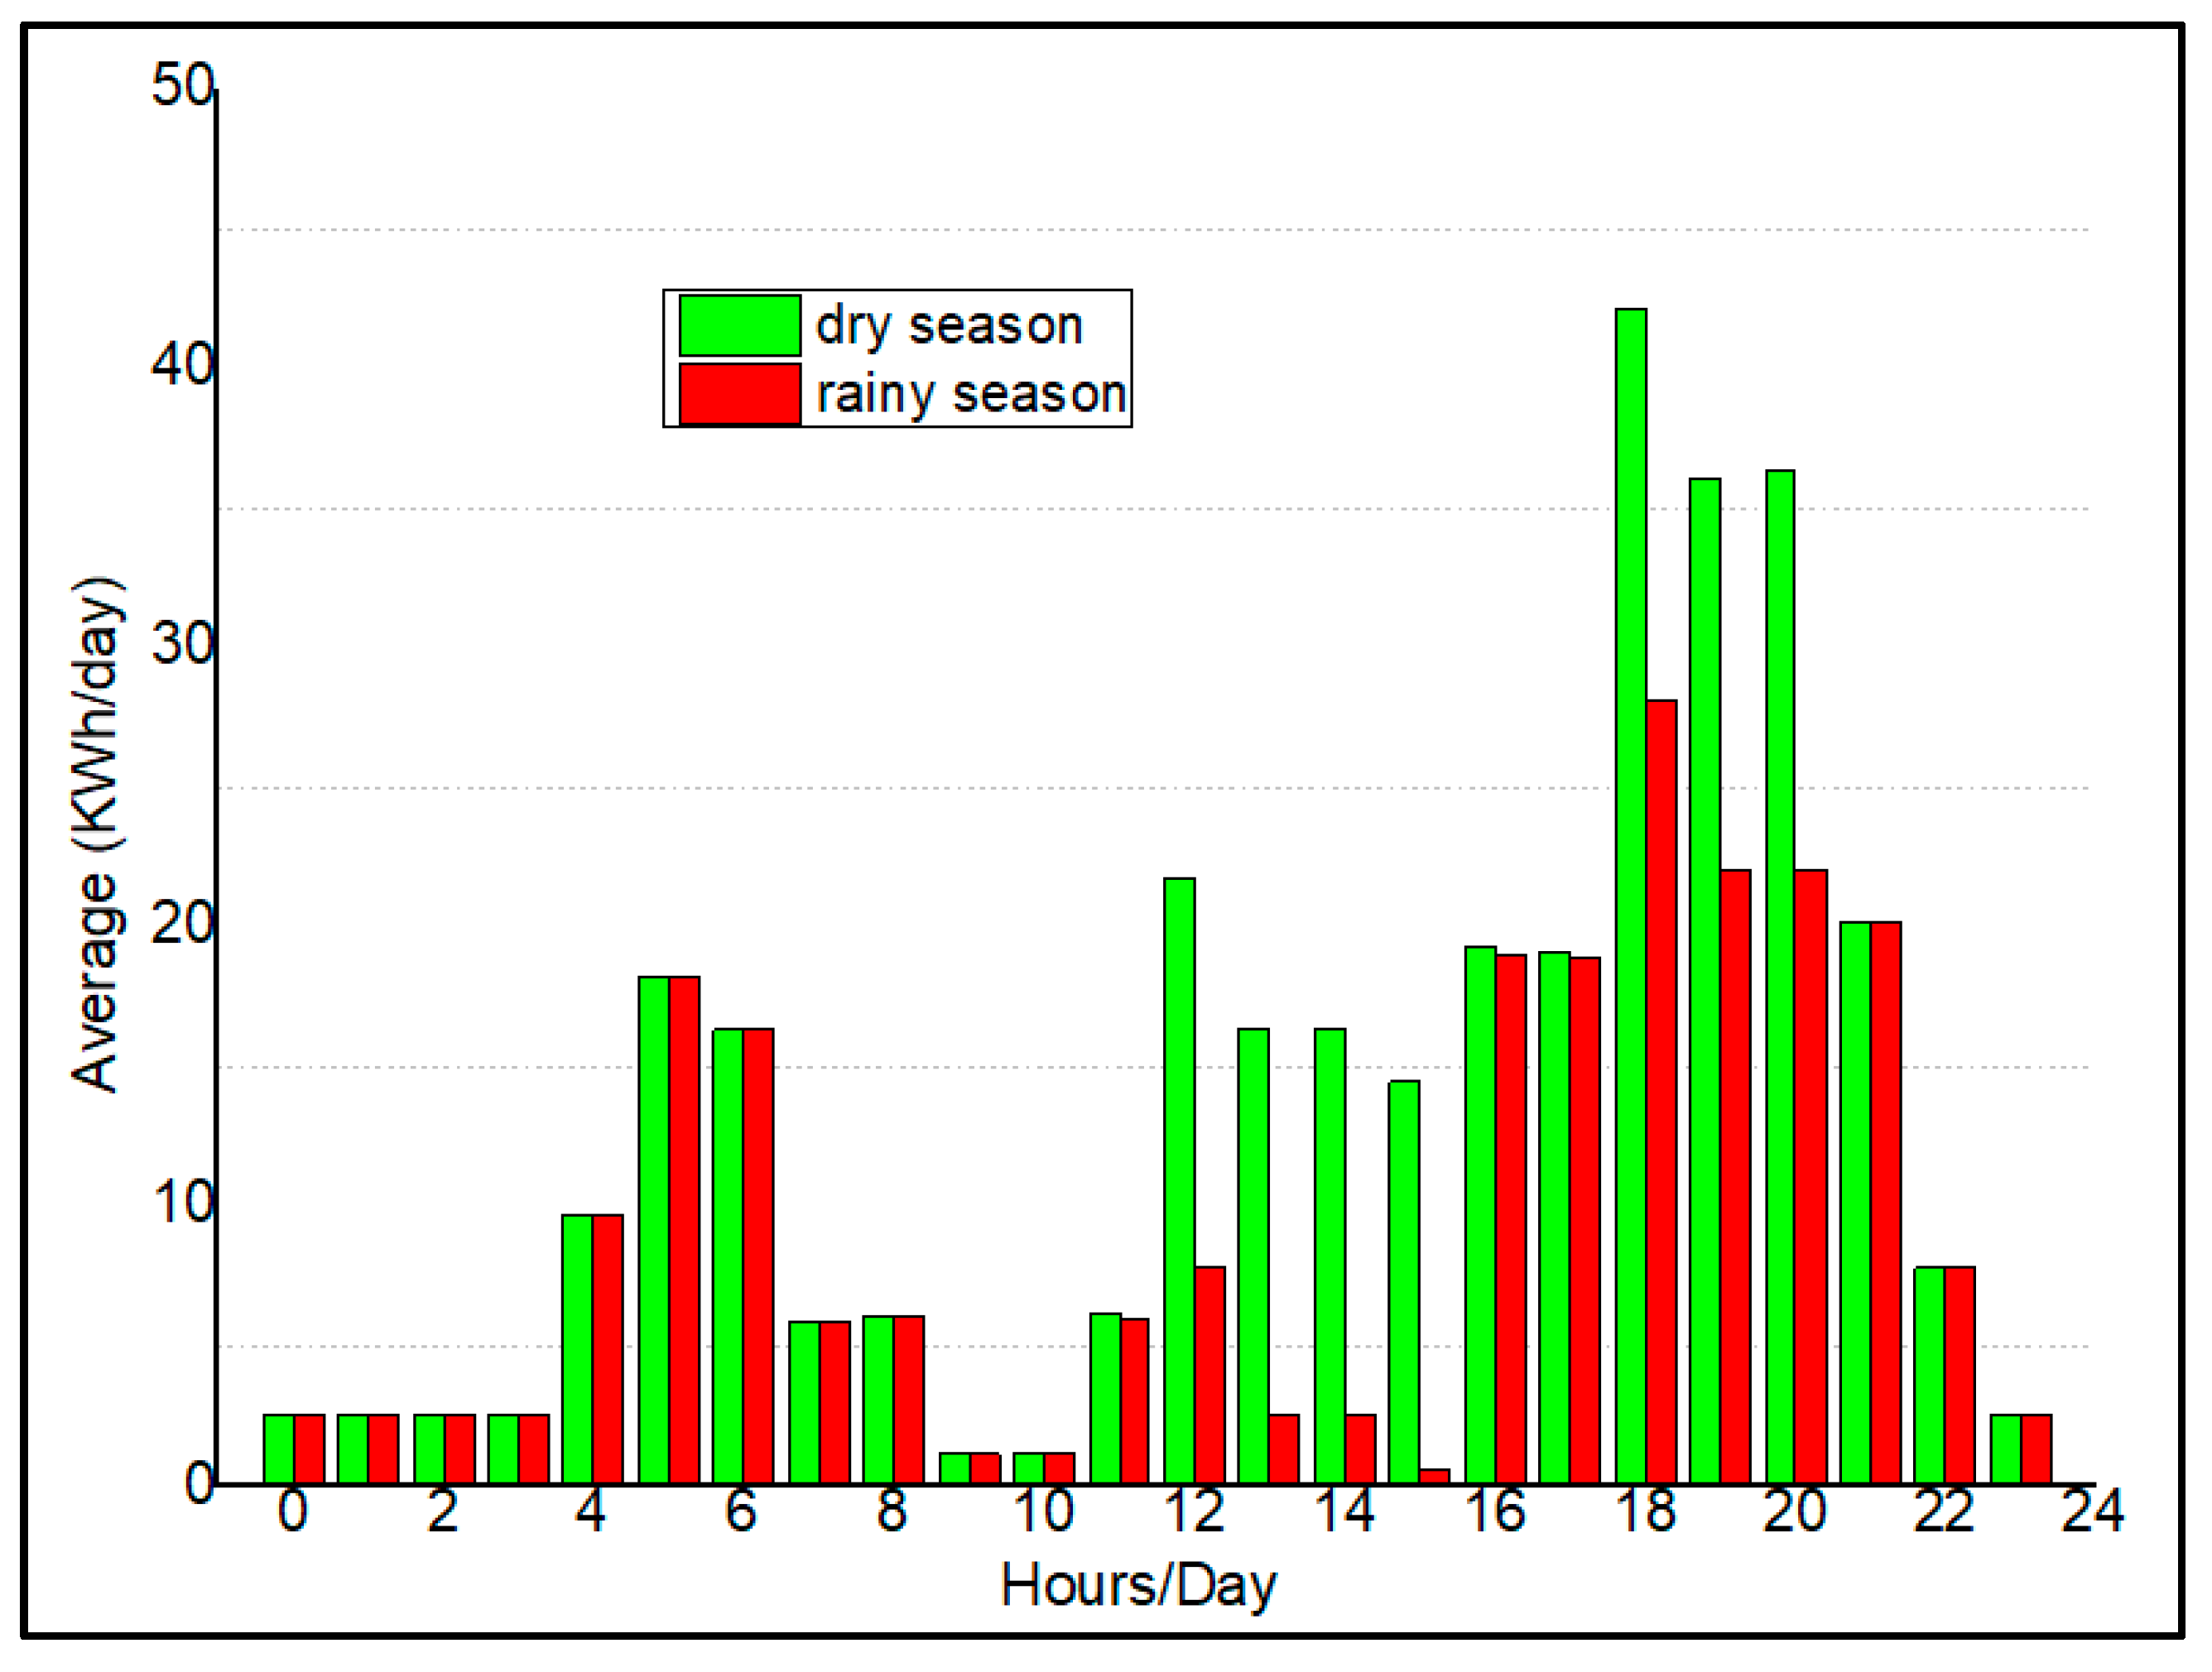
61]. On the other hand, these studies did not consider the seasonal variation in electricity demand. Most countries in the SSA experience two types of seasons: the rainy season and the dry season. Finally, most past research that performed sensitivity analysis failed to provide practical interpretations of their findings. These interpretations are essential for comprehending various aspects of hydrogen-based HRESs and guaranteeing their sustainable development to face rural electrification challenges in SSA.
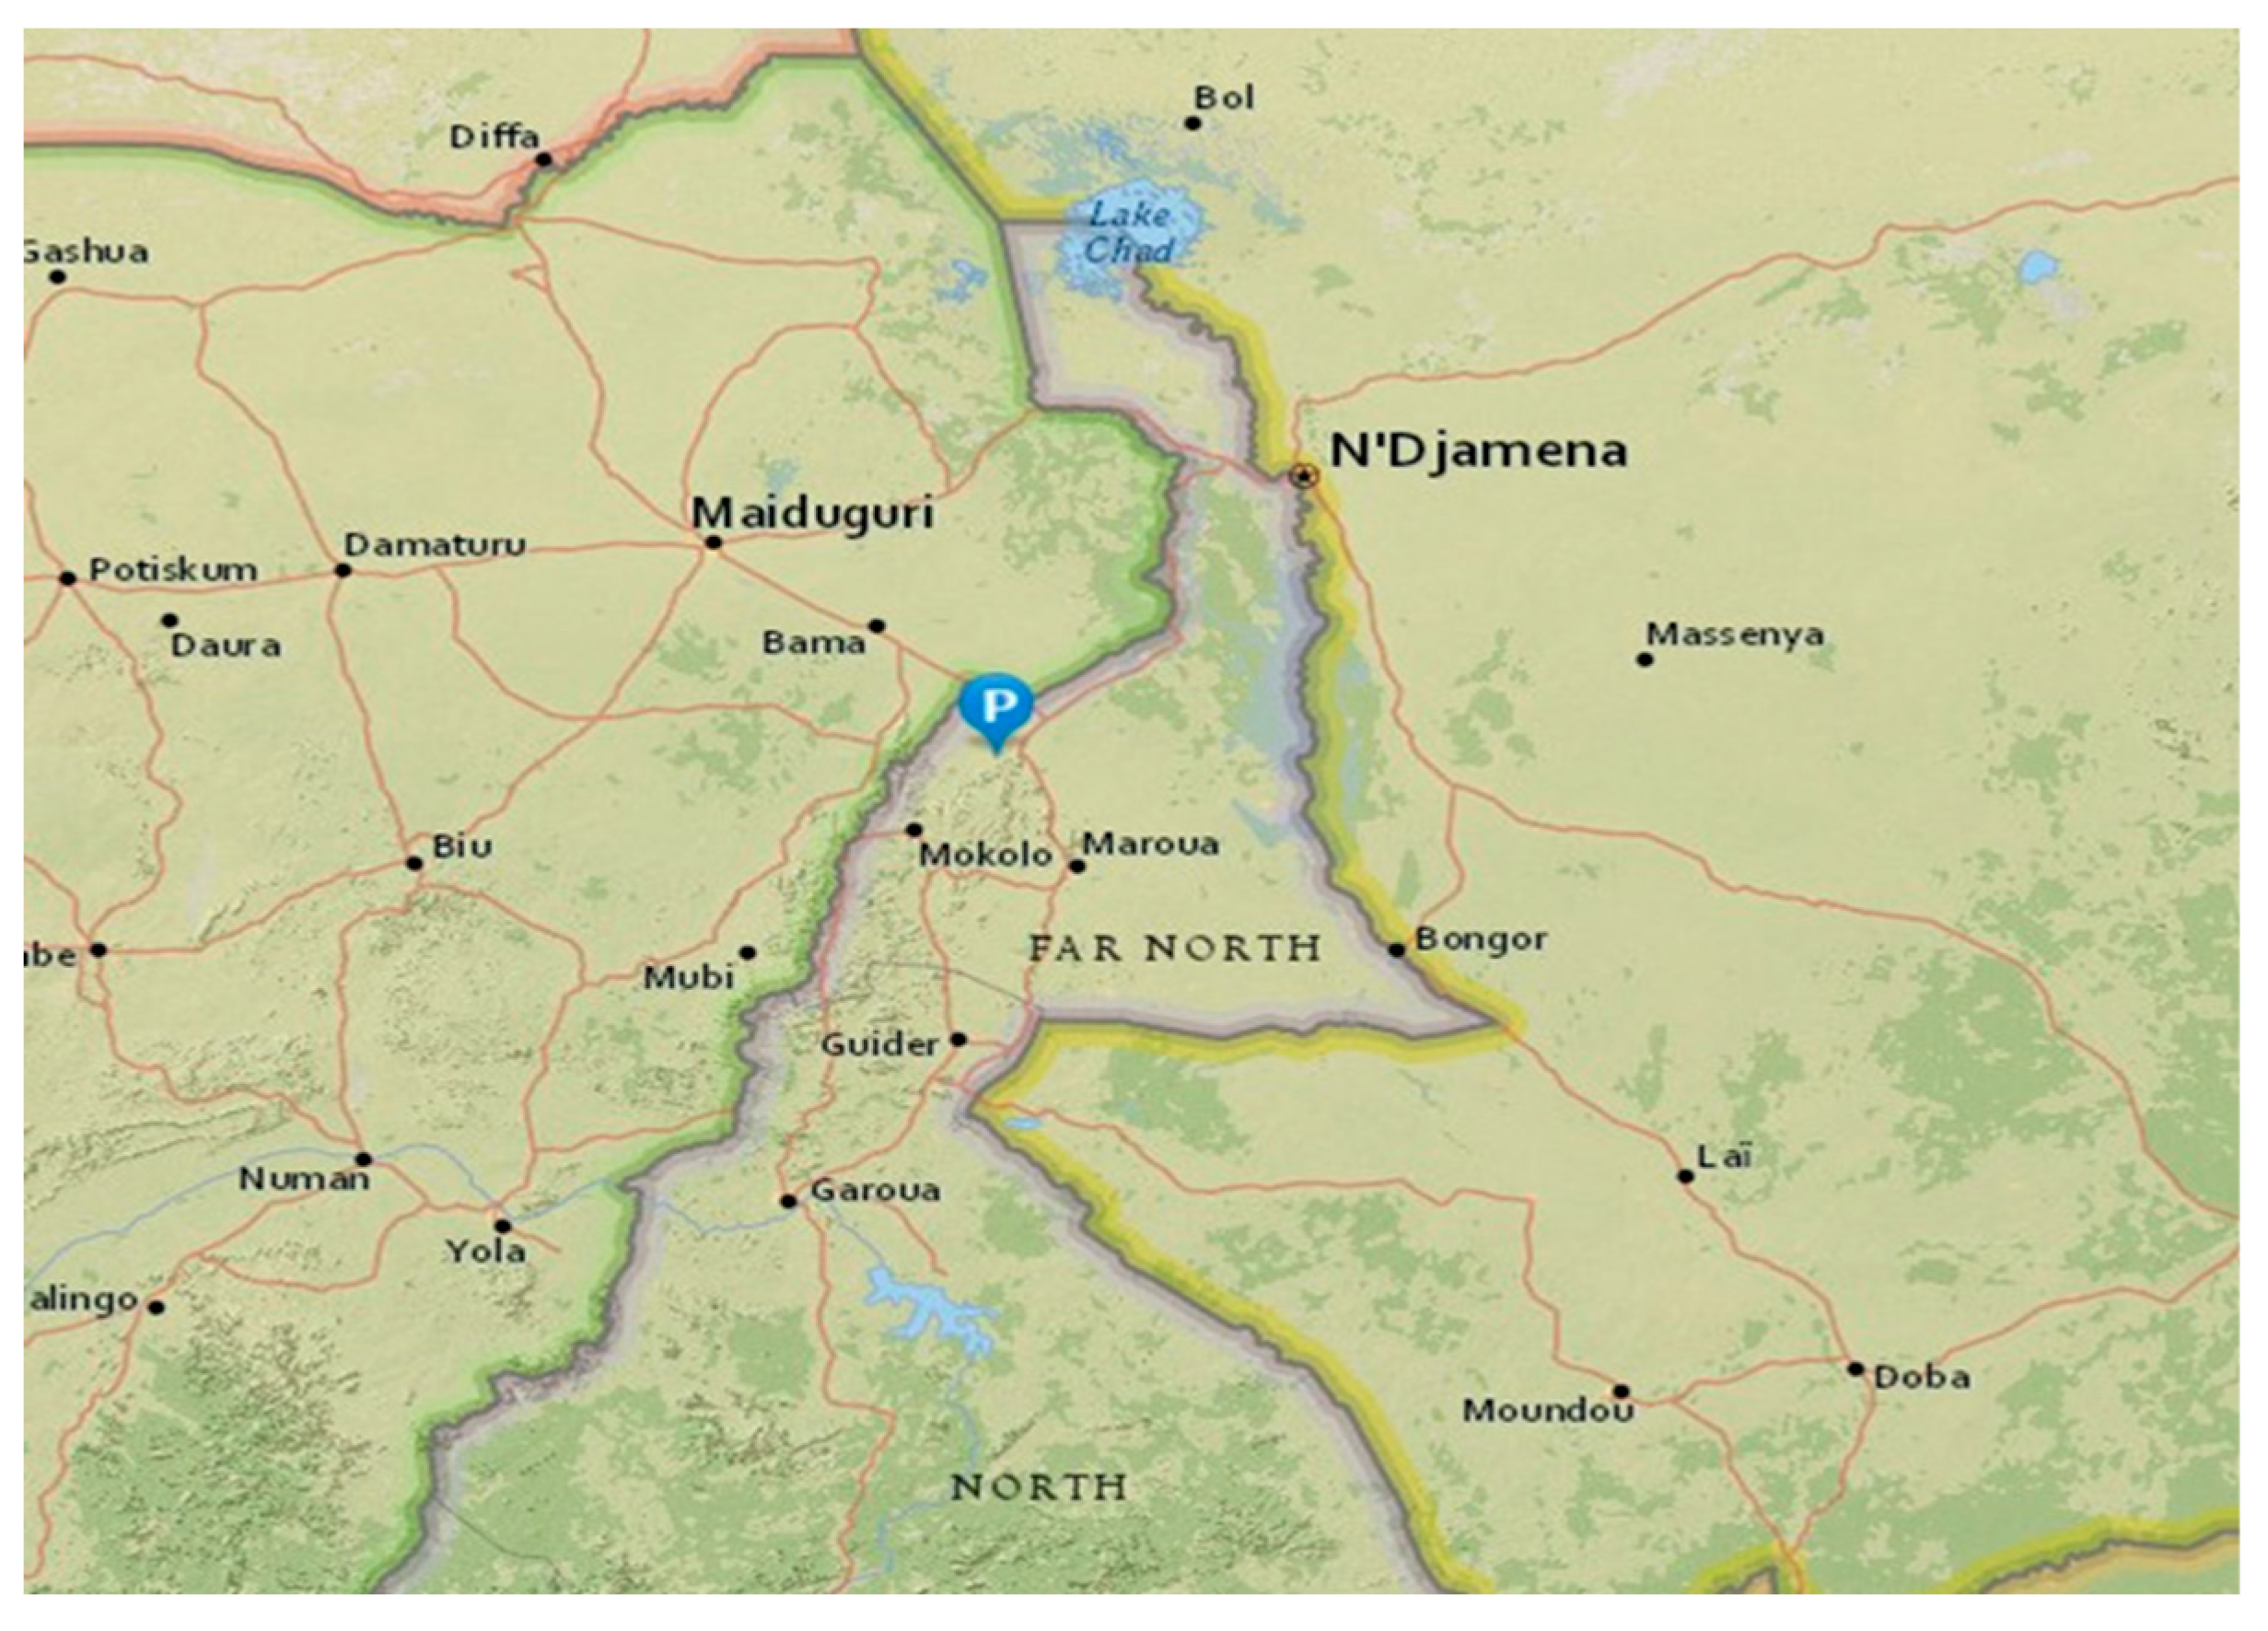
This research aims to fill the gaps found in the existing literature by applying HOMER software to optimize a photovoltaic/wind/hydrogen HRES to fulfil the power requirements of households, communities, companies, and agricultural operations in the remote area of Dargalla in the Far North region of Cameroon.
The rest of this paper is organized as follows:
Section 2 describes the materials and methods used to carry out the study.
Section 3 presents the acquired results, followed by
Section 4, which contains the discussion part.
Section 5 provides the paper's conclusion.
4. Discussion
The conclusions drawn from the previously presented analyses unequivocally demonstrate that the proposed system is capable of meeting the energy needs of an isolated village at a cost of energy (LCOE) lower than those that employ a storage system other than hydrogen in sub-Saharan Africa [
90,
91,
92,
93,
94,
95]. Each case studied uses a battery system or a pumped hydroelectric storage (PHS) system as energy storage devices, thus highlighting the technical and economic superiority of hydrogen-based hybrid renewable energy systems compared to systems relying on batteries, PHS, or diesel generators. This confirms the hypothesis stated in the introductory section. Furthermore, unlike previous studies, the system evaluation was preceded by a thorough analysis of electricity demand, encompassing all electricity-consuming sectors, including agriculture, which is the primary employment sector in rural sub-Saharan Africa. This suggests a more authentic and credible assessment of load demand, thereby contributing to the literature on the applications of hybrid renewable energy systems (HRES) in sub-Saharan Africa.
Hydrogen is a fundamental element in the transition towards cleaner energy and the reduction of global carbon emissions. It provides a solution for storing and managing the intermittency of renewable energy sources, enabling more consistent and efficient use of these resources. As an energy carrier, hydrogen can be generated from various renewable sources, making it adaptable and suitable for diverse energy scenarios. Moreover, its use reduces greenhouse gas emissions, a crucial factor in combating climate change. This research stands out from other global studies in several aspects. For example, Zhang et al. [
48] conducted a study on the optimal sizing of an autonomous hybrid system combining solar, wind, and hydrogen, using weather forecasts and a hybrid search algorithm. However, they did not apply their research to a local context in sub-Saharan Africa, considering the specific seasonal climatic conditions and the energy needs of rural communities. The study by Torreglosa et al. [
52] on a hybrid renewable energy system based on a wind fuel cell/electrolyzer does not focus on a remote region as this study does, which adds a dimension of specific local and climatic adaptation not present in their work. This study specifically targets agricultural and rural communities in sub-Saharan Africa with a practical approach to rural electrification. Unlike Pablo et al. [
50], who studied the performance of a hybrid system to meet the energy demand of a livestock facility using renewable energy sources, this study is distinguished by its unique application context in a remote region of sub-Saharan Africa. It integrates local seasonal climatic variables and aims to meet the specific needs of rural and agricultural communities. Instead of following the approaches mentioned in previous studies, this research focuses on adapting energy solutions to African conditions. Offering a fresh perspective could potentially facilitate the broader adoption of this technology in similar regions.
In the scientific literature, several studies have conducted sensitivity analyses, including those by [
53], [
54], [
55], and [
59], although these studies present certain limitations. Alonso et al. [
53] evaluated various energy storage technologies in Belgium, considering different energy scenarios such as consumption, electricity tariffs, CO
2 taxation, and the evolution of hydrogen technology prices from 2019 to 2030. Turkdogan et al. [
54]conducted a sensitivity analysis on the cost of electricity and hydrogen in relation to the reduction in the costs of electrolyzers, photovoltaic panels, and wind turbines. Basu et al. [
55] studied three combinations of energy systems in India, focusing on the current cost of energy (LCOE), capital expenditures (CAPEX), and operational expenditures (OPEX). Finally, Askarzadeh et al. [
59] explored the optimal sizing and power exchange of a diesel-photovoltaic-fuel cell hybrid system in Iran, focusing on sale and purchase coefficients as well as the variation in the use of non-renewable energy sources.
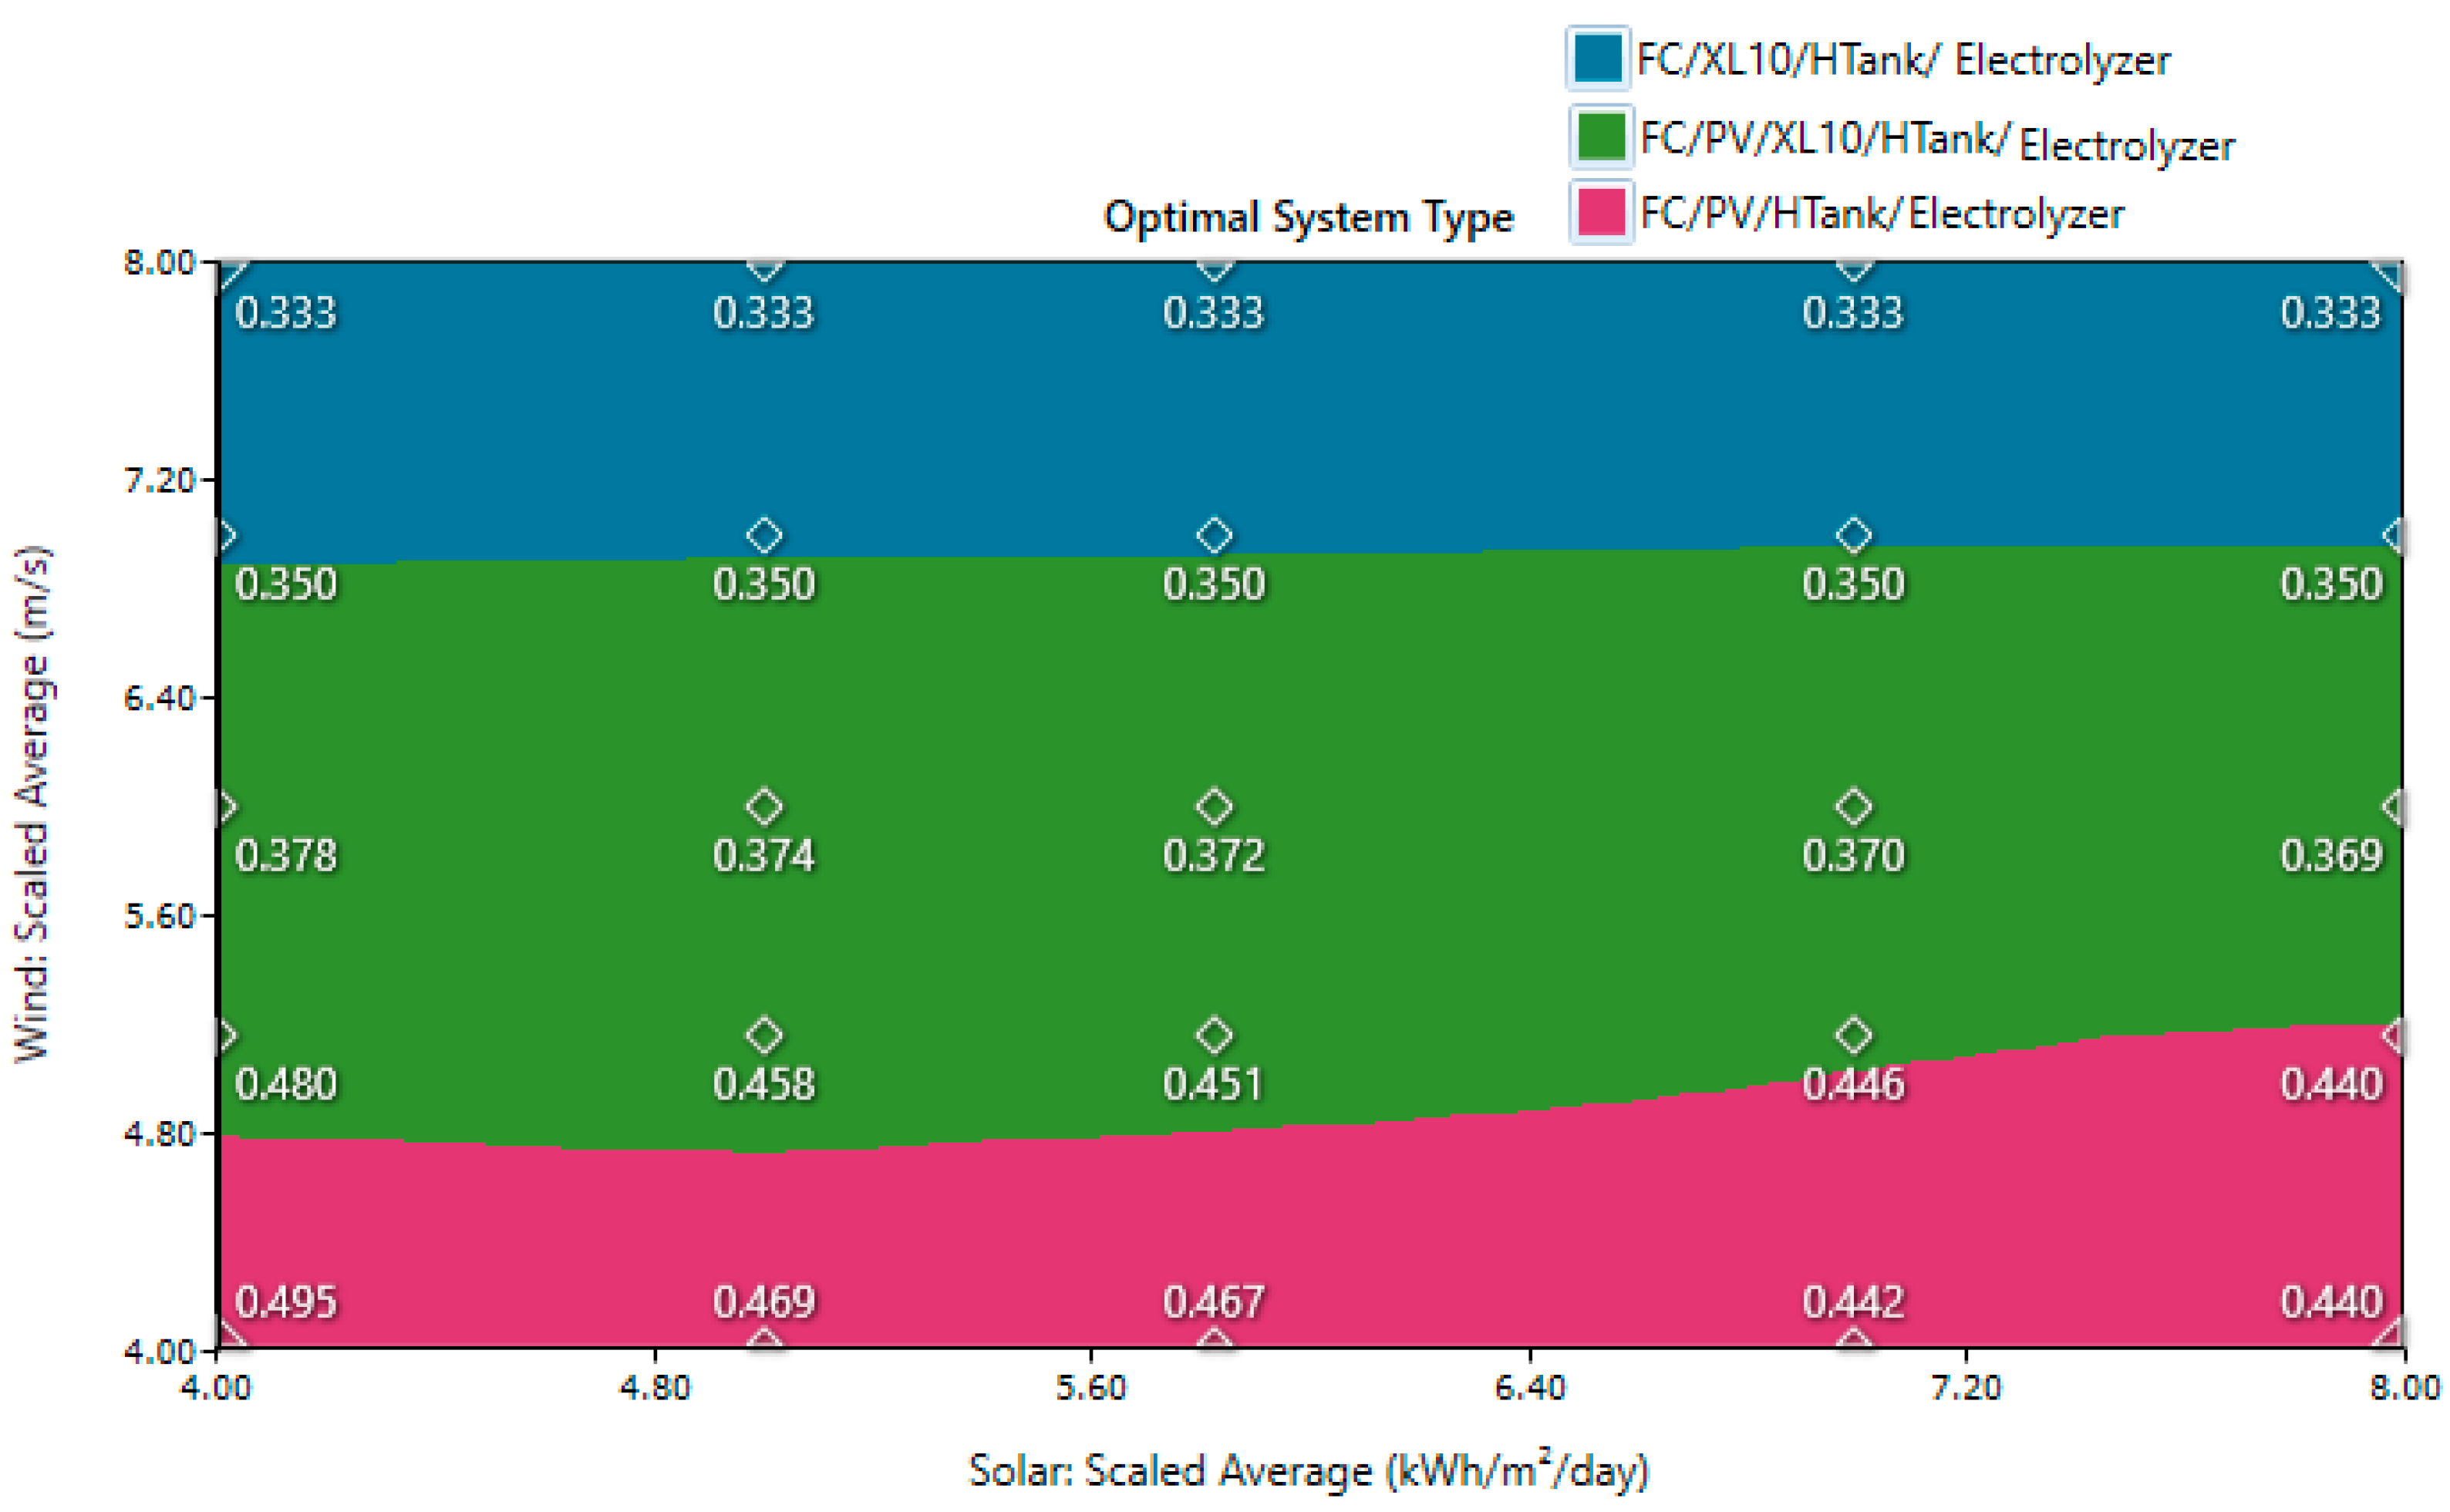
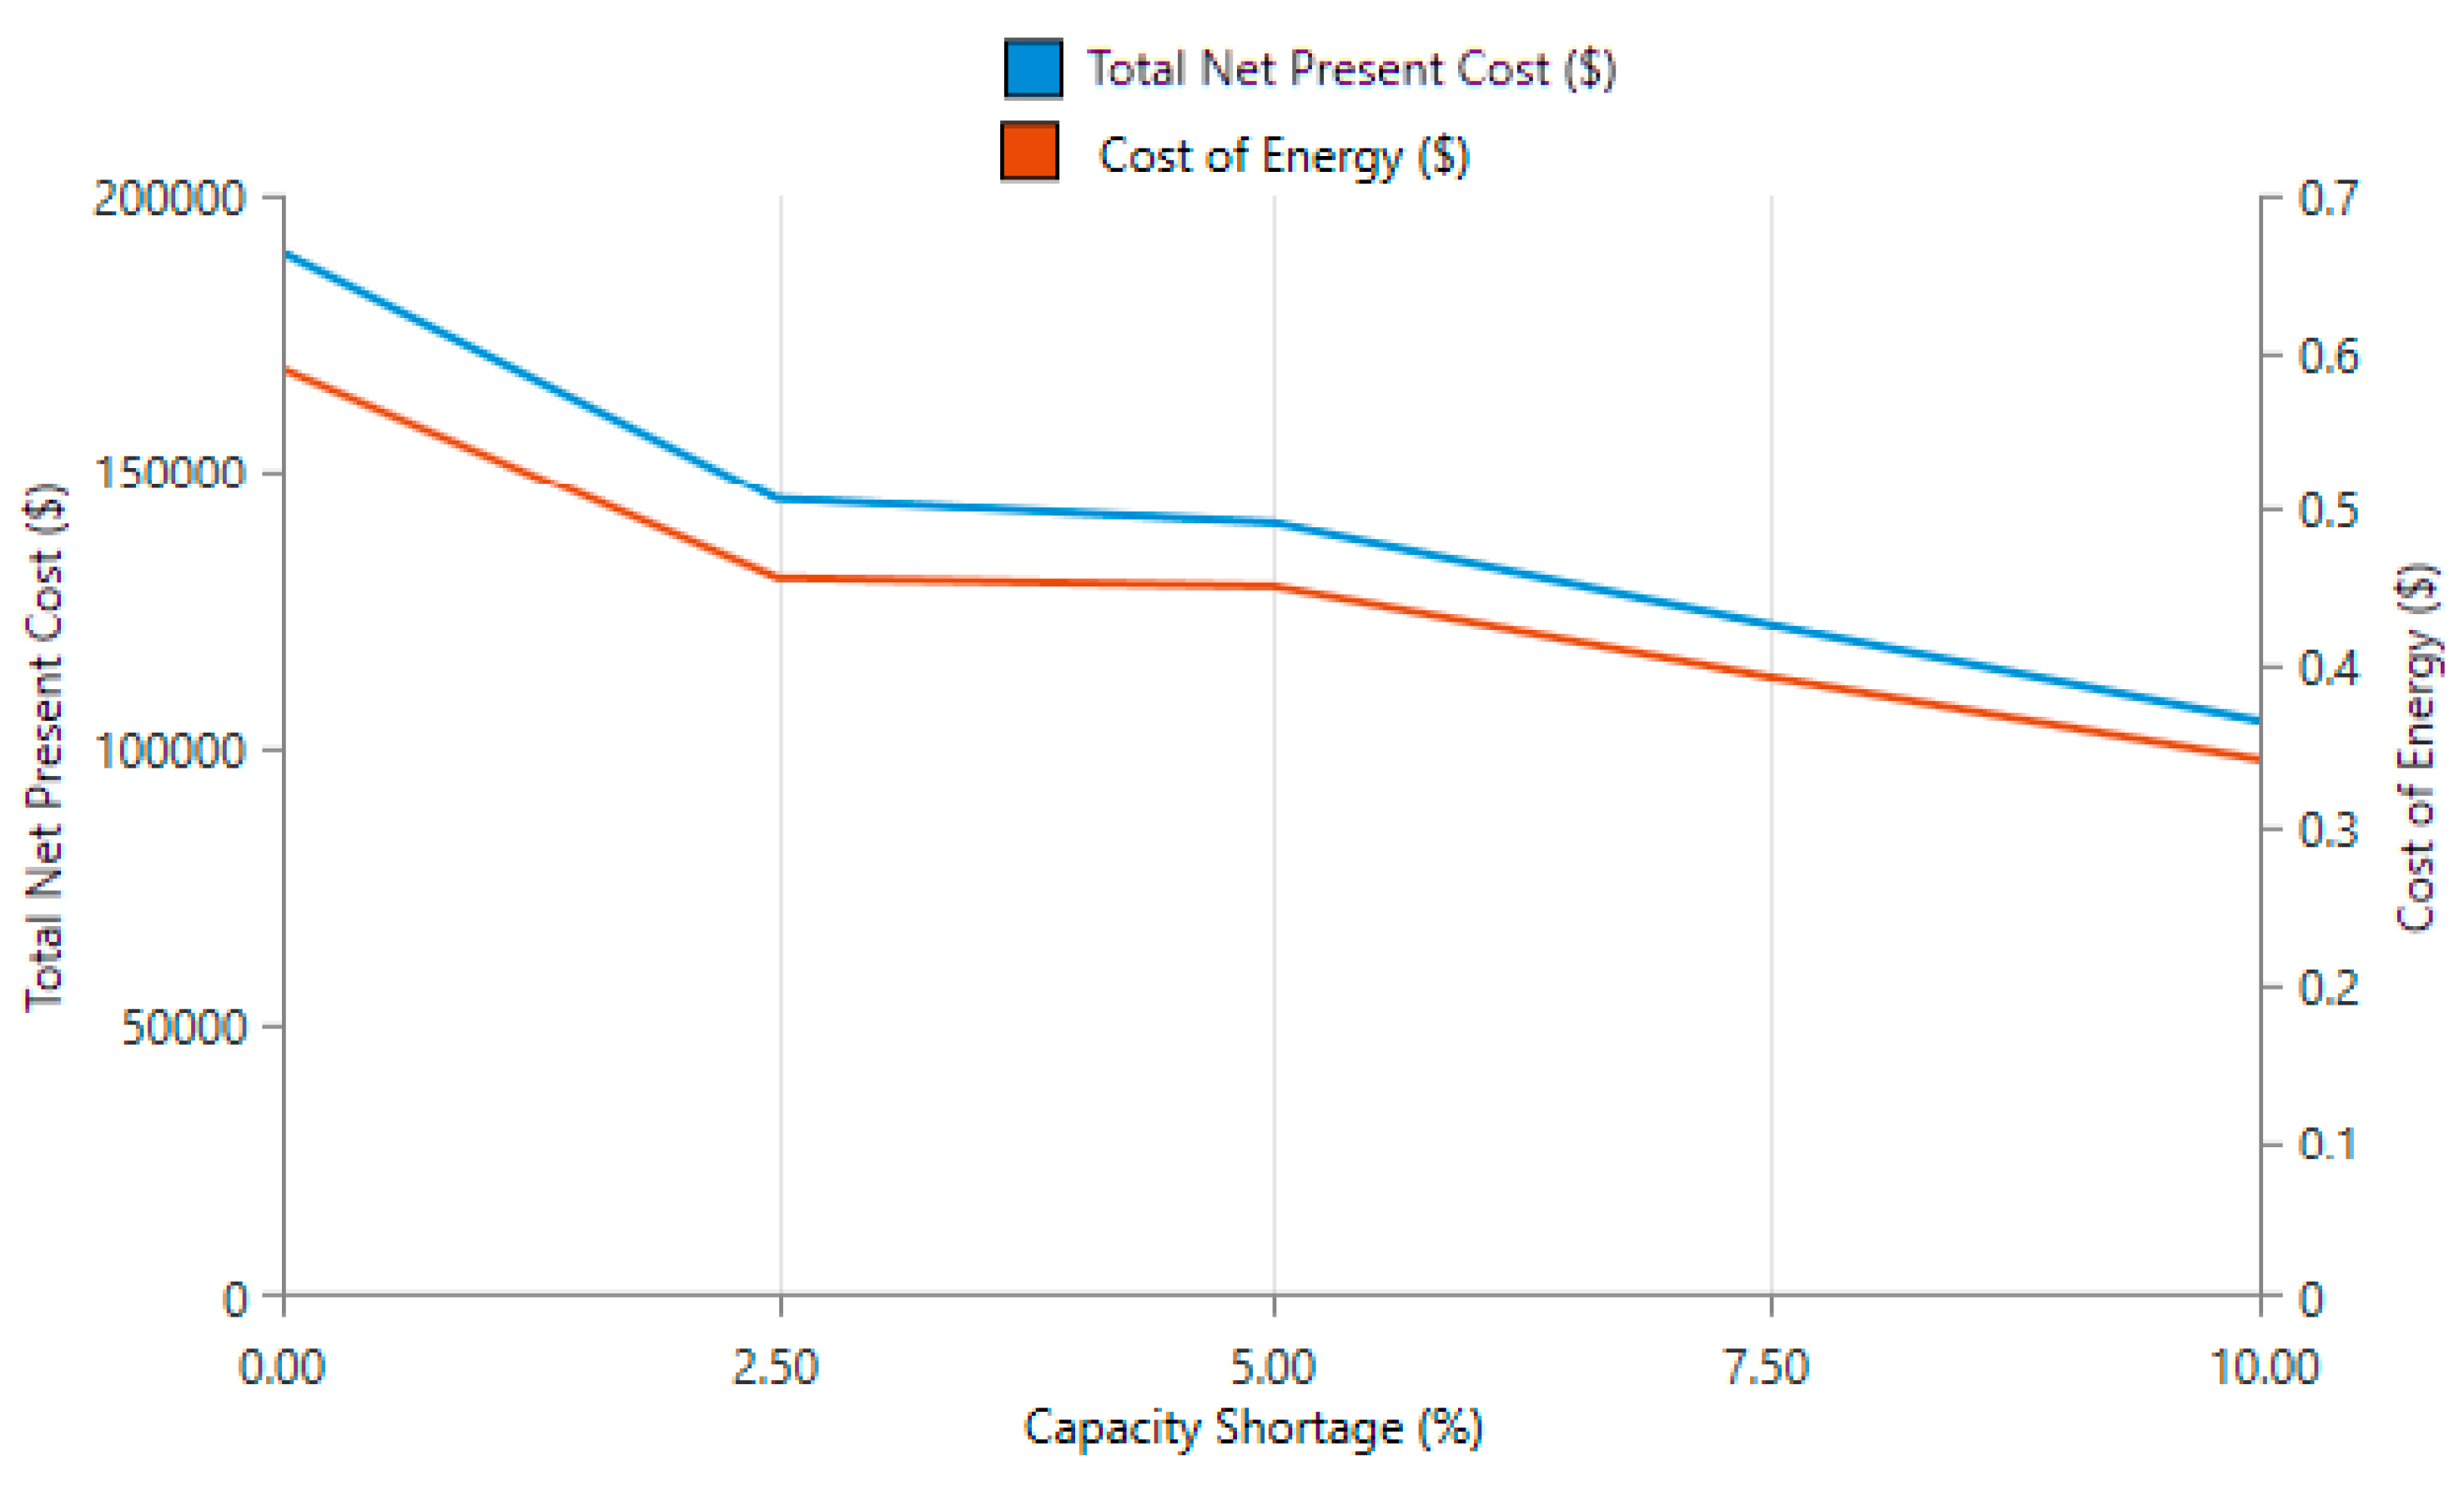
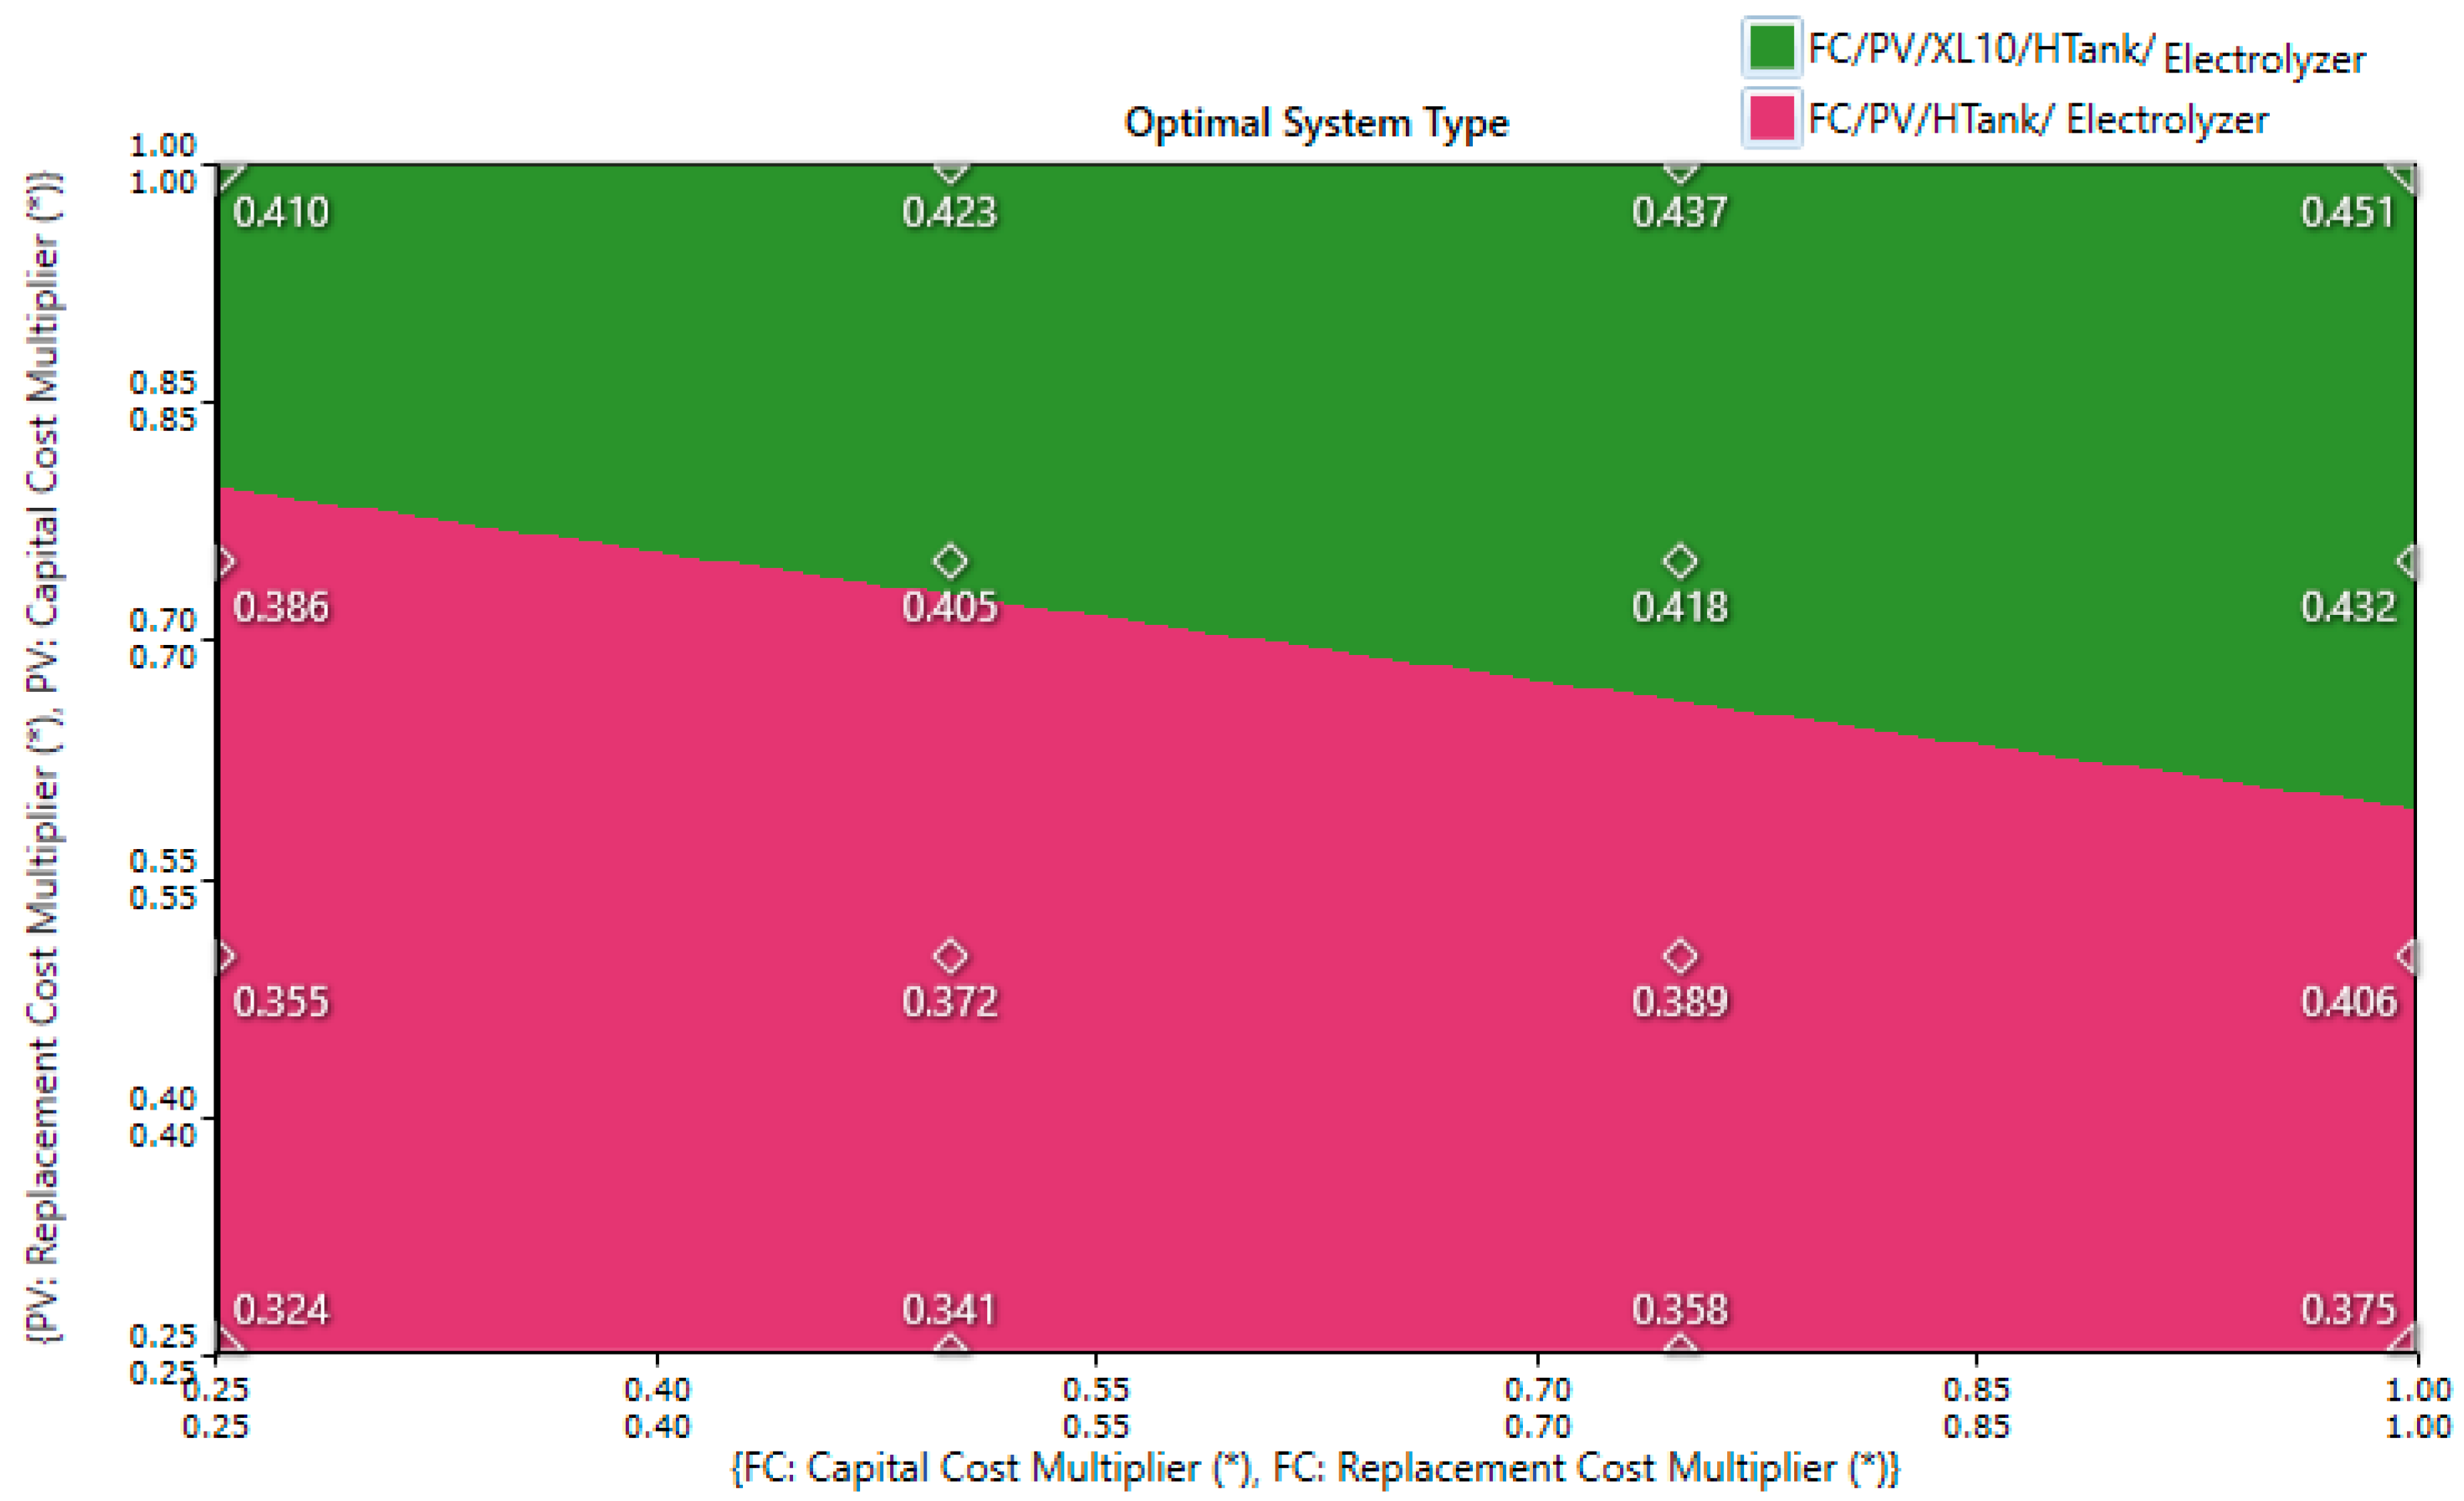
The second innovation of this research lies in its specific application to the sub-Saharan context, integrating local climatic conditions and the energy needs of rural and agricultural communities. Unlike other studies that mainly focus on urban or industrial contexts, this research examines the effects of variations in wind speed and solar radiation on the cost of energy. It also demonstrates that increased wind speed and solar radiation significantly reduce the cost of energy. It highlights the impact of capacity shortage tolerance on the total current cost and the cost of energy, showing that a certain tolerance (up to 5%) can minimize costs without significantly affecting system reliability. The study also illustrates the effect of variations in capital expenditures and replacement costs of photovoltaic systems and fuel cells on the optimal configuration of the hybrid system.
In this context, sensitivity analysis is crucial because it helps identify the most cost-effective and efficient energy system configurations, tailored to the specific conditions of sub-Saharan Africa. It also allows for the modeling and optimization of climate-based energy systems by taking local conditions into account, such as seasonal variations in wind speed and solar radiation. This facilitates the design of robust and reliable energy systems for rural areas, where access to electricity is limited, and fossil resources are often inaccessible or expensive. Sensitivity analysis contributes to minimizing energy costs by optimizing investments, making renewable energy solutions more accessible and sustainable for rural communities. By improving access to reliable and affordable energy, this analysis supports local economic development, reduces dependence on fossil fuels, and promotes more sustainable agricultural practices.
The introduction of electricity into a remote community like Dargalla transforms the daily lives of its residents. This project has had significant impacts on several aspects. In terms of economic development and health, electrification has encouraged the emergence of small businesses and income-generating activities such as sewing, welding, and the preservation of agricultural products [
96]. It has also increased agricultural productivity through the use of electrical equipment for irrigation and post-harvest processing [
97]. Additionally, the transition from kerosene to electric lighting has reduced indoor air pollution, contributing to a decrease in respiratory diseases [
98]. Agriculture is a major pillar of the rural economy in sub-Saharan Africa, and access to electricity is vital for agricultural activities. However, the lack of energy has been identified as the main obstacle to the productivity of the agricultural sector in sub-Saharan Africa, where only 2% of the final electricity consumption is dedicated to agriculture, compared to 18% in India [
99]. This initiative will also play a role in improving study conditions by providing better lighting for students, thus extending study hours and improving academic performance [
100]. Furthermore, it will facilitate access to information and educational resources through information and communication technologies [
101].
The electrification of Dargalla, a rural hamlet in sub-Saharan Africa, through hybrid systems with hydrogen storage presents notable advantages but also faces several hurdles. Overcoming these obstacles is crucial to ensure the success and sustainability of such projects. The installation of complex systems like hybrid microgrids, which require sophisticated integration of various energy sources and storage technologies (such as hydrogen), can present challenges in terms of maintenance and technical management [
102]. Additionally, the lack of appropriate policies and regulatory frameworks to support renewable energies and hydrogen storage technologies hinders the development and installation of these systems [
103]. The absence of adequate infrastructure to support the installation, operation, and maintenance of hydrogen storage systems and hybrid systems makes their implementation in remote areas difficult [
104]. Finally, the lack of sufficient funding and viable economic models for hydrogen storage projects in rural areas impedes their large-scale adoption [
105].
To address the limitations of this study, further research could focus on the long-term sustainability of hybrid systems with hydrogen storage, including the evaluation of component degradation and maintenance requirements over several years. Additional studies could also consider viable economic models and financing strategies to make hydrogen storage projects more accessible and sustainable in rural areas. This could highlight opportunities and challenges for the adoption of these technologies. It would also be relevant to compare the efficiency and economic viability of hybrid systems with hydrogen storage to other storage solutions such as batteries or pumped hydroelectric storage.
Figure 1.
Global population without access to electricity by country in 2019 [
9].
Figure 1.
Global population without access to electricity by country in 2019 [
9].
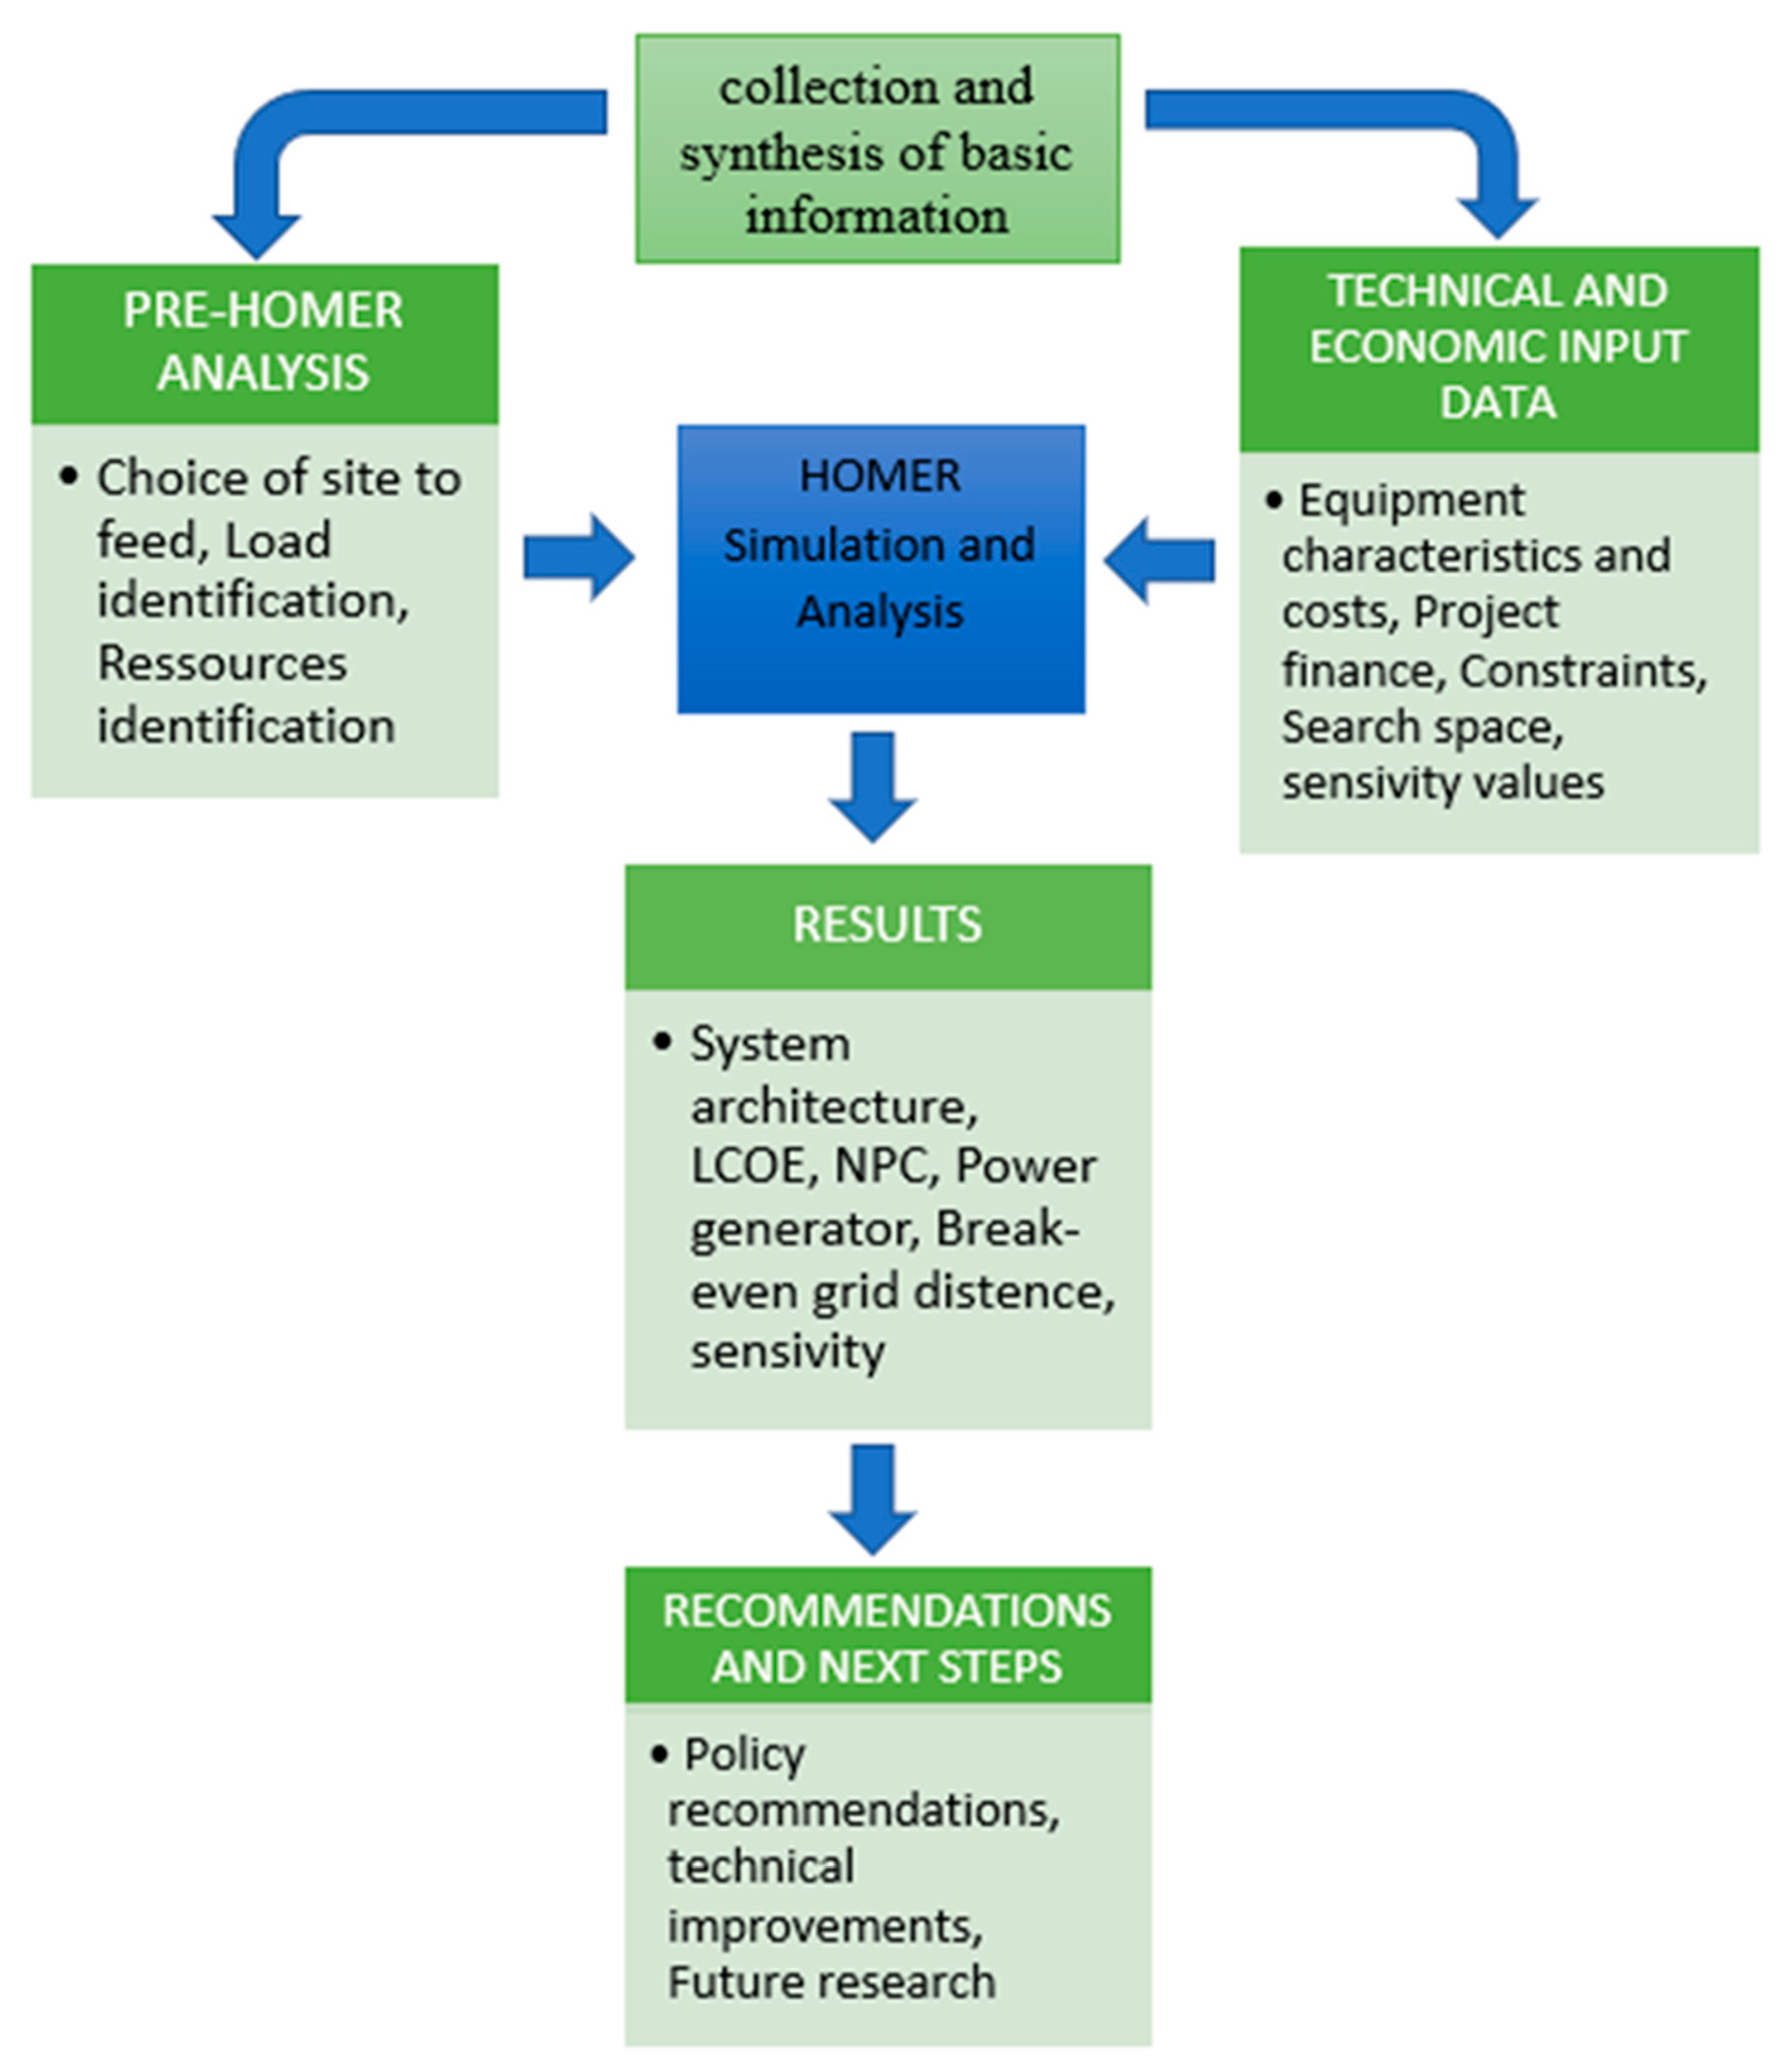
Figure 2.
Functional Diagram of the Research Methodology.
Figure 2.
Functional Diagram of the Research Methodology.
Figure 3.
Geographical Location of the Study Area.
Figure 3.
Geographical Location of the Study Area.
Figure 4.
Average electricity demand per hour of the day, during rainy and dry seasons.
Figure 4.
Average electricity demand per hour of the day, during rainy and dry seasons.
Figure 5.
The schematic diagram of the proposed HRES.
Figure 5.
The schematic diagram of the proposed HRES.
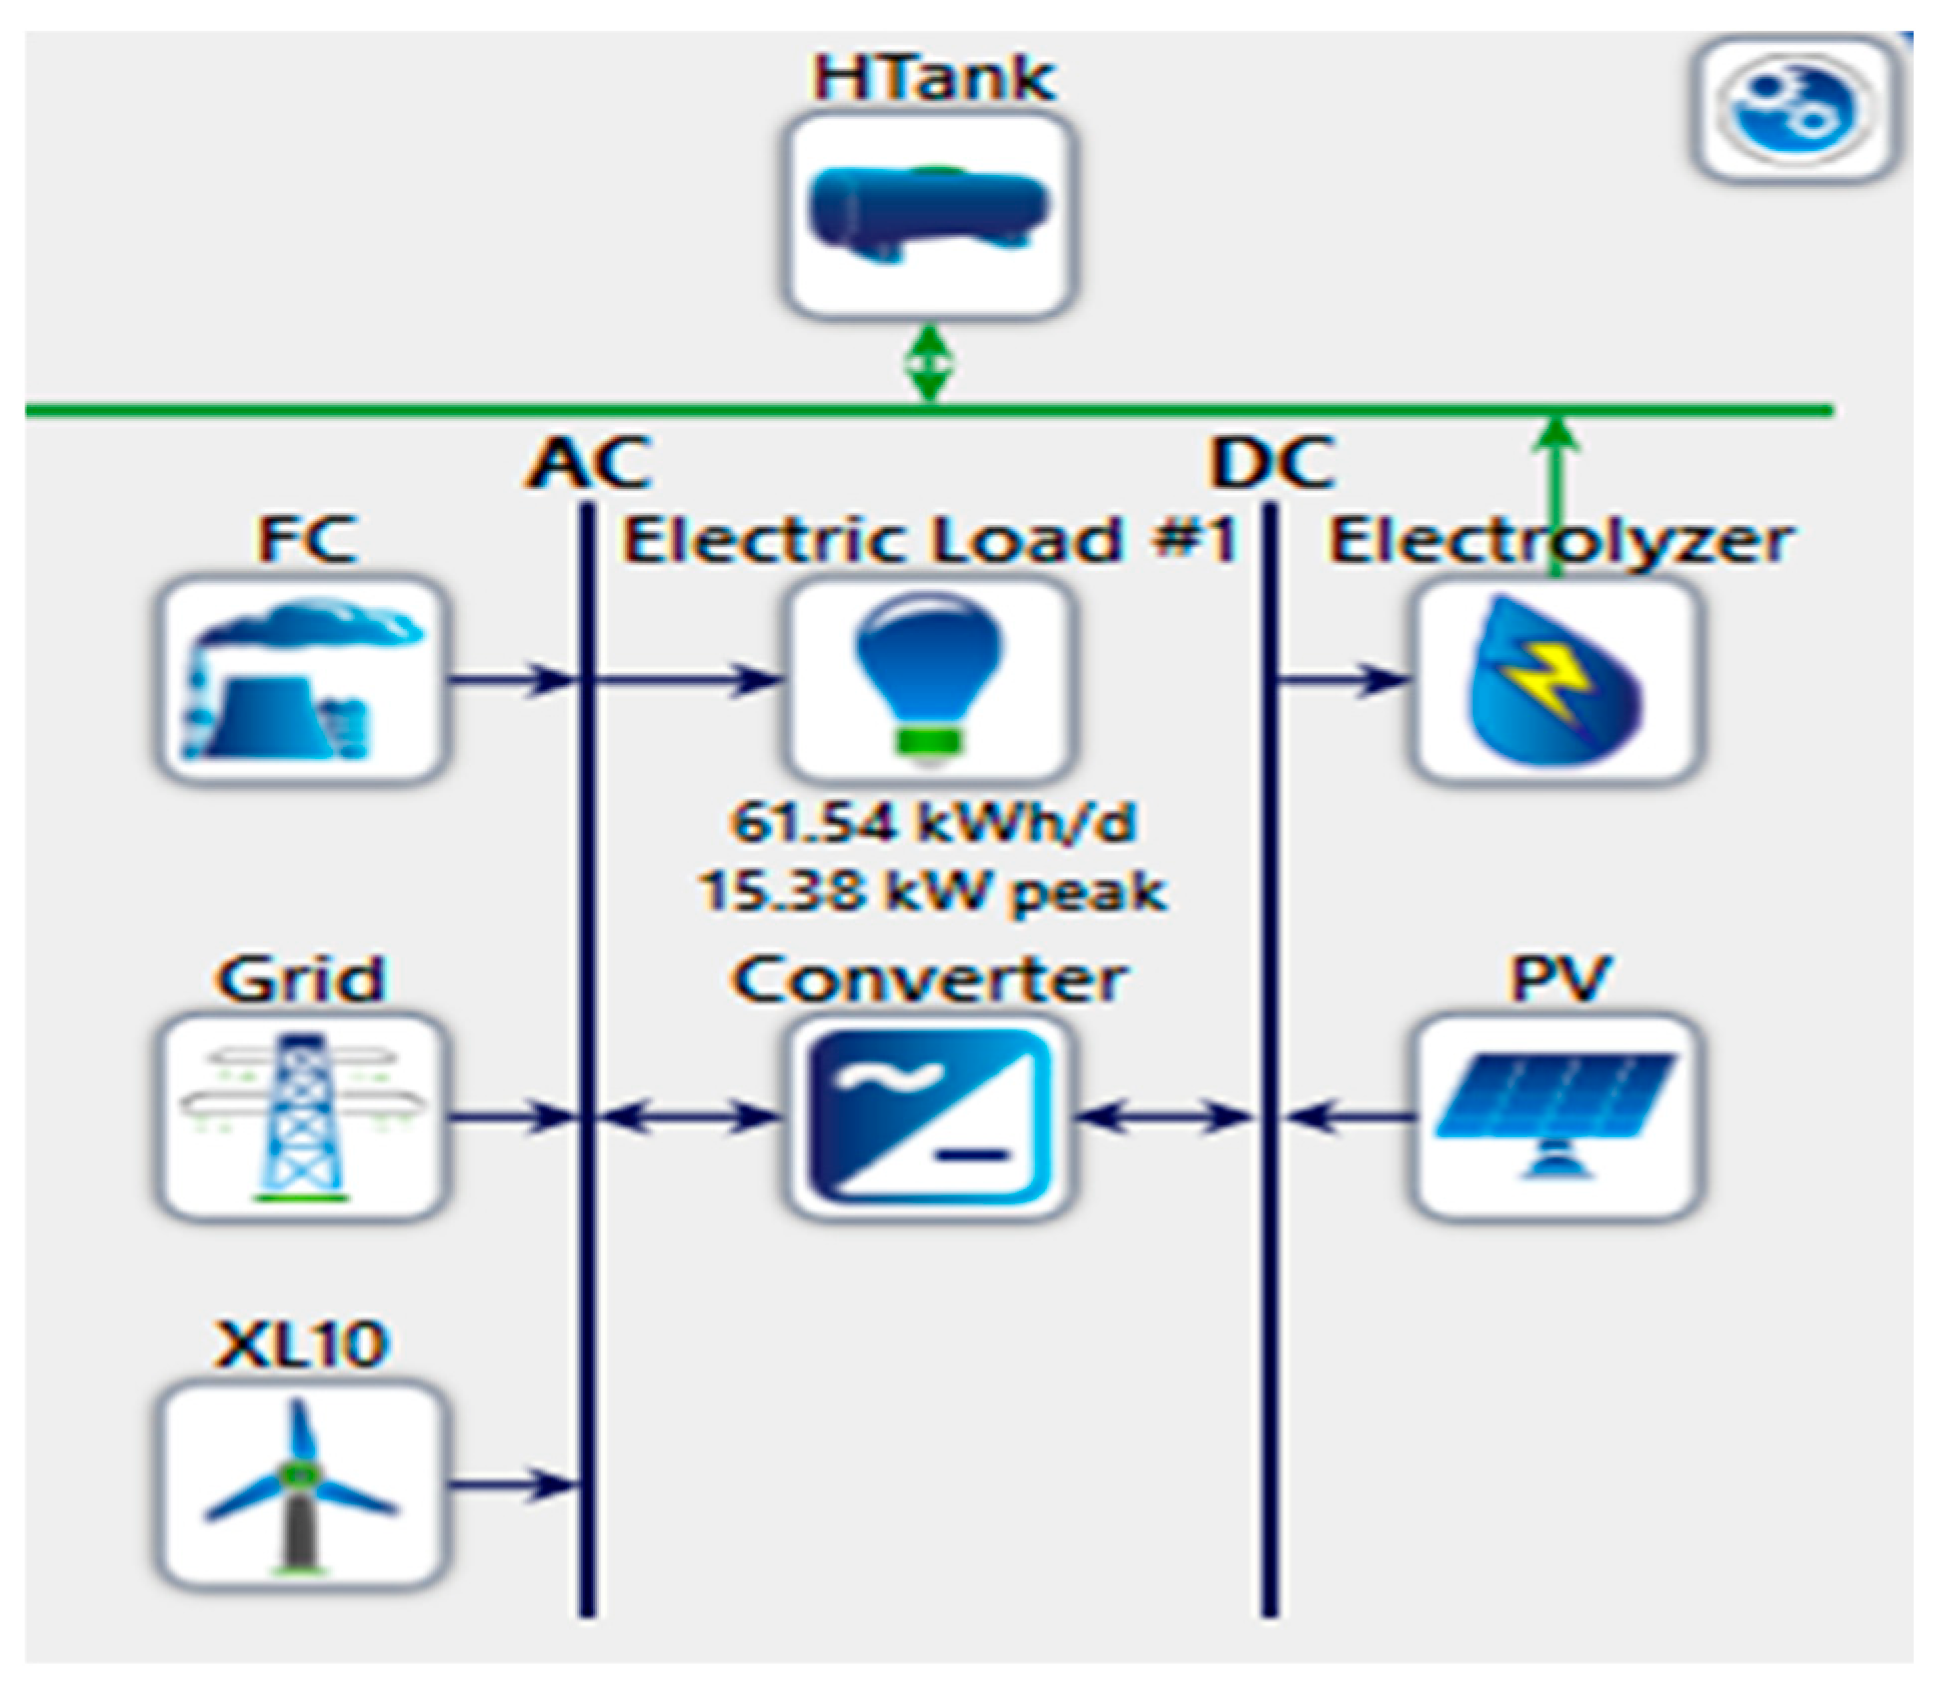
Figure 6.
The proposed HRES in HOMER software.
Figure 6.
The proposed HRES in HOMER software.
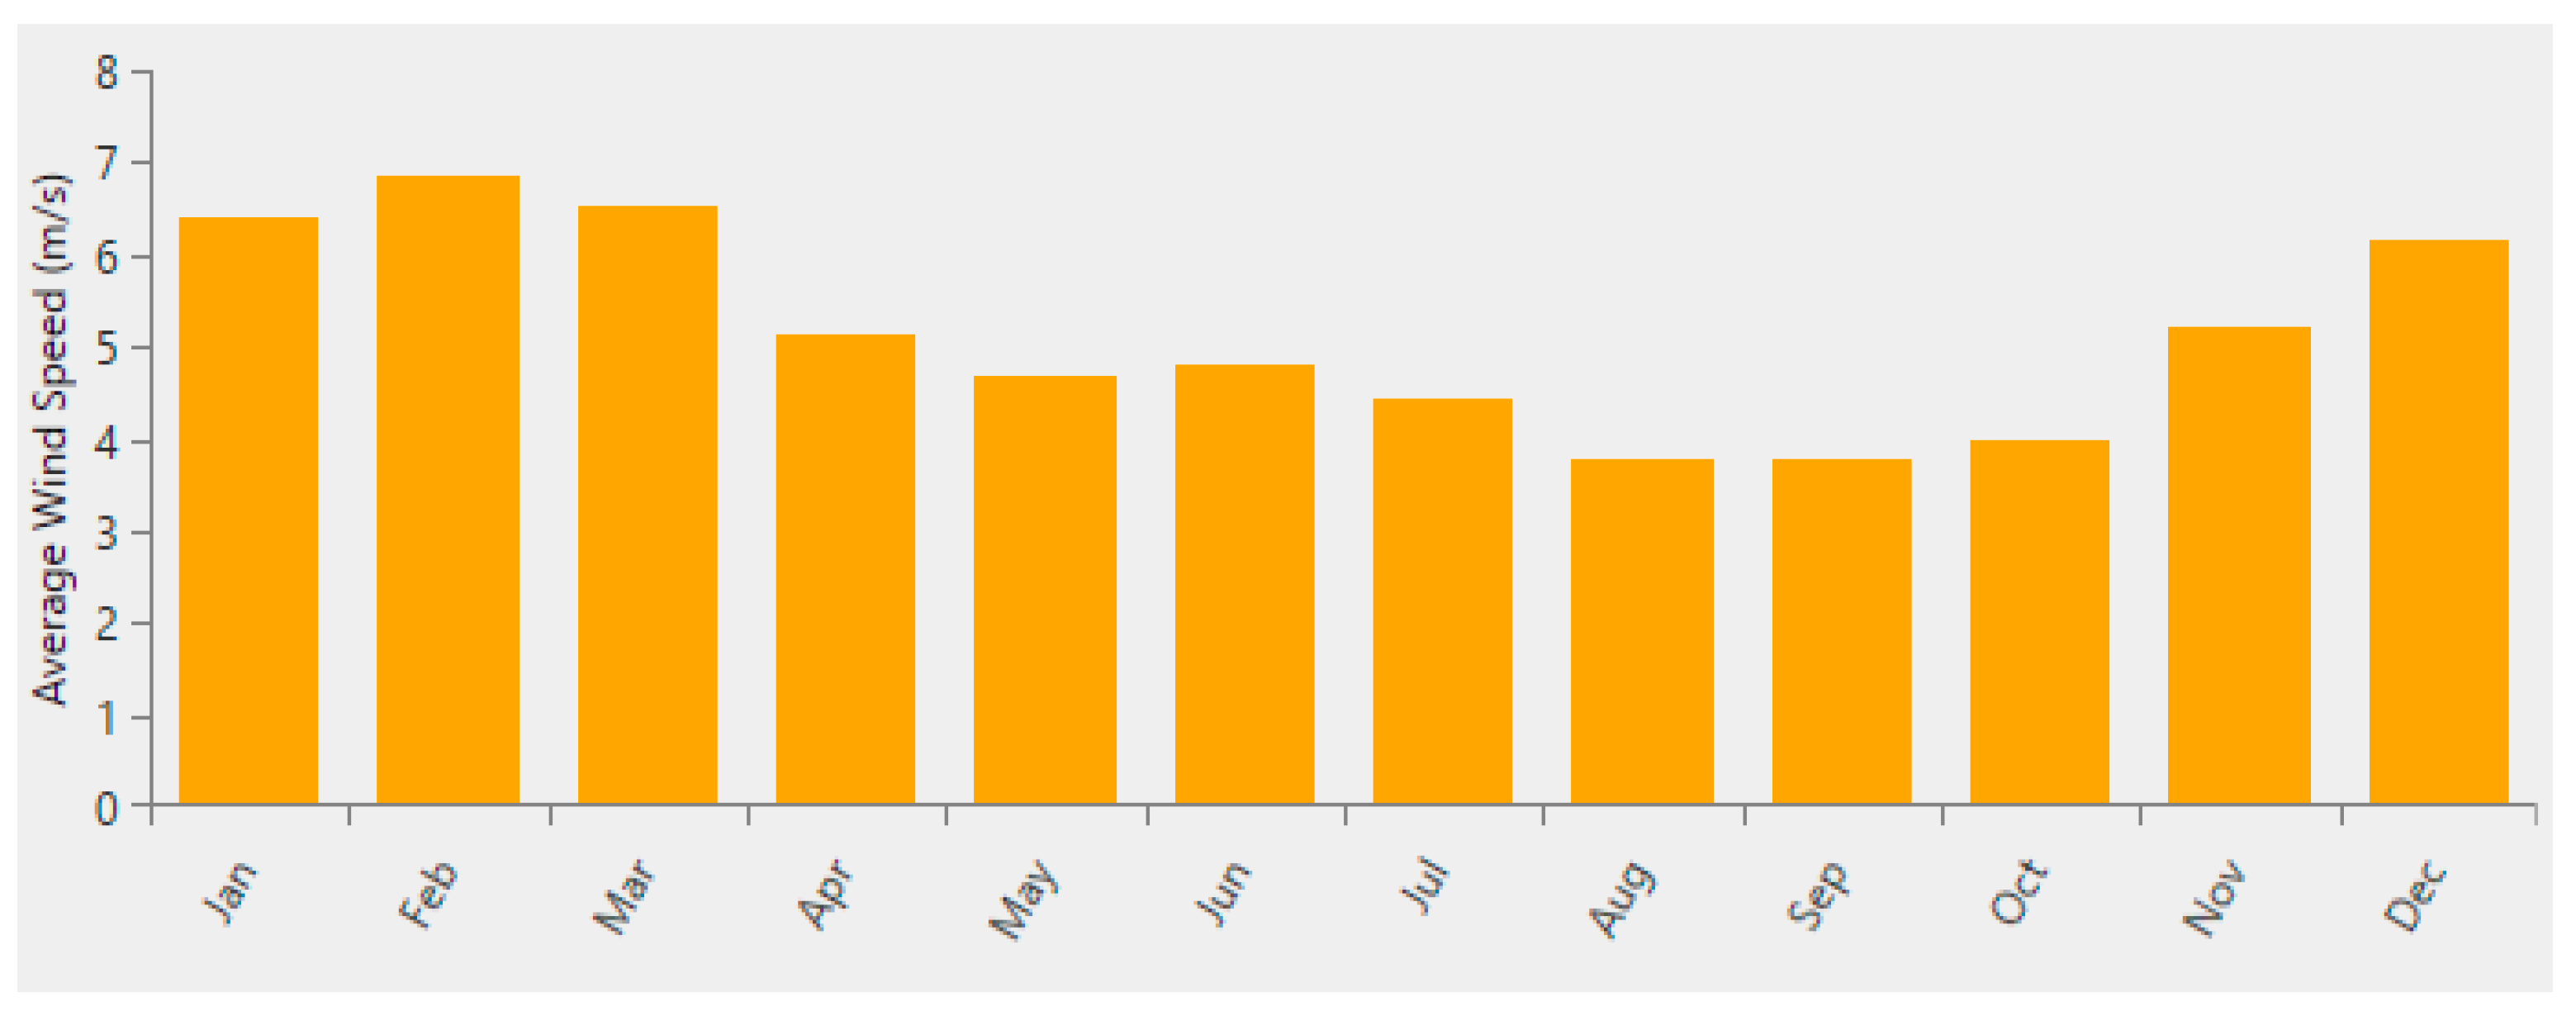
Figure 7.
Monthly Average Wind Speed Measured at 10 m at the Study Site.
Figure 7.
Monthly Average Wind Speed Measured at 10 m at the Study Site.
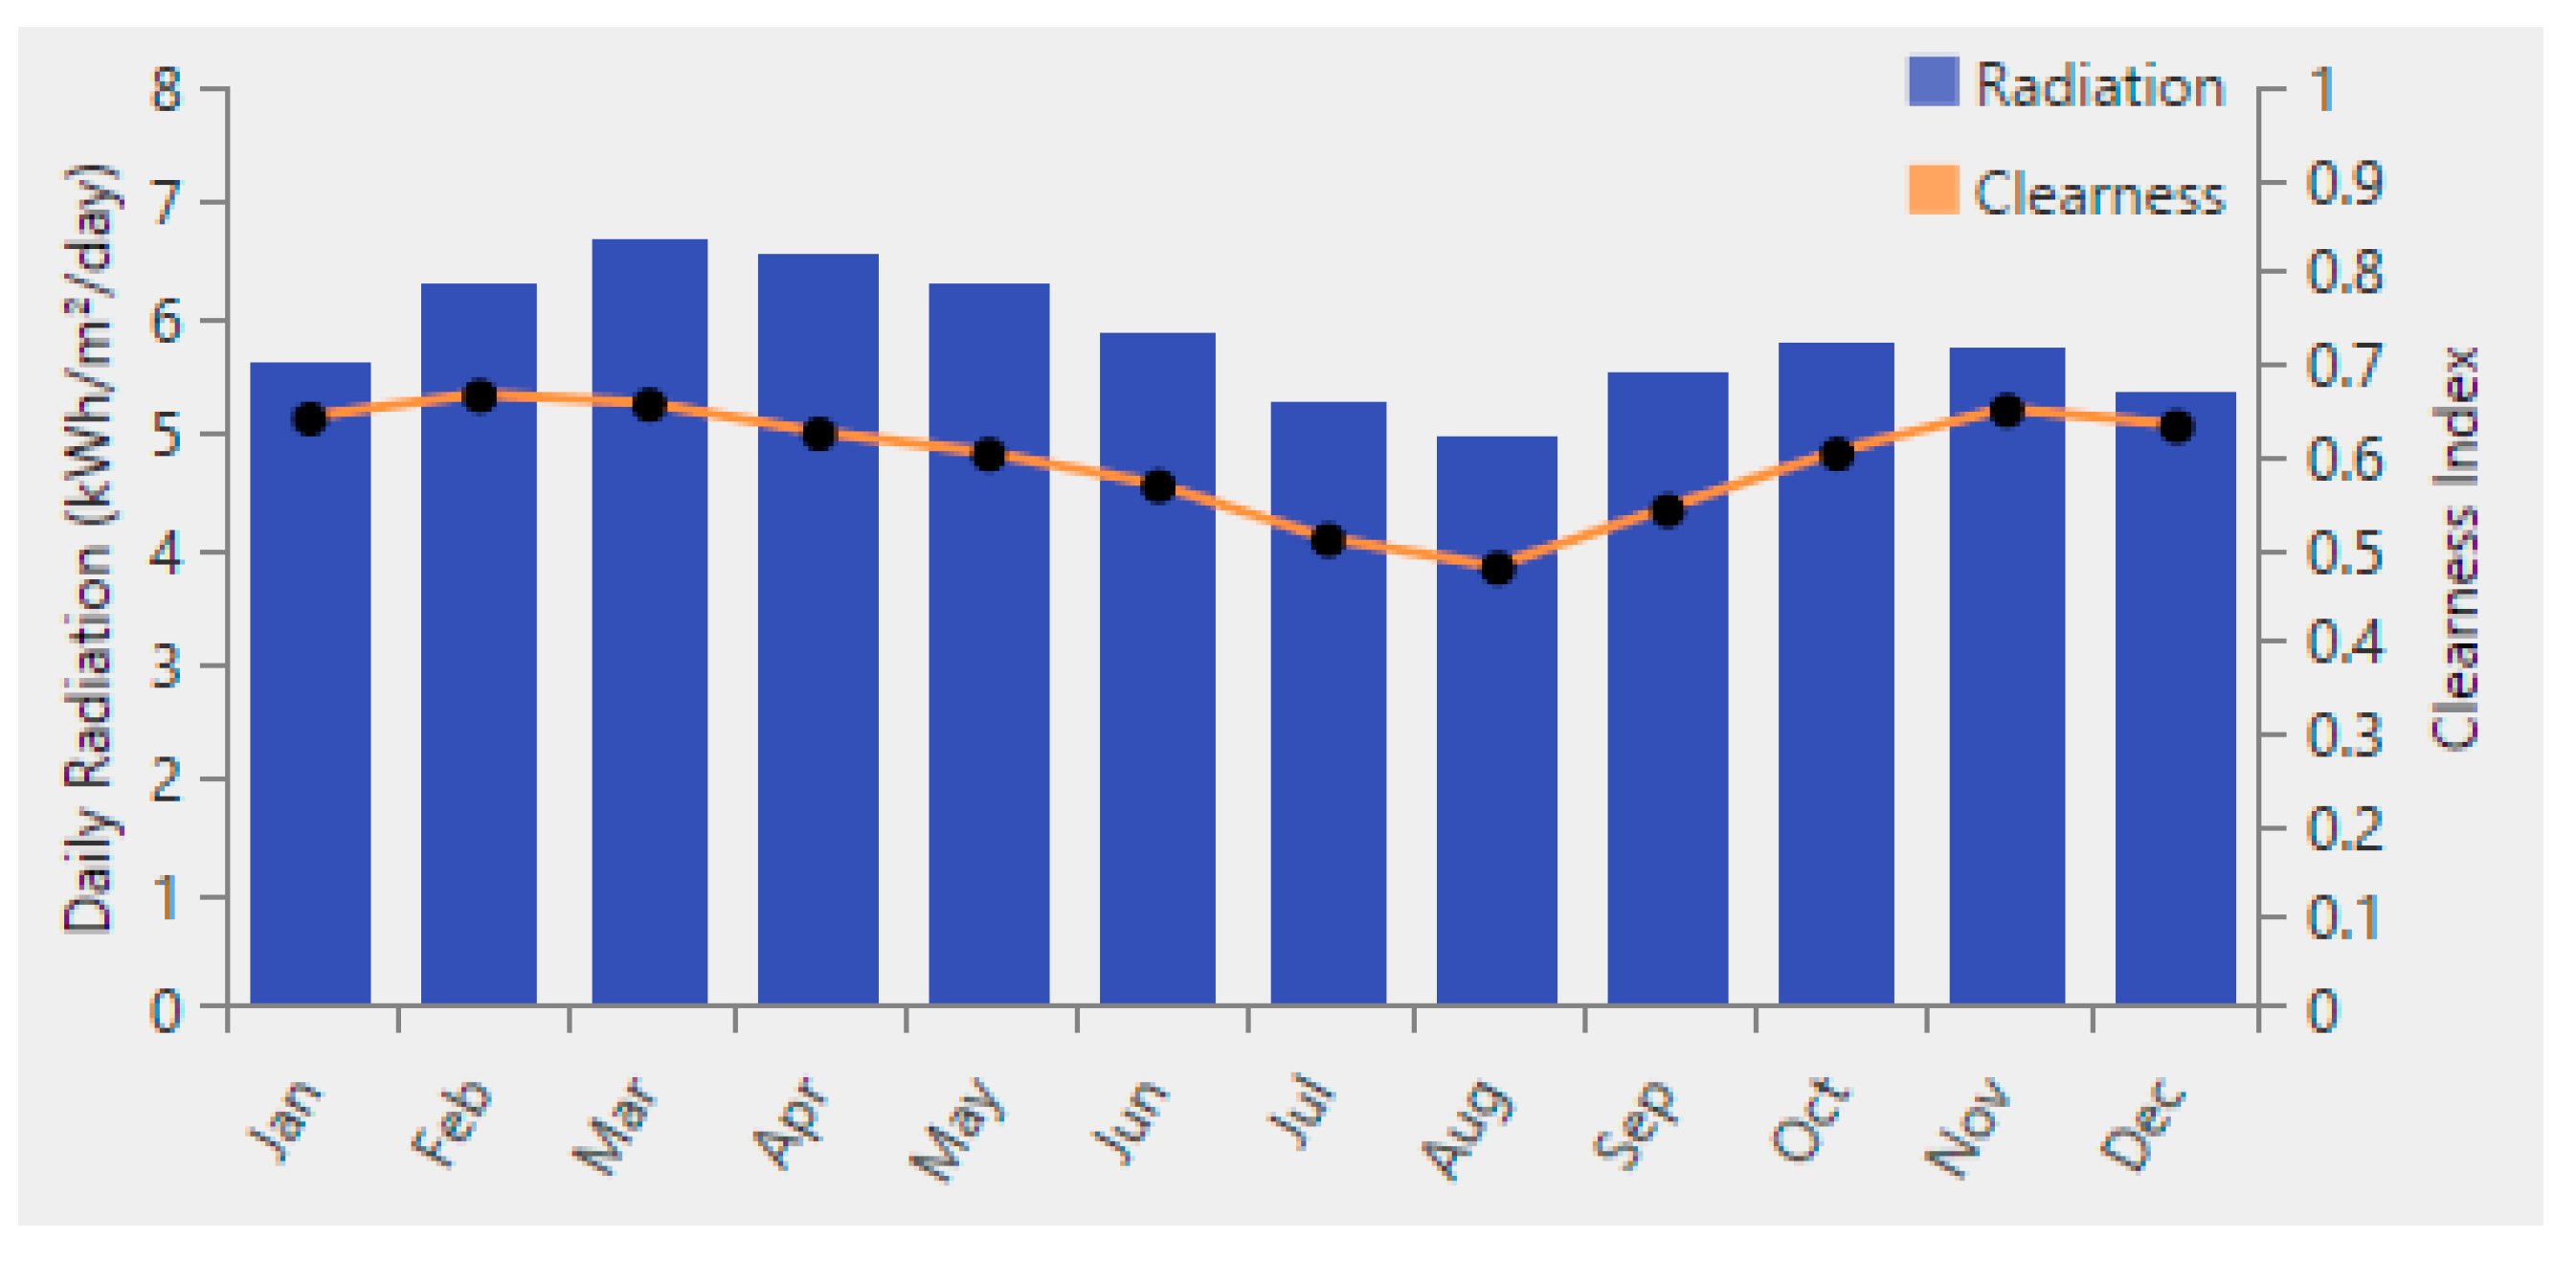
Figure 8.
Monthly Average Solar Resources at the Study Site.
Figure 8.
Monthly Average Solar Resources at the Study Site.
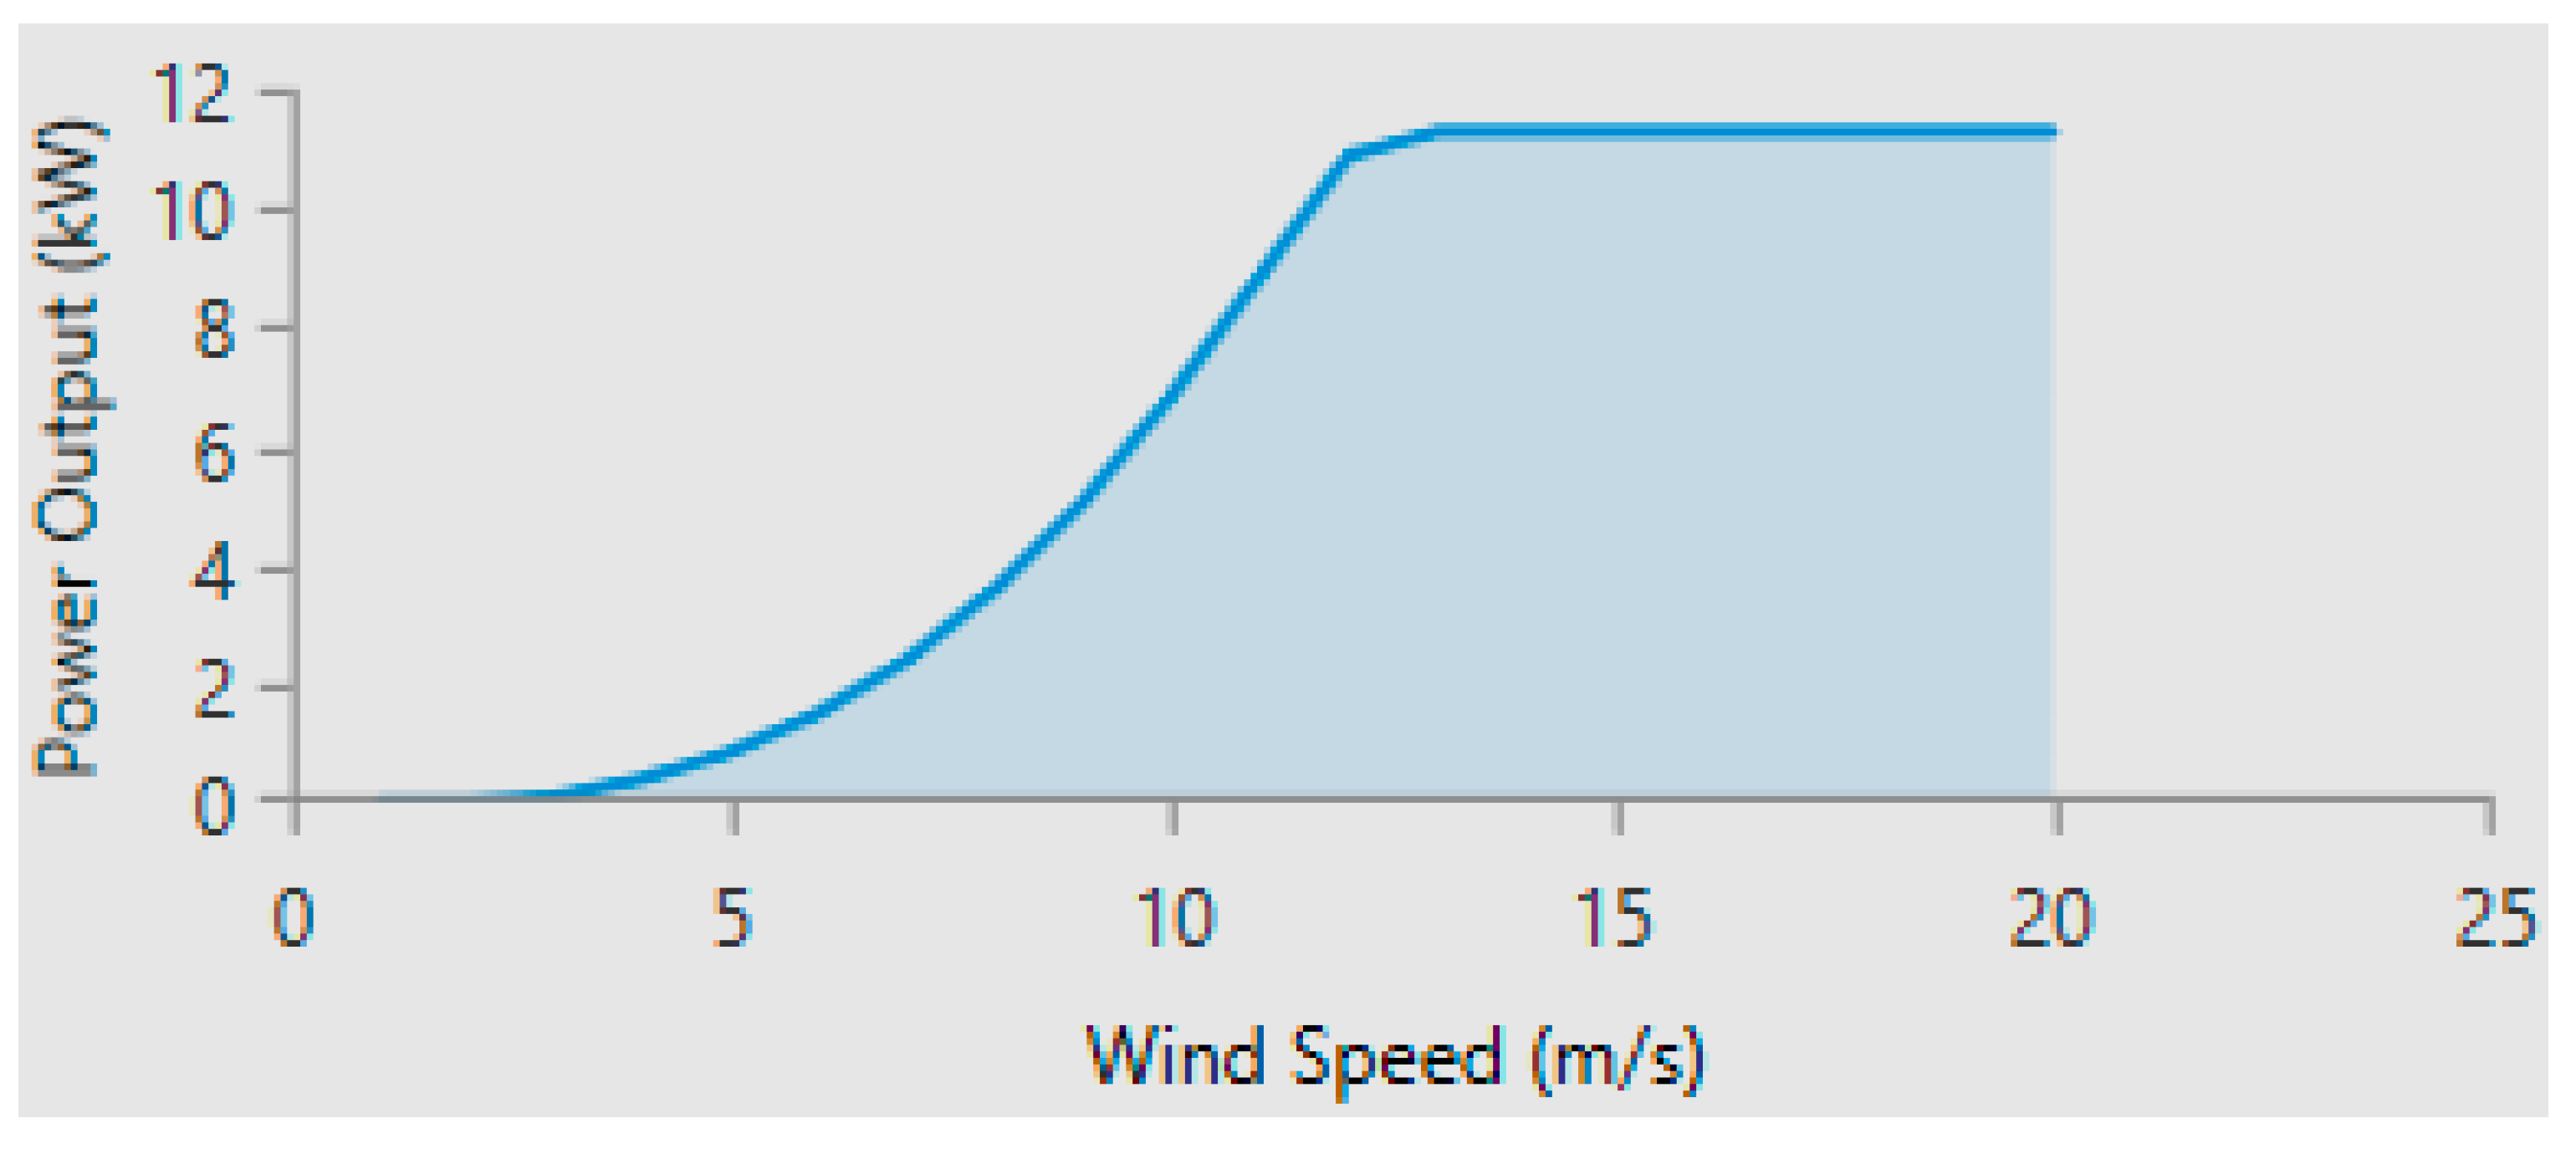
Figure 9.
The power curve of the selected wind turbine.
Figure 9.
The power curve of the selected wind turbine.
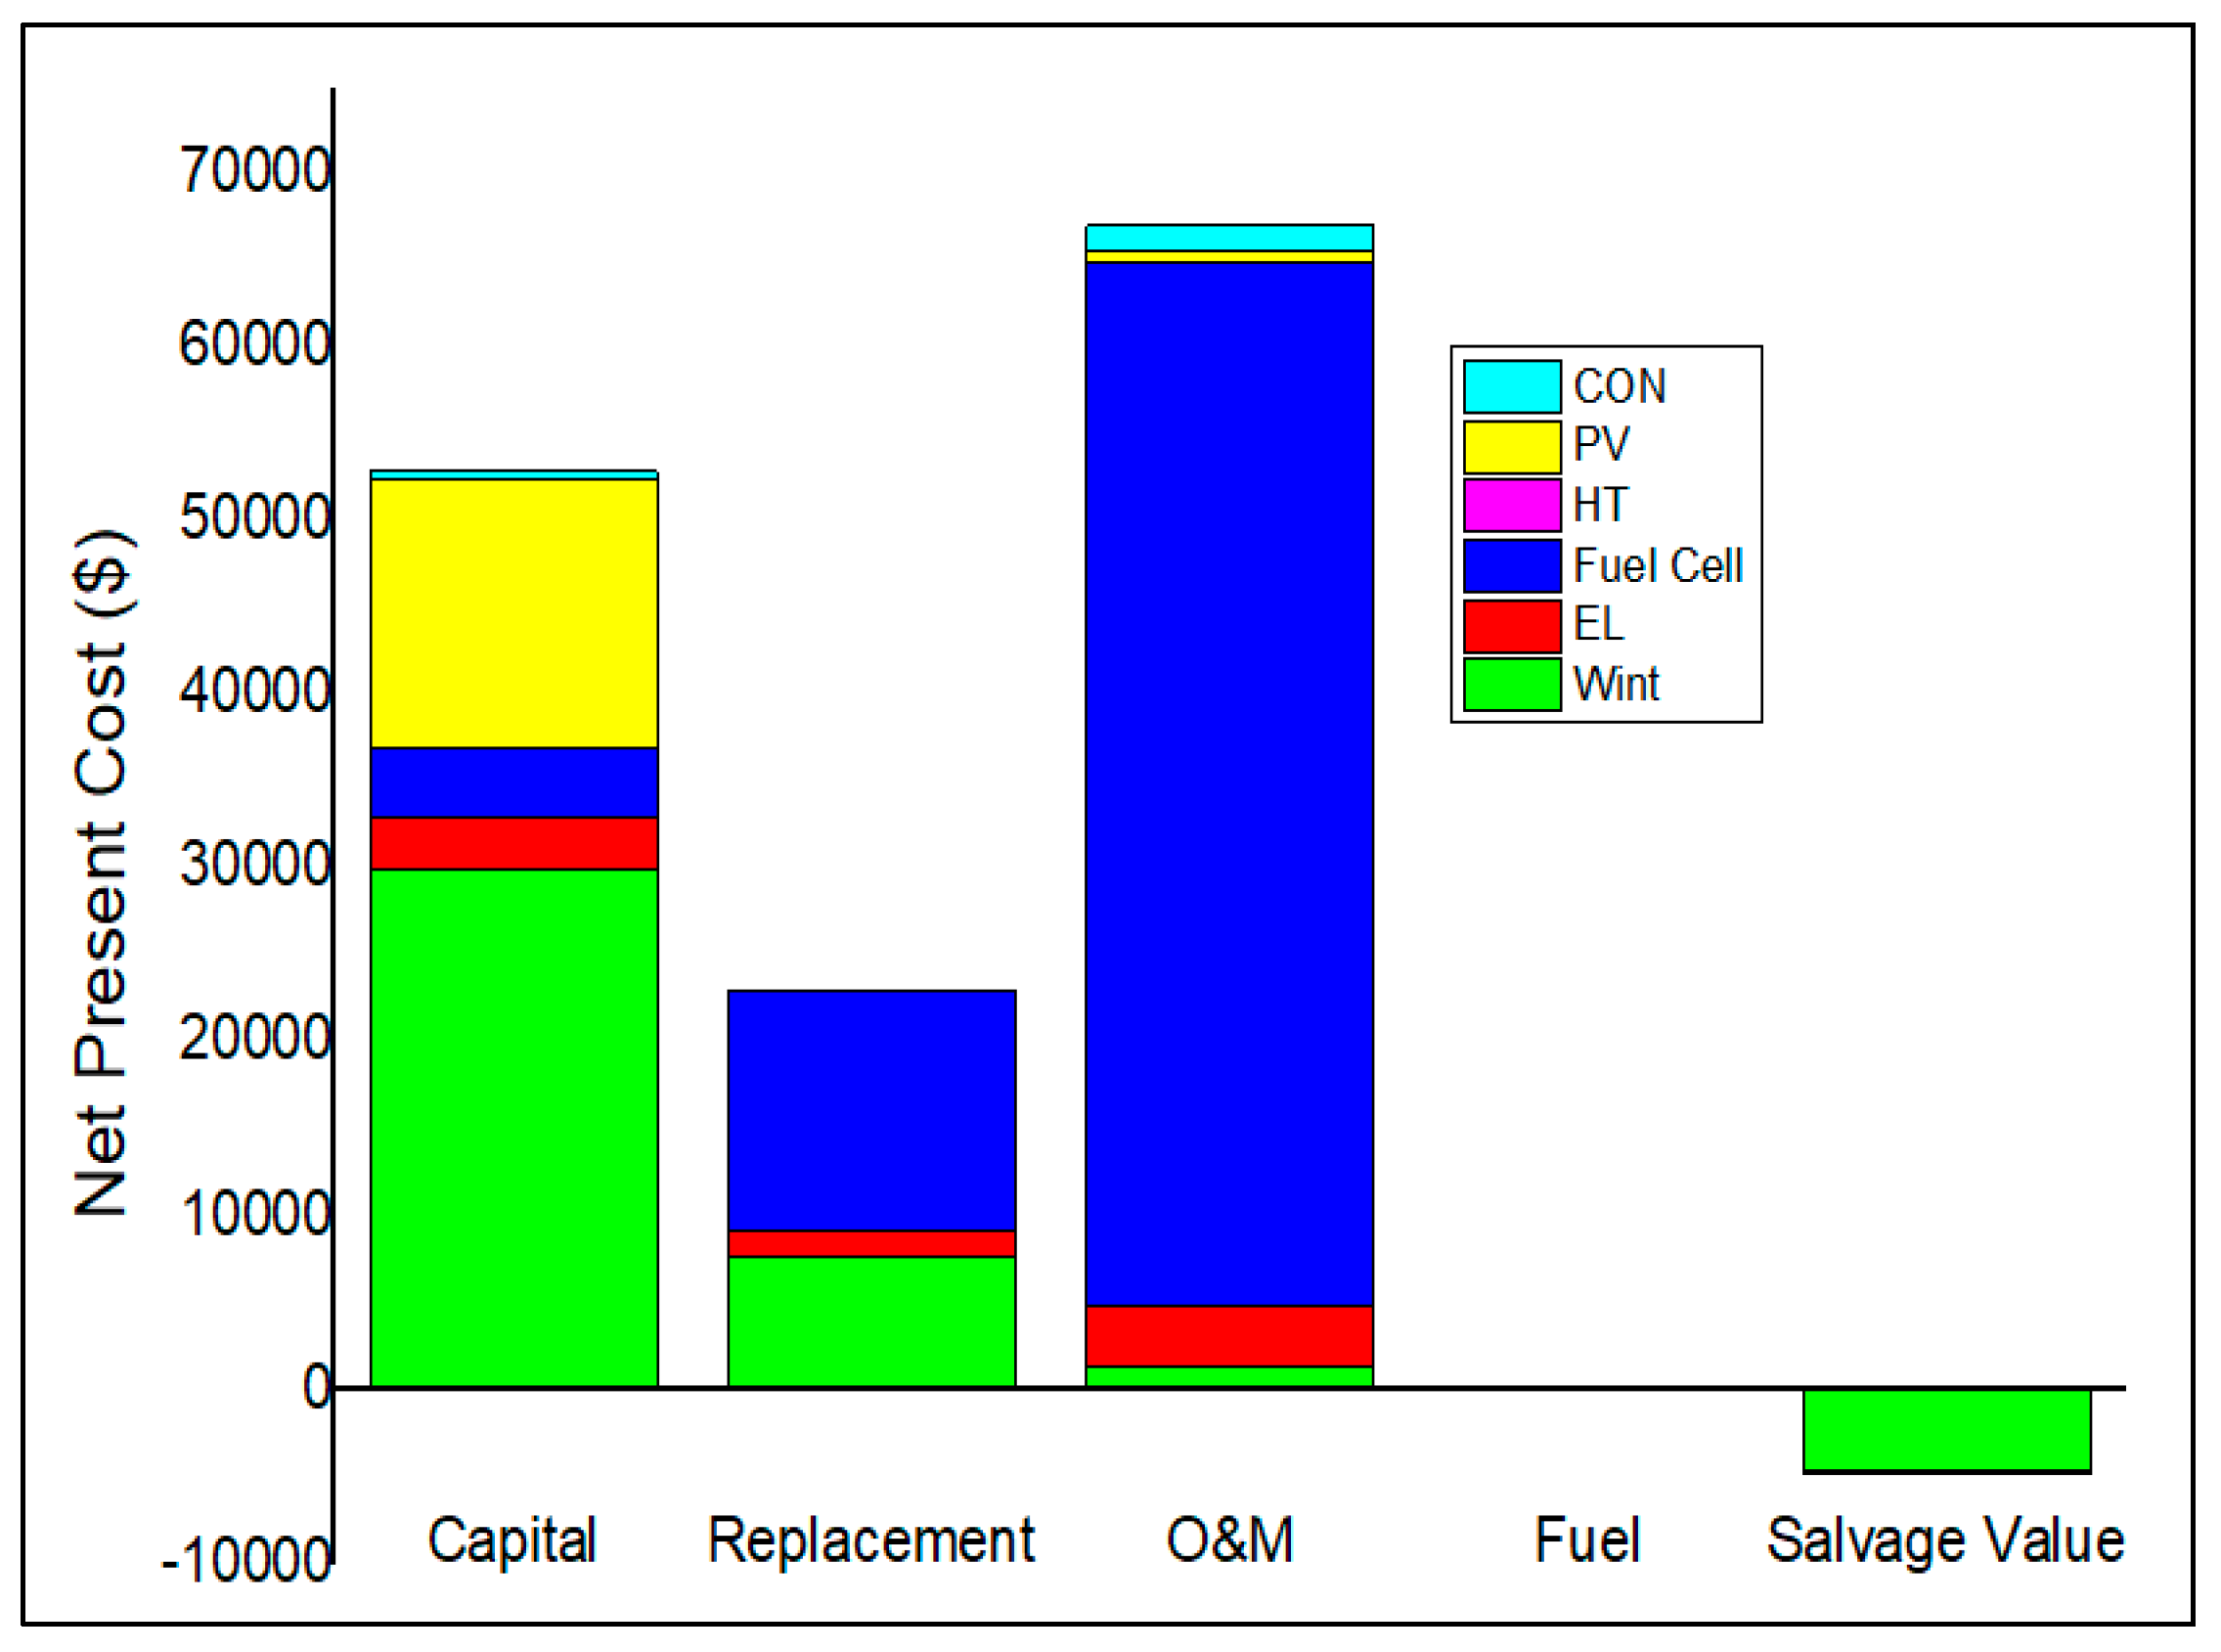
Figure 10.
Cash flow summary based on the optimised architecture.
Figure 10.
Cash flow summary based on the optimised architecture.
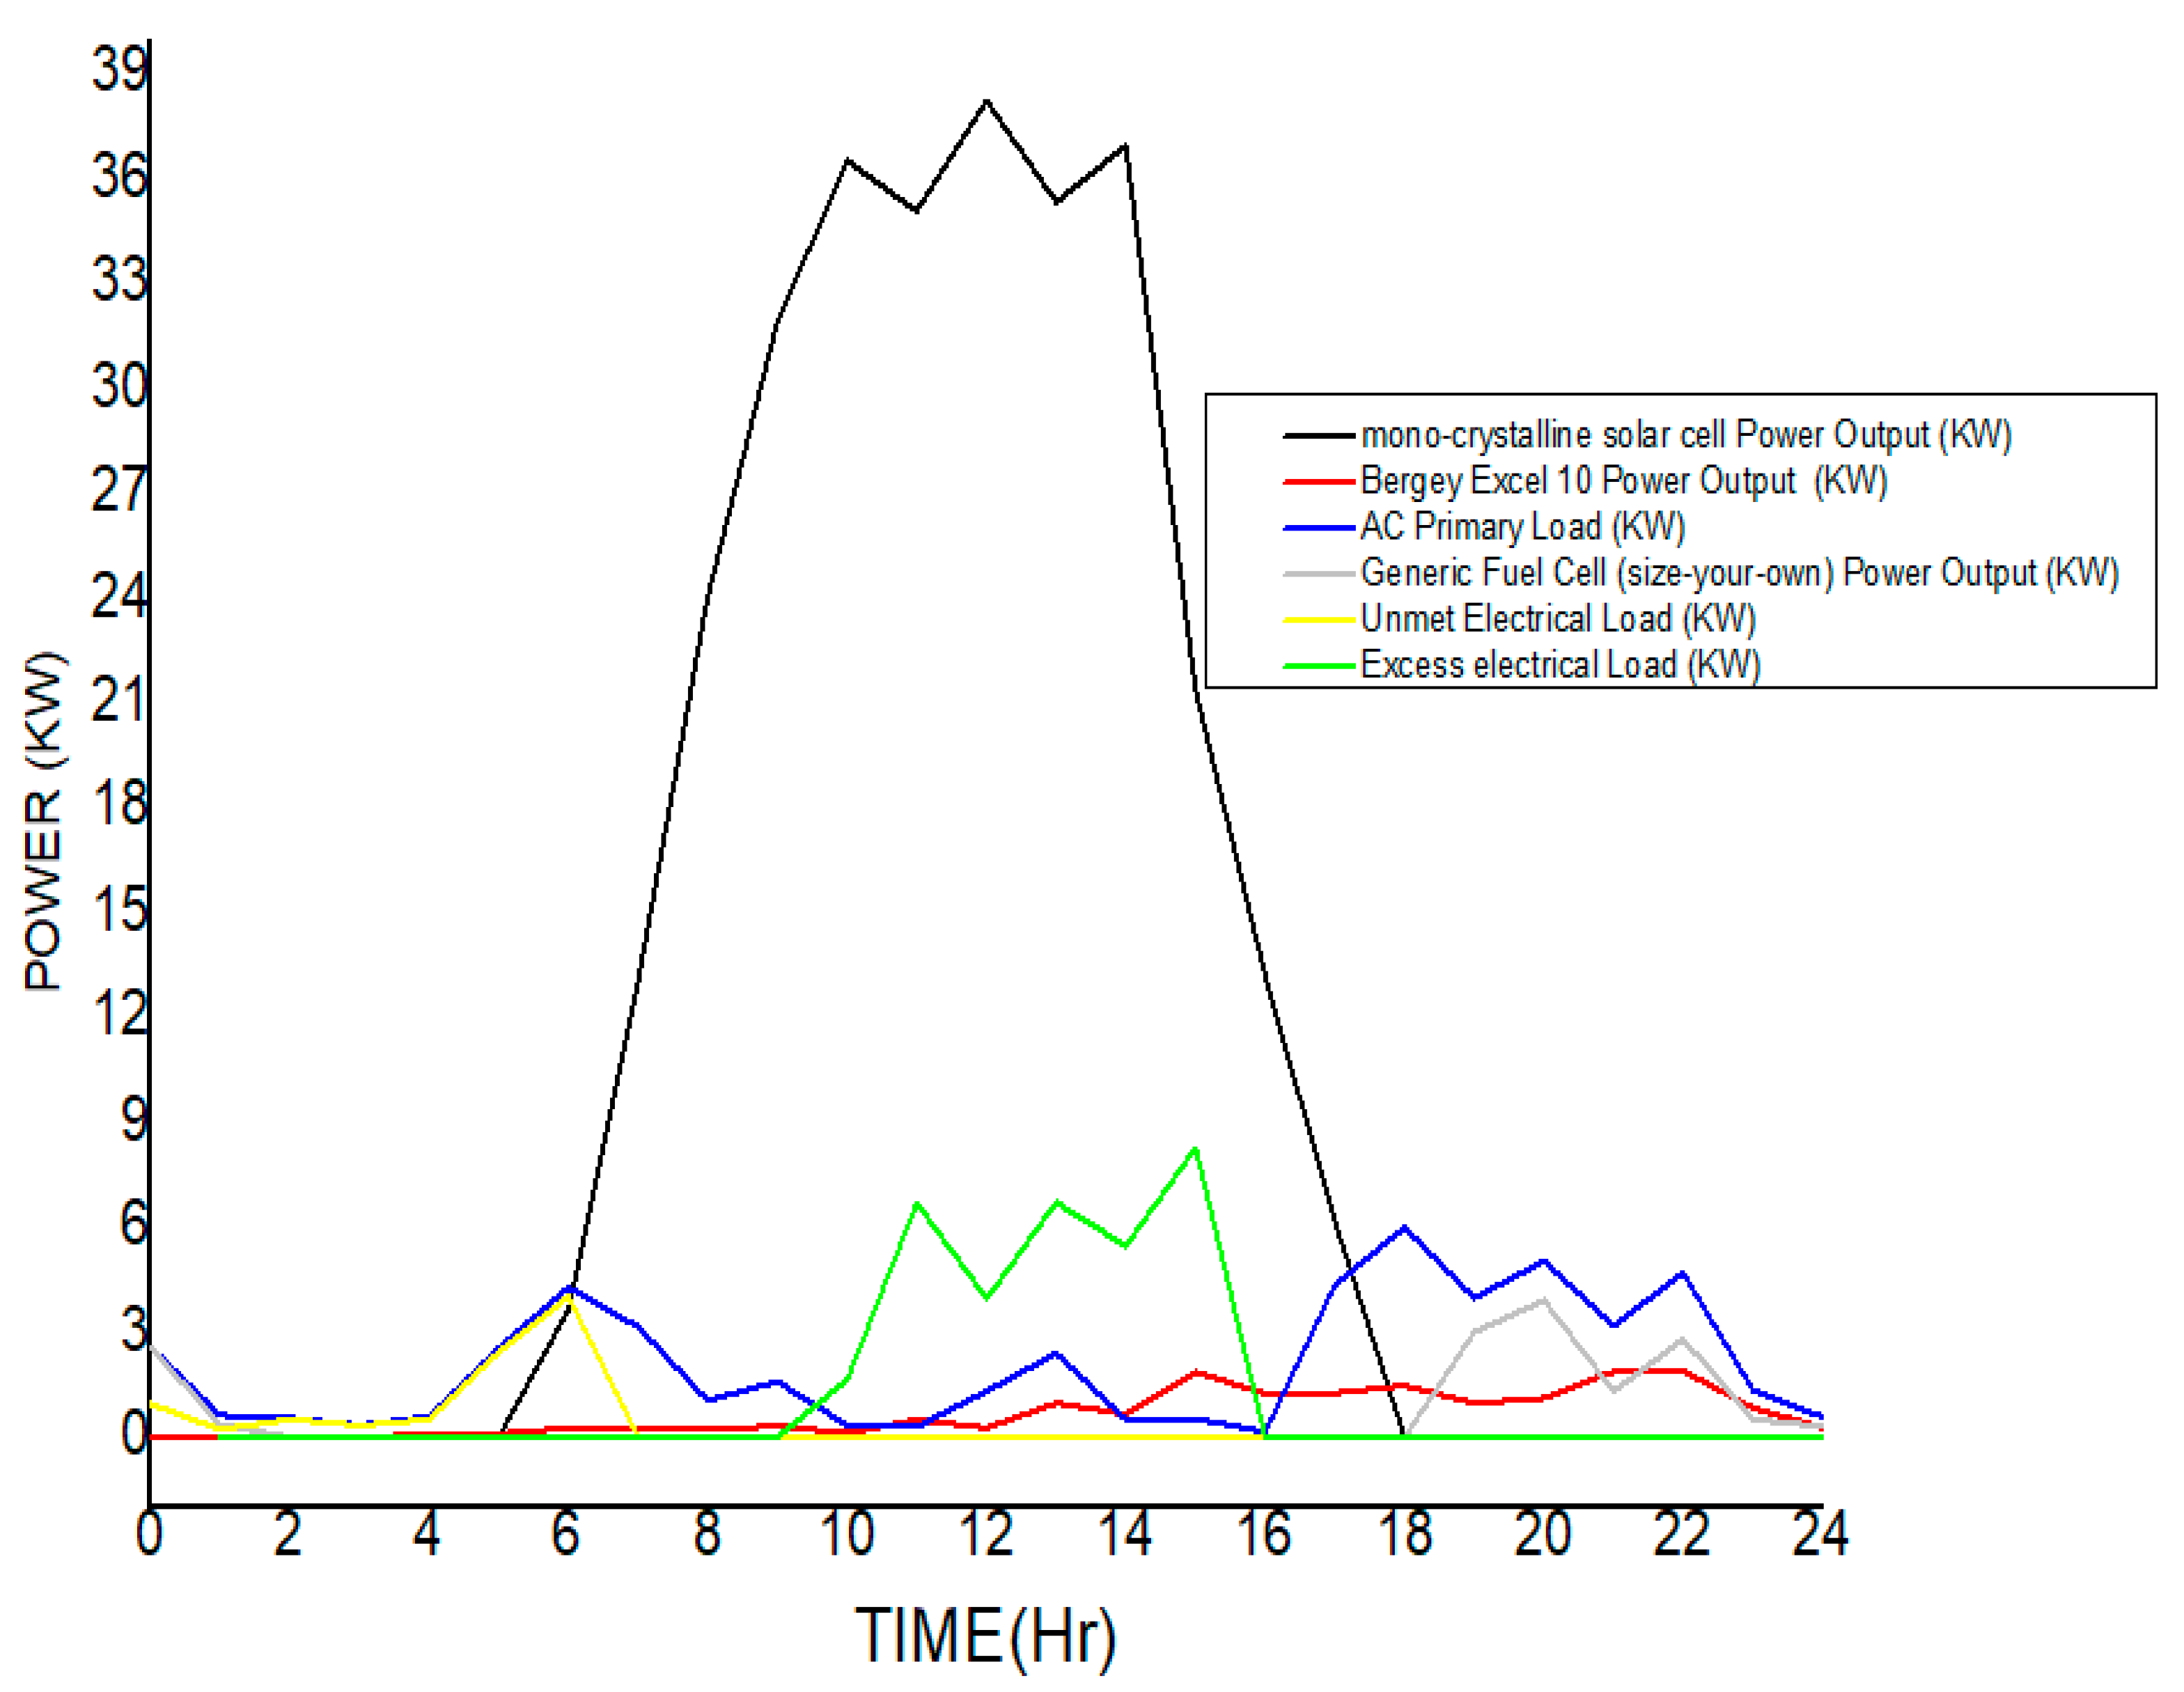
Figure 11.
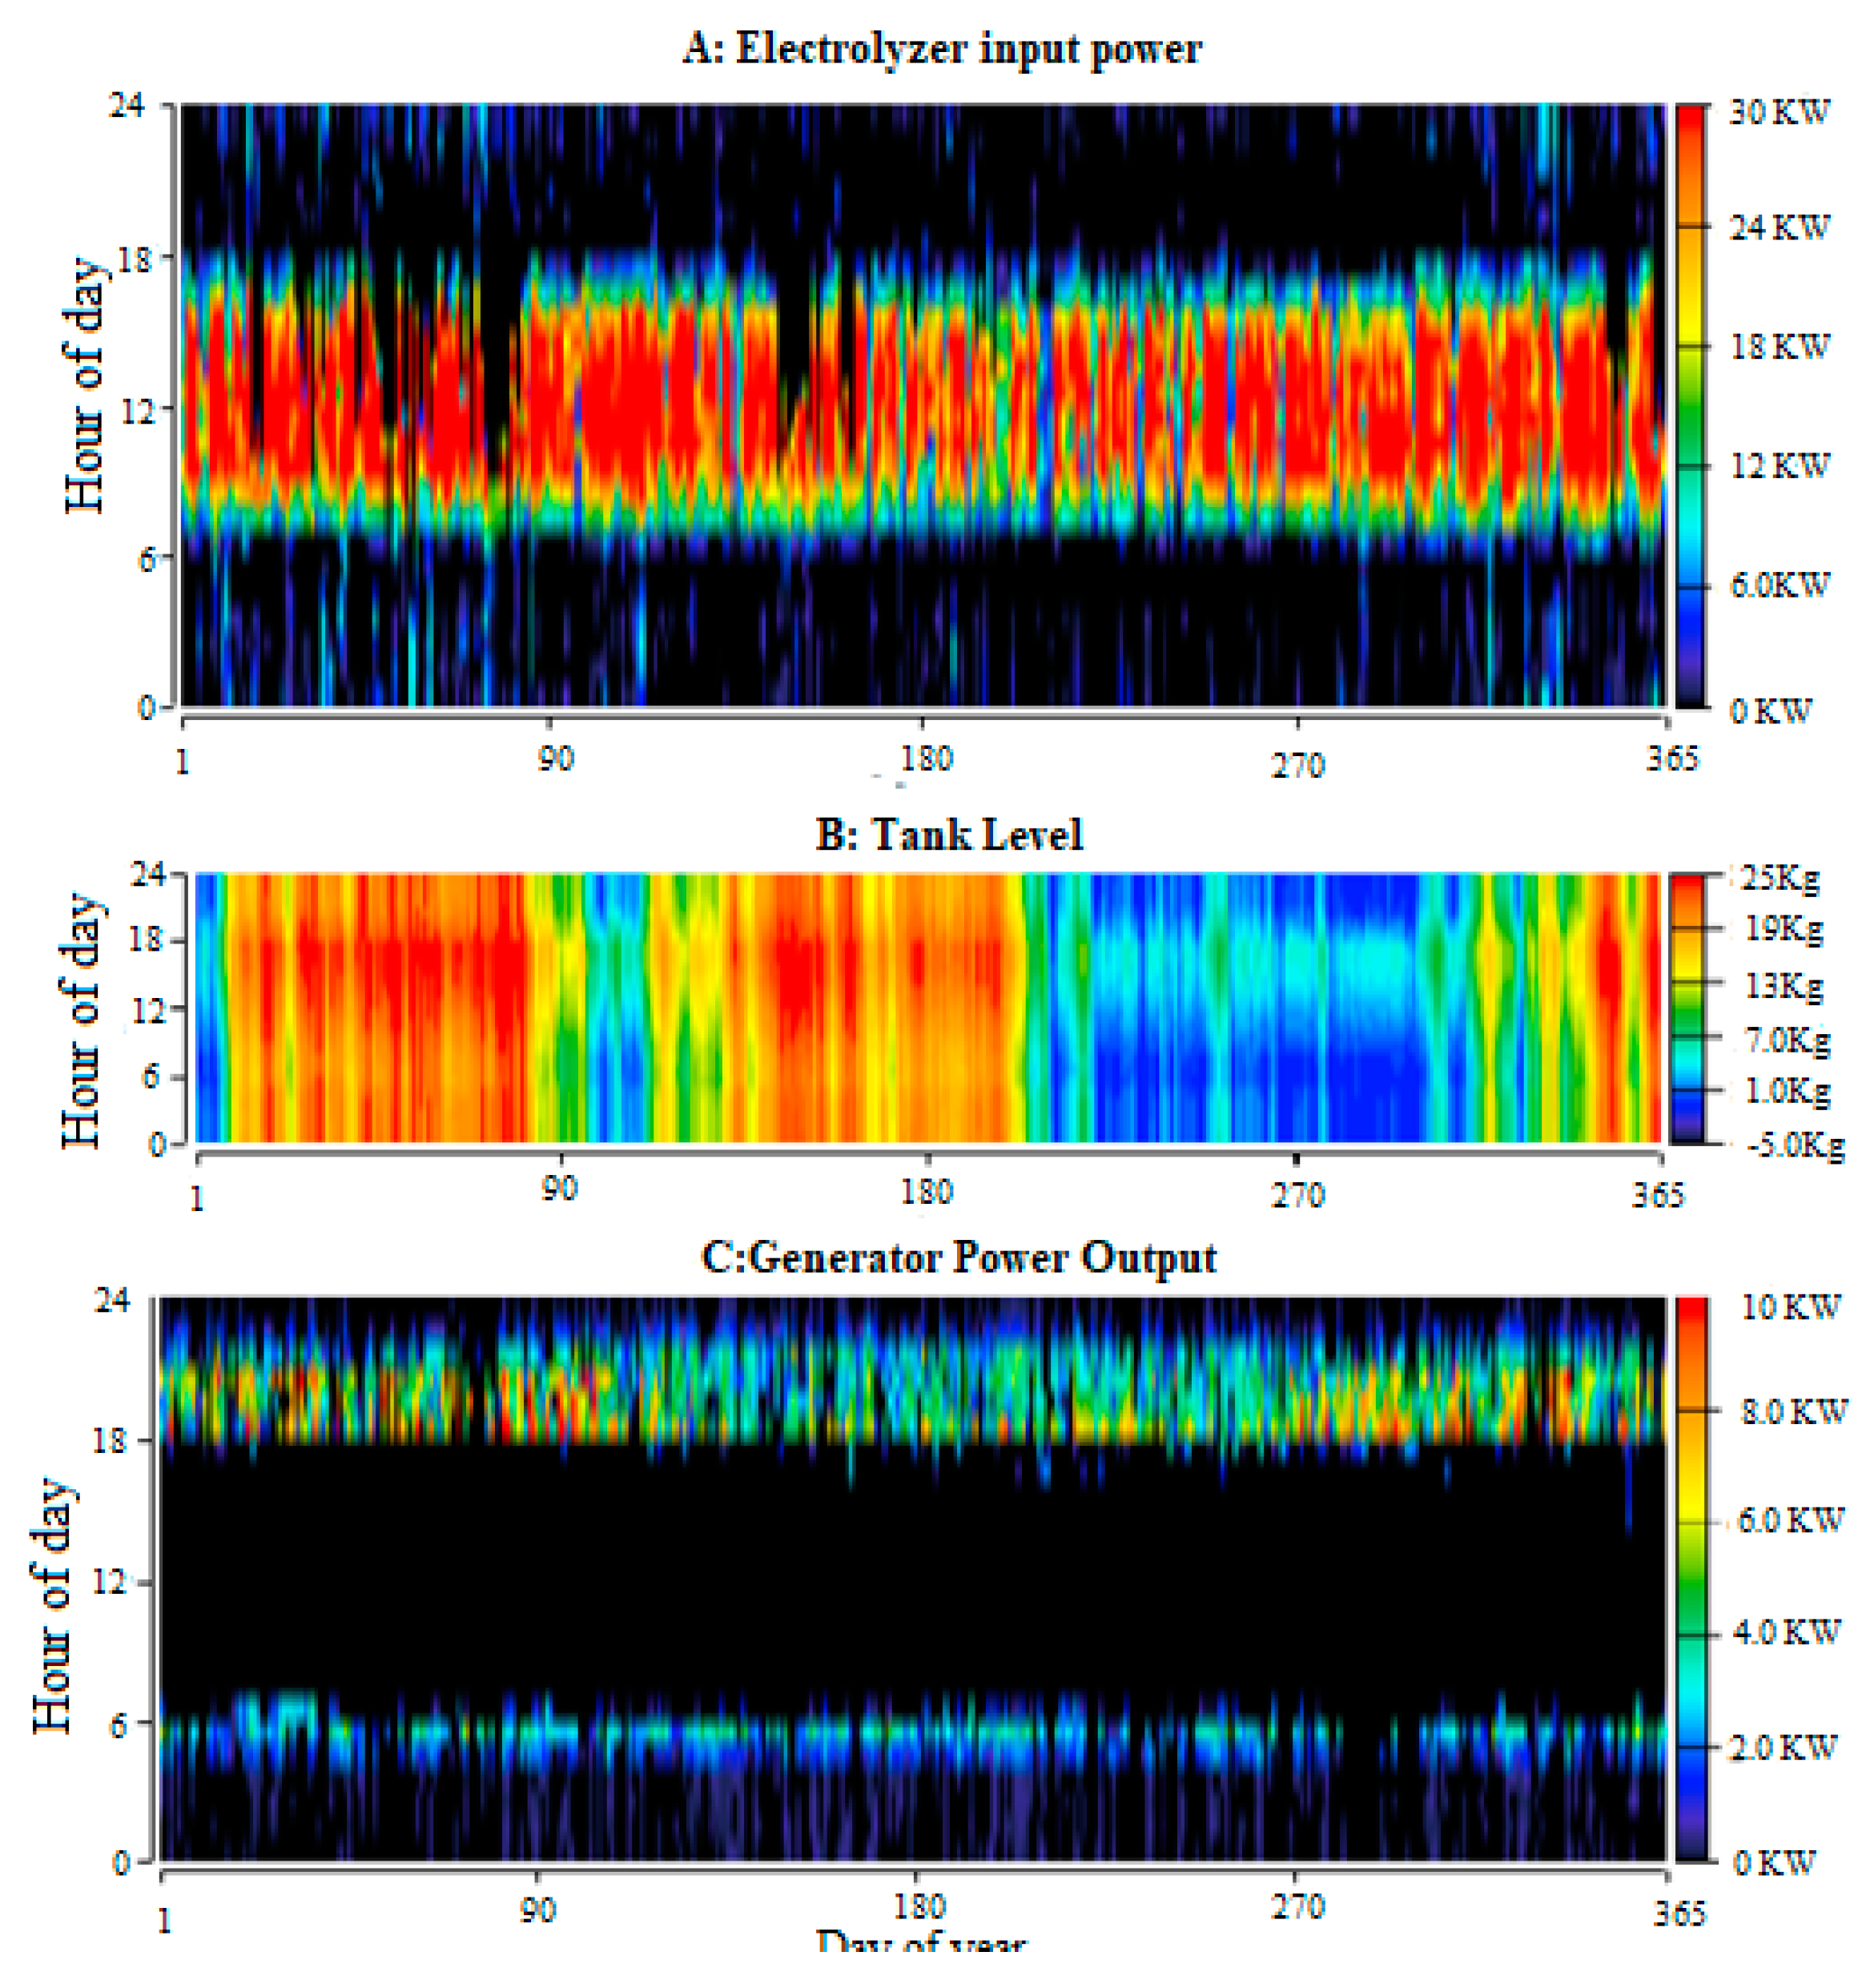
Operations schedules and energy flow of the system components over a 24-hour period.
Figure 11.
Operations schedules and energy flow of the system components over a 24-hour period.
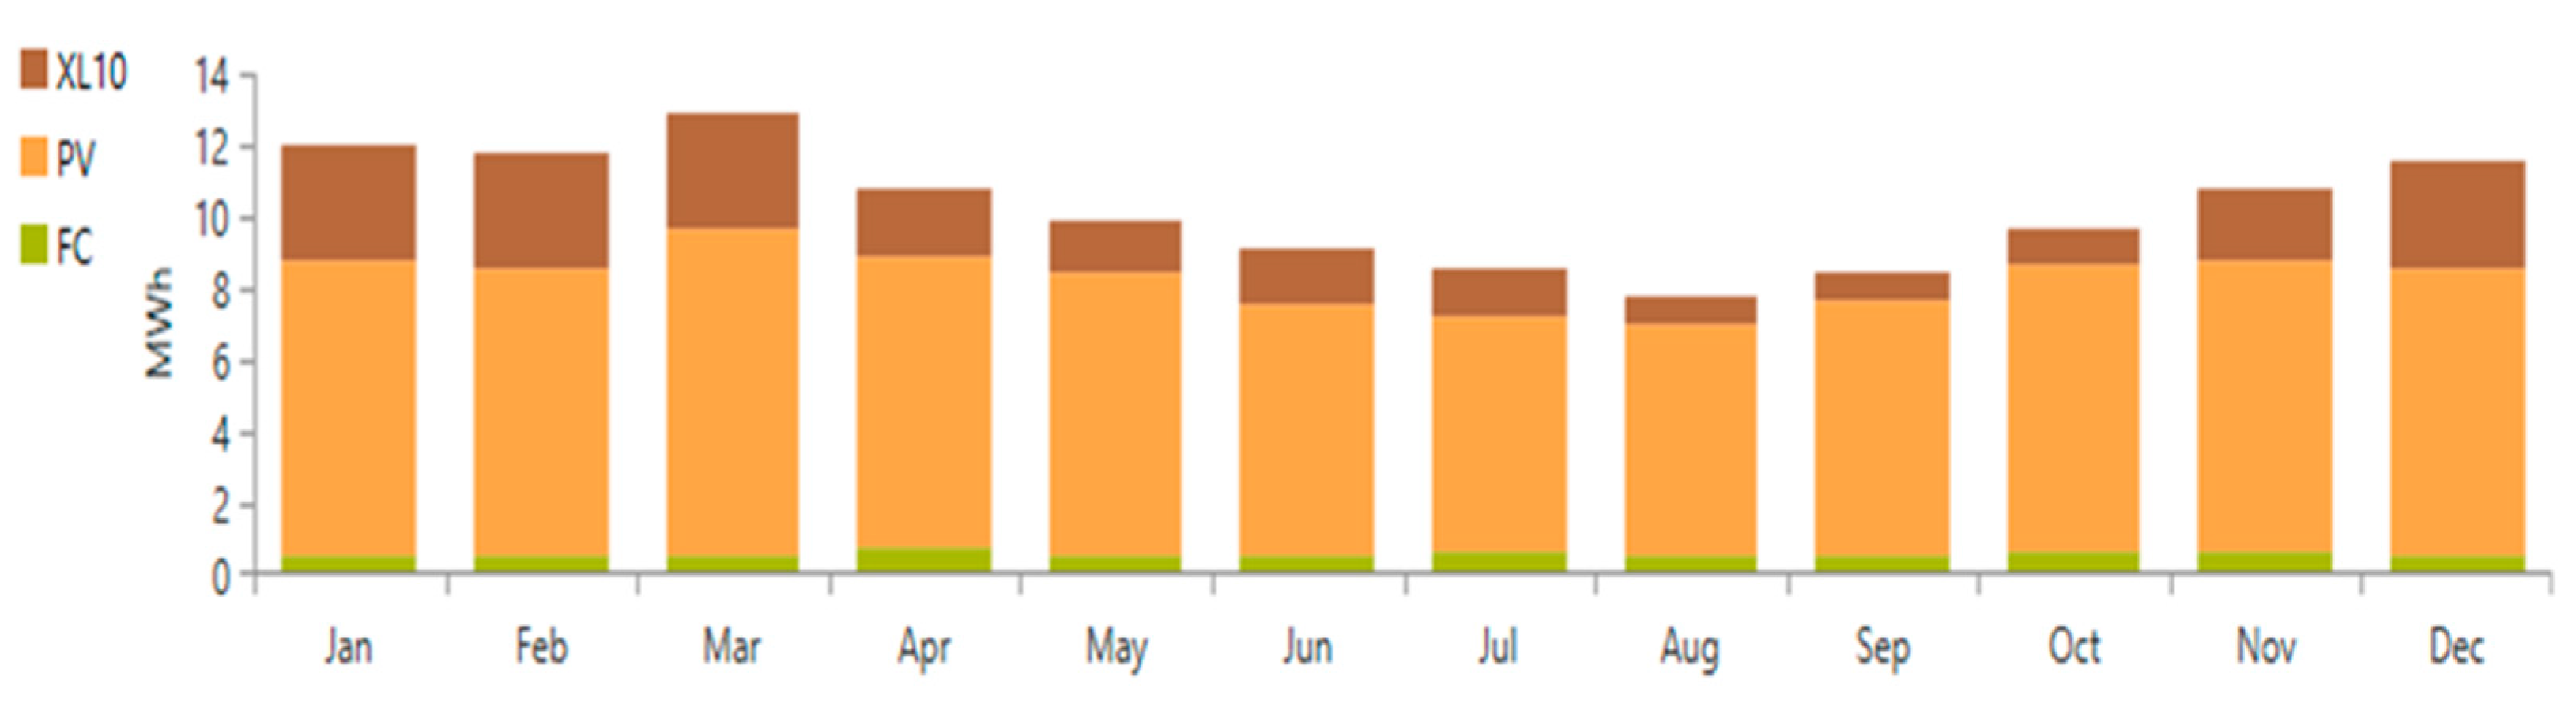
Figure 12.
Monthly average electrical output from the optimal configuration system.
Figure 12.
Monthly average electrical output from the optimal configuration system.
Figure 13.
(A) Electrolyzer input power, (B) Tank level, (C) Full cell power output.
Figure 13.
(A) Electrolyzer input power, (B) Tank level, (C) Full cell power output.
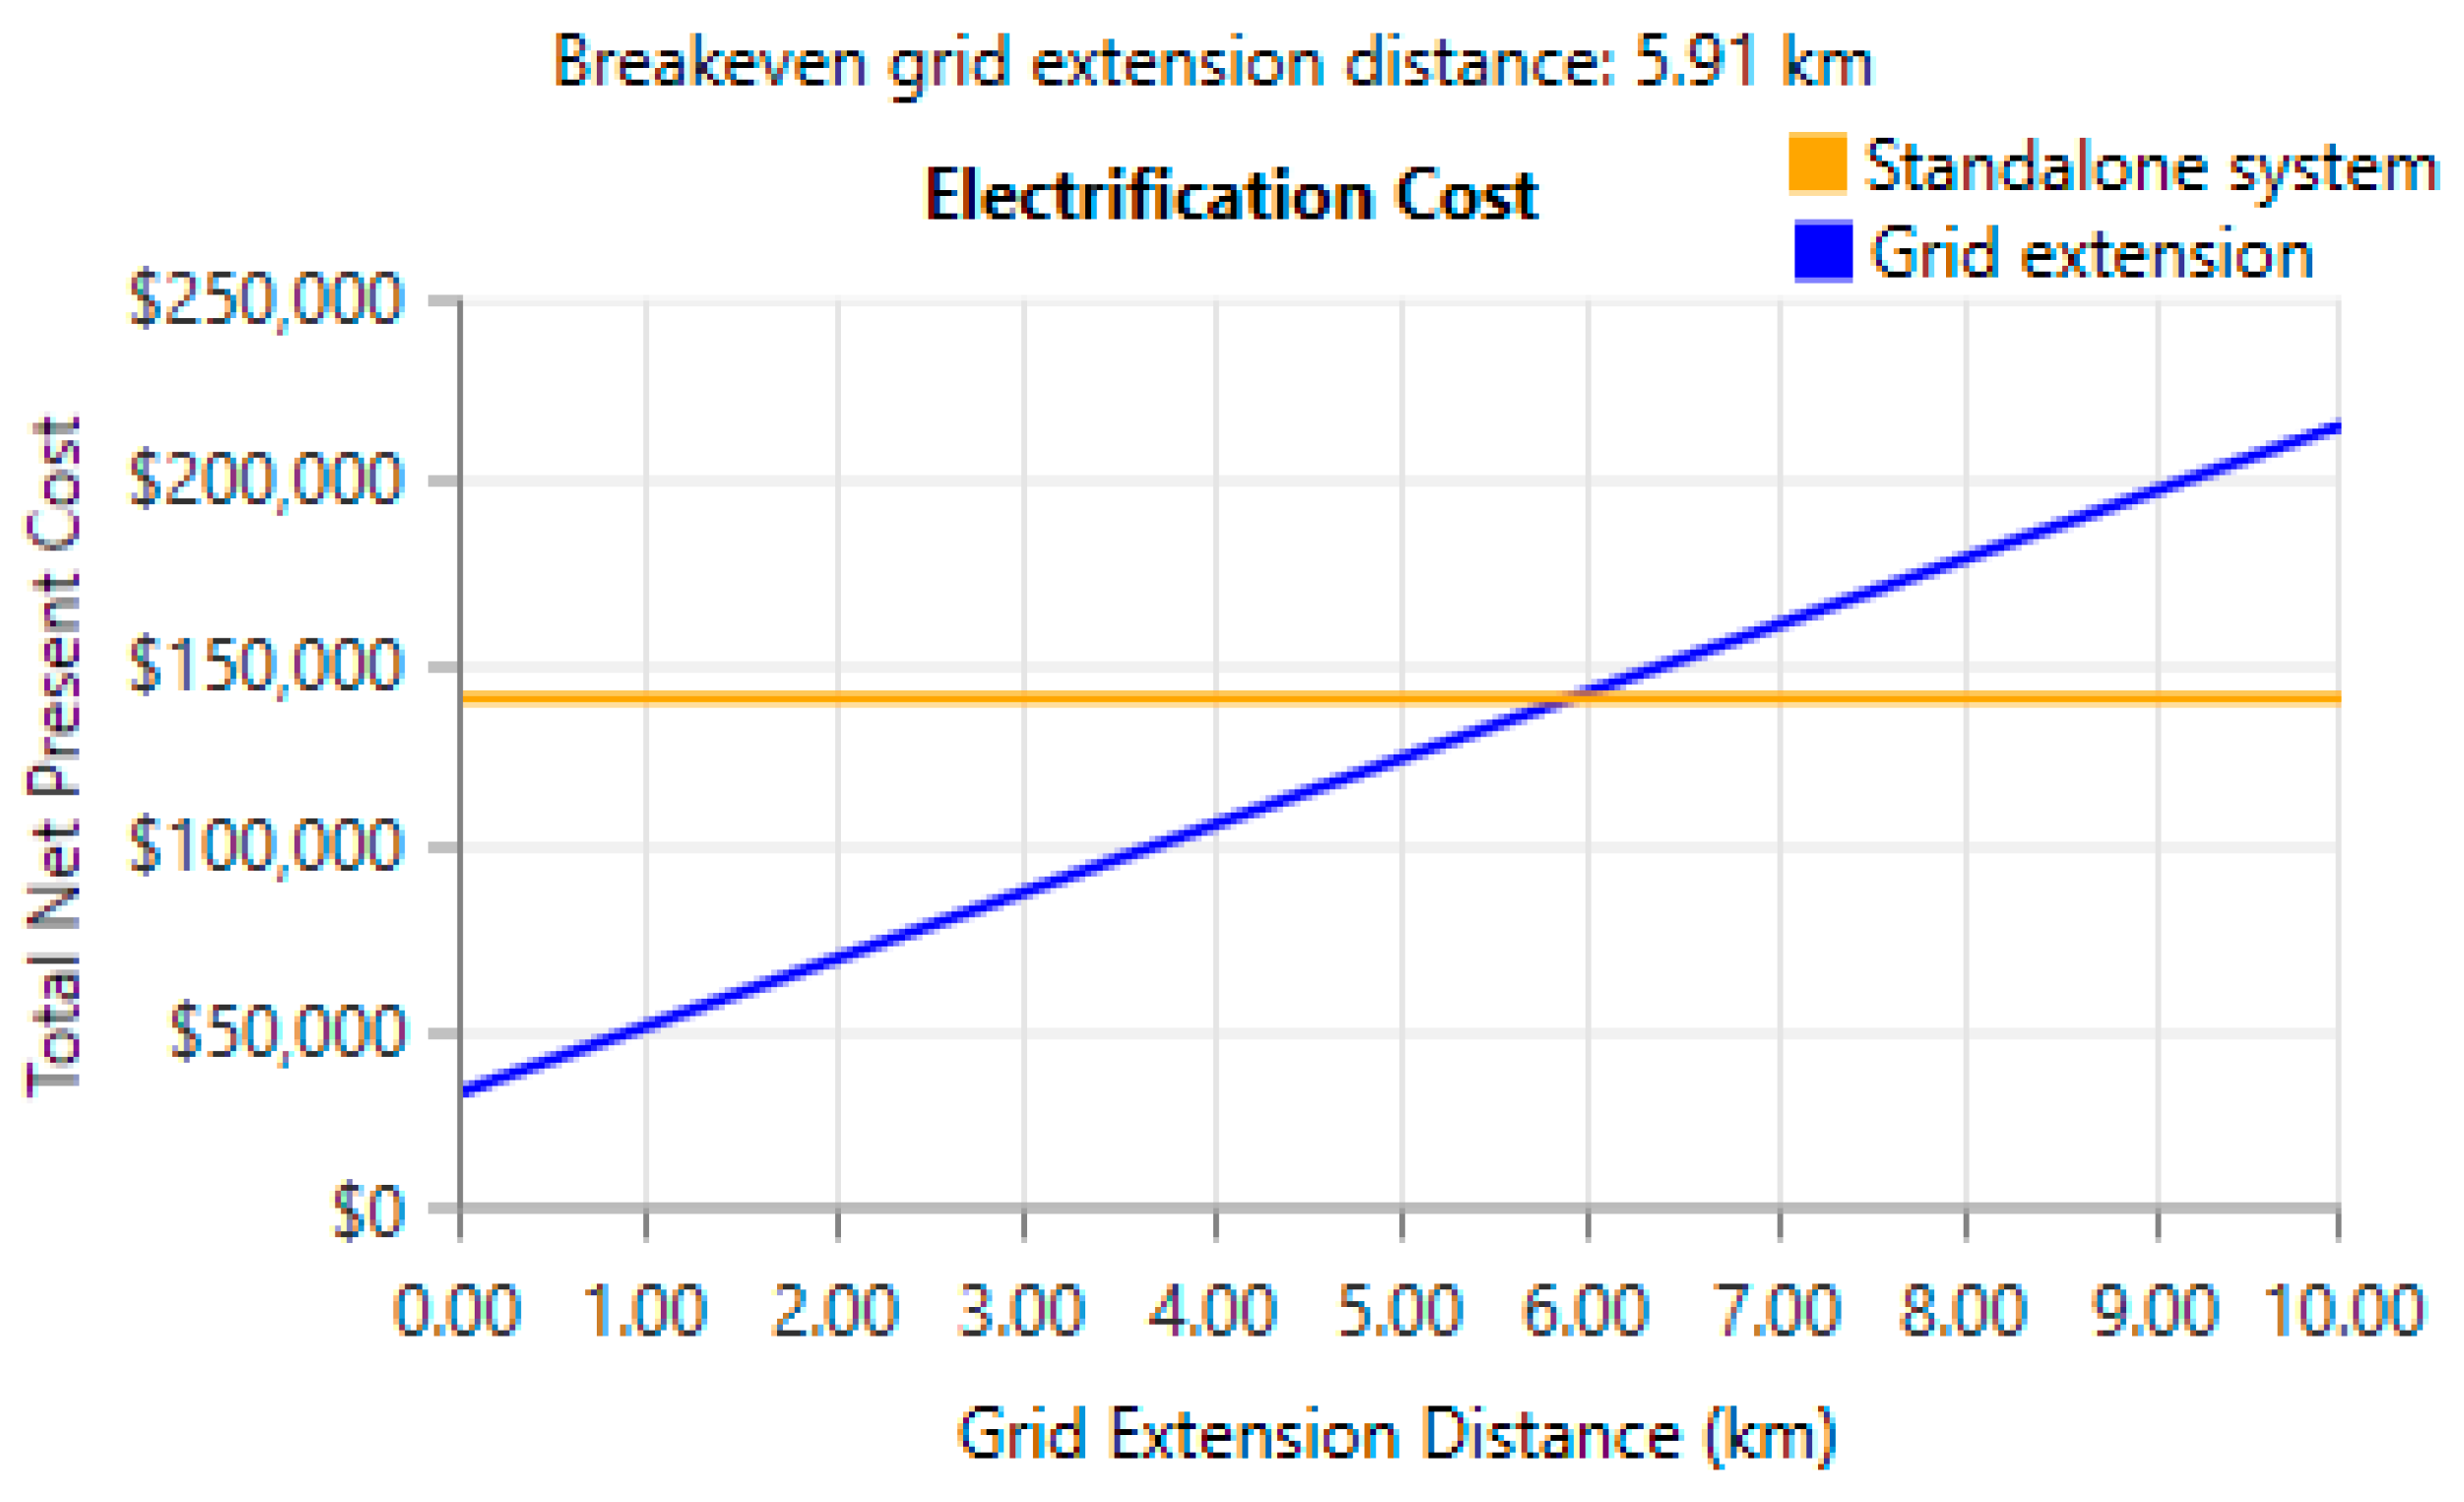
Figure 14.
Cost of electrification options of Dargalla.
Figure 14.
Cost of electrification options of Dargalla.
Figure 15.
Results of the Sensitivity Analysis of Wind Speed and Solar Radiation.
Figure 15.
Results of the Sensitivity Analysis of Wind Speed and Solar Radiation.
Figure 16.
Results of the Sensitivity Analysis of Maximum Capacity Shortage.
Figure 16.
Results of the Sensitivity Analysis of Maximum Capacity Shortage.
Figure 17.
Results of the sensitivity analysis of the capital and replacement costs of PV and FC.
Figure 17.
Results of the sensitivity analysis of the capital and replacement costs of PV and FC.
Table 1.
Selected previous hydrogen-based HRES related studies.
Table 1.
Selected previous hydrogen-based HRES related studies.
| S No |
Authors/Ref |
Country Energy Sources Storage Device Technique/software |
| 01 |
Zhang et al. [48] |
Iran SPV-WES Hydrogen ANN algorithm |
| 02 |
Rodolfo et al. [49] |
Spain SPV-WES Hydrogen GRHYSO |
| 03 |
Pablo et al. [50] |
Spain SPV-WES Battery – Hydrogen MATLAB |
| 04 |
Akyuz et al. [51] |
Turkey SPV-WES Hydrogen MATLAB |
| 05 |
Torreglosa et al. [52] |
Iran SPV-WES Hydrogen MATLAB |
| 06 |
Alonso et al. [53] |
Belgium SPV-WES Battery – Hydrogen HOMER |
| 07 |
Turkdogan et al. [54] |
Turkey SPV-WES Battery – Hydrogen HOMER |
| 08 |
Basu et al. [55] |
India SPV-WES Hydrogen HOMER |
| 09 |
Ramin et al. [56] |
Iran SPV-WES Battery – Hydrogen MATLAB |
| 10 |
Jahangir et al. [57] |
Iran SPV-WES-DG Hydrogen HOMER |
| 11 |
Rodolfo et al. [58] |
Spain SPV-WES-DG Battery – Hydrogen C++ |
| 12 |
Askarzadeh et al. [59] |
Iran SPV-DG Hydrogen MATLAB |
| 13 |
Caliskan et al. [60] |
Turkey SPV-WES Hydrogen HOMER |
Table 2.
General Information about the Study Location.
Table 2.
General Information about the Study Location.
| Designations |
Information |
| Country |
Cameroon |
| Region |
Far North |
| Division |
Diamaré |
| Municipality |
Mora |
| Latitude |
11°2.8’N |
| Longitude |
14°8.4’E |
| Elevation above sea level |
75 m |
| Number of households |
200 |
| Nearest power transformer |
8 km |
| Main socio-economic activities |
Agriculture and livestock farming |
Table 3.
Appliances’ requirement and rating for different sectors of energy consumption.
Table 3.
Appliances’ requirement and rating for different sectors of energy consumption.
| Load Type |
Appliances |
Rating (W) |
Quantity |
Total (KW) |
| A-Domestic |
|
|
|
|
| CFL |
0.015 |
350 |
5.25 |
| Radio |
0.012 |
160 |
1.92 |
| Mobile charger |
0.12 |
160 |
1.92 |
| Fan |
0.04 |
350 |
14 |
| TV |
0.065 |
160 |
10.4 |
| B-Community |
|
|
|
|
| Health center |
CFL |
0.015 |
6 |
0.09 |
| Fan |
0.04 |
6 |
0.24 |
| Refrigerator |
0.5 |
2 |
1 |
| Computer |
0.075 |
2 |
0.15 |
| Street Lamp |
CFL |
0.1 |
20 |
2 |
| Four mil |
|
4.8 |
3 |
14.4 |
| Church |
CFL |
0.015 |
4 |
0.06 |
| Fan |
0.04 |
4 |
0.16 |
| Microphone |
0.001 |
1 |
0.001 |
| Loudspeaker |
1 |
3 |
3 |
| C-Agricultural |
|
|
|
|
| water irrigation pump |
|
2.2 |
3 |
6.6 |
| Electric grass-cutting machine |
|
1.5 |
2 |
3 |
| Trashing machine |
|
4 |
2 |
8 |
|
Note: CFL: compact fluorescent lamp; TV: Television. |
Table 6.
Optimization variables of the study model.
Table 6.
Optimization variables of the study model.
| Optimization variable |
PV array size (kW) |
Number of WT |
hydrogen tank capacity (Kg) |
Fuel Cell Capacity (KW) |
Electrolyzer capacity (KW) |
Converter capacity (kW) |
| Maximum |
150 |
7 |
250 |
25 |
160 |
25 |
| Minimum |
0 |
0 |
0 |
0 |
0 |
0 |
| Step |
25 |
1 |
25 |
5 |
20 |
5 |
| Number of values |
7 |
8 |
11 |
6 |
9 |
5 |
Table 7.
Sensitivity variables and associated values.
Table 7.
Sensitivity variables and associated values.
| Sensitivity variable |
values |
| Wind speed (m/s) |
4,5,5.8, 7, 8 |
| Solar radiation (kWh/m2/d) |
4,5.1,6, 7, 8 |
| Capital and replacement cost multiplier of PV |
0.25, 0.5, 0.75, 1 |
| Capital and replacement cost multiplier of Fuel Cell |
0.25, 0.5, 0.75, 1 |
| Maximum capacity shortage (%) |
0, 2.5, 5, 7.5, 10 |
Table 8.
Optimization results.
Table 8.
Optimization results.
| |
Specification |
Unit |
Best hybrid system per category |
| Category 1 |
Category 2 |
Category 3 |
Category 4 |
Category 5 |
| System architecture |
PV array |
kW |
50 |
100 |
50 |
0 |
125 |
| |
Wind turbine |
Number |
1 |
0 |
3 |
5 |
0 |
| |
Hydrogen Tank |
kg |
25 |
25 |
175 |
200 |
175 |
| |
Electrolyser |
KW |
30 |
30 |
20 |
20 |
100 |
| |
Fuel Cell |
kW |
10 |
10 |
5 |
5 |
10 |
| |
Converter |
KW |
10 |
10 |
0 |
15 |
0 |
| |
Dispatch strategy |
LF or CC |
CC |
CC |
CC |
CC |
CC |
| Cost |
LCOE |
$/kWh |
0.451 |
0.456 |
0.529 |
0.680 |
0.715 |
| |
NPC |
$ |
138,202 |
144,342 |
165,916 |
212,690 |
223,902 |
| |
Total O & M cost |
$/year |
5,960 |
7,263 |
3,935 |
4,041 |
11,957 |
| |
Total capital cost |
$ |
52,963 |
40463 |
109638 |
154,750 |
52,888 |
| Power production |
PV array |
kWh/year |
92,436 |
184,873 |
92,436 |
0 |
231,091 |
| |
Wind turbine |
kWh/year |
23,517 |
0 |
70,550 |
117,584 |
0 |
| |
Fuel Cell |
kWh/year |
7,321 |
12,937 |
6,063 |
4,466 |
21,890 |
| |
Total electricity production |
kWh/year |
123,274 |
197,810 |
169,050 |
122,049 |
252,980 |
| |
Capacity shortage |
kWh/year (%) |
1,044 (4.65) |
558 (2.49) |
1,144 (5.1) |
1,119 (4.98) |
788(3.51) |
| |
Unmet load |
kWh/year (%) |
641 (2.86) |
334(1.49) |
539(2.4) |
601 (2.68) |
572 (2.55) |
| |
Excess electricity |
kWh/year (%) |
24,254 (14.7) |
41,182 (20.8) |
83,149 (49.2) |
47,813(39.2) |
4,263 (1.69) |
| Capacity factor |
PV array |
% |
21.1 |
21.1 |
21.1 |
0 |
21.1 |
| |
Wind turbine |
% |
26.8 |
0 |
26.8 |
26.8 |
0 |
| |
Fuel Cell |
% |
8.36 |
14.8 |
13.8 |
10.2 |
25 |