Submitted:
30 April 2025
Posted:
30 April 2025
You are already at the latest version
Abstract
Most of the world's energy needs are in rural and isolated regions. Hybrid energy systems (HES), combining different types of renewable energy and energy storage technologies, can provide a viable solution for off-grid electrification in rural areas. This paper evaluates the performance analysis, and optimization of an autonomous hybrid system incorporating solar-photovoltaic (PV) array, wind-turbine, storage batteries, and backup generator. It focuses on the case study of an isolated village in Namibia, characterized by high solar irradiation levels and limited availability of wind power. The local load profile, solar irradiation, and wind speed data were employed to ensure precise system model. Using HOMER Pro software for hybrid system simulation, a more advanced optimization was carried out utilizing two metaheuristic algorithms, namely, the Grey Wolf Optimization (GWO), and Harris Hawks Optimization (HHO). The results indicate the best performance was obtained with the GWO algorithm, which achieved a minimum energy cost (COE) of $0.268/kWh. This study demonstrates that advanced techniques can enhance the economic and technical efficiency of hybrid systems to achieve a sustainable electricity supply in rural areas.
Keywords:
Hybrid system
; cost of energy
; feasibility
; Grey Wolf Optimization
; Harris Hawks Op-timization
; battery energy storage
1. Background
Energy systems worldwide are undergoing a major transformation to reduce greenhouse gas emissions and improve power supply security. The combination of diverse renewable energy systems in hybrid notation (HRES), such as: solar-PV, hydro and wind power sources, represent a viable means of providing reliable and sustainable power. A challenge in southern Africa continues with energy supply, especially for the rural zones. In Namibia, for example, electrification is hampered by the scattered nature of the country's housing and the size of its territory. Although the national rate of access is around 55%, the rural zones remain insufficiently supplied. As a result, the country is highly reliant on imported electricity, which means it is particularly vulnerable. Yet Namibia has considerable renewable energy potential, in particular for solar and wind power, which could be used to develop hybrid renewable energy systems (HRES) to increase accessibility to power, decrease dependence on external sources of energy, and reduce reliance on conventional fossil sources.
However, a hybrid renewable energy system integrates one or more power production alternatives to satisfy a specific demand [1,2]. There is growing global interest in hybrid systems using renewables, with photovoltaic (PV) and wind power providing a powerful alternative for supplying electricity to communities without power [3,4]. The seasonal variability of both solar and wind sources enables them to complement each other, and therefore their combination provides a reliable and continuous power supply [5,6]. Emergency power is generally used to provide energy in periods of low insolation and weak wind power. While diesel generators are considered environmentally unfriendly, they supplement unpredictable renewable energy being intermittent sources, as their electricity supply does not fluctuate according to season [7]. Since the majority of renewable energy sources are intermittent, incorporating these DGs in the main electricity grid negatively affects the grid's energy power quality [4,5,6,7,8].
Stand-alone renewable energy source (RES)-based microgrid systems represent potentially the most feasible as well as the most cost-effective way to electrify remote off-grid locations [9,10]. Consequently, the optimal planning and design of such a system is economically and technically complex due to several factors. Among them is the incoherence and dependence of RES on meteorological data. The microgrid systems are frequently designed as over- or under-sized to satisfy load-demand. Oversized microgrids will have higher operating costs and produce energy in excess. On the other hand, undersized microgrids cannot serve the required loads. Maximizing the benefits of a microgrid based on RES requires optimal microgrid sizing, hence an energy management system (EMS) strategy, is needed [10,11].
The HRES which combines solar-PV, diesel generator (DG), storage batteries, and wind turbine (WT), have proven to be a viable and cost-effective solution to the problem of rural electricity supply for sub-Saharan Africa, especially in areas of limited availability such as Namibia. Many studies have concentrated on these systems' optimum sizing and performance, combining simulation tools such as HOMER and enhanced optimization algorithms, such as HHO and GWO.
As an example, Adewale et al (2021) [12] studied the optimal configuration of a hybrid system for a Nigerian rural community based on HOMER, with minimization of the COE and net present cost (NPC). Al-Masri et al (2022) [13] in a multi-objective optimization study for a hybrid energy configuration, used GWO, demonstrating enhanced efficiency and reliability. Most recently, Hassan et al (2023) [14] implemented the HHO algorithm for optimum dimensioning of HRES systems in arid areas, achieving higher rates of convergence and lower probability of power loss than other approaches.
This underlines the increasing focus on combining conventional simulation techniques and AI-derived optimization to solve rural off-grid energy access problems. While HOMER offers a comprehensive technical-economic framework, GWO and HHO provide improved research capacities on complex, high-dimensional optimization issues. Although these methods have proved effective, there is still limited literature comparing and applying GWO and HHO optimization approaches to real hybrid systems from Namibia.
This study contributes to this area of research by presenting optimization results of a hybrid energy system in a rural location of Namibia, using the HOMER simulations in conjunction with the HHO and GWO techniques. The aim is to minimize the global cost of the system at the same time as optimizing energy reliability, the contribution of renewable energies, and the sizing of the hybrid system. Table 1 presents a summary of related works.
To meet the needs of remote rural zones, this study presents a comparative and robust method based on both classical and artificial intelligence approaches for sizing a hybrid energy system. The adopted methodological approach is based on the following:
- -
- Energy modeling of the hybrid energy system using fundamental techno-economic equations.
- -
- Optimization with HOMER Pro, which was used based on hourly simulations to serve as a reference tool;
- -
- Optimization using the GWO and the HHO algorithms, inspired by biology, implemented in MATLAB to investigate the space of solutions;
- -
- Comparing the results about the optimal sizing, COE, loss of power supply (LPSP), and reliability to ascertain which approach fits the rural context best.
2. Materials and Methods
This study adopted the basic two-stage method for optimal hybrid system design at a rural site in Namibia. In the first step, HOMER software was used to carry out a techno-economic preliminary assessment and determine a feasible system configuration based on resource availability and basic constraints. This stage provided a baseline in terms of the component sizes and system cost.
Advanced optimization methods were then applied using MATLAB to improve the system's dimensioning and performance. The HHO and GWO methods were employed to identify optimum number of solar-PV panels, DG capacity, storage batteries and WTs. These methods aimed to minimize key indicators of performance such as NPC, COE, and LPSP.
The optimum configurations achieved by GWO and HHO were compared with the HOMER reference results. In addition, the optimal configurations have been tested in various weather situations to evaluate both the robustness and the adaptability of the design of system. Figure 1 shows the general framework of the research study.
2.1. Description of Namibia
Namibia, situated in the southwest of Africa, has extensive arid and semi-arid scenery, which makes the country among the world's sunniest. This plentiful supply of solar energy, coupled with limited wind power potential in some coastal and interior areas, provides exciting prospects for hybrid energy systems (HES), especially in non-urban and remote rural villages with limited access to grid energy.
In this study, a rural site in Namibia was selected which has a characteristic off-grid requirement profile, assuming a basic charge of around 16.16 kW. Figure 2 shows a load profile with three different consumption peaks for a day: firstly, a morning peak from 7 am to 8 am of 54.00 kW, a second peak between 1 pm and 2 pm of 41.00 kW, and a third peak in the evening between 7 pm and 8 pm. For the area of study, peak load is 91.00 kW each day, and consumption is approximately 615 kWh/day on average.
These characteristics make the location ideally placed for a hybrid energy system configuration, which is optimized to provide a cost-effective and reliable energy supply whilst exploiting the renewable resources of the region.
Figure 3 presents the yearly profile of solar radiation over the study zone for one year. This profile is based on mean monthly data on solar radiation in the study site supplied by the NASA [21]. Solar intensity is between 3.66 kWh/m²/d and 6.43 kWh/m²/day. Annual solar insolation is 5.13 kWh/m²/day. It is weakest in the winter season, and strongest in summer season.
The wind profile of the area under study over a one-year period is shown in Figure 4. Average yearly wind speed recorded is approximately 3.5 m/s.
The energy supply system and the hybrid system at the Namibian site in southern Africa is shown in Figure 5. It consists of a solar-PV plant and a WT, which are used as a sustainable energy source. Back-up power supply is provided by a diesel generator in the event of insufficient production, while a battery farm provides compensation for production and converters.
2.2. Modeling of Hybrid System
Modelling of the hybrid energy system is designed to illustrate the energy and dynamic performance of a photovoltaic/wind/diesel/battery microgrid designed to meet the requirements for a rural location in Namibia. At this stage, the system's performance can be assessed in various weather parameters and with different charging profiles, using advanced optimization techniques. The data and costs for each source and formulation used for all hybrid system technical parameters, conversion models, and operational characteristics (PV, wind, diesel generator, and battery) are given at [18,19,20]. It was selected for its coherence with remote location conditions and the exhaustiveness of the data available covering the energy, economic, and dynamics of each source.
2.2.1. Models of Photovoltaic (PV) Panels
Output power output from a solar-PV unit is dependent on the solar insolation and the temperature of the cells [22]:
With NPV indicates the number in the photovoltaic array, PPV, ref is the rated power output of the array assuming Gref = 1000 W/m², G (t) indicates the current radiation (W/m²), Tc (t) represents the temperature of the cells (°C), αT indicates the temperature coefficient of performance (%/°C).
2.2.2. Wind Turbine (WT) Model
The WT power output is represented by [22]:
Where v is the wind speed (m/s), vcut-in, vrated, vcut-out is the characteristic speeds (m/s), vrated is the rated power of the WT.
2.2.3. Diesel Generator (DG) Model
FDG represents the fuel consumption per hour (L/h),
a, b represent specific coefficients of the generator,
PDG, nom represents the rated power of the generator,
PRES represents combined solar photovoltaic and wind power generation, and
SOC is battery state of charge.
2.2.4. Model of Battery Energy Storage System
The SOC is modeled as in [22]:
Pch (t), Pdis (t) present charging and discharging output (kW), ηc, ηd are charging and discharging efficiency, and Cbat presents the nominal battery capacity (kWh).
2.3. Optimization Problem Formulation
The optimum system configuration for a hybrid solar-PV, DG, WT, and battery energy storage system (BAT) is to provide a durable solution for the power requirements of a rural, isolated zone. To meet these requirements, a multi-objective approach to optimize the system has been implemented, incorporating technical, economic, reliability, and environmental factors. It considers three different objective functions at the same time:
- Minimize the average COE (LCOE).
- Minimize LPSP.
- Maximize the renewable energy fraction (RF).
The problem's mathematical formulation was as shown below:
Where
X= [PPV, PWT, PDG, Ebat, Pinv] is the vector of the decision parameters, respectively representing the power output of the photovoltaic field, WT, DG, BAT and the inverter.
Objective functions can be defined in the following way:
The discounted cost of energy (COE) is obtained as [18,19,20]:
Where Ctot represents the discounted total cost for the system during the project lifespan, and Eload,served represents the electrical energy supplied to the load.
The LPSP probability [18,19,20] is:
Where Edeficit (t) corresponds to energy unmet at time t, and Eload (t) corresponds to the demand for energy.
The renewable fraction (RF) corresponds to the proportion of renewable energies in the overall generation [18,19,20]:
The following technical constraints must be met:
2.4. The Grey Wolf Optimizer (GWO) Methods
GWO is a metaheuristic approach that is based on nature. It was presented by Mirjalili et al. [23] in 2014. The GWO algorithm simulates the command hierarchy and behavior of natural gray wolves. This algorithm is especially noted on account of its robust simplicity, high global finding capacity, and effectiveness at resolving complicated optimization issues using minimum parameter settings.
In GWO, there are four hierarchical population levels, namely: alpha (α), beta (β), delta (δ), and omega (ω). The three most successful wolves (α, β, and δ) provide search guidance, while the remainder of the population (ω) discount positions according to the leads. The process of hunting is modeled in mathematical terms by the mechanics of circling, attack, and prey search.
The position of each wolf symbolizes a solution candidate within the research area, and the target is the optimum of the objective function. Throughout iterations, wolves approach the position of the prey to update their positions, under the guidance of the top three wolves. This balance of exploration and exploitation guarantees the convergence to the global optimum and prevents a premature convergence.
The mechanism of position updating is ruled by the equations (10) :
Where:
is the position vector of the prey (best solution).
is the current position vector of the gray wolf.
and are both the coefficient vectors defined as follows :
In this case, reduces linearly over iterations from 2 to 0, and , ∈ [0,1] represent a random vector.
By iteratively adjusting the positions, GWO imitates the smart cooperative chasing strategies of gray wolves to efficiently achieve an optimum or near-optimum solution. Figure 6 shows the description of GWO.
2.5. Harris Hawks Optimization (HHO) Methods
The HHO algorithm is a population-based metaheuristic recently introduced by Heidari et al. [24] in 2019, based on the collaborative Harris's hawk hunting strategy. These raptors display an intelligent and adaptable hunting behavior, often encircling and engaging their prey in a coordinated fashion. HHO mathematically models this dynamic behavior to solve complex optimization problems with high accuracy and robust convergence performance.
This algorithm provides a simulation of the exploratory and exploitative phases, depending on the prey's energy and escape patterns. During the search phase, the falcons carry out a systematic random search for the prey in the solution space, in order to keep the population diverse. When the target has been found, they enter the exploitation phase, where different strategies, such as gentle besieging, hard besieging, and fast diving, are used depending on the prey's energy of escape. The phase transition is controlled by the prey's escape energy (E), which can be described as:
Where:
E0 represents the prey's starting energy (a random number within [-1,1]),
t represents the current iteration, and
T represents the maximum iteration number.
Hawks are updating positions using a variety of different strategies according to both the value of E and a random probability r ∈ [0,1] :
- Soft seat (|E| ≥ 0.5 and r ≥ 0.5) :
- Hard besiege (|E| < 0.5 and r ≥ 0.5) :
- Soft seat with progressive fast dives (|E| ≥ 0.5 and r < 0.5) :
- Hard seat with dips (|E| < 0.5 and r < 0.5) :
3. Results
With HOMER software and algorithms, GWO and HHO, were used to perform simulations based on different scenarios of interconnected energy facilities. These methods were used to optimize the dimensioning of the various system components and determine the technical and economic performance of the solutions proposed. The cost of energy (COE) was used as the principal parameter for determining which option was the best in each case. The following subsections present the optimisation results, including the economic and technical characteristics of the model studied.
3.1. Result by Homer Software
Table 2 shows the results of the analysis of the energy system. The WT generates 60.8% of the electricity. The excess electricity, unserved load demand, and the capacity shortage are given as: 393,722, 164, and 272 kWh/year, respectively.
Table 3 shows the yearly discharge of pollutants resulting from the investigated system. Carbon dioxide (CO₂) is the main emission, with 847 kg/year, which indicates a substantial greenhouse gas emission impact. The other air pollutants comprise carbon monoxide (6.41 kg/year), nitrogen oxides (7.28 kg/year), and Sulphur dioxide (2.08 kg/year), known for having an impact both on air safety and human health. The emissions of particulate pollutants (0.389 kg/year) and of unburnt hydrocarbons (0.234 kg/year) are relatively low, but not insignificant. With these results, we can evaluate the system's environmental performance measured by emissions of pollutants.
Figure 8 illustrates the economic flows of the system for 25 years. An initial investment cost of around USD 85,000 is incurred. There are periodic fuel costs (approximately $30,000) at 4-year intervals, with a salvage cost of around $40,000 recorded at the system's life. There are no significant operating or replacement costs. The overall system component cost is shown in Table 4.
Based on the HOMER optimization result, the optimized sizing of the hybrid system components is chosen according to optimal economics as presented in Table 5. As a stand-alone system, the penetration of renewable energy represents 100%, which can be observed from Figure 9.
Figure 10 shows the monthly electricity production estimated for the optimum configuration for each power source.
Figure 11 illustrates the photovoltaic system's hourly output over the year. The production peak occurs from 6 a.m. to 6 p.m., around midday, when the sun is most intense. Output is generally highest in summer (around the 180th day) but lowest during the winter, reflecting variations in sunshine levels over the year. The figure also illustrates the daily variations caused by changing meteorological factors. Figure 12 shows the inverter's power and generation output profile over one year, with a 28.6% power factor in the inverter and a 0.140% power factor in the rectifier.
Figure 13 shows the yearly variation by state of charge and demonstrates stability, with a SoC usually ranging from 20% to 100%, reflecting the efficient management of storage. There are a few seasonal decreases, notably from March to June, but this does not compromise the general availability of the system.
3.2. Results by GWO and HHO Methods
Figure 14 shows a comparison based on the yearly energy source contribution of two optimisation approaches, GWO and HHO. For both methods, the solar power (PV) comes first, with a slightly larger contribution from GWO (58%) as compared to HHO (54.1%). HHO makes greater demands on diesel generators (22.8% compared with 20.8%) and batteries (13.7% compared with 12.5%). Wind power (WT) accounts for a small proportion of both. The GWO, therefore, favours solar power, while the HHO has a more balanced distribution.
Table 6 compares the performances of the different hybrid systems (HERS), which were optimized by three methods: GWO, HHO, and HOMER. The results show that the GWO-based system provided the most cost-effective technical solution, offering a COE value of $0.268/kWh, with a LPSP of 0.234% as well as a relatively high reliability factor (RF) of 87.79%. The HHO-based system shows a marginally better COE ($0.276/kWh) and a lower reliability (82.85%). On the other hand, the system generated by HOMER, although very reliable (RF = 98.6%), has a significantly higher COE ($0.98/kWh), which makes it less economically competitive.
4. Conclusions
The study concentrated on the optimum dimensioning of a hybrid energy system which combined solar-PV, WT, DG, and storage batteries to supply an isolated rural site. Three approaches were used: simulation with HOMER Pro and two bio-inspired artificial intelligence approaches, specifically Grey Wolf Optimizer (GWO) and Harris Hawks Optimization (HHO).
The results indicated that both the GWO and HHO approaches resulted in optimal system configurations that achieved a COE in the range of $0.268 to $0.276/kWh and a LPSP below 1%, as well as ensuring high system availability and reliability. In comparison, with the HOMER method, a more conservative battery capacity configuration resulted in a COE of $0.298/kWh.
Our results demonstrate the value of using computational intelligence approaches for designing suitable hybrid systems for remote sites. In the future, the incorporation based on dynamic loading patterns, real-time optimization, and the cross-utilization between algorithms is are promising avenue for continuously improving the energy and financial efficiency of stand-alone systems.
Author Contributions
RO and IED conceptualized the study and methodology. RO provided the software and conducted the theoretical derivations and AI simulation and analysis; IED provided the case study and data curation; RO carried out the writing of the original draft; IED carried out the validation, review, editing, supervision, and APC funding. All authors have read and agreed to the published version of the manuscript.
Funding
This research received no external funding.
Institutional Review Board Statement
Not applicable
Informed Consent Statement
Not applicable.
Data Availability Statement
Data are available in the manuscript.
Conflicts of Interest
The authors declare no conflicts of interest.
References
- Author 1, A.B.; Author 2, C.D. Title of the article. Abbreviated Journal Name Year, Volume, page range.
- Rezk, H.; Al-Dhaifallah, M.; Alola, A.A. Design and performance analysis of a hybrid PV/wind/diesel/battery energy system for remote areas in Saudi Arabia. Sustain. Energy Technol. Assess. 2020, 37, 100604. [Google Scholar]
- Kabalci, E. A review on the integration of renewable energy systems with smart grid. Renew. Sustain. Energy Rev. 2016, 53, 712–725. [Google Scholar]
- Sinha, S.; Chandel, S.S. Review of recent trends in optimization techniques for solar photovoltaic–wind based hybrid energy systems. Renew. Sustain. Energy Rev. 2015, 50, 755–769. [Google Scholar] [CrossRef]
- Philip, J.; Jain, C.; Kant, K.; Singh, B.; Mishra, S.; Chandra, A.; et al. Control and implementation of a standalone solar photovoltaic hybrid system. IEEE Trans. Ind. Appl. 2016, 52, 3472–3479. [Google Scholar] [CrossRef]
- Khan, I.; Halder, P.K.; Paul, N. Renewable Energy Based Hybrid Nano-Power Station for Remote Isolated Island. In Proceedings of the 4th Global Engineering, Science and Technology Conference, Dhaka, Bangladesh, 2013. [Google Scholar]
- Lal, D.K.; Dash, B.B.; Akella, A.K. Optimization of PV/wind/micro-hydro/diesel hybrid power system in HOMER for the study area. Int. J. Electr. Eng. Inform. 2011, 3, 307–325. [Google Scholar]
- Ogunjuyigbe, A.S.O.; Ayodele, T.R.; Akinola, O.A. Optimal allocation and sizing of PV/Wind/Split-diesel/battery hybrid energy system for minimizing life cycle cost, carbon emission and dump energy of remote residential building. Appl. Energy 2016, 171, 153–171. [Google Scholar] [CrossRef]
- Eftekharnejad, S.; Heydt, G.T.; Vittal, V. Optimal generation dispatch with high penetration of photovoltaic generation. IEEE Trans. Sustain. Energy 2015, 6, 1013–1020. [Google Scholar] [CrossRef]
- Bukar, A.L.; Modu, B.; Gwoma, Z.M.; Mustapha, M.; Buji, A.B.; Lawan, M.B.; Tijjani, I.; Benisheik, U.A.; Bukar, A.; Mai, K.B. Economic Assessment of a PV/Diesel/Battery Hybrid Energy System for a Non-Electrified Remote Village in Nigeria. Eur. J. Eng. Res. Sci. 2017, 2, 21. [Google Scholar] [CrossRef]
- Bukar, A.L.; Tan, C.W.; Lau, K.Y. Optimal sizing of an autonomous photovoltaic/wind/battery/diesel generator microgrid using grasshopper optimization algorithm. Sol. Energy 2019, 188, 685–696. [Google Scholar] [CrossRef]
- Nadjemi, O.; Nacer, T.; Hamidat, A.; Salhi, H. Optimal hybrid PV/wind energy system sizing: Application of cuckoo search algorithm for Algerian dairy farms. Renew. Sustain. Energy Rev. 2017, 70, 1352–1365. [Google Scholar] [CrossRef]
- Adewale, A.; Okoro, O.; Adaramola, M. Optimal configuration of PV/Wind/DG/Battery hybrid energy system using HOMER: A case study in rural Nigeria. Renew. Energy 2021, 168, 409–421. [Google Scholar]
- Al-Masri, A.; Al-Adwan, A.; Saadeh, D. Multi-objective sizing of hybrid energy systems using Grey Wolf Optimizer. Energy Rep. 2022, 8, 1234–1245. [Google Scholar]
- Hassan, H.; Elazab, A.; Salem, M. Harris Hawks Optimization for Off-grid Hybrid Renewable System Design in Arid Regions. J. Clean. Energy 2023, 11, 221–234. [Google Scholar]
- Fadli, M.; Purwoharjono, A. Optimal Sizing of Hybrid Microgrid Using Multi-objective Bat Algorithm. Sustain. Energy Technol. 2022, 10, 450–462. [Google Scholar]
- Shi, J.; Wang, X.; Liu, Y. Genetic Algorithm for PV/Wind/Diesel Hybrid Power System Optimization. Appl. Energy 2020, 265, 114789. [Google Scholar]
- Rehan, M.A. Optimization of grid-connected hybrid renewable energy system for the educational institutes in Pakistan. e-Prime-Advances in Electrical Engineering, Electronics and Energy 2024, 10, 100781. [Google Scholar] [CrossRef]
- Ukoima, K.N.; Okoro, O.I.; Obi, P.I.; Akuru, U.B.; Davidson, I.E. Optimal Sizing, Energy Balance, Load Management and Performance Analysis of a Hybrid Renewable Energy System. Energies 2024, 17, 5275; [Google Scholar] [CrossRef]
- Alzahrani, A. Energy management and optimization of a standalone renewable energy system in rural areas of the Najran Province. Sustainability. 2023, 15, 8020. [Google Scholar] [CrossRef]
- NASA, The United States of America National Aeronautics and Space Administration. https://www.nasa.gov.
- Hamatwi, E.; Davidson, I.E.; Agee, J.; Venayagamoorthy, G.K. Model of a hybrid distributed generation system for a DC nano-grid. In Proceedings of the Clemson University Power Systems Conference (PSC), Clemson, SC, USA, 8–11 March 2016. [Google Scholar]
- Mirjalili, S.; Mirjalili, S.M.; Lewis, A. Grey Wolf Optimizer. Adv. Eng. Softw. 2014, 69, 46–61. [Google Scholar] [CrossRef]
- Heidari, A.A.; Mirjalili, S.; Faris, H.; Aljarah, I.; Mafarja, M.; Chen, H. Harris hawks optimization: Algorithm and applications. Future Gener. Comput. Syst. 2019, 97, 849–872. [Google Scholar] [CrossRef]
Figure 1.
Framework for the research study.
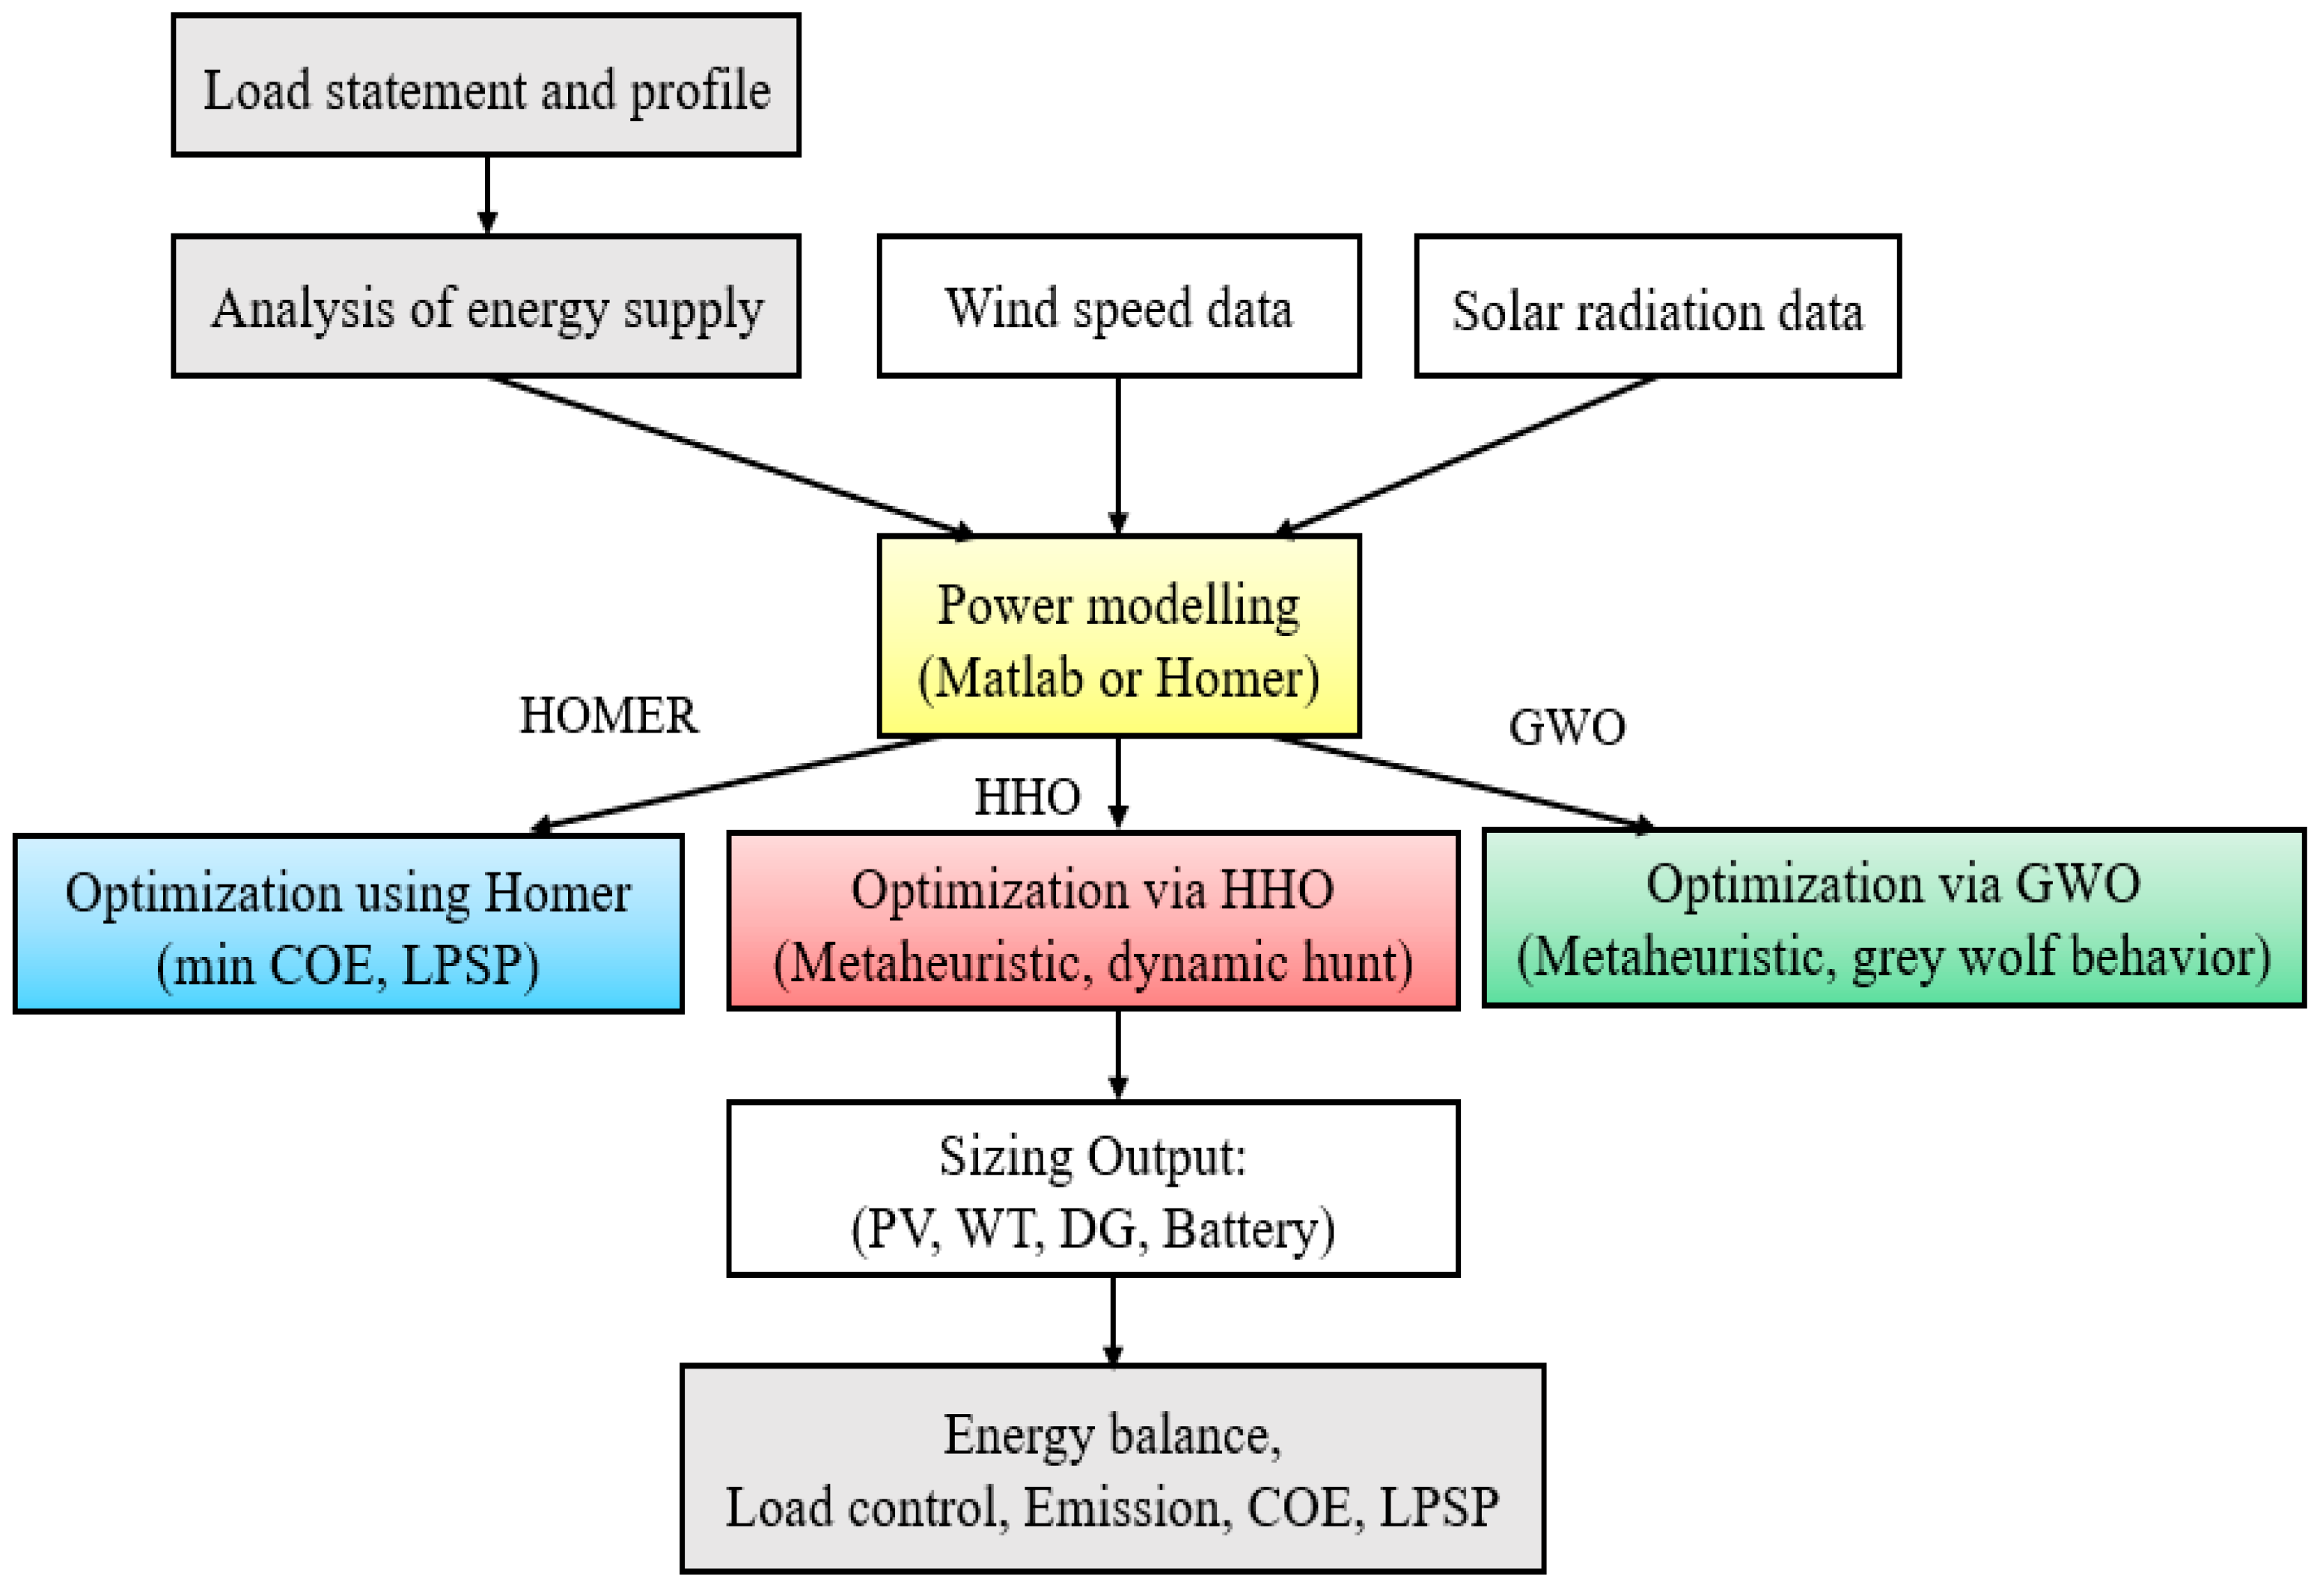
Figure 2.
Average daily load profile for the area under study.
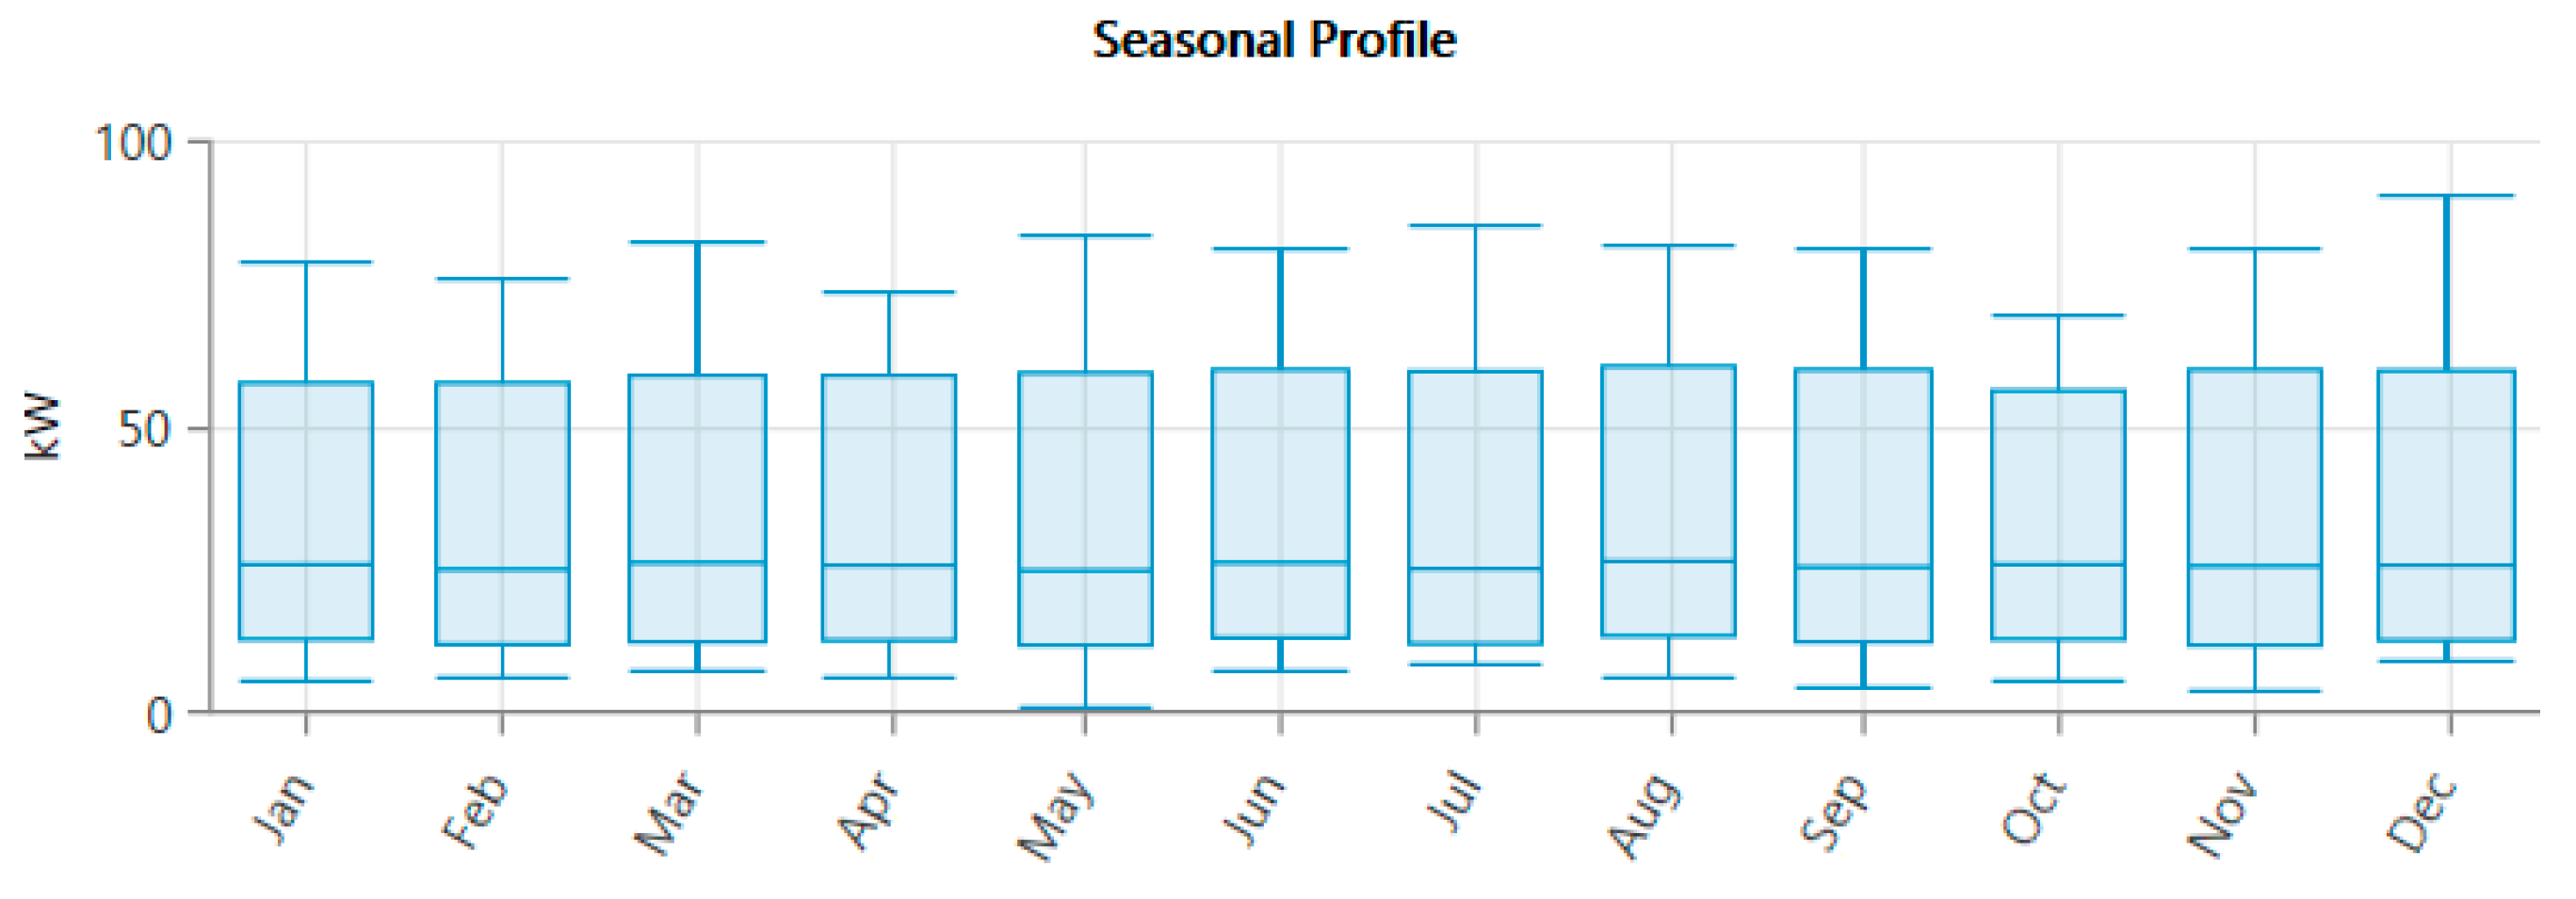
Figure 3.
Monthly solar insolation.
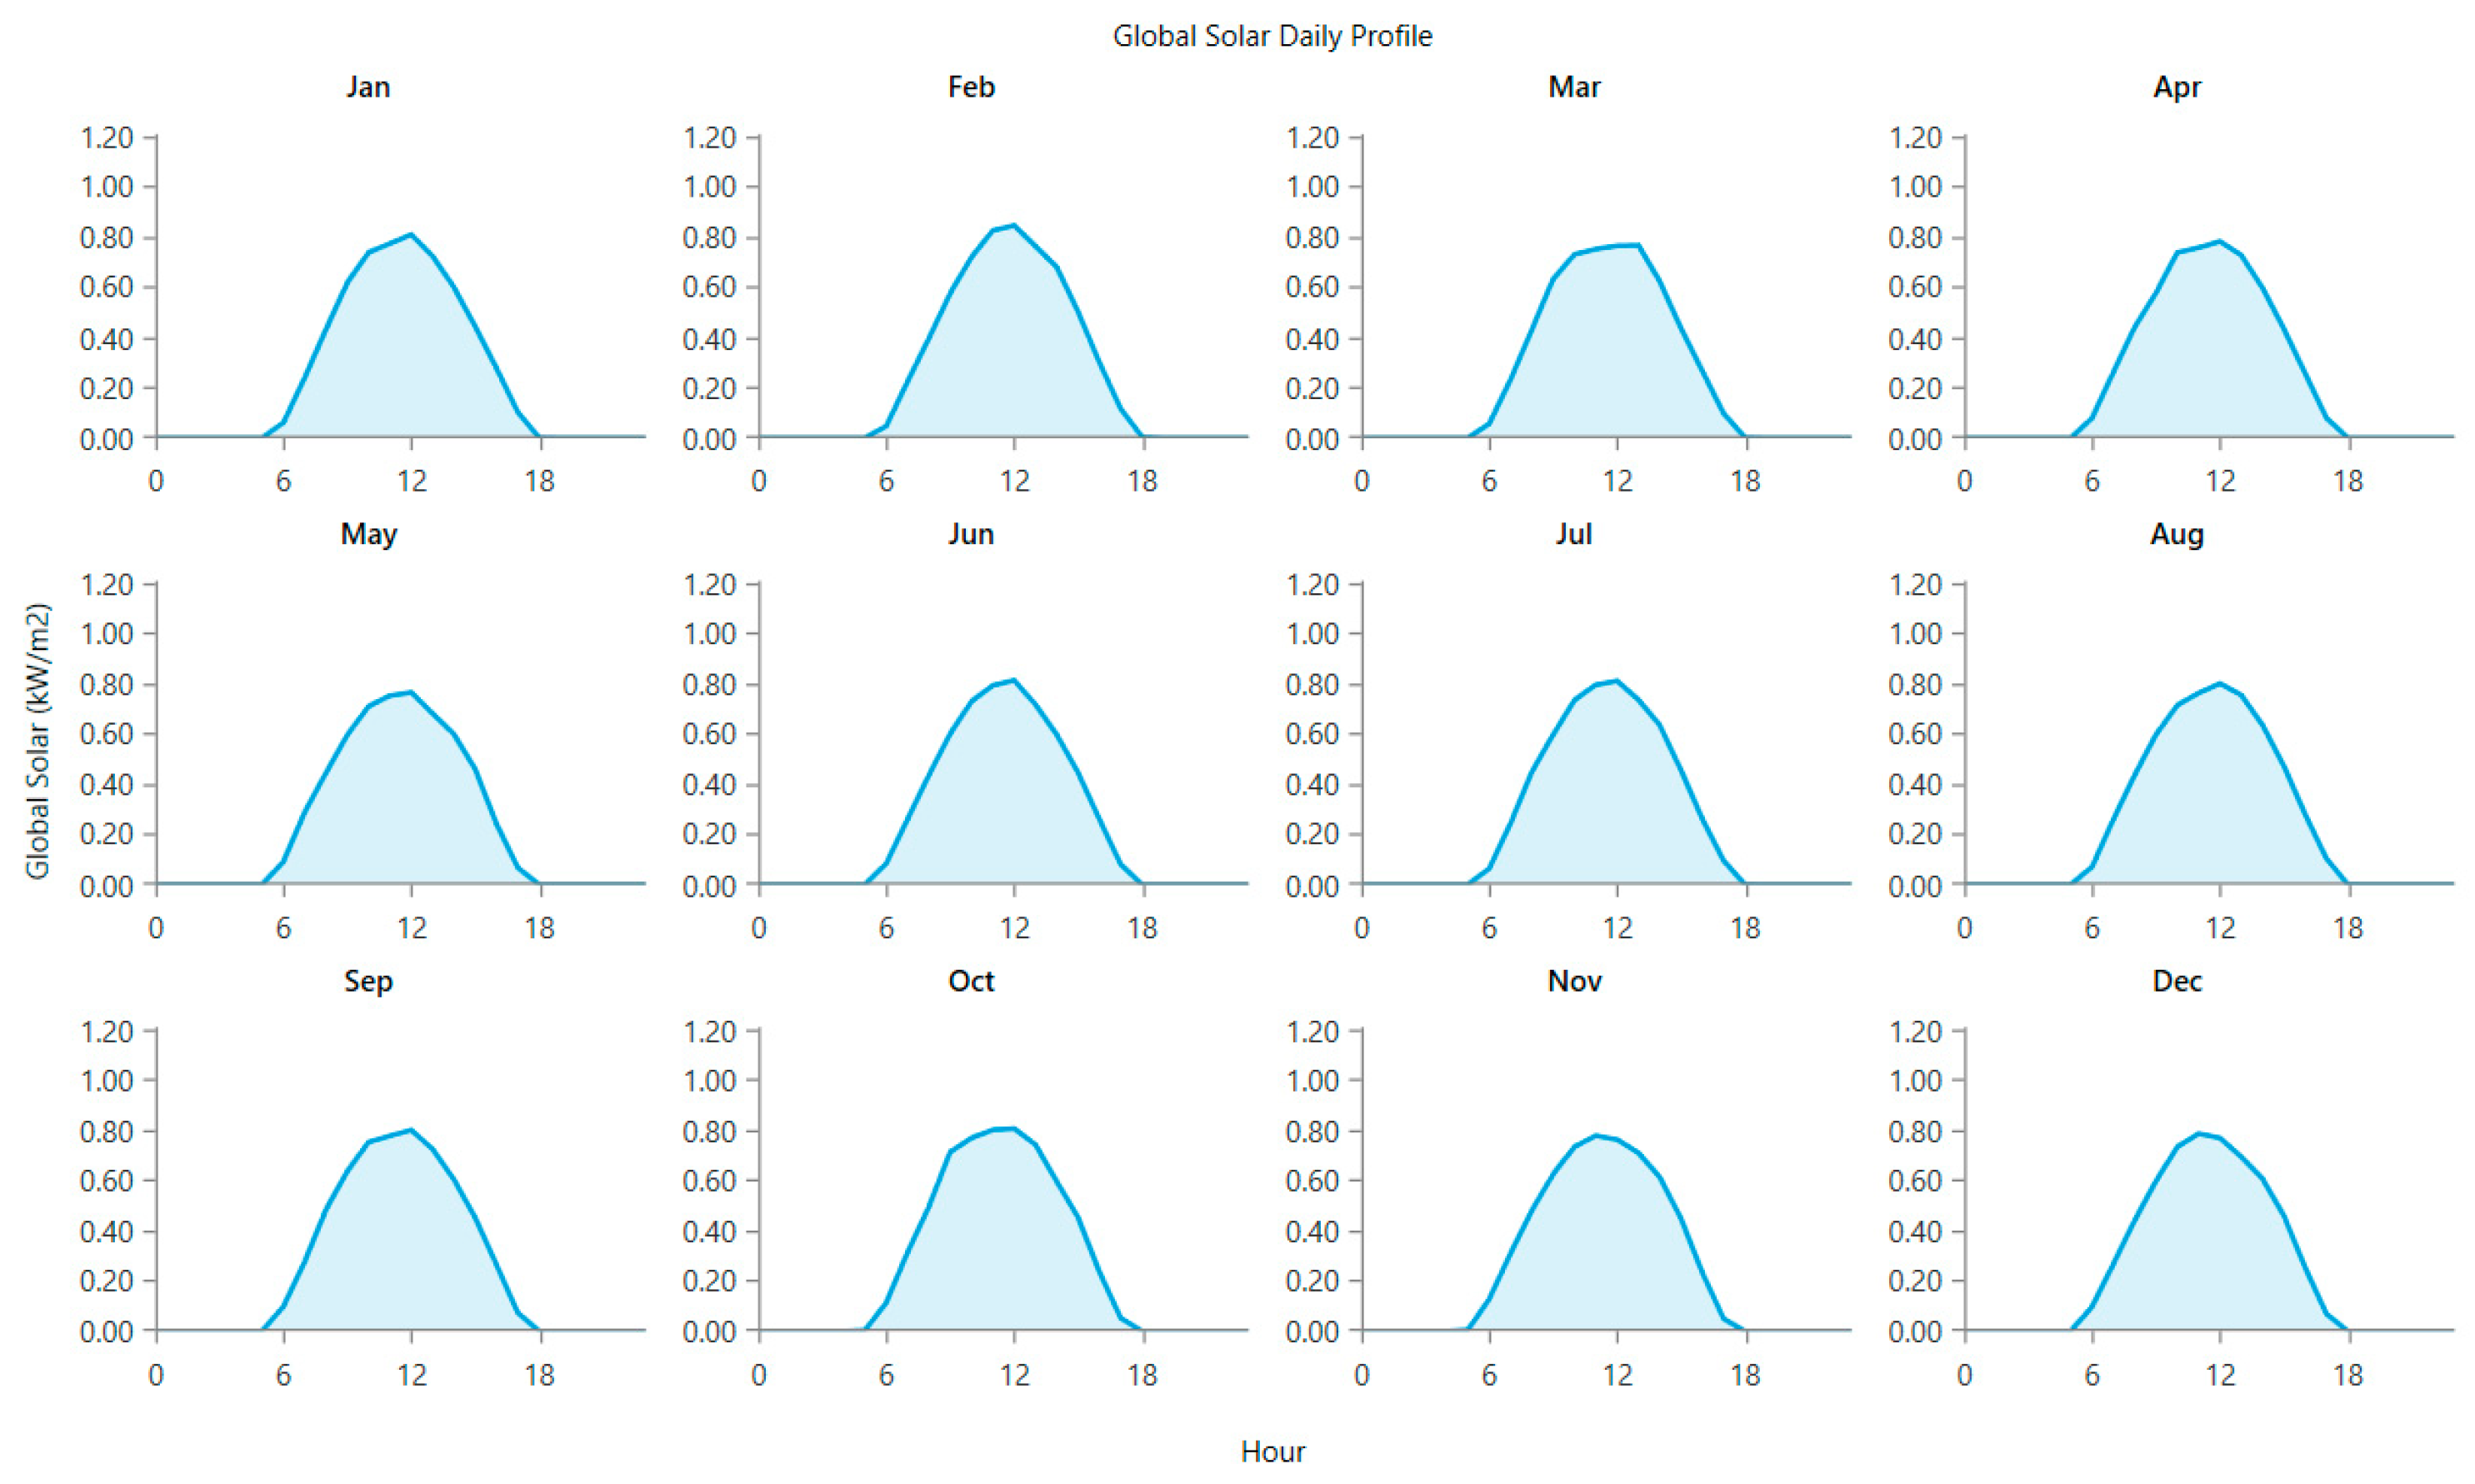
Figure 4.
Monthly average wind speed [22].
Figure 4.
Monthly average wind speed [22].
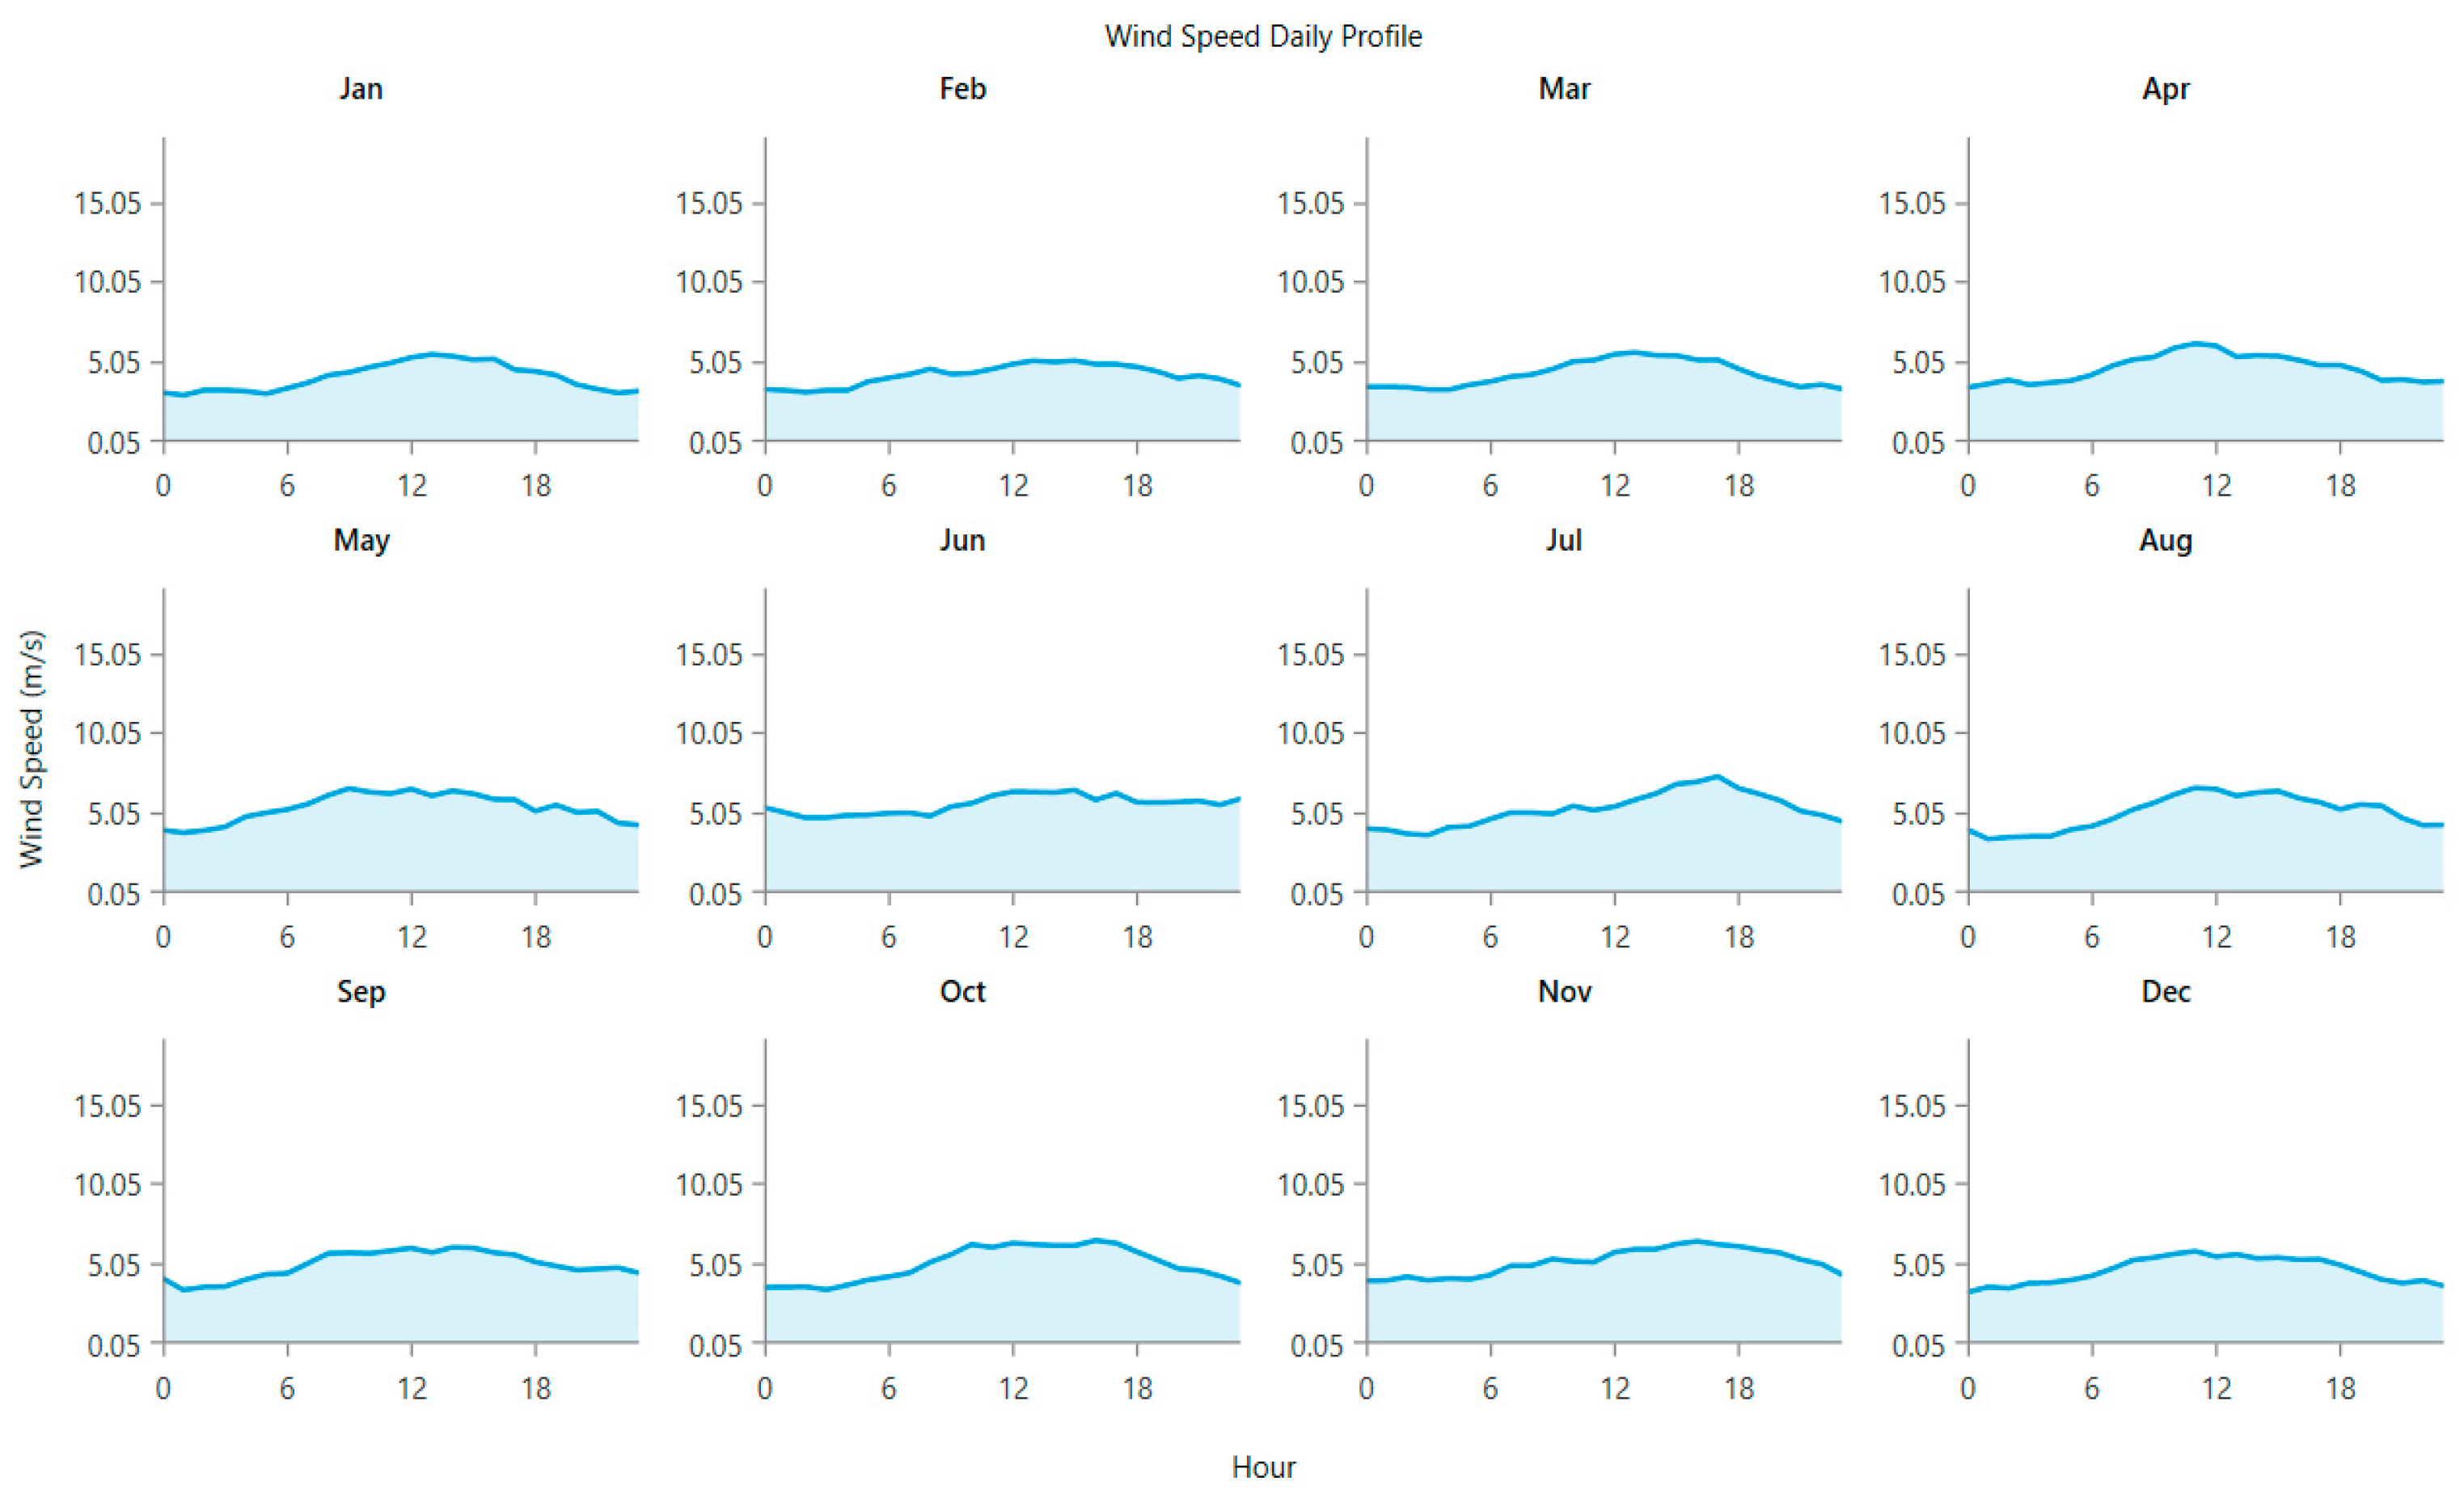
Figure 5.
Proposed diagram of a hybrid system [22].
Figure 5.
Proposed diagram of a hybrid system [22].
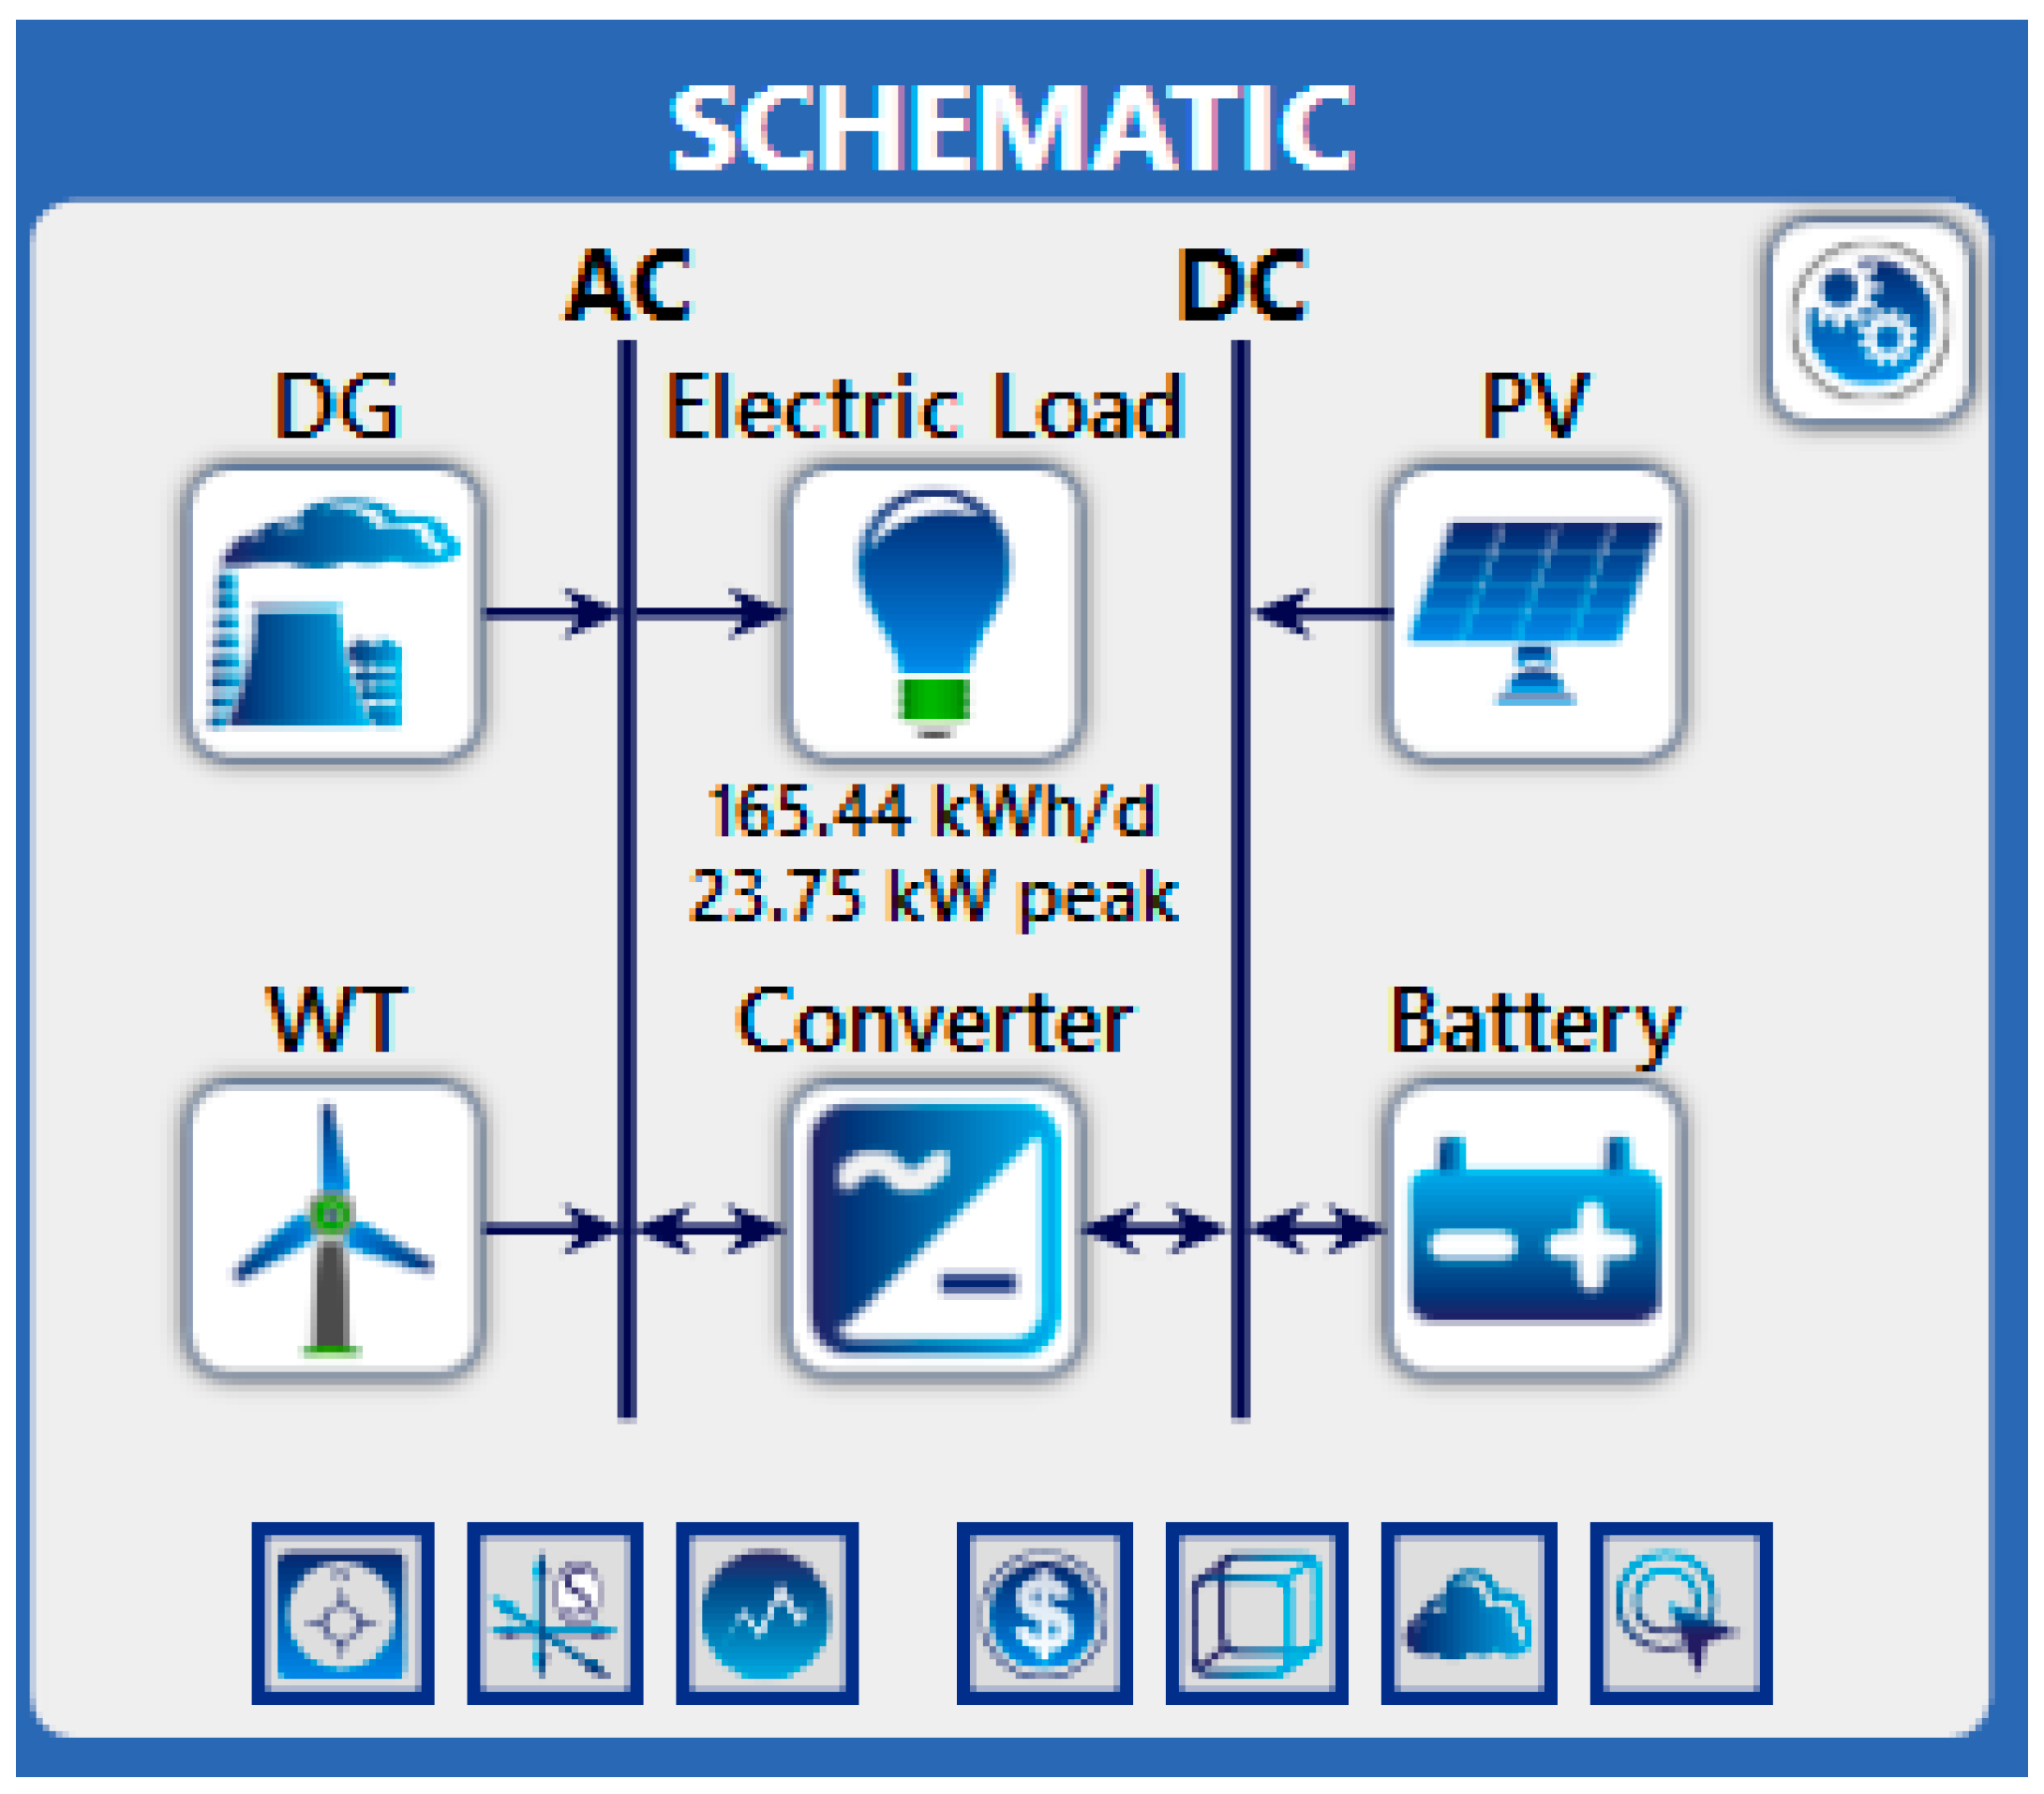
Figure 6.
Flowchart of GWO methodology.
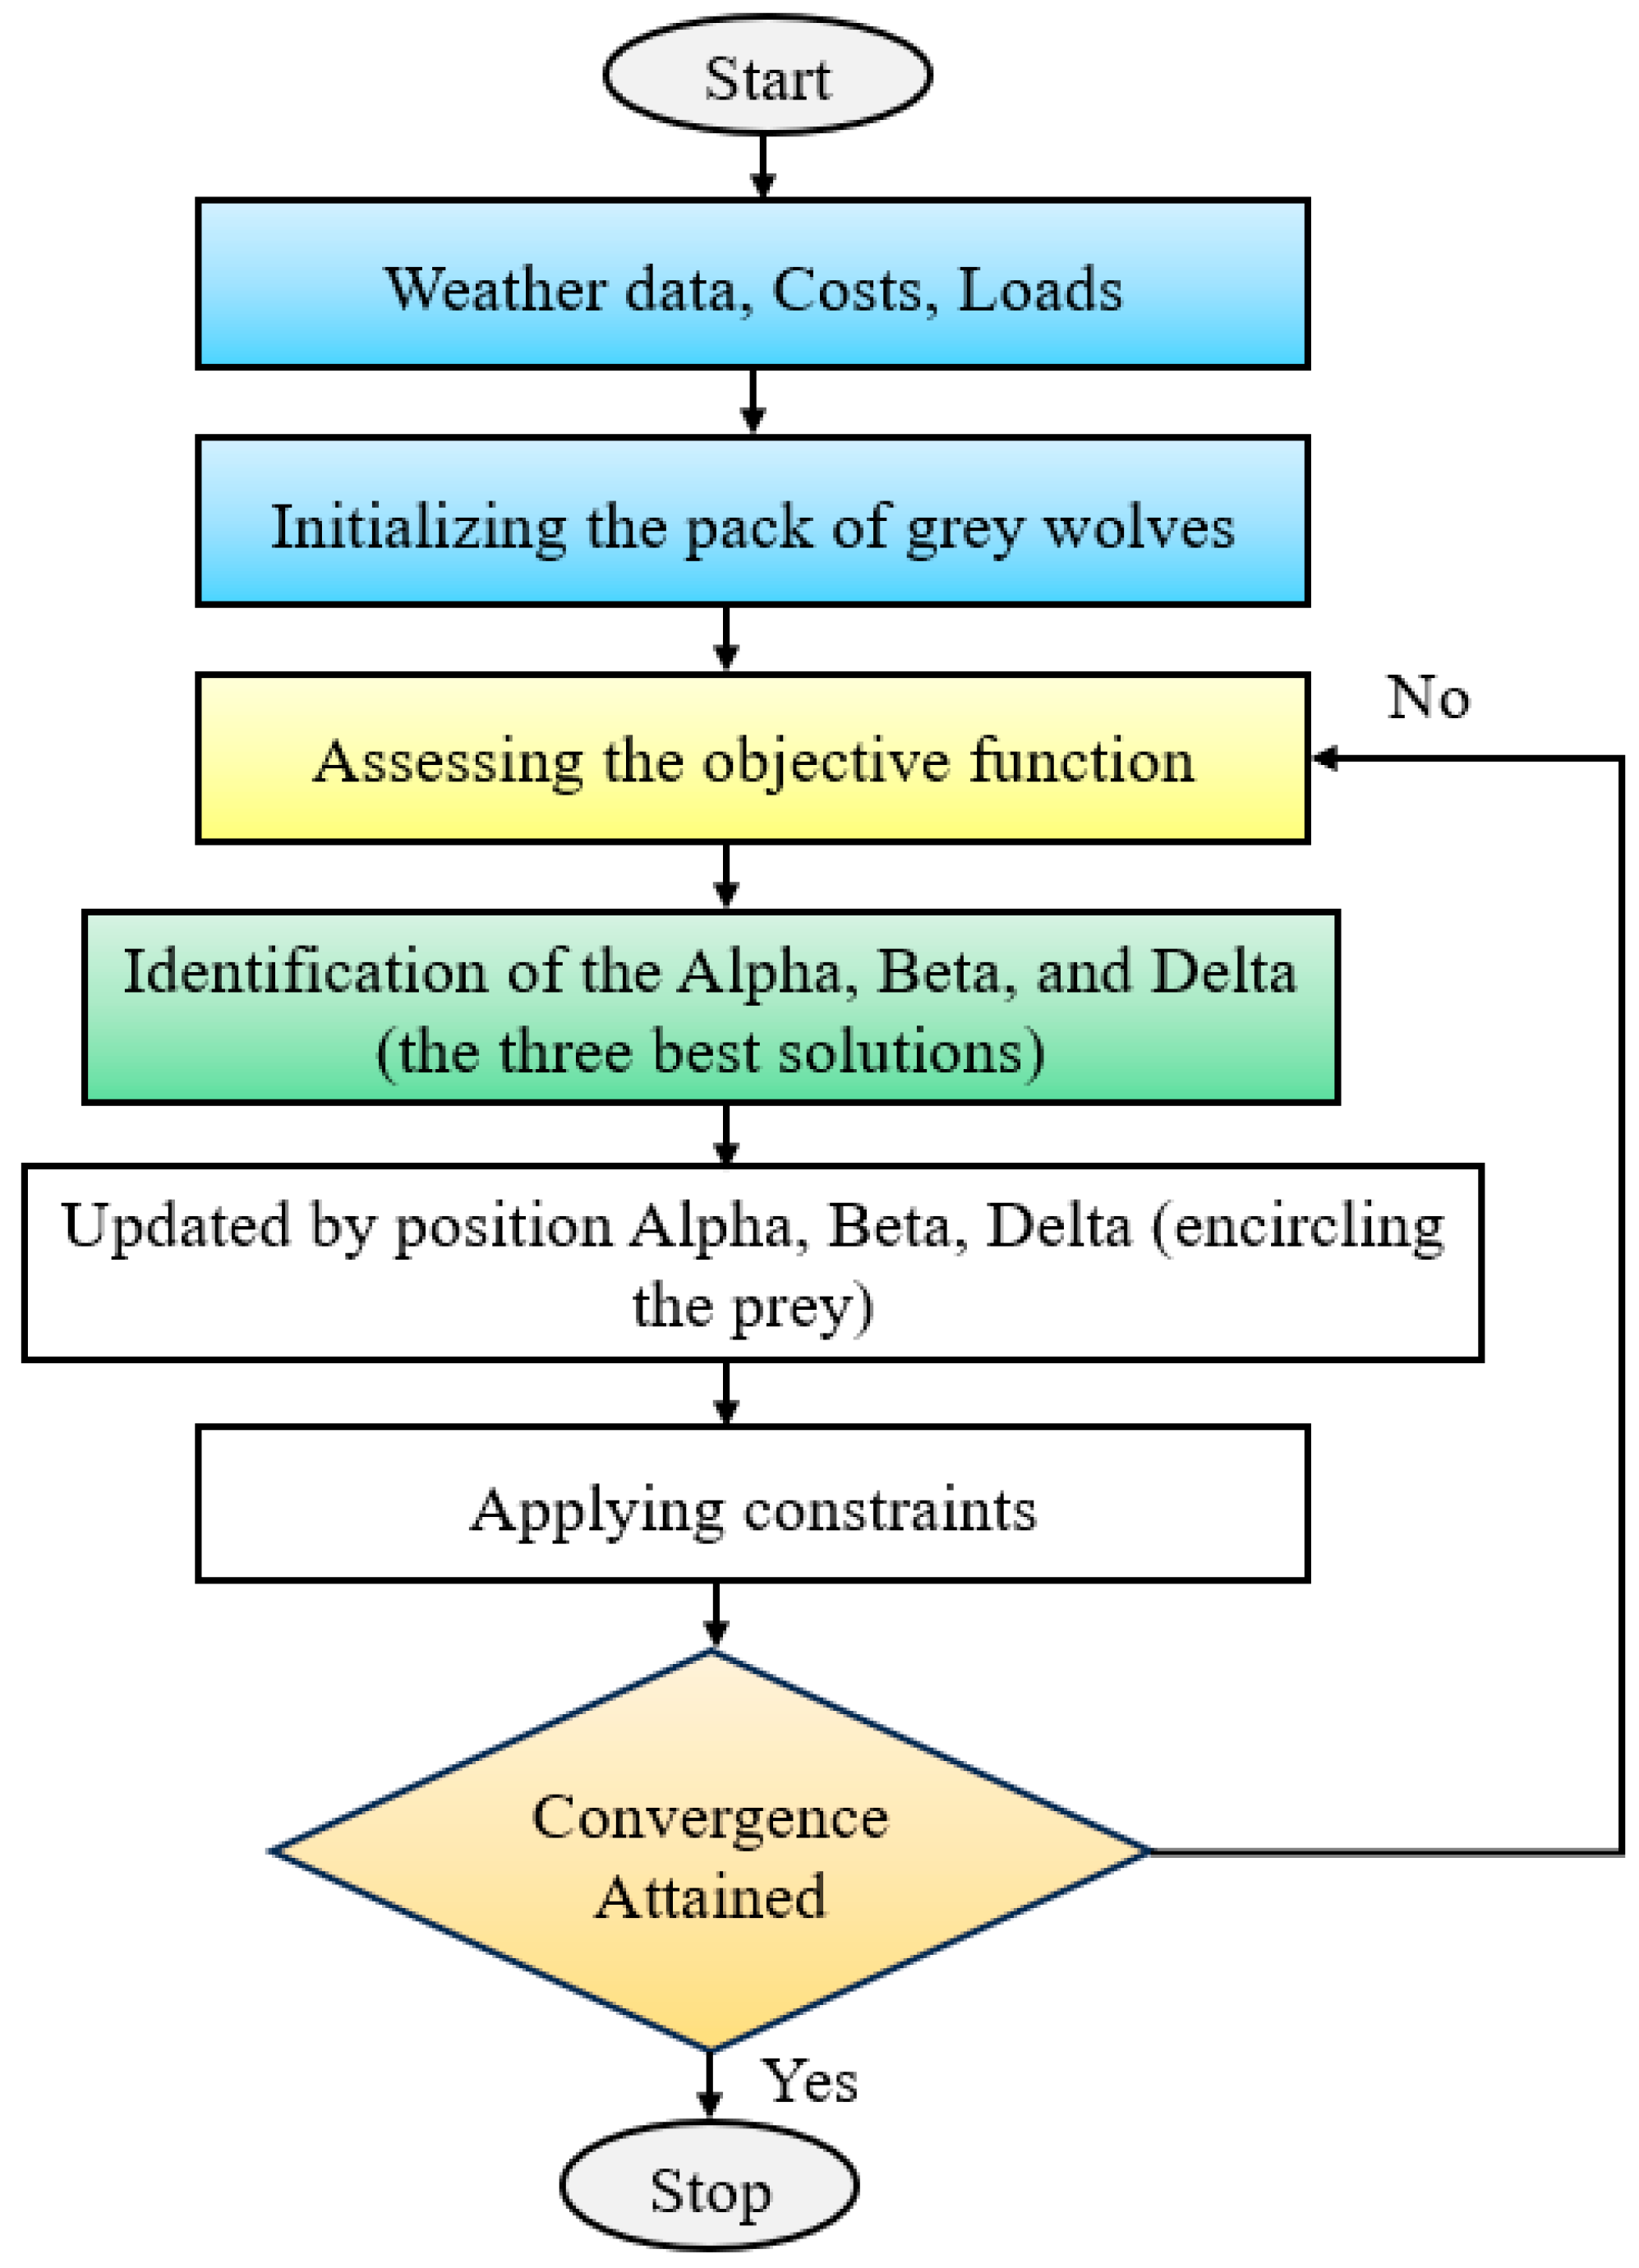
Figure 7.
Flowchart of HHO methodology.
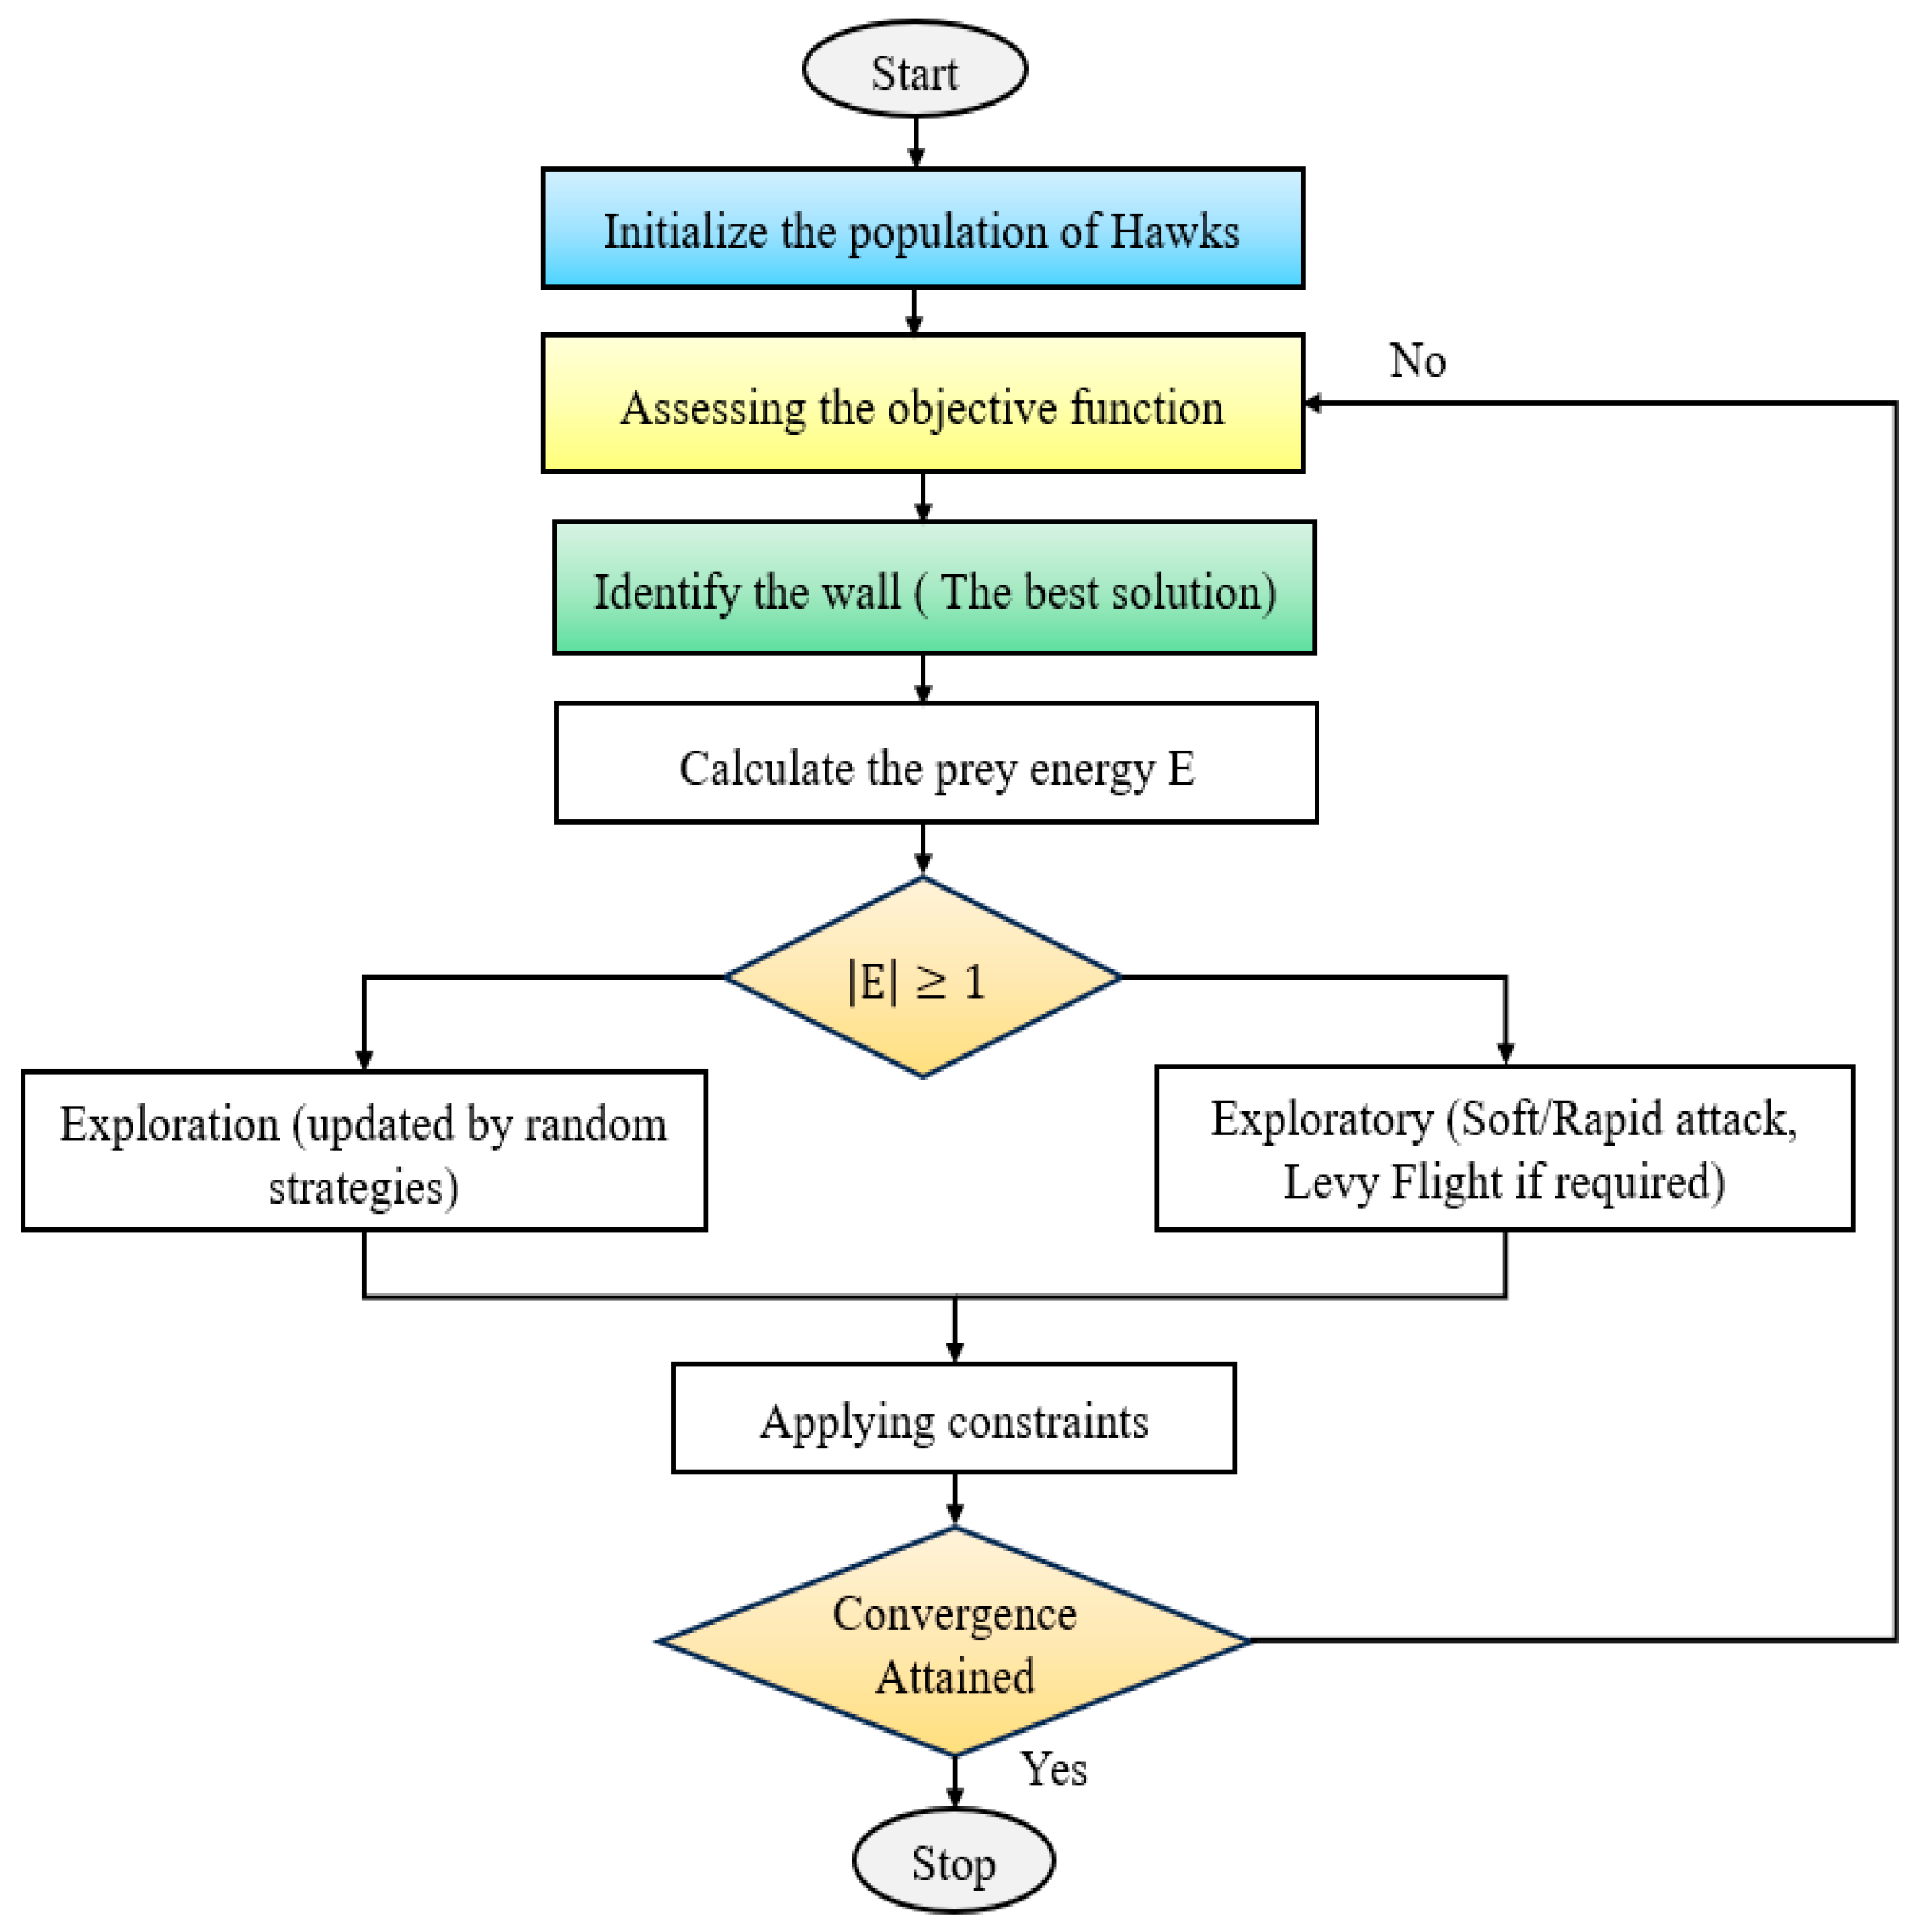
Figure 8.
Analysis of costs.
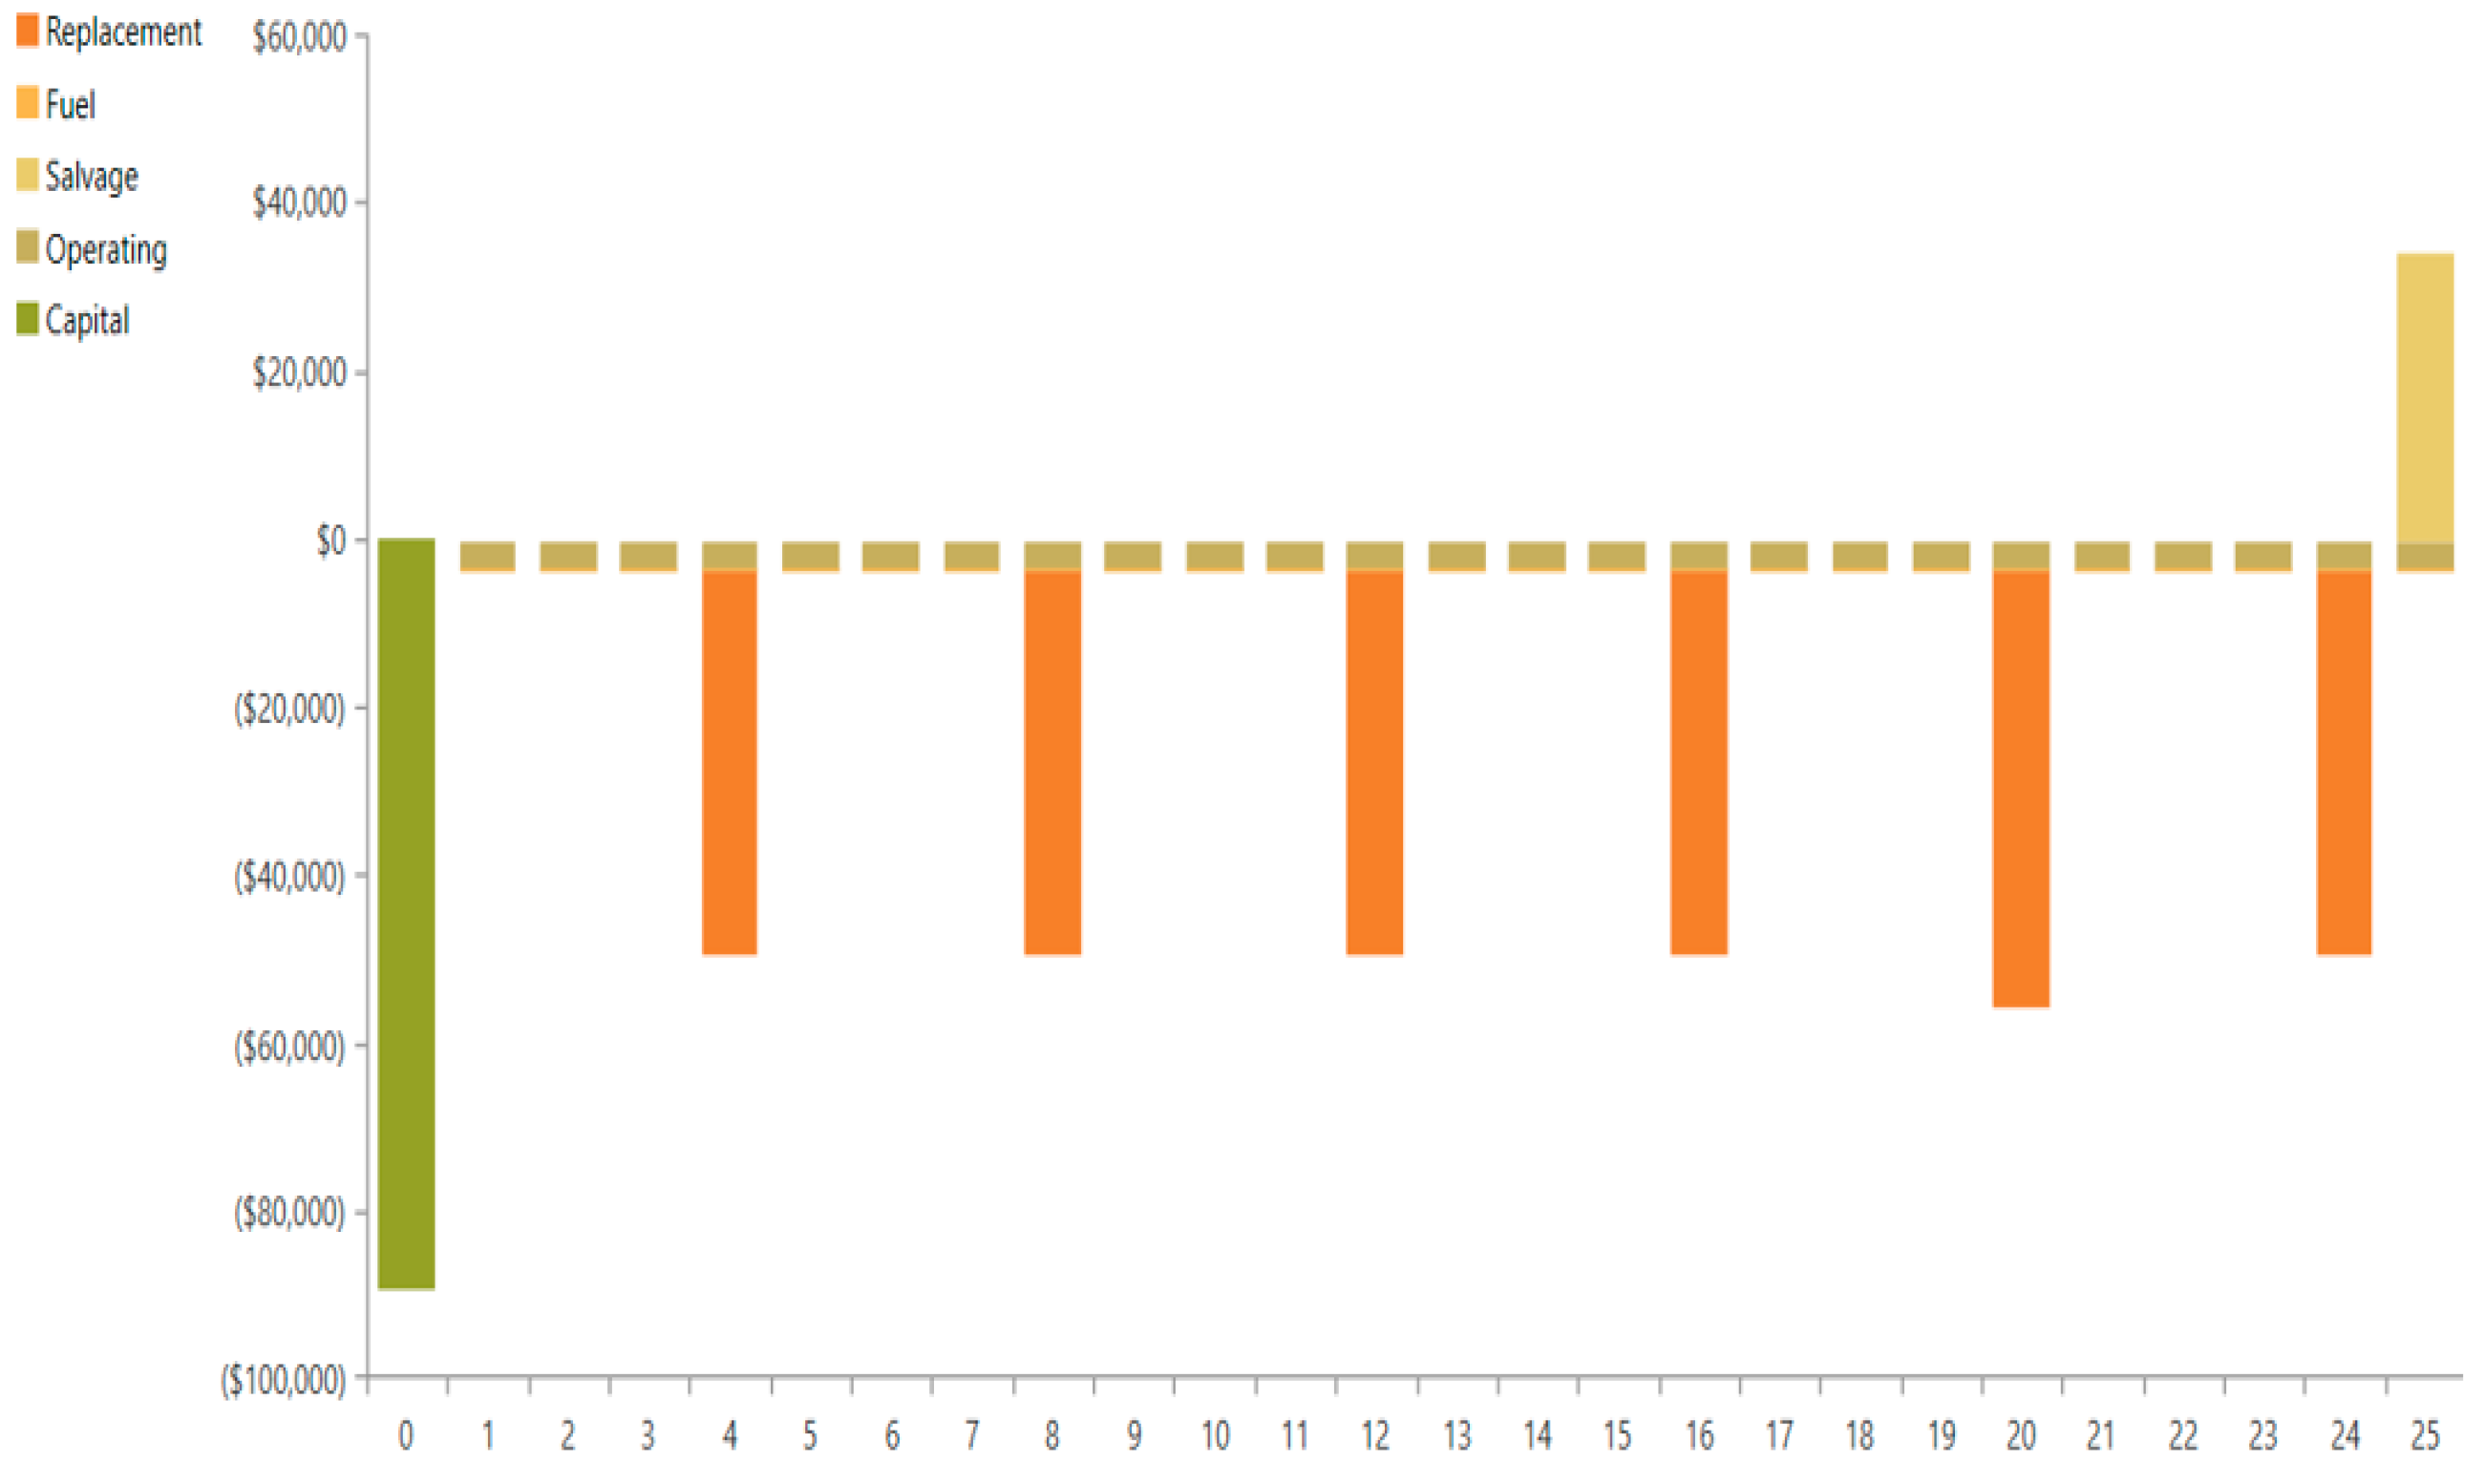
Figure 9.
Details of the penetration of renewable energies.
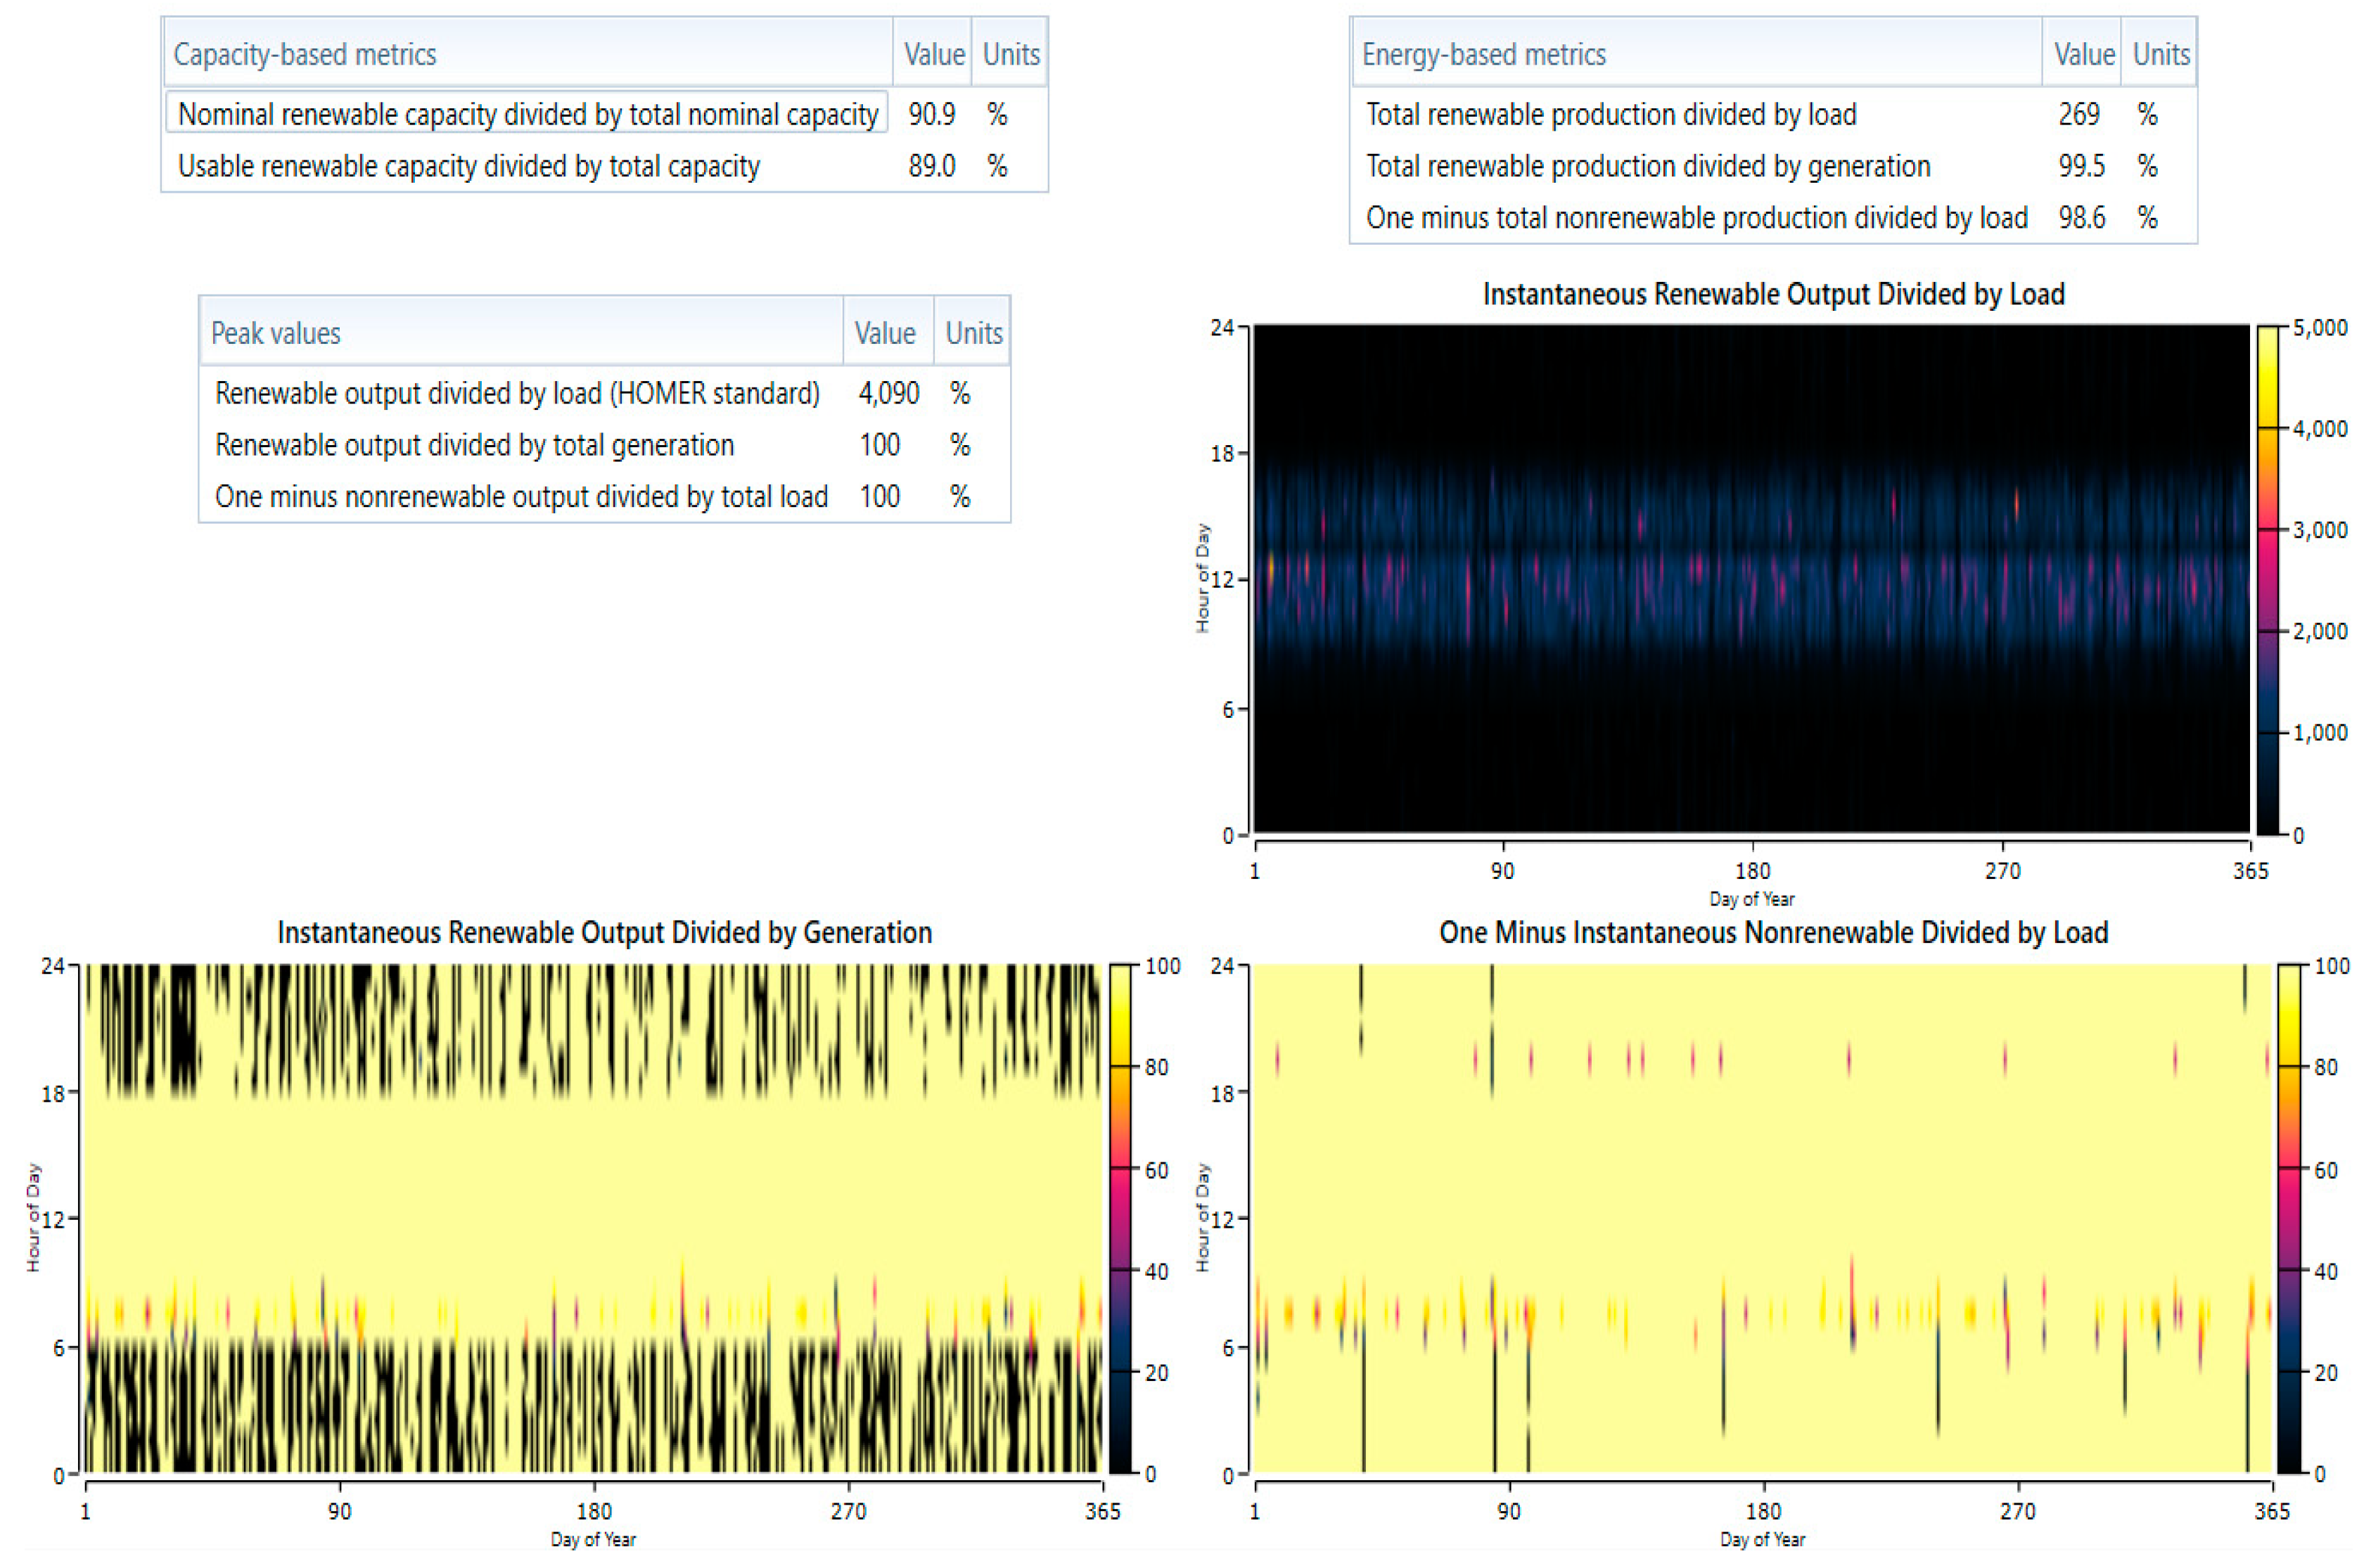
Figure 10.
Monthly electrical production.
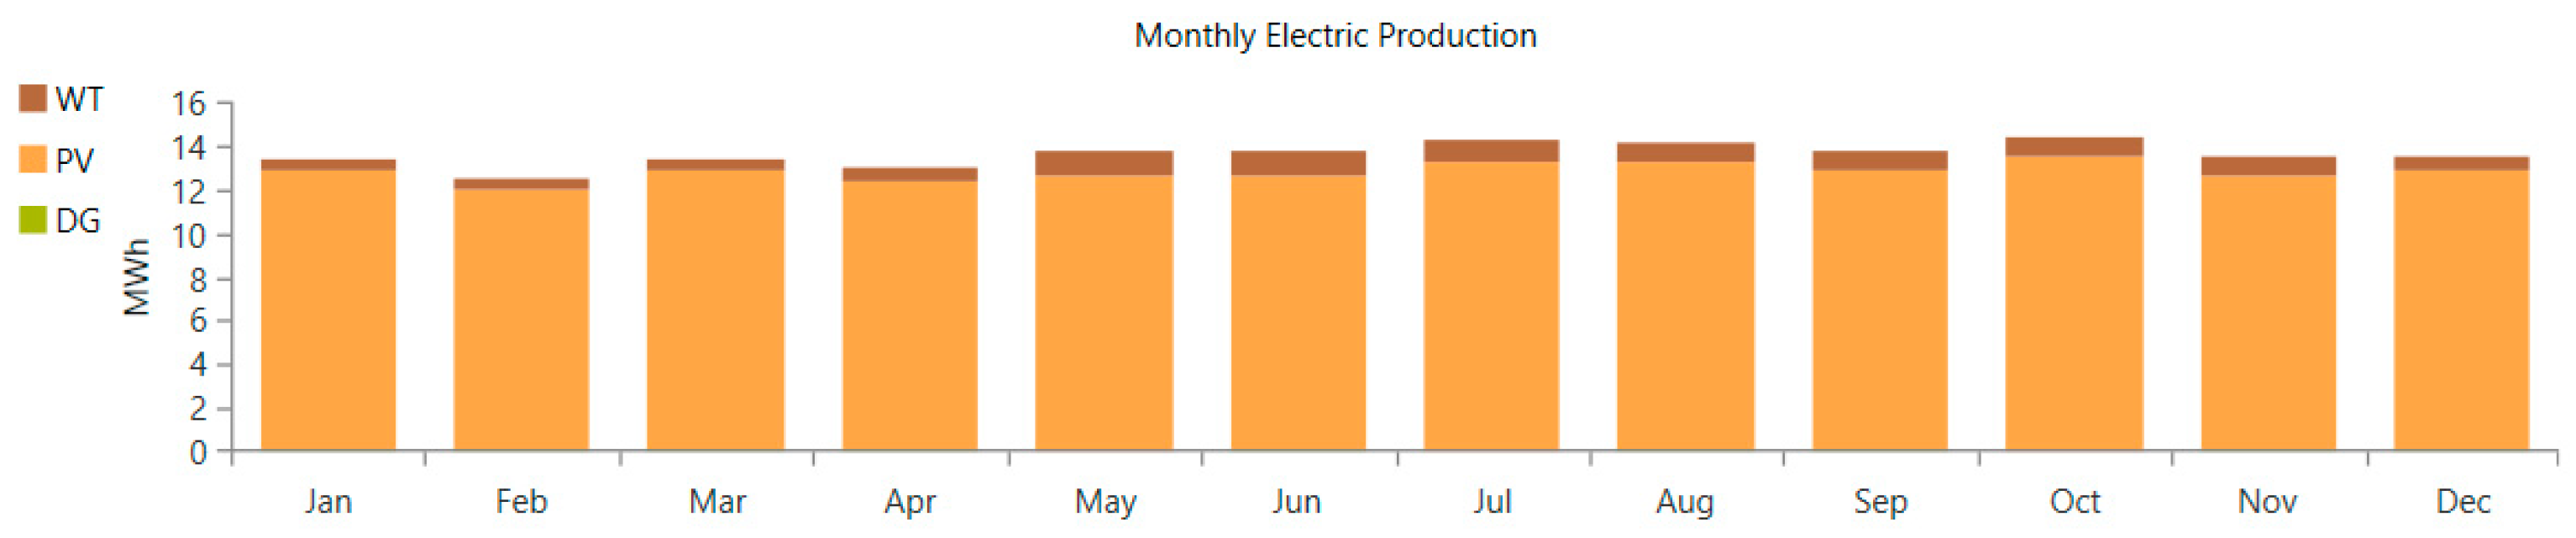
Figure 11.
Details of the penetration of renewable energies.
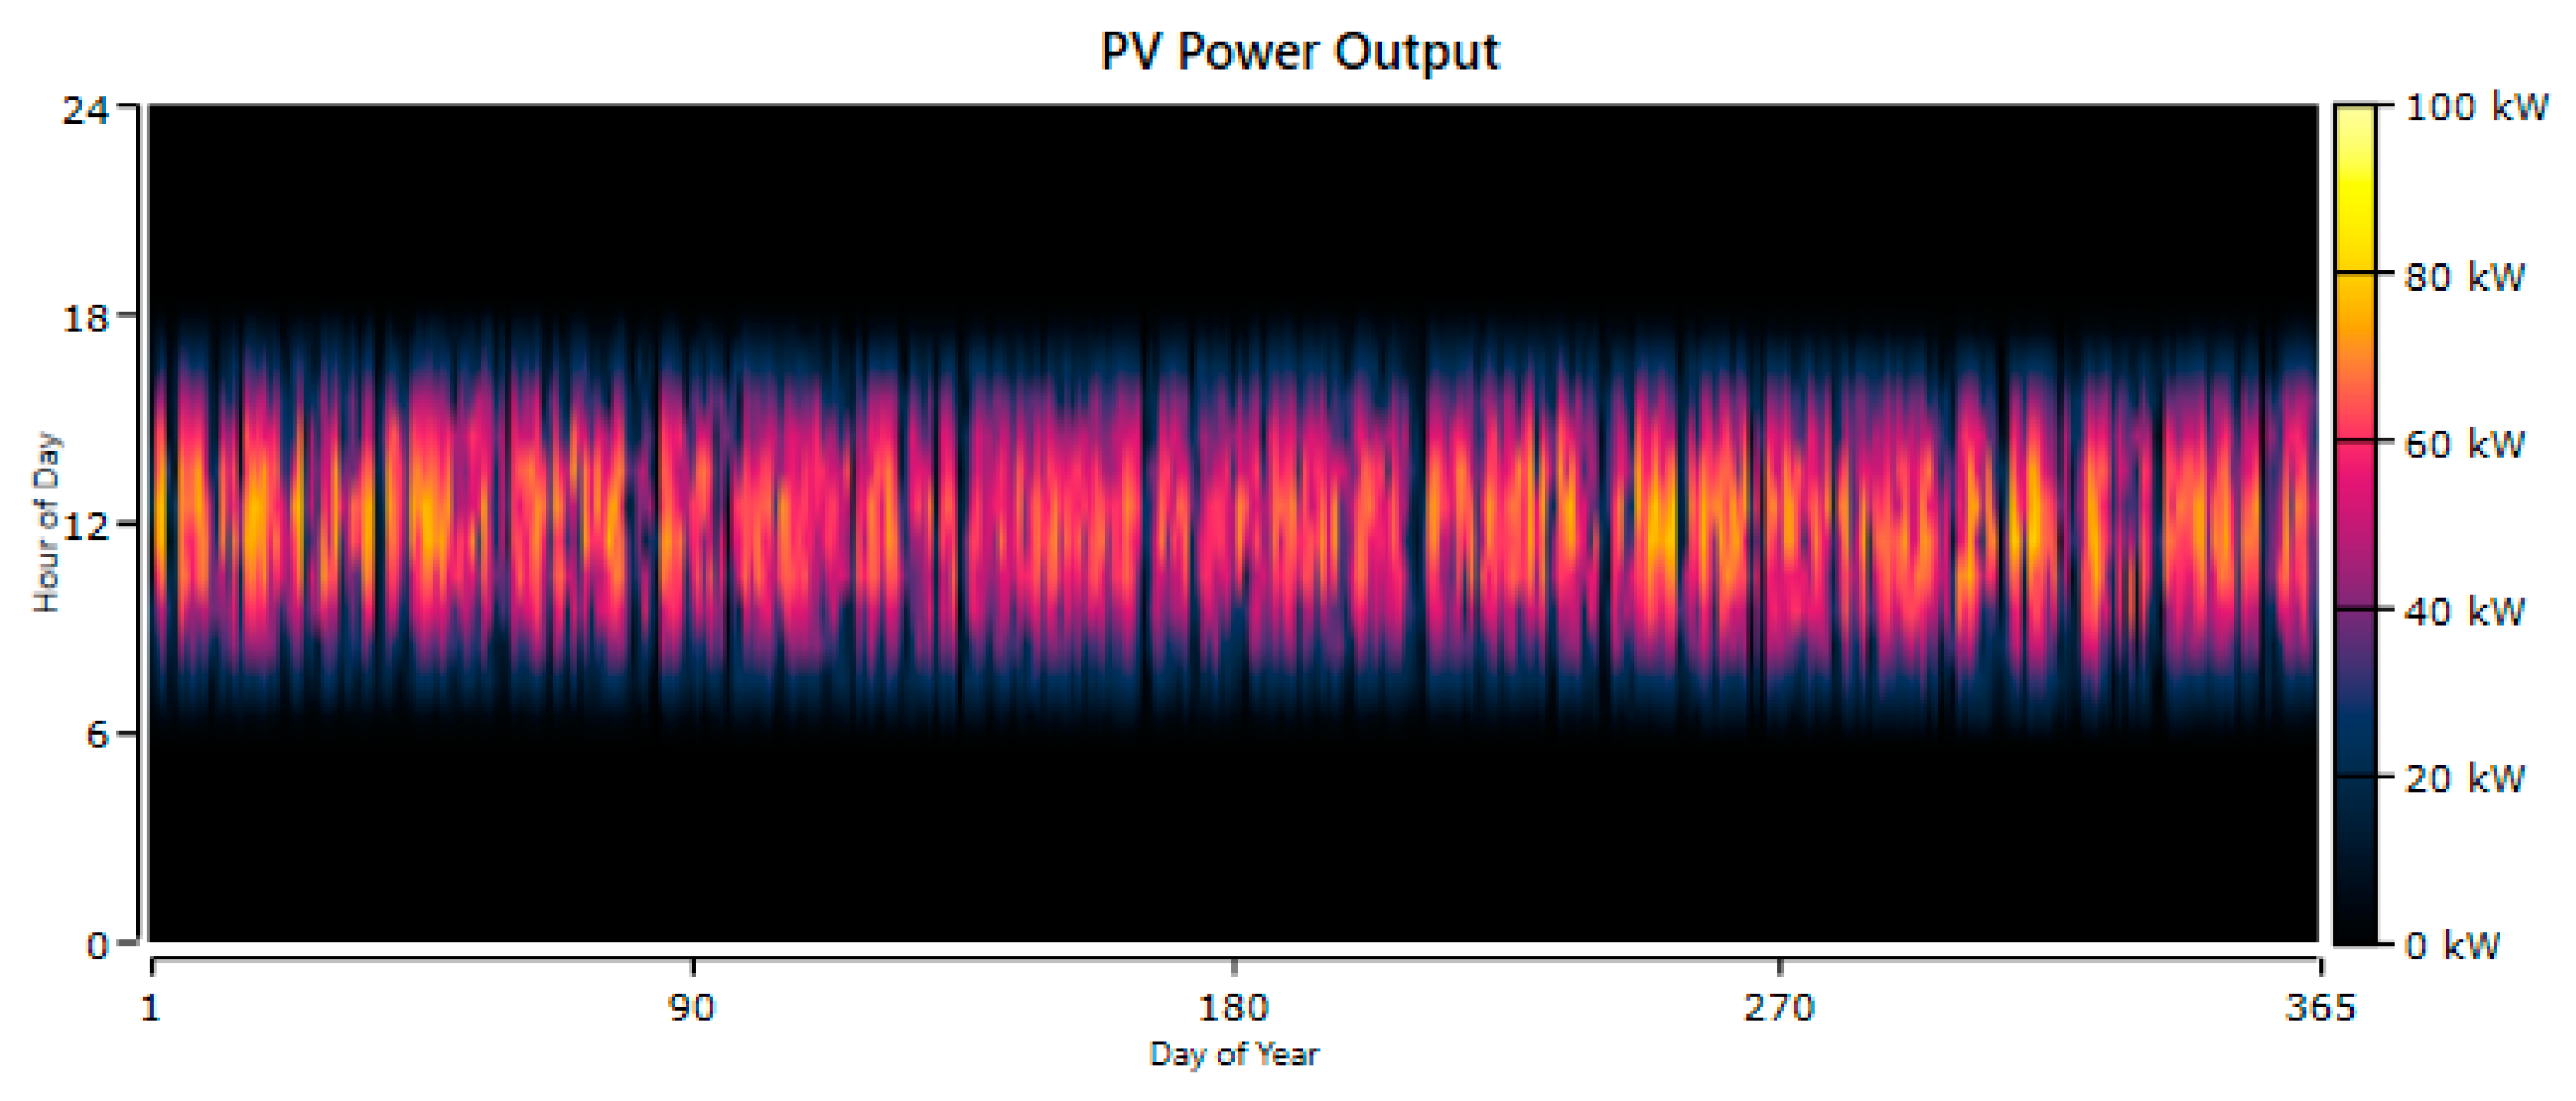
Figure 12.
The energy output of the converter for one year.
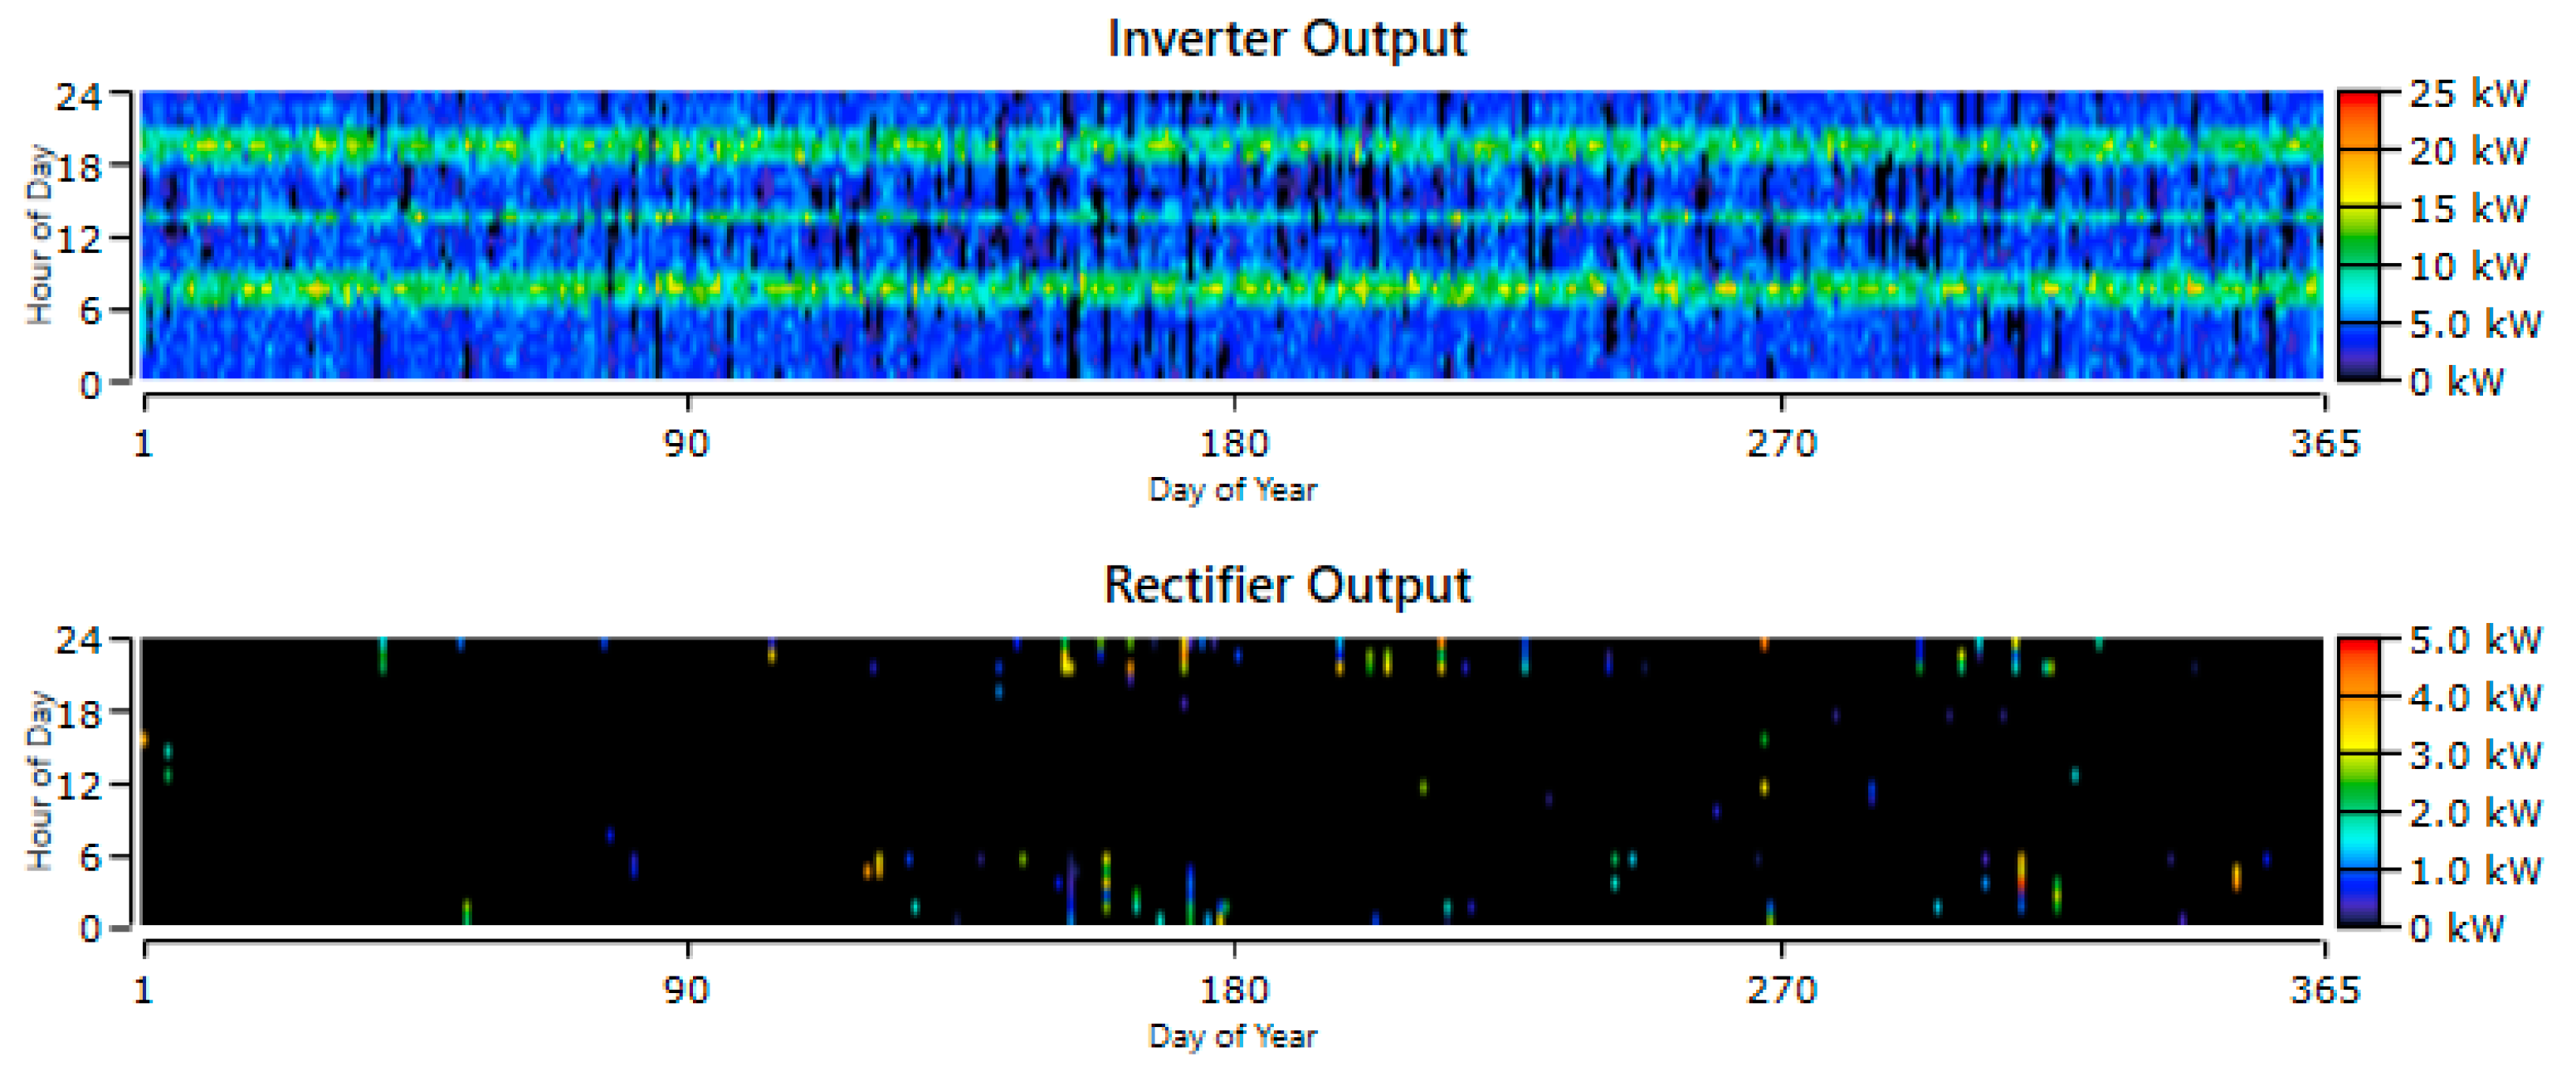
Figure 13.
State of charge.
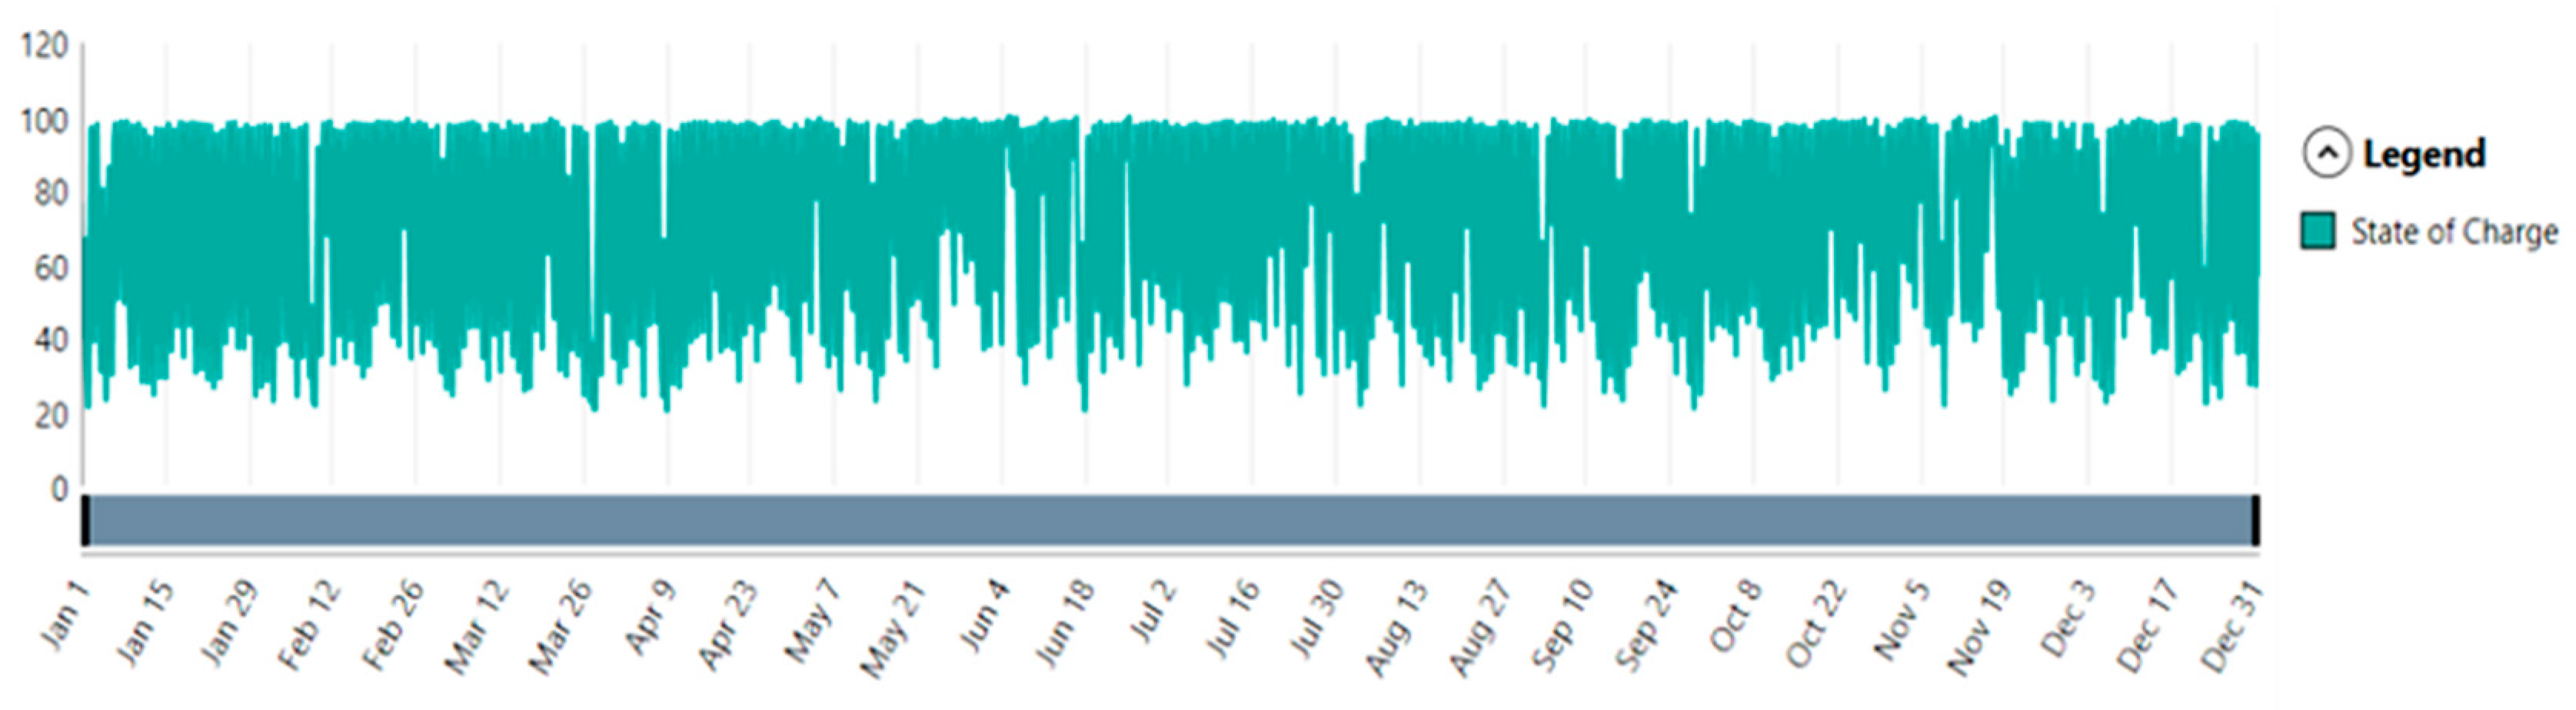
Figure 14.
The annual contribution of the hybrid system by the GWO and the HHO methods.
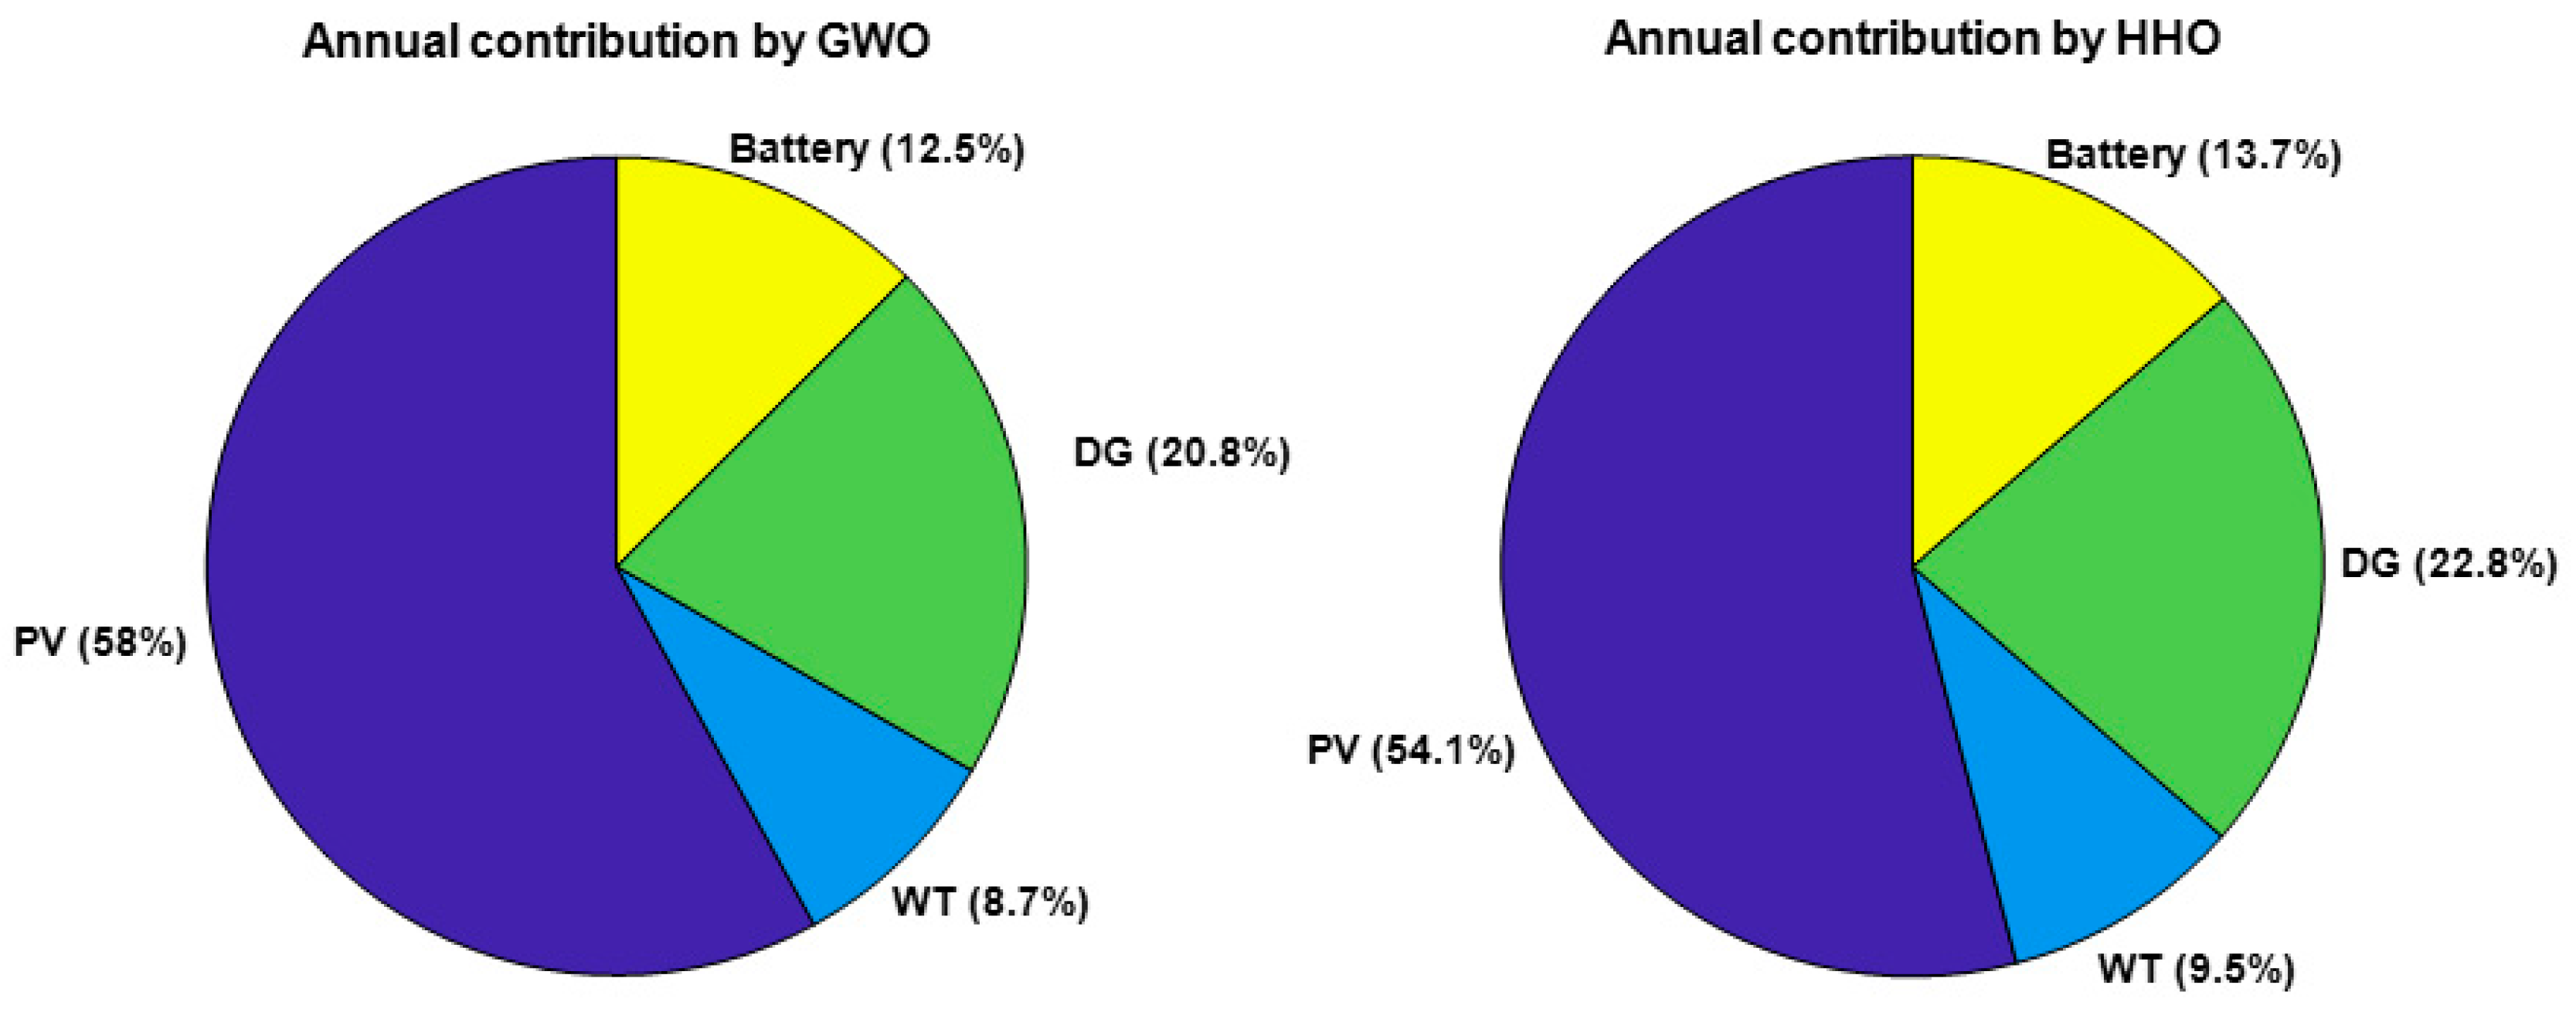

Table 1.
Summary of related works on PV/WT/DG/Battery system optimization.
| Reference | Location | Objective Function | Methods |
|---|---|---|---|
| [12] | Nigeria | NPC, COE | HOMER |
| [13] | Jordan | Cost, reliability, renewable fraction | GWO |
| [14] | Egypt | LPSP, NPC, COE | HHO |
| [15] | Indonesia | Economic and environmental optimization | Multi-objective BAT |
| [16] | China | Cost minimization and reliability improvement | GA |
| [17] | Saudi Arabia | System sizing, COE, LPSP | Hybrid Optimization |
Table 2.
Electrical Result for the hybrid system.
| Electrical | Elements | kWh/y | % |
|---|---|---|---|
| Production | PV | 152,666 | 93.6 |
| Wind Turbine | 9,592 | 5.88 | |
| DG | 840 | 0.515 | |
| Total | 163,099 | 100 | |
| Consumption | AC load | 60,386 | 100 |
| Total | 60,386 | ||
| Quantity | Excess Electricity | 93,074 | 57.1 |
| Capacity Shortage | 33,0 | 0.0546 |
Table 3.
Energy system annual emissions report.
| Quantity | Value | Units |
|---|---|---|
| Carbone Dioxide | 847 | kg/yr |
| Carbone Monoxide | 6.41 | kg/yr |
| Unburned Hydrocarbons | 0.234 | kg/yr |
| Particulate Matter | 0.389 | kg/yr |
| Sulfur Dioxide | 2.08 | kg/yr |
| Nitrogen Oxides | 7.28 | kg/yr |
Table 4.
Total cost of hybrid system components.
| Component | Capital ($) | Replacement ($) | Fuel ($) | Salvage ($) | Total ($) |
|---|---|---|---|---|---|
| PV | 25,596.42 | 0 | 0 | 0 | 45,825.09 |
| DG | 3,000.00 | 0 | 10,765.71 | 2,788.10 | 12,139.34 |
| Battery | 45,600.00 | 240,681.37 | 0 | 20,441.96 | 299,474.27 |
| WT | 9,000.00 | 0 | 0 | 0 | 28,915.38 |
| System Converter | 6,085.27 | 5,025.28 | 0 | 3,592.88 | 12,006.21 |
| System | 89,281.69 | 245,706.66 | 10,765.71 | 26,822.94 | 398,360.30 |
Table 5.
Cost Summary.
| Costs | Base System | Optimal System |
|---|---|---|
| NPC ($) | 918,357 | 398,360 |
| Initial Capital ($) | 20,622 | 89,282 |
| LCOE ($/kWh) | 0.687 | 0.298 |
Table 6.
Results based on economic and technical factors and optimum sizing using the proposed algorithm.
Table 6.
Results based on economic and technical factors and optimum sizing using the proposed algorithm.
| Proposed HERS | Methods | COE ($/kWh) | LPSP (%) | RF (%) | Nad | Ppv (kW) | NWT | Nbat |
|---|---|---|---|---|---|---|---|---|
| Hybrid system | GWO | 0.268 | 0.234 | 87.79 | 5 | 161.54 | 8 | 9 |
| HHO | 0.276 | 0.715 | 82.85 | 4 | 156.58 | 9 | 8 | |
| Homer | 0.298 | -- | 98.6 | -- | 91.4 | 3 | 152 |
Disclaimer/Publisher’s Note: The statements, opinions and data contained in all publications are solely those of the individual author(s) and contributor(s) and not of MDPI and/or the editor(s). MDPI and/or the editor(s) disclaim responsibility for any injury to people or property resulting from any ideas, methods, instructions or products referred to in the content. |
© 2025 by the authors. Licensee MDPI, Basel, Switzerland. This article is an open access article distributed under the terms and conditions of the Creative Commons Attribution (CC BY) license (http://creativecommons.org/licenses/by/4.0/).
Copyright: This open access article is published under a Creative Commons CC BY 4.0 license, which permit the free download, distribution, and reuse, provided that the author and preprint are cited in any reuse.


