
Submitted:
23 December 2024
Posted:
23 December 2024
You are already at the latest version
Abstract
The drainage of the Hula wetlands and old Lake Hula was completed in 1957. Agricultural development replaced the natural ecosystem land use with agricultural cultivation. The Hula pre-drainage anaerobic conditions were replaced by organic matter oxidation and Sulfur and Nitrate carbonate enrichments. The ecosystem structure of highly diversified fauna and flora was devastated. During the post-drainage period, enhancement of accumulated carbonates and Gypsum (CaSO4) and organic matter oxidation created soil salinization and nitrate accumulation. Ammonia was oxidized to Nitrate and its accumulation concerned Kinneret water quality protection managers. Evaluation of long-term (1994-2024) study through monitoring program of the temporal and seasonal distributional pattern of Nitrate, Sulfate, pH, Alkalinity, and Electrical Conductivity within the Peat soil drained and pore-waters indicates soil moisture as the dominant impact factor which controls two geochemically independent coincide processes, nitrate migration and soil salinization.
Keywords:
Hula Valley
; Nitrate
; Salinization
; Peat Soil Moisture
1. Introduction
e Hula Valley and Lake Kinneret are located in northern Israel's Syrian–African Great Rift Valley. Lake Kinneret is the only natural freshwater lake in Israel. Until 2010, an average of 336 mcm (336 million cubic meters) of water was pumped annually from the lake, supplied mostly for domestic usage and partly for agricultural irrigation. The water quality of Lake Kinneret is therefore a national concern, and pollutant migration from the Hula Valley is prominent. More than 95% of Israel’s natural water resources are utilized. The total national water supply is 2.11 bcm (2.11 billion cubic meters), of which 0.55 bcm comes from the Kinneret–Jordan water system and 0.7 bcm comes from desalinization. The area of the Kinneret drainage basin is 2730 km2 and is located mostly to the north of the lake, of which the total Hula Valley is about 200 km2. Three major headwater rivers (Hatzbani, Banyas, and Dan) flow from the Hermon Mountain region in the northern part of the Kinneret drainage basin. These rivers join and form the Jordan River. Before the Hula drainage, the Jordan crossed the valley through three branches (tributaries) flowing into the old Lake Hula. From Lake Hula, at an altitude of 61-68 masl (m above mean sea level), the Jordan River flows downstream into Lake Kinneret (Mean WL 211 mbsl) for a distance of approximately 15 km. The altitude difference between top Hermon (2814 masl) and Kinneret WL (mean 211 mbsl) along a spatial distance of 70 km resulted in a mean slope of 4.3% creating a rather strong erosive force. The Jordan River contributes approximately 63% of the Kinneret water budget and more than 50% of the total external nutrient inputs. Before the drainage of the Hula Valley (1957), the land was covered by Lake Hula (1.5 m mean depth; 13 km2 water surface) and 3500 ha of swamps. The swampy area was totally covered by water in the winter and partly covered in the summer. To the north of the swamps was an area (3200 ha) where water table levels were high in winter, thus making agricultural cultivation impossible. During the summer, when underground water levels declined, this 3200-ha land surface was efficiently cultivated.
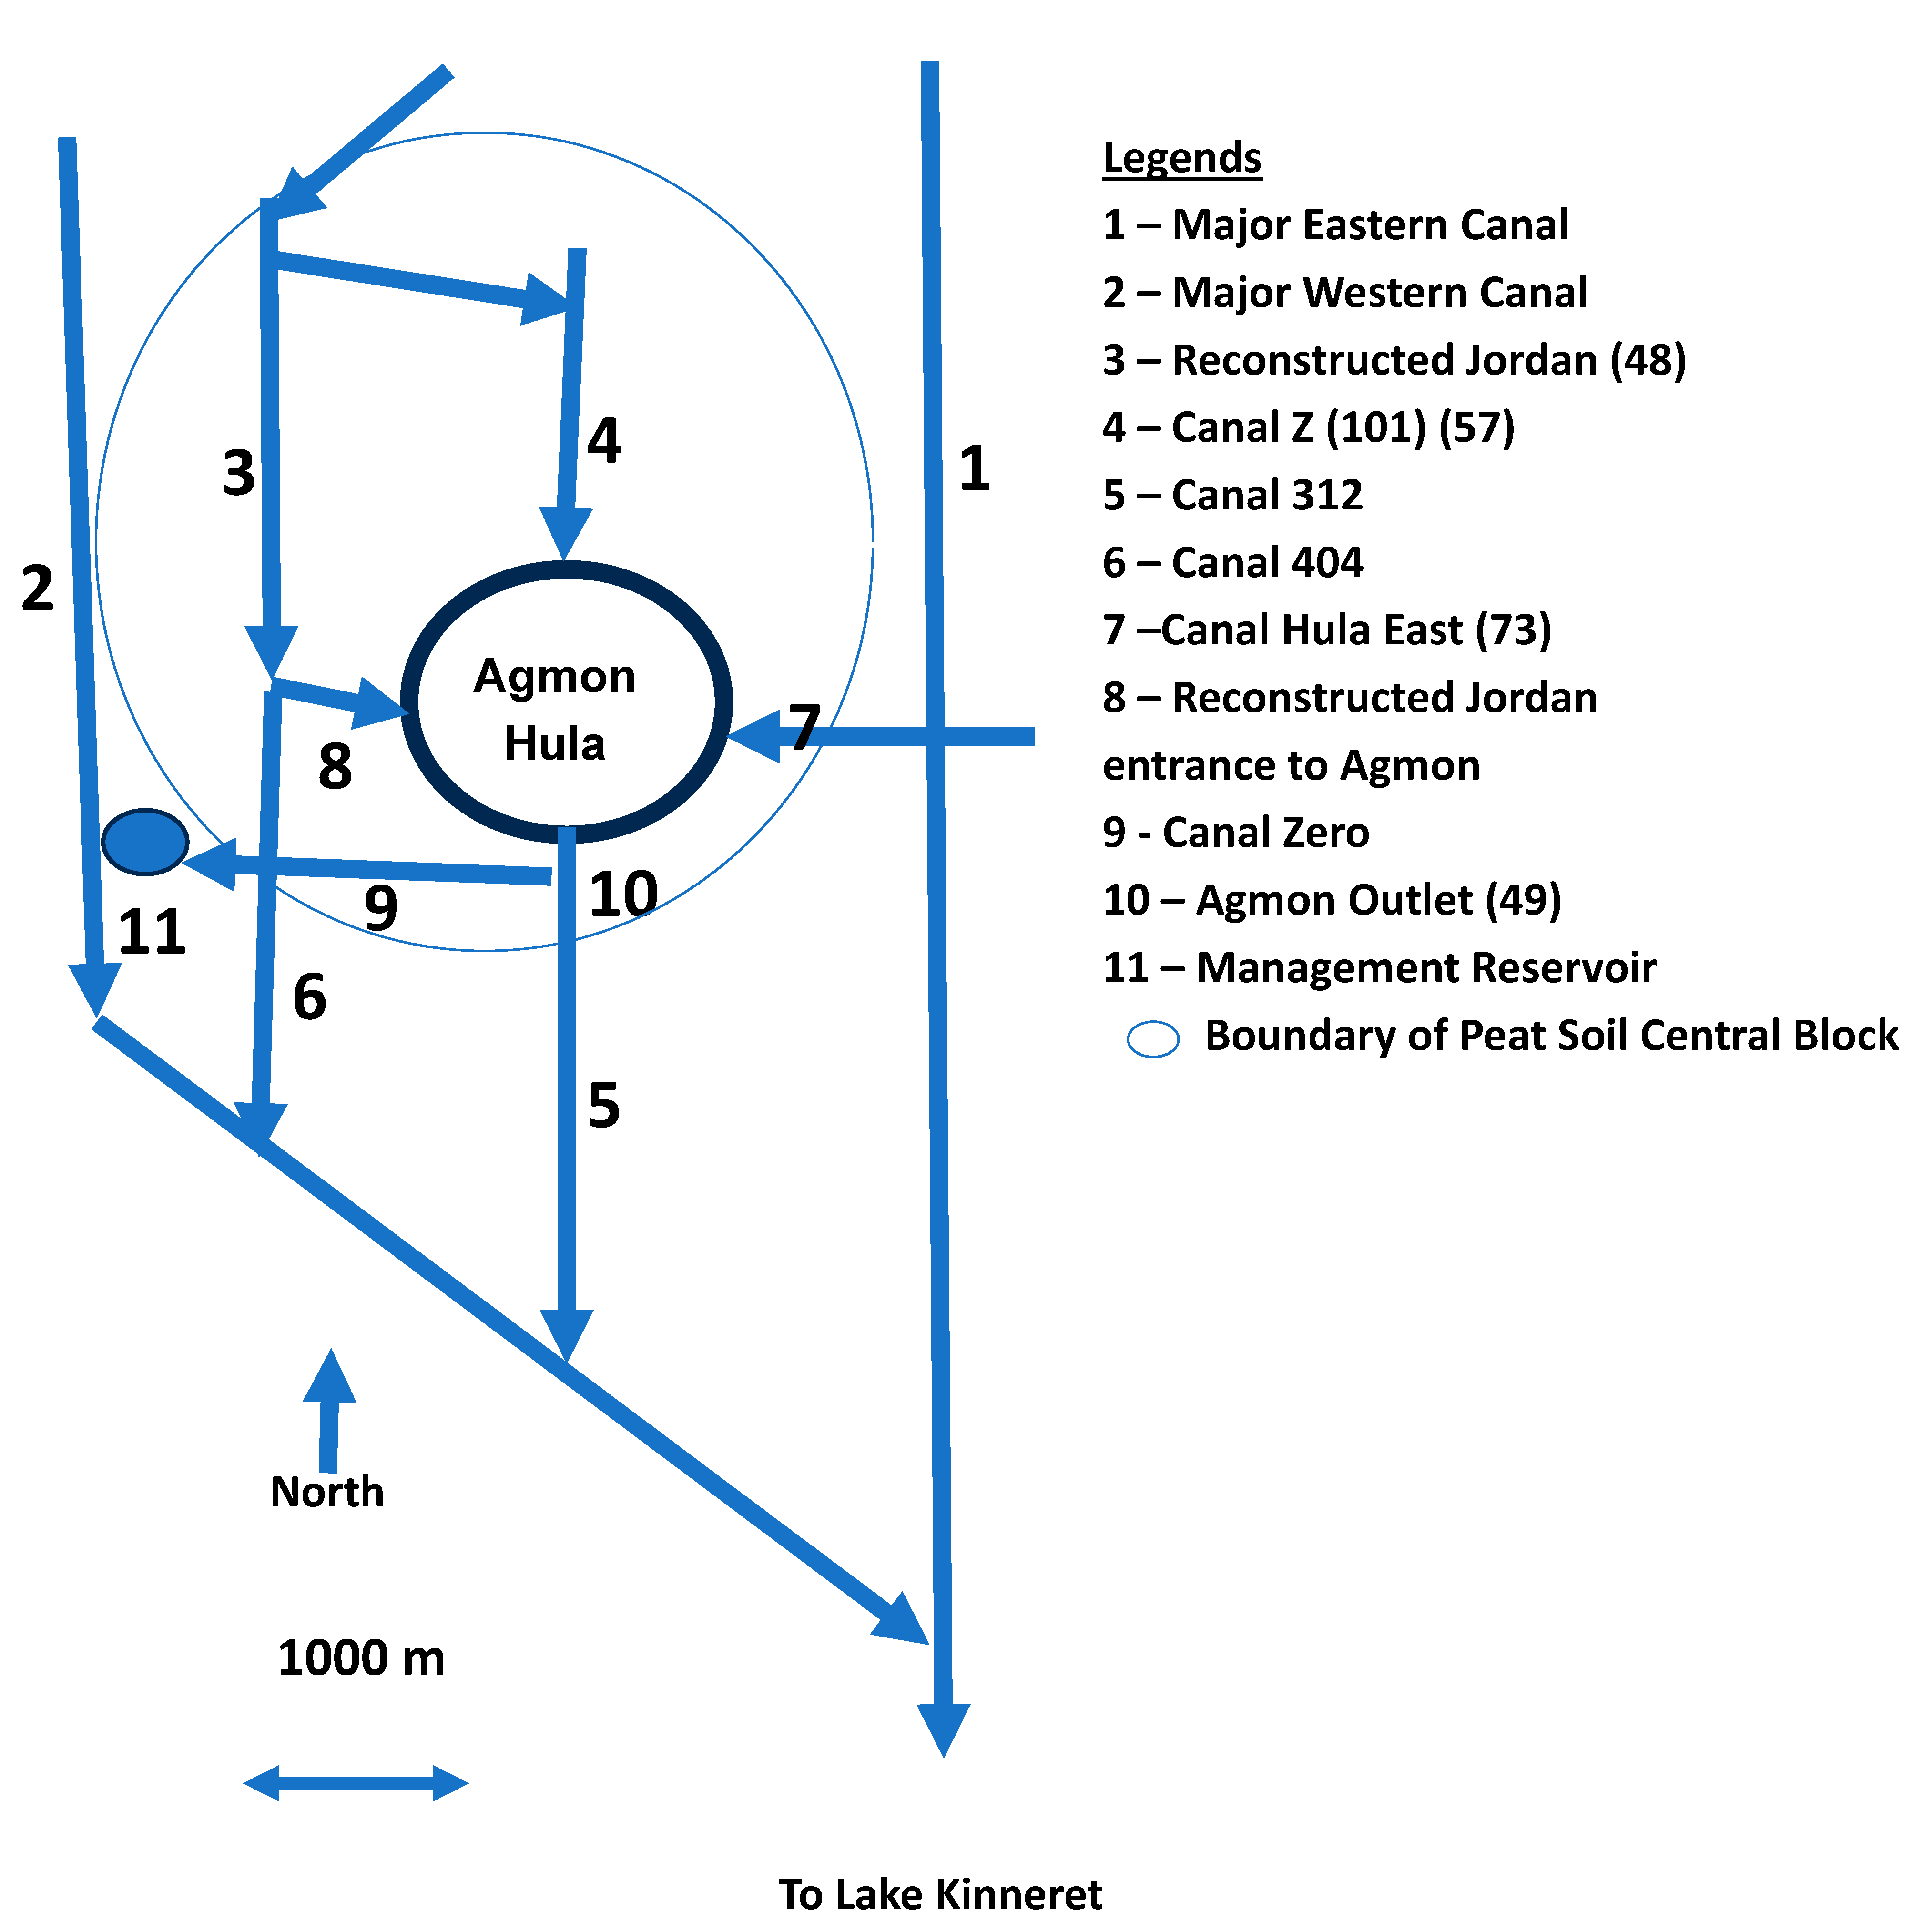
In the 1950s, the Hula Valley landscape underwent significant modifications. The anthropogenic intervention carried out was a drainage of the Hula swampy wetlands and old lake (1957). The land use was converted into agricultural development. Forty years later, as a result of cultivation difficulties, a reclamation project was implemented, the Hula Project (HP) resuming presently 30 years of existence. Several developments of concerns were initiated as the result of organic matter oxidation. Frequent outbreaks of subsurface unsecured fire; Soil surface subsidence deteriorating the hydrological system; Nitrogen mineralization has led to the accumulation of weakly bound nitrates, increasing the risk of leaching into Lake Kinneret and deteriorating its water quality. Additionally, the Intrusion of soluble Gypsum into the Peat organic matter has contributed to increased levels of sulfate and calcium, enhancing soil salinization. A hypothesis was considered by the late principal Hula Peat soil scientist, Dr. I. Levin (D. Levanon, personal communication): there is a linkage between nitrate enhancement in Peat and its drained water and soil salinization process. The present study examines this 50-year-old assumption about the Ecological linkage between nitrate migration and soil salinization in the Hula Valley. Long-term records of the dynamics of Alkalinity (ALK), Electrical Conductivity (EC), Nitrate (NO3), and Sulfate (SO4) concentration [1-3] in the Peat soil drained and porewaters water in relation to soil moisture were investigated. The dynamics of the chemical composition of water sampled in Canal Z (Figure 1) which transported drained water from the central Peat soil block in the Hula Valley conveyed into Lake Agmon Hula (LAH) (Figure 1).
The migration of nutrients in Peat soil, including Nitrogen, Phosphorus, Carbonates, Sulfates, and others, occurs hypsometrically, directed downwards and horizontally (spatially). This process continues continuously, representing seasonal fluctuations. A significant portion of those nutrients are deeply buried. A portion of the nutrients within the shallow (0-6 m) layers are exported horizontally in a north-south direction. Routine monitoring of Hydrological and soil moisture conditions was not documented in previous geological investigations in the Hula Valley. Nonetheless, the monitoring program of quantitative and qualitative qualities of surface waters was long term routinely recorded.
2. Material and Methods
2.1. Chemistry (Analytical Methods followed APHA Standard Methods 2023)
Electrical Conductivity (EC) was measured by a Conductivity meter in-situ in the Ground Water Table and experimentally in sampled waters.
Nitrate analysis was carried out by Cadmium Reduction (NED) method on Millipore filtered sample. The analysis of Ammonia was done by the Indophenol Method which is based on the formation of a blue color resulting from the reaction between Phenol and Hypochlorite in the presence of Ammonia.
2.2. Sampling Methodology
The following parameters were sampled and measured weekly at the entrance of Canal z (Canal 101) into Lake Agmon-Hula (LAH) (Figure 1): Electrical Conductivity (EC)(MS), NO3 (ppm), SO4 (ppm), Alkalinity (ALK) (as ppm CaCO3), pH and discharge (103 m3/hour). Canal Z conveys drained water from the Central block of Peat Soil within the Hula Project territory (Figure 1). The data obtained from the Hula Project Monitor Program (1994-2024): Migal-Galilee Scientific Research Institute, Jewish National Fund and Israel Water Authority [1-8].
2.3. Statistical Methods
Statistical evaluation included the following methods: Quadratic, and Linear Regressions (w/CI 95%) and scatter plot. Quadratic and Linear regressions (w/CI 95%) are used for modeling relationships between variables distribution with a parabolic best-fit curve, as most likely relevant to the analyses presented in this paper.
2.4. PCA Analysis
PCA Analysis is a dimensionality reduction technique exploratory data analysis, of a multivariate Gaussian distribution. The shown vectors and separated Biplot presentation are the visualization of the data preprocessing. The data is linearly transformed into a new coordinate system such that the directions (principal components) capturing the largest variation in the data can be identified. PCA is used when variables are correlated with each other and it is desirable to reduce their number to an independent set. The first principal component can equivalently be defined as a direction that maximizes the variance of the projected data. PCA defines a new orthogonal coordinate system that optimally describes variance in a single dataset.
The statistical evaluation was carried out using the software STATA 17.0- Standard Edition for Statistics and Data Science.
2.5. Study Site
Figure 1.
Schematic chart of the Hula Project territory in the Hula Valley.
3. Results
3.1. Seasonal Fluctuations
The seasonal (monthly) distribution (Quadratic Regression, w/CI95%) of NO3, Alkalinity and SO4 concentrations, pH, and Electrical Conductivity in Canal Z averaged for 1994-2024 are given in Figure 2, Figure 3, Figure 4, Figure 5 and Figure 6.
Results given in Figure 2 indicate the rainfall impact on soil moisture enhancing the migration of NO3 within the Peat soil habitat: increase during December-March and decline later.
Figure 3.
Seasonal (monthly) changes (1994–2024) of Electrical Conductivity (EC): Quadratic regression plot (Linear Regression parameters are given).
Figure 3.
Seasonal (monthly) changes (1994–2024) of Electrical Conductivity (EC): Quadratic regression plot (Linear Regression parameters are given).
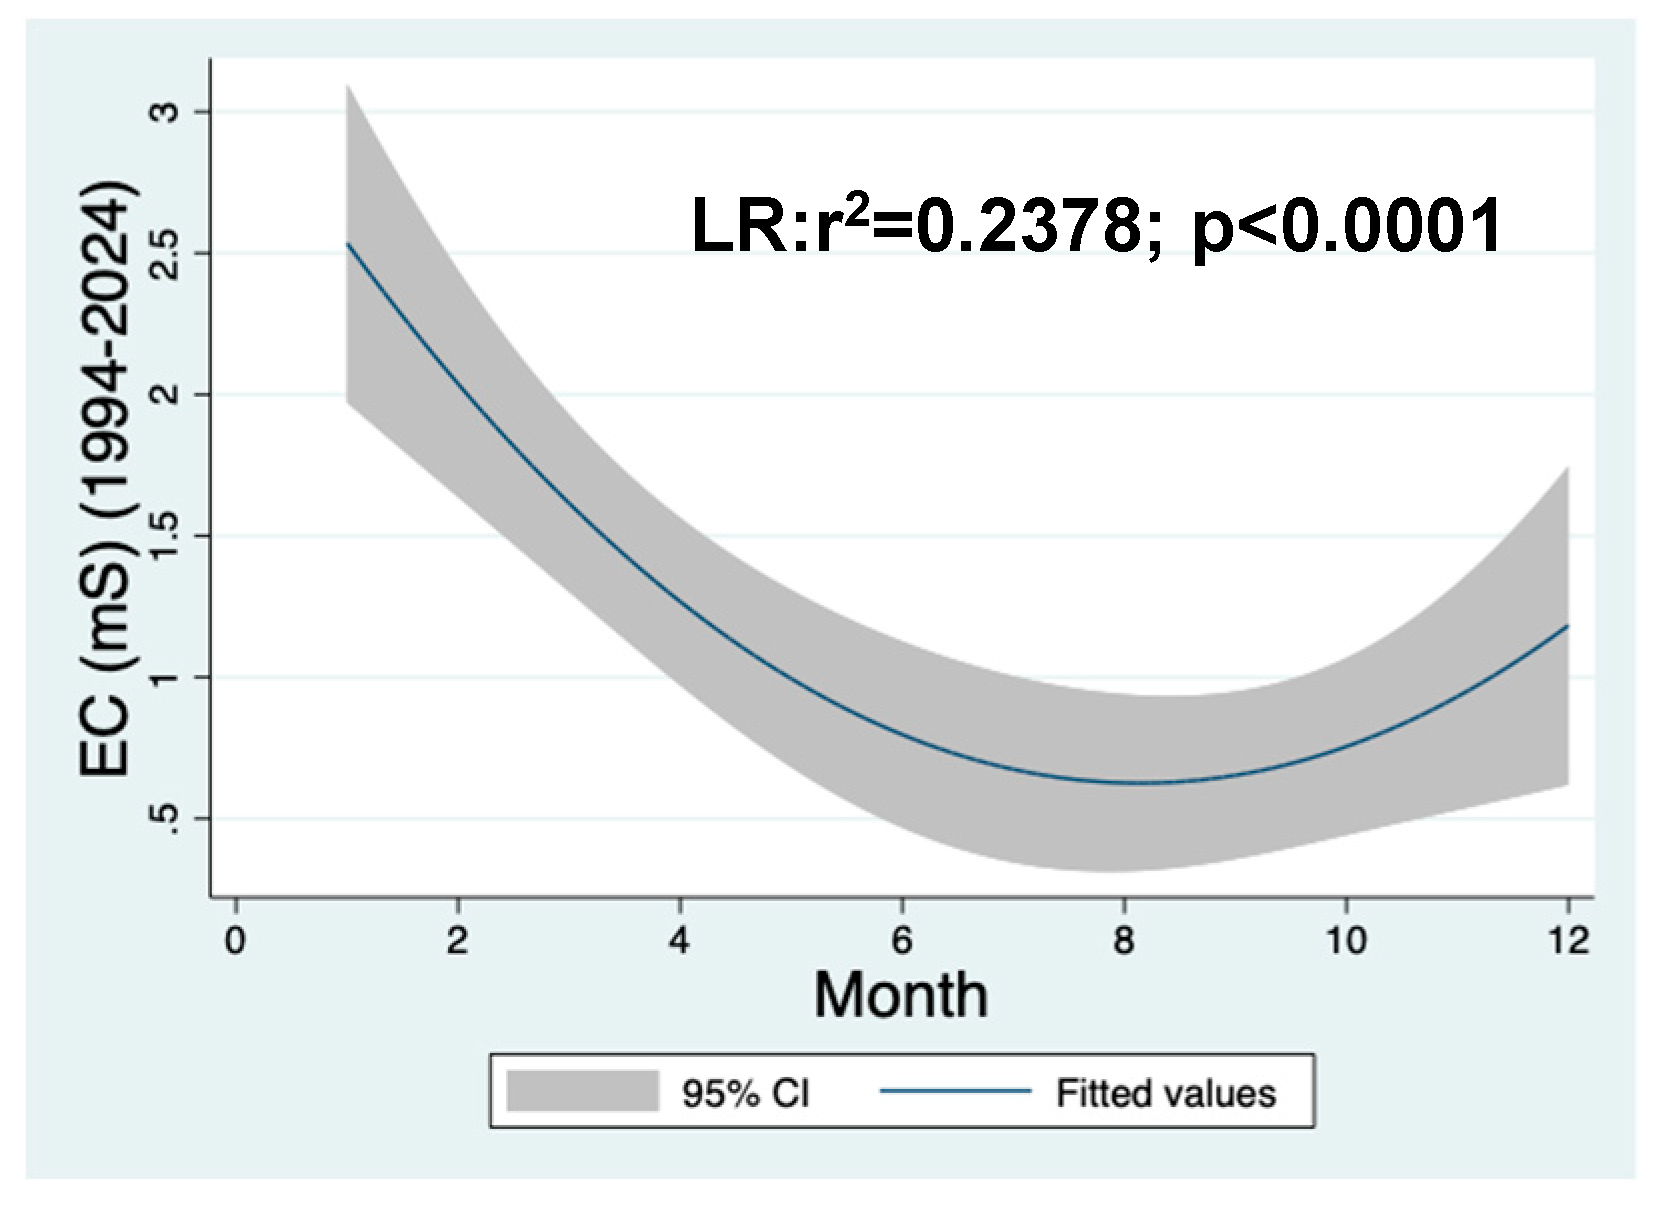
Results given in Figure 3 indicate that similar to the NO3 pattern of seasonal changes, the EC level in the Peat soil drained waters is rainfall and consequently soil moisture dependent: Increase during September-April and decline later.
Figure 4.
Seasonal (monthly) changes (1994–2024) of Alkalinity (ALK) (ppm CaCO3, Quadratic regression plot.
Figure 4.
Seasonal (monthly) changes (1994–2024) of Alkalinity (ALK) (ppm CaCO3, Quadratic regression plot.
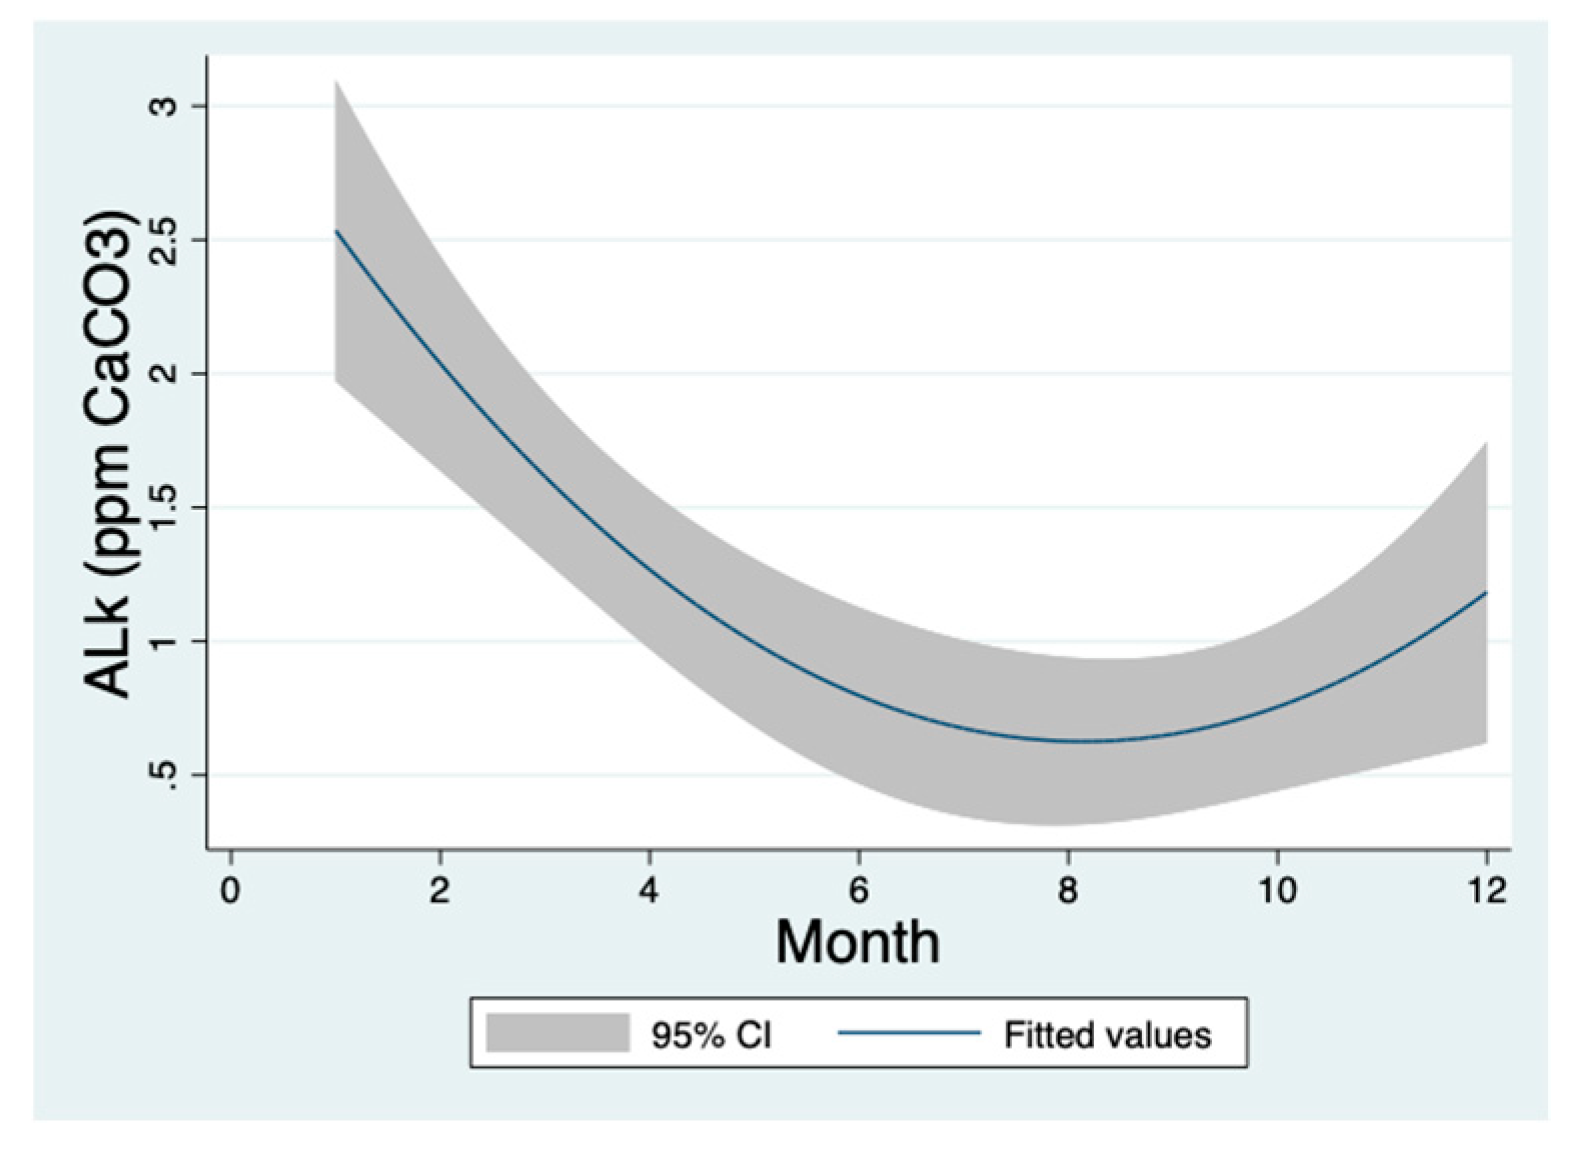
Results given in Figure 4 indicate that similar to NO3 and EC pattern of seasonal changes, the ALK level in the Peat soil drained waters is rainfall and consequently soil moisture dependent: Increase during Winter and decline during Summer.
The seasonal fluctuations of NO3, EC and Alkalinity are dependent on rainfall and consequently soil moisture changes pattern.
Figure 5.
Seasonal (monthly) changes (1994–2024) of pH, Quadratic regression plot.
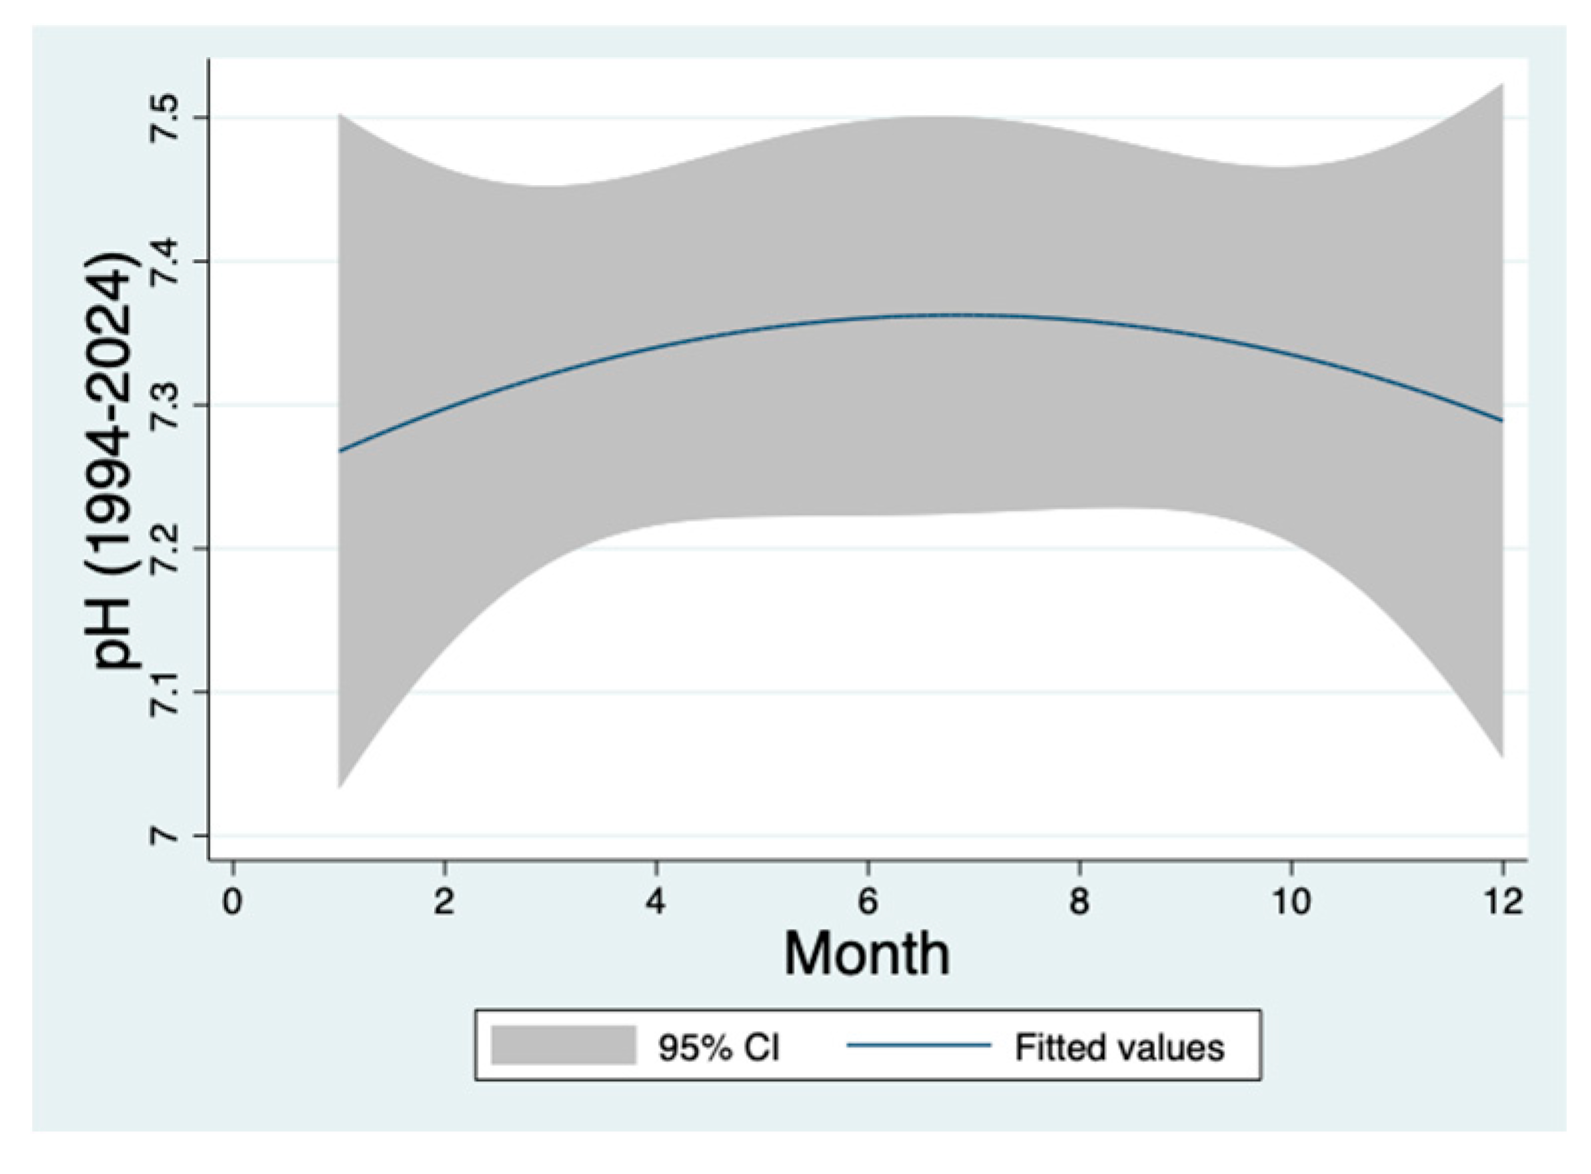
Unlike seasonal fluctuation of NO3, EC and Alkalinity, the amplitude of seasonal pH fluctuations is rather stable.
Seasonal Rainfall and Peat soil moisture induce seasonal fluctuations whilst pH changes are minor. Seasonality of nitrates and carbonate (ALK) drifted by drained waters from the Peat soil and consequently enhancing, EC elevation (salinization) is a seasonal case process.
Figure 6.
Seasonal (monthly) changes (1994–2024) of Sulfate (SO4) (ppm), Quadratic regression plot.
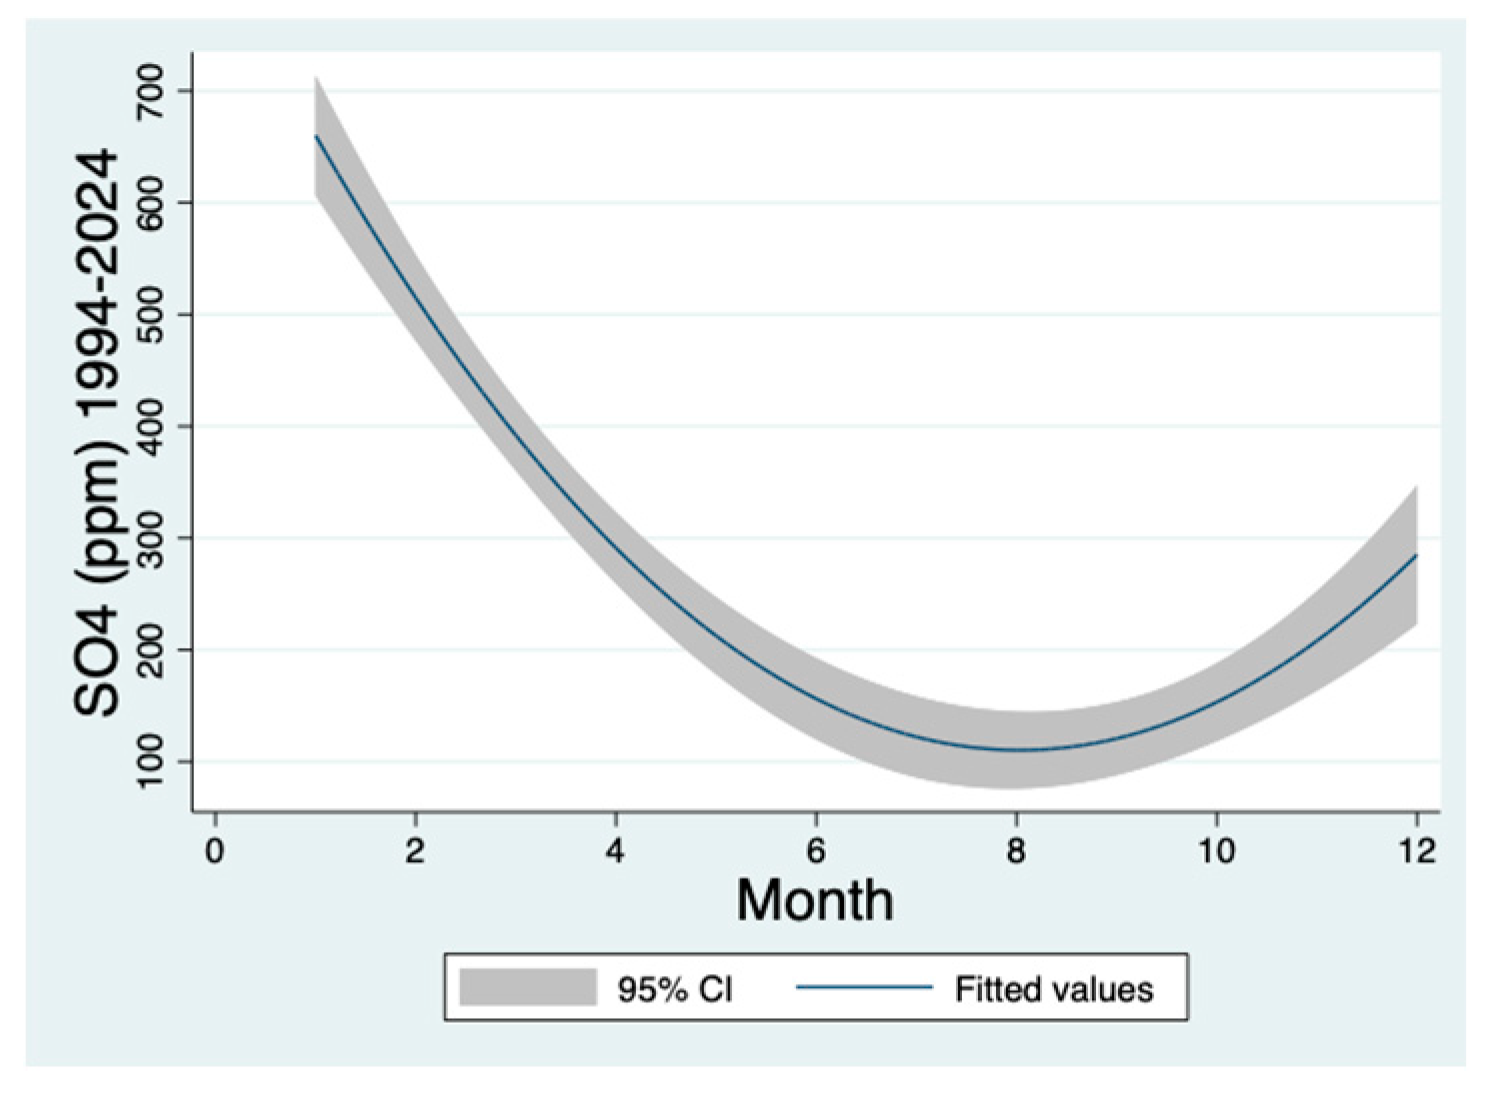
Results given in Figure 6 indicate the similarity of SO4 to NO3, ALK and EC patterns of seasonal changes. The proof of the dependence of SO4 to NO3, ALK and EC distribution in rainfall and soil moisture distribution in the Peat soil-drained waters is getting stronger. The seasonal fluctuations of NO3, EC, Sulfate and Alkalinity in the Peat soil-drained water are dependent on rainfall and consequently soil moisture pattern of changes.
3.2. Temporal Fluctuations
The Temporal, annual averages, (1994-2024) distribution of EC, NO3 concentration, pH, Alkalinity, and SO4 concentrations, in Canal Z averaged for 1994-2024 are given in Figure 7, Figure 8 and Figure 9.
Results confirm that during 1994–2024, unlike EC, temporal changes of NO3 (ppm)are minor.
Results given in Figure 2, Figure 3, Figure 4, Figure 5, Figure 6, Figure 7, Figure 8 and Figure 9 indicate that seasonal distribution patterns of EC, ALK, SO4 and NO3 are similar: high in winter and summer decline. The pattern of temporal distribution of EC, pH, ALK, and SO4 are also similar: low during 2010 and decline during 1994-2010. Two distributional pattern exceptions were documented: seasonal pH and temporal NO3. Soil moisture seasonality, characterized by high levels in winter and declines in summer, significantly impacts changes in the concentration of parameters (EC, pH, Alkalinity, and SO4) in drained waters, and this relationship is therefore confirmed. The temporal pattern of NO3 changes represents stability due to its high availability resulting from the high Ksp of Ca(NO3)2 in comparison with much lower Ksp of SO4 carbonate (Gypsum). The similarity of temporal and seasonal changes of EC, pH, SO4 and ALK confirm a similar response of migration capacity to soil moisture.
3.3. Interactions between EC, NO3, and ALK Parameters
The interactive relations between NO3 and EC, EC and Alkalinity and NO3 and Alkalinity are plotted as Linear regressions and presented in Figure 9, Figure 10 and Figure 11.
The significant relationship between NO3 and EC parameters in the Peat soil drained water is clearly shown in Figure 10.
The significant relationship between EC and ALK parameters in the Peat soil drained water is clearly shown in Figure 11.
The significant relationship between NO3 and ALK parameters in the Peat soil drained water is clearly shown in Figure 12.
Soil moisture is dependent on two water sources: Rainfall and irrigation. Quantitative Irrigation data is not available and rainfall capacity as averaged (1994-2024) for 3 stations in the Hula Valley is given in Figure 12.
The sub-tropical climate conditions of 4 winter wet months (12-1-3) and 8 dry summer months (4-11) are presented in Figure 13.
3.4. Climate Change (Rainfall) and Ground Water Table Relations
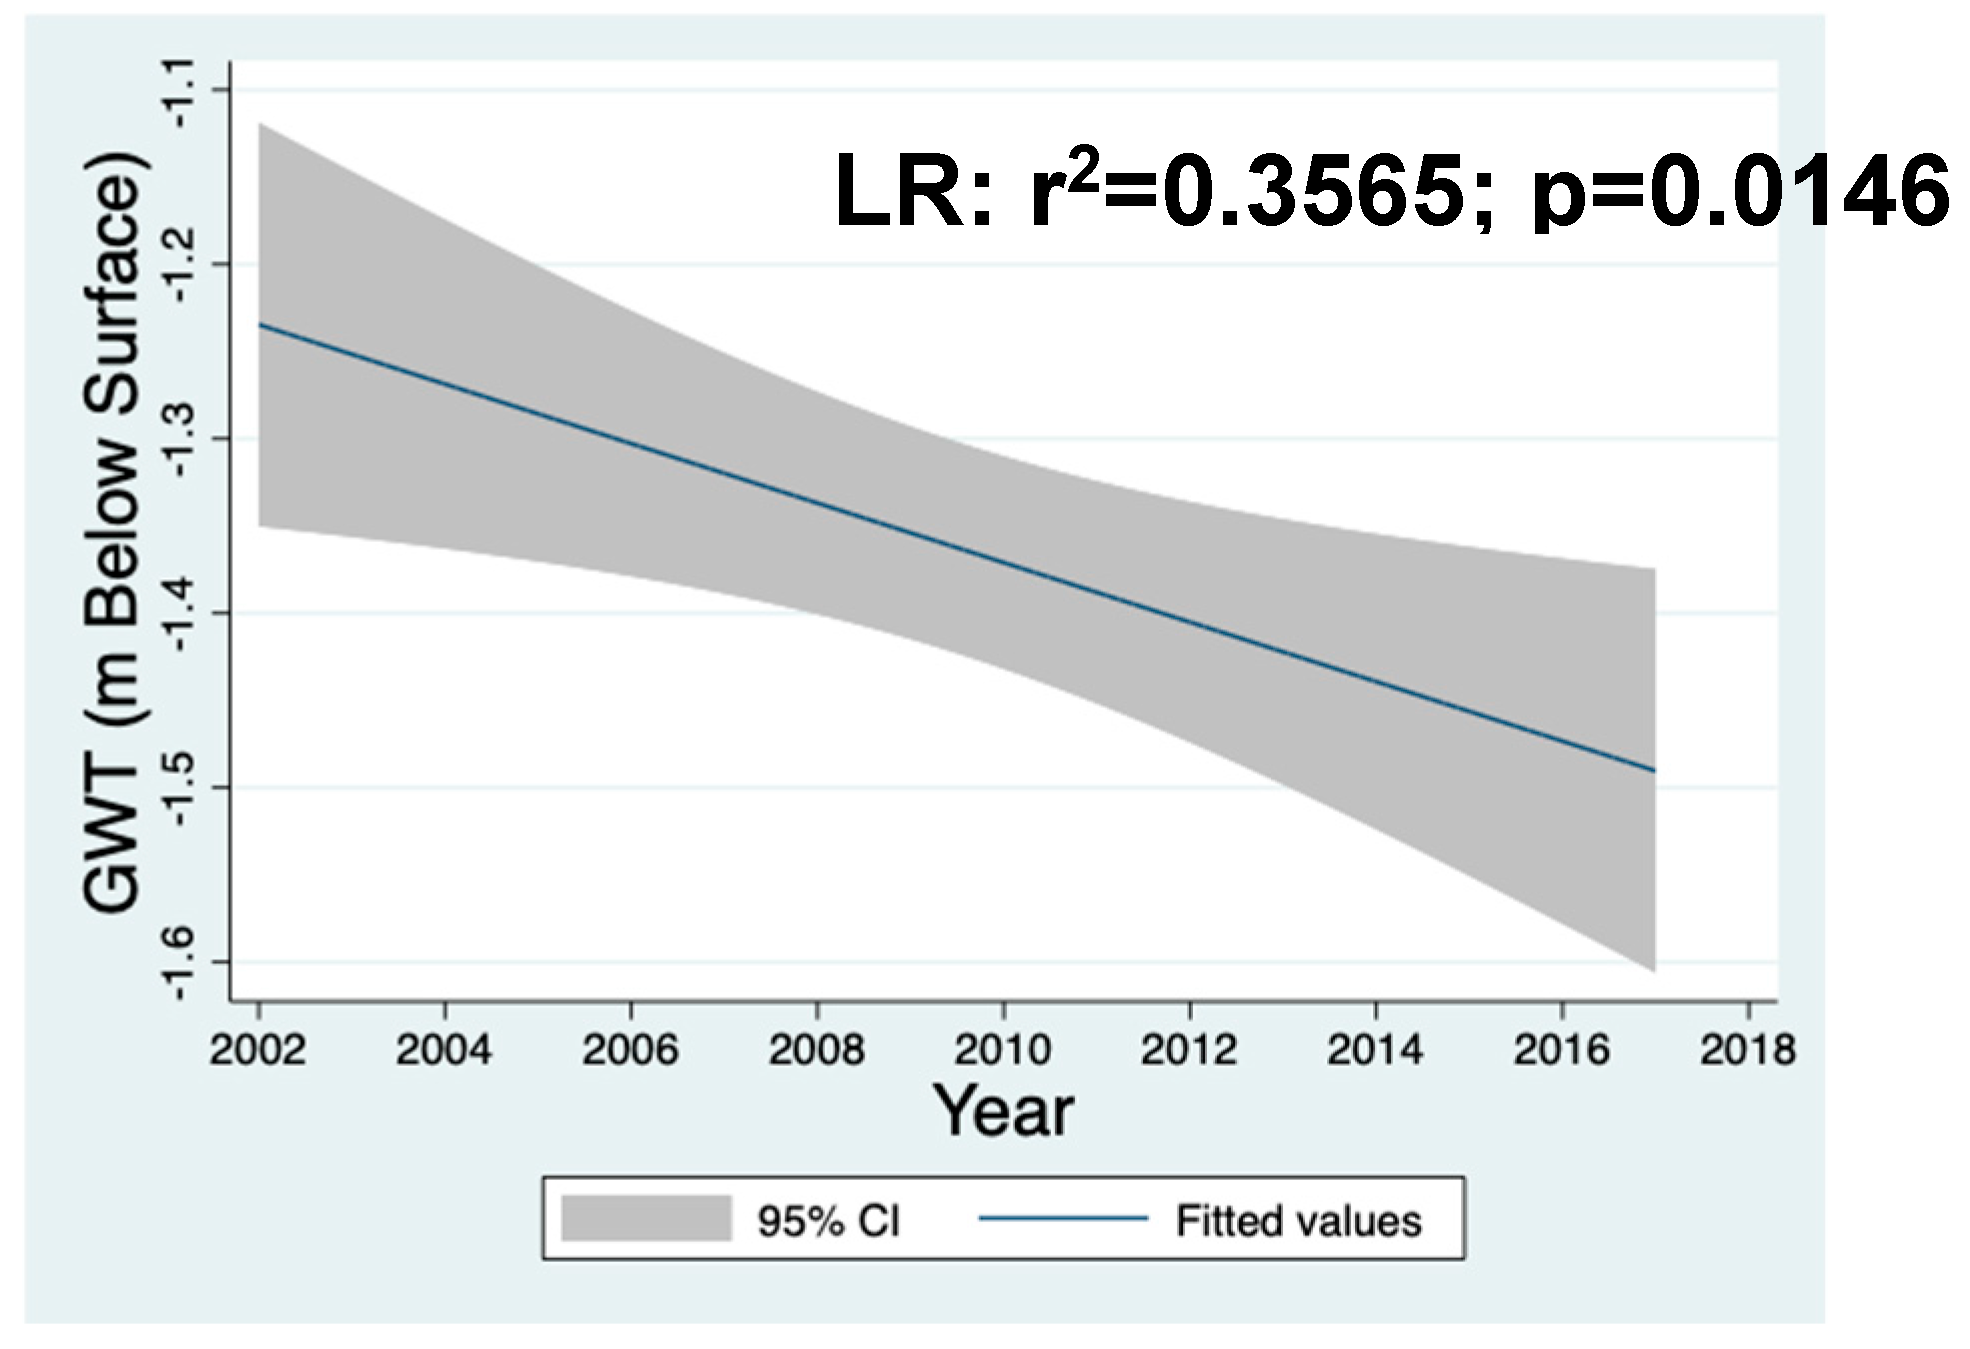
Statistical evaluation (Linear Regression) of rainfall records (2002-2017) in three stations (Gadash, Kfar Blum, Dafna) located in the Hula Valley has indicated significant similarity between each other with the following range of parameters: r2=0.847-0.5145; p=<0.0001-0.0018. The statistical relations (Linear Regression (w/95%CI) between mean (3 stations) annual rainfall and the depth (annual mean) of Ground Water Table (GWT) and the temporal changes of rainfall capacity are given in Figure 14 and Figure 15.
Results given in Figure 14 indicate a positive relation between rainfall and GWT: The higher the rain, the higher the GWT and consequently soil moisture.
3.5. Principal Component Analysis (PCA).
Figure 16.
Graphical layout of PCA analysis/Biplot presentation of environmental variable combinations, NO3, NH4, Ground Water Table (total valley annual means, 1994–2024) and Annual rain (mean, Dafna).
Figure 16.
Graphical layout of PCA analysis/Biplot presentation of environmental variable combinations, NO3, NH4, Ground Water Table (total valley annual means, 1994–2024) and Annual rain (mean, Dafna).
| Table 1. |
| Principle component (Eigenvector) and explained variance by components (Coordinates 1 and 2 and total Explained variance by component 1 = 0.4535 Explained variance by component 2 = 0.3063 Total explained variance = 0.7598 Variables dim1 dim2 ------------------------------------------------------------ EC (mS). 1.2315 -0.6198 Annual Rain(mm) 0.4241 1.7379 GWT (MBS). 0.6983 1.5201 NO3 (ppm) 1.6780 -0.0806 NH4 (ppm). 1.5417 -0.5839 Principle components (Eigenvector): NO3, NH4 and EC are negatively (inversely) correlated with Dimension 2 and all other relations are positive. |
4. Discussion
Not very many Peat soil studies in the Hula Valley were carried out before drainage [9,10]. Shortly after the Hula drainage, intensive investigations of the Peat soil texture, other edaphic features, Peat drained and porewaters and environmental impact consequences were carried out [11-16]. These studies documented Gypsum accumulation and dissolution resulting in SO4, and Ca common components of Peat soil composition. Over a period of 40 years after drainage, the oxidation processes in Peat organic matter resulted in the production of nitrates in the peat soil, accompanied by sulfate (SO4) in both the soil’s porewater and drained waters [15-17]. During 1994-2024 the implementation of the Hula reclamation project (HP) [18-20] of the Peat land was carried out. A major part of the renovated hydrological management was due to the upper (5-7m below surface) Peat soil layers implementing an increase in soil moisture and elevation of the Ground Water Table (GWT). Temporal and seasonal Peat soil moisture enhancement accompanied by GWT elevation enriched NO3, SO4, ALK, as well as increased EC in the drained water.
Calcium Carbonate (source of alkalinity) and Calcium Sulfate (Gypsum, source of Sulfate) in the Peat soil were formed as common components of the Peat soil during the post-Hula drainage period. Consequently, Gypsum dissolution enriched Ca+2 and SO4-2 inputs into the drained waters, sourced from rainfall and irrigation. Enhancement of Ca+2 dissolution combined with elevation of Alkalinity (water capacity to resist acidification) resulted from organic matter decay initiated precipitation of CaCO3 [17]. During the post-Hula drainage period, organic matter was oxidized, emphasizing the conversion of Ammonia to Nitrate and Sulfur to Sulfate [21]. The results presented in Figure 2, Figure 3, Figure 4, Figure 5 and Figure 6 (excluding Figure 5) (seasonal changes) and 7-9 (excluding Figure 7) (Annual temporal changes) indicate a similar distributional pattern: winter increase and summer decline of NO3, EC, Alk, and SO4 (seasonal) and EC, pH, ALK, and SO4 (temporal). It is therefore suggested that the activation factor of Peat nutrient migration is soil moisture. The rainfall seasonality, as measured in 3 stations in the Hula valley, is a typical sub-tropical regime (Figure 12) which is identical to the seasonality presented in Figure 2, Figure 3, Figure 4, Figure 5 and Figure 6 (excluding pH, Figure 5). The very minor changes in seasonal pH indicate Buffer capacity done by the ALK component. The decomposition of the high content of organic matter in Peat demands ALK buffer which is supplied through Gypsum dissolution, accompanied by enhancing EC (salinization) which is an agricultural disadvantage.
Comparative temporal distribution patterns of NO3 and the other soluble components (ALK, SO4) indicate discrepancy. The NO3 pattern represents temporal stability and that of SO4 indicates a decline during 1994-2012 and an increase later. On the contrary, the seasonal patterns of SO4 and ALK of winter high and low in summer and that of NO3 are similar. The seasonal and temporal distribution patterns represent the minor amplitude of pH value fluctuation. Linear Regressions of seasonal distribution of soluble components represent highly significant indication:
ALK Vs SO4: r2=0.4734; p=0.0134
EC Vs SO4: r2=0.9689; p<0.0001
NO3 Vs SO4: r2=0.9351; p<0.0001
All linear regressions between the seasonal distribution pattern of pH and soluble components were not significant.
It was reported that shortly after Peat soil moisture enhancement by sprinkle irrigation, an increase in denitrification activity and nitrate content enhancement were recorded [22]. Moreover, alternate wet-dry conditions during the summer irrigation regime enhanced nitrogen mineralization of the Peat organic matter and nitrate content increase [22]. The inorganic Peat constituents include, among others, CaSO4. (Gypsum), CaCO3, Ca(NO3)2, or NaNO3.The solubility Products (equilibrium) and Solubility Constants (Ksp) of these salts are different. The more soluble a substance is the higher its Ksp value. Alternate cycling of wet-dry through seasonality of rain capacity or temporal climate change or irrigation management induces significant changes in the Peat soil moisture. Consequently, soluble Peat soil products fluctuated respectively. Seasonal changes are respectively incorporated within the correlation plot curve. Even if Ksp values for CaCO3, Ca(NO3)2 and CaSO4 are different, the distributional patterns of the impact of soil moisture for each year (Figure 2, Figure 4, Figure 6) are similar. Whilst, temporal distributional of NO3 is significantly unlike that of CaSO4, Alkalinity and EC. The Ksp of anhydrite (CaSO4) (10-4.36) and Hydrite (CaSO4.2H2O) (10-4.61) forms are significantly lower than that of NaNO3 (0.804) or Ca(NO3)2 (1.2x10⁻²). Likely, the long-term (1994-2024) evaluated record accompanied by respective Ksp values confirmed a higher temporal capacity of dissolved nitrate in comparison with sulfate (Figure 7). The dominant factor that effectively drains and flushes NO3, SO4, EC, and Alkalinity from the Peat soil into the underground waters and forwarding into Canal Z and LAH is soil moisture. The minor seasonal and temporal changes of pH (Figure 5, Figure 8) indicate high buffer capability. Soil moisture enhanced Peat soil salts migration accompanied by nitrates. About sixty years after the considered assumption it was confirmed that salinization of the Peat soil was created not by external contributions but by internal resources within the Peat soil. The same generator creating salinization is recommended inversely to reduce salinity: summer freshwater additional allocation. The fate of nutrient migration in wetlands is a national and international issue [23 - 28]. The Hula drainage enhanced soil nitrogen oxidation, and nitrate replaced ammonium as a significant component within the Peat soil chemical composition. Ammonium migration from the unlimited stock of ammonium within the swampy wetlands was controlled by hydrological conditions. Nitrates are weakly bounded to the Peat soil particles and efficiently disconnect and migrate through water flushing, rain in winter and irrigation in summer. Consequently, a hydrological regime through the Peat-soil defines the rate of nitrate migration from the Hula. The discharge capacity of the Kinneret inflow rivers is therefore the factor that controls load migration by biomass and concentration. The impact of climate change and anthropogenic involvement in the Hula Valley is affected by fluctuated wettability and consequently, soil moisture elevation which enhances NO3 migration and consequently TN, whilst dryness enhances TP migration from the peat soil in the Hula Valley [23-26]. The shift of irrigation usage method from a “flood-capillarity” to moveable sprinkle lines and drip-irrigation, reduced significantly salt drainage water flux into the underground. The impacts of climate conditions (precipitation and discharge) on the nitrogen nutrient loads transportation respectively.
Water mass flow types in the Hula Valley include surface runoff as aerial flood dispersed and folded within the canal system and as underground gathered in preferential pathways (tunnels, or free space). Surface and shallow depths of underground water flows within the Hula Valley are mostly directed from north to south. Nevertheless, Artesian water migration was indicated and defined as significant underground water migration in the valley [29] and was considerable in the northern and not in the southern valley region. The hydraulic gradient oriented North-South was indicated [16]. Three Hypsometrical levels of underground water were defined in the Hula Valley: 1) Surface water; 2) Underground level (Ground Water Table) (GWT, 0-5 m below surface) [16]; 3) “Lignite waters” (5-150m below surface) [30].
Downwards migrations of the Peat-Soil nutrients, including Nitrogen, Phosphorus, Carbonates, Sulfates, and others, occur continuously with seasonal fluctuations and a significant portion of those nutrients are deeply buried. Part of the nutrients within the shallow (0-6 m) layers are exported horizontally north-south directed. Previous geological investigations in the Hula Valley were documented [11,31,32,33,34,35]. Nevertheless, documentation of hydrological monitor data and soil moisture conditions was not comprehensively accomplished [36]. Underground Peat-Soil water composition studies of deep and shallow depth were documented [16,37]. Nonetheless, the monitoring program of quantitative and qualitative qualities of surface waters was long term routinely recorded. A comprehensive description of the upper (shallower) different soil types in the Hula Valley during the Post Drainage Era was widely documented (among others) [9,21,23,29,34]. The present study is a partial completion supporting knowledge for future management design.
4.1. Conclusive Remarks
Varieties of chemical compositions and concentrations resulting soil and water salinization [38]. Calcium-Sulfur-Gypsum`s Geochemical system constructs the mechanisms of salinization in the Hula Valley [17,39]. The present study emphasizes that salinization and nitrate migration processes in the Hula Valley coincide due to adjacent phenomena driven by soil moisture whilst a supportive linkage factor through geochemical traits is absent. The post-drainage Hula period initiates several agro-eco-environmental obstacles: efficient agricultural management whilst preventing Kinneret water quality deterioration. The newly created ecosystem conditions required a program formulation for the management of agriculture, tourism and Kinneret water quality protection of which nitrate migration and soil salinization are critical. Awareness of contradicted factor involvement within a complicated ecosystem and interests was clearly understood (among others): Nature protectors against natural ecosystem devastation; Agro-economical demands, such as fertilization or irrigation water allocation by the farmer`s land owners; prevention of pollutants leaking into Lake Kinneret by water managers; Touristic optional attractions for recreational designers. Consequently, the relationship between NO3 migration and soil salinization, typical Hula Valley compartments, deserves a thorough consideration. The enhancement of soil moisture, which was one of the Hula Reclamation Project conclusions, was successfully implemented. Nevertheless, salinization was enhanced as well and NO3 migration continued intensively. Therefore, the findings presented in this paper, which suggest that salinization and nitrate migration are geochemically independent yet coincident processes, both enhanced by elevated soil moisture, are crucial for informing future management strategies. The already implemented increase of summer irrigation water allocation reduced soil salinity and phosphorus migration but enhanced NO3 migration which was indicated as not harmful for Kinneret water quality at present conditions of nitrogen insufficiency.
Author Contributions
Acknowledgments
Sincere appreciation is given to Prof. D. Levanon, and D. Klein, for fruitful and friendly collaboration; To V. Orlov-Levin, and M. Peres, for unpublished data supply and T. Natanson, and E. Yasur for field sampling assistance.
References
- Luther, G.W., III; Church, T.M. Seasonal cycling of sulfur and iron in porewater of a Delaware salt marsh. Mar. Chem. 1988, 23, 295–309. [Google Scholar] [CrossRef]
- Litaor, M.I.; Reichman, O.; Shenker, M. /12. Genesis, classification and human modification of peat and mineral-organic soils, Hula Valley, Israel. Mires Peat 2011, 9,, 1–9, Available online: http://www.mires-andpeat .net.
- Levanon, D. Chapter-Forward: Agricultural Development and Soil Deterioration After the Hula Drainage. In Agriculture, Recreation, Water Quality and Nature Protection in the Hula Valley, Israel; 70 Years of a Mega-Ecological Project; Springer Geography, 2023; 243p. [Google Scholar] [CrossRef]
- Gophen, M.; Levanon, D. (1994-2006) Hula Project Annual Reports. MIGAL and JNF (KKL). (1994-2005 in Hebrew), (2006 in English).
- Gonen, E. (2007) Hula Project Annual Report. Jewish National Fund (Keren Kaye- met LeIsrael) MIGAL-Scientific Research Institute and Israeli Water Authority, 133 p. (in Hebrew.
- Barnea, I. (2008) Hula Project Annual Report. Jewish National Fund (Keren Kaye- met LeIsrael), MIGAL-Scientific Research Institute and Israeli Water Authority, 159 p. (in Hebrew).
- Barnea, I.; Kaplan, D. (2008-2018) Hula Project Annual Report. Jewish National Fund (Keren Kayemet LeIsrael), MIGAL-Scientific Research Institute and Israeli Water Authori- ty, 156 p. (in Hebrew).
- Perelson, O.; Klein, D.; Kaplan, D. 2021-2023; Hula Project Annual Report. Jewish National Fund (Keren Kayemeth Lelsrael), MIGAL-Scientific Research Institute and Is- raeli Water Authority, 127, p. (in Hebrew).
- Ravikovitch, S. Peat soils and soils rich in organic matter in the Huleh Valley. Agric. Res. Station. Bull. 1948, 47. [Google Scholar]
- Dimentman, C.; Bromely, H.J.; Por, F.D. Lake Hula, Reconstruction of the Fauna and Hydrobiology of a Lost Lake; Publications of the Israel Academy of Sciences and Humanities: 1992; 170p (Brief Summary in Hebrew 24p.).
- Agron, N.; Fleisher, E. Quality and Distribution of Peat in the Hula Valley; Report No. Hydro/76; Geological Survey of Israel: Jerusalem, 1976. [Google Scholar]
- Brenner, S.; Ikan, R.; Agron, N.A.; Nissenbaum, A. Hula Valley Peat: review of chemical and geochemical aspects. Soil Science 1978, 125, 226–232. [Google Scholar] [CrossRef]
- Bein, A. Early evolution and transformation of organic matter in the active continental Jordan Rift Valley. Org. Geochem. 1986, 10, 751–757. [Google Scholar] [CrossRef]
- Bein, A.; Nielsen, H. Sulfur diagenesis in freshwater lignite (Hula Basin, Israel): implication for S-C relationships in organic sediments. J. Geol. Soc. Lon. 1988, 145, 133–136. [Google Scholar] [CrossRef]
- Ronen, D.; Magaritz, M.; Paldor, N.; Bachmat, Y. The behavior of groundwater in the vicinity of water table evidenced by specific discharge profiles. Water Resour. Res. 1986, 22, 1217–1224. [Google Scholar] [CrossRef]
- Gophen, M. Chapters: 1) Subterranean migration of nutrients in the Hula Valley; pp 39-51: https://doi.org/10.1007/978-3-031-23412-5_3 2) Nutrient Export from the Hula Valley. https://doi.org/10.1007/978-3-031-23412-5--11;pp 161-178. In: Agriculture, Recreation, Water Quality and Nature Protection in the Hula Valley, Israel. Springer-Geography; Springer Nature Switzerland AG 2023.
- Markel, D.; Sass, E.; Lazar, B.; Bein, A. Biogeochemical evolution of s.a sulfur-iron rich aquatic system in a reflooded wetland environment (Lake Agmon, northern Israel). Wetlands Ecology, and Management 1998 1998 Kluwer Academic Publishers. 1998, 6, 103–120. [Google Scholar] [CrossRef]
- Agmon-Hula -Nature Production; Jewish National Fund, Keren Kayemet Le`Israel, Soil development Department, Publisher Jerusalem: 2019; 188 p. (in Hebrew). Duani, M.; Bone, O. (Eds.).
- Duani, M. The Hula Swamp as a Symbol of Israel`s Developing Attitude Towards the Environment; (in Hebrew, English Abstract); Yad Izhak Ben-0Zvi Publisher: Jerusalem, 2020; 182 p. [Google Scholar]
- Gophen, M. Agriculture, Recreation, Water Quality and Nature Protection in the Hula Valley, Israel: 70 Years of a Mega-Ecological Project; Springer Geography, 2023; 243p. [Google Scholar] [CrossRef]
- Avnimelech, y.; Dasberg, s.; Harpaz, a.; Levin, i. prevention of nitrate leakage from the hula basin, israel: a case study in watershed management. Soil Science 1978, 125, 233–239. [Google Scholar] [CrossRef]
- Levanon, D., Y. Henis, Y. Okon, A. Dovrat. Alfaalfa saponins and microbial transformations of nitrogen in Peat. Soil. Biochem. 1982, 14, 501–504. [Google Scholar] [CrossRef]
- Marish, S. (1986) Chapter: Soil Survey in Hula Valley 1984/85. In: Zemach, M.M., Ed., Workshop on Hula Peat Management Esteem Compiled, Kinneret Authority and Kinneret Drainage Authority, 2-6.
- Avnimelech, Y. (1986) Chapter: The Hula Peat Soil: Composition, Features and Con- clusion. In: Zemach, M.M., Ed., Workshop on Hula Peat Management Esteem Com- piled, Kinneret Authority and Kinneret Drainage Authority, 11-13.(in Hebrew).
- Gophen, M.; Orlov-Levin, V. Temporal, Spatial, and Hypsometrical Dispersion of Nutrients in the Hula Valley, Israel. Open Journal of Ecology 2024, 14, 604–628. [Google Scholar] [CrossRef]
- Michaeli, A. (1979) Hula Lignite Project, Drainage Studies. TAHAL Consulting En- gineers Ltd., Institute for Petroleum Research and Geophysics, Ministry of Energy and Infrastructure, 88.
- Al Maarofi, S.; Douabul, A.; Al-Saad, H. Mesopotamian Marshlands: Salinization Problem. Journal of Environmental Protection 2012, 3, 1295–1301. [Google Scholar] [CrossRef]
- Mohamed, M.L., Diongue, D.M.L., Emvoutou, H.C., Mohamed, A.S., Jiddou, M. and Faye, S. Salinization Processes in the Benichab Coastal Aquifer-Mauritania. International Journal of Geosciences 2020, 11, 377–-392. [Google Scholar] [CrossRef]
- Litaor, I. M.; Eshel, G. 2003, Hydrogeology and Water balance of the Agmon region, Hula Valley, Conclusive Report, Funded by Water Commission, 69 p.(in Hebrew); Four attachments; 27 Figures; 9- Tables.
- Grader, P. 1952, Isr. Geol. Surv. Bull. No. (1).1952, Geological report on the lower peat zone of the Hula Basin. Geol. Surv. Israel, 8 p.
- Picard, L. The Quaternary in the northern Jordan Valley. The Israel Academy of Sciences and Humanities. Proceedings 1963, 1, 1–34. [Google Scholar]
- Hutchinson, H. E., and V. M. Cowgill. The waters of Merom: a study of lake Huleh 3. The major constituents of a 54 m core. Arch. Hydrobiol. 1973, 72, 145–185. [Google Scholar]
- Kafri, U., and B. Lang. Hula Lignite Project, Geological Report; Institute for Petroleum Research and Geophysics, Ministry of Energy and Infrastructure, Geological Survey of Israel, Hydrogeology Div.; Report HYDRO/3/79, Jerusalem, Dec. 1979, 85 p. 1979. [Google Scholar]
- Levin, I.; Shoham, D. Soil Subsidence in the Reclaimed Hula Swamps 1958-1965, Interim Report; The Vulcani Institute for Agricultural Research, Irrigation Department and TAHAL, Water Planning . For Israel, Ltd. Drainage Division, Haifa February 1966, 12 p. 3 tble , 3 Figures, (in Hebrew, English Summary). 1966.
- Workshop: Esteemed evaluation of the present status of Hula Peat Soil management (Abstracts), Tzemach, March 1986, Kinneret Authority -Kinneret Drainage Authority: 1986, 47 p (in Hebrew). Meron, M. (Ed.).
- Neuman, S.P.; Dasberg, S. Peat hydrology in the Hula Basin. II. Sub- surface flow regime. J. Hydrol. 1977, 32, 241–256. [Google Scholar] [CrossRef]
- Serruya, C.; Edelstein, M. The Lignite Project: Impact of the Hula Lignite in Mining on the Lake Kinneret Water Quality; Interim Report; Institute for Petroleum Research and Geophysics-Hula Lignite Project; Ministry of Energy and Infrastructure: 1979; 40 p.
- Nishri, A.; Geifman, M.S.A.R.Y.; Krom, M. Lake Kinneret The Sea of Galilee : the effects of diversion of external salinity sources and the probable chemical composition of the internal salinity sources 1999. Chemical Geology 1999, 158, 37–52. [Google Scholar] [CrossRef]
- Brand-Klivanski, S. Mechanisms of geochemical salinization in the violated swampy soil in the Hula Valley, the Calcium-Sulfur Gypsum system. PhD Thesis, (in Hebrew, English Abstract).. submitted to the Hebrew University, Jerusalem, 2015. [Google Scholar]
Figure 2.
Seasonal (monthly) changes (1994–2024) of NO3 concentration (ppm): Quadratic regression plot (Linear Regression parameters are given).
Figure 2.
Seasonal (monthly) changes (1994–2024) of NO3 concentration (ppm): Quadratic regression plot (Linear Regression parameters are given).
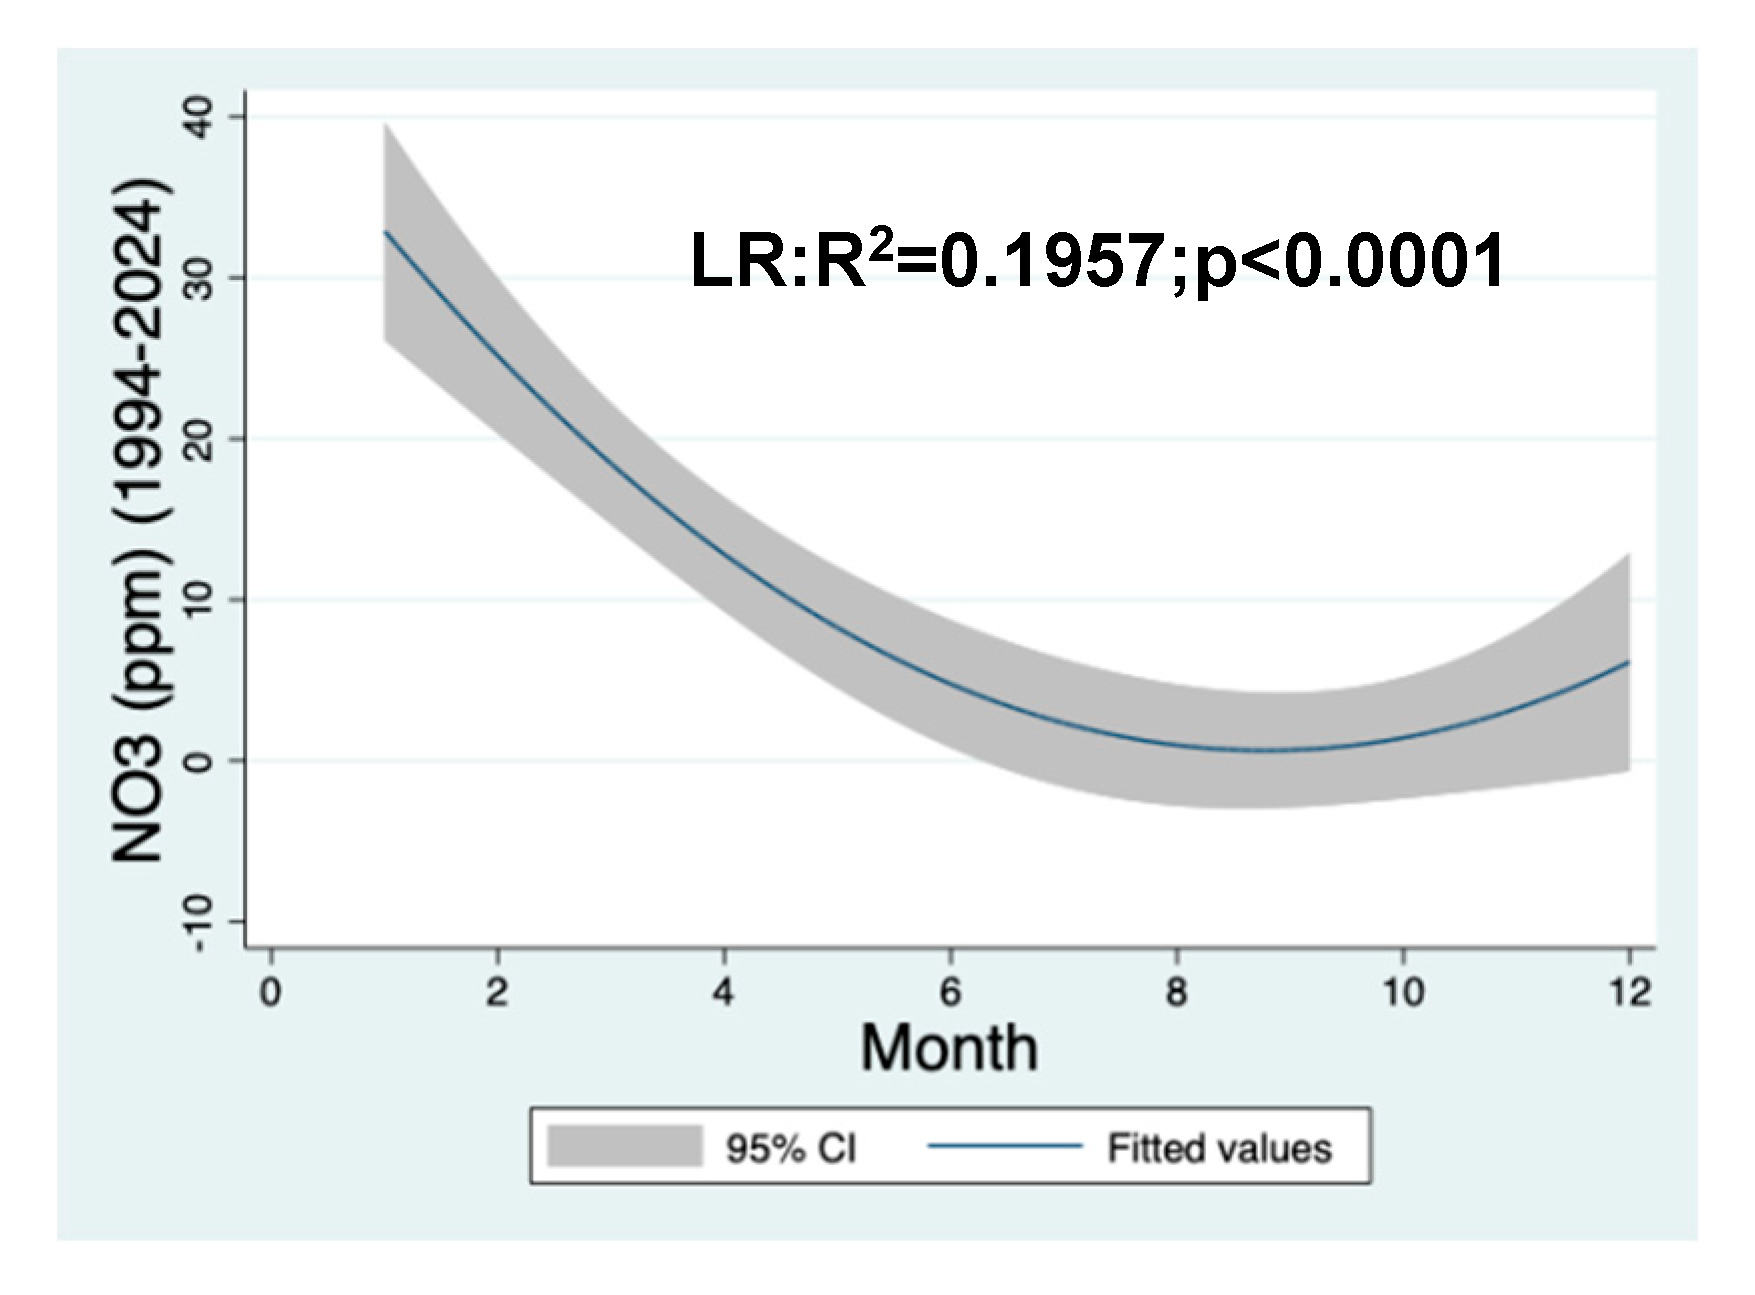
Figure 7.
Quadratic regression plot of temporal fluctuations of EC (left) and NO3 (right) during 1994–2024.
Figure 7.
Quadratic regression plot of temporal fluctuations of EC (left) and NO3 (right) during 1994–2024.
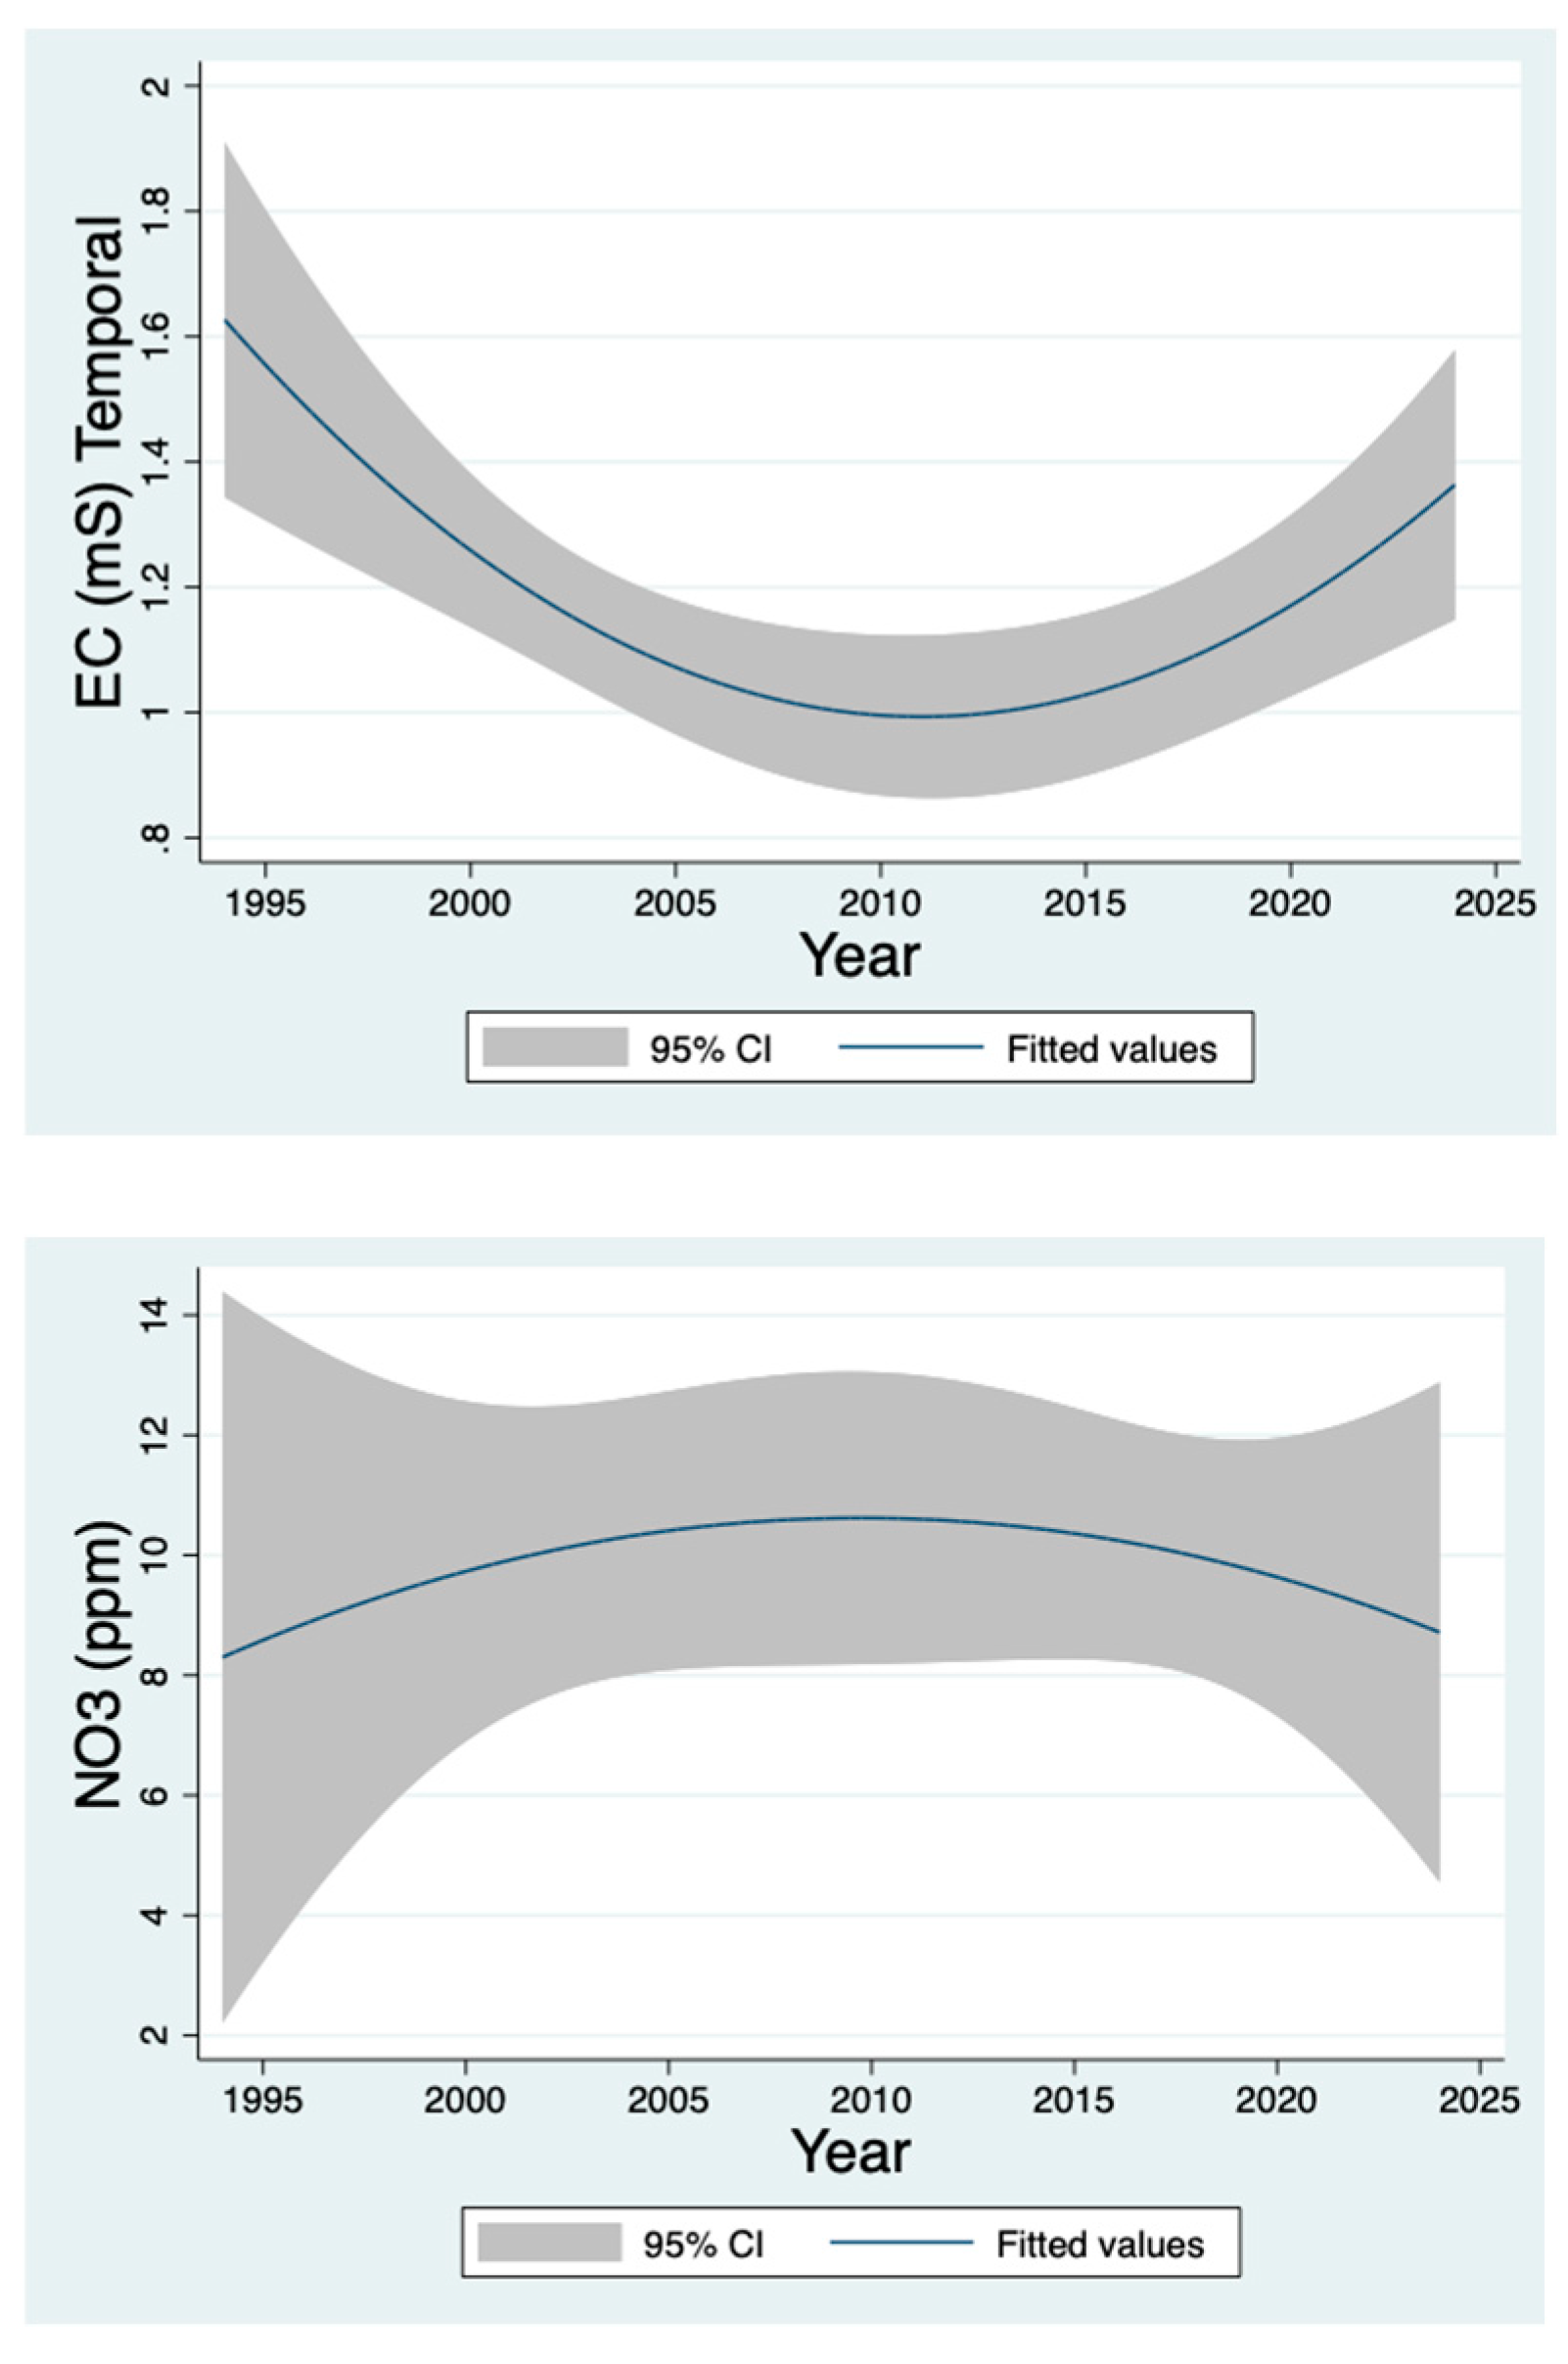
Figure 8.
Quadratic regression plot of temporal fluctuations of pH (left) and ALK (right) during 1994–2024.
Figure 8.
Quadratic regression plot of temporal fluctuations of pH (left) and ALK (right) during 1994–2024.
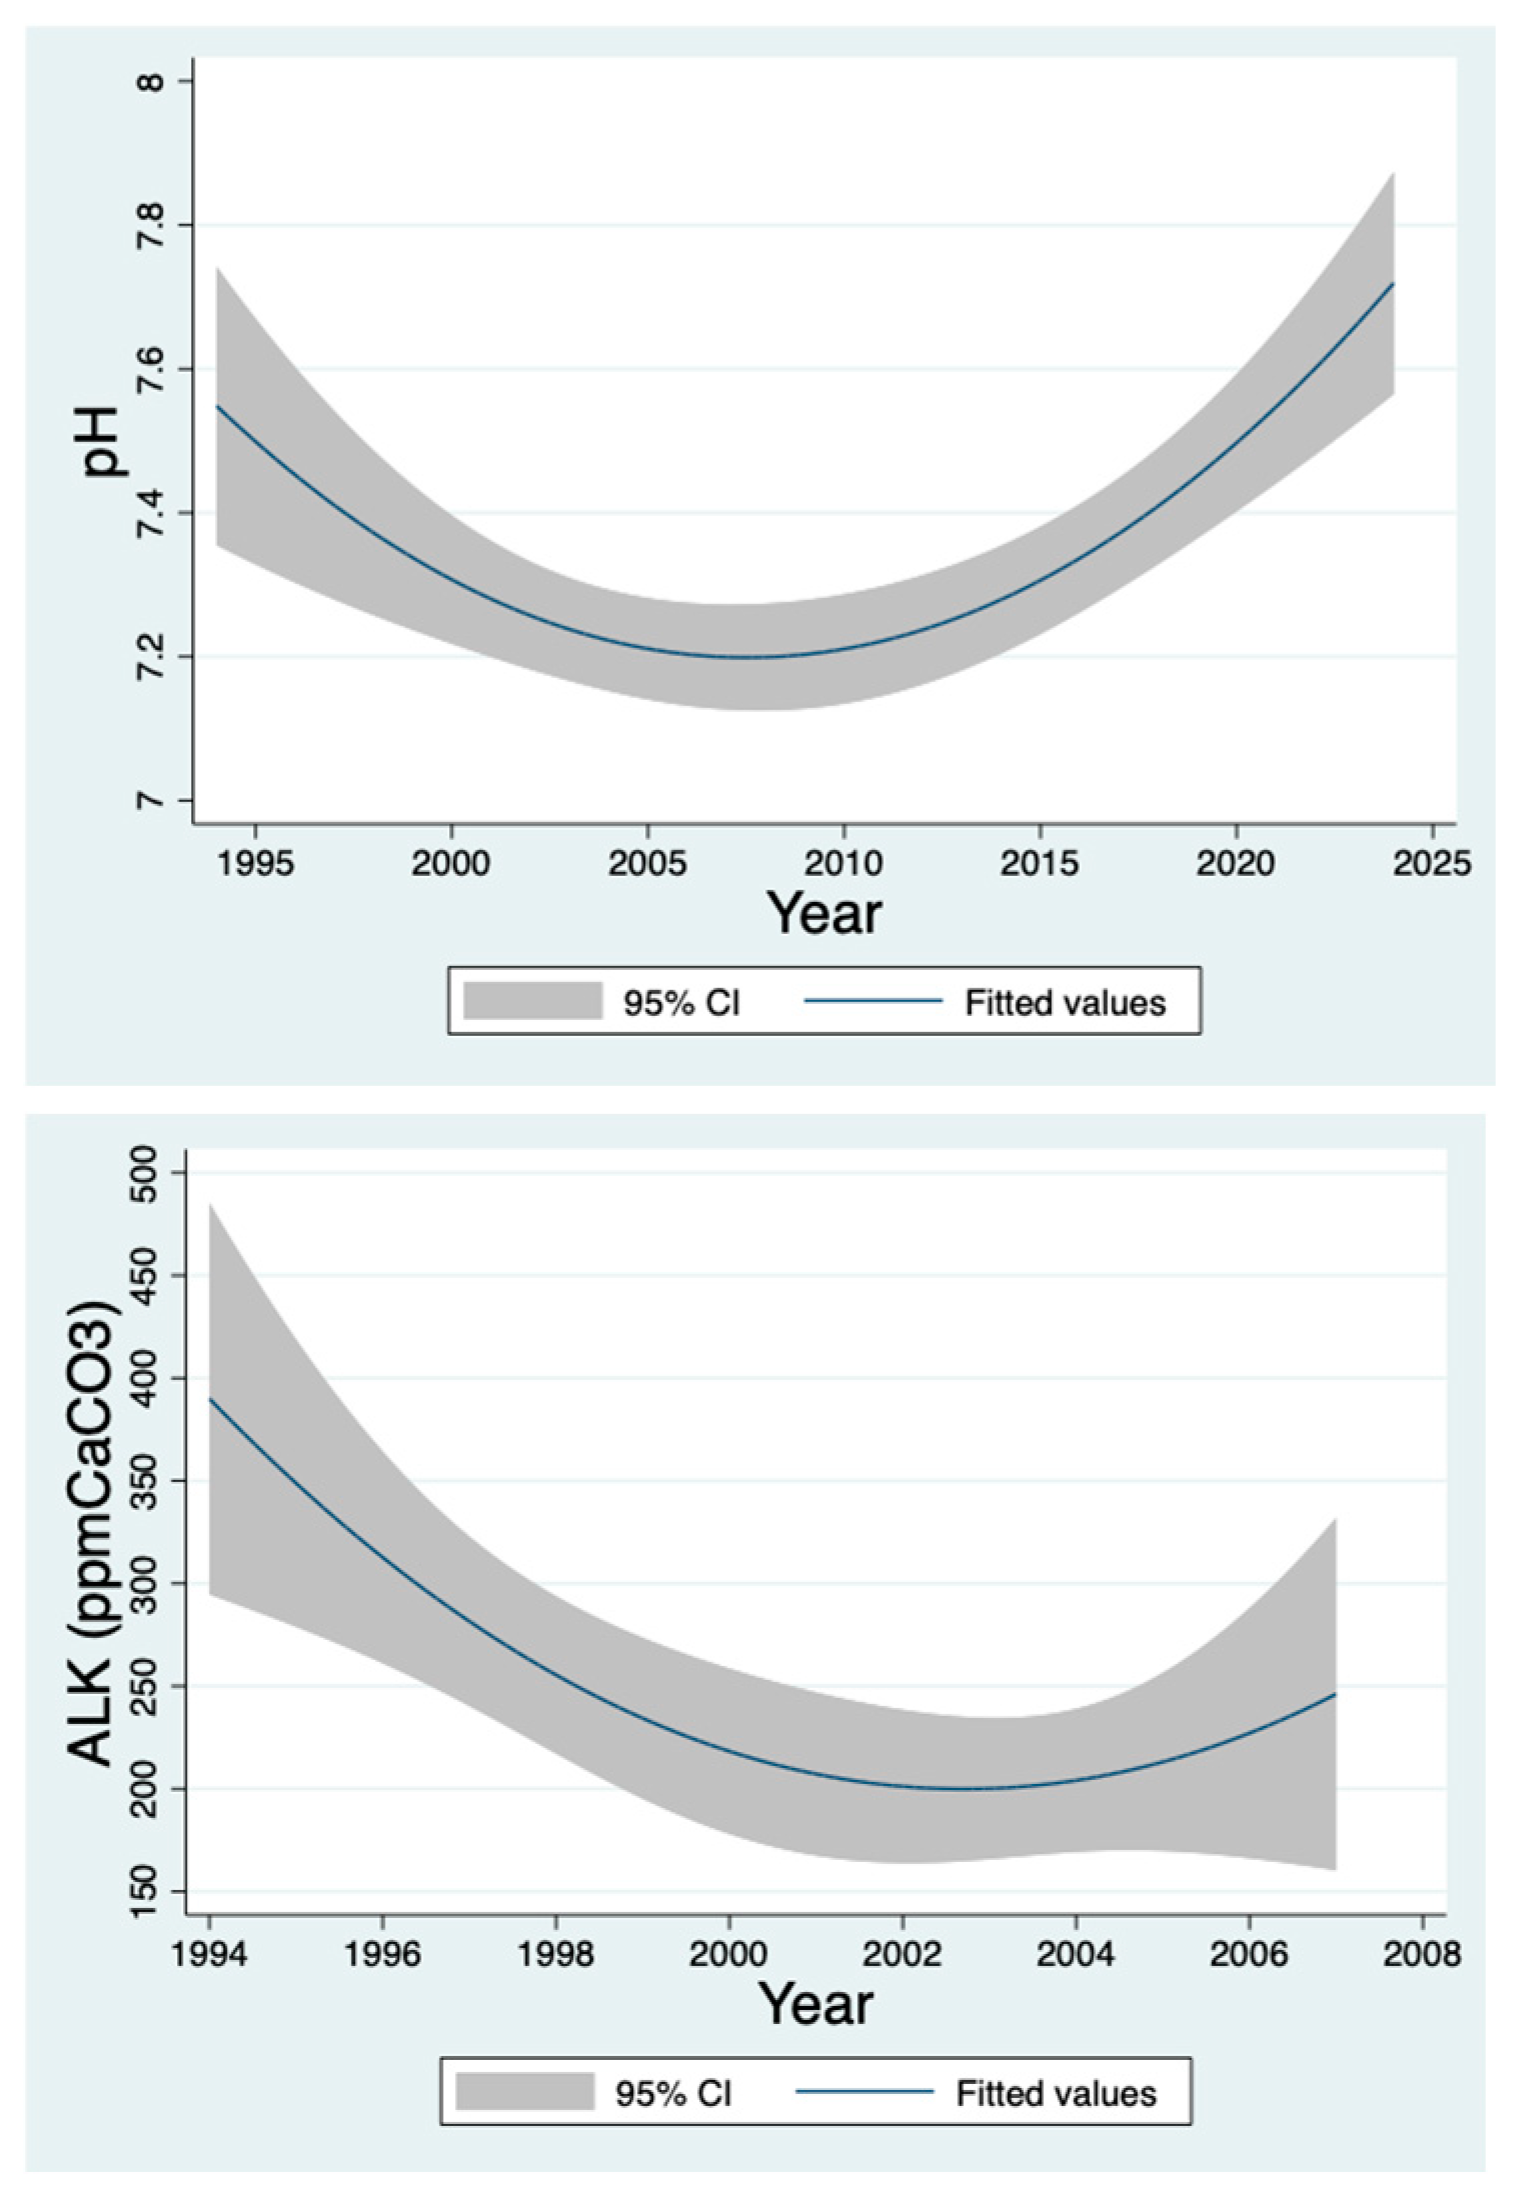
Figure 9.
Quadratic regression plot of temporal fluctuations of Sulfate (SO4) t) from 1994-2024.Results confirm the similarity between seasonal and temporal patterns of distribution of pH, EC, ALK and SO4 parameters: winter elevation and summer decline. The temporal distribution of NO3 is exceptionally different.
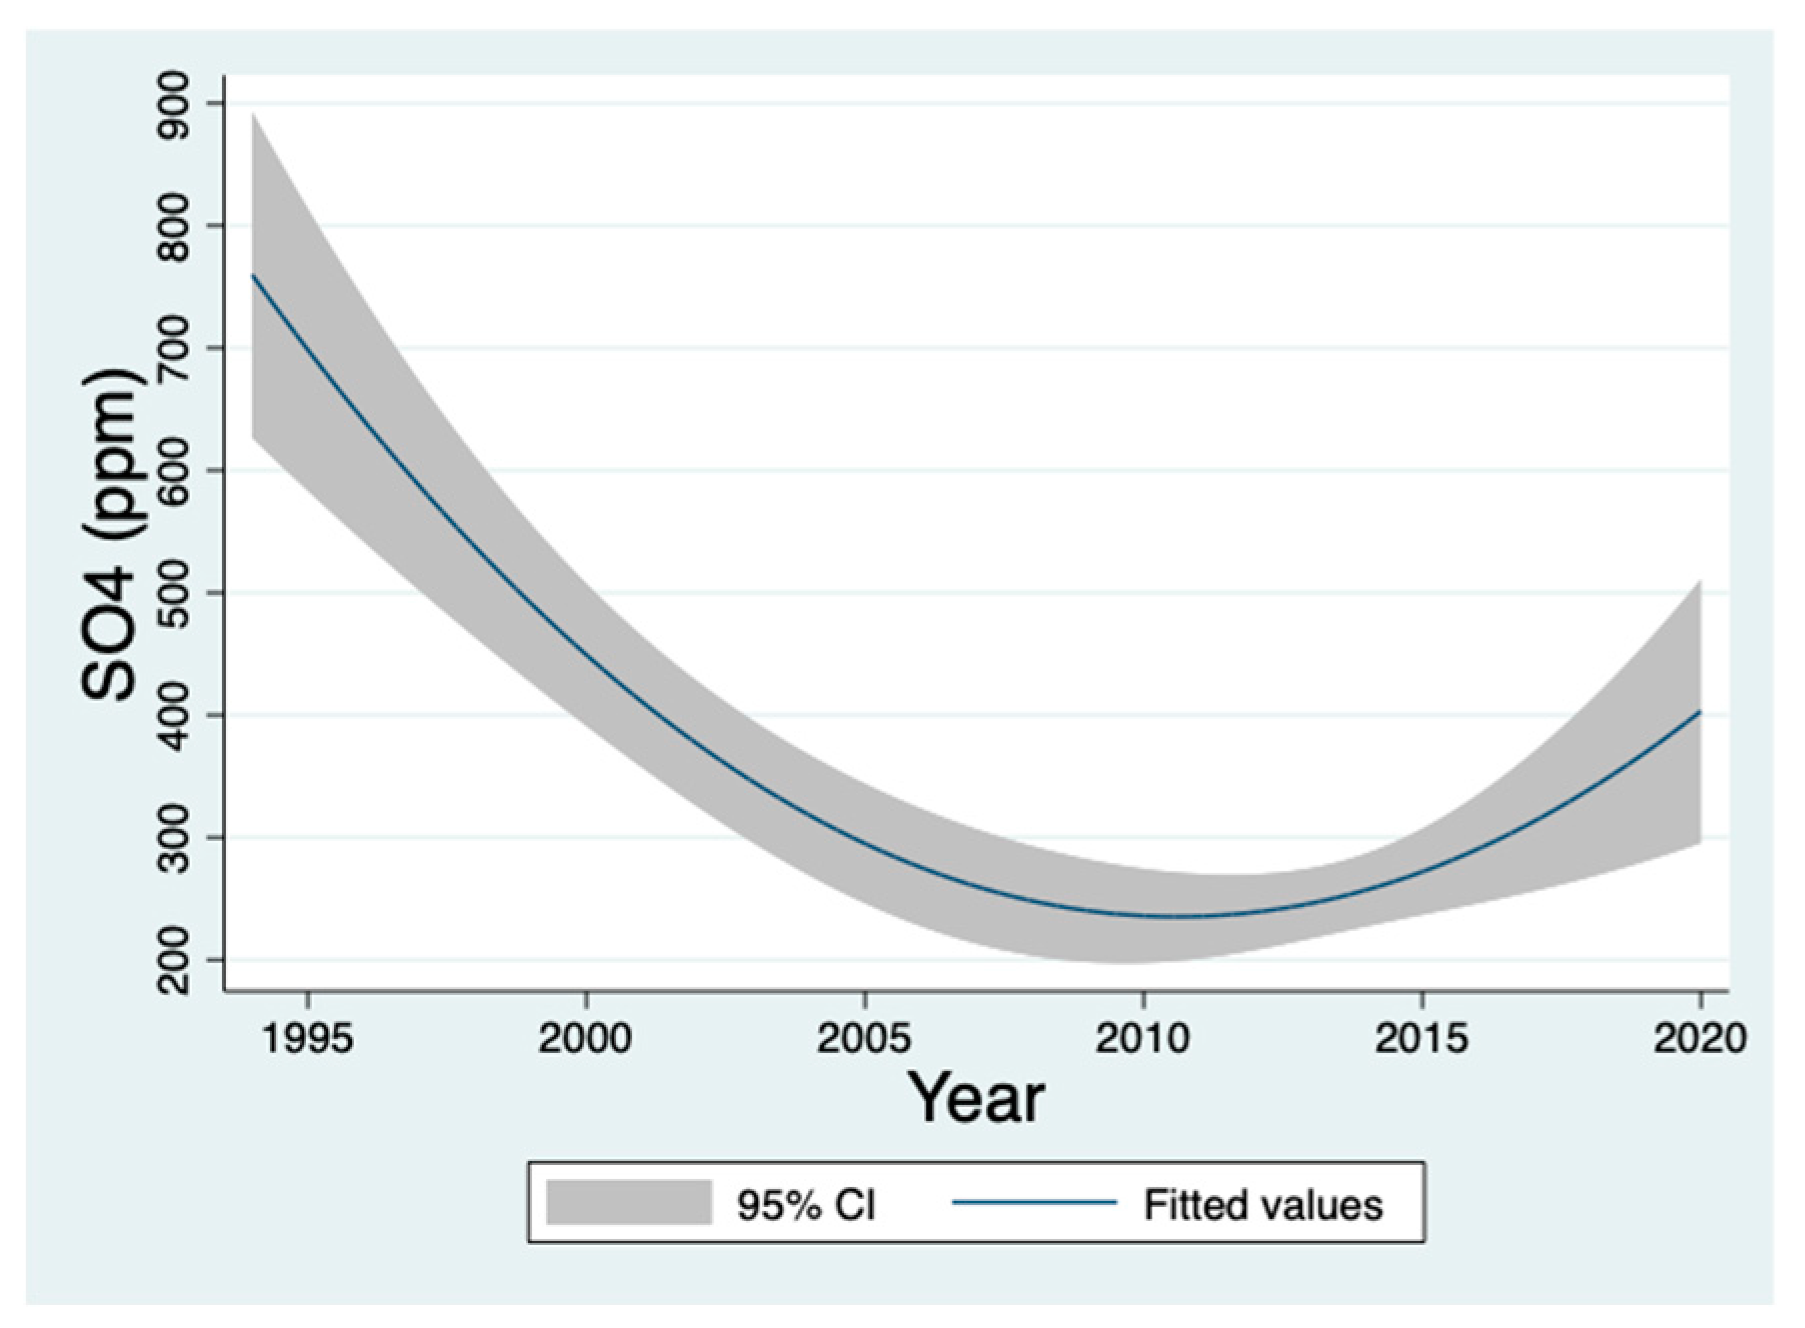
Figure 10.
Linear regression between the monthly mean distribution of NO3 (ppm) and EC (mS) during 1994–2024.
Figure 10.
Linear regression between the monthly mean distribution of NO3 (ppm) and EC (mS) during 1994–2024.
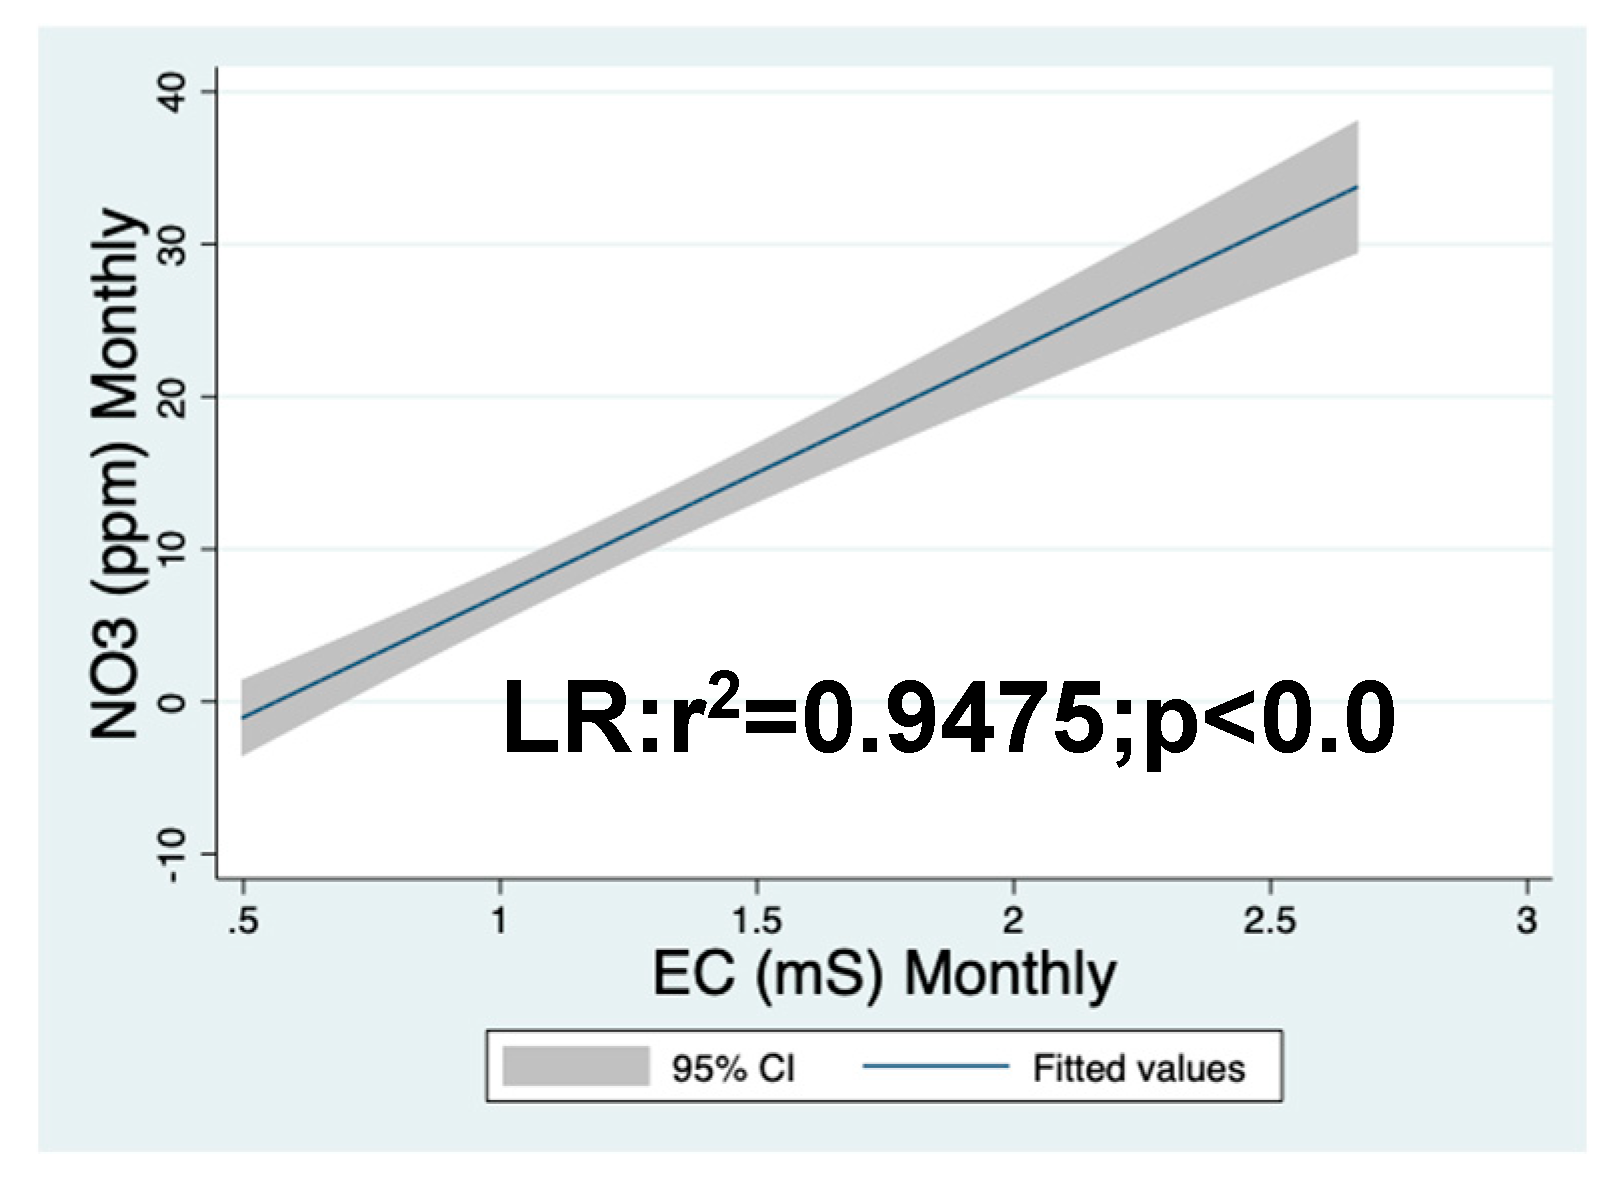
Figure 11.
Linear regression between the monthly mean distribution of EC (mS) and ALK (ppm CaCO3) during 1994–2024.
Figure 11.
Linear regression between the monthly mean distribution of EC (mS) and ALK (ppm CaCO3) during 1994–2024.
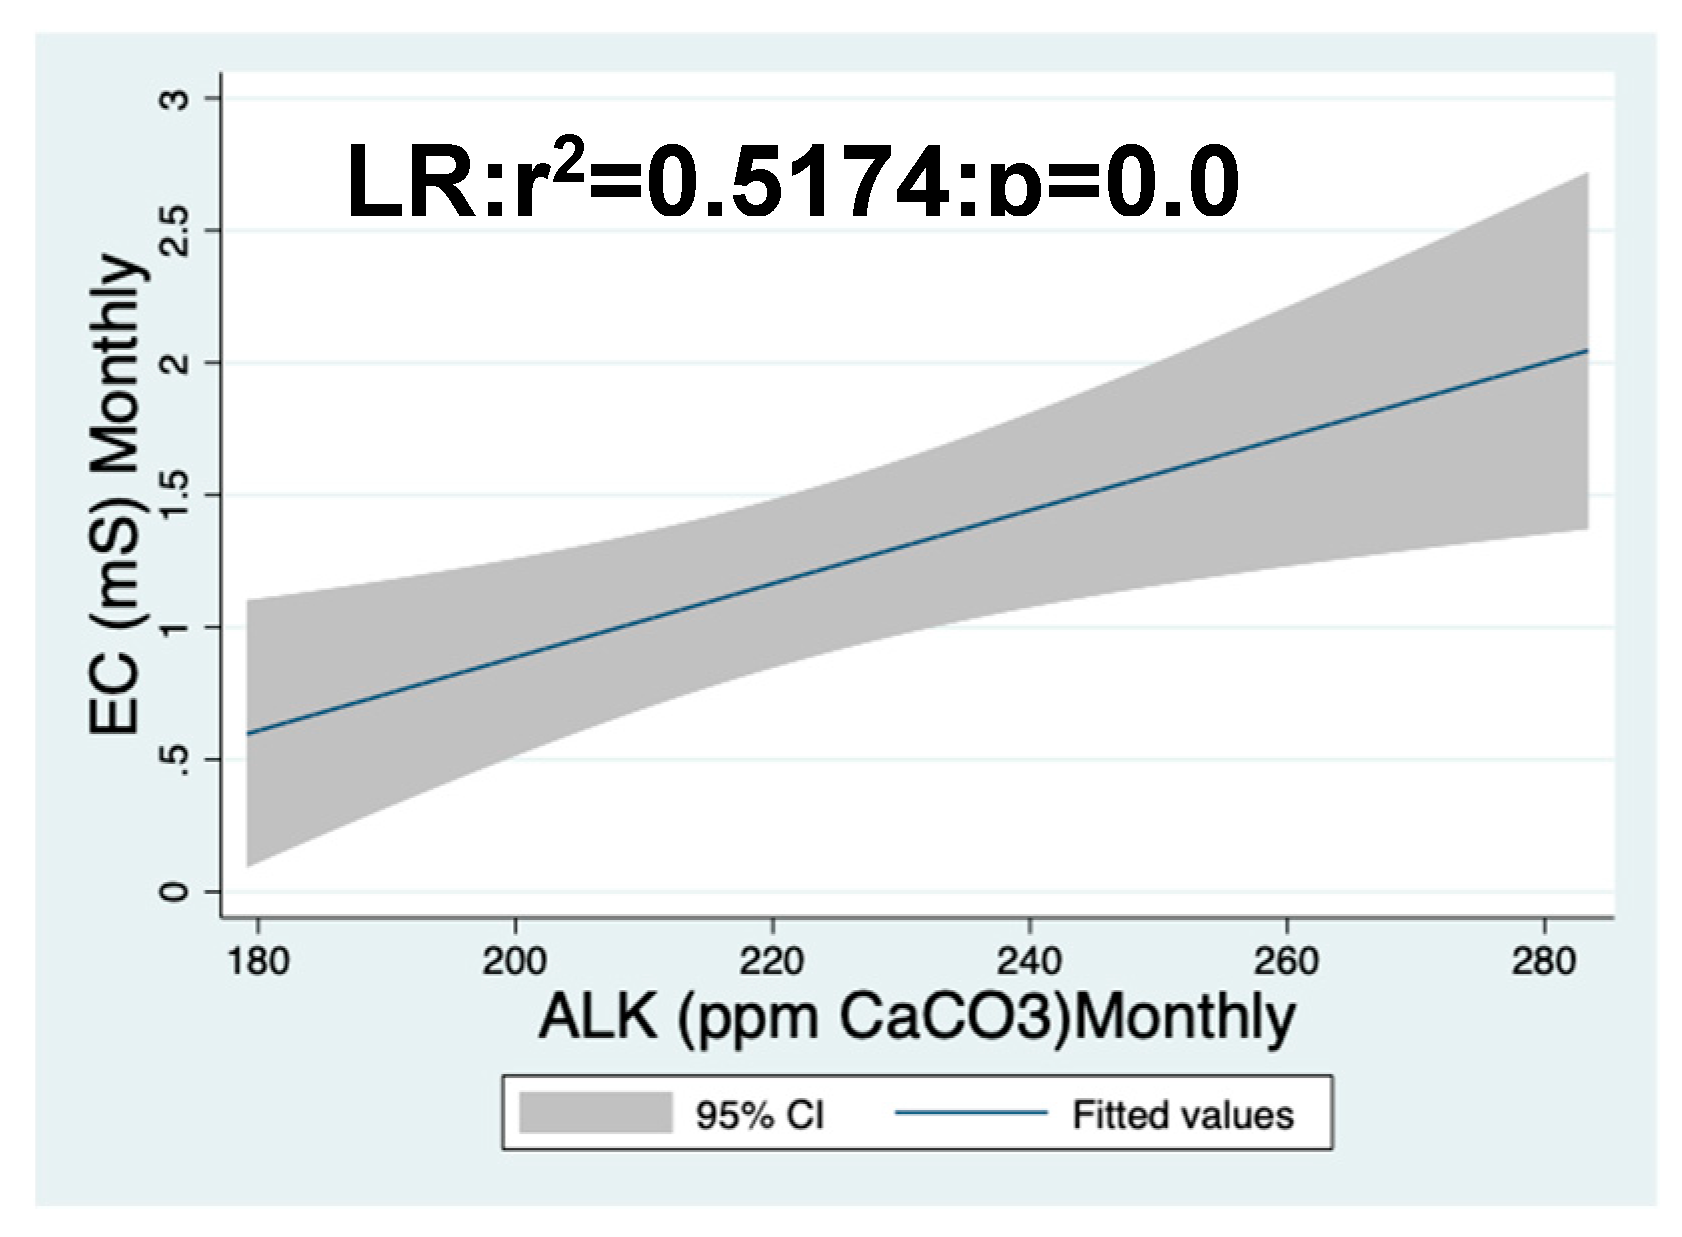
Figure 12.
Linear regression between the monthly mean distribution of NO3 (ppm) and ALK (ppm CaCO3) during 1994–2024 [3,4,5,6,7,8].
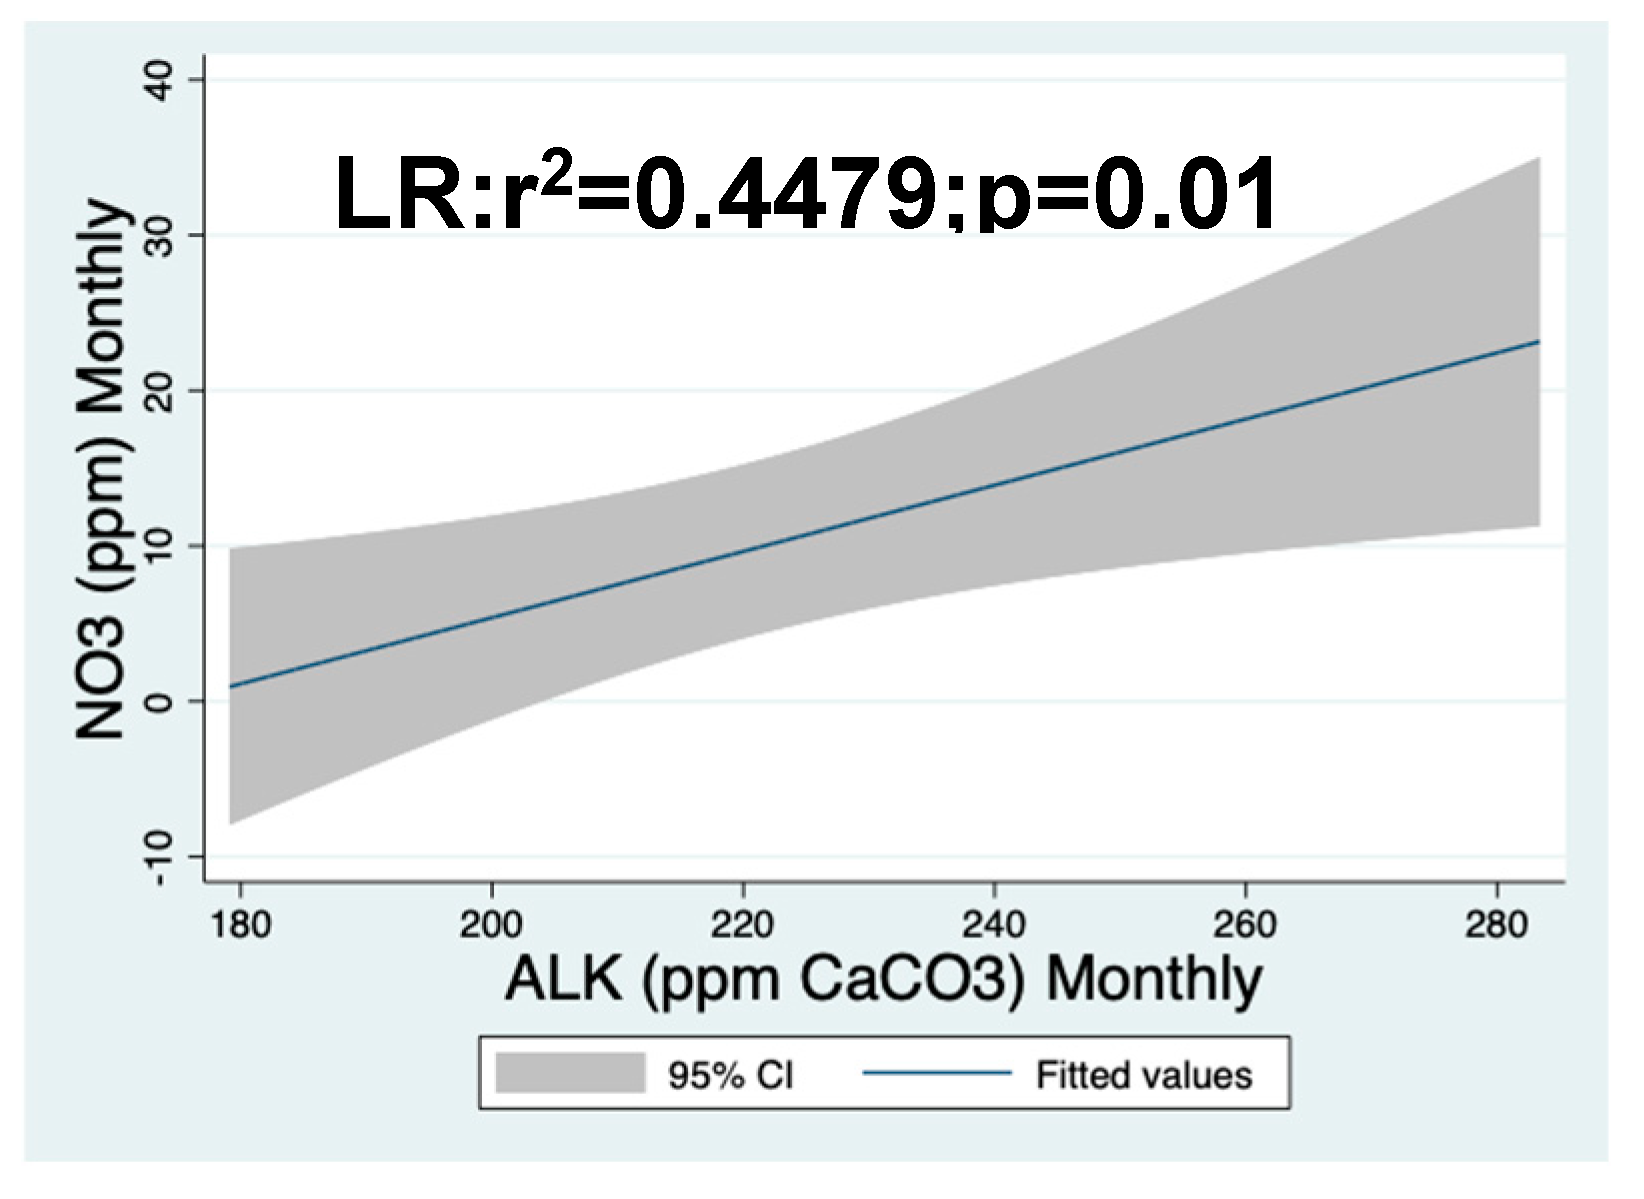
Figure 13.
Monthly Rainfall (mm), average (1994–2024) of Gadash, Kfar Blum and Dafna meteorological Stations in the Hula Valley.
Figure 13.
Monthly Rainfall (mm), average (1994–2024) of Gadash, Kfar Blum and Dafna meteorological Stations in the Hula Valley.
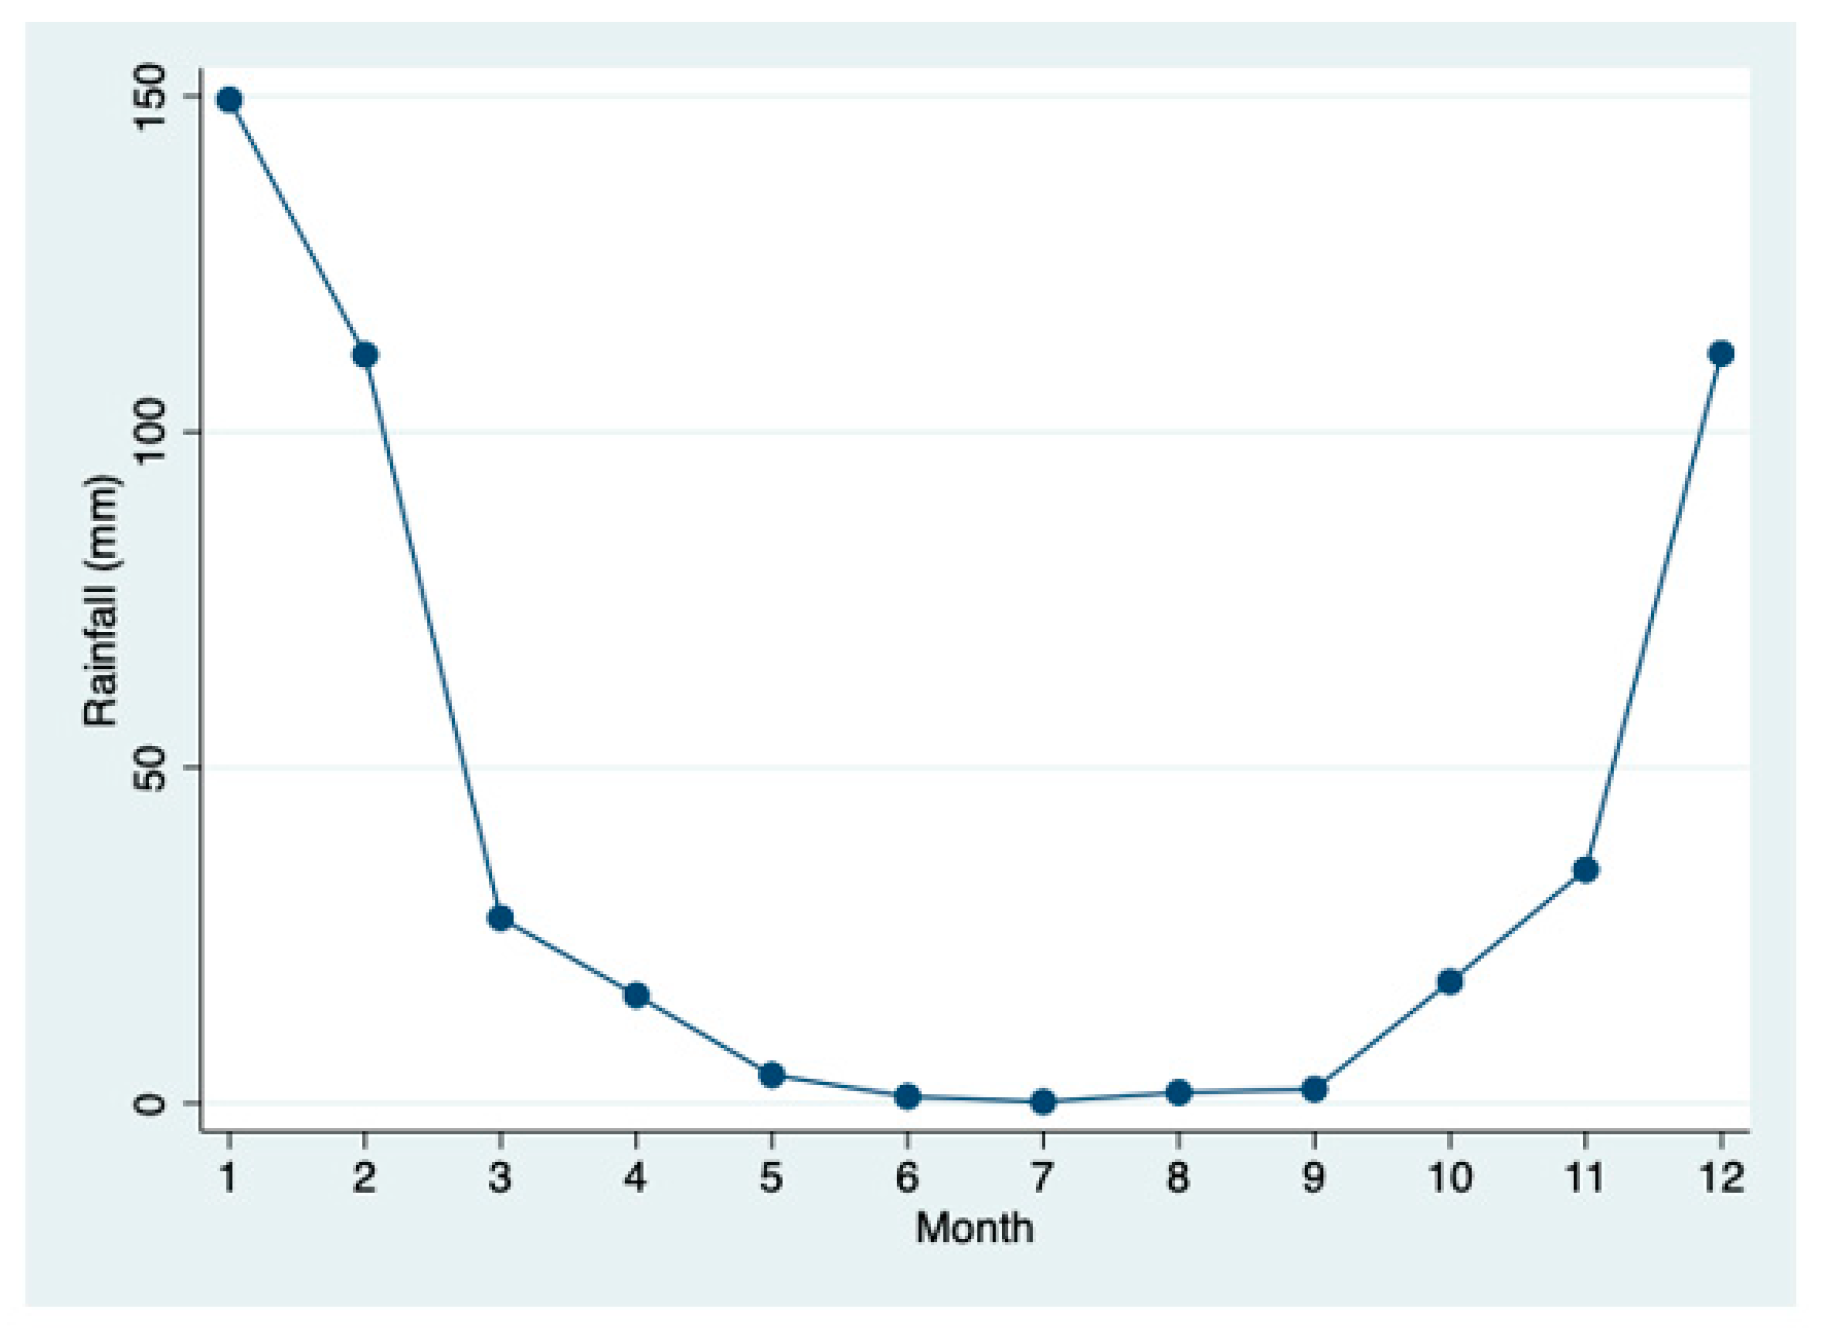
Figure 14.
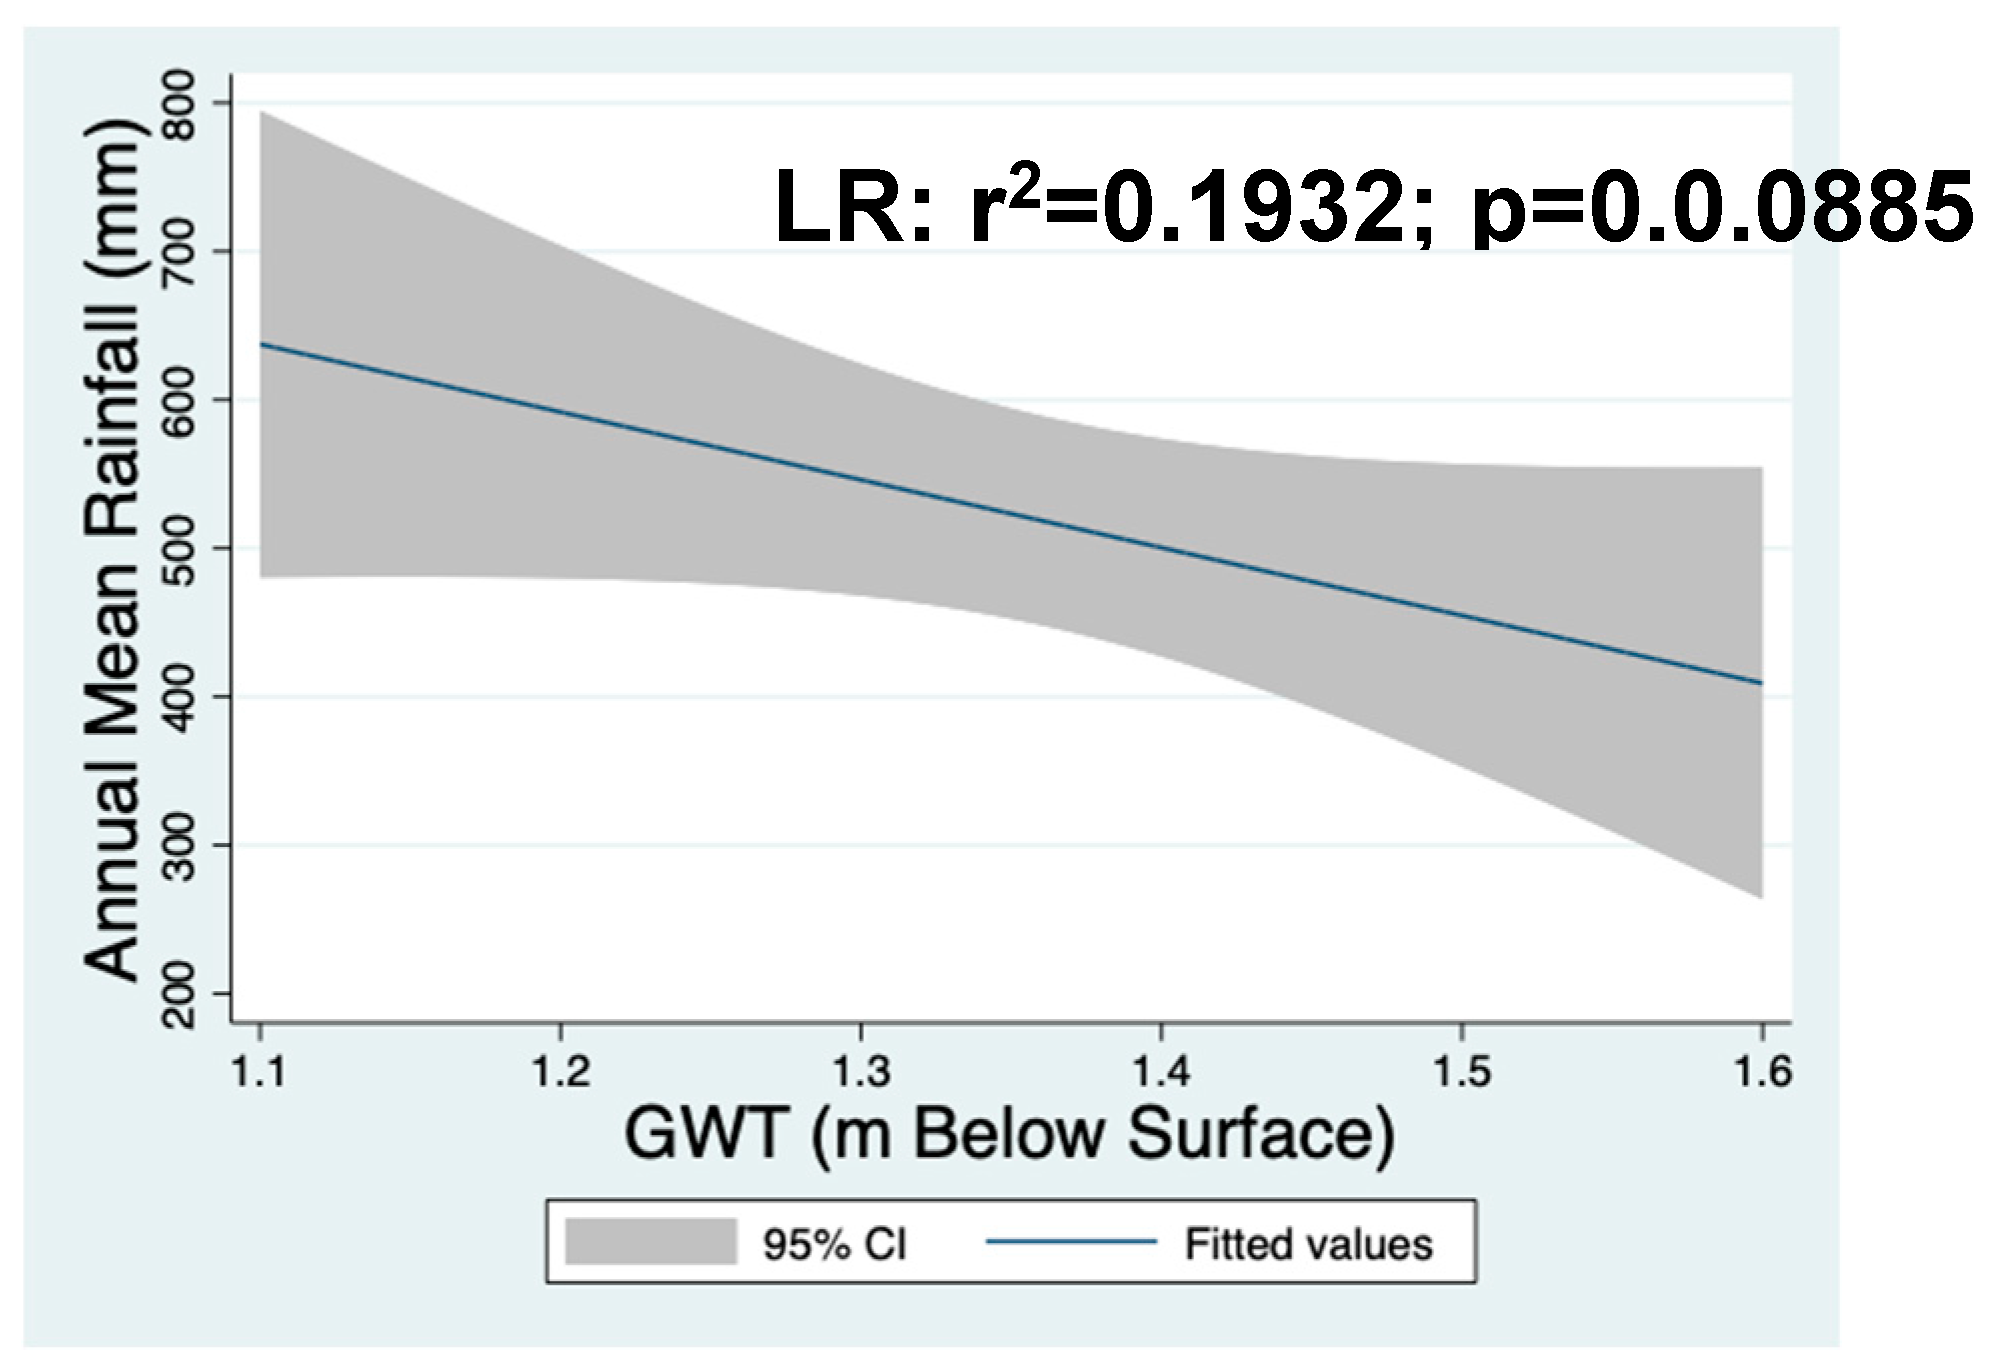
Figure 15.
Linear Regression (w/95% CI) annual GWT and Years (2002–2017). Considering Figure 14 Temporal decline of rainfall was associated with a lowering ntrend of GWT.
Figure 15.
Linear Regression (w/95% CI) annual GWT and Years (2002–2017). Considering Figure 14 Temporal decline of rainfall was associated with a lowering ntrend of GWT.
Disclaimer/Publisher’s Note: The statements, opinions and data contained in all publications are solely those of the individual author(s) and contributor(s) and not of MDPI and/or the editor(s). MDPI and/or the editor(s) disclaim responsibility for any injury to people or property resulting from any ideas, methods, instructions or products referred to in the content. |
© 2024 by the authors. Licensee MDPI, Basel, Switzerland. This article is an open access article distributed under the terms and conditions of the Creative Commons Attribution (CC BY) license (http://creativecommons.org/licenses/by/4.0/).
Copyright: This open access article is published under a Creative Commons CC BY 4.0 license, which permit the free download, distribution, and reuse, provided that the author and preprint are cited in any reuse.


