Preprint
Article

This version is not peer-reviewed.

Agronomic Traits, Nutrients Accumulation, and Their Correlations in Wheat as Affected by Nitrogen Supply in Rainfed Coastal Saline Soils

A peer-reviewed article of this preprint also exists.

Submitted:

25 February 2025

Posted:

26 February 2025

You are already at the latest version

Abstract

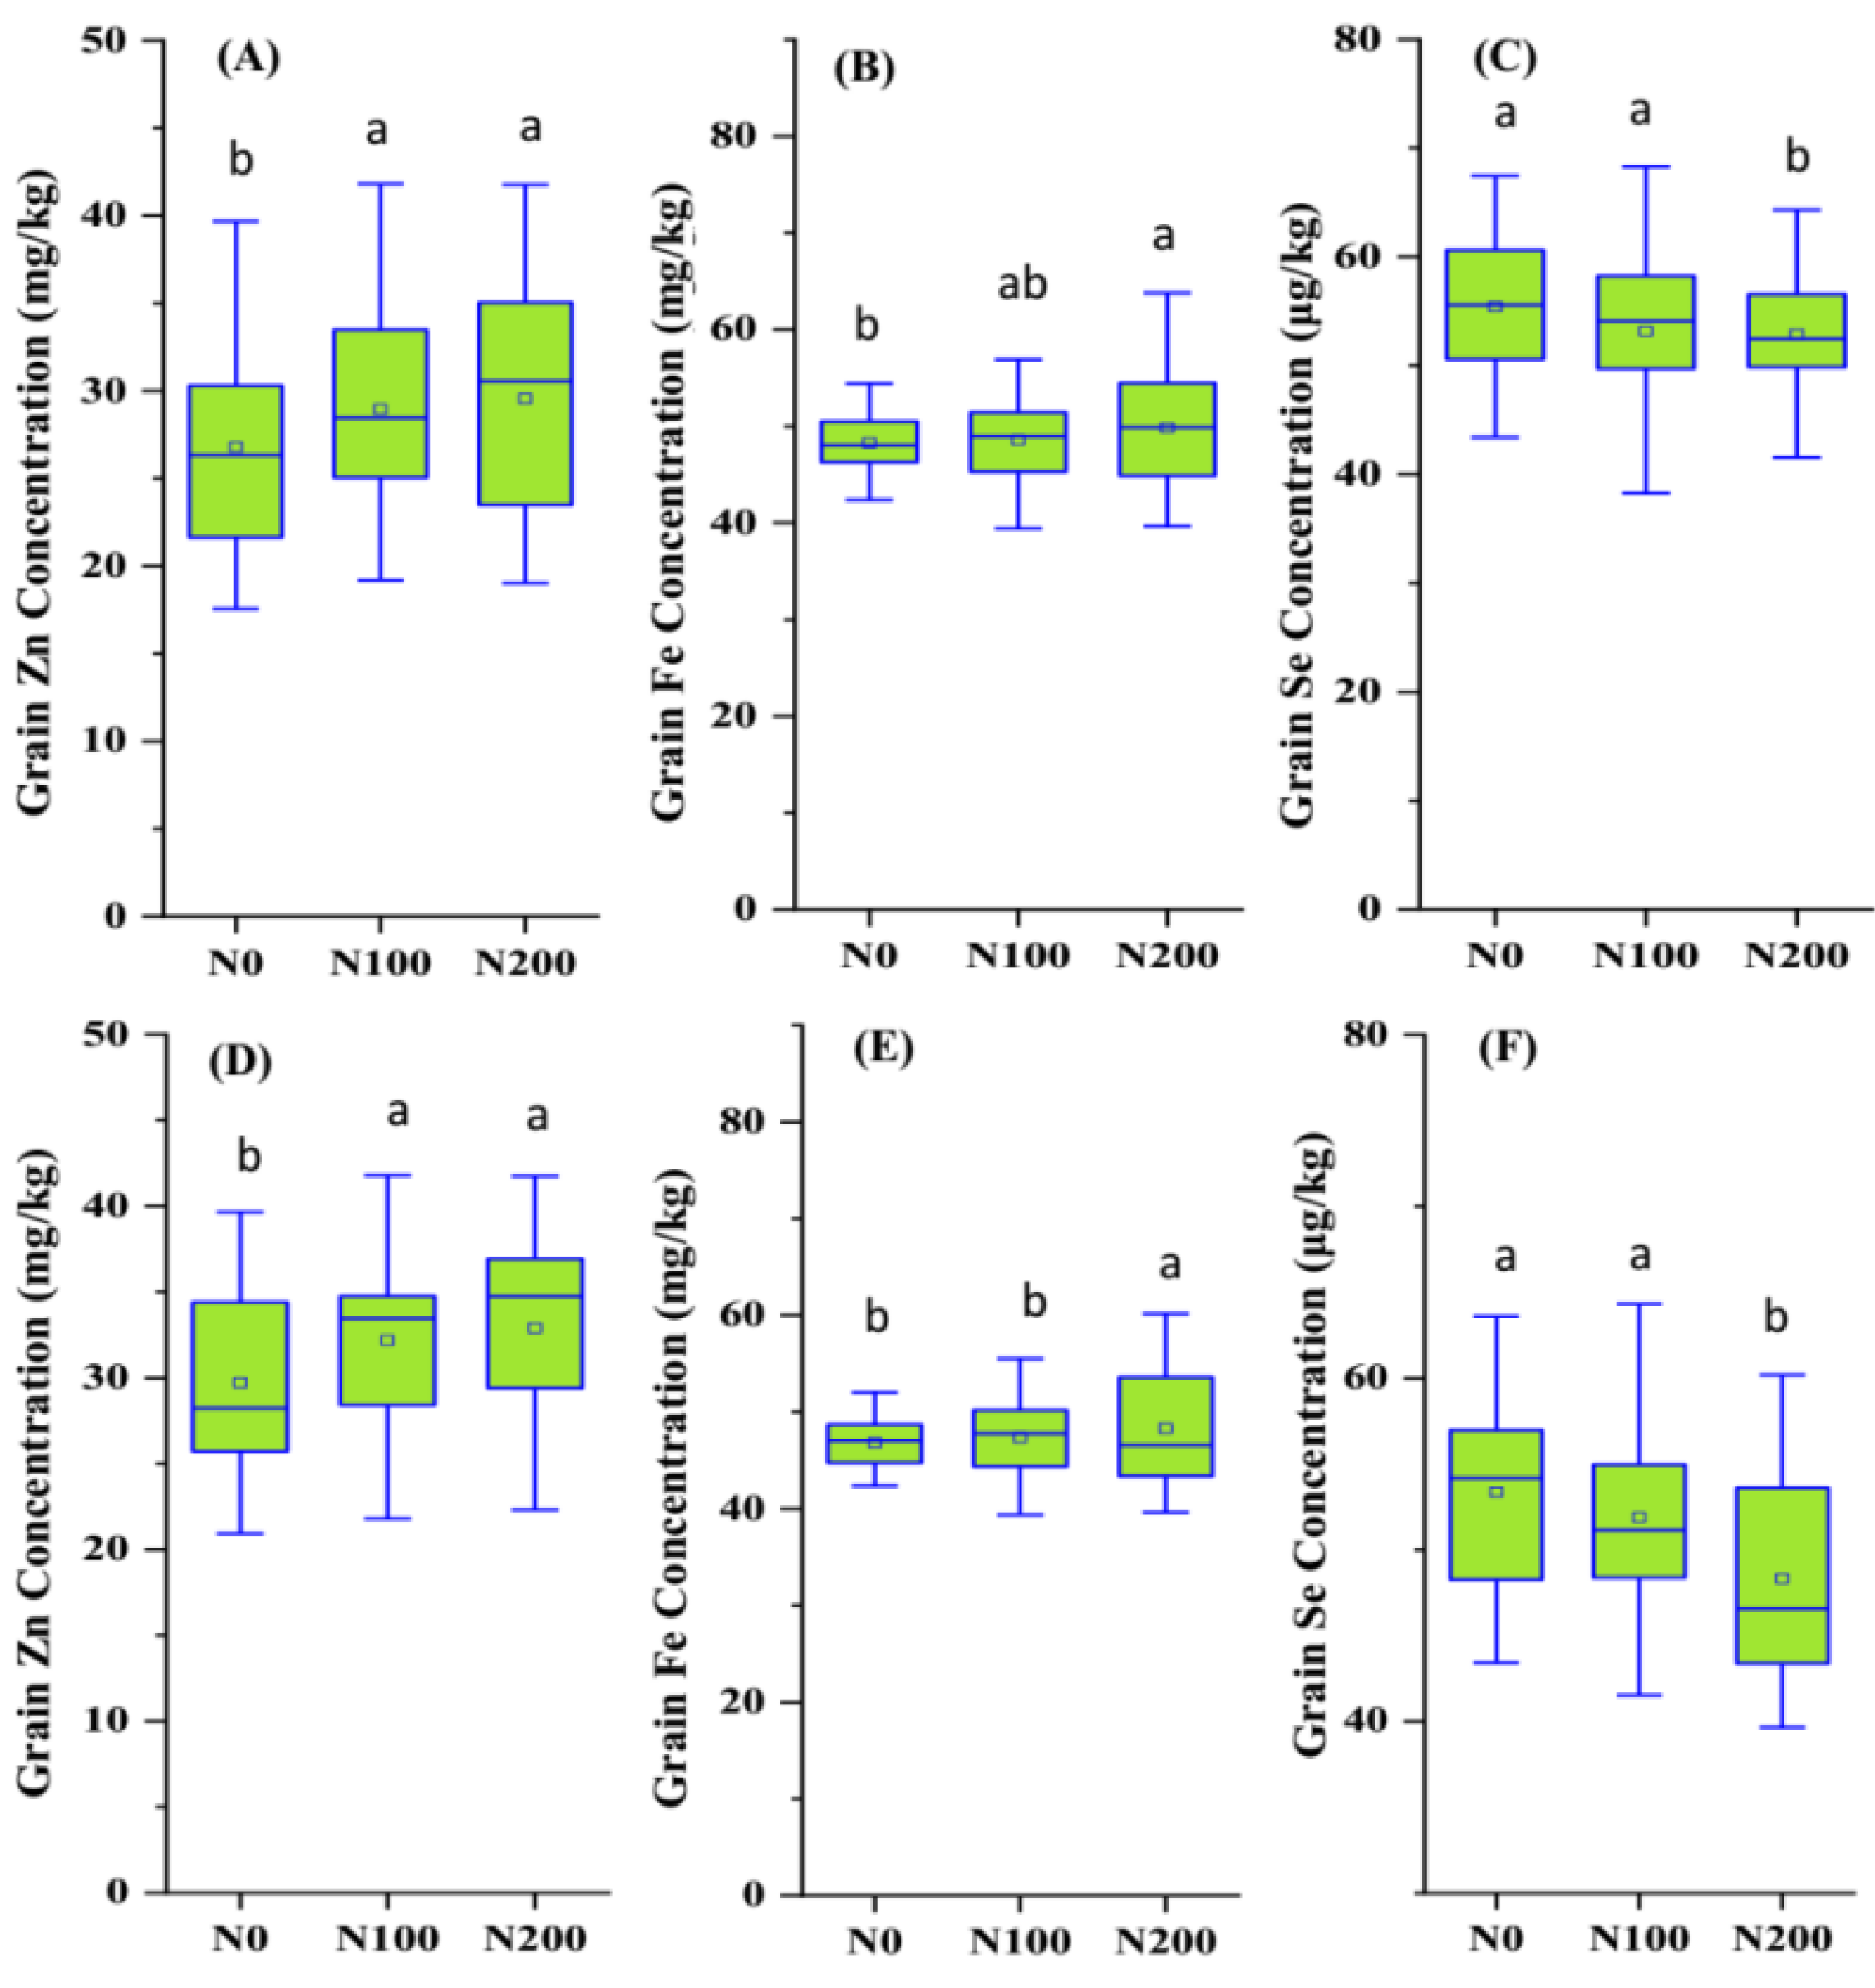
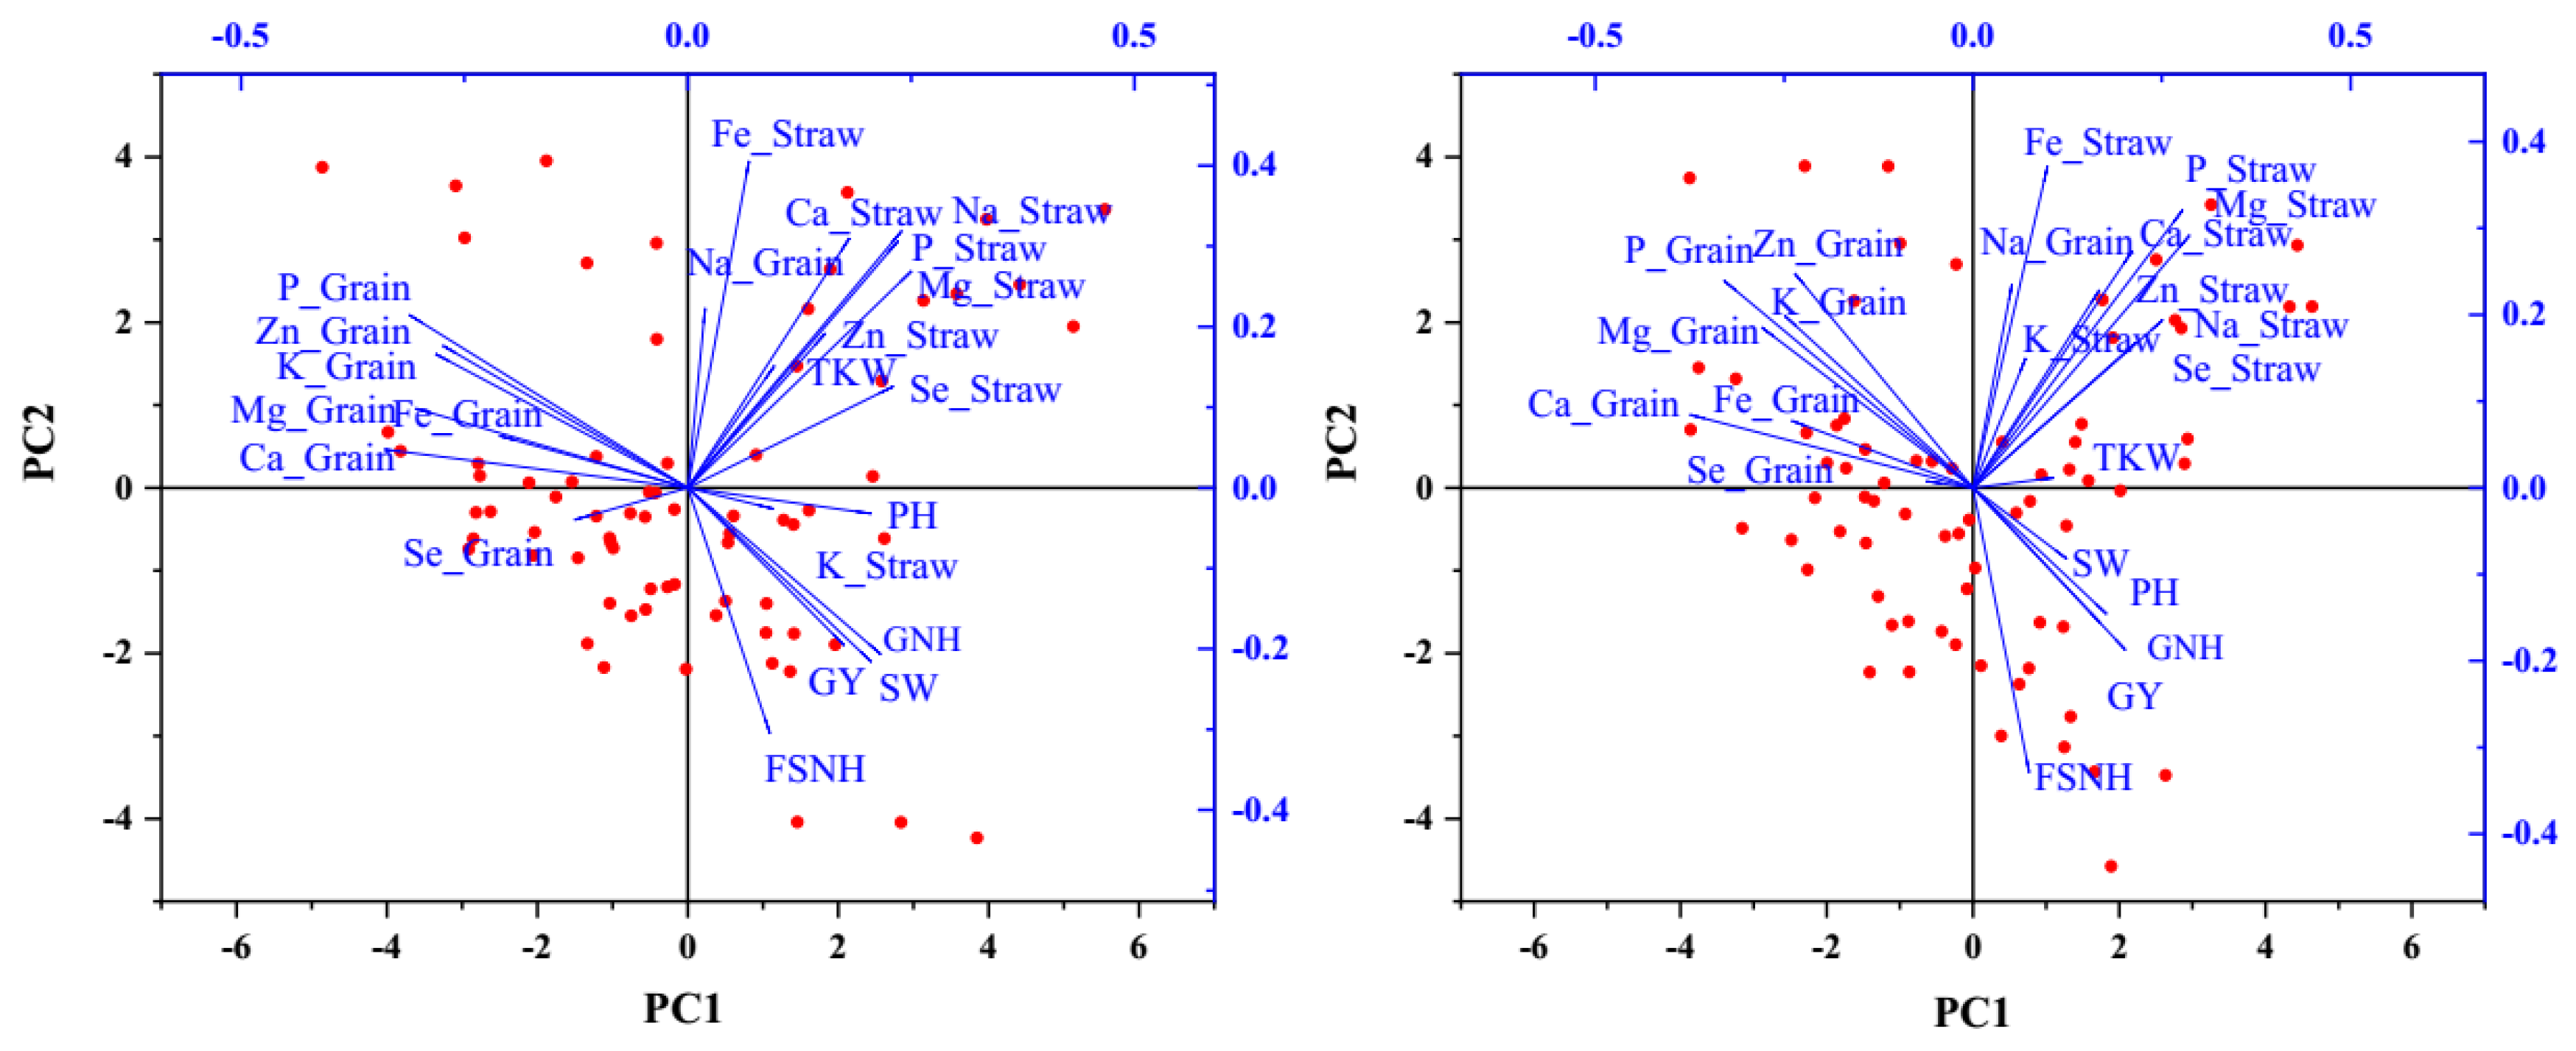
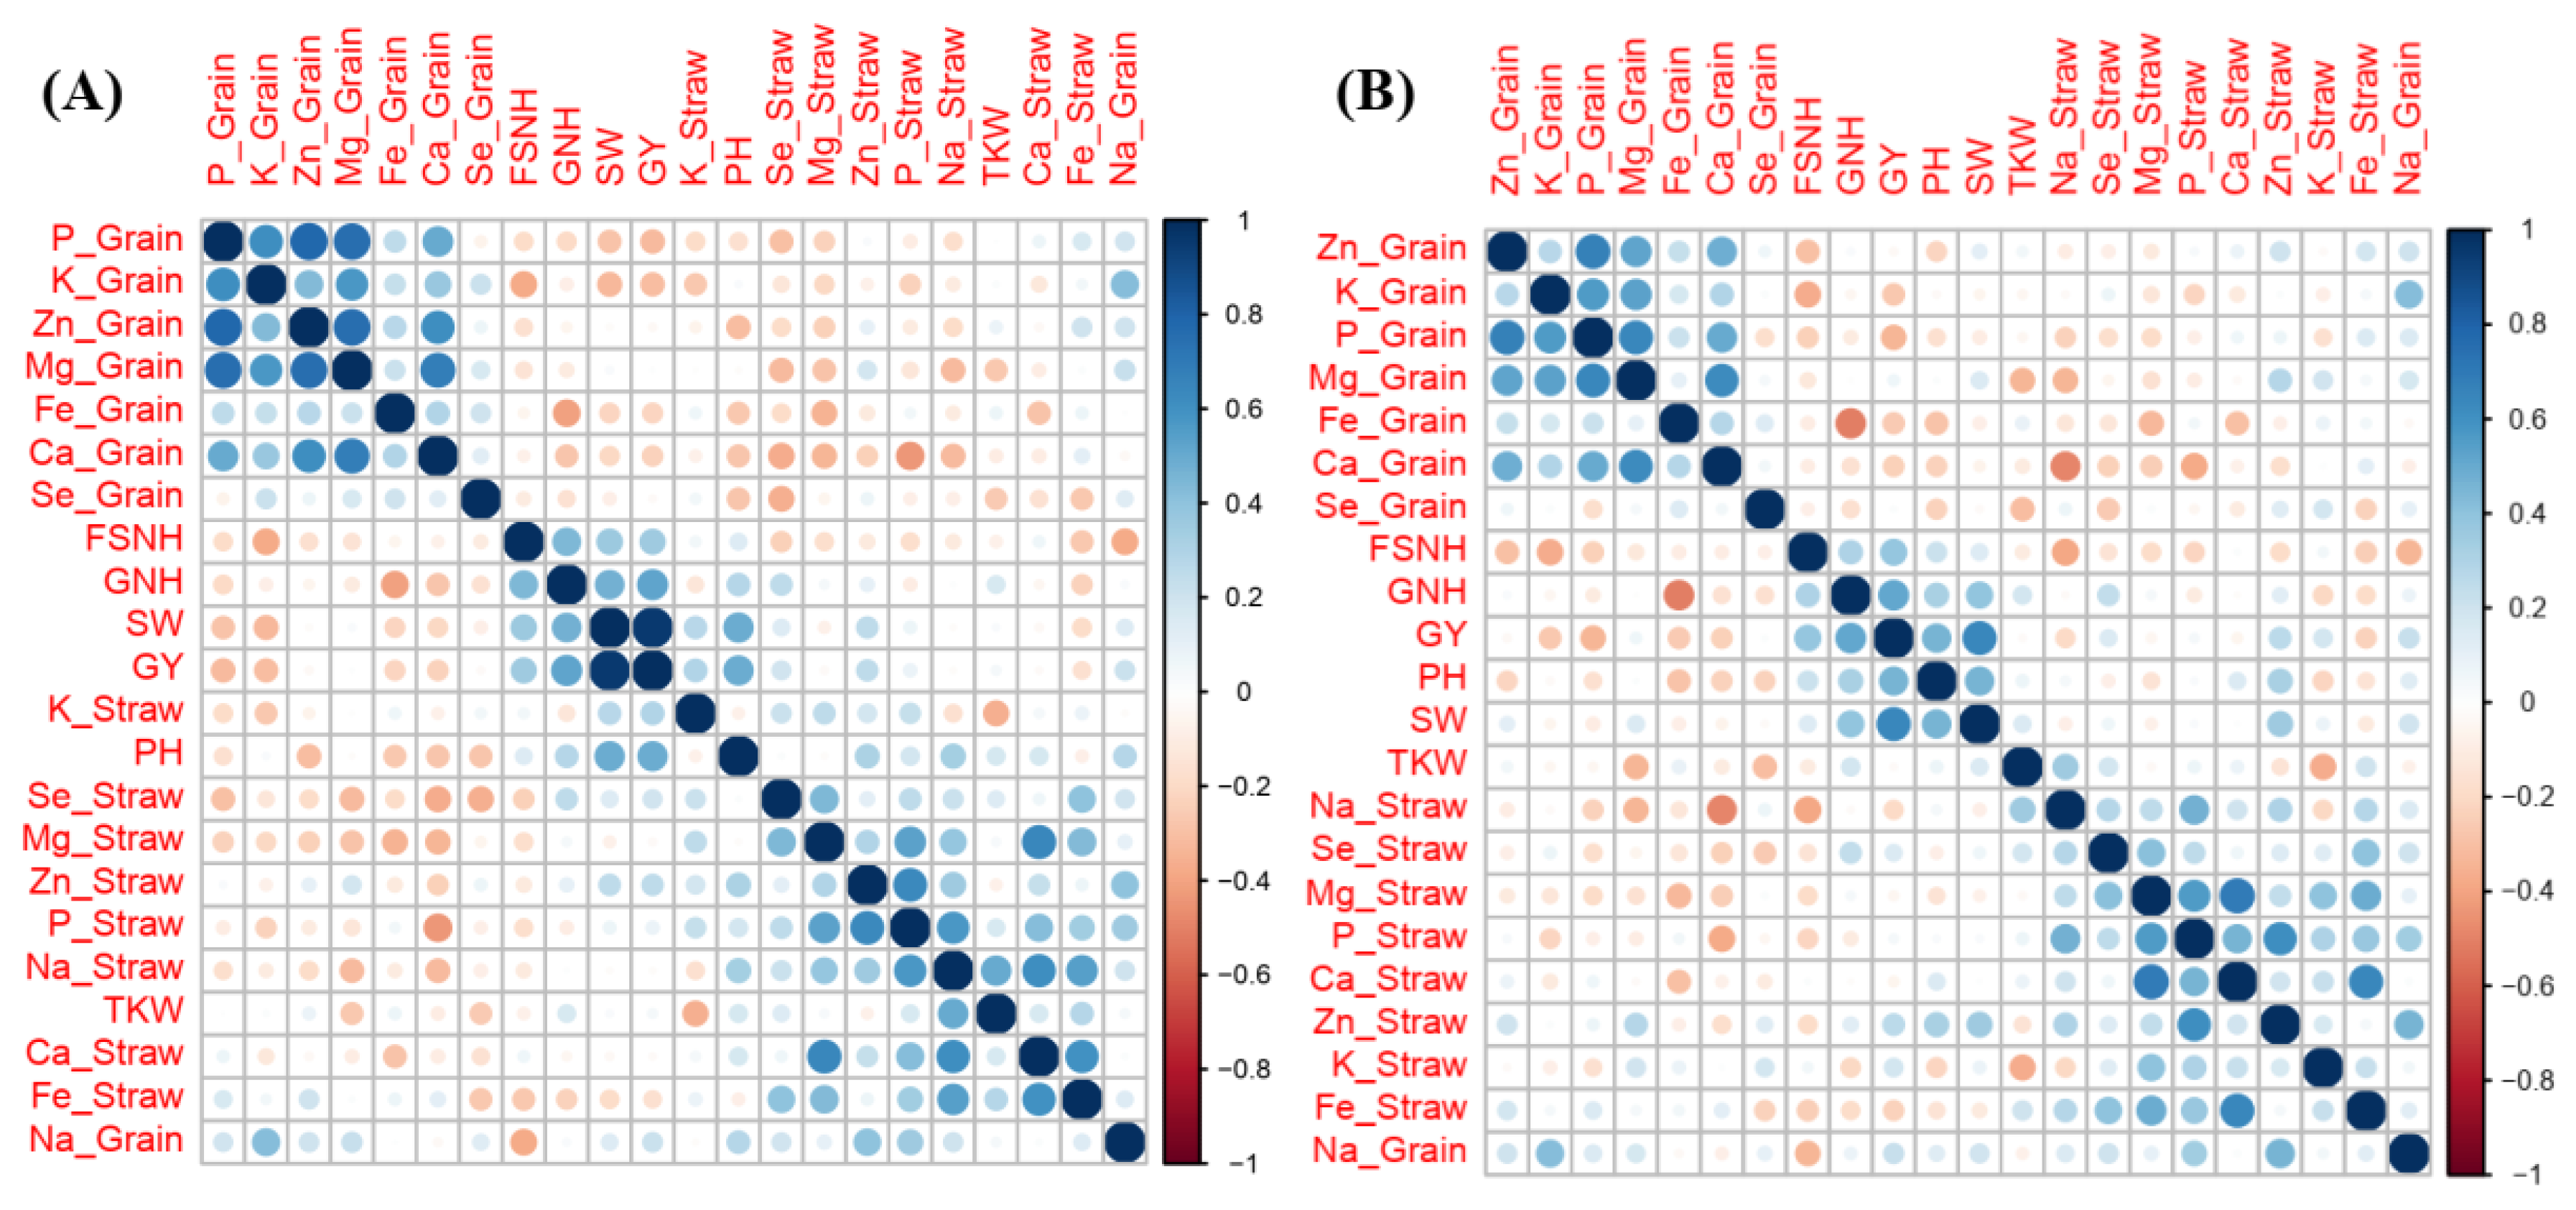
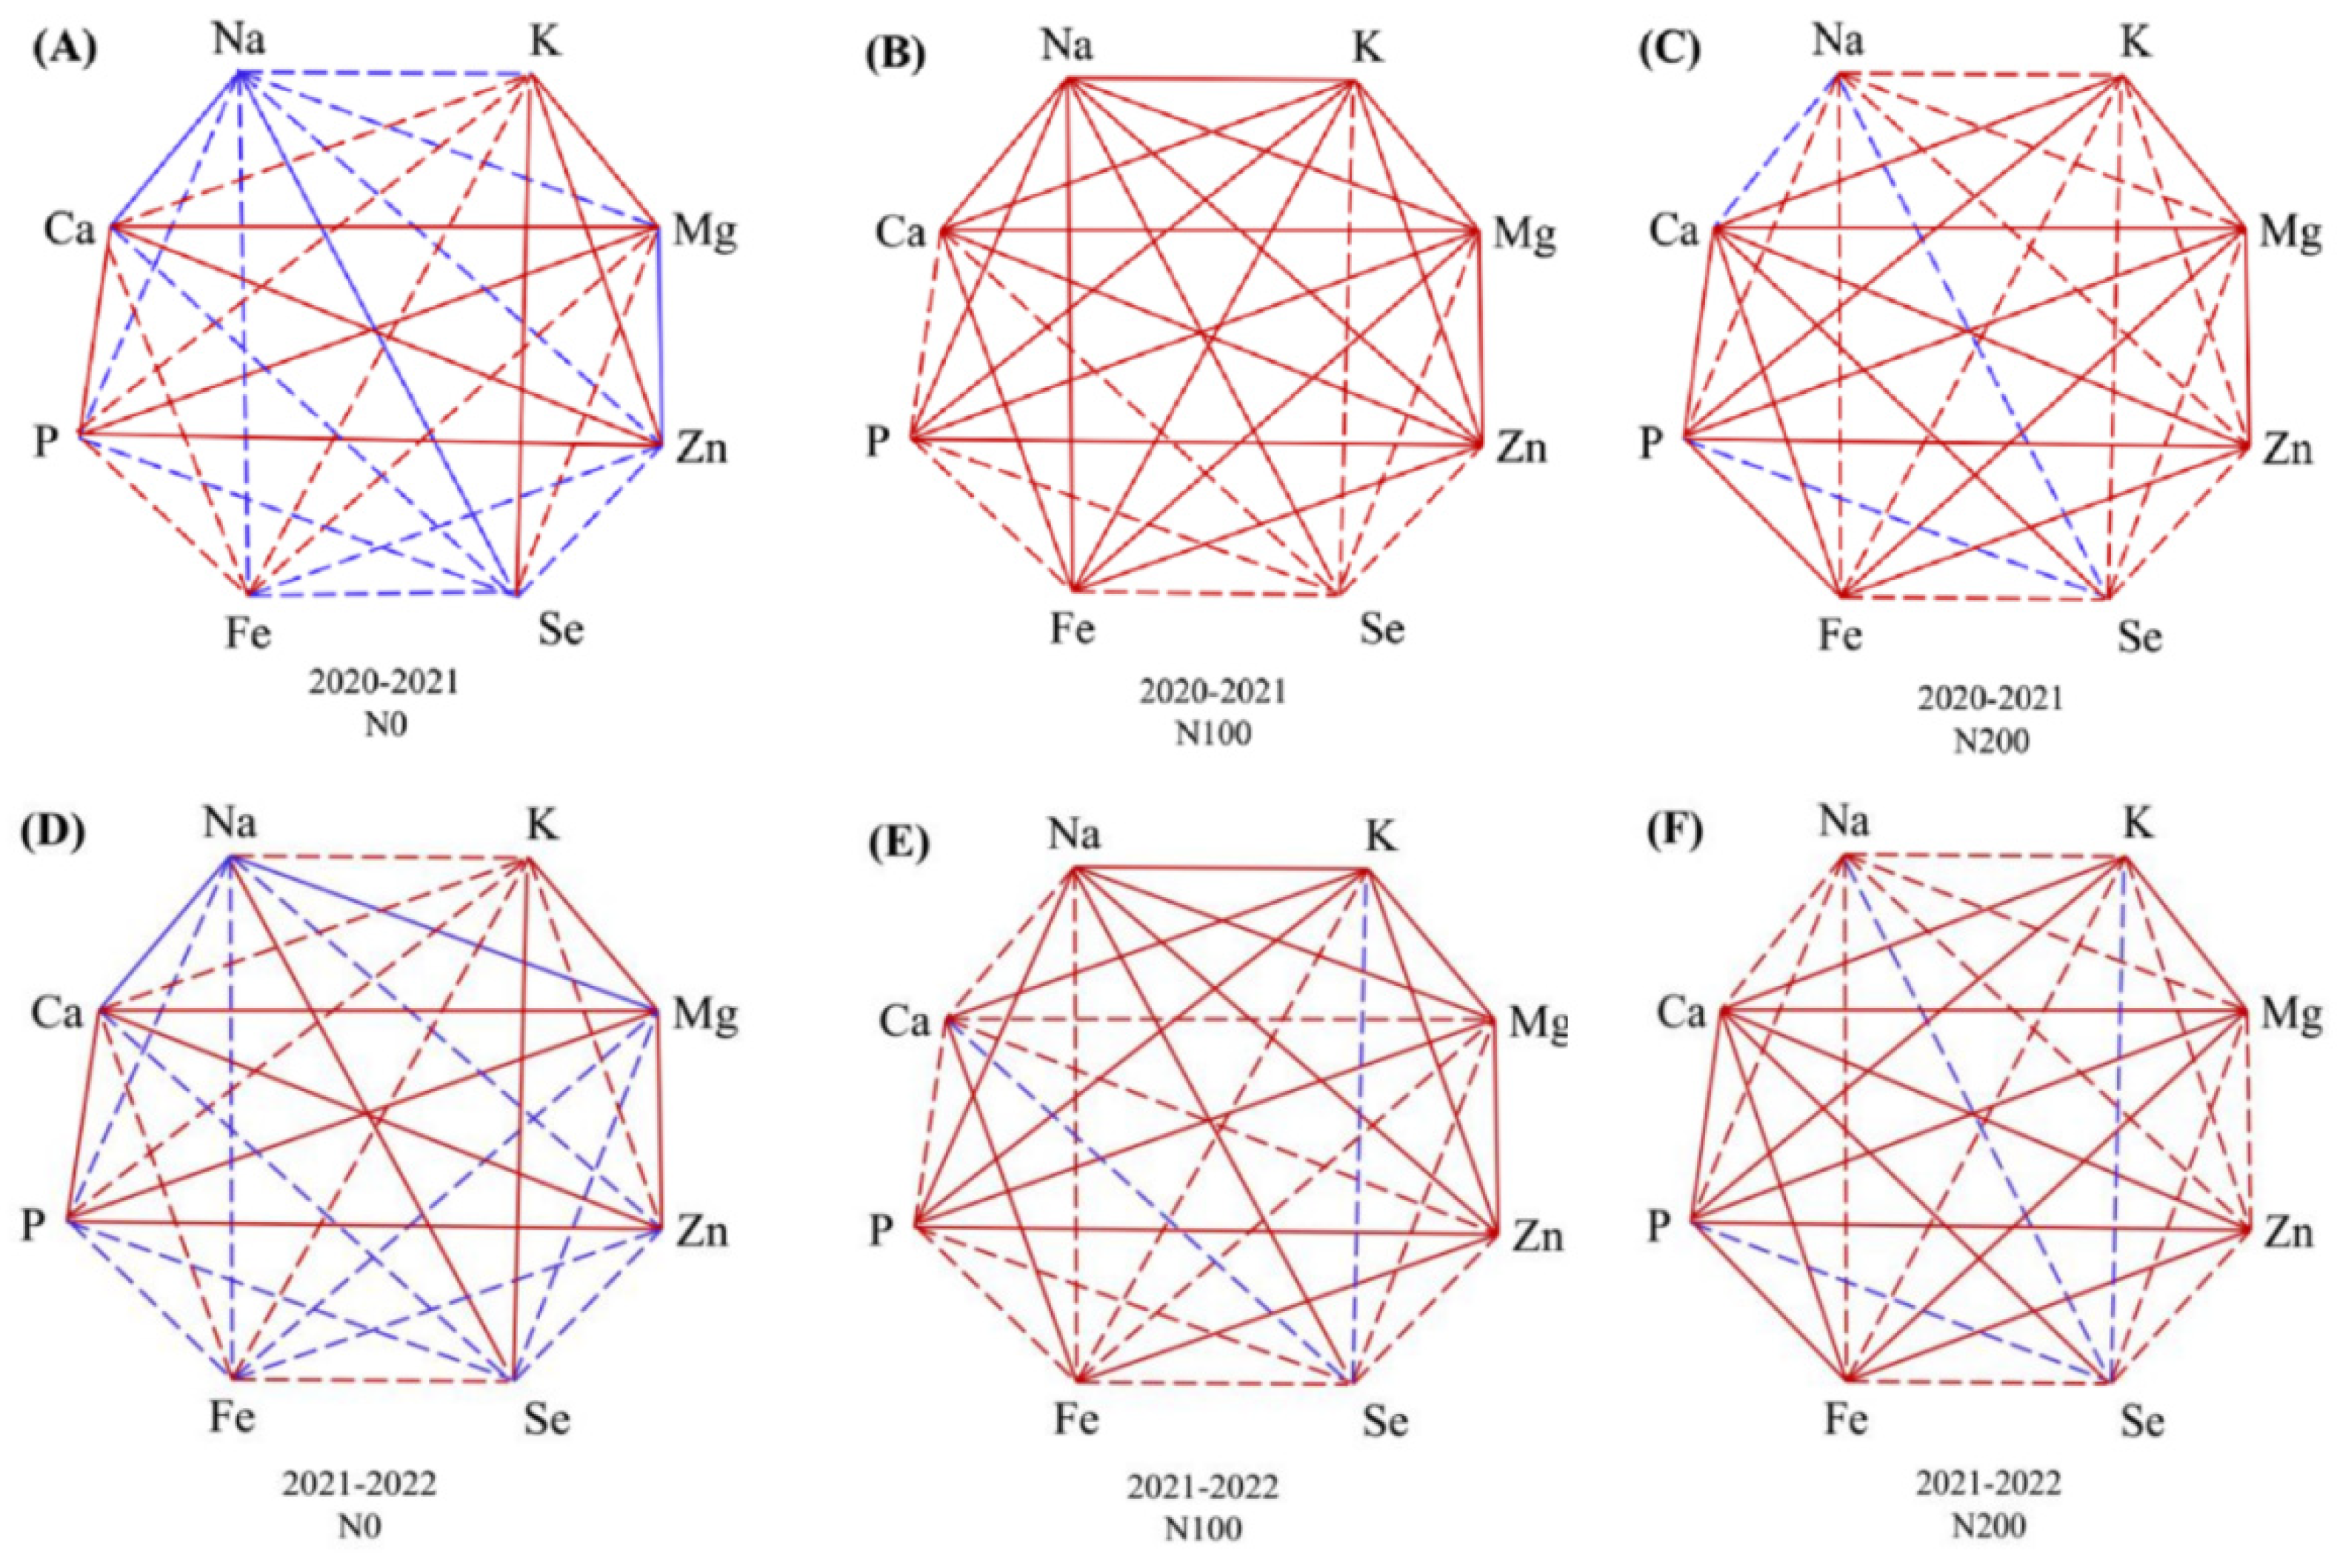
How nitrogen (N) levels affect agronomic performance and nutrient utlization process in wheat grown in rainfed coastal saline soils remains largely unknown. This study investigated the influence of three N supply treatments (0, 100, and 200 kg/ha) on the growth and accumulation of P, Ca, Mg, K, Na, Zn, Fe, and Se of eight wheat genotypes across two consecutive seasons (2020-2021, 2021-2022) in a rainfed coastal field. Both agronomic performance and nutrient accumulation were significantly affected by N supply and genotypic effect. The increased total accumulation of nutrients were mainly due to enhanced agronomic performance by N supply. Grain Zn and Fe concentrations increased while grain Se concentration decreased with N supply increasing. Genotype “Jimai 775” exhibited both a higher grain yield and a higher nitrogen agronomic efficiency among tested genotypes. The association among agronomic traits and nutrients accumulation was obviously modified by N supply as revealed by principal component analysis, correlation analysis, and stepwise multiple regression models. These findings suggest both N supply level and genotypic difference should be taken into consideration to enhance nutrient utilization in wheat cultivated in coastal saline soils.

Keywords: 
;  ;  ;  ;  ;  

1. Introduction

Globally, salinity affects about 17 million km2 of land [1]. Coastal soils, particularly those in semi-arid and arid climates, often exhibit elevated salt content (measured as electrical conductivity, EC) and/or higher pH due to shallow groundwater tables, limited rainfall, and high evaporation rates. Consequently, these coastal saline soils frequently suffer from compaction, hindering the efficient transfer of nutrients from soil to crop. Successful crop production in such environments necessitates the development of salt-tolerant crop varieties and improved fertilizer management practices.
Throughout their entire growth periods, wheat plants require a range of macronutrients and micronutrients, accumulating these nutrients in their grains, which are vital food sources for humans. Essential micronutrients support various physiological and biochemical processes within organisms, although they account for only a small portion of the dry matter. Inadequate Zn supply intake can lead to growth retardation, cell-mediated immune dysfunction, and cognitive impairment [2], while Fe deficiency results in anemia. The National Institute of Health (USA) recommends 8–11 mg daily Zn for adults, while the average daily dietary Fe intake typically ranges from 10–15 mg [3]. The inadequate intake of Se in human is also prevalent; the recommended dietary intake of Selenium (Se) is 50–55 µg day [4]. Crop grains with higher available beneficial micronutrients such as Zn, Fe, and Se are required to sustain a sufficient intake by human body. However, the Zn and Fe concentrations in wheat grain worldwide often fall short of biofortification targets set at 40 mg/kg for Zn and 60 mg/kg for Fe [5,6,7]. The Se concentration in wheat grain varied largely across investigated sites, with an average of 0.03–0.16 mg/kg [8]. Significant progress has been made in breeding Zn- and Fe-enriched wheat varieties, with genetically biofortified wheat lines exhibiting 75–150% higher grain Zn content than non-biofortified counterparts [9]. Additionally, agronomic approaches, such as soil or foliar application of fertilizers at appropriate growth stages, are commonly used to enhance Zn and Se accumulation [10,11].
The N supply level is a critical factor influencing wheat grain yield and protein concentration. Proper soil N levels can facilitate the uptake of other essential elements, including phosphorus (P), calcium (Ca), and boron (B) [12]. Moreover, a positive correlation exists between grain protein concentration and Zn and Fe concentrations, as grain protein is a sink for these micronutrients. Thus, N supply can increase grain protein, Zn, and Fe accumulation [13,14]. However, the extent to which N supply enhances whole grain Zn concentration depends on the initial soil Zn content, with high N supply increasing grain Zn concentration only when soil Zn levels are high [15,16]. Nitrogen fertilizer rate of 120-240 kg/ha had increased concentrations of water-soluble Se, and exchangeable Se in soil, but a higher N rate exceeding 240 kg/ha could hinder formation of soil available Se [17]. On the other hand, application of Se could also improve N metabolism in wheat [18].
Interactions between elements can exhibit antagonistic or synergistic effects, influencing plant ion uptake and translocation. For instance, Zn positively correlated with N, potassium (K), magnesium (Mg), and manganese (Mn) in wheat seedlings [19]. Conversely, high P supply and soil Fe levels can limit Zn accumulation in wheat grain [20,21]. Plant Fe deficiency may occur with liming (application of Ca- and Mg-rich materials), as Fe and Mg exhibit mutual antagonism [22]. Furthermore, inadequate K supply or excessive Zn levels can also lead to Fe deficiency [12]. Soil properties and agronomic practices including N supply, together with antagonistic and/or synergistic effects among elements affect the final concentration of a specific element within wheat plants at maturity. Understanding how crop growth would be affected by soil properties, and agronomic measures is of importance to explore coastal soils for agricultural purpose. To date, limited information is available on the effects of N supply on K, Ca, Mg, P, Zn, Fe, and Se accumulation in wheat grown under coastal soil conditions. This study was therefore conducted to (1) explore the impact of N supply on agronomic performance and nutrient accumulation; (2) elucidate the associations between agronomic performance and nutrient accumulation as mediated by N supply under rainfed coastal soil conditions.

2. Results

2.1. Agronomic Performance

Agronomic traits, including plant height, fertile spikelet number per head, grain number per head, 1000-kernel weight, grain yield, and straw weight, were significantly affected by genotype, and N supply. Investigated agronomic traits excluding straw weight varied significantly between growth seasons. Generally, the N200 treatment resulted in the highest values for plant height, fertile spikelet number, grain number per ear, grain yield, and straw weight in both seasons (Table 1). Agronomic performance also varied between seasons, with mean grain number increasing from 42.5 in 2020–2021 to 44.2 in 2021–2022, fertile spikelet number per head increasing from 15.6 in 2020–2021 to 16.2 in 2021–2022, 1000-kernel weight increasing from 40.67 g in 2020–2021 to 41.50 g in 2021–2022, and grain yield increased by 4.49% in 2021–2022 compared to 2020–2021.
Significant differences occurred among the eight genotypes for plant height, fertile spikelet number per head, grain number per head, 1000-kernel weight, grain yield, and straw weight (Table 2). Across all three N supply treatments, Jimai 60 recorded the tallest plants (average 63.9 cm), while Hongdi 95 had the shortest (average 50.6 cm). Fertile spikelet number per head ranged from 15.2 (LS018R) to 16.9 (Jimai775), grain number per head ranged from 40.2 (LJJ803) to 45.3 (Jimai60), and 1000-kernel weight ranged from 37.2 (Jimai775) to 44.1 (Jimai60). Genotypes Jimai60 and Jimai775 consistently achieved significantly higher average grain yields than the other six genotypes across all three N treatments. In the N0 treatment, Jimai60 and Jimai775 yielded 4899.8–5099.1 kg/ha and 4133.7–4334.0 kg/ha, respectively.

2.2. Nutrient Accumulation

ANOVA results revealed significant effects of season, genotype, and N supply on Na, Mg, P, K, Ca, Zn, Fe, and Se concentrations in both grain and straw. Grain had significantly lower Na, K, Ca, and Fe concentrations and higher P and Zn concentrations than straw. On average, grain had 305.0% higher Zn concentration and 74.5% lower Fe concentration than straw. Grain Zn concentrations showed an increased trend with N supply increasing (Figure 1 A & D), the average value under N0, N100, and N200 treatments were 26.8 mg/kg, 28.9 mg/kg, and 29.5 mg/kg, respectively. Similarly, N supply significantly increased grain Fe concentration, with highest average achieved under N200 treatment (Figure 1 B & D). Inversely, grain Se concentration showed a decreased trend with N supply increasing (Figure 1 C & F), average value under N0, N100, and N200 treatments were 55.4 μg/kg, 54.7 μg/kg, and 53.1 μg/kg, respectively.
Moreover, significant genotypic differences were observed in grain elemental concentrations (Table 3). For instance, grain Zn concentration ranged from 23.7 mg/kg (LS3666) to 33.1 mg/kg (Jimai 106), grain Fe concentration ranged from 46.8 mg/kg (Jimai 775) to 61.9 mg/kg (LJJ803), and grain Se concentration ranged from 48.8 μg/kg (Jimai106) to 58.6 μg/kg (Shannong25) among the eight genotypes grown under three N supply levels. Total elemental accumulation of P, K, Ca, Mg, Zn, Fe, and Se in grain and straw increased in the N100 and N200 treatments relative to N0 (data not shown), mainly due to increased grain yield and straw weight.
Aboveground biomass accumulation partly relies on nutrient uptake from the soil. Enhanced agronomic traits observed in the N100 and N200 treatments resulted in higher grain yield and straw weight than the N0 treatment, accompanied by increased grain and straw P, K, Ca, and Mg accumulation. Moreover, significant genotypic differences were observed in response to N supply levels, with Jimai 775 and Jimai 60 producing higher grain yield under low N supply.

3.3. Nitrogen Agronomic Efficiency

NAE, an index evaluating the response of grain yield to N supply amount, was used to examine the difference among genotypes, N treatments, and seasons (Table 4). NAE was affected significantly by N treatment, genotype, and season. In 2020-2021 season, NAE varied from 0.5 (LS3666) to 18.7 (Jimai775) at N100 treatment, and from 3.3 (LS018R) to 15.4 (Jimai775) at N200 treatment. In 2021-2022 season, NAE varied from 3.8 (LS018R) to 16.0 (Jimai775) at N100 treatment, and from 2.2 (LS3666) to 20.4 (Jimai775) at N200 treatment. ‘Jimai 775’ and ‘Shannong 25’ achieved highest NAE among eight tested wheat genotypes in both N100 and N200 treatments across both two seasons.

3.4. Associations Between Agronomic Performance and Nutrient Accumulation

The PCA explored associations between agronomic traits and nutrient accumulation. For the eight genotypes, the PCA explained 38.42% of the variance in the first two components in the 2020–2021 season and 34.10% in the 2021–2022 season (Figure 2). The first component (PC1) accounted for 22.40% of the variability in the 2020–2021 season and 18.16% in the 2021–2022 season, primarily representing agronomic traits. The second component (PC2) explained 16.02% of the variability in the 2020–2021 season and 15.94% in the 2021–2022 season, mainly accounting for elemental grain and straw concentrations. Three distinct clusters representing agronomic traits, elemental accumulation in straw, and elemental accumulation in grain appeared separately in the PCA plots, with components within the same cluster positively correlated. To be more specifical, a correlation maps involving agronomic trait and nutrient concentration were drawn for both two growing seasons (Figure 3). Grain yield positively correlated with plant height, straw weight, fertile spikelet number per head, and grain number per head in both seasons. Grain Zn concentration positively correlated with grain Mg concentration, grain P concentration, grain K concentration, grain Ca concentration, and grain Fe concentration in both seasons. Straw Zn concentration and straw Fe concentration positively correlated with straw Na concentration, straw Mg concentration, straw P concentration, and straw Ca concentration. Grain Se concentration negatively correlated with plant height, 1000-kernel weight, straw Se concentration, and straw Fe concentration.
Further correlations among grain elemental accumulation under N0, N100, and N200 treatments were examined respectively (Figure 4). Overall, the correlation among grain elemental accumulation was significantly changed by N supply. Besides, the correlation also varied between seasons. For example, correlation between grain Zn concentration and grain Na concentration was non-significantly negative, significantly positive, non-significantly positive under N0, N100, and N200 treatment, respectively. Grain Zn concentration was consistently positive correlated with grain P concentration across all N treatments in both seasons. Grain Fe significantly positive correlated with grain P, and Zn concentration under N100 and N200 treatments.
Stepwise multiple regression models were further applied to construct equations using investigated variables. Grain Zn concentration, grain Fe concentration, and grain Se concentration can be explained by some investigated agronomic traits and some elemental concentrations in straw and grain (Table 5). Equations varied slightly among different N treatments and across seasons. Generalized multiple regression equation models were established using combined data from all treatments in both 2020-2021 and 2021-2022 seasons. The generalized multiple regression equation model revealed that grain Zn concentration can be predicted using a regression equation that includes grain P concentration, grain Ca concentration, straw weight, plant height, straw Zn concentration, 1000-kernel weight, and grain Mg concentration. Similarly, grain Fe concentration can be predicted using a regression equation that includes straw P concentration, grain K concentration, fertile spikelet number per head, grain number per head, straw Mg concentration, and plant height. Grain Se concentration can be predicted using a regression equation that includes straw Se concentration, plant height, grain Na concentration, grain P concentration, grain Mg concentration, grain K concentration, grain Ca concentration, and straw Na concentration.
Abbreviations: PH, plant height; GY, grain yield; SW, straw weight; GNH, grain number per head; FSNH, fertile spikelet number per head; TKW, 1000-kernel weight; P_grain, grain P concentration; Mg_grain, grain Mg concentration; K_grain, grain K concentration; Na_grain, grain Na concentration; Ca_grain, grain Ca concentration; Zn_grain, grain Zn concentration; Fe_grain, grain Fe concentration; P_straw, straw P concentration; Mg_straw, straw Mg concentration; K_straw, straw K concentration; Na_straw, straw Na concentration; Ca_straw, straw Ca concentration; Zn_ straw, straw Zn concentration; Fe_straw, straw Fe concentration; Se_straw, straw Se concentration.

3. Discussion

3.1. Seasonal Variation of Agronomic Performance and Nutrient Utilization Under Coastal Soil Conditions

Crop growth in rainfed coastal field could be hampered by both soil properties and saline ground water as roots penetrate into deeper soil layer. On the other hand, weather conditions, particularly rainfall distribution in arid and semi-arid rainfed fields, play a crucial role in soil moisture availability, influencing crop reactions in root system development due to nutrient availability [23]. In dry seasons, limited rainfall results in frequent topsoil drying, restricting nutrient uptake. Moreover, the movement of topdressed N into deeper soil layers is hindered, further limiting N uptake by deeper roots. Conversely, wet seasons promote greater root system development [24], facilitating N uptake from topsoil and deep soil. Consequently, N supply effectiveness can vary based on seasonal conditions, with wet years typically yielding better results due to enhanced root systems. On the other hand, the seed of wheat under rainfed saline soil might not be fully filled with carbohydrates in extremely dry seasons, resulting in reduced grain yield, due to soil gets too dry and the soil salinity increases to unacceptable levels [25]. The superior performance for all genotypes in the 2021–2022 season compared to the 2020–2021 season in our study, therefore, could be attributed to higher rainfall during the entire growth period.
Response of wheat plant growth performance to soil nutrient availability is a dynamic process which may vary between seasons, because of the different weather conditions. Variations in weather conditions and soil nutrient availability during the entire growth period can impact plant development, altering the association among agronomic traits. In current study, grain yield correlated positively with straw weight, plant height, fertile spikelet per head, and grain number per head, indicating that satisfactory grain yield depended on high aboveground biomass and spikelet fertility under coastal rainfed soil conditions. Indeed, the higher grain yield in 2021–2022 was associated with higher straw weight, plant height, fertile spikelet per head, and grain number per head relative to that in 2020–2021. On the other hand, agronomic response to salt stress varies largely among different genotypes. Identifying suitable genotypes with high grain yield potential in coastal soils is therefore an essential prerequisite for large-scale cultivation. Genotype “Jimai 775” which exhibited both a higher grain yield and a higher NAE than the others under current field trial is of promise to achieve satisfactory production benefits in coastal soil conditions. Due to the significant differences in the properties of saline soils in different coastal locations, it is necessary to explore the relationship between soil nutrient supply, soil properties, and nutrient utilization in order to develop a matched cultivation model for efficient nutrient utilization in wheat. A large scale screening of diverse wheat genotypes for better agronomic performance and nutrient utilization efficiency by trials with multi-sites and multi-seasons under coastal saline soils is hence required in the next step, with the aim to identify suitable genotypes for sustainable production tailored to specific saline soil condition.

3.2. Correlations Between Agronomic Traits and Nutrient Uptake Was Modified by N Supply

Differences in intrinsic genetic factors lead to variations in agronomic traits and nutrient accumulation among different genotypes. However, environmental factors and agronomic management practices such as fertilizer application can adaptively modify morphological development and nutrient uptake. Nutrient composition in plant can be altered by external environmental factors such as salinity, a higher soil Na content led to a higher Na/K ratio together with a differential elemental composition in wheat plant [26]. Similarly, correlations among grain Na, K, Ca, Mg, Zn, Fe, Se concentration varied between N supply treatments in current study.
Genotype × environment interactions account for substantial variations in zinc utilization [27]. Consistently, wheat grain Zn concentration was significantly different among genotypes in current study. On the other hand, soil is the main Zn source for wheat grown without fertilizer containing Zn fertilizer, and soil properties, such as low soil moisture and organic matter and high pH and CaCO3, can hinder Zn translocation to grain [21]. Soil properties such as salt content and pH vary from site to site due to difference in irrigation conditions, groundwater depth, and agronomic management measures among different sites. Differential N supply results in contrasting soil environments among treatments, leading to variations in nutrient uptake and translocation in wheat plants. Grain Zn concentrations increased with higher N supply (N100 and N200 treatments) in current study, consistent with the findings of Kutman et al. (2011) [16].
Genotypes with higher Fe or Zn concentrations could be planted extensively in coastal soil conditions for biofortification. The average grain Fe concentration of genotype LJJ803 (61.9 mg/kg) reached the Fe biofortification target. However, all eight genotypes had grain Zn concentrations below the biofortification target, with Jimai 106 showing the highest average value (33.1 mg/kg). Plant Zn uptake largely depends on soil properties such as available Zn content [28]. The experimental site in this study had a soil DTPA-Zn concentration of 0.9 mg/kg. Therefore, soil and/or foliar Zn applications are essential to achieve higher grain Zn concentrations in wheat grown in soils with low Zn availability.
Calcium is crucial for establishing plant cell walls, and the external application of Ca supplements on crops can alleviate abiotic stresses [29]. Magnesium is essential for normal plant growth as it is involved in chlorophyll biosynthesis. Increased P nutrition enhances plant Mg and Ca uptake [30,31], suggesting coordination among P, Mg, and Ca. In the current study, straw Mg, Ca, and P concentrations were consistently and positively correlated.
Although increased P input may decrease Zn uptake in wheat [32], wheat grain P and Zn concentrations tend to be positively correlated across diverse genotypes [33]. Moreover, elemental interactions play an important role in mediating nutrient absorption of wheat, with Zn concentrations positively correlated with N, K, Mg, and Mn concentrations in wheat seedlings [19]. Grain Zn had a positive correlation with Ca, Cu, K, Mg [34]. Similarly, the uptake of Mg, P, K, and Ca positively influenced grain Zn accumulation, as grain Zn concentration positively correlated with grain Mg, P, K, and Ca concentrations in current study. Soil available phosphorus was considered as one of main soil factors affecting grain iron content, grain iron content positively correlated with soil available phosphorus in the study of Luo et al. (2025) [35]. Consistently, straw Fe concentrations positively correlated with straw P concentration in current study, suggesting increased P uptake could facilitate Fe uptake from soil to plant.
Understanding the associations between agronomic traits and nutrient accumulation is crucial for wheat production under rainfed coastal soil conditions. Enhancement in agronomic performance may cause negative impact on nutrient accumulation, increased grain yield was associated with higher grain and ear numbers but decreased conentrations of grain minerals such as Fe, Mg, Na, P, and Zn [36]. In current stuy, grain Zn concentration positively correlated with grain P concentration, grain Ca concentration, grain Mg concentration, straw weight and 1000-kernel weight in the generalized regression equation model, suggesting grain Zn concentration depended on both plant developmental process and nutrient accumulation process within plant. Higher N supply level (N100, N200) increased 1000-kernel weight of wheat grain relative to control treatment, consistently with Klikocka et al. (2016) [37]. It can be deduced that grain Zn cocentration relied on post-anthesis nutrient remobilization from canopy to growing seeds, specifically, higher grain Zn concentration caused by higher N supply level (N100, N200) associated with enhanced nutrient remobilization including Ca, Mg, K, and P togeher with improved 1000-kernel weight in current study. Interestingly, grain Fe concentration positively correlated with straw P concentration, straw K concentration, while negatively correlated with plant height, and grain number per head in the regression model (Table 5). This finding was in agreement with Hui et al. (2014) [32] and Luo et al. (2025) [35] wherein grain Fe concentration was negatively correlated with yield, and biomass. The decreased grain Fe concentration with increased biomass might be due to dilution effect. Selenium could play a role in mitigation of plant salt stress [38,39], so it was not surprising that regression model revealed positive correlation between grain Se concentration and grain Na concentrations in current study. This might be due to more Se was required in some genotypes to deal with salt stress, resulting in a higher concentration of Se together with Na.

4. Materials and Methods

4.1. Experimental Setup

Field trials were conducted in a typical coastal field (37.57 °N, 117.50 °E) at Liupu town, Wudi, Shandong Province, China, over two consecutive seasons (2020–2021 and 2021–2022). This experimental site had a shallow groundwater table (0.8-1.2 m); the wheat growth was assumed to be influenced not only by salinity in top soil layer but also by saline groundwater as roots penetrated into deeper soil layer. The top soil (0-20cm) at the experimental site had a pH of 8.1, ECe of 2.3 dS/m (as measured by extracts of saturated soil), 0.9 g/kg N, 6.8 mg/kg Olsen-P, 0.1 g/kg exchangeable K, and 0.9 mg/kg DTPA-Zn, 28.3 g/kg total Ca, 8.7 g/kg total Mg, 0.8 g/kg Na, 22.6 g/kg total Fe and 2.2 mg/kg total Se. The area experiences an average annual rainfall of 500–700 mm and annual evaporation of 1800–2000 mm. The wheat growth season usually starts in October and ends in next June. The precipitation, average high temperature, average low temperature during 2020–2021 and 2021–2022 growing seasons were shown in Figure 5. The experimental site received less precipitation in 2020–2021 growing season (118.2 mm) than that of 2021–2022 growing season (288.3 mm).
The field trial comprised eight newly bred winter wheat genotypes (Hongdi 95, Shannong 25, LJJ803, Jimai 775, LS018R, LS3666, Jimai 60, and Jimai 106) in Shandong province, China, and three N input levels with urea as the N source: N200 (200 kg/ha N, topdressed), N100 (100 kg/ha N, topdressed), and N0 (no N added). Each treatment had three replications, resulting in 72 plots (8 genotypes × 3 N input levels × 3 replications). Each plot, measuring 6 m2, received the specific N input and equal doses of P (150 kg/ha) using Ca(H2PO4)2 and K (120 kg/ha) using K2SO4. The fertilisers were applied for each plot before sowing. Seeds were sown manually in mid-October during both seasons, with a sowing density of 2.50 × 10⁶ seeds/ha for all genotypes. No irrigation was applied throughout the experiment. Plants were harvested in mid-June in both seasons.

4.2. Agronomic Performance

Agronomic traits for each genotype under different N supply levels were assessed. At maturity, 30 randomly selected plants from each plot were used to determine fertile spikelet number per head, non-fertile spikelet number per head, grain number per head, and 1000-kernel weight. Grain yield, and straw weight were determined by harvesting and measuring all the plants within each plot.

4.3. Elemental Measurements

Plant samples were harvested, separated into straw and grain, oven-dried 70 ℃ for 48 h, and ground into fine powder. A 50 mg subsample was digested with 13 mL HNO3 and 2 mL H2O2 in a tube. The digest solution was adjusted to 50 mL before elemental concentrations (Na, K, Ca, Mg, P, Zn, Fe, Se) were determined using inductively coupled plasma optical emission spectrometry (Thermo Scientific iCAP PRO ICP-OES).

4.4. Nutrient Accumulation Parameters

Grain and straw Na, K, Ca, Mg, P, Zn, Fe, and Se concentrations were calculated as follows:
(C×V)/SW,
where C is the concentration of an individual element in the digest solution, V is the volume of the digest solution, and SW is the sample weight (50 mg).
Total Na, K, Ca, Mg, P, Zn, Fe, and Se accumulation in grain and straw were calculated as follows:
Total accumulation of an individual element in grain (or straw) = grain (or straw) weight × Cgrain (or Cstraw),
where Cgrain and Cstraw are the concentrations (mg/kg) of individual elements in grain and straw, respectively.

4.5. Nitrogen Agronomic Efficiency

Nitrogen Agronomic Efficiency (NAE) was calculated as follows:
NAE (kg/kg) = (Grain yield in treatment - Grain yield in control)/(N input amount)

4.6. Statistical Analysis

A Season × N supply × Genotype interaction model was analyzed by ANOVA using SPSS software (IBM, USA). A mixed linear model accounted for fixed effects (season, genotype, and N supply) and random effects (block and measured replication). Multiple comparisons (Tukey) of measured parameters were conducted among different N supply levels for the same genotype within the same season, as well as among genotypes, with a significance level (α) set at 0.05. Stepwise multiple regression equations were constructed using investigated traits, including agronomic traits and nutrient concentrations, in SPSS software. For the regression equation model, grain Zn (or Fe, Se) concentration was used as the dependent variable, while other traits were used as independent variables. Principal component analysis (PCA) was performed using Origin 2018 software (Origin Lab, Northampton, USA), while Pearson’s correlation analysis was conducted using SPSS software to examine relationships among variables.

5. Conclusions

In summary, this study investigated the impact of N supply on agronomic performance and nutrient accumulation in eight wheat genotypes grown under rainfed coastal soil conditions. Season, genotype, and N supply significantly influenced agronomic traits and nutrient accumulation parameters, including grain and straw Na, K, Ca, Mg, P, Zn, Fe, and Se concentrations. Increasing N supply enhanced agronomic performance and grain Zn and Fe concentrations, but reduced grain Se concentration. N supply had a significant impact on the correlation among grain elemental accumulation. A better fertilizer management approach targeting wheat genotypes with higher Zn, Fe, and Se uptake holds promise for achieving the biofortification target in wheat grown under coastal soil conditions. This study underscores the importance of nutrient management strategies tailored to specific genotypes and environmental conditions to enhance crop productivity and nutritional quality. N supply could affect nutrients metabolism and plant development in wheat, hence change the association among elemental accumulation and agronomic performance. Both N supply level and genotypic difference should be taken into consideration for improved nutrient utilization in wheat cultivated in coastal saline soils and other similar challenging agricultural environments.

Author Contributions

Conceptualization, D.Z. and KHM.S.; methodology, Y.L. and D.Z.; data analysis, Y.L. and D.Z.; investigation, Y.L., S.Z. and G.L; resources, J.L. and D.Z.; data curation, Y.L., S.Z., and G.L.; writing—original draft preparation, Y.L. and D.Z.; writing—review and editing, D.Z. and KHM.S; supervision, D.Z.; project administration, D.Z.; funding acquisition, J.L. and D.Z. All authors have read and agreed to the published version of the manuscript.

Funding

This research was funded by the National Natural Science Foundation of China (32071954, 32302671), and National Natural Science Foundation of Shandong Province (ZR2022QC121, ZR2023YQ024).

Data Availability Statement

Data are contained within the article, further details are available upon reasonable request.

Conflicts of Interest

The authors declare no conflicts of interest.

Abbreviations

The following abbreviations are used in this manuscript:
Ca_grain Grain Ca concentration
Ca_straw Straw Ca concentration
Fe_grain Grain Fe Concentration
Fe_straw Straw Fe Concentration
FSNH Fertile Spikelet Number per Head
GNH Grain Number per Head
GY Grain Yield
K_grain Grain K Concentration
K_straw Straw K Concentration
Mg_grain Grain Mg Concentration;
Mg_straw Straw Mg Concentration
NAE Nitrogen Agronomic Efficiency
Na_grain Grain Na concentration
Na_straw Straw Na Concentration
PCA Principal Component Analysis
P_grain Grain P concentration
PH Plant Height
P_straw Straw P Concentration
Se_grain Grain Se Concentration
Se_straw Straw Se Concentration
SW Straw Weight
TKW 1000-Kernel Weight
Zn_grain Grain Zn Concentration
Zn_ straw Straw Zn concentration

References

  1. Negacz, K.; Malek, Z.; De Vos, A.; Vellinga, P. Saline soils worldwide: identifying the most promising areas for saline agriculture. J. Arid Environ. 2022, 203, 104775. [Google Scholar] [CrossRef]
  2. Prasad, A.S. Discovery of human zinc deficiency: its impact on human health and disease. Adv. Nutr. 2013, 4(2), 176–190. [Google Scholar] [CrossRef] [PubMed]
  3. Piskin, E.; Cianciosi, D.; Gulec, S.; Tomas, M.; Capanoglu, E. Iron absorption: Factors, limitations, and improvement methods. ACS Omega 2022, 7(24), 20441–20456. [Google Scholar] [CrossRef]
  4. Danso, O.P.; Asante-Badu, B.; Zhang, Z.; Song, J.; Wang, Z.; Yin, X.; Zhu, R. Selenium Biofortification: Strategies, Progress and Challenges. Agriculture 2023, 13, 416. [Google Scholar] [CrossRef]
  5. Bouis, H.E.; Welch, R.M. Biofortification – a sustainable agricultural strategy for reducing micronutrient malnutrition in the global South. Crop Sci. 2010, 50, 20–32. [Google Scholar] [CrossRef]
  6. White, P.J.; Broadley, M.R. Biofortification of crops with seven mineral elements often lacking in human diets – Fe, Zn, Cu, calcium, magnesium, selenium and iodine. New Phytol. 2008, 182, 49–84. [Google Scholar] [CrossRef]
  7. Cakmak, I.; Kutman, U.B. Agronomic biofortification of cereals with zinc: a review. Eur. J. Soil Sci. 2018, 69, 172–180. [Google Scholar] [CrossRef]
  8. Hawkesford, M.J.; Zhao, F.J. Strategies for increasing the selenium content of wheat. J. Cereal Sci. 2007, 46, 282–292. [Google Scholar] [CrossRef]
  9. Velu, G.; Ortiz-Monasterio, I.; Cakmak, I.; Hao, Y.; Singh, R.Á. Biofortification strategies to increase grain zinc and iron concentrations in wheat. J. Cereal Sci. 2014, 59(3), 365–372. [Google Scholar] [CrossRef]
  10. Zou, C.Q.; Zhang, Y.Q.; Rashid, A.; Ram, H.; Savasli, E.; Arisoy, R.Z.; Ortiz-Monasterio, I.; Simunji, S.; Wang, Z.H.; Sohu, V.; Hassan, M.; Kaya, Y.; Onder, O.; Lungu, O.; Yaqub Mujahid, M.; Joshi, A.K.; Zelenskiy, Y.; Zhang, F.S.; Cakmak, I. Biofortification of wheat with zinc through zinc fertilization in seven countries. Plant Soil 2012, 361, 119–130. [Google Scholar] [CrossRef]
  11. Ramkissoon, C.; Degryse, F.; da Silva, R.C.; Baird, R.; Young, S.D.; Bailey, E.H.; McLaughlin, M.J. Improving the efcacy of selenium fertilizers for wheat biofortifcation. Sci. Rep. 2019, 9, 19520. [Google Scholar] [CrossRef]
  12. Fageria, N.K.; Baligar, V.C.; Jones, C.A. Growth and Mineral Nutrition of Field Crops (3rd ed.). CRC Press. 2010.
  13. Nie, Z.; Zhao, P.; Shi, H.; Wang, Y.; Qin, S.; Liu, H. Nitrogen supply enhances zinc uptake and root-to-shoot translocation via up-regulating the expression of TaZIP3 and TaZIP 7 in winter wheat (Triticum aestivum). Plant Soil 2019, 444, 501–517. [Google Scholar] [CrossRef]
  14. Recena, R.; García-López, A.M.; Delgado, A. Zinc uptake by plants as affected by fertilization with Zn sulfate, phosphorus availability, and soil properties. Agronomy 2021, 11, 390. [Google Scholar] [CrossRef]
  15. Kutman, U.B.; Yildiz, B.; Cakmak, I. Effect of nitrogen on uptake, remobilization and partitioning of zinc and iron throughout the development of durum wheat. Plant Soil 2011, 342, 149–164. [Google Scholar] [CrossRef]
  16. Kutman, U.B.; Yildiz, B.; Cakmak, I. Improved nitrogen status enhances zinc and iron concentrations both in the whole grain and the endosperm fraction of wheat. J. Cereal Sci. 2011, 53(1), 118–125. [Google Scholar] [CrossRef]
  17. Fan Z.J.; Mi D.M.; L, Y., Huo, R.W.; Kong, W.L.; Noor, H.; Ren, AX.; Ding, P.C.; Li, L.H.; Ren, Y.K.; Sun, M.; Gao Z.Q. Effects of Nitrogen application amount on soil selenium speciations, physiological characteristics and yield of triticales in selenium-enriched area. Russ. J. Plant Physiol. 2023, 70(9), 207.
  18. Zhang, H.; Du, B.; Jiang, S.; Zhu, J.; Wu, Q. Potential Assessment of Selenium for Improving Nitrogen Metabolism, Yield and Nitrogen Use Efficiency in Wheat. Agronomy 2023, 13, 110. [Google Scholar] [CrossRef]
  19. Guo, X.; Ma, X.; Zhang, J.; Zhu, J.; Lu, T.; Wang, Q.; Wang, X.; Hua, W.; Xu, S. Meta-analysis of the role of zinc in coordinating absorption of mineral elements in wheat seedlings. Plant Methods 2021, 17, 105. [Google Scholar] [CrossRef]
  20. Zhang, W.; Liu, D.; Liu, Y.; Chen, X.; Zou, C. Overuse of phosphorus fertilizer reduces the grain and flour protein contents and zinc bioavailability of winter wheat (Triticum aestivum L.). J. Agric. Food Chem. 2017, 65, 1473–1482. [Google Scholar] [CrossRef]
  21. Huang, T.; Huang, Q.; She, X.; Ma, X.; Huang, M.; Cao, H.; He, G.; Liu, J.; Liang, D.; Malhi, S.S.; Wang, Z. Grain zinc concentration and its relation to soil nutrient availability in different wheat cropping regions of China. Soil Till. Res. 2019, 191, 57–65. [Google Scholar] [CrossRef]
  22. Agarwala, S.C.; Mehrotra, S.C. Iron-magnesium antagonism in growth and metabolism of radish. Plant Soil 1984, 80, 355–361. [Google Scholar] [CrossRef]
  23. Mehrabi, F.; Sepaskhah, A.R.; Ahmadi, S.H. Winter wheat root distribution with irrigation, planting methods, and nitrogen application. Nutr. Cycl. Agroecosystems 2021, 119, 231–245. [Google Scholar] [CrossRef]
  24. Zhao, D.; Zhang, X.; Zhao, W.; Zhao, S.; Liu, G.; Siddique, K.H.M. Root distribution, agronomic performance, and phosphorus utilization in wheat as mediated by phosphorus placement under rainfed coastal saline conditions. Agronomy 2023, 13, 2700. [Google Scholar] [CrossRef]
  25. Setter, T.L.; Waters, I.; Stefanova, K.; Munns, R.; Barrett-Lennard, E. G. Salt tolerance, date of flowering and rain affect the productivity of wheat and barley on rainfed saline land. Field Crop Res. 2016, 194, 31–42. [Google Scholar] [CrossRef]
  26. Zhao, D.; Gao, S.; Zhang, X.; Zhang, Z.; Zheng, H.; Rong, K.; Zhao, W.; Khan, S.A. Impact of saline stress on the uptake of various macro and micronutrients and their associations with plant biomass and root traits in wheat. Plant Soil Environ 2021, 67, 61–70. [Google Scholar] [CrossRef]
  27. Joshi, A.K.; Crossa, J.; Arun, B.; Chand, R.; Trethowan, R.; Vargas, M.; Ortiz-Monasterio, I. Genotype× environment interaction for zinc and iron concentration of wheat grain in eastern Gangetic plains of India. Field Crop Res. 2010, 116(3), 268–277. [Google Scholar] [CrossRef]
  28. Li, C.; Guo, Z.; Wang, X.; Ma, Y.; Liu, J.; Shi, M.; Zhang, D.; Malhi, S.S.; Siddique, K.H.M.; Wang, Z.H. Field-scale studies quantify limitations for wheat grain zinc biofortification in dryland areas. Eur. J. Agron. 2023, 142, 126687. [Google Scholar] [CrossRef]
  29. Feng, D.; Wang, X.; Gao, J.; Zhang, C.; Liu, H.; Liu, P.; Sun, X. Exogenous calcium: Its mechanisms and research advances involved in plant stress tolerance. Front. Plant Sci. 2023, 14, 1143963. [Google Scholar] [CrossRef]
  30. Li, L.; Tang, C.; Rengel, Z.; Zhang, F.S. Calcium, magnesium and microelement uptake as affected by phosphorus sources and interspecific root interactions between wheat and chickpea. Plant Soil 2004, 261, 29–37. [Google Scholar] [CrossRef]
  31. Zhao, D.; Zhang, X.; Zhao, S.; Liu, G.; Zhang, Z.; Zhao, W.; Li, X.; Khan, S.A.; Siddique, K.H.M. Biomass allocation and nutrients utilization in wheat as affected by phosphorus placement and salt stress. Agronomy 2023, 13, 1570. [Google Scholar] [CrossRef]
  32. Hui, X.; Wang, X.; Luo, L.; Wang, S.; Guo, Z.; Shi, M.; Wang, R.; Lyons, G.; Chen, Y.; Cakmak, I.; Wang, Z. Wheat grain zinc concentration as affected by soil nitrogen and phosphorus availability and root mycorrhizal colonization. Eur. J. Agron. 2022, 134, 126469. [Google Scholar] [CrossRef]
  33. Zhao, F.J.; Su, Y.H.; Dunham, S.J.; Rakszegi, M.; Bedo, Z.; McGrath, S.P.; Shewry, P.R. Variation in mineral micronutrient concentrations in grain of wheat lines of diverse origin. J. Cereal Sci. 2009, 49(2), 290–295. [Google Scholar]
  34. Shaukat, M.; Sun, M.; Ali, M.; Mahmood, T.; Naseer, S.; Maqbool, S.; Rehman, S.; Mahmood, Z.; Hao, Y.; Xia, X.; et al. Genetic Gain for Grain Micronutrients and Their Association with Phenology in Historical Wheat Cultivars Released between 1911 and 2016 in Pakistan. Agronomy 2021, 11, 1247. [Google Scholar] [CrossRef]
  35. Luo, Y, Li, Y, Li, W, Zhang, S.; Mu, W.; Huang, N.; Sun, R.; Ding, Y.; She, W.; Song, W.; Li, X.; Shi, M.; Wang, Z. Iron concentrations in grain and its different parts of newly developed wheat Varieties (lines) in China and influencing factors. Scientia Agricultura Sinica 2025, 58(3), 416–430.
  36. Marcos-Barbero EL, Pérez P, Martínez-Carrasco R, Arellano JB, Morcuende R. Genotypic Variability on Grain Yield and Grain Nutritional Quality Characteristics of Wheat Grown under Elevated CO2 and High Temperature. Plants 2021, 21;10(6):1043.
  37. Klikocka, H.; Cybulska, M.; Barczak, B.; Narolski, B.; Wójcik, E. The effect of sulphur and nitrogen fertilization on grain yield and technological quality of spring wheat. Plant Soil Environ. 2016, 62(5), 230–236. [Google Scholar] [CrossRef]
  38. Bouzid, N. Selenium as a powerful trace element for mitigation of plant salt stress: A review. J. T. E.Min. 2024, 8, 100123. [Google Scholar]
  39. Hussain, S.; Ahmed, S.; Akram, W.; Ahmad, A.; Yasin, N.A.; Fu, M.; Li, G.; Sardar, R. The potential of selenium to induce salt stress tolerance in Brassica rapa: Evaluation of biochemical, physiological and molecular phenomenon. Plant stress 2024, 11, 100331. [Google Scholar]
Figure 1. Grain (A, D) Zn, (B, E) Fe, and(C, F) Se concentrations in eight wheat genotypes under three N supply levels (N0, N100, N200) in the (A, B, C) 2020–2021 and (D, E, F) 2021–2022 seasons. Note: Different letters indicate statistically significant difference (p<0.05).
Preprints 150469 g001
Figure 2. PCA plots for the (left) 2020-2021 and (right) 2021-2022 wheat growing seasons.
Preprints 150469 g002
Figure 3. Correlations between agronomic trait and nutrient concentration in the 2020-2021 (A) and 2021-2022 (B) wheat growing seasons.
Preprints 150469 g003
Figure 4. Correlations among grain elemental accumulation under (A, D) N0, (B, E) N100, and (C, F) N200 treatments during (A, B, C) 2020-2021 and (D, E, F) 2021-2022 seasons. Note: Blue, and red lines indicate negative, and positive correlations respectively. Bold, and dash lines indicate correlation are significant, and non-significant respectively.
Preprints 150469 g004
Figure 5. Precipitation and temperature during 2020-2021 (A) and 2021-2022 (B) growth seasons.
Preprints 150469 g005
Table 1. Plant height, fertile spikelet number per head, grain number per head, 1000-grain weight, grain yield, and straw weight under three N supply levels (N0, N100, N200) in the 2020–2021 and 2021-2022 seasons.
Season N supply PH (cm) FSNH GNH TKW (g) GY (kg/ha) SW (kg/ha)
2020-2021 N0 53.0 ± 4.4 c 15.4 ± 0.7 a 41.6 ± 2.7 b 40.1 ± 2.2 c 4013.7 ± 611.8 c 4404.5 ± 602.1 c
N100 54.3 ± 4.3 b 15.6 ± 0.6 a 41.4 ± 3.4 b 40.5 ± 2.2 b 4706.6 ± 710.2 b 5136.8 ± 775.8 b
N200 57.1 ± 5.2 a 15.8 ± 0.9 a 44.6 ± 2.0 a 40.8 ± 2.3 a 5782.3 ± 890.0 a 6110.8 ± 1009.9 a
2021-2022 N0 55.0 ± 4.4 b 16.0 ± 0.8 b 42.6 ± 3.3 b 41.2 ± 2.3 c 4158.2 ± 619.7 c 4120.3 ± 658.1 c
N100 57.1 ± 5.7 a 16.2 ± 0.7 a 43.3 ± 3.8 b 41.5 ± 2.4 b 4921.2 ± 784.8 b 5095.3 ± 1068.2 b
N200 58.9 ± 4.6 a 16.4 ± 1.0 a 46.6 ± 2.4 a 41.9 ± 2.4 a 6073.9 ± 916.7 a 6096.9 ± 1326.6 a
Note: Different letters indicate statistically significant difference (p<0.05).
Table 2. Multiple comparison of agronomic traits of eight wheat genotypes at maturity.
Growing season Genotype PH (cm) FSNH GNH TKW (g) GY (kg/ha) SW (kg/ha)
2020–2021 Hongdi95 49.6 ± 0.9 d 15.1 ± 0.5 cd 41.0 ± 3.3 bc 40.3 ± 0.6 bc 3667.8 ± 558.4 d 3964.1 ± 723.4 d
Jimai106 50.7 ± 1.3 d 15.9 ± 0.7 b 44.2 ± 1.2 a 43.3 ± 0.9 a 4759.1 ± 1176.8 c 5219.7 ± 1245.3 bc
Jimai60 62.9 ± 2.2 a 15.5 ± 0.7 bc 44.2 ± 2.1 a 43.5 ± 0.5 a 5457.7 ± 781.3 ab 5730.2 ± 650.4 ab
Jimai775 54.6 ± 2.7 c 16.4 ± 0.7 a 44.4 ± 3.9 a 36.7 ± 0.8 e 5782.7 ± 1363.7 a 6135.1 ± 1472.2 a
LJJ803 55.4 ± 5.0 bc 15.5 ± 0.6 bc 38.6 ± 4.4 c 38.8 ± 0.9 d 4572.5 ± 906.3 c 5166.9 1118.3 bc
LS018R 54.4 ± 3.9 c 14.8 ± 0.4 d 40.4 ± 3.4 c 40.6 ± 0.6 b 4836.0 ± 372.7 c 5148.5 ± 357.9 bc
LS3666 56.5 ± 3.9 b 15.8 ± 0.7 b 43.2 ± 1.0 ab 39.7 ± 1.3 c 4591.5 ± 549.2 c 4904.5 ± 514.7 c
Shannong25 54.3 ± 3.6 c 15.7 ± 0.5 b 42.9 ± 3.2 ab 40.8 ± 0.8 b 5006.3 ± 988.3 bc 5469.8 ± 769.9 abc
2021–2022 Hongdi95 51.6 ± 1.7 d 15.6 ± 0.6 c 43.1 ± 4.0 bcd 41.2 ± 1.0 bc 3865.3 ± 585.8 c 4033.9 ± 860.0 b
Jimai106 53.1 ± 1.7 d 16.4 ± 0.7 b 46.0 ± 1.3 ab 44.9 ± 1.0 a 4817.0 ± 1229.7 b 5128.9 ± 1028.4 ab
Jimai60 64.9 ± 3.4 a 16.1 ± 0.6 bc 46.4 ± 2.2 a 44.2 ± 0.5 a 5696.0 ± 807.7 a 5820.1 ± 979.5 a
Jimai775 57.7 ± 3.6 bc 17.3 ± 0.7 a 45.8 ± 4.4 ab 37.3 ± 0.9 e 6081.7 ± 1444.8 a 5078.9 ± 1484.1 ab
LJJ803 57.6 ± 5.8 bc 16.0 ± 0.8 bc 41.2 ± 3.3 d 39.8 ± 1.2 d 4770.6 ± 949.7 b 5655.9 ± 1817.6 a
LS018R 56.0 ± 3.7 c 15.6 ± 0.5 c 41.7 ± 3.7 cd 42.0 ± 0.7 b 5120.7 ± 413.2 b 5135.2 ± 1060.2 ab
LS3666 58.4 ± 4.2 b 16.4 ± 0.8 b 44.6 ± 1.8 abc 40.9 ± 1.3 c 4867.4 ± 527.3 b 4297.9 ± 707.8 b
Shannong25 56.4 ± 3.5 bc 16.2 ± 0.4 bc 44.5 ± 3.8 abc 41.7 ± 1.1 bc 5190.3 ± 1210.6 b 5682.6 ± 1496.8 a
Note: Different letters within the same column indicate significant differences at the 0.05 level.
Table 3. Multiple comparison of grain elemental concentration of eight wheat genotypes at maturity.
Growing season Genotype Na
(mg/kg )
K
(g/kg )
Ca
(mg/kg)
Mg
(g/kg)
P
(g/kg)
Zn
(mg/kg)
Fe
(mg/kg)
Se
(µg/kg)
2020–2021 Hongdi95 51.7 ± 18.5 b 4.6 ± 0.5 a 524.3 ± 41.2 a 1.6 ± 0.1 ab 4.4 ± 0.5 a 28.4 ± 2.8 ab 51.9 ± 3.1 bc 55.8 ± 6.7 ab
Jimai106 43.3 ± 3.5 c 4.2 ± 0.4 abc 501.8 ± 52.8 ab 1.5 ± 0.1 bc 3.9 ± 0.4 b 30.2 ± 4.6 a 55.1 ± 4.5 b 50.6 ± 7.9 c
Jimai60 64.3 ± 14.1 a 4.4 ± 0.3 a 441.8 ± 29.8 d 1.4 ± 0.1 c 3.4 ± 0.5 c 23.1 ± 2.9 de 50.1 ± 3.8 c 54.2 ± 7.1 bc
Jimai775 45.2 ± 5.2 c 4.0 ± 0.4 bc 487.9 ± 59.8 abc 1.6 ± 0.1 ab 3.4 ± 0.5 c 25.1 ± 4.5 cd 48.4 ± 4.8 cd 57.3 ± 5.4 ab
LJJ803 49.9 ± 14.1 b 4.4 ± 0.4 a 511.9 ± 40.3 ab 1.6 ± 0.2 a 4.0 ± 0.5 b 26.5 ± 4.6 bc 63.6 ± 15.3 a 57.2 ± 3.9 ab
LS018R 35.3 ± 4.4 d 4.3 ± 0.4 ab 486.4 ± 43.1 abcd 1.5 ± 0.2 bc 3.3 ± 0.5 c 23.8 ± 2.6 d 49.8 ± 2.1 c 56.8 ± 3.9 ab
LS3666 52.2 ± 13.6 b 4.2 ± 0.3 abc 449.5 ± 82.6 cd 1.4 ± 0.1 c 3.2 ± 0.2 cd 21.3 ± 1.2 e 44.9 ± 2.4 d 58.6 ± 9.1 ab
Shannong25 44.8 ± 9.4 c 3.9 ± 0.3 c 478.4 ± 36.6 bcd 1.4 ± 0.1 c 2.9 ± 0.2 d 23.5 ± 3.8 de 49.6 ± 2.7 c 60.0 ± 10.4 a
2021–
2022
Hongdi95 47.6 ± 17.2 b 4.1 ± 0.4 a 489.7 ± 31.9 a 1.4 ± 0.1 ab 4.1 ± 0.4 a 35.1 ± 3.5 ab 48.5 ± 3.2 bc 51.8 ± 6.2 bc
Jimai106 39.7 ± 3.6 c 3.9 ± 0.4 b 470.1 ± 54.8 a 1.3 ± 0.1 bc 3.6 ± 0.2 b 35.9 ± 3.4 a 51.9 ± 3.0 b 47.0 ± 5.8 d
Jimai60 58.5 ± 11.1 a 3.9 ± 0.2 ab 406.8 ± 16.8 c 1.3 ± 0.1 c 3.2 ± 0.5 c 30.4 ± 6.2 cd 46.4 ± 2.9 cd 49.5 ± 5.5 cd
Jimai775 41.5 ± 4.8 c 3.6 ± 0.4 c 453.9 ± 57.2 ab 1.4 ± 0.1 ab 3.2 ± 0.5 c 31.2 ± 6.9 bc 45.2 ± 4.2 cd 53.1 ± 4.6 abc
LJJ803 48.1 ± 13.6 b 4.1 ± 0.3 ab 481.6 ± 44.5 a 1.5 ± 0.2 a 3.7 ± 0.5 b 32.8 ± 5.3 abc 60.4 ± 1.3 a 53.8 ± 2.5 abc
LS018R 33.2 ± 3.7 d 3.9 ± 0.4 ab 454.8 ± 47.3 ab 1.3 ± 0.2 bc 3.0 ± 0.4 c 30.8 ± 5.6 bc 47.1 ± 3.1 cd 52.6 ± 3.3 bc
LS3666 48.9 ± 13.0 b 3.9 ± 0.2 c 427.9 ± 79.2 bc 1.3 ± 0.1 c 3.0 ± 0.2 cd 26.1 ± 2.5 d 42.9 ± 2.6 d 55.3 ± 7.8 ab
Shannong25 41.5 ± 8.5 c 3.5 ± 0.3 c 453.6 ± 38.5 ab 1.3 ± 0.2 bc 2.8 ± 0.3 d 30.4 ± 5.2 cd 47.5 ± 3.6 c 57.2 ± 8.9 a
Note: Different letters within the same column indicate significant differences at the 0.05 level.
Table 4. Nitrogen agronomic efficiency of eight wheat genotypes grown under N100, and N200 supply levels.
Growing season Genotype NAE (kg/kg)
N100 N200
2020–2021 Hongdi95 4.6 ± 0.3 c 6.0 ± 0.4 b
Jimai106 6.1 ± 1.9 c 13.0 ± 0.8 ab
Jimai60 1.5 ± 0.2 d 7.6 ± 0.5 b
Jimai775 18.7 ± 2.1 a 15.4 ± 0.9 a
LJJ803 8.0 ± 0.7 c 10.0 ± 0.6 b
LS018R 2.1 ± 0.6 d 3.3 ± 0.7 c
LS3666 0.5 ± 0.1 d 5.1 ± 0.3 c
Shannong25 14.9 ± 1.5 b 10.2 ± 2.0 b
2021–2022 Hongdi95 6.3 ± 0.9 c 4.2 ± 1.7 cd
Jimai106 13.4 ± 1.7 ab 6.4 ± 0.9 c
Jimai60 7.8 ± 1.7 bc 3.5 ± 0.4 cd
Jimai775 16.0 ± 0.6 a 20.4 ± 4.7 a
LJJ803 10.4 ± 1.8 b 8.2 ± 2.4 c
LS018R 3.8 ± 1.6 c 3.1 ± 1.1 cd
LS3666 5.4 ± 0.3 c 2.2 ± 0.6 d
Shannong25 13.6 ± 0.7 ab 14.2 ± 1.4 b
Note: Different letters within the same column indicate significant differences at the 0.05 level.
Table 5. Regression model between grain Zn, Fe, Se concentrations and agronomic traits and other elemental concentrations.
Growing season N treatment Equation
2020–2021 N0 (1) YZn_Grain = 0.004XP_Grain + 0.010XMg_Grain + 0.118XSe_Straw – 16.230
(2) YFe_Grain = -3.558XGNH -7.195XZn_Straw – 0.034XMg_Grain – 2.264XTKW – 0.004XSW +402.986
(3) YSe_Grain = –0.097XFe_Straw + 0.302XPH + 0.010XK_Grain +0.001XK_Straw + 0.021XCa_Grain –12.485
N100 (1) YZn_Grain = 0.003XP_Grain + 0.458XFe_Grain – 8.818
(2) YFe_Grain =0.535XZn_Grain – 0.381XPH + 56.774
(3) YSe_Grain = 0.636XNa_Grain - 0.008XK_Grain + 0.033XP_Straw + 44.317
N200 (1) YZn_Grain = 0.782XFe_Grain - 0.113XNa_Grain + 0.794XZn_Straw – 13.421
(2) YFe_Grain = 0.885XZn_Grain + 0.074XNa_Grain + 0.003XP_Grain +14.528
(3) YSe_Grain = –0.727XSe_Straw + 0.025XMg_Straw + 0.729XZn_Straw +99.073
Combined N0, N100, and N200 (1) YZn_Grain = 0.005XP_Grain + 0.025XCa_Grain + 0.001XGY – 10. 214
(2) YFe_Grain = –0.920XGNH – 0.014XMg_Straw + 0.021XP_Straw + 101.986
(3) YSe_Grain = –0.244XSe_Straw – 0.542XPH + 0.156XNa_Grain +105.618
2021–2022 N0 (1) YZn_Grain = 0.008XP_Grain – 0.006XMg_Straw + 11. 632
(2) YFe_Grain = –2.790XGNH – 4.416XZn_Straw + 0.332XNa_Grain + 184. 671
(3) YSe_Grain = –0.089 XFe_Straw + 72.295
N100 (1) YZn_Grain = 0.006XP_Grain + 12. 670
(2) YFe_Grain = 0.063XCa_Grain + 16.797
(3) YSe_Grain = 0.114XP_Straw – 3.074XZn_Straw + 33.843
N200 (1) YZn_Grain = 1.020XFe_Grain + 0.007XCa_Grain – 34. 0624
(2) YFe_Grain = 0.724XZn_Grain – 0.009XCa_Straw + 0.027XFe_Straw + 42.911
(3) YSe_Grain = –0.127XFe_Straw + 1.546XZn_Straw + 64.592
Combined N0, N100, and N200 (1) YZn_Grain = 0.007XP_Grain + 0.002XGY – 0.262XPH – 1.567XFSNH +37. 591
(2) YFe_Grain = –0.954XGNH – 0.008XMg_Straw + 0.279XZn_Grain + 91. 642
(3) YSe_Grain = –0.825XTKW +86.838
Combined N0, N100, and N200 treatments of both 2020–2021 and 2021–2022 seasons / (1) YZn_Grain = 0.003XP_Grain + 0.013XCa_Grain + 0.001XSW – 0.377XPH + 0.374XZn_Straw + 0.5XTKW + 0.008XMg_Grain – 13.578
(2) YFe_Grain = 0.033XP_Straw + 0.006XK_Grain + 2.656XFSN – 0.867XGN – 0.014XMg_Straw – 0.494XPH + 56.263.
(3) YSe_Grain = –0.330XSe_Straw – 0.994XPH + 0.119XNa_Grain – 0.012XP_Grain + 0.032XMg_Grain+ 0.006XK_Grain – 0.045XCa_Grain + 0.004XNa_Straw + 124.646.
Disclaimer/Publisher’s Note: The statements, opinions and data contained in all publications are solely those of the individual author(s) and contributor(s) and not of MDPI and/or the editor(s). MDPI and/or the editor(s) disclaim responsibility for any injury to people or property resulting from any ideas, methods, instructions or products referred to in the content.
Copyright: This open access article is published under a Creative Commons CC BY 4.0 license, which permit the free download, distribution, and reuse, provided that the author and preprint are cited in any reuse.
Prerpints.org logo

Preprints.org is a free preprint server supported by MDPI in Basel, Switzerland.

Subscribe

Disclaimer

Terms of Use

Privacy Policy

Privacy Settings

© 2025 MDPI (Basel, Switzerland) unless otherwise stated