
Submitted:
20 December 2024
Posted:
23 December 2024
You are already at the latest version
Abstract
This work uses state-of-the-art climate model data at 30 European airport locations to examine how climate change may affect summer take-off distance required – TODR – and maximum take-off mass – MTOM – for mid-century (2035–2064) compared to a historical baseline (1985–2014). The data presented here are for the Airbus A320, however the methodology is generic and few changes are required in order to apply this methodology to a wide range of different fixed-wing aircraft. The climate models used are taken from the 6th Coupled Model Intercomparison Project (CMPI6) and span a range of climate sensitivity values, that is, the amount of warming they exhibit for a given amount of increase in atmospheric greenhouse gas concentrations. Using a Newtonian force-balance model, we show that 30-year average values of TODR may increase by around 50–100 m, albeit with significant day-to-day variability. The changing probability distributions are quantified using kernel density estimation and an illustration is given showing how changes to future daily maximum temperature extremes may affect distributions of TODR going forward. Furthermore, it is projected that the 99th percentile of the historical distributions of TODR may by exceeded up to half the time in the summer months for some airports. Some of the sites studied have runways that are shorter than the distance required for a fully laden take-off, which means they must reduce their payloads as temperatures and air pressures change. We find that, relative to historical mean weight-restriction values, passenger numbers may need to be reduced by approximately 10 passengers per flight, again with significant increases (as high as approximately 60%) in the probability of exceeding historical extreme values.
Keywords:
take-off distance
; climate change
; take-off mass
; Europe
; scenario
1. Introduction
Aircraft take-off distance required (TODR) and maximum take-off mass (MTOM) are critical parameters that must be considered for the safe operation of each and every military, civilian, and freight air movement. A 2016 order-of-magnitude estimate from the World Economic Forum put this value at approximately flights per day worldwide [1]. Going forward, for Europe specifically, the European Organisation for the Safety of Air Navigation (EUROCONTROL) predicts an increase of between 19% and 76% in flight numbers between 2019 and 2050 [2].
Tables of TODR versus weight are typically publicly available for passenger aircraft up to the relevant maximum payload. For many large airports – e.g. Amsterdam Schiphol and London Heathrow – available runway lengths are more than capable of accommodating a fully laden Airbus A320, often with kilometres to spare. However, for airports with runway lengths roughly equal to, or shorter than the manufacturers’ limits (or where the effective runway length is reduced due to maintenance or a take-off starting away from the end of the runway), the weight of the aircraft must be reduced in order to comply with safety constraints.
For a given air pressure and aircraft mass, increasing temperature (e.g. from climate change) reduces air density, which must be balanced by increased speed to achieve the same amount of lift to overcome gravity. Changing density also affects aerodynamic drag and hence the vertical and horizontal balance of forces are subject to change. Because of this, a given aircraft configuration in a warmer world will require a longer distance before take-off occurs and – equivalently – for a given limited take-off distance (i.e. a particular runway), the maximum aircraft mass must be reduced.
This study builds on previous work which detailed the effects of past climate change on several Greek airports under climate change, taking (daily minimum) temperature and headwind speed into account [3]. This study found that maximum take-off weight is already being affected by a changing climate climate and quantified this effect in terms of reduced passenger numbers and fuel payload for the Airbus A320 turbofan and DHC-8-400 turboprop aircraft.
Other previous relevant studies include those of Coffel et al. and Wang et al. [4,5,6]. The former two both consider a selection of airports in the USA, which were chosen for their high temperatures (Phoenix), elevation (Denver), or short runways (LaGuardia and Washington, DC). The former study used the most extreme emissions scenario available at the time (RCP8.5) and the latter used a more nuanced approach by also considering a more optimistic (lower emissions) RCP4.5 future. These studies differ subtly to the study of Gratton et al. [3] in their concentration on ‘weight-restriction days’; that is, the number (or fraction) of days in a particular time window when weight restrictions must be applied. The latter study of Wang et al. [6] studies the take-off performance of the Boeing 737 at four Asian airports (also under RCP8.5) and shows non-linear increases in TODR with temperature resulting in increases of between m by the 2070s.
In this work, we combine the main analysis methods of the above studies using a Newtonian force-balance model and open-access input data to obtain estimates for how TODR and MTOM may change in the future using data from 10 state-of-the-art climate models and three future emissions scenarios. We consider 30 specific European airports using 1985–2014 as a recent historical baseline and 2035–2064 as our future period of interest. The use of simulated data over the historical period, rather than observations, enables the removal of any model-data biases, since these will be common to both the past and future periods chosen.
The structure of this paper is as follows: Input climate model data and the force balance model are described in Section 2.1, the numerical methods are detailed in Section 2.2 and Section 2.3 respectively, results are given in Section 3 and we provide conclusions and sugestions for further work in Section 4.
2. Materials and Methods
2.1. Input Data
We use the method of Gratton et al. [3] to calculate take-off distances as a function of daily mean air pressure and daily maximum temperature at 2 m above ground level. The data used is from 10 climate models from the 6th Coupled Model Intercomparison Project (‘CMIP6’) and covers the ‘historical’ period 1985–2014 and projections for 2035–2064 for three different future climate scenarios. The models used are listed in Table A3.
These scenarios –– or Shared Socieconomic Pathways (SSPs) –– are described by two numbers; the first indicating the scenario ‘family’ that they belong to, and the second giving the top-of-atmosphere radiative forcing in Watts per metre squared at 2100. We use the scenarios described in Table 1, which broadly correspond to low, medium and high levels of future climate change.
The data used are for the 25 busiest European airports – according to 2019 European Civil Aviation Council data [11] – plus an additional 5 sites which (according to media reports) have already experienced either frequent noise complaints or take-off restriction issues related to short runways; they are shown in Figure 1.
The climate model data used in this study are the surface air pressure, and the standard measure of ‘Maximum temperature at 2 metres in the last 24 hours’, or (e.g. https://codes.ecmwf.int/grib/param-db/51). Other variables were also extracted from the climate model data, including specific humidity – which affects sound propagation and hence noise pollution [12] – and will be used in future work. The daily maximum temperature was chosen here in order to enhance the signal to noise ratio in data with large day-to-day variability.
The air density is calculated assuming ideal gas conditions:
where is the air density and is the specific gas constant for dry air, 287 J·kg−1·K.
The methodology used to prepare the model data in the required format for this study is based on Trentini et al. [13], which uses bias correction tailored to extreme events in ERA5 reanalysis. In addition, the current study introduces a Quantile Delta Mapping step, which helps to maintain variations over longer periods [Trentini et al., 2024, in prep.]. In addition, any values more than 3 standard deviations from the mean in any of the distributions studied are discarded to reduce the impact of outliers emerging from the model ensemble.
2.2. Take-Off Distance Calculation
We use the method from Gratton et al. [3] assuming a flat runway (no incline) for the Airbus A320 aircraft using V2500-A1 turbofan engines; Figure 2 illustrates the direction of the forces and angles involved.
The forces on the aircraft are calculated assuming a constant thrust, and then the equations of motion are solved iteratively until the ‘true air speed’ – TAS – is found where the lift is equal to the weight, i.e. the moment of take-off. The local wind speed is not taken into account in this calculation but could straightforwardly be included in the future. From this value of the take-off speed, and using the acceleration at each velocity, the amount of runway from rest to take-off is calculated. The TODR includes the horizontal distance illustrated in Figure 2, plus the distance required to climb to 10.7 m (35 feet) above the runway, which is 79 m. Finally, the sum of these two distances is multiplied by 1.15 [14] to give the final TODR. Thrust and drag data are obtained from the openAP package [15] where drag from landing gears is used but wave and wing flap drag are excluded. The openAP software gives minimum, optimum, and maximum values of take-off speeds (74.5, 85.3 and 96 m·s−1) from the WRAP kinematic model of aircraft performance [16] and we use these values to find a corresponding lift coefficient () value envelope. By using the table of take-off distance as a function of mass from Gratton et al. [3] we find the lift coefficient by minimisation of root-mean-square differences between model and manufacturer values:
- Obtain the thrust value from the openAP model assuming minimum take-off speed.
- Calculate the TODR as a function of the masses from Gratton et al. [3] for = 1 to = 2 in increments of 0.01.
- Find the root-mean-squared difference (RMSD) value between the array of TODRs found in 2 and the manufacturer values.
- Find the value of which gives the lowest RMSD value; this gives an estimate of the lower bound ,
- Repeat steps 1 – 4 twice more for the thrust values given by the optimum and maximum take-off speeds and to get an optimum value of the lift coefficient, and error bound estimates.
The results of the above steps are shown in Figure 3 and show that the uncertainty considerations are valid in that they encompass the values from Gratton et al. [3] at every take-off mass considered with the exception of the manufacturer’s TODR value at maximum take-off weight. This is where where one would expect this linear model to break down due to lack of consideration of higher-order effects, which are outside the scope of this study [15,16]). Finally we obtain the optimum value of the lift coefficient = 1.14 ± 0.03.
Since the calculation as it stands currently only uses air density as a thermodynamic input, we can straightforwardly find idealised (i.e. not using climate model data) TODR as a function of temperature and pressure independently by holding one constant and varying the other since . Example values are an increase of 4.2 m (7.4 m) per degree and a decrease of 1.2 m (2.2 m) per hPa at minimum (maximum) payload under International Standard atmosphere (ISA) conditions of 15 degrees Celsius and 1013.25 hPa.
2.3. MTOM Calculation
The algorithm and equations used here and in Gratton et al. [3] are, a priori, used to find the TODR for a given mass. To do the inverse of this – find the mass for a given TODR – involves inverting the system and to do this we use a search algorithm which iteratively calculates TODR at decreasing values of take-off mass until the it is equal to the runway length. For every day of a model’s time series, the TODR is calculated using the daily maximum temperature and surface pressure. We then follow these steps:
→ if (TODR < runway length) then go to next day.
→ else
→→ Reduce mass by kg until TODR < runway length.
→→ Add to the mass.
→→→ Reduce mass by kg until TODR < runway length.
→→→ Add to the mass.
→→→→ Reduce mass by kg until TODR < runway length.
→→→→ Add to the mass.
→→→→→ Reduce mass by kg until TODR < runway length.
→→→→→ Add to the mass.
→→→→→→ Stop; MTOM has been found to the nearest kg.
This allows us to efficiently find the mass that gives a TODR equal to the runway length to an accuracy of 1 m by minimising a function of the form,
and is faster than a ‘brute force’ method by over an order of magnitude.
Throughout this work (for illustrative purposes) we use the UKESM1-0-LL model as our input dataset and Heathrow airport for the site. All results are shown for June-July-August (JJA) and we split the results up into two main sections; the former looking at TODR and the latter on MTOM.
For TODR, we firstly examine a specific model-airport case study for June-July-August (JJA) in order to illustrate the type of results available from the model at this stage. We use the UKESM1-0-LL model and London Heathrow airport – International Civil Aviation Organization code (ICAO) EGLL. We then examine all models and sites together, illustrating the variation across the entire ensemble of the probability of future exceedance of the a ‘one in a hundred day’ warm – and hence maximised TODR – event.
For MTOM, we show results for four short-runway case study sites. These are Chios, Pantelleria, San Sebastian, and Rome Ciampino. These are the airports in our study group with the shortest runways, noting that we do not include London City here since it does not operate the A320. All other airports have runways long enough to accommodate the A320 at maximum payload even under extreme warming conditions.
3. Results and Discussion
3.1. Take-Off Distance Required
3.1.1. Case Study
Figure 4 shows distributions of TODR for the historical period and the three future forcing scenarios used for Heathrow airport in JJA using the UKESM1-0-LL climate model.
Figure 4 shows that, in general, the TODR increases with increased forcing. This is the expected first-order behaviour since warmer air will be less dense for a given air pressure as shown in Equation 1. Note however that for some airport/model combinations, the median values of TODR do not always increase monotonically as shown for example in Figure 5 for Brussels airport and the ACCESS-ESM1-5 model. This could be a function either of the chosen model’s forcing response (in general or for this site specifically) or the bias correction pipeline which was used to produce the data used in this modelling exercise [13].
Figure 6 shows both histograms and smooth kernel density estimates (KDEs) for the same TODR input data as shown in Figure 4 and for the daily maximum temperatures.
The correlation between the TODR and the daily maximum temperature is not one-to-one since the air pressure is also varying – see discussion of Figure 7 below – but the overall link between the two variables shown in Figure 6 is clear. The increasing width of the distributions seen in Figure 6 is accompanied by a wider tail of the distributions on hotter days. The distributions in Figure 6 evolve from positively skewed unimodal distributions in the historical data to clearly bimodal ones in the future projection data, especially for temperature. This feature, coupled with the general increase in overall temperatures with increased forcing tends to make the TODR not only larger but more variable, which is in line with the predictions of an increased occurrence of unusually hot days in the future noted, for example, by Zhang et al. [17].
To further emphasise the point that TODR does not have a one-to-one relationship with temperature, Figure 7 shows scatter plots of TODR and MTOM as a function of daily maximum temperature and pressure for Rome Ciampino airport. The co-variability is large; indeed for a temperature of 20°C, the variation in TODR simply from pressure changes is approximately 50 m and at 30°C, these variations can account for MTOM changes of up to half a ton (500 kg, 1100 lb).
It is worth noting that the symbols for the MTOM are not shown when the calculated weight restriction is zero. What this means is that for temperatures below approximately 18°C, the runway (2203 m for Rome Ciampino) is longer than the maximum TODR and so weight restrictions are not required.
3.1.2. Ensemble
Figure 8 shows the model ensemble spread of the probability of exceedance of the 99th percentile of the historical distribution of TODR values for the whole ensemble. The y-axis shows the number of days exceeding the 99th percentile of the historical distribution in each case. What this means is that a value of, say, 20, means an event that was historically a 1/100 day event, will occur 1/5th of the time in the future.
3.2. MTOM
The MTOM is obtained via an inversion of the TODR calculation as detailed above; that is, the mass is calculated which gives a TODR equal to the runway length at each airport. The aircraft will only be mass-limited if, at maximum loading, the TODR is greater than the runway length. Therefore we only need consider airports which have a TODR close to this value. Figure 9 shows the TODR at the maximum loading mass under International Standard Atmosphere conditions in comparison to the runway lengths for the airports studied (given numerically in Table A2). Note that going forward in this section we do not consider London City Airport which, although its runway is short (1508 m), does not operate the A320 although it does use the shorter A319 and A318 variants.
Figure 10 shows projected changes in weight restrictions over time for the four short-runway sites discussed above and the three future emissions scenarios compared to the respective historical mean values. Analogous figures for a selection of American airports can be found in [4] and this study uses the same value for an average passenger’s mass, i.e. 190 lb, or just over 86 kg.
Figure 10 shows that even the most optimistic future projections of greenhouse gas emissions (SSP1-2.6) our model indicates that the MTOM will be reduced by a weight equivalent to approximately 5 passengers.
At the beginning of the future period considered, MTOM is largely independent of the scenario used because in 2035, the divergence in their emissions profiles is relatively small. Under SSP1-2.6, the stabilisation of emissions leads to broadly static reductions in MTOM of 5-6 passengers over the whole period. This increases to ≈ 9 for SSP3-7.0 and as much as ≈ 13 for SSP5-8.5 by the end of 2064.
To obtain an estimate for the increase in the frequency of weight-restriction-days, it is important to note that – using manufacturer data in ISA conditions [3] – the TODR for a fully laden A320 is greater than any of the five short-runway sites considered here. In other words, even in the historical period, manufacturer data alone tells us that some level of payload restriction must apply even at a conservatively cool (ISA) temperature of 15 °C, and even this excludes other deleterious factors such as standing water and headwind.
Because of these ‘built in’ weight restrictions, to give some tangible numbers we find the fraction of future days with weight restrictions at the 99th percentile of historical values for each short-runway site (analogous to the process followed above for TODR in Figure 8) and this is shown in Figure 11.
As in the top row of Figure 10, the values through time for SSP1-2.6 in Figure 11 are broadly static, reflecting the stabilisation of emissions in this scenario. However, unlike Figure 10, the number of days where MTOM is highly dependent on the site with mean values as low as approximately 10% for Pantelleria and San Sebastian and as high as approximately 30% for Ciampino. For SSP3-7.0 and SSP5-8.5, we see the same noticeable site-dependent variation in MTOM plus the effect of the larger increases in temperature resulting from the increased emissions profiles.
The values – as for TODR in Figure 8 – are striking. By definition, the historical equivalent value in Figure 11 is 1%, and so our data shows that under a high future emissions scenario, days in which weight restrictions occurred one day per hundred historically could occur up to 60% of the time under an extreme future emissions scenario.
We now consider the probability distribution functions – PDFs – of all the weight restriction data for each period rather than through time and these are presented in Figure 12, which shows the normalised weight restriction PDFs of the periods considered relative to the historical mean. Subtracting this average gives a historical distribution which has an integral of 0.5 either side of zero and more clearly shows the resulting increases in weight restriction.
Again (as with the TODR distributions shown in Figure 6) there are two key features of the PDFs in Figure 12; the overall shape, and the changes to extreme values and in this analysis again we consider the probability of exceeding the 99th percentile of historical values. The historical distributions are broadly unimodal, albeit with small but non-negligible probabilities of high weight restrictions (‘long tails’), particularly for San Sebastian which has a 99th percentile value of almost 20 passengers above the historical mean. With increased greenhouse gas forcing, the shape of the PDFs tends to shift from unimodal to bimodal, again indicating an increase in the relative occurrence of extreme hot days. This is reflected in the increase in the 1/100 day weight restriction value which (insets in the top row of Figure 12) in each case, approximately doubles when comparing SSP5-8.5 values to the historical distribution.
4. Conclusions
Using a Newtonian force-balance model with open access input parameters, we have examined how take-off distance required (TODR) and maximum take-off mass (MTOM) may change in the future over European airspace. Ten state-of-the-art climate models were used to span a range of sensitivities of future temperature rises to increased greenhouse gas forcing, and the uncertainty in the emissions profiles themselves were quantified using three distinct Shared Socioeconomic Pathways, or SSPs.
Absolute projected changes in median TODR are small (approximately 50–110 m) with respect to total runway length for many of the airports considered, several of which have runways which are over 4 km long. However, due to changes in the distribution of daily-maximum temperatures, occurrences of recent-past extreme (1/100 day) take-off distances may occur up to half the time by mid-century. These changes may not adversely affect the ability of aircraft to safely operate within take-off distance limits, however they are likely to have impacts on ground operations such as runway maintenance and utilisation since some flights begin their acceleration at runway/taxiway intersections rather than at the runway extrema.
When an airport’s available runway length is shorter than that required for a maximally laden aircraft, weight restrictions must be applied to reduce the take-off distance required. The resulting reduction in passenger numbers has been quantified for four airports – Chios, Pantelleria, San Sebastian, and Rome Ciampino – and shows projected reductions of approximately 5–12 passengers per flight by 2065 compared to the historical reference period. When the probability of exceeding the 99th percentile of historical values is considered as a function of time, following an SSP1-2.6 trajectory of emissions enables this quantity to stabilise between 10–20% (indeed as does the passenger number restriction) but for higher emissions futures, values of up to 60% are possible. The values of the 99th percentile weight restriction (again compared to the historical mean) could exceed 20 passengers in some cases; that is, more than 10% of the seats in an Airbus A320.
Future work in this project will consider other aircraft and engine types as available from the openAP database; indeed the current model has already been used for the Boeing 737 and Embraer 190.
Thus far, we have employed pressure and temperature in our calculations, however, humidity changes may also affect take-off performance. As yet we have not considered these import effects and there is some evidence (e.g. [19]) that changes to water vapour amount (and hence humidity) may have a non-negligible effect on air density, and therefore on TODR and MTOM. In addition increased humidity will very likely affect passenger and ground crew comfort through changes to heat stress (e.g.[20]). A further – and crucial – meteorological factor is that of changing wind patterns affecting local ‘true air speed’. Effects of this type have been considered for certain Greek airport in Gratton et al. [3] but to the authors’ knowledge, a pan-European study of this kind has not been published.
Finally, work is also underway using the same study sites and models as used here to examine the effect of climate change on climb-rate-related safety parameters and noise pollution.
Author Contributions
Conceptualization, PDW; methodology, PDW; software, JW, FG, MV; validation, JW, FG, MV; formal analysis, JW, FG, MV; investigation, JW, PDW, FG, MV; resources, JW, FG, MV; data curation, JW, FG, MV; writing—original draft preparation, JW; writing—review and editing, JW, PDW, FG, MV; visualization, JW; supervision, PDW; project administration, PDW; funding acquisition, PDW. All authors have read and agreed to the published version of the manuscript.
Funding
The research work for this article is part of the AEROPLANE project which is supported by the SESAR 3 Joint Undertaking and its founding members over GA nr. 101114682.
Data Availability Statement
The raw data presented in the study are openly available in the Earth System grid Federation - ESGF – repository, [21].
Acknowledgments
We acknowledge the modelling groups that contributed their data to the Earth System Grid Federation database as part of CMIP6 and the computational services provided by the University of Reading’s RACC Linux cluster and associated research software engineering staff.
Conflicts of Interest
The authors declare no conflicts of interest. The funders had no role in the design of the study; in the collection, analyses, or interpretation of data; in the writing of the manuscript; or in the decision to publish the results.
Abbreviations
The following abbreviations are used in this manuscript:
| TODR | Take-off Distance Required |
| MTOM | Maximum Take-off Mass |
| CMIP6 | Coupled model Intercomparison Project, phase 6 |
| ICAO | International Civil Aviation Organization code |
Appendix A ICAO Airport Codes and Runway Lengths

Table A1.
Airport ICAO codes.
| Acronym | Description | Location |
|---|---|---|
| EBBR | Brussels Airport | Belgium |
| EDDF | Frankfurt am Main International Airport | Germany |
| EDDL | Dusseldorf International Airport | Germany |
| EDDM | Munich International Airport | Germany |
| EGKK | London Gatwick Airport | UK |
| EGLC | London City Airport | UK |
| EGLL | London Heathrow Airport | UK |
| EHAM | Amsterdam Airport Schiphol | Netherlands |
| EIDW | Dublin Airport | Ireland |
| EKCH | Copenhagen Kastrup Airport | Denmark |
| ENGM | Oslo Gardermoen Airport | Norway |
| ESSA | Stockholm-Arlanda Airport | Sweden |
| LEBL | Barcelona International Airport | Spain |
| LEMD | Madrid Barajas International Airport | Spain |
| LEPA | Palma De Mallorca Airport | Spain |
| LESO | San Sebastian Airport | Spain |
| LFPG | Charles de Gaulle International Airport | France |
| LFPO | Paris-Orly Airport | France |
| LGAV | Eleftherios Venizelos International Airport | Greece |
| LGHI | Chios Island National Airport | Greece |
| LICG | Pantelleria Airport | Italy |
| LIMC | Malpensa International Airport | Italy |
| LIRF | Leonardo Da Vinci (Fiumicino) International Airport | Italy |
| LIRA | Ciampino Airport | Italy |
| LOWW | Vienna International Airport | Austria |
| LPPT | Lisbon Portela Airport | Portugal |
| LSZH | Zurich Airport | Switzerland |
| LTAI | Antalya International Airport | Turkey |
| LTFJ | Sabiha Gokcen International Airport | Turkey |
| LTFM | Istanbul Airport | Turkey |
Table A2.
Runway lengths for all airports considered in this study in metres.
| Airport Code | Runway Length (m) |
|---|---|
| EGLC | 1508 |
| LGHI | 1511 |
| LICG | 1675 |
| LESO | 1800 |
| LIRA | 2203 |
| EDDL | 3000 |
| EIDW | 3110 |
| ESSA | 3301 |
| EGKK | 3316 |
| LEPA | 3354 |
| LTAI | 3400 |
| LTFJ | 3500 |
| EKCH | 3600 |
| ENGM | 3600 |
| LOWW | 3600 |
| EBBR | 3638 |
| LFPO | 3650 |
| LSZH | 3700 |
| LPPT | 3705 |
| LEBL | 3743 |
| EHAM | 3800 |
| LIRF | 3900 |
| EGLL | 3902 |
| LIMC | 3920 |
| EDDF | 4000 |
| EDDM | 4000 |
| LGAV | 4000 |
| LTFM | 4100 |
| LFPG | 4200 |
| LEMD | 4350 |
Appendix B Climate models used
Table A3.
Climate models used.
| Model | description |
|---|---|
| ACCESS-ESM1-5 | CSIRO Commonwealth Scientific and Industrial Research Organisation, Australia |
| CMCC-ESM2 | CMCC Centro Euro Mediterraneo sui Cambiamenti Climatici, Italy |
| CNRM-ESM2-1 | CNRM Centre National de Recherches Météorologiques and CERFACS Centre Européen de Recherche et de Formation Avancée en Calcul Scientifique, France |
| CanESM5 | CCCMa Canadian Centre for Climate Modelling and Analysis, Canada |
| EC-Earth3 | EC-Earth Consortium Europe |
| GFDL-ESM4 | NOAA-GFDL National Oceanic and Atmospheric Administration, Geophysical Fluid Dynamics Laboratory, USA |
| IPSL-CM6A-LR | IPSL Institut Pierre Simon Laplace, France |
| MPI-ESM1-2-LR | MPI-M Max Planck Institute for Meteorology, Germany |
| NorESM2-LM | NCC NorESM Climate Modelling Consortium, Norway |
| UKESM1-0-LL | MOHC Met Office Hadley Centre, UK |
References
- World Economic Forum., 2016. Accessed: 2024-11-25.
- EUROCONTROL. EUROCONTROL Aviation Outlook 2050, 2022. Accessed: 2024-11-25.
- Gratton, G.; Padhra, A.; Rapsomanikis, S.; Williams, P.D. The impacts of climate change on Greek airports. Climatic Change 2020, 160, 219–231. [Google Scholar] [CrossRef]
- Coffel, E.; Horton, R. Climate Change and the Impact of Extreme Temperatures on Aviation. Weather, Climate, and Society 2015, 7, 94–102. [Google Scholar] [CrossRef]
- Coffel, E.D.; Thompson, T.R.; Horton, R.M. The impacts of rising temperatures on aircraft takeoff performance. Climatic Change 2017, 144, 381–388. [Google Scholar] [CrossRef]
- Wang, K.; Peng, X.; Dan, B.; Liu, H.; Cheng, S.; Fu, N.; Fu, H.; Liu, C. Decreased Aircraft Takeoff Performance under Global Warming. Atmosphere 2023, 14. [Google Scholar] [CrossRef]
- Abram, N.e.a., IPCC Special Report on the Ocean and Cryosphere in a Changing Climate. In The Ocean and Cryosphere in a Changing Climate; Cambridge University Press, 2022; chapter Framing and Context of the Report, p. 73–130. [CrossRef]
- Van Vuuren, D.P.; Stehfest, E.; Gernaat, D.E.; Doelman, J.C.; Van den Berg, M.; Harmsen, M.; de Boer, H.S.; Bouwman, L.F.; Daioglou, V.; Edelenbosch, O.Y.; others. Energy, land-use and greenhouse gas emissions trajectories under a green growth paradigm. Global environmental change 2017, 42, 237–250. [Google Scholar] [CrossRef]
- Fujimori, S.; Hasegawa, T.; Masui, T.; Takahashi, K.; Herran, D.S.; Dai, H.; Hijioka, Y.; Kainuma, M. SSP3: AIM implementation of shared socioeconomic pathways. Global Environmental Change 2017, 42, 268–283. [Google Scholar] [CrossRef]
- Kriegler, E.; Bauer, N.; Popp, A.; Humpenöder, F.; Leimbach, M.; Strefler, J.; Baumstark, L.; Bodirsky, B.L.; Hilaire, J.; Klein, D.; others. Fossil-fueled development (SSP5): An energy and resource intensive scenario for the 21st century. Global environmental change 2017, 42, 297–315. [Google Scholar] [CrossRef]
- EUROCONTROL. Performance Review Report 2019. Technical report, Performance Review Commission, 2020.
- Kang, X.; Zhao, G.; Song, H.; Zeng, X. Analysis of Density Altitude Characteristics at Chinese Airports. Atmosphere 2023, 14, 1784. [Google Scholar] [CrossRef]
- Trentini, L.; Dal Gesso, S.; Venturini, M.; Guerrini, F.; Calmanti, S.; Petitta, M. A Novel Bias Correction Method for Extreme Events. Climate 2022, 11, 3. [Google Scholar] [CrossRef]
- European Union Aviation Safety Agency. Easy Access Rules for Large Aeroplanes (CS-25), 2023. Accessed: 2024-12-18.
- Sun, J.; Hoekstra, J.M.; Ellerbroek, J. OpenAP: An Open-Source Aircraft Performance Model for Air Transportation Studies and Simulations. Aerospace 2020, 7, 104. [Google Scholar] [CrossRef]
- Sun, J.; Ellerbroek, J.; Hoekstra, J.M. WRAP: An open-source kinematic aircraft performance model. Transportation Research Part C: Emerging Technologies 2019, 98, 118–138. [Google Scholar] [CrossRef]
- Zhang, Y.; Li, Q.; Ge, Y.; Du, X.; Wang, H. Growing prevalence of heat over cold extremes with overall milder extremes and multiple successive events. Communications Earth & Environment 2022, 3. [Google Scholar] [CrossRef]
- Zelinka, M.D.; Myers, T.A.; McCoy, D.T.; Po-Chedley, S.; Caldwell, P.M.; Ceppi, P.; Klein, S.A.; Taylor, K.E. Causes of Higher Climate Sensitivity in CMIP6 Models. Geophysical Research Letters 2020, 47, e2019GL085782. [Google Scholar] [CrossRef]
- Yuan, W.; Dai, P.; Xu, M.; Song, W.; Zhang, P. Estimating the Impact of Global Warming on Aircraft Takeoff Performance in China. Atmosphere 2021, 12, 1472. [Google Scholar] [CrossRef]
- Willett, K.M. HadISDH.extremes Part I: A Gridded Wet Bulb Temperature Extremes Index Product for Climate Monitoring. Advances in Atmospheric Sciences 2023, 40, 1952–1967. [Google Scholar] [CrossRef]
- Eyring, V.; Bony, S.; Meehl, G.A.; Senior, C.A.; Stevens, B.; Stouffer, R.J.; Taylor, K.E. Overview of the Coupled Model Intercomparison Project Phase 6 (CMIP6) experimental design and organization. Geoscientific Model Development 2016, 9, 1937–1958. [Google Scholar] [CrossRef]
- Gutiérrez, J.M.; Treguier, A.M.; Durack, P.J.; Emori, S.; Nowicki, S.; Ruiz, L.; Sierra, J.D.; Guilyardi, E.; Satoh, Y.; Stockhause, M., Climate Change 2021: The Physical Science Basis. Contribution of Working Group I to the Sixth Assessment Report of the Intergovernmental Panel on Climate Change; Cambridge University Press, 2023; chapter AII - Annex II: Models, p. 2087–2138. [CrossRef]
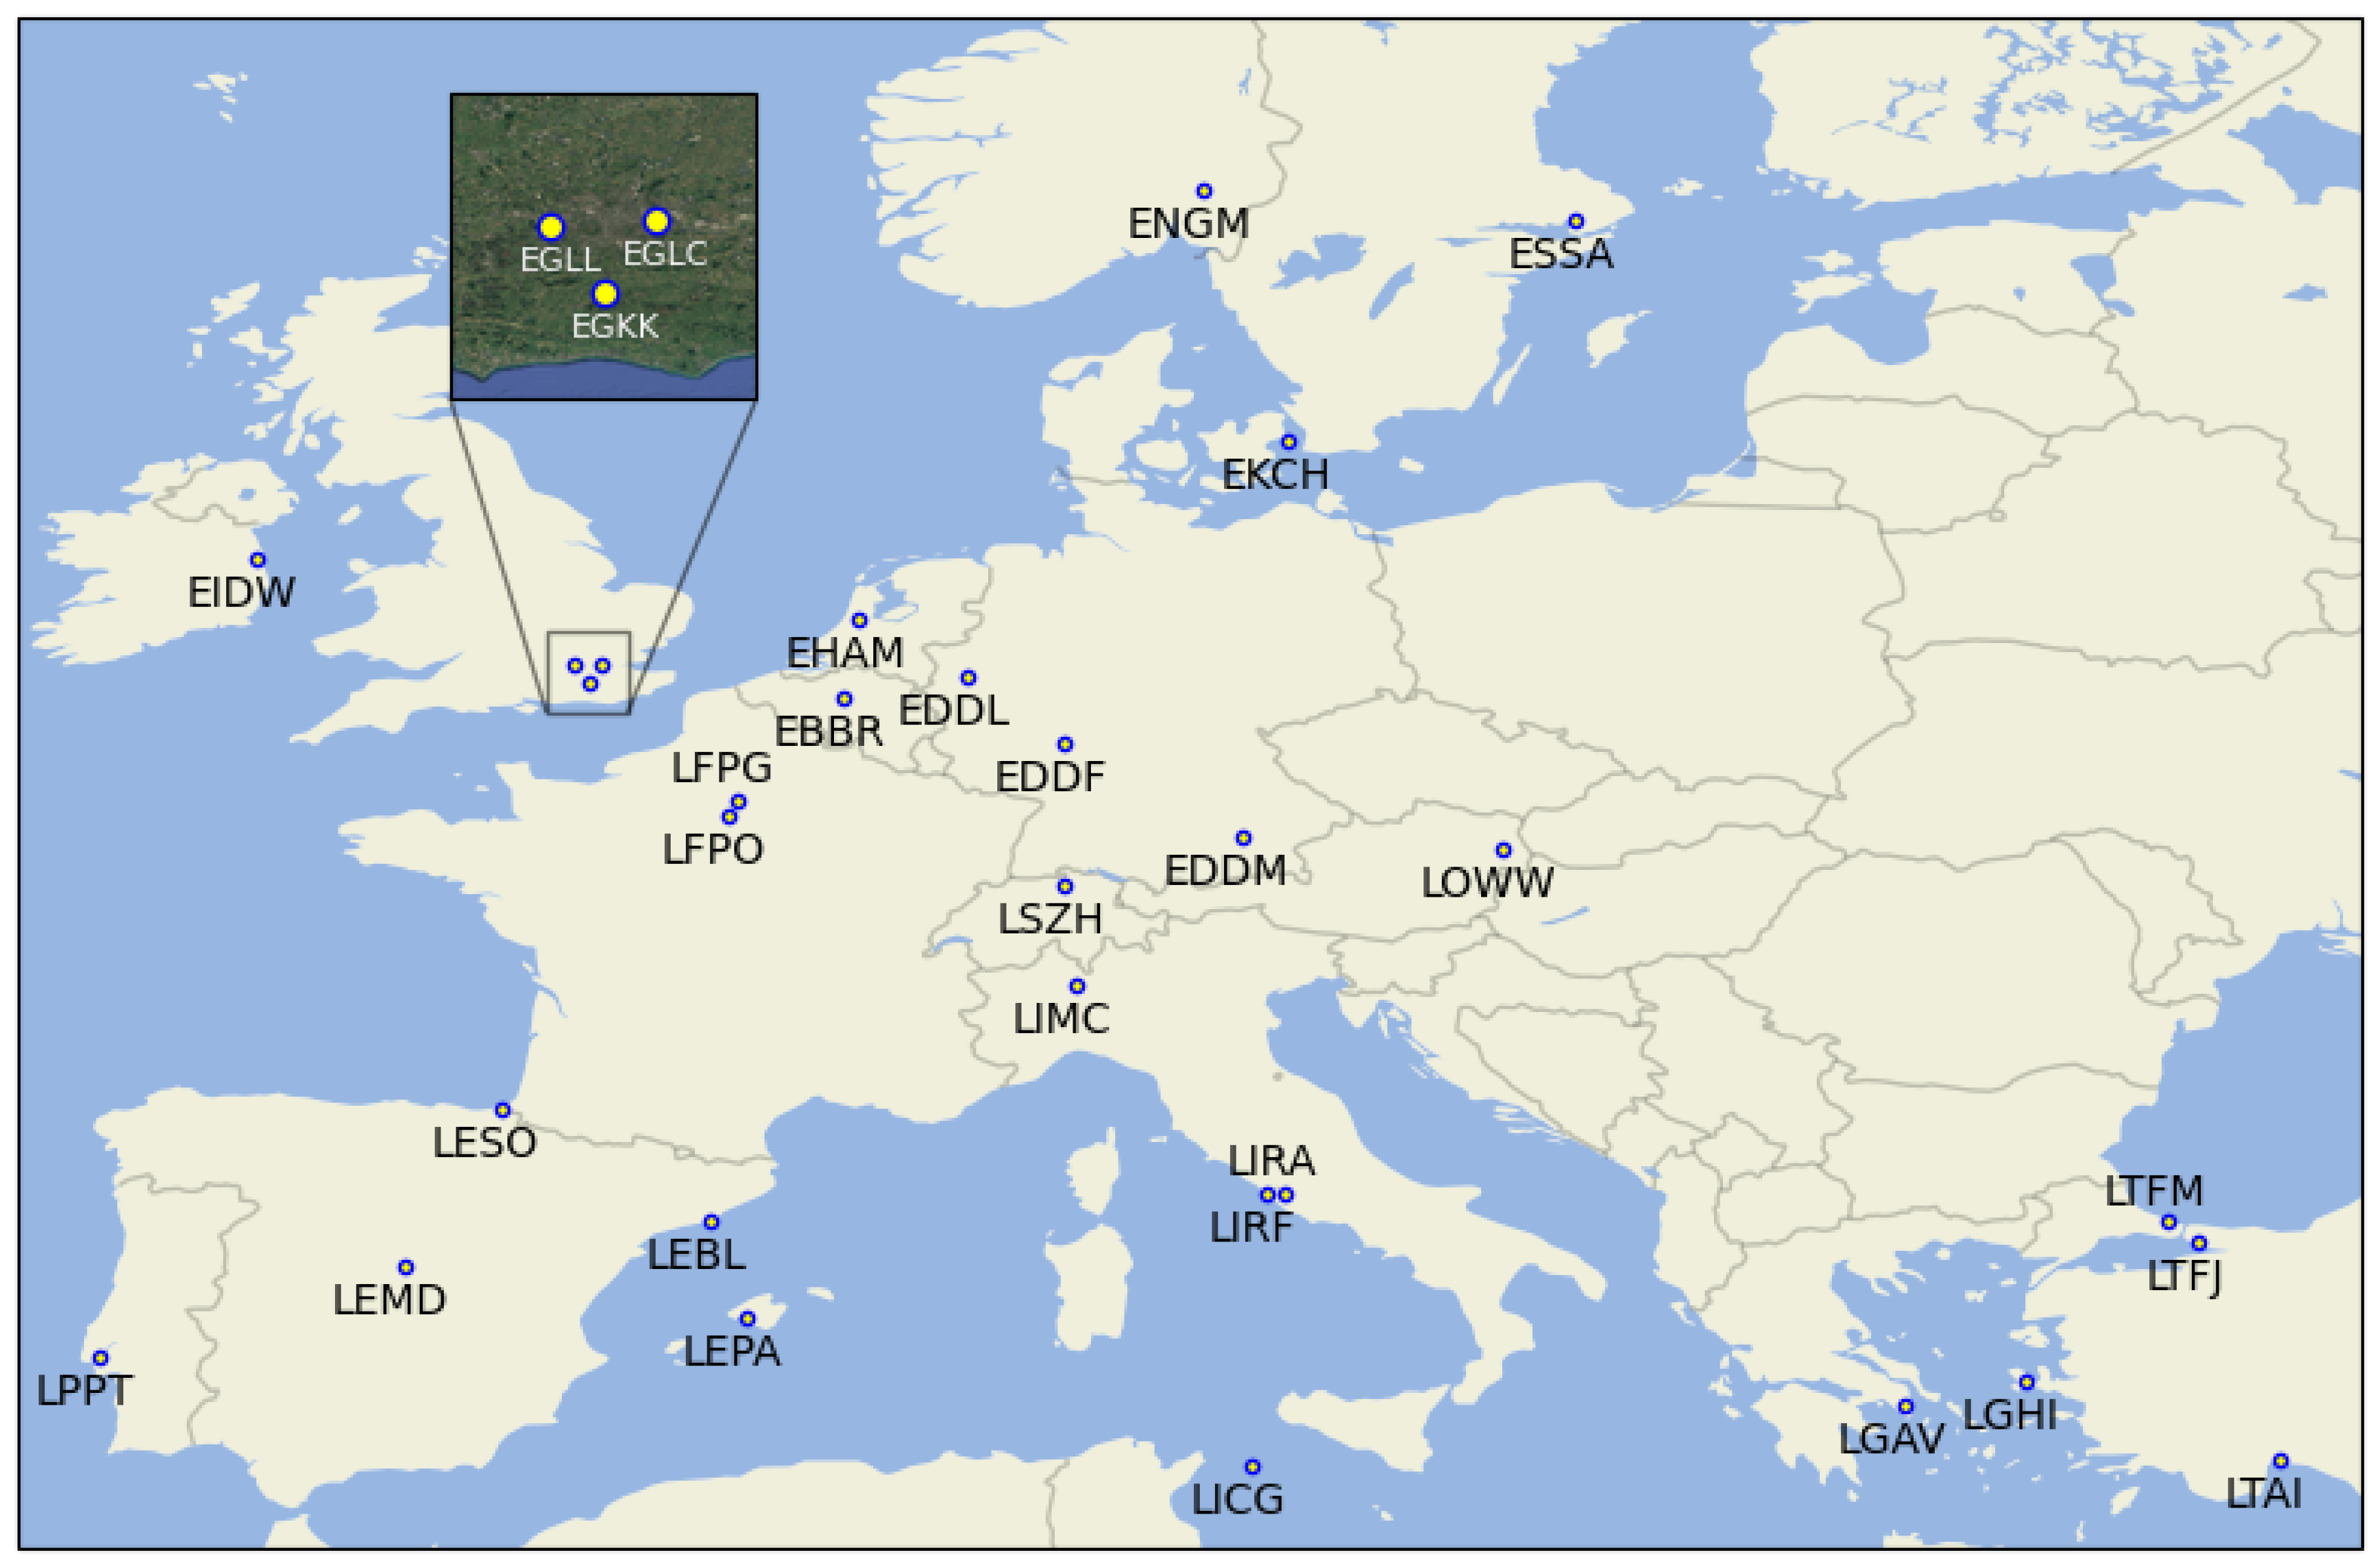
Figure 2.
Angles and forces involved in TODR calculation; is the angle between the runway and the local horizontal plane and is the take-off angle between the flight path and the runway.
Figure 2.
Angles and forces involved in TODR calculation; is the angle between the runway and the local horizontal plane and is the take-off angle between the flight path and the runway.
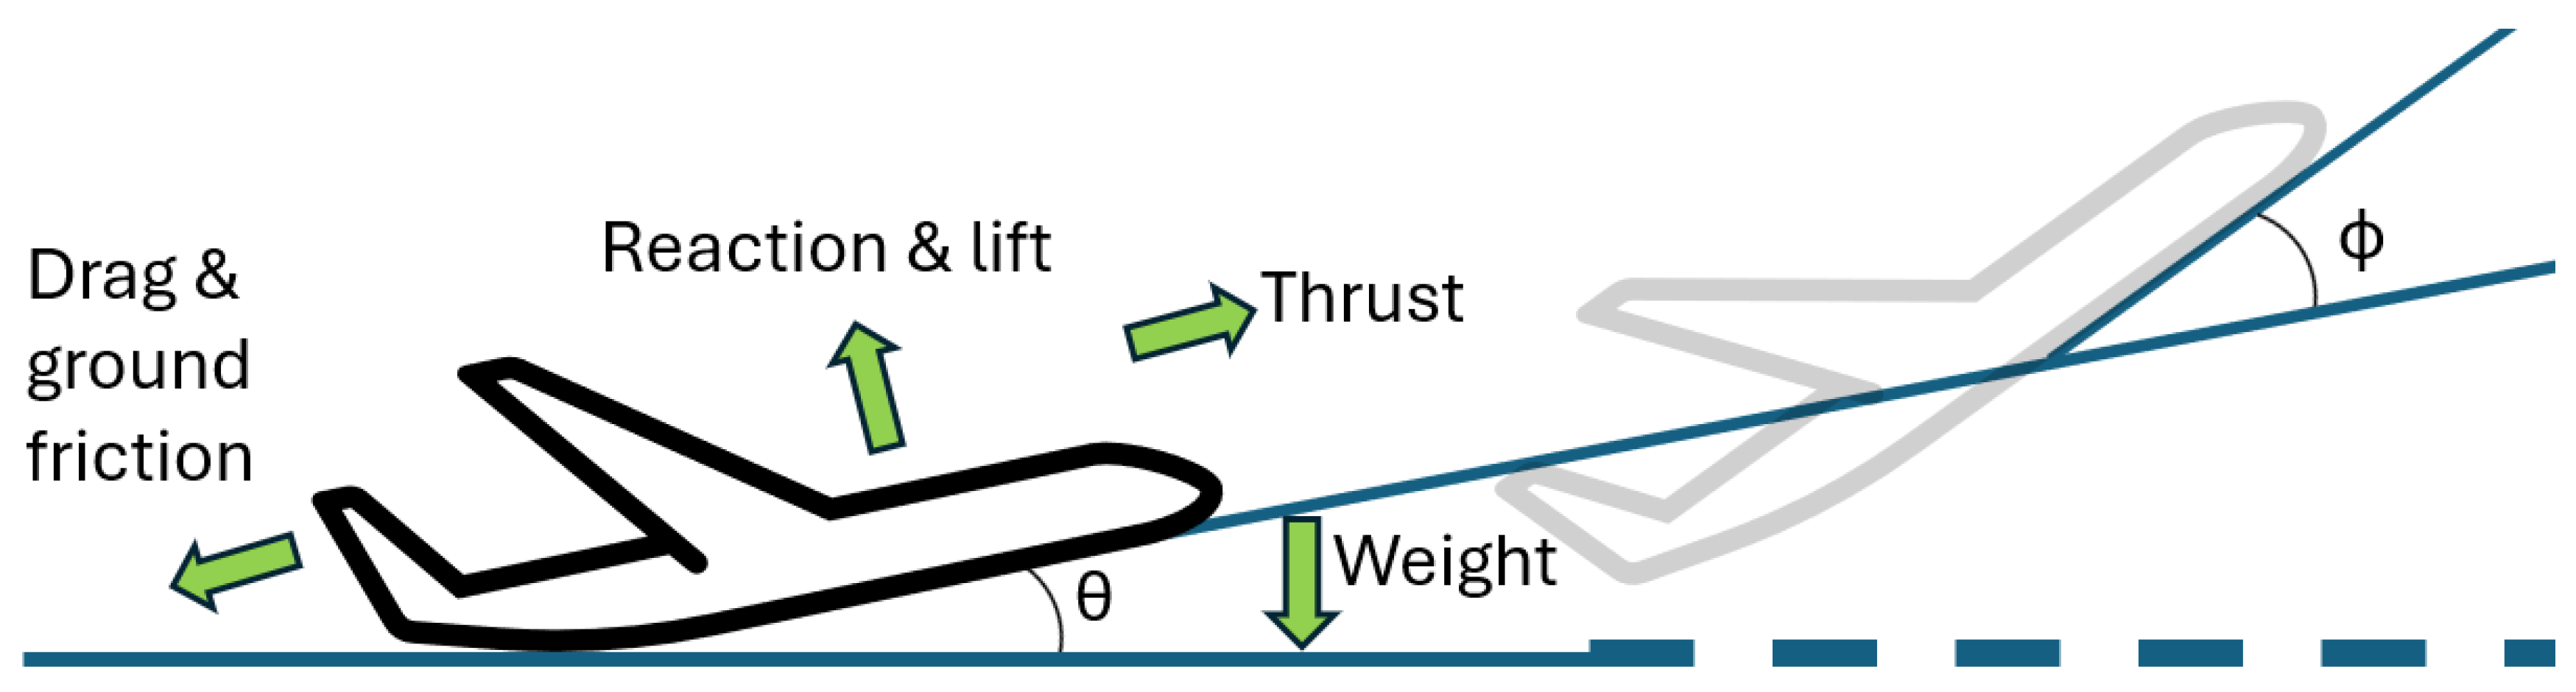
Figure 3.
TODR as a function of mass for the Gratton et al. [3] study and the calculations done in this study. Manufacturer values are also shown.
Figure 3.
TODR as a function of mass for the Gratton et al. [3] study and the calculations done in this study. Manufacturer values are also shown.
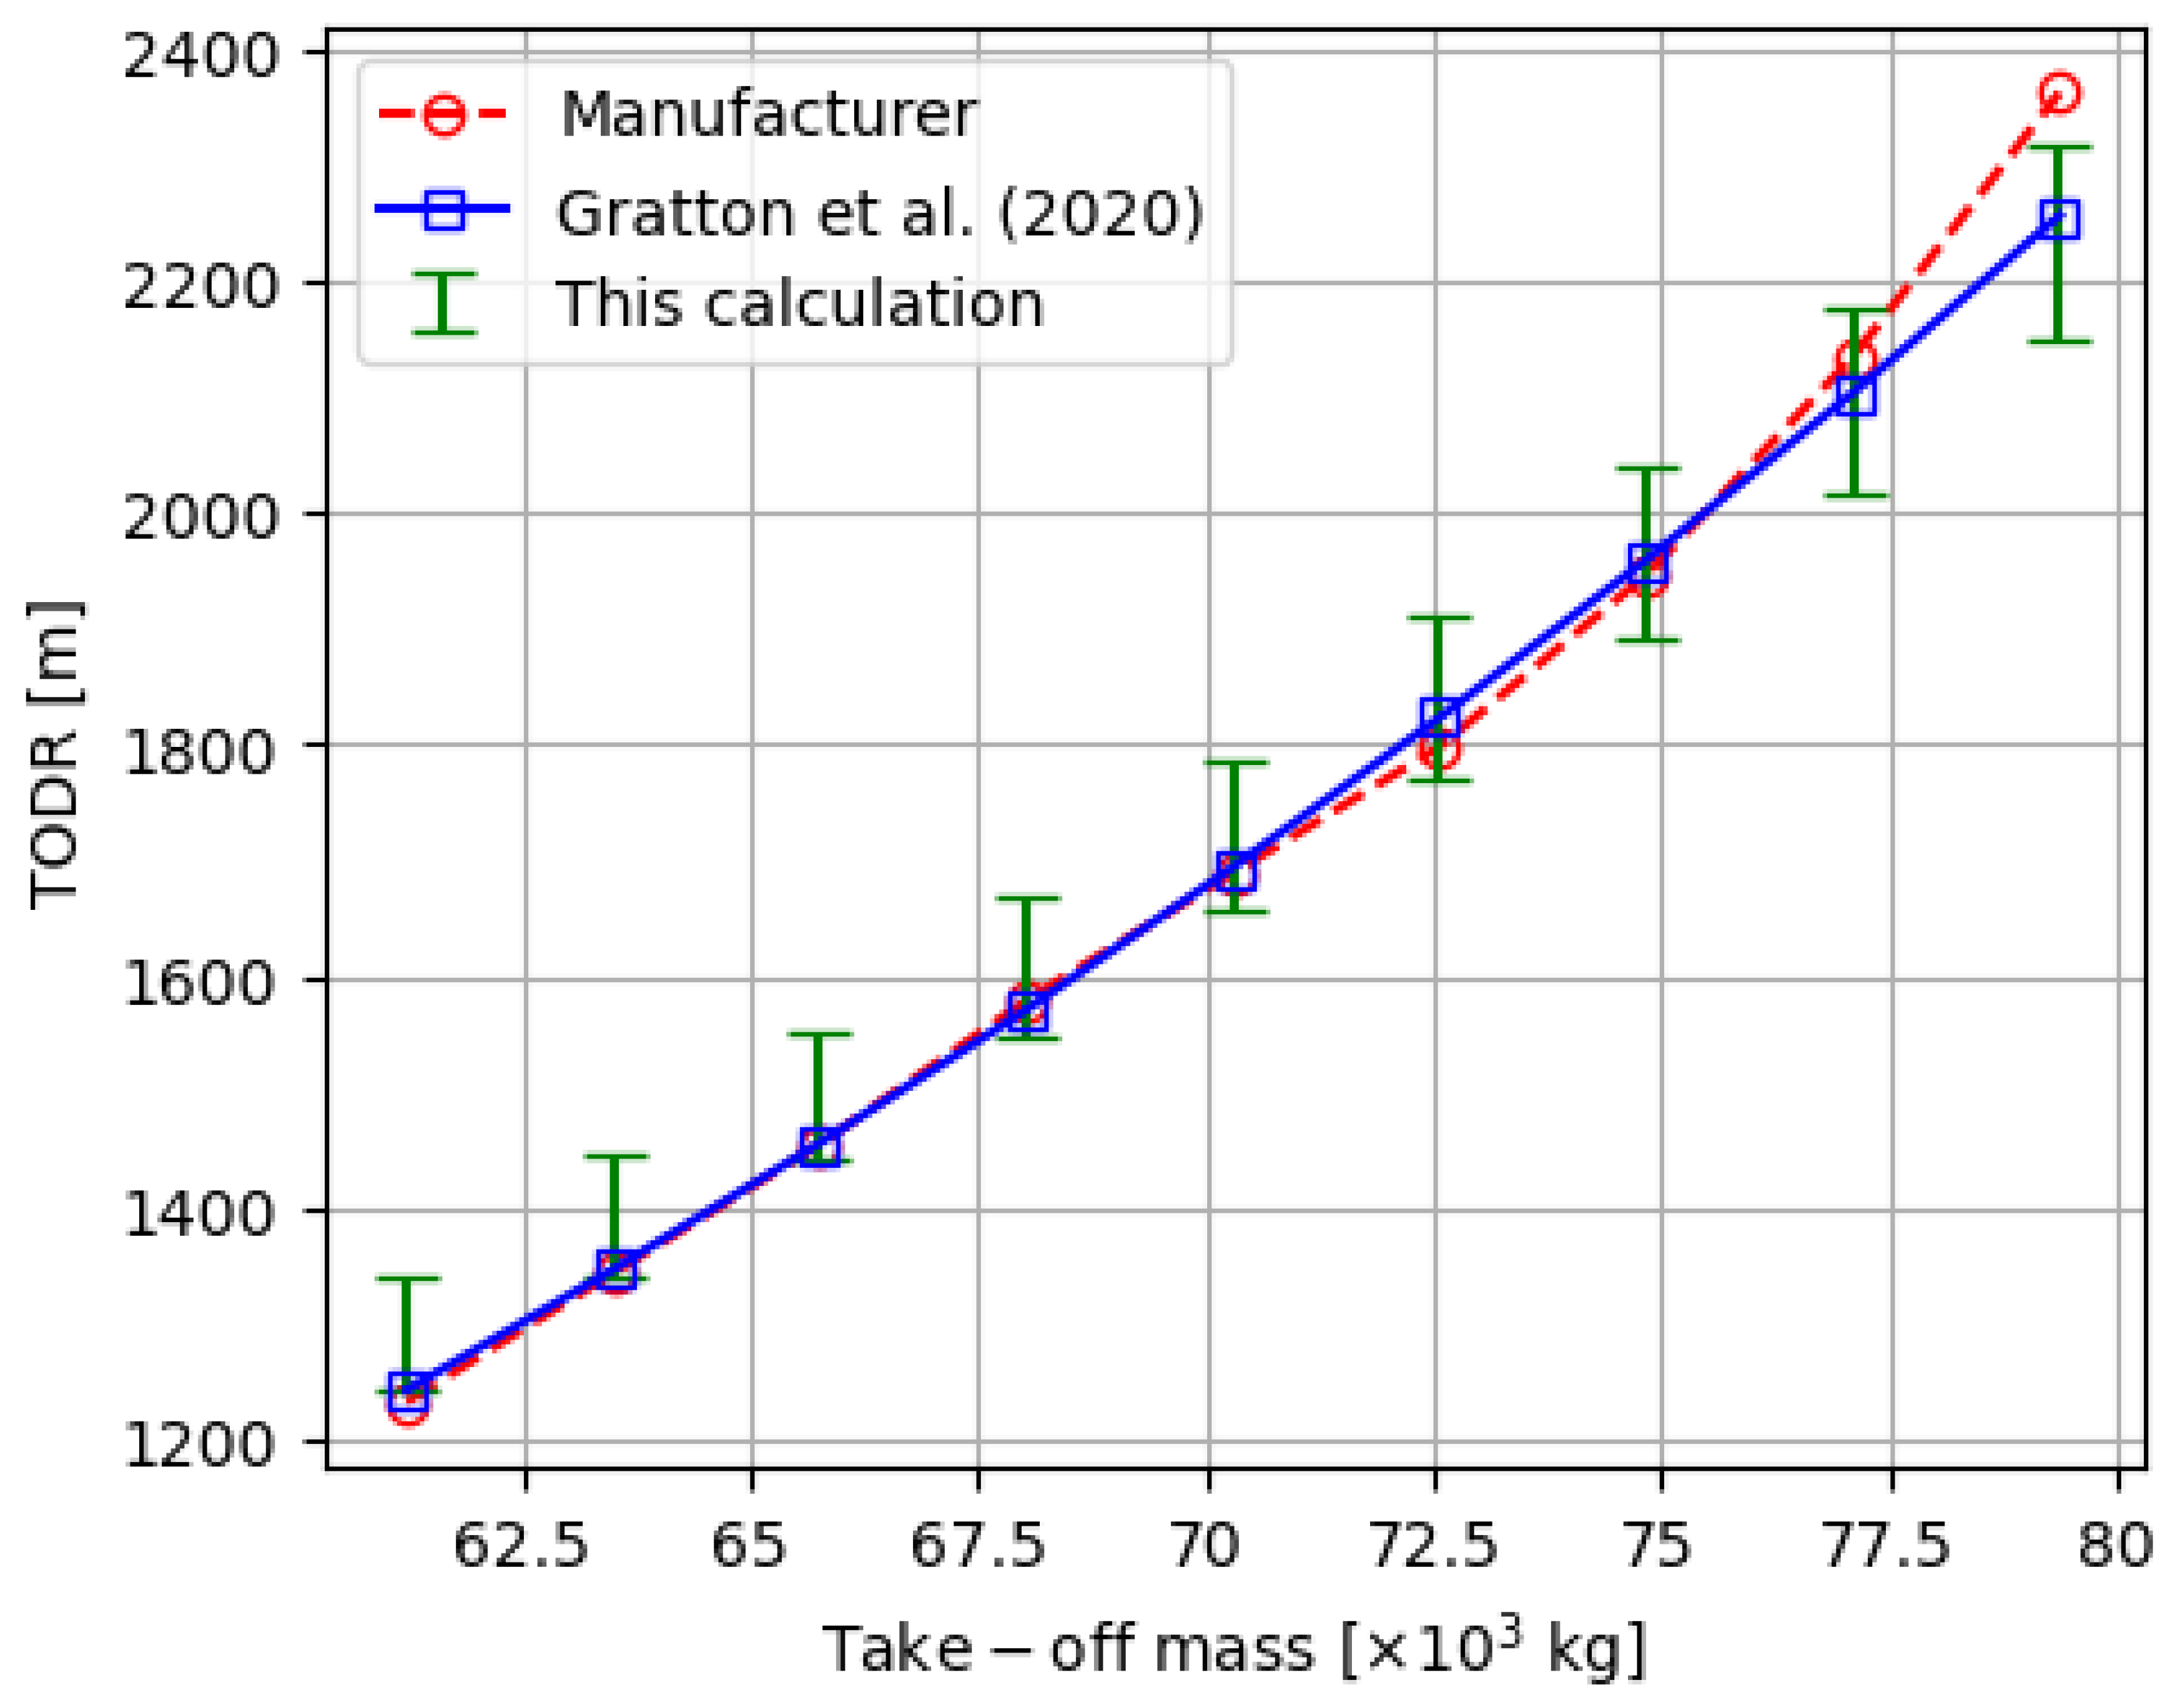
Figure 4.
Distributions of TODR for Heathrow airport and UKESM1-0-LL for JJA. Data which lie more than 1.5 times the inter-quartile range away from the median are explicitly shown.
Figure 4.
Distributions of TODR for Heathrow airport and UKESM1-0-LL for JJA. Data which lie more than 1.5 times the inter-quartile range away from the median are explicitly shown.
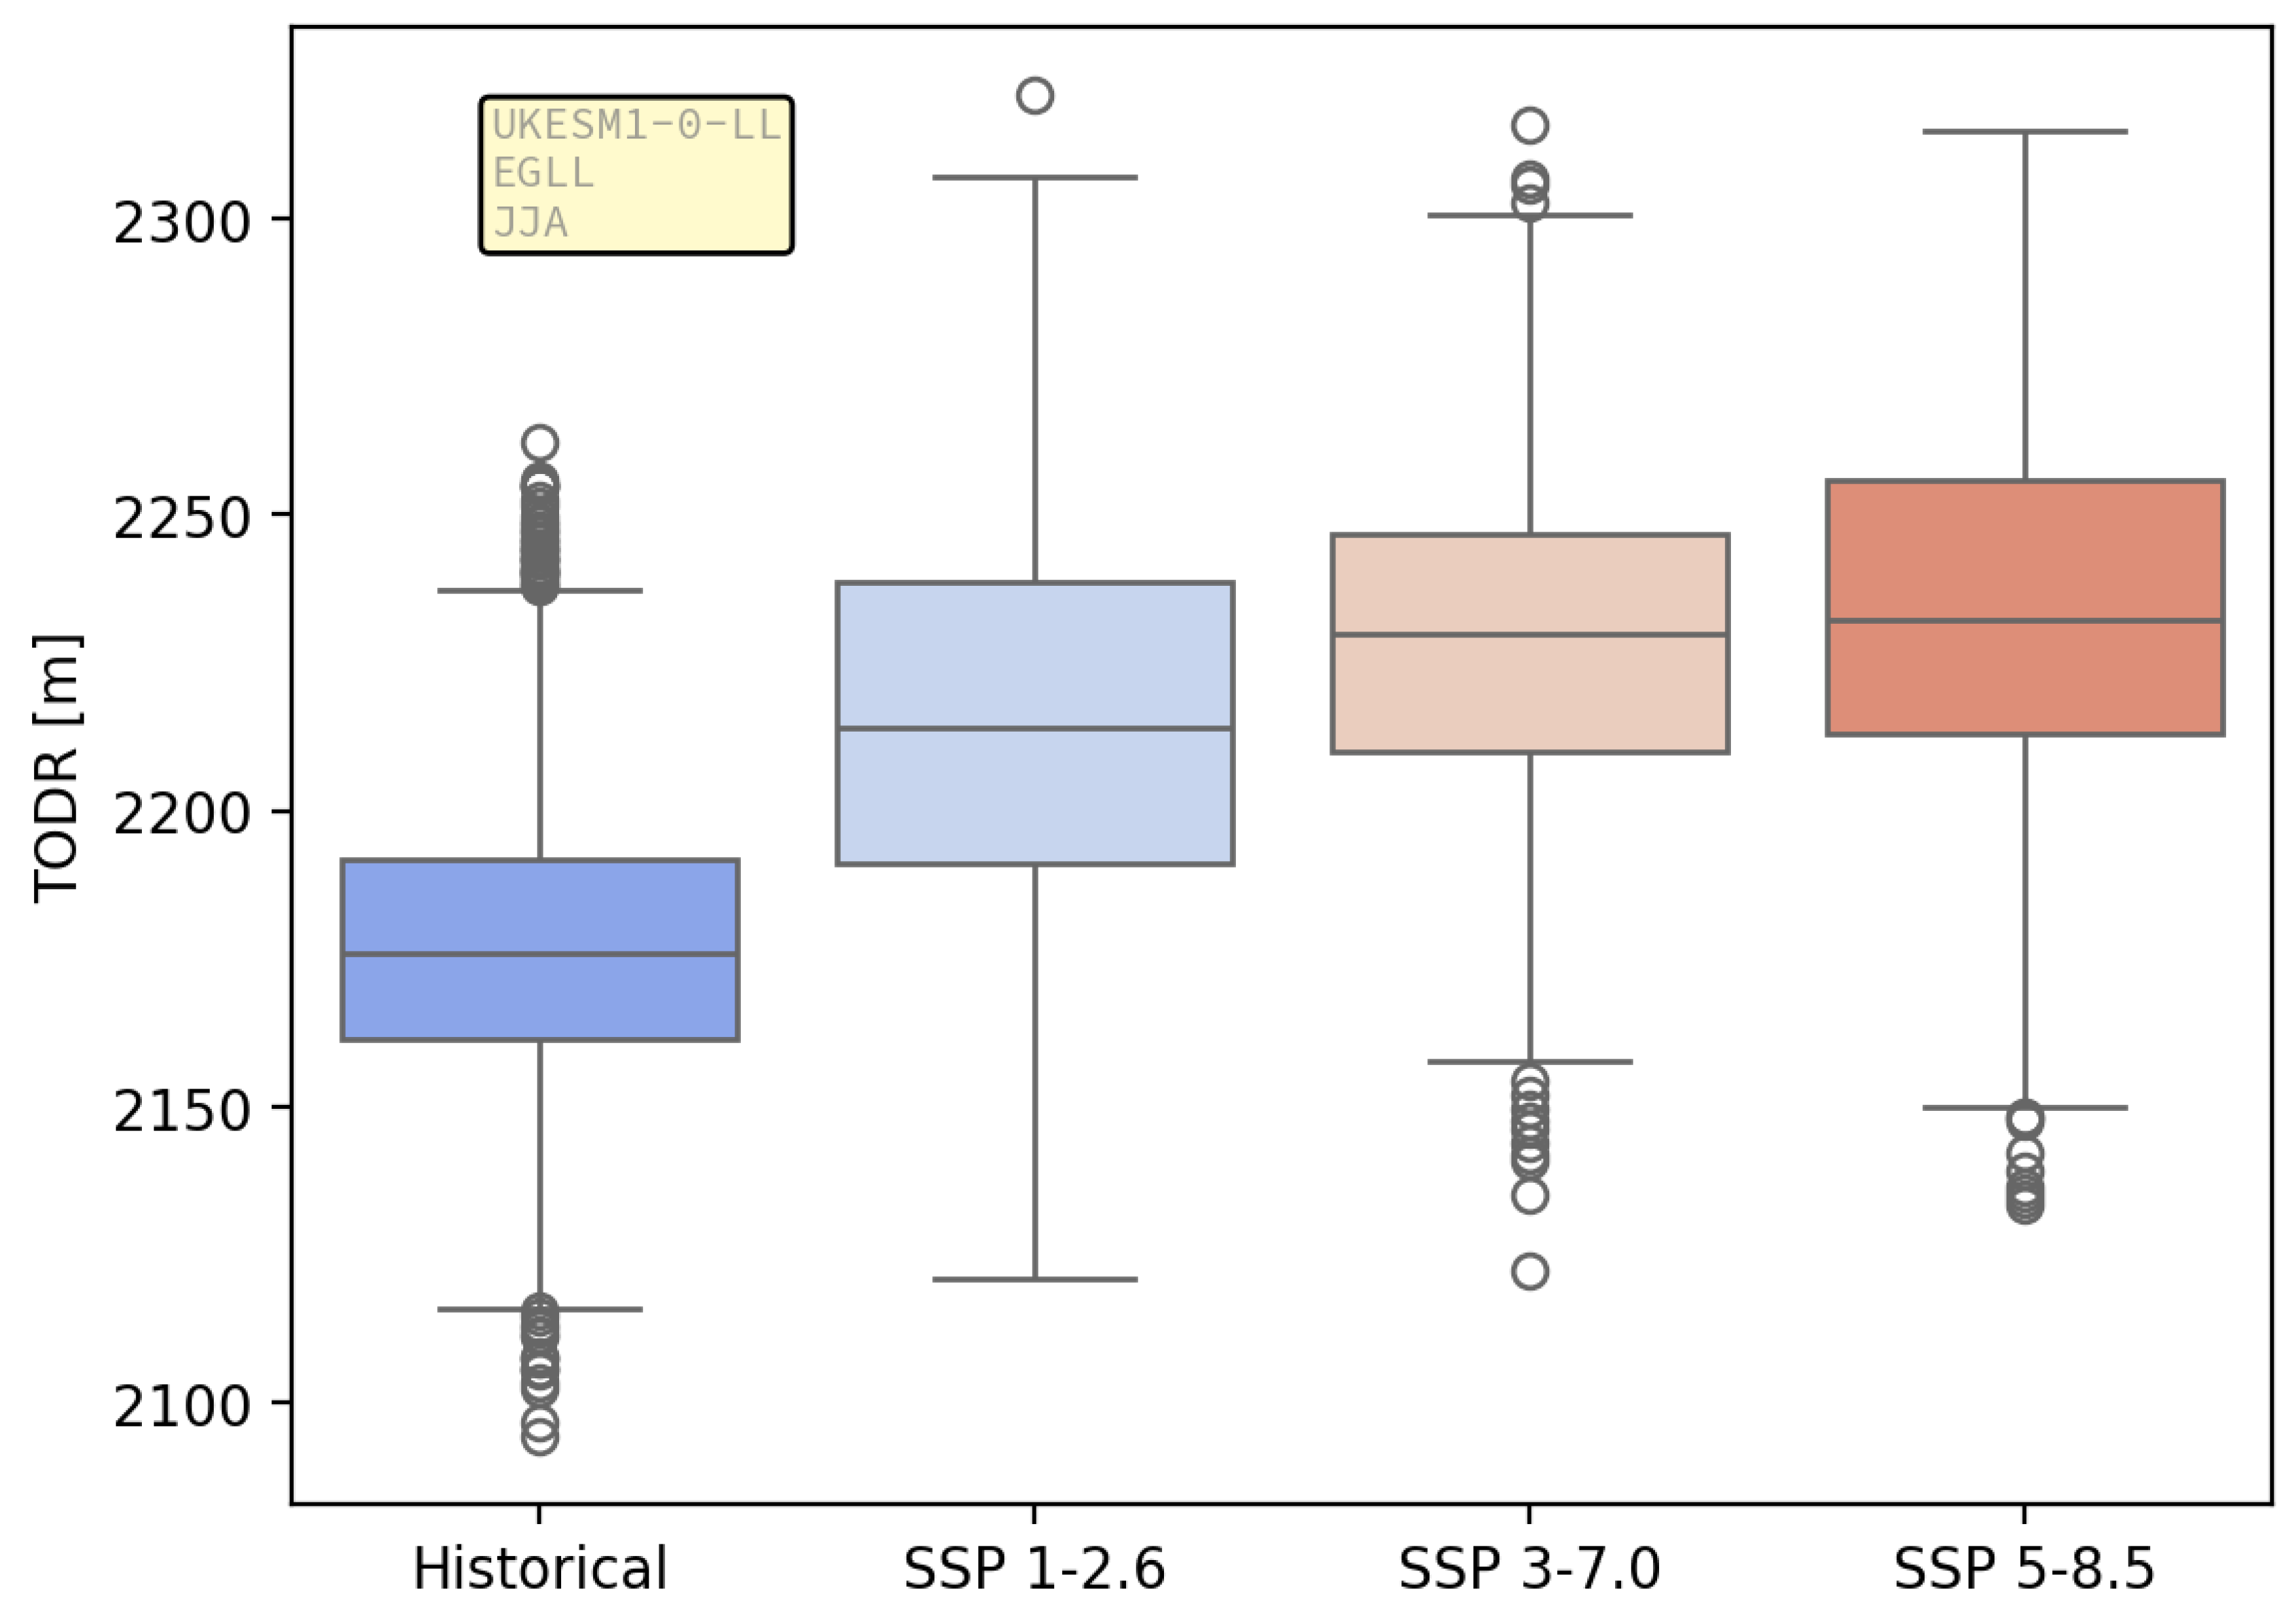
Figure 5.
As for Figure 4 but for the ACCESS-ESM1-5 model and Brussels Airport.
Figure 5.
As for Figure 4 but for the ACCESS-ESM1-5 model and Brussels Airport.
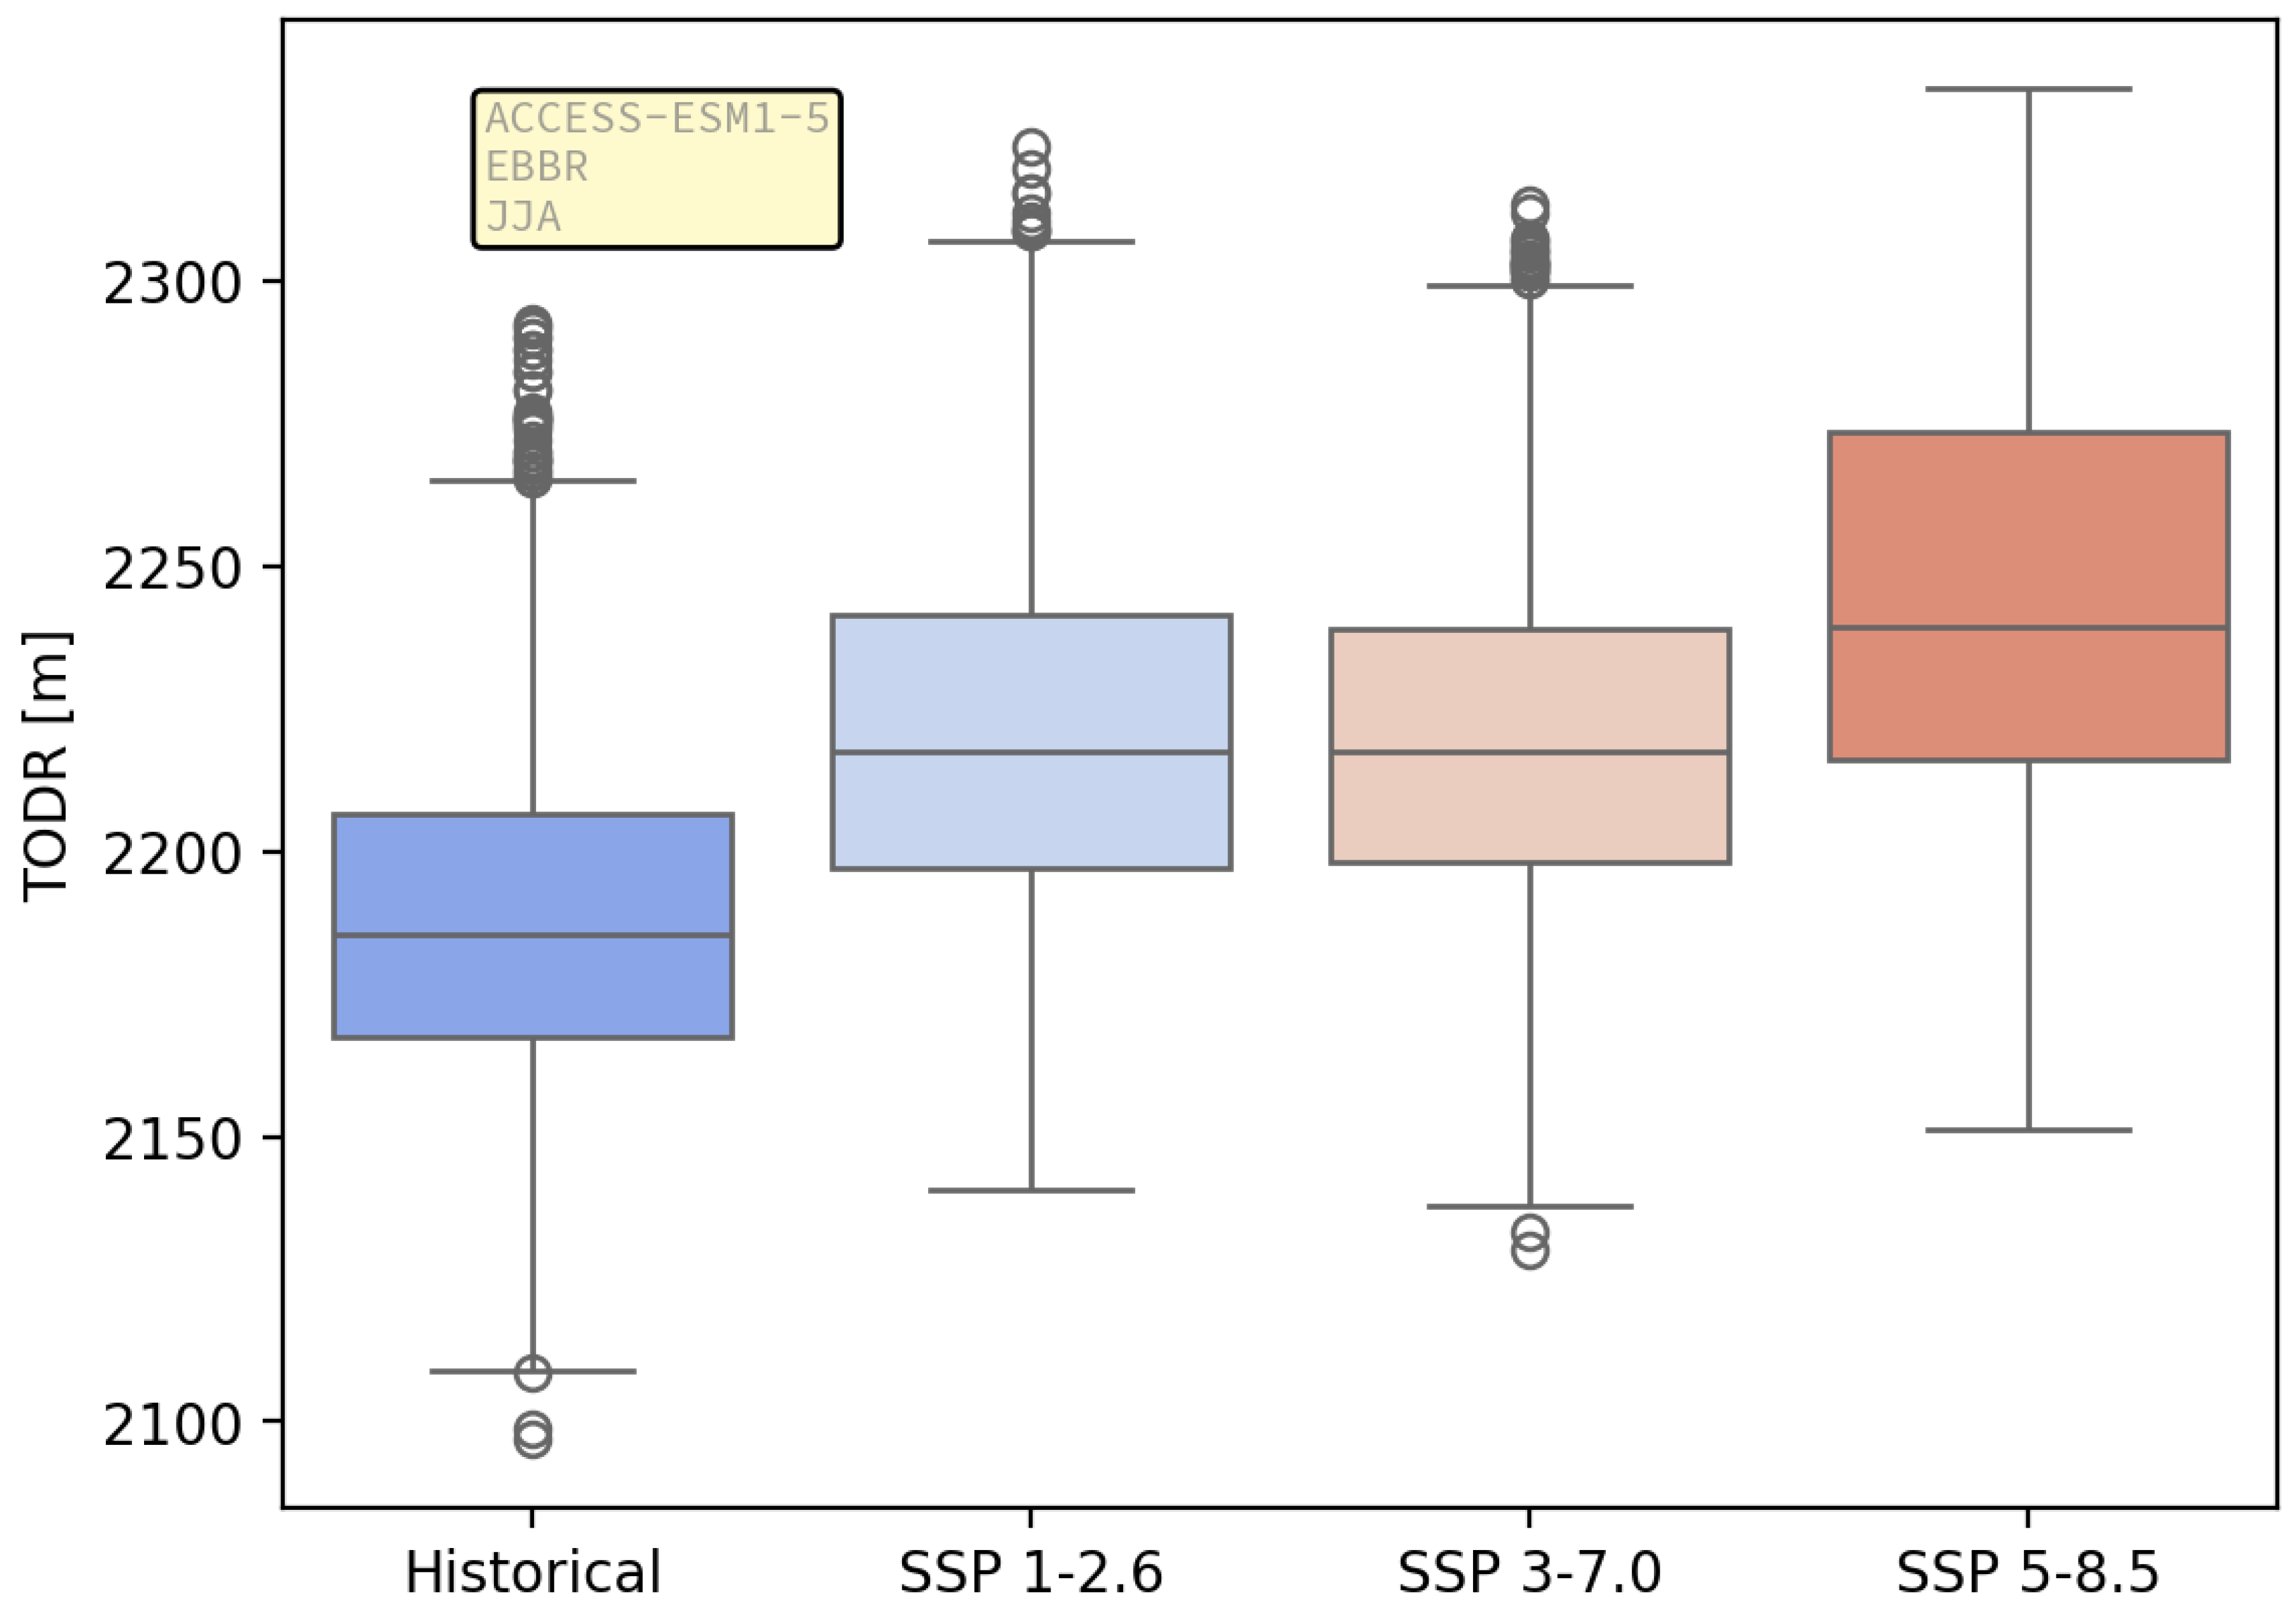
Figure 6.
Normalised histograms (bars) kernel density estimation plots (lines) of TODR (right) and 24 hour daily maximum temperature (left) for the historical period (bottom) and for increasing forcing which increases in the vertical direction for JJA. The arrows are guides to the eye, indicating increased greenhouse gas forcing.
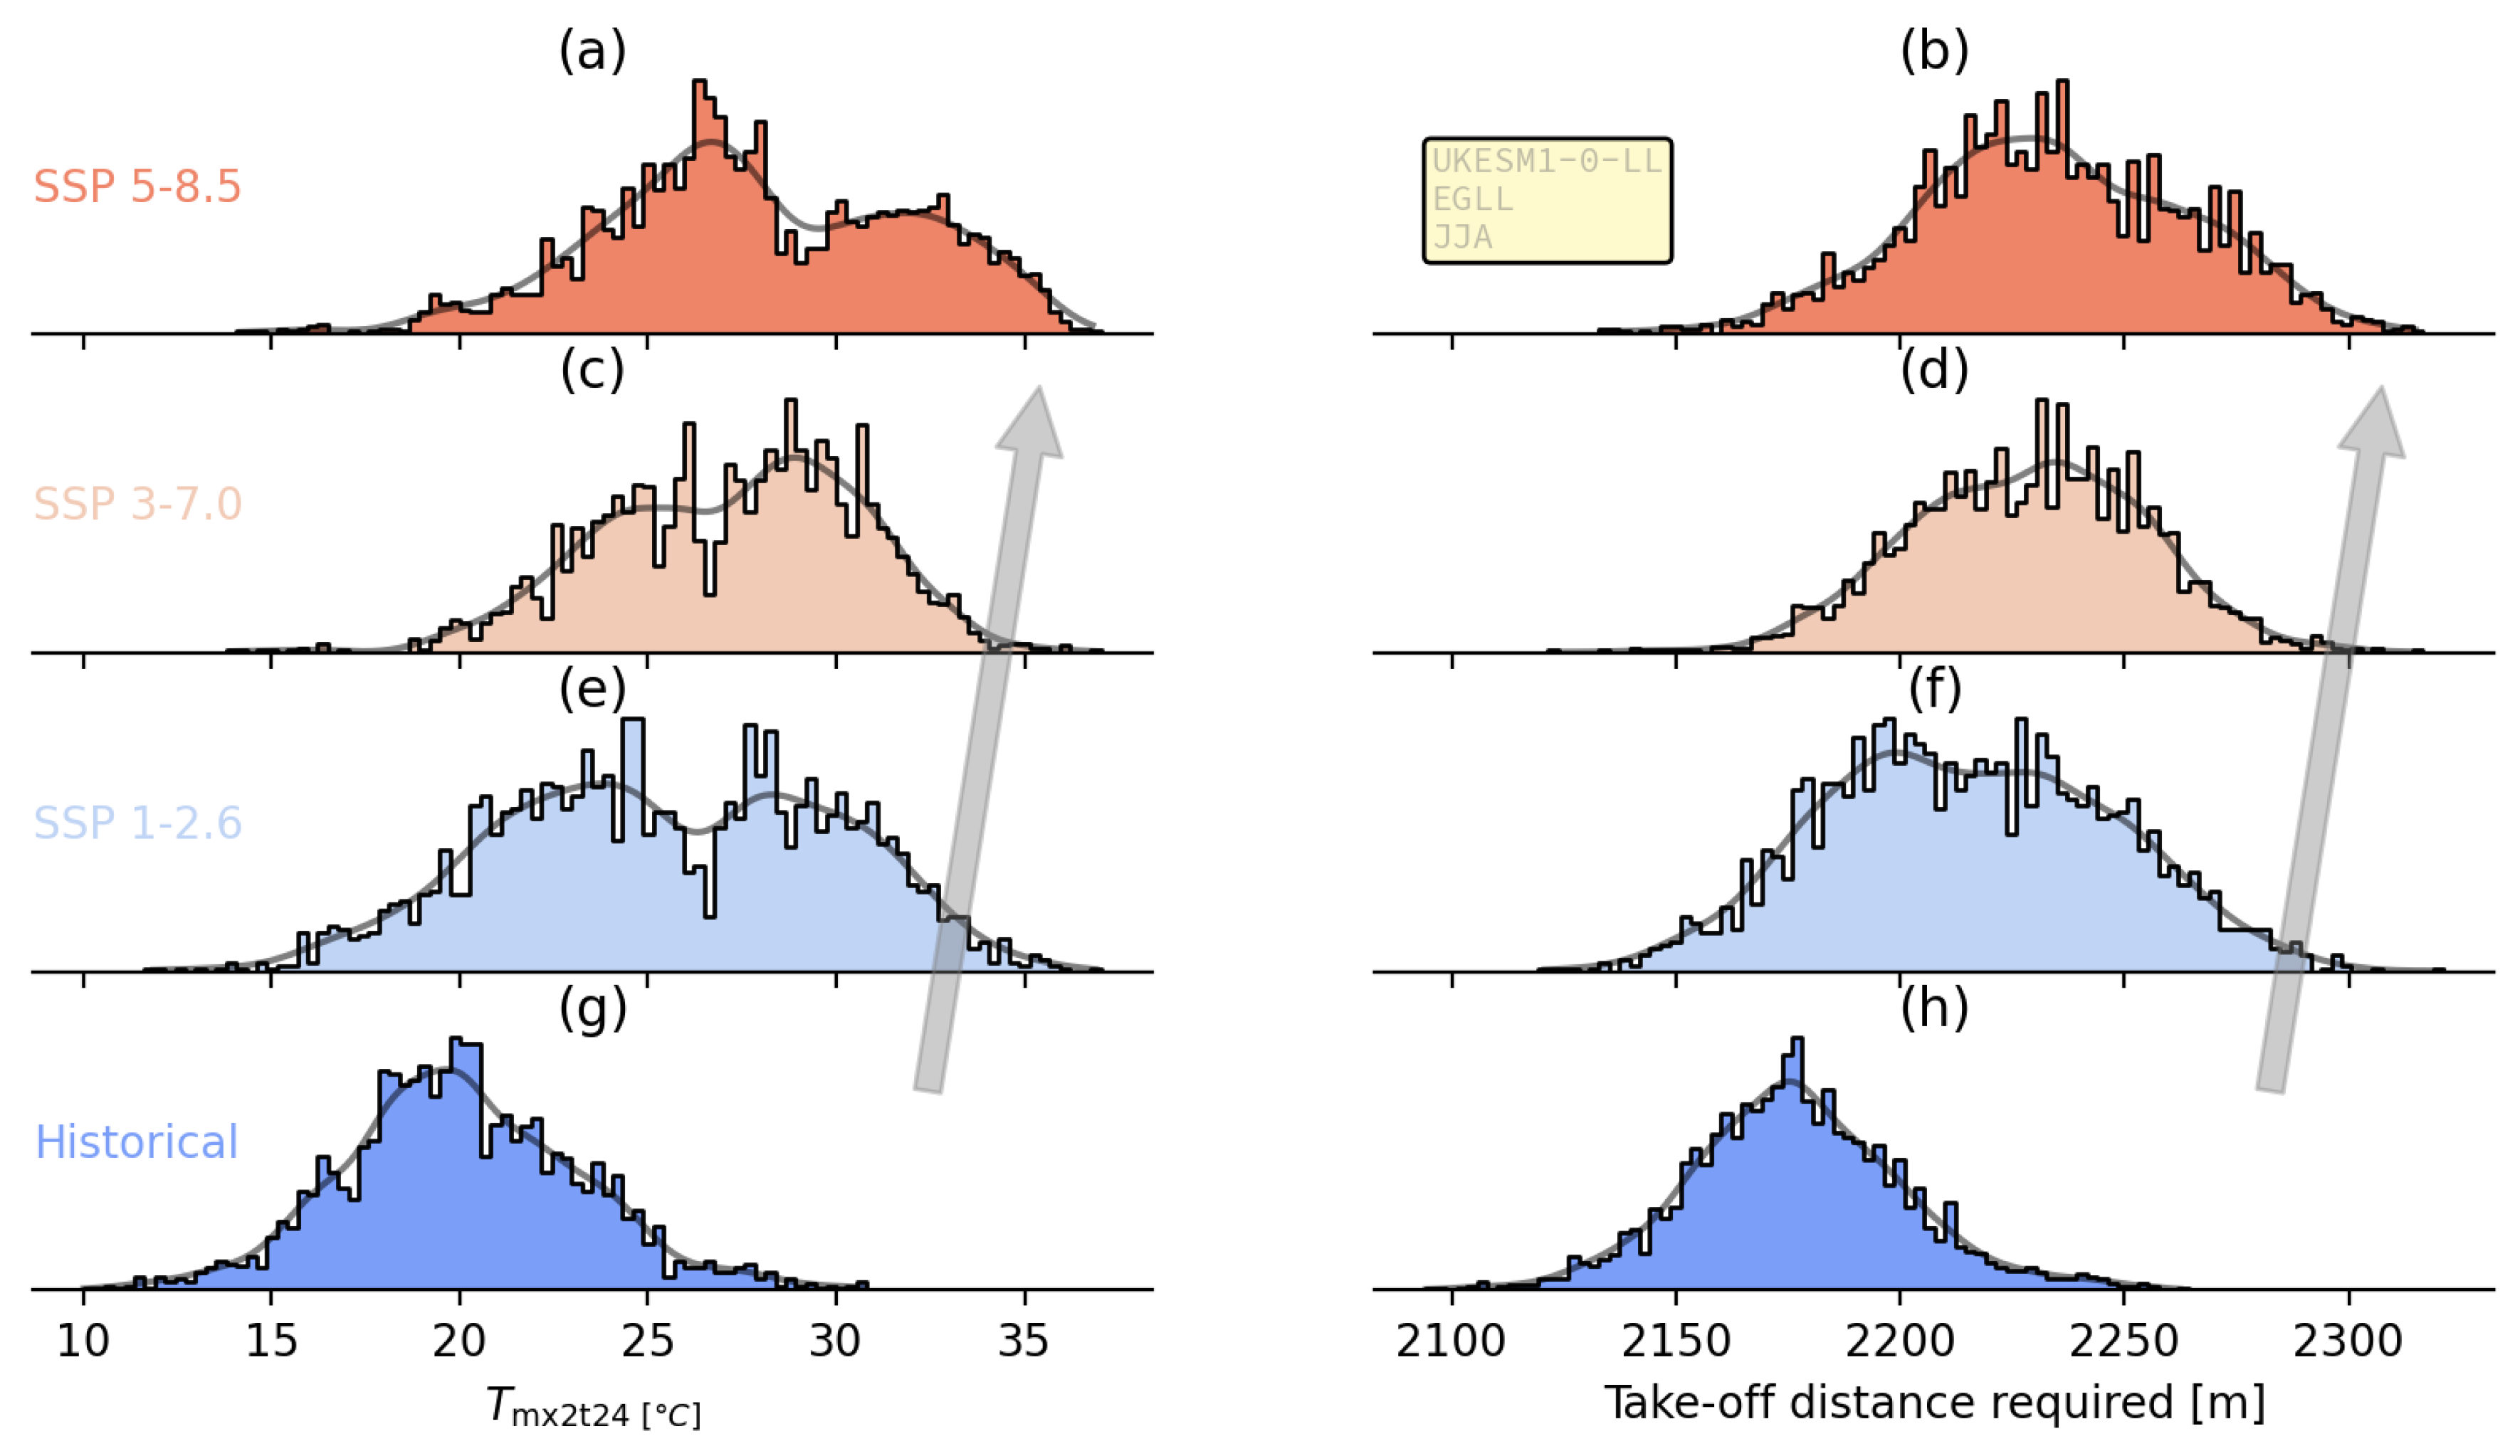
Figure 7.
Take-off distance (a) and maximum take-off mass (b) as a function of the maximum temperature in the last 24 hours, and (symbol size, colour/hue) surface air pressure for Rome Ciampino airport in JJA using the UKESM1-0-LL model. The short, blue lines attached to the axes show each data point to further illustrate the individual parameter values.
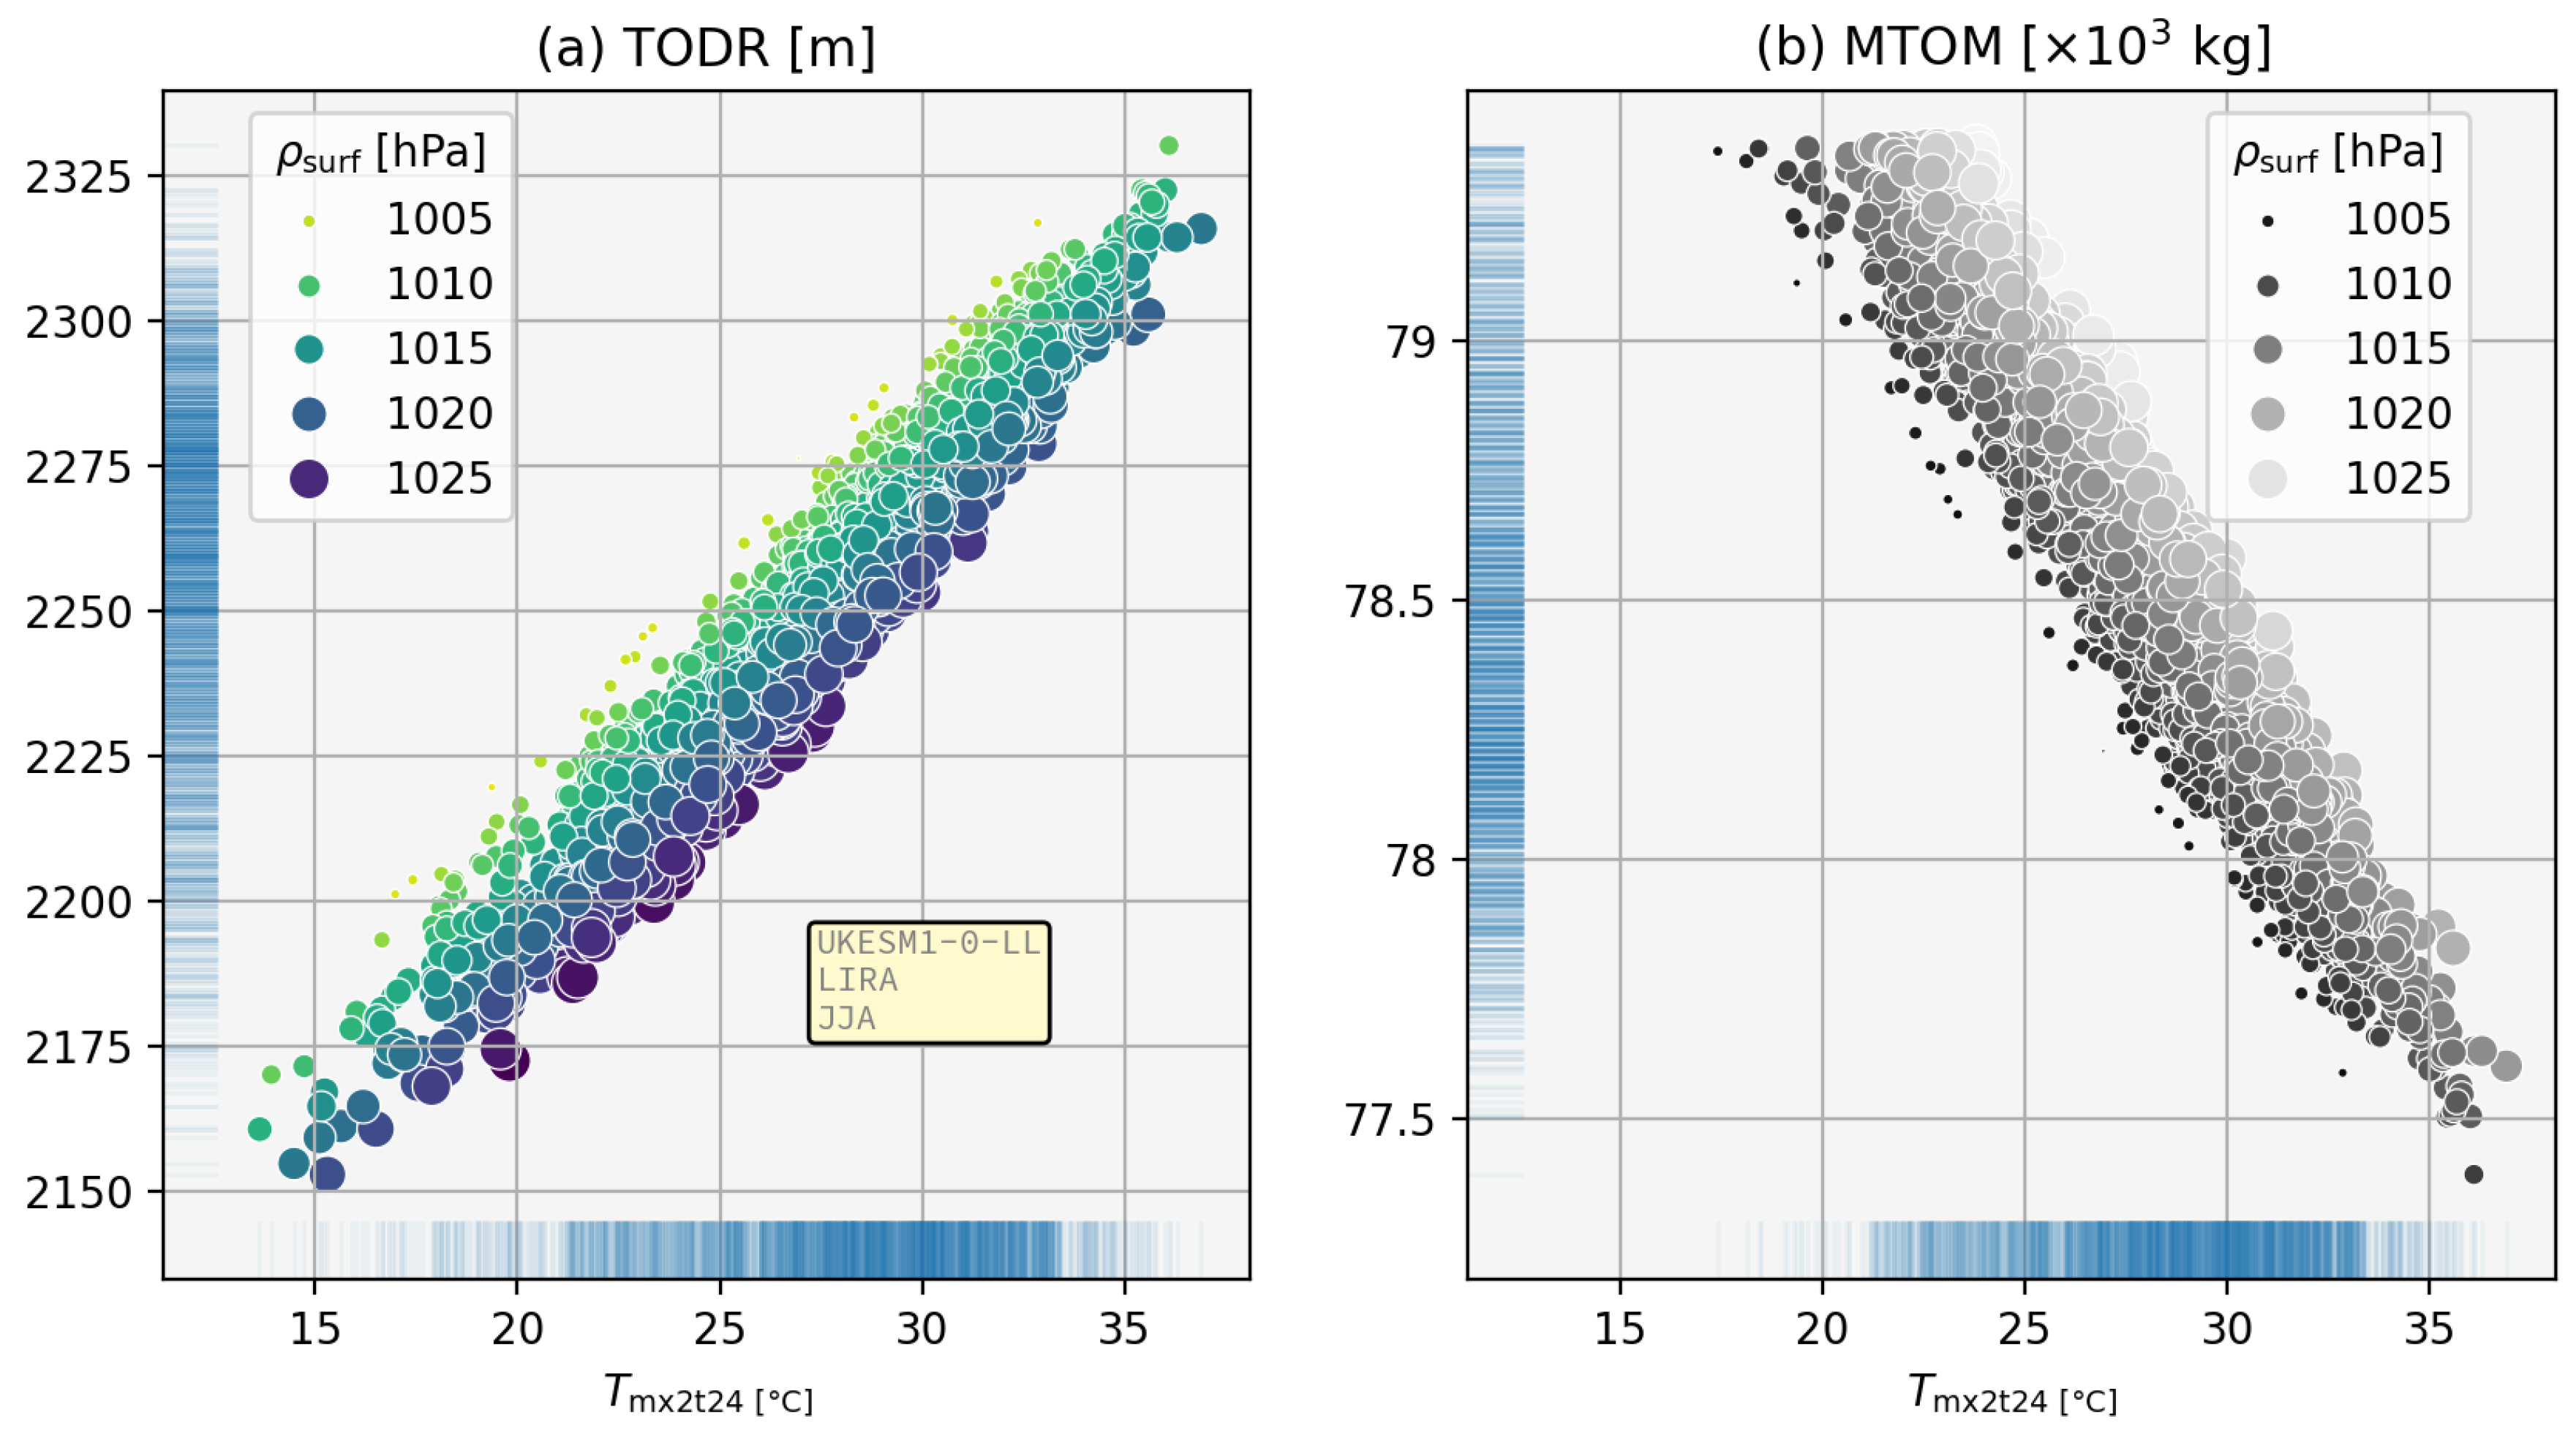
Figure 8.
Ensemble spread of the probability of exceeding the 99th percentile of the historical distribution of TODR, JJA. Outliers (outside 1.5 times the inter-quartile range of each distribution) are shown by circles and the number of outliers is shown by the small numbers above each sub-figure. The maximum y-axis value is 1.05 times the highest value of any of the ‘whiskers’ shown.
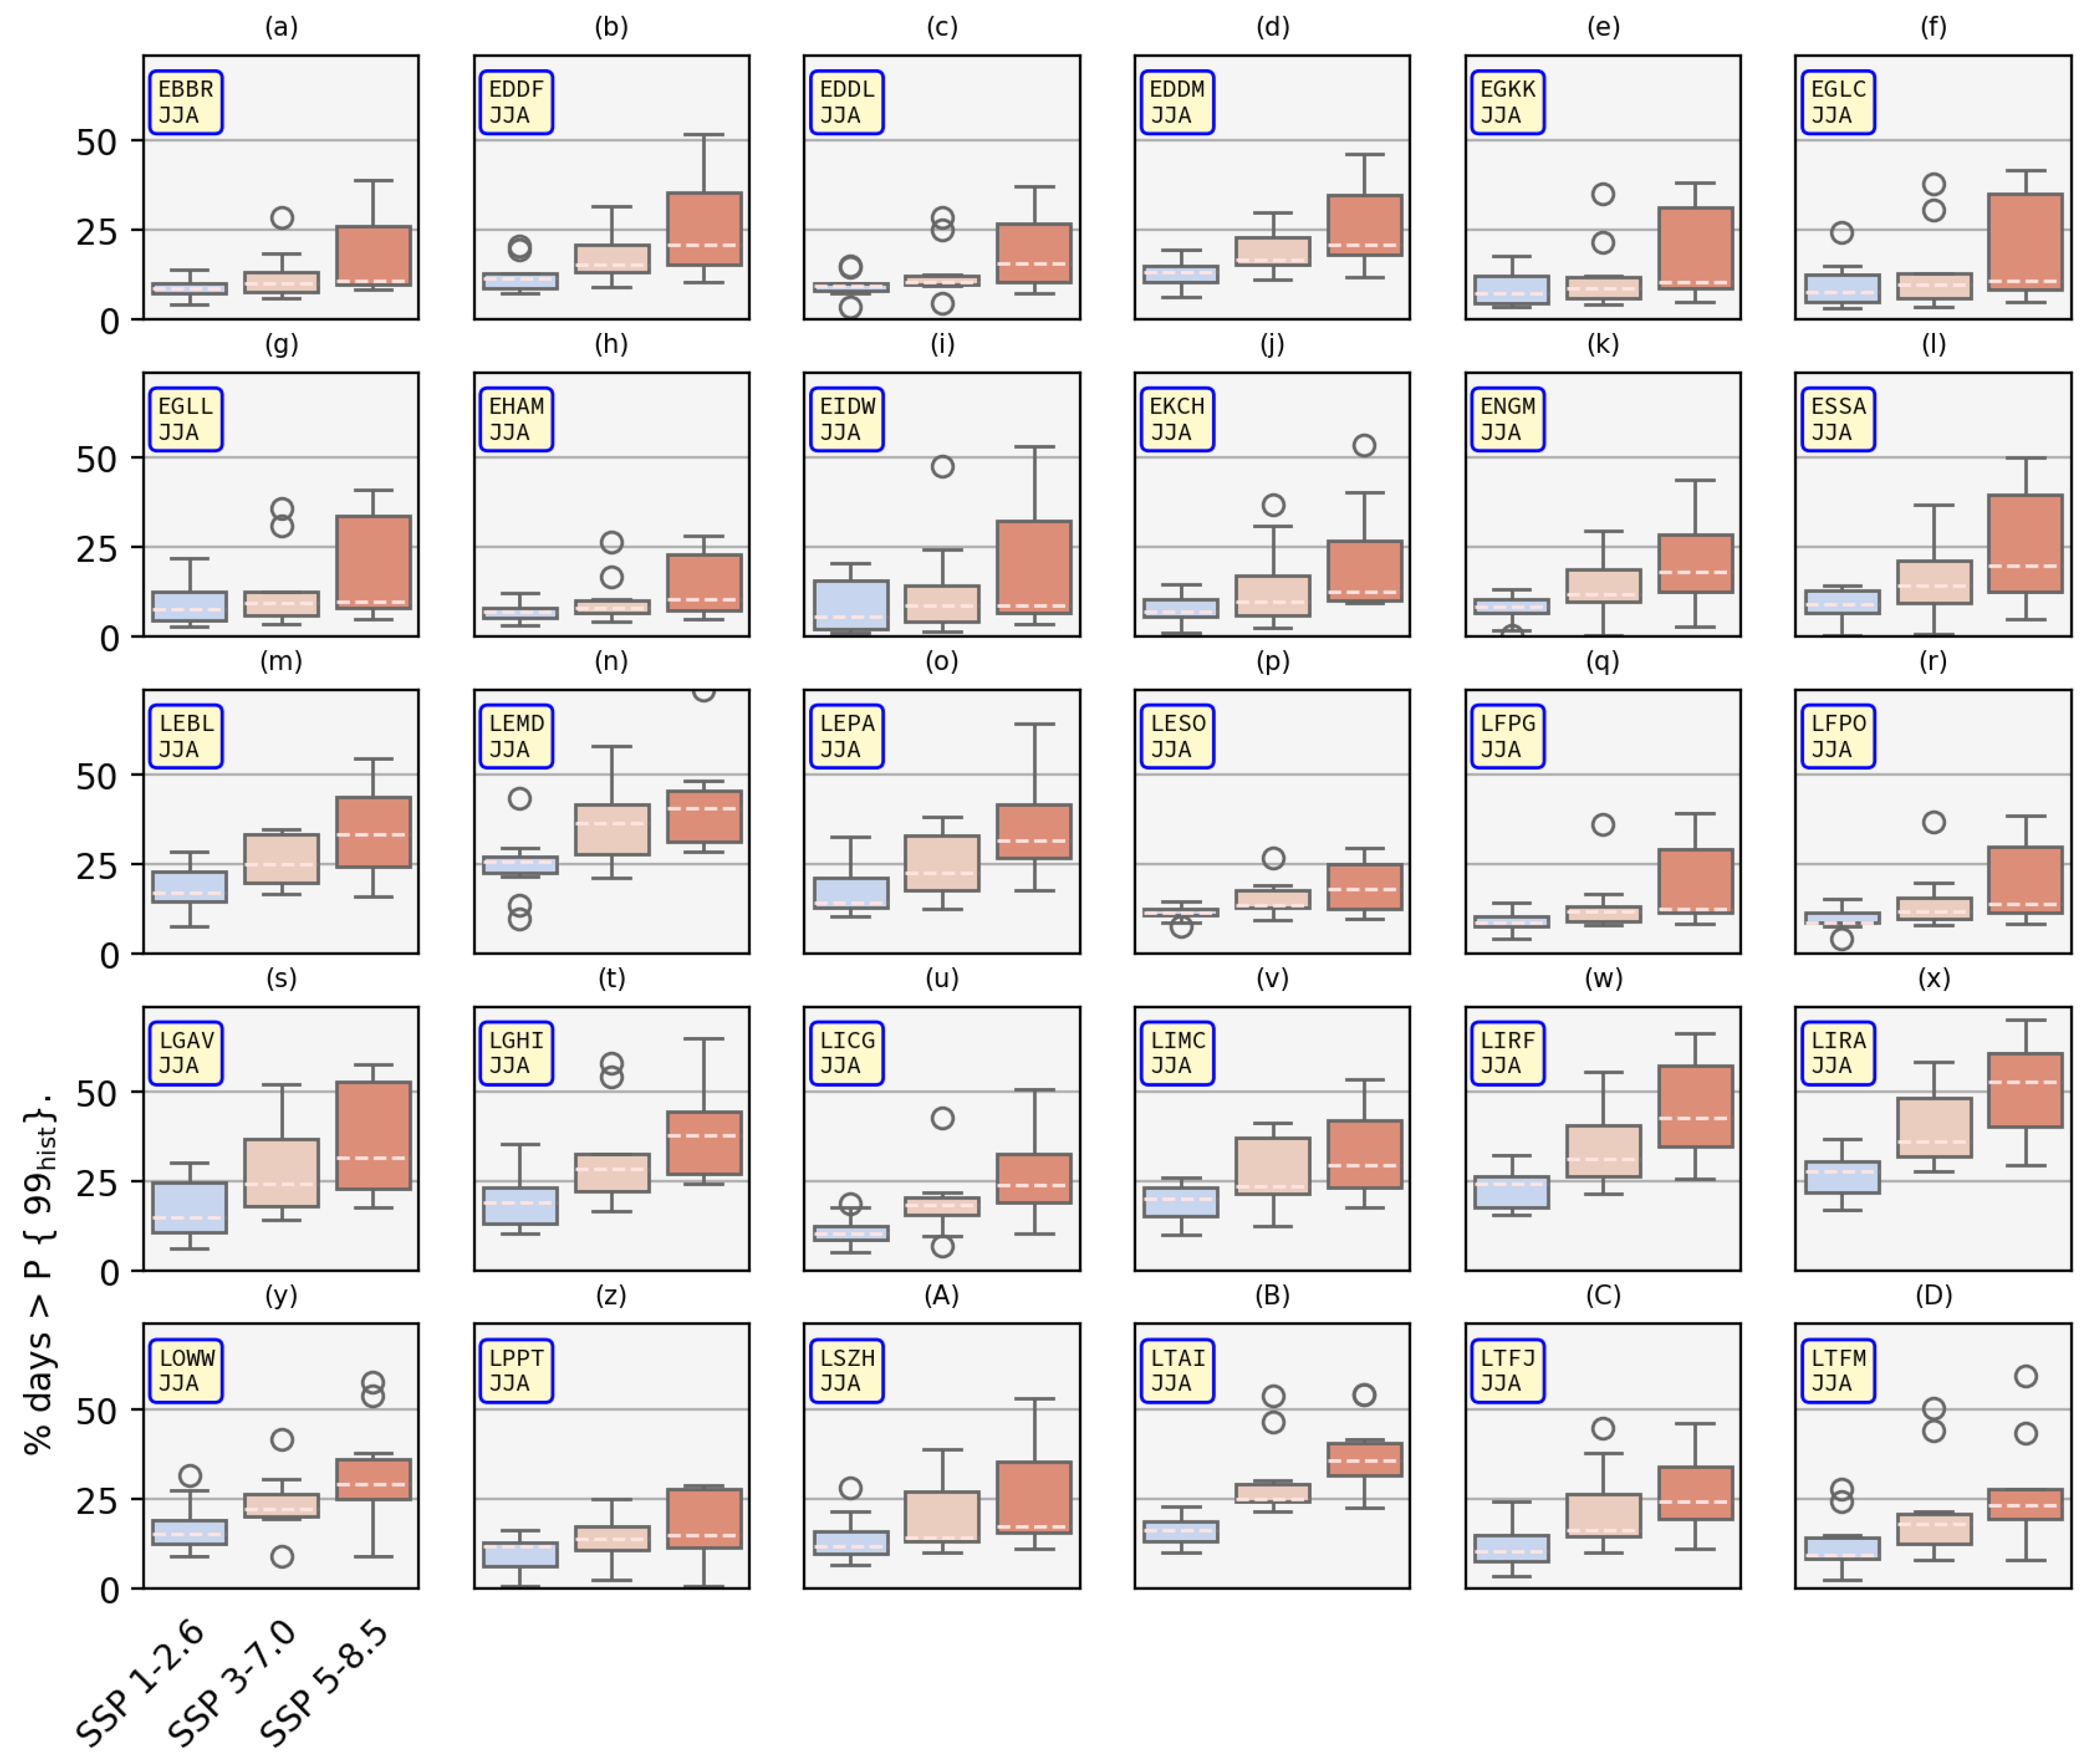
Figure 9.
Runway lengths for each airport considered and the runway length calculated for the maximum-rated mass of the Airbus A320 using the International Standard Atmosphere. The airports which have runways shorter than or very close to the TODR for the maximum-rated mass are indicated in red and with raised ICAO codes. Those with longer runways, which will likely not be affected as temperatures increase are indicated in blue.
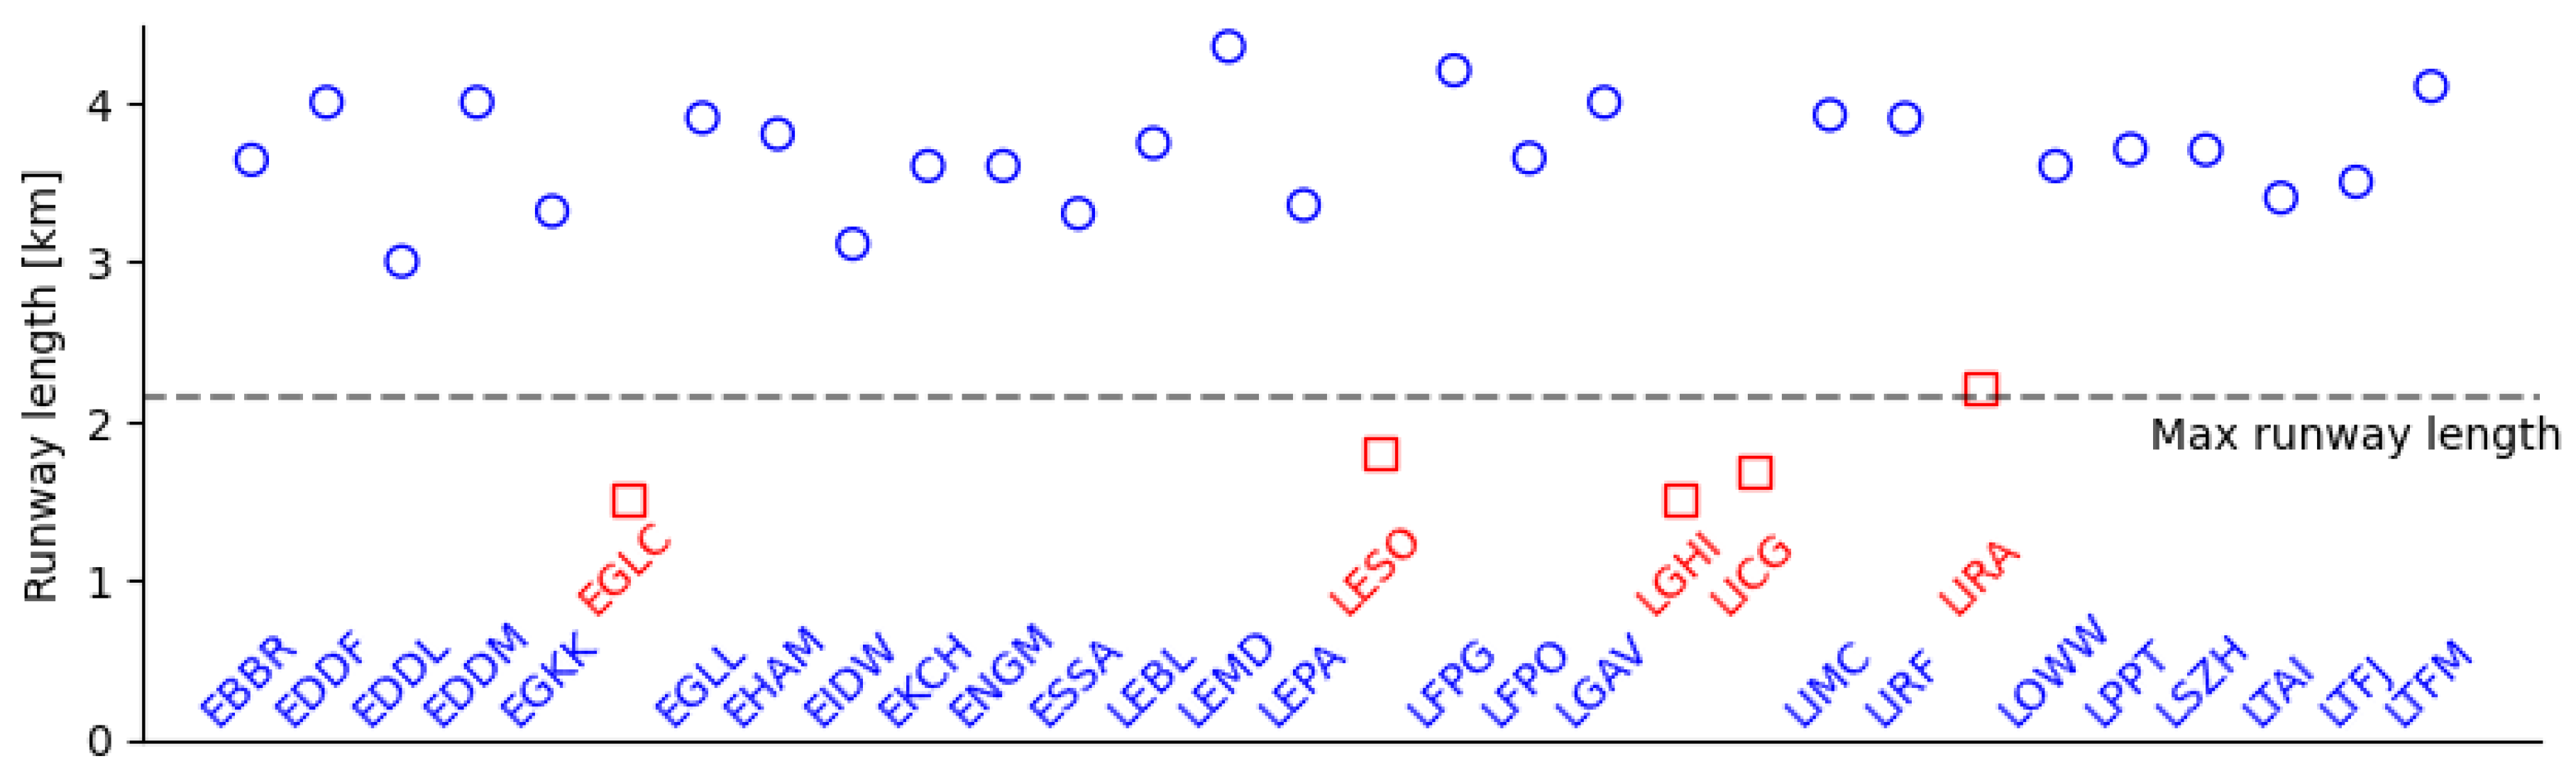
Figure 10.
Additional weight restrictions in number of passengers (‘pax’) relative to the respective historical value for four short-runway airports (columns) and three future emissions scenarios (rows).
Figure 10.
Additional weight restrictions in number of passengers (‘pax’) relative to the respective historical value for four short-runway airports (columns) and three future emissions scenarios (rows).
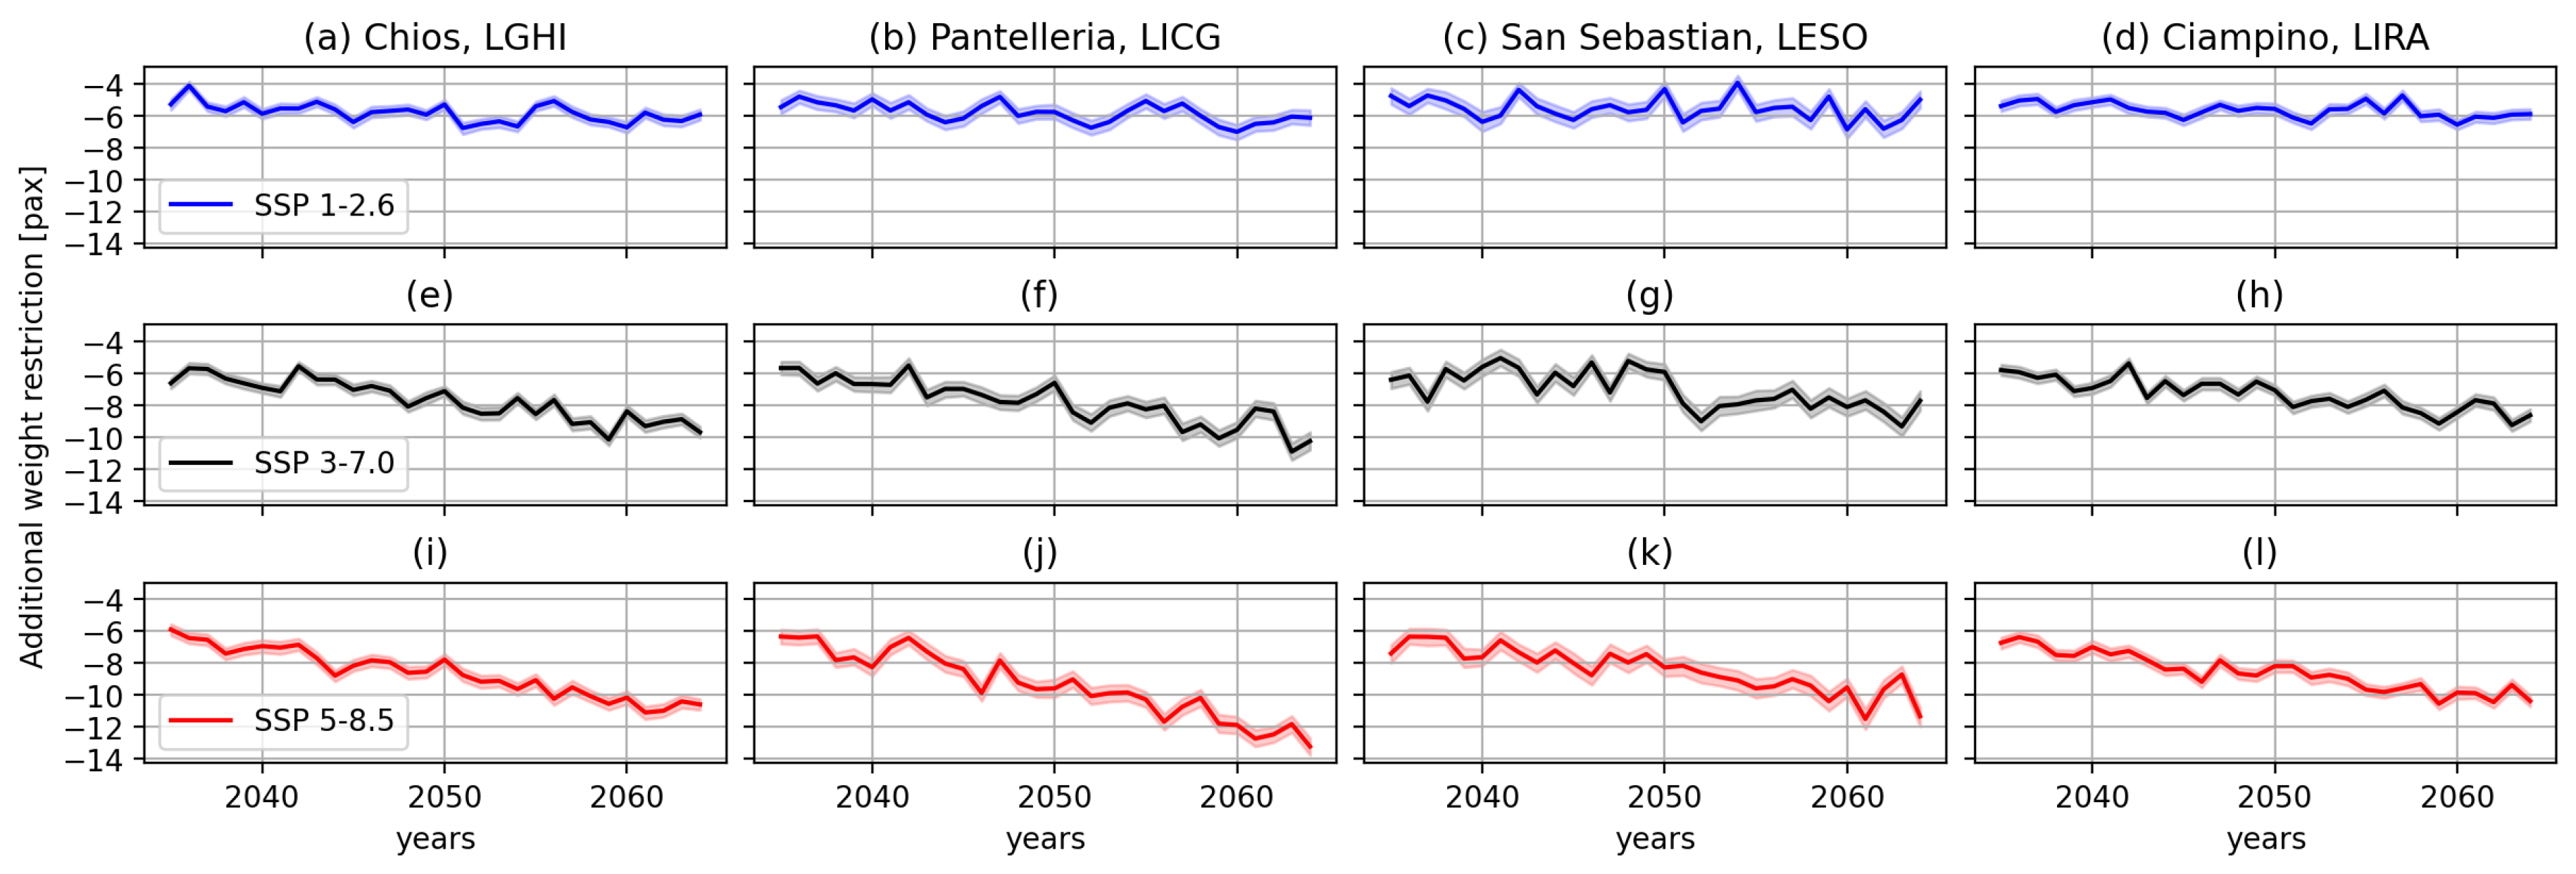
Figure 11.
Number of days in which weight restrictions exceed the 99th percentile of historical values.
Figure 11.
Number of days in which weight restrictions exceed the 99th percentile of historical values.
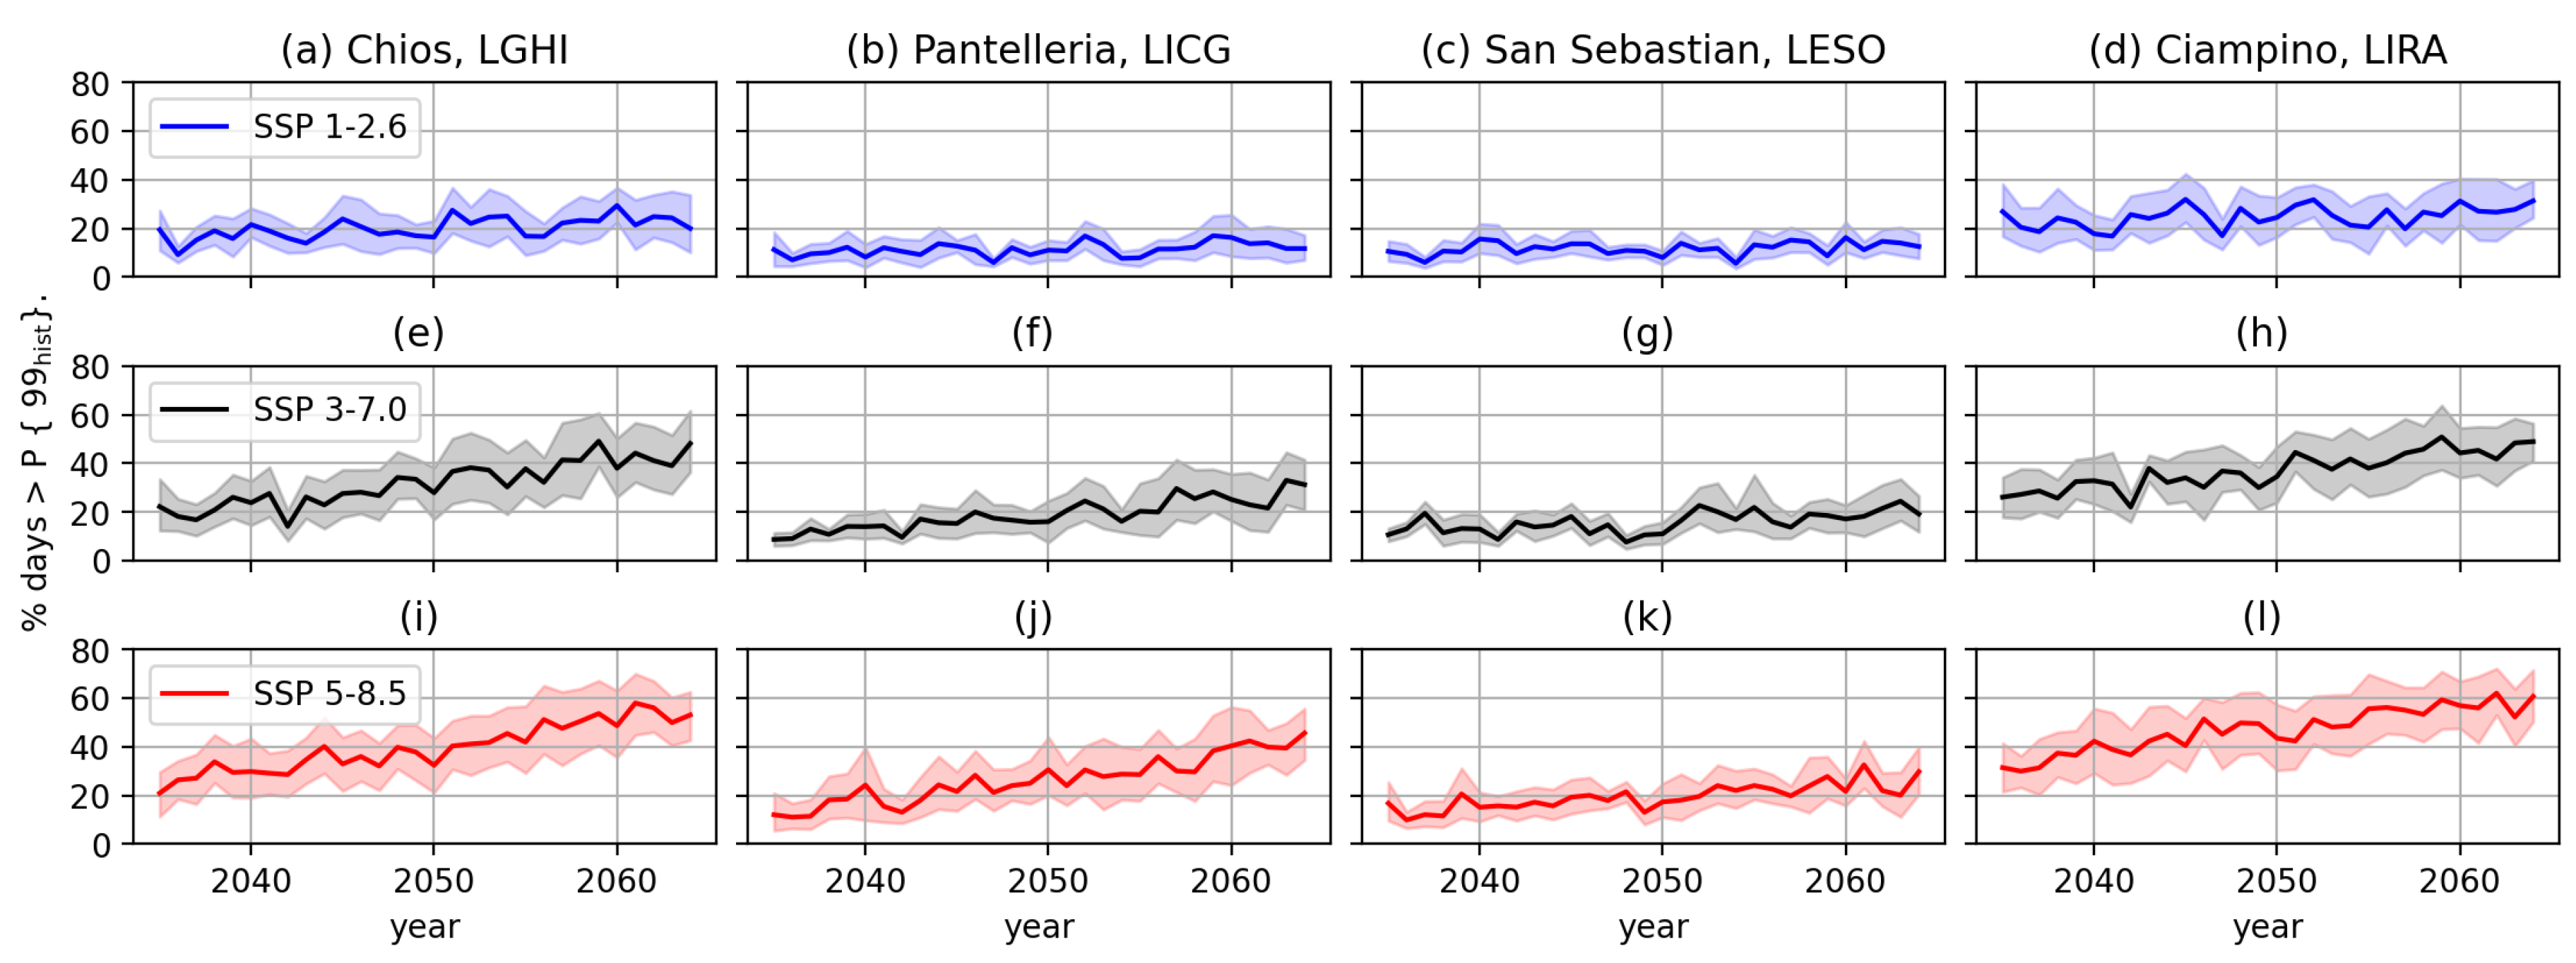
Figure 12.
Probability density function of take-off weight restrictions relative to the historical value for each airport and emissions scenario. Negative values show restrictions below the respective historical mean and hence the integral –– i.e. the probability of occurrence –– of the historical curve is symmetric around zero. The top row shows all scenarios and the following rows show the model ensemble range (mean ± 1 standard deviation) for SSP1-2.6, SSP3-7.0 and SSP5-8.5 respectively. The insets in the top row show the values in number of passengers equivalent weight for the historical (‘H’) and future SSP forcings (1,3,5).
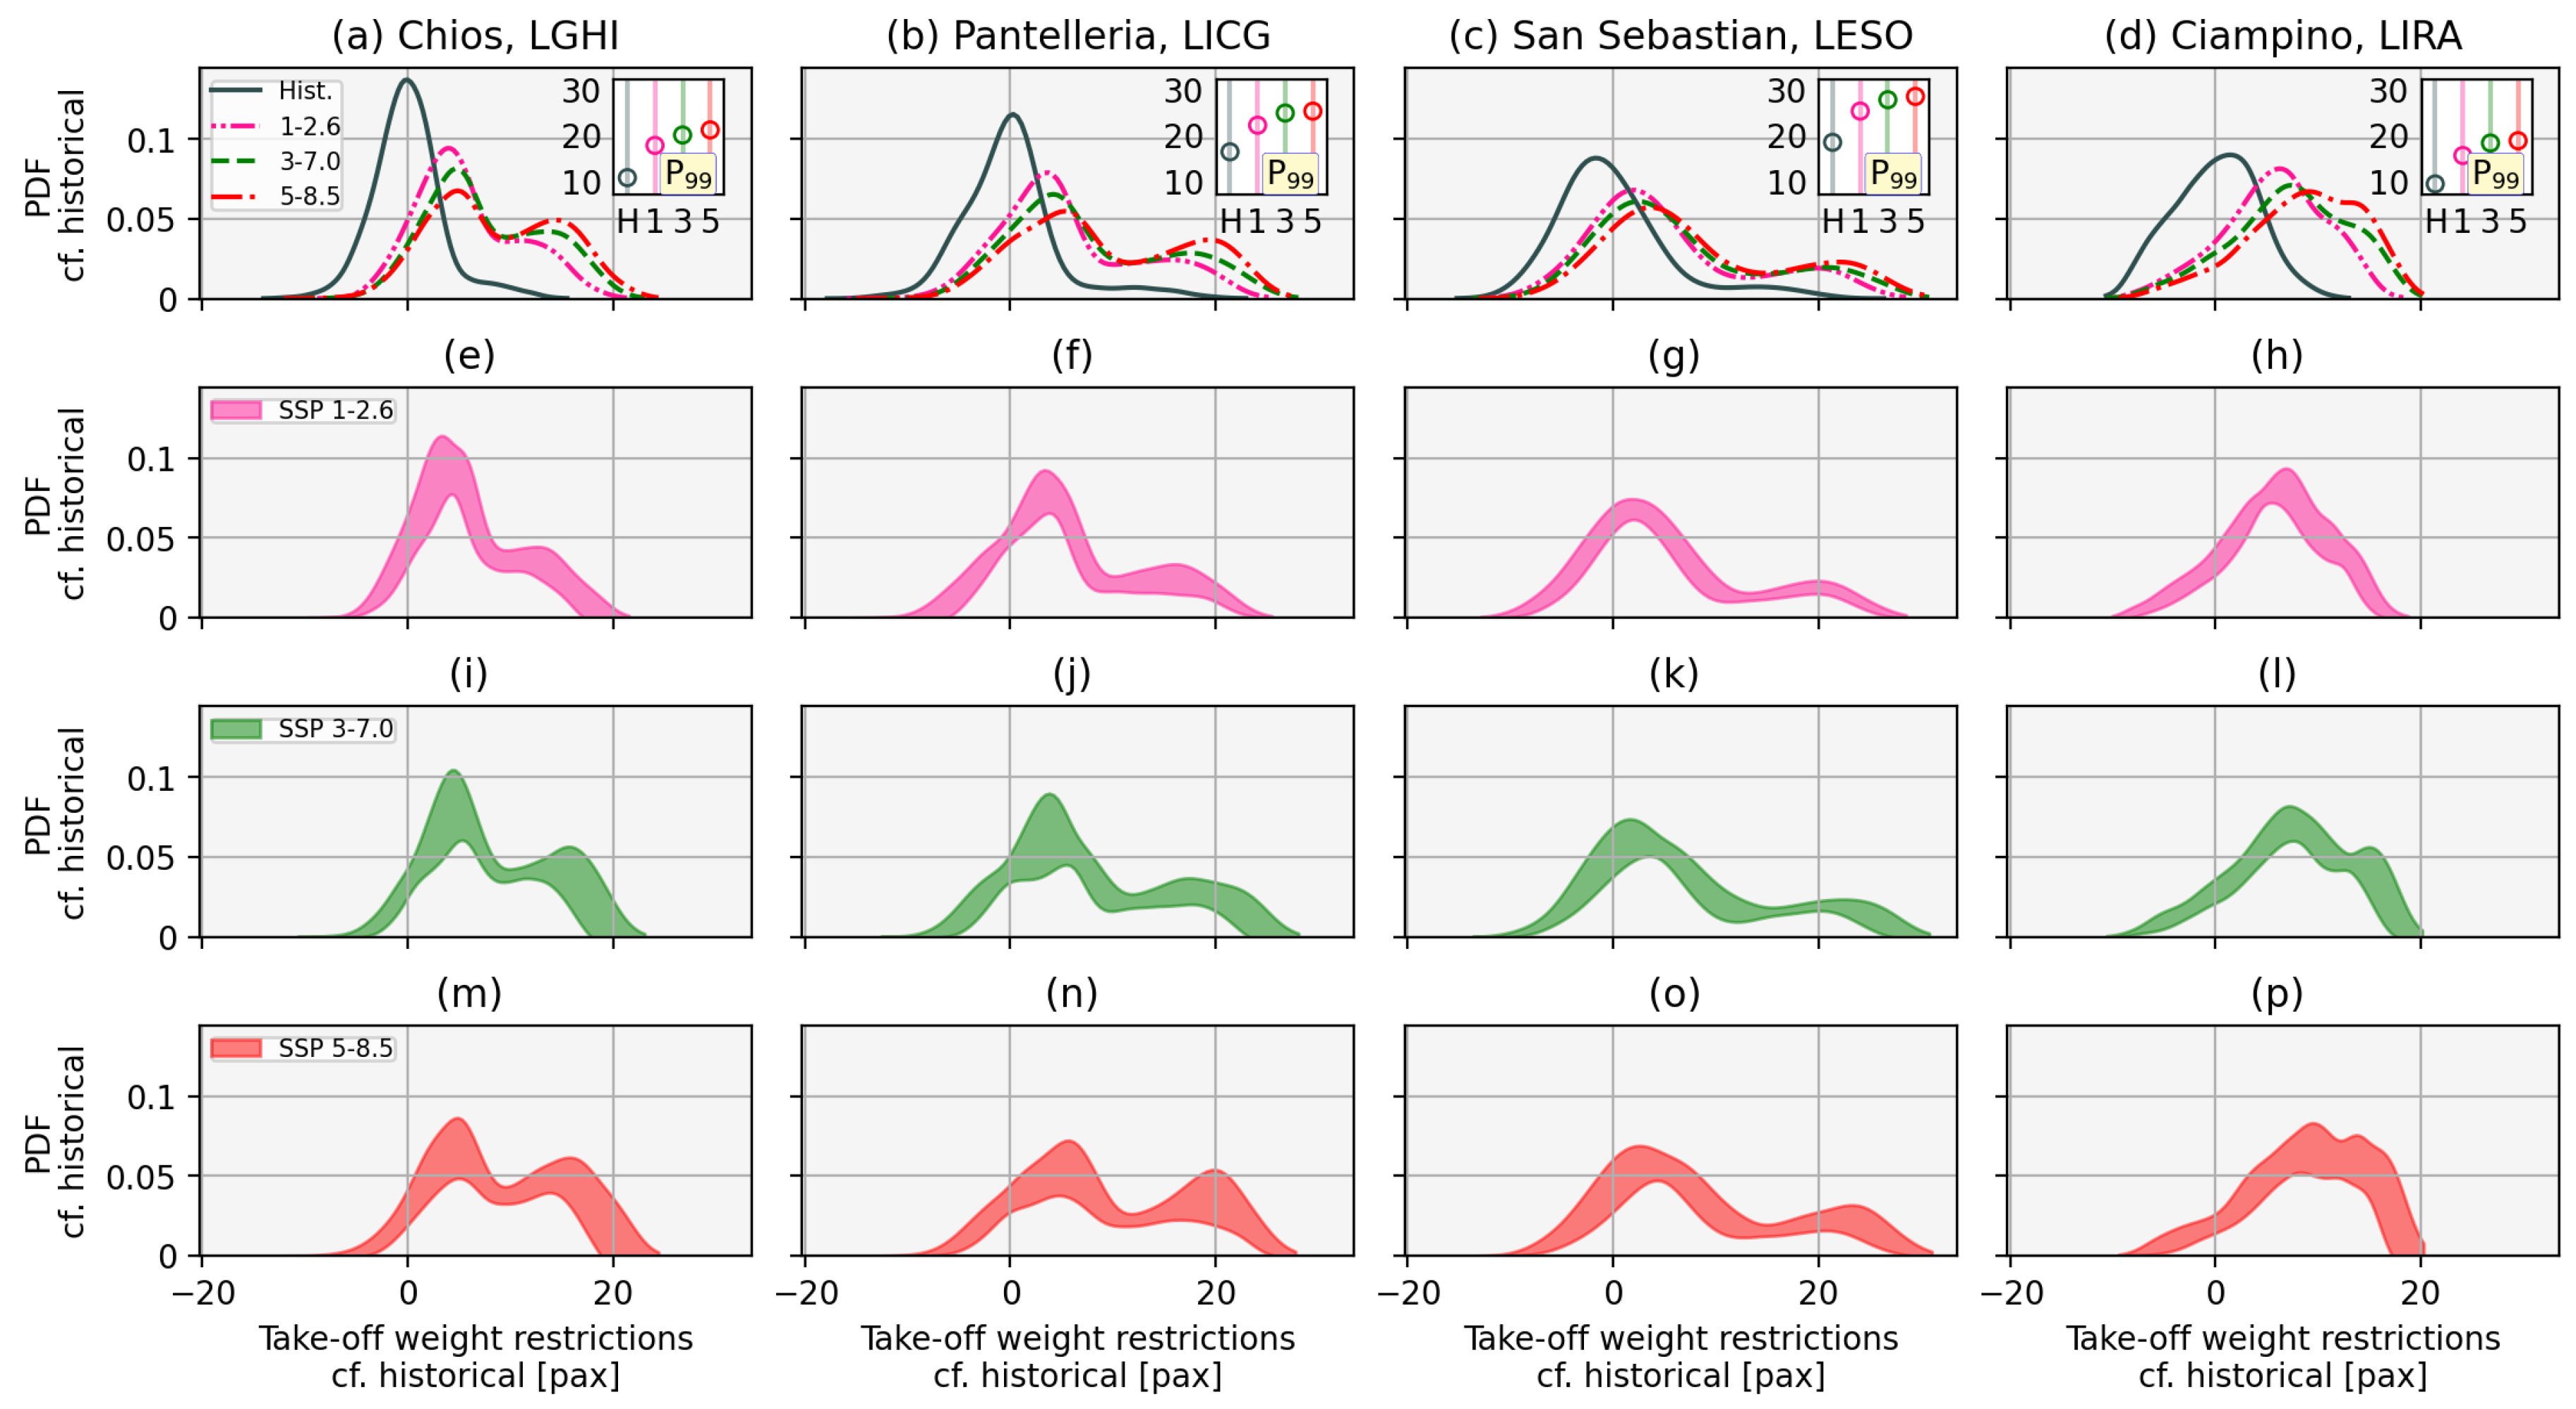
Table 1.
Description of climate change scenarios used in this work (see e.g. [7])
Disclaimer/Publisher’s Note: The statements, opinions and data contained in all publications are solely those of the individual author(s) and contributor(s) and not of MDPI and/or the editor(s). MDPI and/or the editor(s) disclaim responsibility for any injury to people or property resulting from any ideas, methods, instructions or products referred to in the content. |
© 2024 by the authors. Licensee MDPI, Basel, Switzerland. This article is an open access article distributed under the terms and conditions of the Creative Commons Attribution (CC BY) license (http://creativecommons.org/licenses/by/4.0/).
Copyright: This open access article is published under a Creative Commons CC BY 4.0 license, which permit the free download, distribution, and reuse, provided that the author and preprint are cited in any reuse.


