Introduction
Sodium-ion (Na-ion) batteries were first demonstrated along-side Li-ion batteries with Whittingham’s demonstration of intercalation into TiS
2 in 1978 [
1] and Doeff’s full cell in 1993 [
2]. However, Na’s lower energy density and inability to intercalate into a graphite anode contributed to limited research emphasis and commercialization of the chemistry. More recently, beginning in the 2010s, key components of the Li-ion battery supply chain, like cobalt and lithium, became strained, resulting in the Li-ion battery demand outpacing production and supply [
3]. Since that time, Na-ion battery research and commercialization has regained momentum [
4,
5,
6]. In the early 2020s, companies like CAT’L (China) and Faradion (UK, India) began producing large quantities of cells (>10 GWh) with energy densities comparable to lithium iron phosphate (LFP) Li-ion batteries (~150 Wh/kg).
With resurging interest in Na-ion batteries, research grade cells and material analysis began indicating attractive features of Na-ion batteries, which address weaknesses of the ubiquitous Li-ion battery [
5,
7]. These include long cycle life [
8], high rate capability [
9,
10,
11], stability during 0V storage, [
12] and a higher degree of safety [
13,
14]. However, features like cycle life and safety are difficult to assess prior to scaleup, as demonstrated during the maturation of Li-ion batteries [
15,
16]. Performance and safety are both strongly influenced by parameters like electrolyte quantity, electrode thickness, and form factor. From a performance perspective, electrolyte quantity impacts lithium inventory, while thickness and form factor impact impedance and rate capability [
17]. From a safety perspective, electrolyte quantity influences cell volatility and total capacity and form factor influences failure mode severity.
High energy density batteries like Li-ion exhibit thermal runway, which is a cascade of chemical reactions initiated by short circuit-induced heating of volatile electrolyte solvents and culminating with cathode combustion [
18,
19]. Careful diagnosis of thermal runaway in Li-ion batteries revealed that onset is correlated to the quantity and volatility of electrolyte and severity to cathode composition [
19]. Cathode composition is the primary variable among commercial Li-ion batteries with layered metal oxides like NMC (Nickel, manganese, cobalt oxide) and olivine structures like LFP (lithium iron phosphate) being the most popular. However, cathode composition is more widely varied in 2024 commercial Na-ion batteries [
20].
Due in part to Na’s distinct compatibility with other cell materials compared to Li, the wide range of materials in commercial Na-ion batteries to date make assessment of performance and safety difficult [
10]. The most common anode material is a hard carbon, but research is accelerating on higher energy density alloy and intercalation anodes [
10]. Electrolytes tend to contain similar components to Li-ion: -PF
6 or -TFSI based salt, carbonate solvents, and small quantities of additives. Finally cathodes primarily fall into three main categories: layered metal oxides, polyanions, and prussian blue analogs [
6,
10,
21]. Briefly, the layered transition metal oxide cathodes (Na
xM
1…M
nO
2, M= Ni, Fe, Mn, Cu, Ti, Co, etc. ; n=number of metals) deliver the highest capacity and are the most like NMC Li-ion cathodes, exhibiting layered structures and propensity for catastrophic thermal runaway. Na polyanion cathodes are similar to the olivine LFP with an open framework to facilitate high rates and high structural and thermal stability providing less severe failure modes. Initial research attempted simply replacing the Li in LFP (NaFePO
4) however, the compound was unstable leading to the incorporation of components like V and PO
2, which present toxicity and cost concerns. Finally, Prussian blue analogs (PBAs, NaM
1[M
2(CN)
6] M
1= Ni, Cu, Zn, Mn, etc. M
2= Fe), boast low cost and an open channel framework, which is promising for high rates. These materials were not compatible with the smaller Li cation, but they have gained popularity with Na-ion, as well as larger ions like potassium (K). PBAs are challenged by complicated synthesis and water instability. Safety insights are not yet available.
As well documented in Li-ion battery literature, cathode type is a key factor in cycle life and rate capability and dictates thermal runway severity when comparing cells with similar anodes and overall construction, motivating similar comparative research on Na-ion batteries. Despite its larger size (atomic and ionic) compared to Li
+, Na
+ ions undergo faster solid state diffusion in Na-ion cathodes which may be due to closer size matching of the cation and the interatomic spacing of the host [
22], resulting in high rate capability (> 50C) [
4]. Further, thermal stability of Na-ion cathodes suggest higher temperatures to initiate their combustion and lower relative oxygen content to fuel the combustion [
23]. However, recent publications presenting early demonstrations of Na-ion battery performance and safety, explore only one cathode type at a time with limited tests [
9,
12,
13,
14,
24,
25,
26,
27,
28,
29,
30]. Thermal runaway is typically induced by external heating to assess safety. The most quantitative of the heating techniques is heat-wait-seek (HWS) using accelerating rate calorimetry (ARC) tests, which heat in small increments allowing accurate detection of onset of self-heating temperatures and approximates adiabaticity to allow calculation of chemical energy released during failure [
18]. Physical abuse tests like nail penetration allow for analysis of response to packaging failures or accidents. Finally, off-gas analysis is important to understand the toxicity of gases released during venting or thermal runaway. Gas chromatography-mass spectroscopy (GC-MS) or Fourier transform infrared spectroscopy (FTIR) are the most common gas analysis techniques [
31,
32,
33] and are often employed on collected samples, which can result in under-detection of reactive or condensed species. This work explores performance (energy, power, and 0V storage stability) and safety (ARC, nail penetration and time resolved FTIR off-gas analysis) of four commercial Na-ion batteries with cathodes from each of the three main categories (polyanion, layered metal oxide, and prussian blue analog), allowing for assessment of strengths and weaknesses of each type for the first time.
Experimental
Commercial Na-ion batteries from four vendors and Li-ion batteries from two vendors were obtained and cycled galvanostatically using a Maccor battery cycler and thermal chamber according to specifications provided by the cell manufacturers. Skin temperatures were tracked with 18-gauge T-type thermocouples secured around the cell midpoint with electrical tape. Zero-volt tests were conducted by discharging the cells to 0V, below the manufacturer specified lower cutoff voltage for all cells (
Table 1), on the Maccor and resting for 5 hours followed by conventional cycles to probe performance recovery. A Thermal Hazard Technology (THT) EV ARC was utilized for Accelerating Rate Calorimetry (ARC) heat-wait-seek (HWS) measurements, thermal ramp experiments, and nail penetration. The HWS procedure involves heating in small increments, waiting for the system to equilibrate, and then seeking to see if the sample is heating faster than the chamber at a rate >0.02 °C/min. When self-heating is detected the chamber approximates an adiabatic environment heating at the same rate as the sample until a safety temperature of 300 °C is reached [
18]. During thermal ramps of ~1.6 °C/min, a Thermo Scientific in line Antaris IGS Gas Analyzer was used to collect off gas analysis via 180 °C heated line attached to sealed pressure vessel and purged with N
2 gas. The closed system ensured the off gases were detected and the heated line prevented them from condensing before detection. Fluoropolymer gas sampling lines were used to minimize loss of highly reactive acid gases including HF. Reference spectra for gases of interest at varied concentrations were utilized for gas concentration measurements which is assessed in specific regions with minimized interference with other gases (Figure S4). THT pneumatic nail penetration actuated with 1500 psi N
2 gas was used as an additional abuse method to characterize external damage to the cells.
Results and Discussion
The performance of four commercial Na-ion cell types with different cathodes (
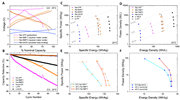
Table 1) was first assessed with galvanostatic cycling at a symmetric C/2 rate, which was within specification for each cell. The second cycle is plotted in
Figure 1A. The polyanion cathode (Na-VPF) exhibited the highest voltage reactions at ~3.5 and ~4.1V but the lowest fraction of its reported nominal capacity (~76.8%) at a C/2 rate. The high voltage nature of the reaction was previously reported for similar
NavVx(PO4)yFz cathodes [
8,
9,
12]. The layered metal oxide cells (Na-NMF1 and Na-NMF2) have the next highest voltage reactions at ~3.75V and ~2.5V, consistent with other Na(Ni
xFe
yMn
z)O
2 reports [
11,
14,
24], and delivered 89.4% and 96.4% of their respective nominal capacities. Finally, the Prussian blue analog cathode (Na-tmCN) exhibits the lowest voltage reaction at ~1.5V but delivers 104.8% of its nominal capacity. The Na-tmCN cathodes utilize specific transition metals (tm) inside the Na
xtm[Fe(CN)
6] unit cells at each electrode to control the reaction voltage and electrode stability [
21]. Simply comparing the voltage responses to a C/2 cycle emphasizes the wide range of behaviors possible in the Na-ion battery category, as a result of different active materials and charge storage mechanisms.
Cycling stability of these cells was then assessed with CC-CV charging at a C/3 rates and compared to commercial Li-ion batteries with the two most popular cathode types (NMC and LFP). The Li-FP, Na-NMF2, and Na-tmCN cells deliver high capacity retention (>99% capacity retention after 100 cycles). Higher resolution of the capacity retention during cycling of these cells is provided in Figure S1. In contrast, the Na-VPF and Na-NMF1 cells experience more rapid capacity loss than Li-NMC cells, and the Na-VPF cell experience the most severe decay (~0.1% capacity/cycle). One of the more surprising observations of cycle life retention is the very different capacity retention behaviors for the two cells with similar cathode chemistries, Na-NMF1 and Na-NMF2. These differences are likely linked to varied quality of manufacturing and cell details like electrolyte selection. Overall, these findings do not confirm the overall assertion that Na-ion batteries exhibit longer cycle life than Li-ion, since (1) the quality of Na-ion commercial cells varies and is not yet be equivalent to state-of-the-art Li-ion and (2) different active materials will likely present different capacity retentions and only three types were tested.
Within specification sheet parameters (voltage ranges and peak currents) the power and energy density of each Na cell is compared to the same Li cells (Li-NMC and Li-FP) on Ragone plots normalized to cell mass and volume (
Figure 1C,D). The Na-tmCN and Na-VPF cells exhibit lower energy density than Li-ion and the Na-NMF1 and Na-NMF2 cells exhibits similar performance to Li-FP. The Na-NMF1 cells delivers slightly higher energy density while the Na-NMF2 cells delivers slightly higher power density. The Na-tmCN cell was not tested at its highest rate due to the current limits of our cyclers, but overall the Na cells did not exhibit power densities exceeding the Li cells. Finally, the Na-NMF1 and Na-tmCN cells were tested at 0 °C and 40 °C. At 40 °C, the Na-NMF1 cell achieved close to the nominal energy density regardless of applied current: delivering 127 Wh/kg and 122 Wh/kg at C/5 and 3C, respectively. In contrast, lowering the temperature to 0 °C resulted in suppressed energy densities that were rate dependent, with the Na-NMF1 delivering 109 Wh/kg at C/5 and 93 Wh/kg at 3C. The Na-tmCN cell was less impacted by temperature, with slightly less energy density at the lowest temperature (0 °C) and the highest rate (5C), 15.2 Wh/kg vs. 18.8 Wh/kg, and no difference in performance at 40 °C compared to 25 °C.
Along with the rate testing, surface mounted type-T thermocouples were used to detect heat generation during cycling. During a 1C discharge (
Figure 2A), the skin temperature for each cell (
Figure 2B) in a fan cooled chamber set to 25 °C was assessed. In agreement with other observations, the cells reach their highest temperature at the end of discharge [
34]. The peak temperatures of the Na-ion batteries are lower the Li-ion. This is likely a result of differing specific heat and their overall lower energy densities, visualized in
Figure 2C. Interestingly, while the Na-NMF1 and NA-NMF2 discharge profiles are similar, the Na-NMF2 cell exhibits a higher temperature rise. This suggests that both electrode chemistry and cell engineering influence cell heating. At 1C, heat generation is largely composed of resistive heating that can be influenced by cell level factors like the applied current, thickness of the electrodes, and tab placement. Further assessment is required, but these initial observations indicate that less thermal management may be required for Na-ion batteries compared to Li-ion batteries.
We went on to test the resilience of the Na cells to 0V excursions, since Na-ion batteries can effectively utilize aluminum (Al) for both current collectors. Li-ion batteries, must employ copper (Cu) as an anode current collector to prevent Li alloying with Al at low voltages. Therefore, if Li-ion batteries are discharged below 0.5V, as the cathode voltage falls, the anode voltage rises enough for Cu to oxidized to Cu
+ or further to Cu
2+. These ions are released into the electrolyte, etching away the anode current collector, altering current flow. Then in a subsequent charge the ions can be redeposited as Cu
0 metal, introducing risk of internal short circuit [
12,
35,
36]. This phenomenon is avoided by controlling Li-ion discharge voltage typically to no less than 2.5V and storing cells at states of charge (SOC) above 0%, typically 20-30%. However, since Na does not alloy with Al, their anodes can employ Al current collectors. Therefore, Na-ion batteries can be stored safely at 0V and 0% SOC providing a “deactivated” condition desirable for safe storage and transport [
12,
37].
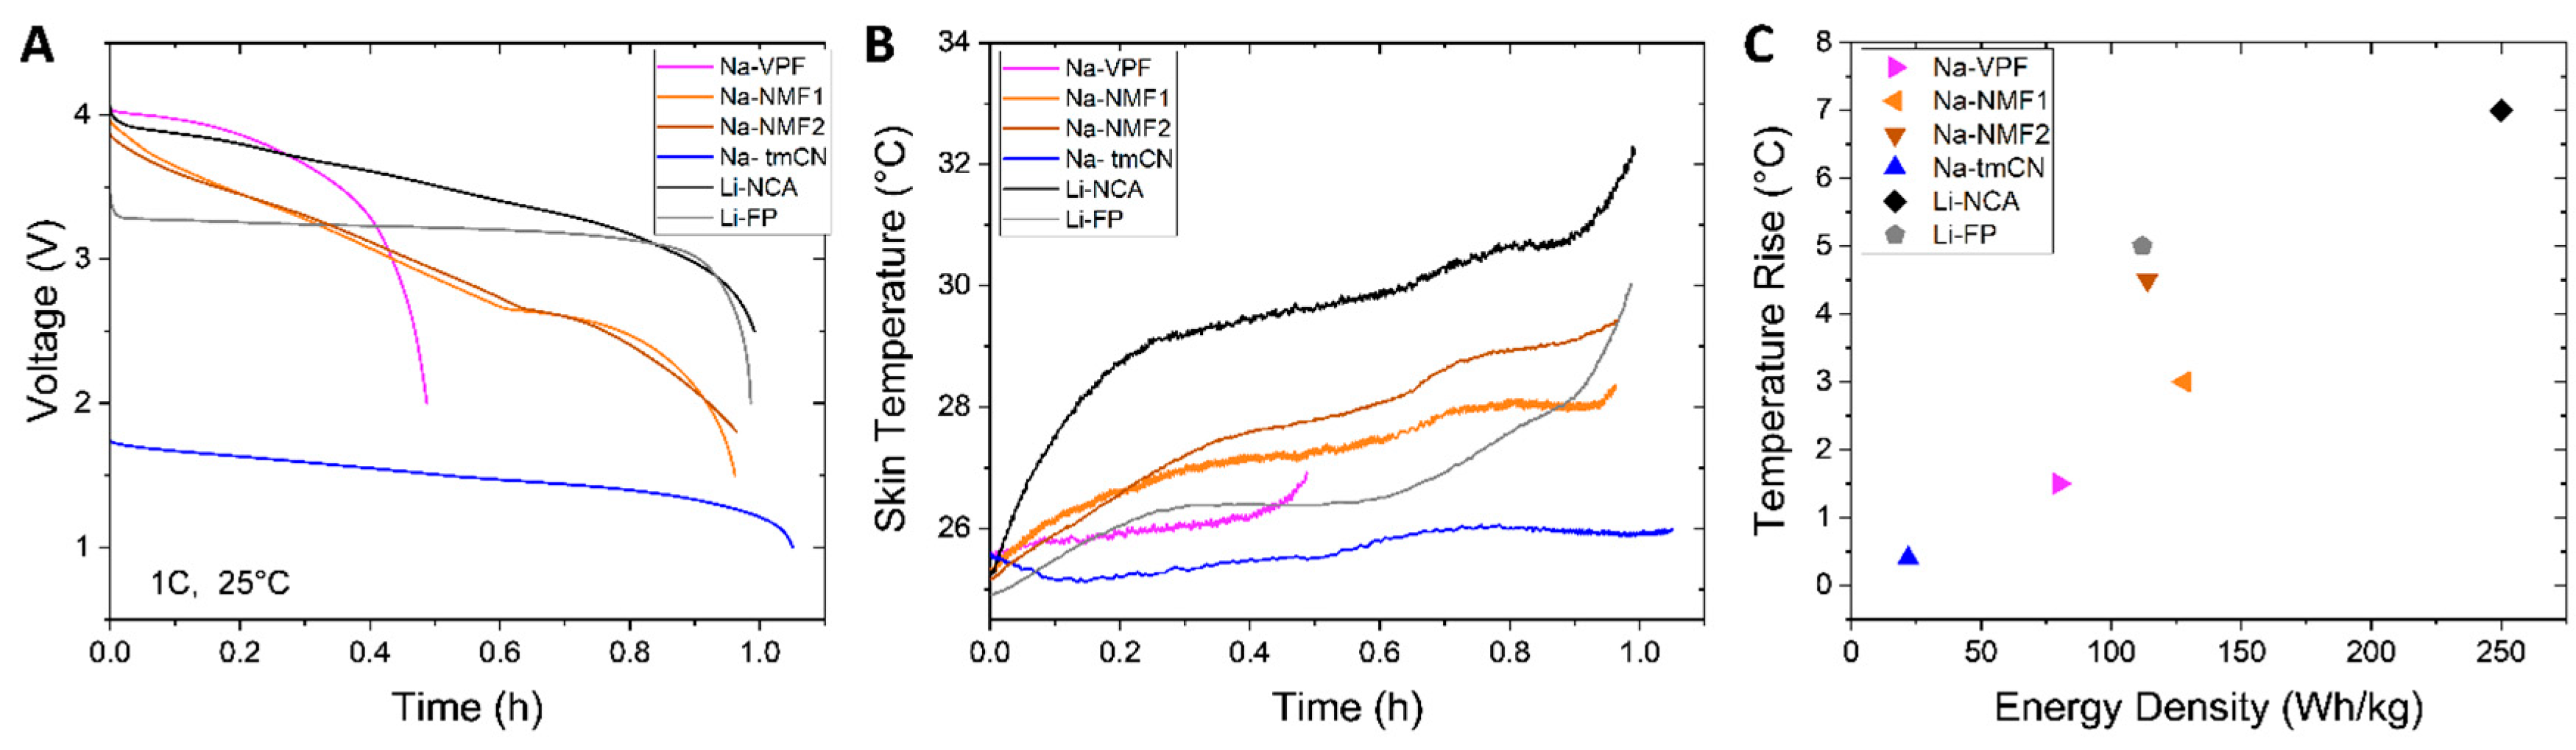
In order to test the stability of the cells in the low voltage range, the cells were discharged to 0V after a normal C/2 charge and discharge and then rested for 5 hours (
Figure 3A). This process was repeated every 5
th cycle and compared to Li-FP and Li-NCA cells (
Figure 3B). The Li-NCA cell exhibited more rapid capacity loss than in its normal operating regime (0.036% compared to 0.12%,
Figure 1B) presumably due to dissolution of the Cu current collector. The Li-FP cell did not exhibit this sort of capacity loss over these 6 excursions. Perhaps it has a higher N:P ratio than the Li-NCA cell providing some built-in resilience to 0V excursions. The Li-FP cell, the Na-NMF1, NMF2, and Na-tmCN cells proved more resilient to over discharge than the Li-NCA cell. However, the Na-VPF cell rapidly decayede with 0V excursions [
12]. With Cu dissolution no longer a risk in Na cells, other undesirable behaviors like further SEI growth or transition metal dissolution from the cathode are more likely contributors to the decay of the Na-VPF cell.
Figure 3C plots the capacity delivered below the cutoff voltage indicating the varying degree of additional electrochemical activity in that region. However, the cells passing greater capacity below their cutoff do not correlate to those decaying quicker under 0V excursion. The Na-VPF, Na-NMF1, and NMF2 cells, pass minimal capacity (<10% nominal), which is likely due to further SEI growth or capacitive charge storage. However, the Na-tmCN cell exhibits an additional plateau at ~0.5V, indicating an additional reaction delivering another 37% of the nominal capacity, which proves reversible, since minimal to no capacity loss is observed with multiple 0V excursions. While some Na-ion batteries are more robust to 0V storage than others, these findings emphasize the Na-ion’s unique capability for 0V storage not accessible to Li-ion.
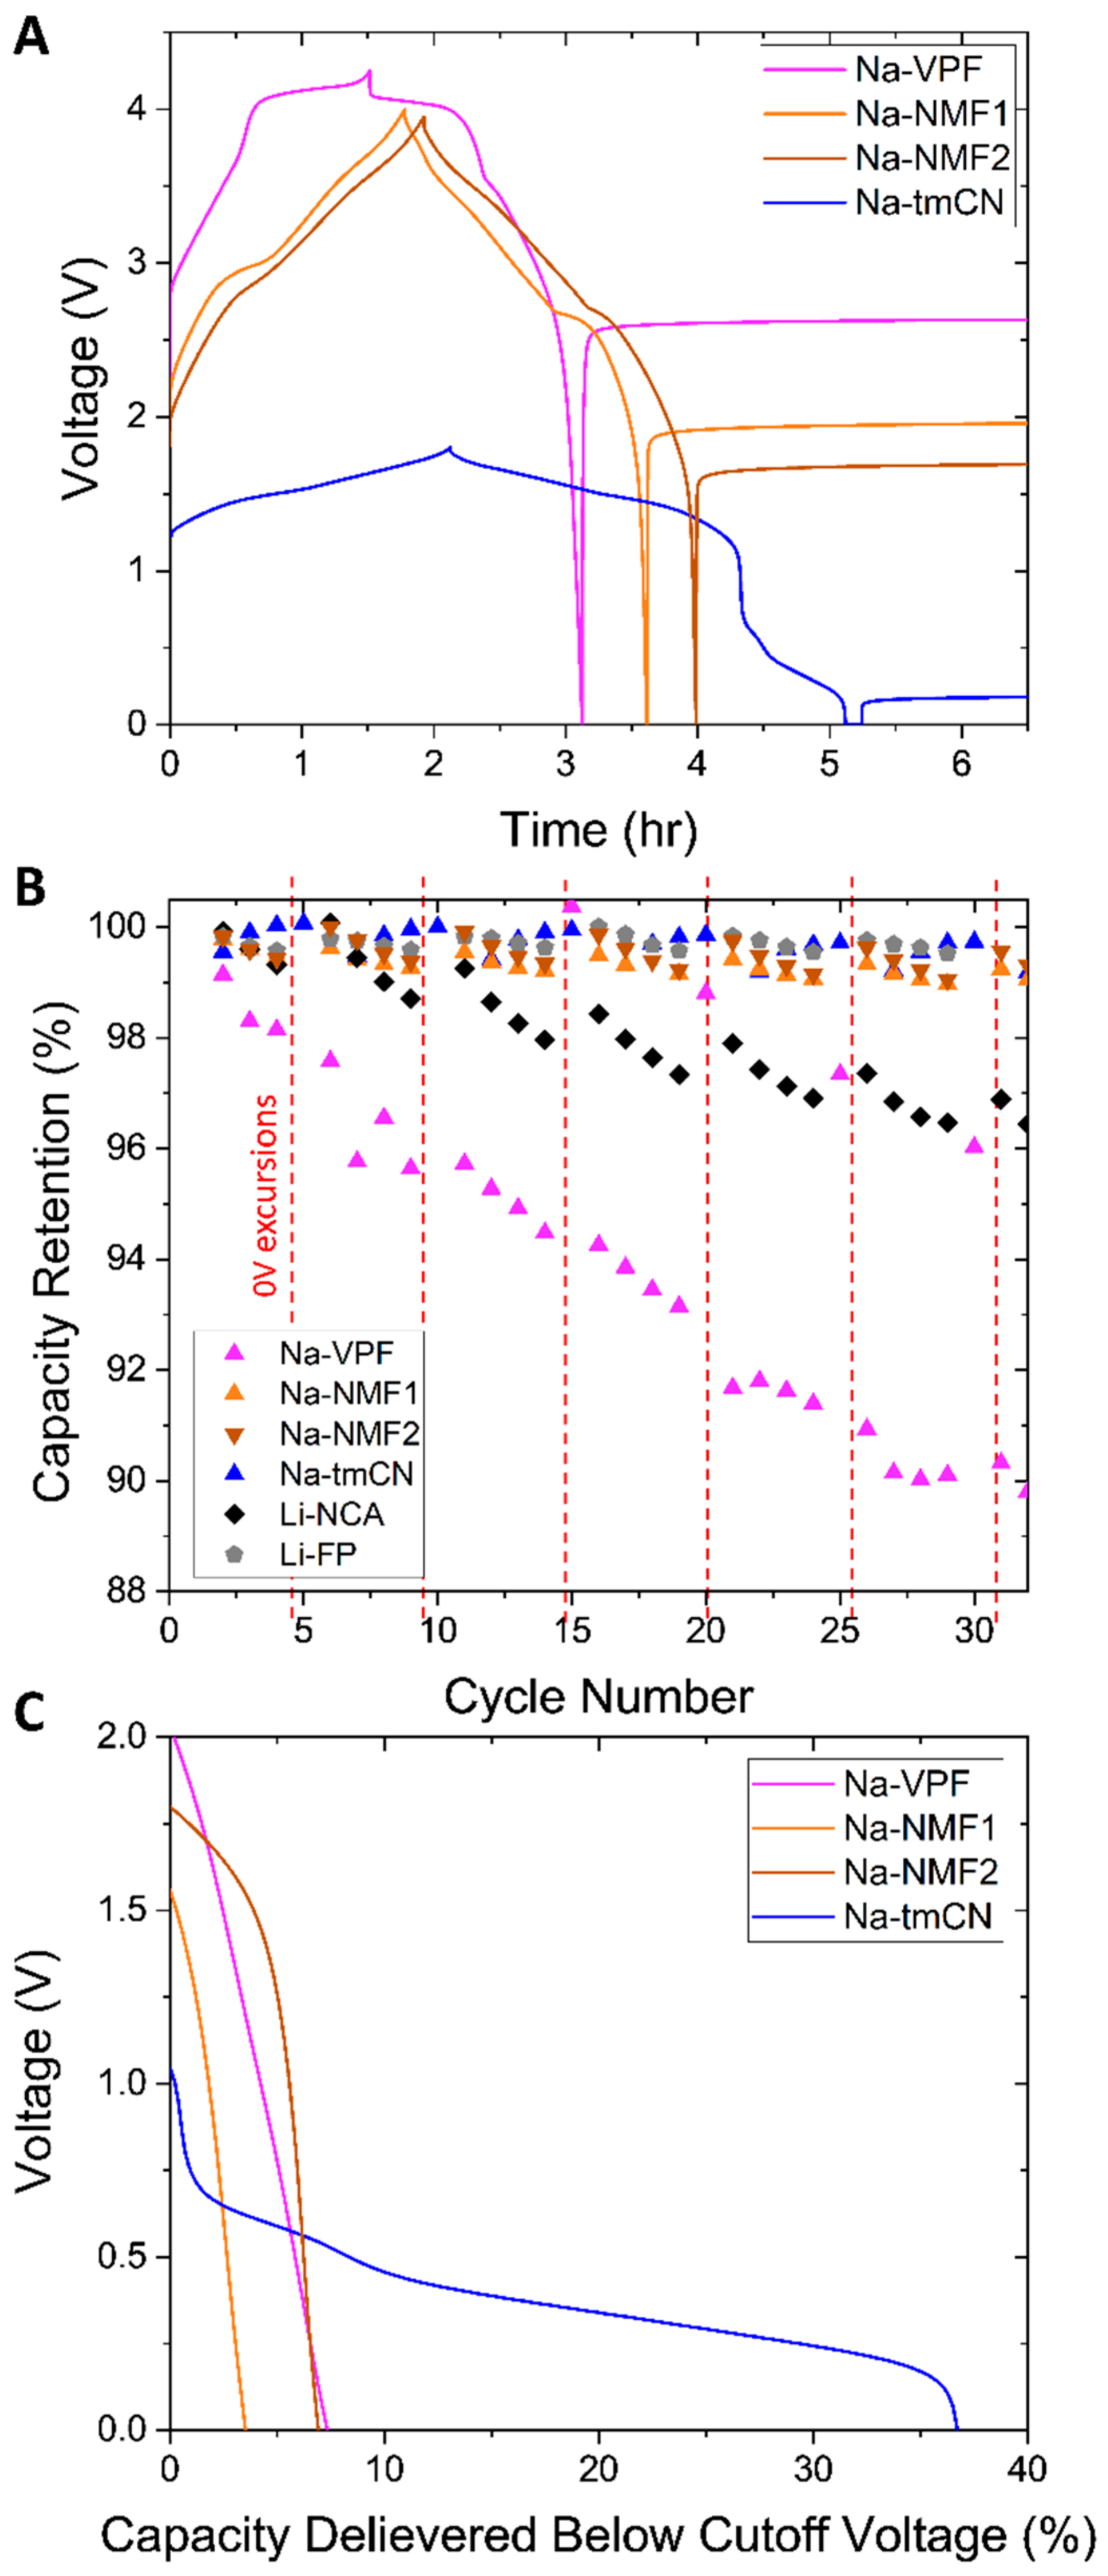
The remainder of this work focuses on safety analysis, beginning with accelerating rate calorimetry (ARC). Each Na-ion battery was fully charged (100% SOC) and tested using the heat-wait-seek (HWS) technique to accurately assess safety parameters like onset of self-heating and peak self-heating rates (
Figure 4A). Among the Na-ion cells tested, only the Na-NMF1 and Na-NMF2 presented behavior consistent with Li-ion battery thermal runaway [
15,
18]. The Na-NMF1 cell began self-heating at 87 °C and then vented at 134 °C and spiked in temperature to 442 °C. The Na-NMF2 cell had a similar vent temperature to Na-NMF1 at 125 °C but did not exhibit self-heating until 147 °C followed by a peak temperature of 487 °C. The delayed self-heating could be due to different electrolyte formulation or safety features provided in manufacturing. Despite the cell (Na-NMF2) going into thermal runaway its later onset indicates a higher degree of safety. The Na-tmCN cell started in a similar manner to the Na-NMF2 cell with a vent at 96 °C followed by self-heating at 177 °C however no thermal runaway was detected in this cell. The Na-tmCN cell maintained mild self-heating rates (<1°C/min) until the experimental cutoff temperature of 300 °C was reached. Finally, the Na-VPF cell exhibited self-heating at the lowest temperature, 51 °C, followed by a vent at 98 °C. Mild self-heating was maintained in the Na-VPF cell until ~200 °C, where the self-heating rate dropped below 0.02 °C/min and the system re-entered HWS mode. Self-heating was minimal beyond 200 °C until the experimental cutoff of 300 °C was reached.
These results are more easily compared on a temperature rate vs. temperature plot (
Figure 4B) which includes the Li-NCA and Li-FP cells. The Na-VPF and Na-tmCN cells did not surpass the ~5 °C/min threshold for thermal runaway [
18]. However, the Na-NMF1 and Na-NMF2 cell well surpassed that reaching 5,607 °C/min and 2,528 °C/min respectively. These peak temperature rates are much higher values than that of the Li-FP cell (7.2 °C/min), despite remarkably similar electrochemical energy density (
Figure 1C,D). We went on to test if the Na-NMF1 and Na-NMF2 cell’s thermal runaway severity reduced at lower SOCs (50, 25 and 0%). For the Na-NMF2 cell, we observed steadily lower peak temperatures (337, 309, and 274; Figure S2A) and self-heating rates (90, 13, and 0.62 °C/min; Figure S2B). However, only the 0% SOC Na-NMF cell drops below the 5 °C/min threshold indicating no thermal runaway. This measurement demonstrates that the 0% SOC case is inert to abuse in cells capable of thermal runaway. Reducing the Na-NMF2 cell’s capacity to 50% results in prevention of thermal runaway. The 100% SOC Na-NMF2 cell had a high self-heating onset of 147 °C, at 50% SOC this was increased to 161°C and the self- heating rate peaks at only 1.2 °C/min.
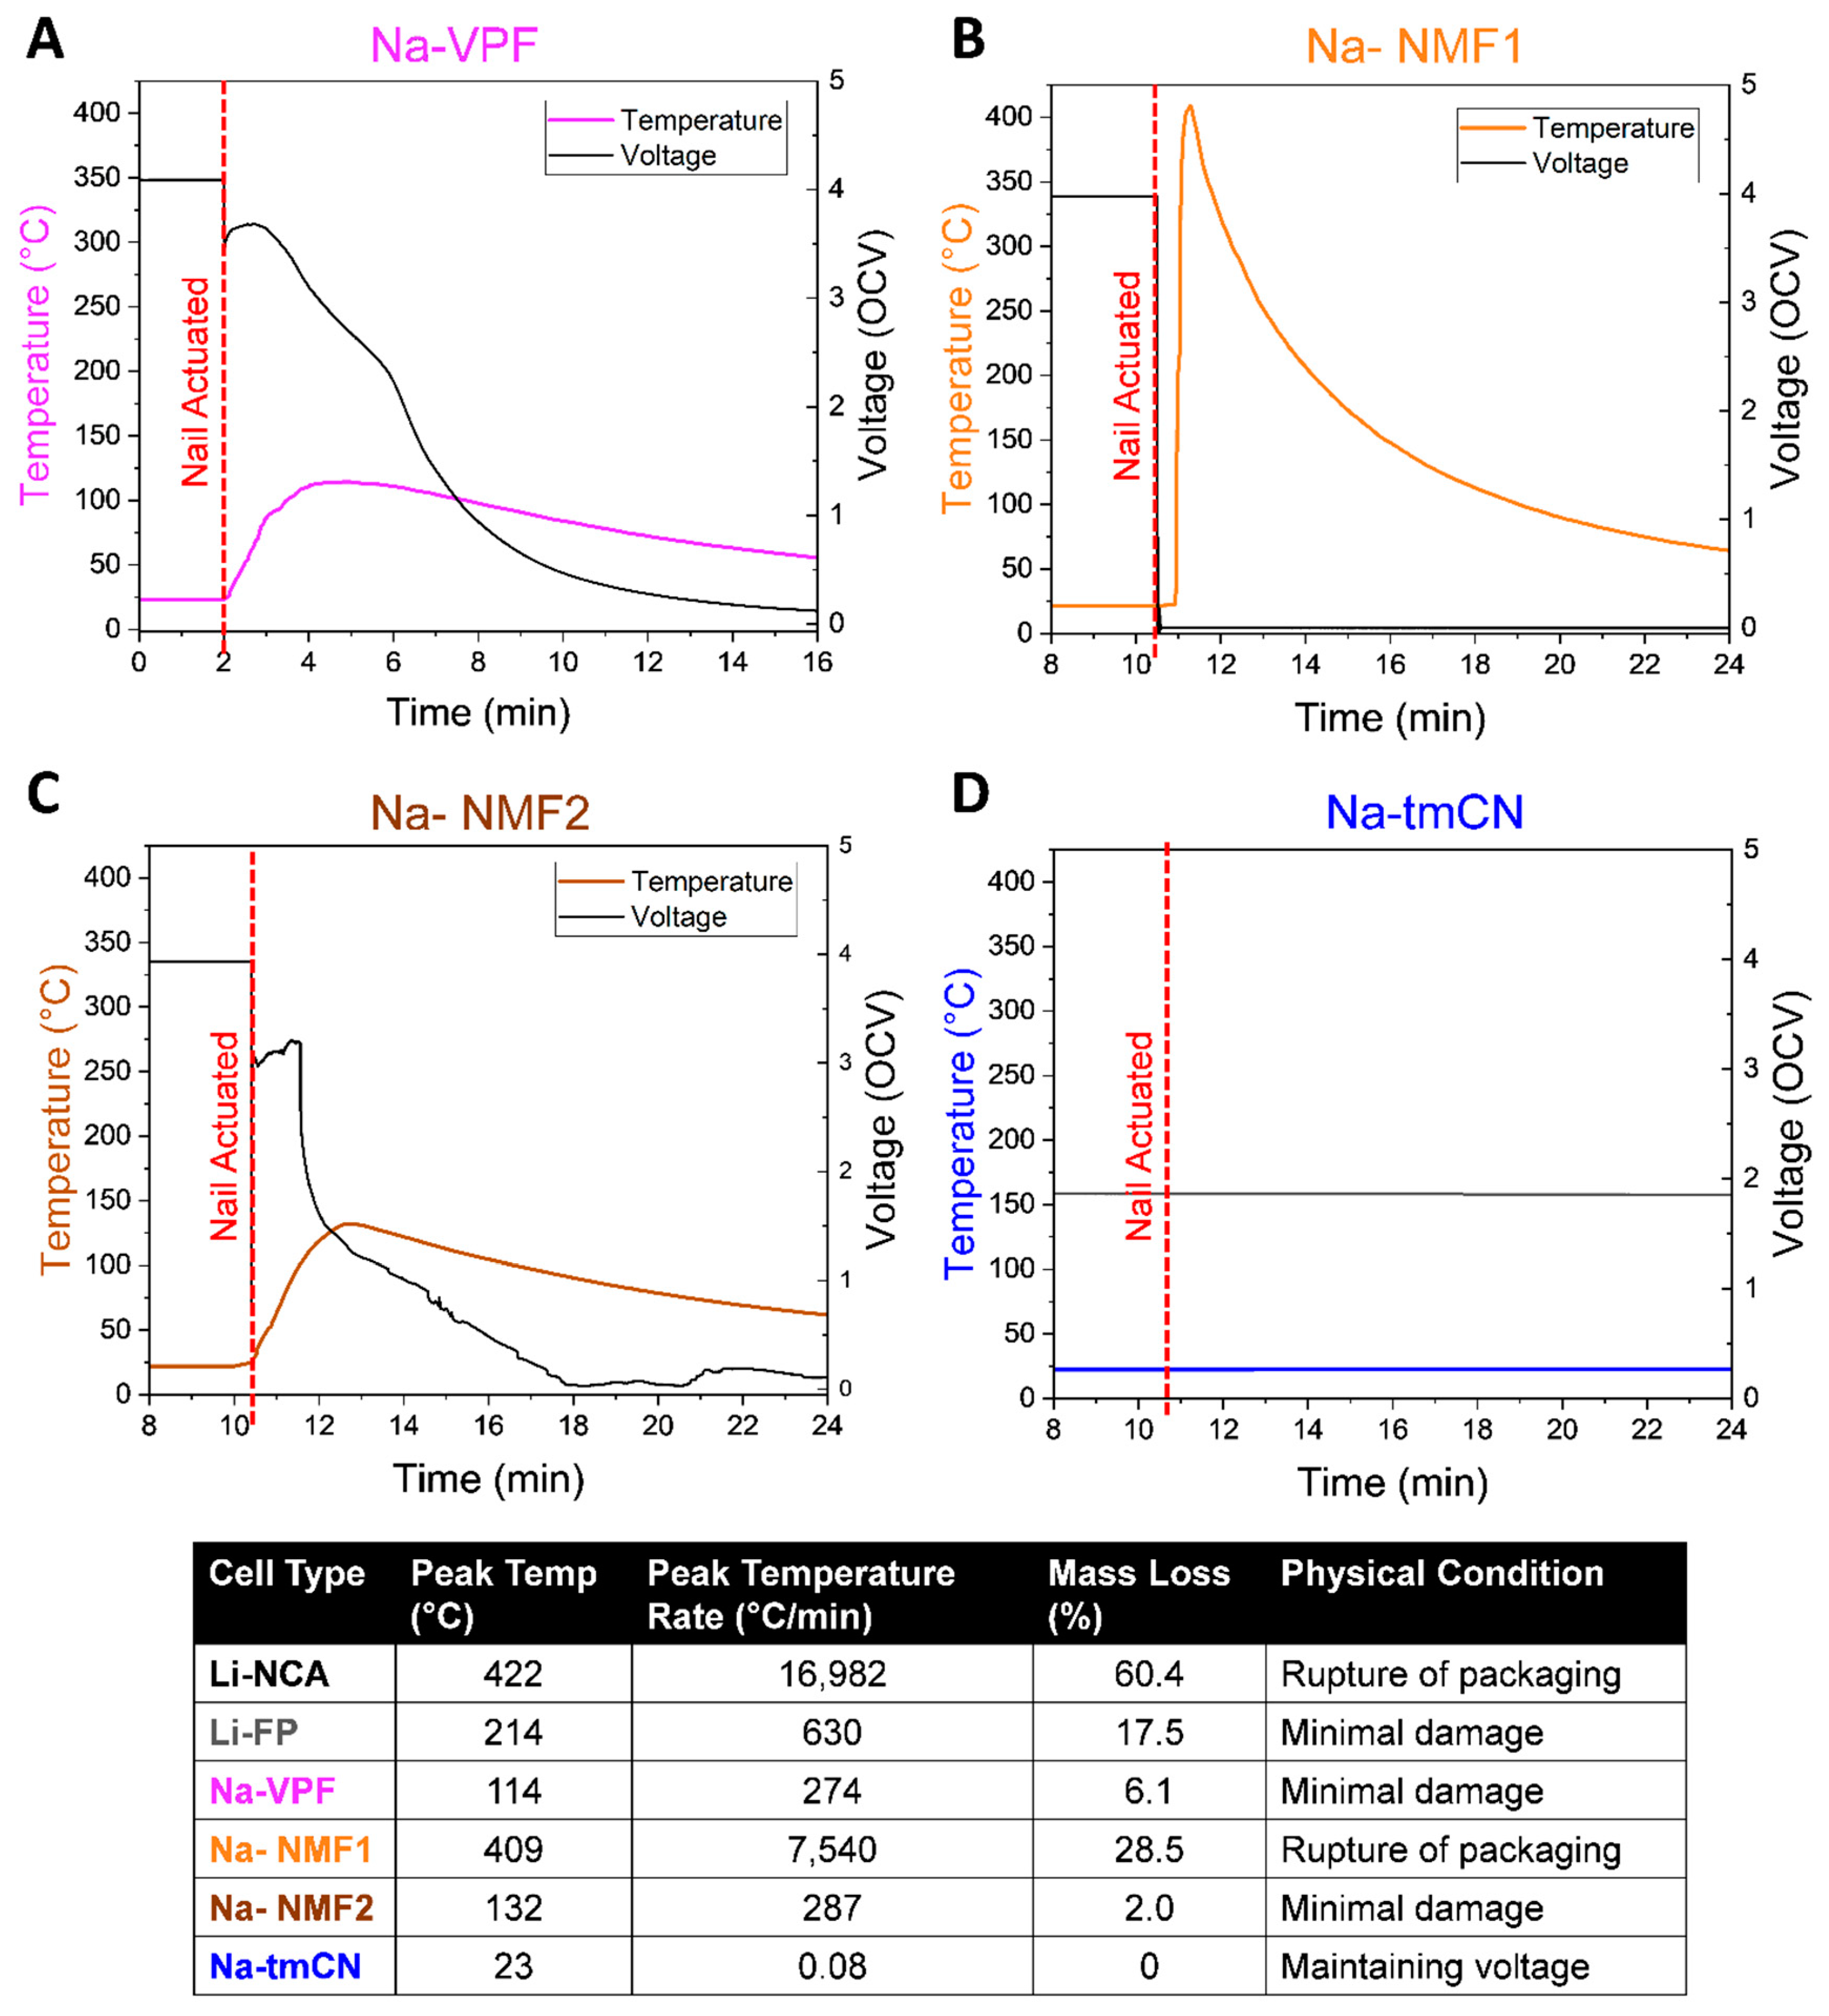
In order to assess a failure mode not induced by heat, nail penetration was investigated (
Figure 5). The reaction of the fully charged Na-ion cells to pneumatically actuated nail penetration revealed the resiliency of each cell to mechanical failure. The Na-VPF cell (
Figure 5A) experienced slow voltage loss, self-heating to 114°C, and minimal damage to the cell. In contrast the Na-NMF1 cell rapidly lost voltage, reached a peak temperature of 409 °C, and was left with packaging damage, revealing the internal electrodes. The Na-NMF2 cell behaved much like the Na-VPF cell with slow voltage loss and self-heating to 132 °C, again indicating a higher degree of safety compared to the electrochemically similar, Na-NMF1 cell. Finally, the Na-tmCN cell did not experience any self-heating upon nail puncture and maintained its cell voltage. In comparison to the Li-ion batteries (Figure S3) the severity of failure, based on peak self-heating rates, was Na-tmCN< Na-VPF< Na-NMF2 < Li-FP<Na-NMF1<Li-NCA.
Since vent gases were apparent from each ARC and nail-penetration test, we utilized an in-line FTIR-g setup to detect gases of interest, including combustion products (CO, CO2, CH4), toxic gases (HCN, HF, NH3), and electrolyte carbonates (DMC, EMC, and PC). The cells were sealed in a pressure vessel and purged with N2 before thermal ramp experiments was completed to 180 °C. The concentration of gases detected is calculated by comparing reference spectra at 180 °C and ranging ppm values in regions of the spectra that are not convoluted with other species of interest. The error between the experimental spectra and the reference spectra is plotted with the detected values throughout each experiment. Visualization of this process is provided in Figure S4A.
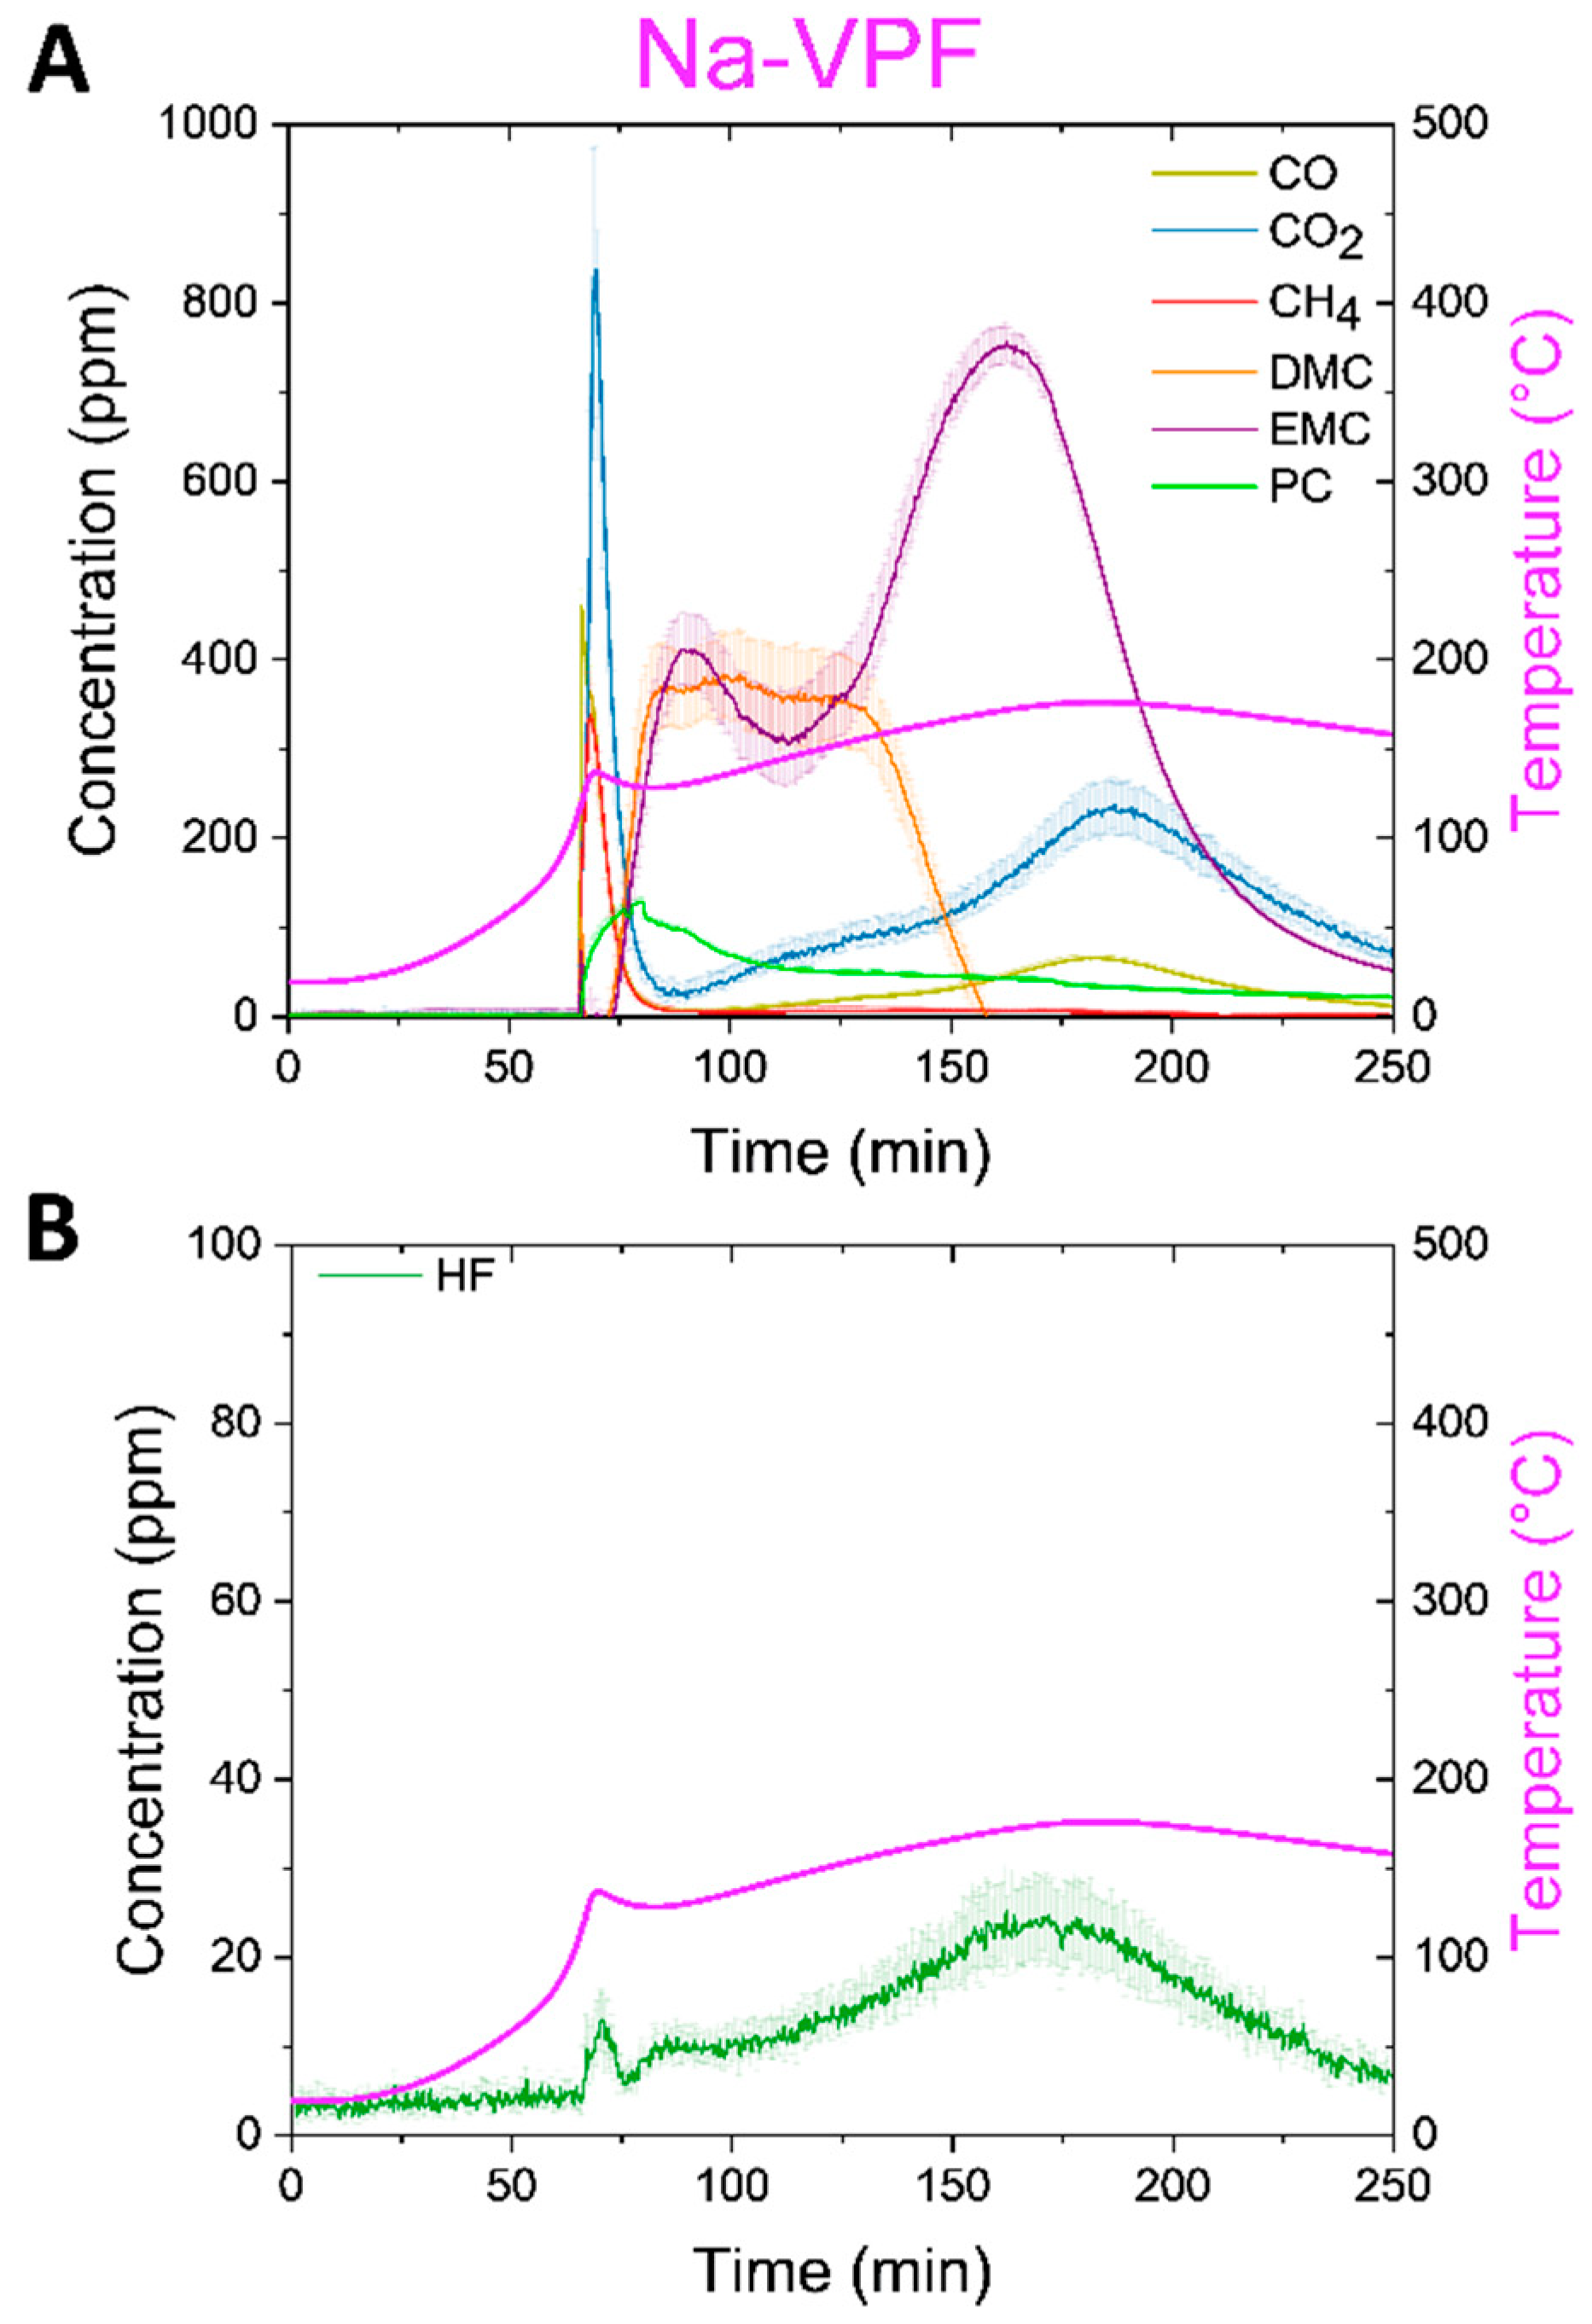
Beginning with the Na-VPF cell (
Figure 6A), we observe a spike in the temperature ramp at ~100 °C, in conjunction with detection of several gases. CO, CO
2, and CH
4 were detected in the range of ~300-800 ppm indicative of material combustion. HF was also detected at 25 ± 5 ppm (
Figure 6B). Following the first detected gases, carbonates were detected as the electrolyte was boiled through the now open cell vents. PC was detected first peaking at ~150ppm, followed by DMC up to 400 ppm, and finally EMC up to 800 ppm. DMC and EMC present in order of their boiling points, 90 °C and 107 °C respectively, but PC is observed well below its boiling point of 242 °C. As the test progressed, the cell was heated until 180 °C was reached, CO, CO
2 and HF evolved a second time with less intensity around 175 °C.
Next, the Na-NMF cells were investigated. First the Na-NMF1 cell, which has evidence of both vent and thermal runaway along the orange temperature curve (
Figure 7A), much like in the cell’s ARC data (
Figure 4A), was investigated. These features correlate with detection of large concentrations of combustion gases (CO, CO
2 and CH
4) up to10,000 ppm at the vent (~150 °C) and up to 50,000 ppm at the thermal runaway (~200 °C). Other gases were detected at smaller quantities (
Figure 7B) as seen in
Figure 6B. Notably carbonates were detected up to 500 ppm prior to the cell venting at ~100 °C. There are detected in similar order and quantity to the Na-VPF cell, first PC, then DMC, and finally EMC. The similarities between these detected gases in the Na-VPF and Na-NMF1 cells indicate that the electrolytes are likely similar. However, the detection of the carbonates prior to venting in the Na-NMF1 cell presents concern about the quality of cell manufacturing, allowing leaking and delaying venting. At thermal runaway, HF is detected at 14 ±8 ppm (
Figure 7C). Due to the relatively high degree of error, HF detection was compared to reference spectra in Figure S4A, confirming peaks in the proper range for the Na-VPF, Na-NMF1, and Li cells. In stark difference to the Na-NMF1 cell, the Na-NMF2 cell does not experience thermal runaway during the thermal ramp experiments; just a vent is detected at ~140 °C (
Figure 7D), a finding that was replicated twice (Figure S5). The lack of thermal runaway in thermal ramp experiments is due to the low self-heating rate of the Na-NMF2 cell below 200 °C (
Figure 4B). At the cutoff temp of the thermal ramp (180 °C) the self-heating rate is ~0.26 °C/min well below the 5 °C/min threshold for thermal runaway. The Na-NMF2 cell did experience thermal runaway during ARC testing (
Figure 4A) but at a higher onset temperature than the Na-NMF1 cell (147 °C compared to 87 °C). The gases detected upon vent of the Na-NMF2 cell are first combustion gases CO and CO
2, followed by carbonates, much like the observations from the Na-VPF cell in
Figure 5. In this cell, less PC and DMC were detected in exchange for more EMC, indicating a different electrolyte blend than the Na-VPF and Na-NMF1 cells. Carbonates were not detected prior to venting in the Na-NMF2 cell, in contrast to the Na-NMF1 cell, this indicates more robust sealing and vent mechanisms, which may explain its stability to higher temperature and lack of thermal runaway in this test. Further HF was not detected (
Figure 7E). This finding points to improved manufacturing as the property providing a higher degree of safety in ARC, nail penetration, and thermal ramp tests, since cell active materials and electrochemical energy density are similar.
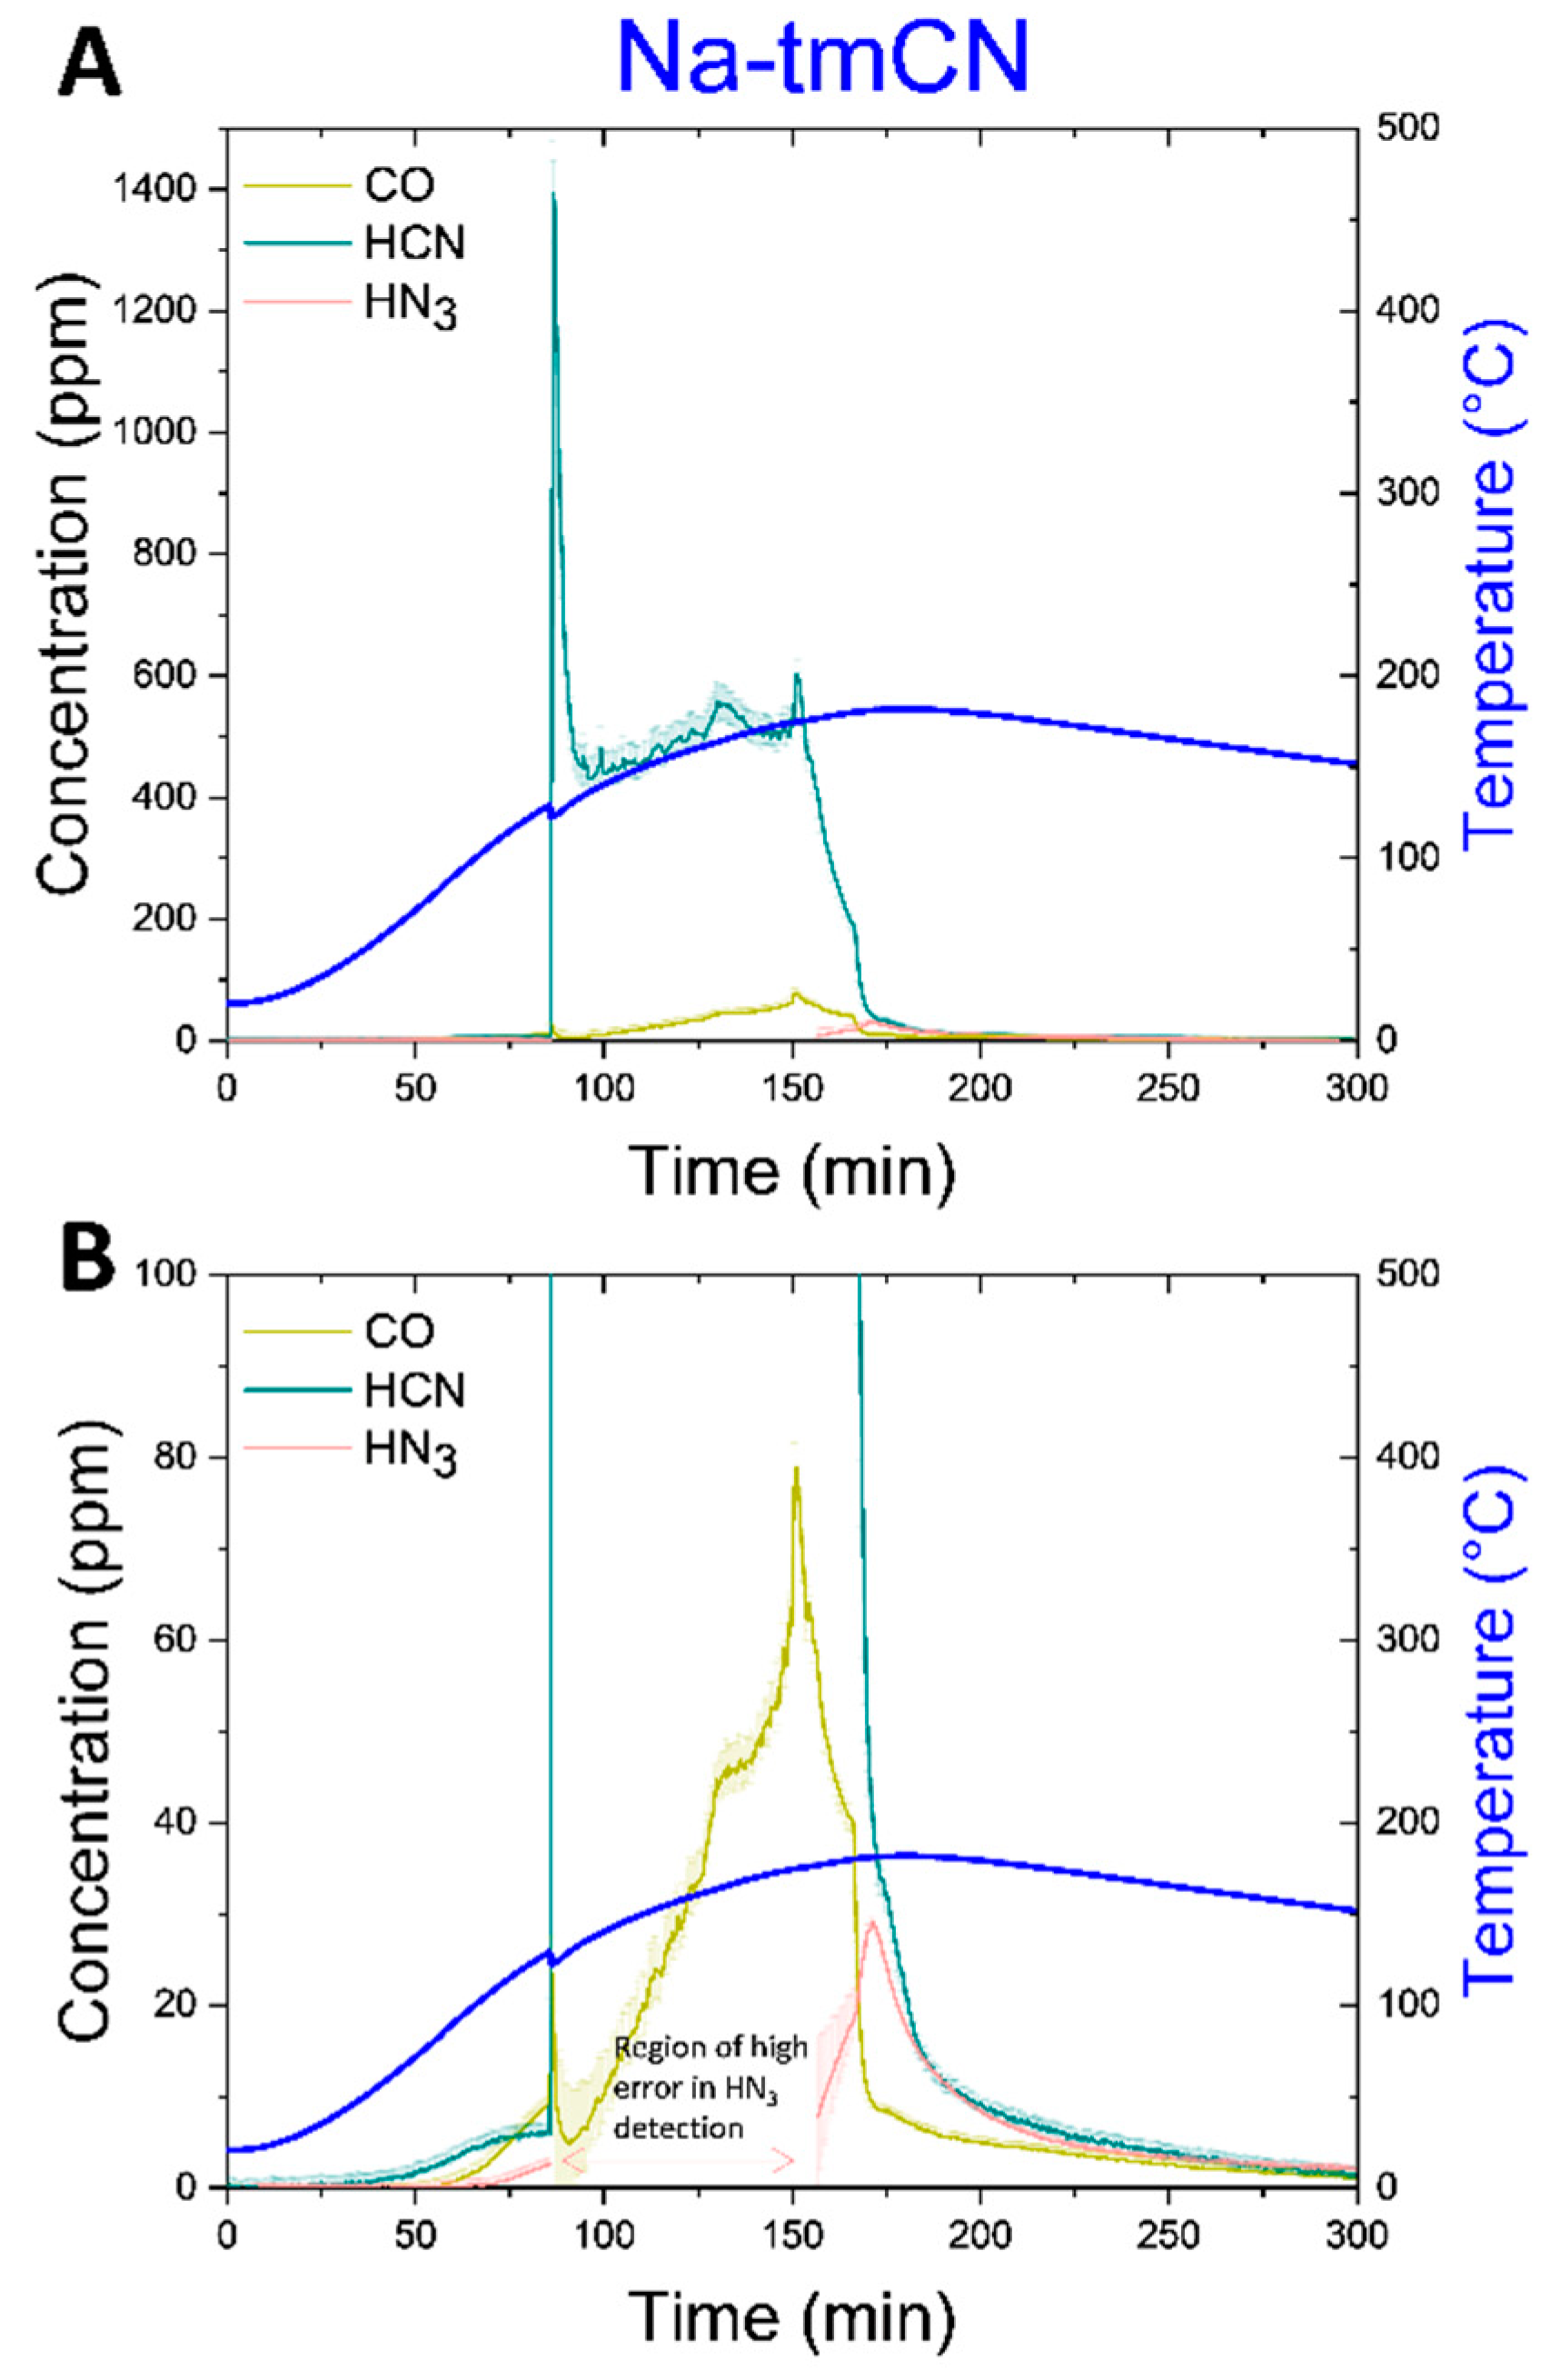
Finally, the Na-tmCN cell was tested (
Figure 5C). This cell was not sealed in a pressure vessel, making gas analysis less reliable. This cell shows one distinct feature in the temperature ramp, where the cell vented at ~120 °C, correlating with peak detection of HCN gas to ~1400 ppm, followed by steady detection at ~500 ppm until the test is terminated (
Figure 8A). With such a high detection of HCN, we again compared the instantaneous FTIR spectra to the reference spectra and confirmed agreement with peak shape and location (Figure S4B). After the cell breaching, CO was detected to about 80 ppm (
Figure 8B), when the cell was heated to ~170 °C. Finally, ~20 ppm of NH
3 was detected near the end to the test at ~180 °C. Notably, like the Na-NMF1 cell all three gases detected for the Na-tmCN cell were detected prior to cell venting beginning at around only ~50 °C. After the vent at ~86 min until ~160 min, the HN
3 detection was reported with >100% error. Investigating the FTIR spectra in this region, revealed that HN
3 was not detected here. Therefore, this portion of the data was removed. In the region of high error, it is likely that a different gas that we did not fit the spectra for, which has some peaks in the fitted region of HN
3, was present. This emphasizes that we have not detected all gases formed in all experiments, especially hydrogen. However, we feel confident in the combustion products, carbonates, and acid gases that we are reporting for each cell.
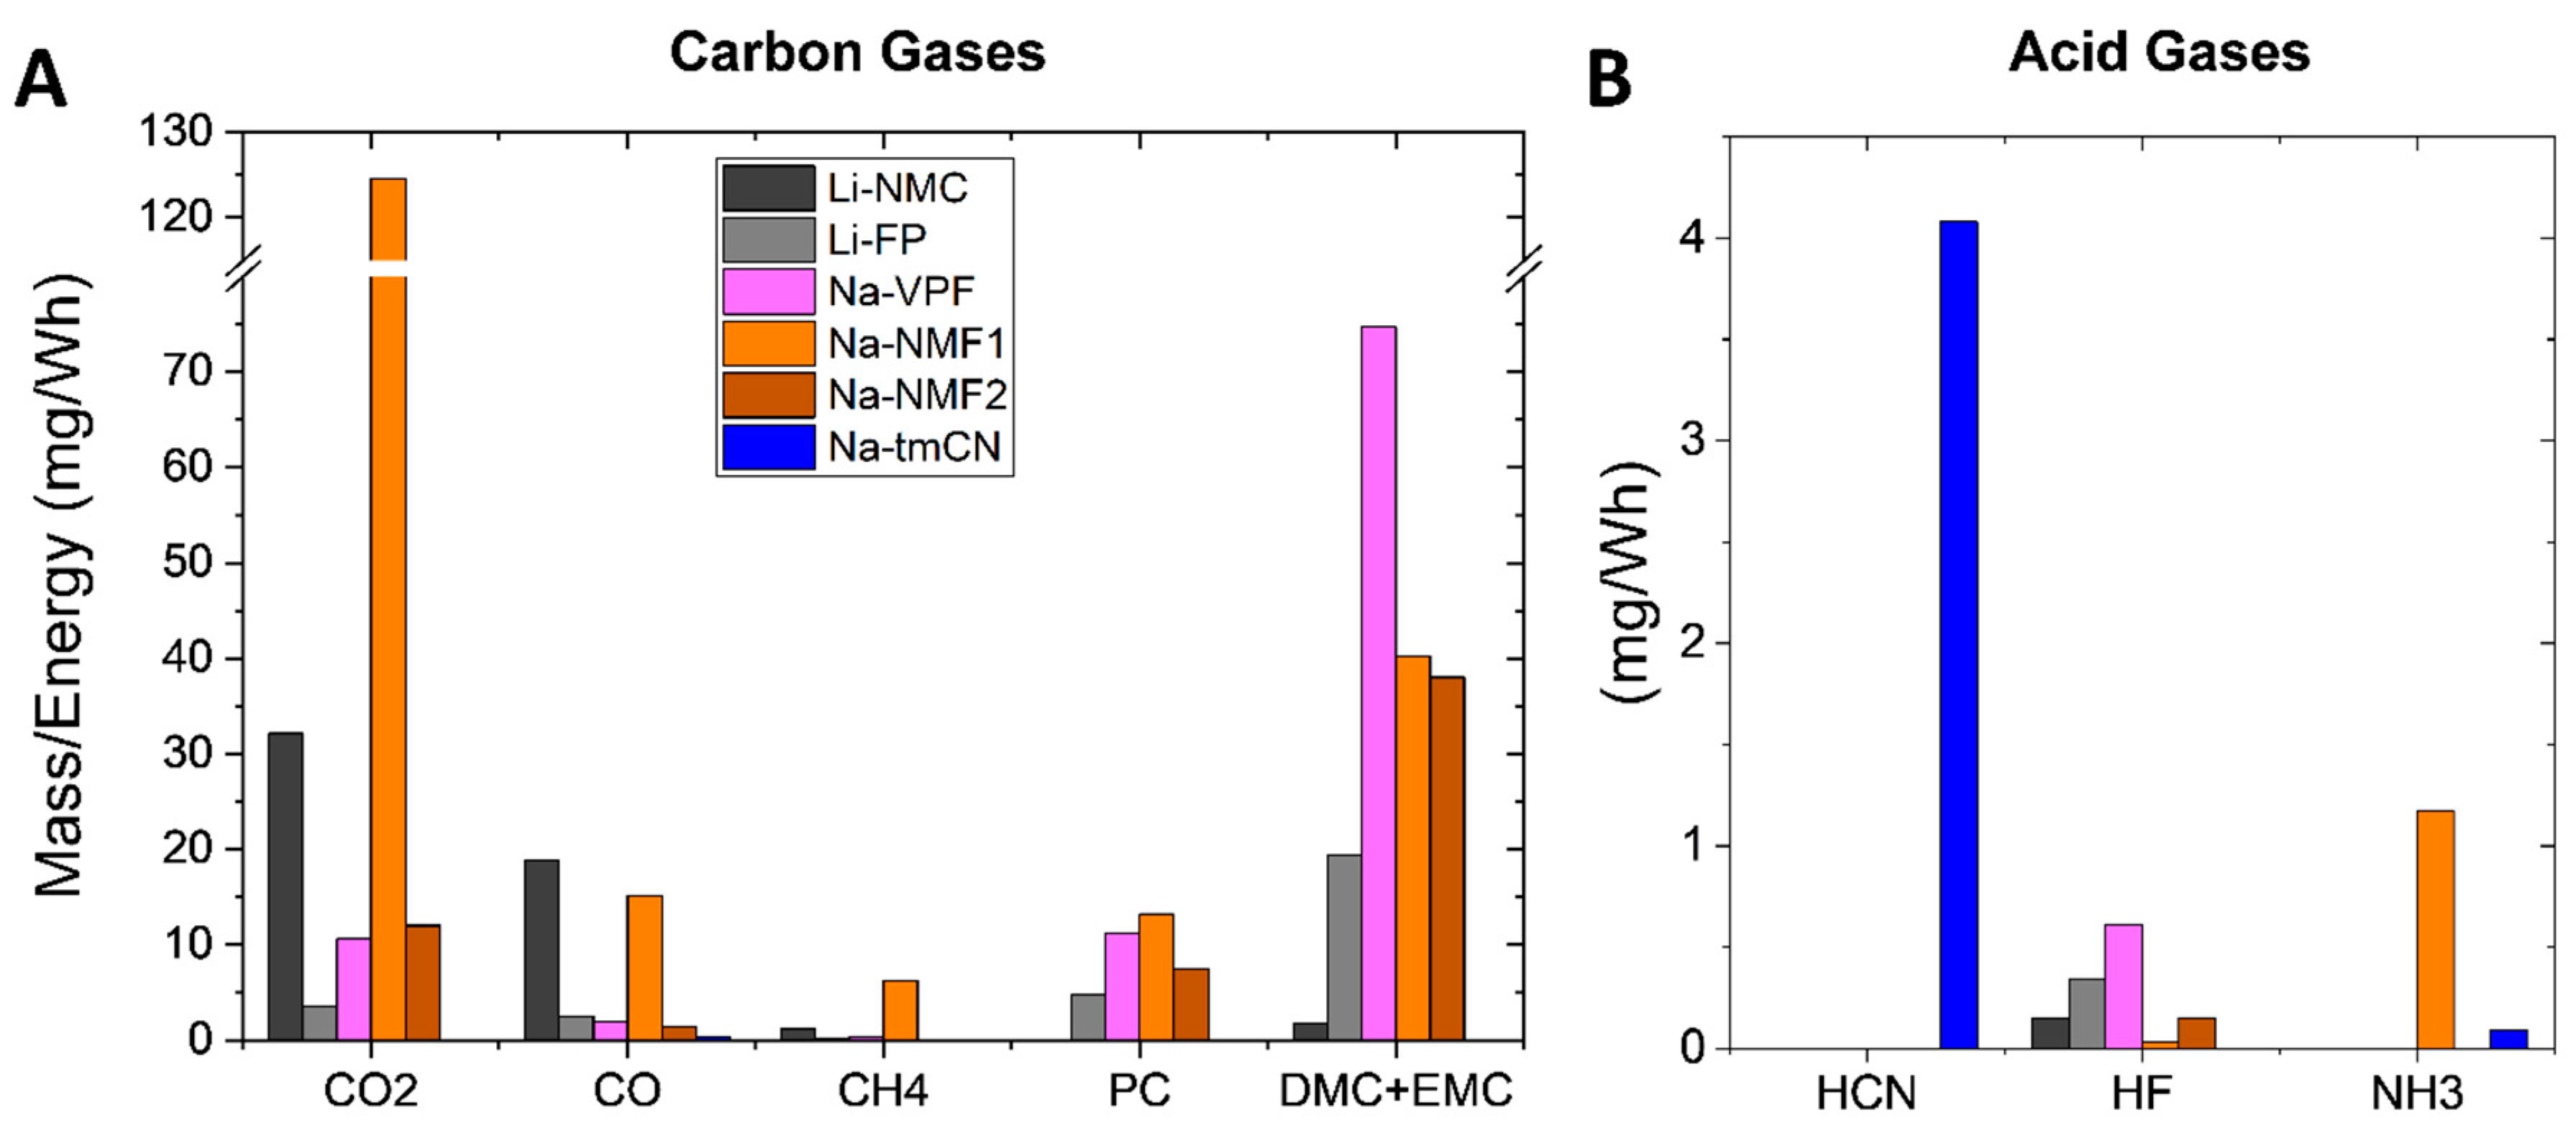
For fair comparison of the gases detected from each Na cell (
Figure 6,
Figure 7 and
Figure 8) and Li cell (Figures S6 and S7), the concentration in ppm integrated over the duration of the test and quantified based on the test cell flow rate, size, pressure and temperature, as well as the ideal gas law. The mass of each detected gas was then normalized to cell energy in Wh in
Figure 9. We note that for the Na-NMF the concentrations of combustion gases are similar to Li-NMC, while for the Na-VPF and Na-NMF the concentrations are similar to Li-LFP. Among the toxic gases analyzed, the most HCN is detected from the Na-tmCN cell which contains CN in its unit cells. Similar concentrations (~10 ppm/Ah) of HF were detected from the Li-NMC, Li-FP, Na-VPF and Na-NMF cells. Finally carbonates of similar concentrations were detected from the Li-NMC, Li-FP, Na-VPF and Na-NMF cells.
In conclusion, this work investigates three different commercial Na-ion batteries representing the cells containing the three most popular cathode types among research and commercialization (polyanion, transition metal oxide, and Prussian blue analogs). The Na-VPF, Na-NMF, and Na-tmCN deliver a wide range of energy density and safety behaviors emphasizing the diversity of the Na-ion battery market and the early stages of maturation of the commercially available cells. Some cell specific conclusions include: the Na-VPF cell exhibits poor cyclability but good safety response to thermal and physical insult; the Na-NMF cell delivers energy and power density comparable to Li-FP cells but which a lower degree of safety, and the Na-tmCN cell is robust to conventional and 0V cycling and exhibits a high degree of safety but delivers a low energy density. We present a radar plot to emphasis parameters prominent in Na-ion batteries not provided by Li-ion batteries (rate capability, safety, and long cycle life) to emphasis the benefit of diversifying the battery landscape with this emerging chemistry. Finally, we want to emphasize that these are only four cells from four vendors and the findings should be used for early assessment but not to generalize about each cathode type.
Supporting Information: Lower SOC ARC tests for Na-NMF1 and Na-NMF2 cells. Li-ion thermal ramp and nail penetration tests. HF, HCN, and HN3 detections compared to FTIR-g standards.
Acknowledgements
The authors acknowledge funding and technical support from DOT PHMSA program 693JK323N00010.
References
- Whittingham, M. S. , Chemistry of intercalation compounds: Metal guests in chalcogenide hosts. Progress in Solid State Chemistry 1978, 12, 41–99. [Google Scholar] [CrossRef]
- Doeff, M. M.; Ma, Y.; Visco, S. J.; De Jonghe, L. C. , Electrochemical Insertion of Sodium into Carbon. Journal of The Electrochemical Society 1993, 140, L169. [Google Scholar] [CrossRef]
- Olivetti, E. A.; Ceder, G.; Gaustad, G. G.; Fu, X. , Lithium-Ion Battery Supply Chain Considerations: Analysis of Potential Bottlenecks in Critical Metals. Joule 2017, 1, 229–243. [Google Scholar] [CrossRef]
- Gao, Y.; Zhang, H.; Peng, J.; Li, L.; Xiao, Y.; Li, L.; Liu, Y.; Qiao, Y.; Chou, S.-L. , A 30-year overview of sodium-ion batteries. Carbon Energy 2024, 6, e464. [Google Scholar] [CrossRef]
- Hirsh, H. S.; Li, Y.; Tan, D. H. S.; Zhang, M.; Zhao, E.; Meng, Y. S. , Sodium-Ion Batteries Paving the Way for Grid Energy Storage. Advanced Energy Materials 2020, 10, 2001274. [Google Scholar] [CrossRef]
- Hwang, J.-Y.; Myung, S.-T.; Sun, Y.-K. , Sodium-ion batteries: present and future. Chemical Society Reviews 2017, 46, 3529–3614. [Google Scholar] [CrossRef] [PubMed]
- Li, M. Elevating the Practical Application of Sodium-Ion Batteries through Advanced Characterization Studies on Cathodes Energies [Online], 2023.
- Dubarry, M.; Beck, D. , Communication—Forecast of the Impact of Degradation Modes on a Commercial Hard Carbon/Na3V2(PO4)2F3-based Na-ion Battery. Journal of The Electrochemical Society 2024, 171, 080541. [Google Scholar] [CrossRef]
- He, M.; Mejdoubi, A. E. L.; Chartouni, D.; Morcrette, M.; Troendle, P.; Castiglioni, R. , High power NVPF/HC-based sodium-ion batteries. Journal of Power Sources 2023, 588, 233741. [Google Scholar] [CrossRef]
- Li, M.; Du, Z.; Khaleel, M. A.; Belharouak, I. , Materials and engineering endeavors towards practical sodium-ion batteries. Energy Storage Materials 2020, 25, 520–536. [Google Scholar] [CrossRef]
- Dorau, F.; Sommer, A.; Koloch, J.; Roess-Ohlenroth, R.; Schreiber, M.; Neuner, M.; Abo Gamra, K.; Lin, Y.; Schöberl, J.; Bilfinger, P.; Grabmann, S.; Stumper, B.; Katzenmeier, L.; Lienkamp, M.; Daub, R. , Comprehensive Analysis of Commercial Sodium-Ion Batteries: Structural and Electrochemical Insights. Journal of The Electrochemical Society 2024. [Google Scholar] [CrossRef]
- Desai, P.; Huang, J.; Foix, D.; Tarascon, J.-M.; Mariyappan, S. , Zero volt storage of Na-ion batteries: Performance dependence on cell chemistry! Journal of Power Sources 2022, 551, 232177. [Google Scholar] [CrossRef]
- Chak, C.; Jayakumar, R.; Shipitsyn, V.; Bass, E.; McCloskey, R.; Zuo, W.; Le, P. M. L.; Xu, J.; Ma, L. , Unveiling the Thermal Stability of Sodium Ion Pouch Cells Using Accelerating Rate Calorimetry. Journal of The Electrochemical Society 2024, 171, 070512. [Google Scholar] [CrossRef]
- Xie, Y.; Xu, G.-L.; Che, H.; Wang, H.; Yang, K.; Yang, X.; Guo, F.; Ren, Y.; Chen, Z.; Amine, K.; Ma, Z.-F. , Probing Thermal and Chemical Stability of NaxNi1/3Fe1/3Mn1/3O2 Cathode Material toward Safe Sodium-Ion Batteries. Chemistry of Materials 2018, 30, 4909–4918. [Google Scholar] [CrossRef]
- Chen, J.; Rui, X.; Hsu, H.; Lu, L.; Zhang, C.; Ren, D.; Wang, L.; He, X.; Feng, X.; Ouyang, M. , Thermal runaway modeling of LiNi0.6Mn0.2Co0.2O2/graphite batteries under different states of charge. Journal of Energy Storage, 1040. [Google Scholar] [CrossRef]
- Frith, J. T.; Lacey, M. J.; Ulissi, U. , A non-academic perspective on the future of lithium-based batteries. Nature Communications 2023, 14, 420. [Google Scholar] [CrossRef] [PubMed]
- Chen, S.; Niu, C.; Lee, H.; Li, Q.; Yu, L.; Xu, W.; Zhang, J.-G.; Dufek, E. J.; Whittingham, M. S.; Meng, S.; Xiao, J.; Liu, J. , Critical Parameters for Evaluating Coin Cells and Pouch Cells of Rechargeable Li-Metal Batteries. Joule 2019, 3, 1094–1105. [Google Scholar] [CrossRef]
- Klein, E. J.; Carter, R.; Love, C. T.; Klein, E. J.; Love, C. T. , Accelerating Rate Calorimetry and Complementary Techniques to Characterize Battery Safety Hazards. JoVE 2021, (175), e60342. [Google Scholar] [CrossRef] [PubMed]
- Lei, B.; Zhao, W.; Ziebert, C.; Uhlmann, N.; Rohde, M.; Seifert, H. J. Experimental Analysis of Thermal Runaway in 18650 Cylindrical Li-Ion Cells Using an Accelerating Rate Calorimeter Batteries [Online], 2017.
- Nguyen, T. P.; Kim, I. T. Recent Advances in Sodium-Ion Batteries: Cathode Materials Materials [Online], 2023.
- Gupta, P.; Pushpakanth, S.; Haider, M. A.; Basu, S. , Understanding the Design of Cathode Materials for Na-Ion Batteries. ACS Omega 2022, 7, 5605–5614. [Google Scholar] [CrossRef]
- Tarascon, J.-M. , Na-ion versus Li-ion Batteries: Complementarity Rather than Competitiveness. Joule 2020, 4, 1616–1620. [Google Scholar] [CrossRef]
- Yang, C.; Xin, S.; Mai, L.; You, Y. , Materials Design for High-Safety Sodium-Ion Battery. Advanced Energy Materials 2021, 11, 2000974. [Google Scholar] [CrossRef]
- Laufen, H.; Klick, S.; Ditler, H.; Quade, K. L.; Mikitisin, A.; Blömeke, A.; Schütte, M.; Wasylowski, D.; Sonnet, M.; Henrich, L.; Schwedt, A.; Stahl, G.; Ringbeck, F.; Mayer, J.; Sauer, D. U. , Multi-method characterization of a commercial 1.2 Ah sodium-ion battery cell indicates drop-in potential. Cell Reports Physical Science. [CrossRef]
- Li, Y.; Hu, Y.-S.; Qi, X.; Rong, X.; Li, H.; Huang, X.; Chen, L. , Advanced sodium-ion batteries using superior low cost pyrolyzed anthracite anode: towards practical applications. Energy Storage Materials 2016, 5, 191–197. [Google Scholar] [CrossRef]
- Robinson, J. B.; Finegan, D. P.; Heenan, T. M. M.; Smith, K.; Kendrick, E.; Brett, D. J. L.; Shearing, P. R. , Microstructural Analysis of the Effects of Thermal Runaway on Li-Ion and Na-Ion Battery Electrodes. Journal of Electrochemical Energy Conversion and Storage 2017, 15. [Google Scholar] [CrossRef]
- Yue, Y.; Jia, Z.; Li, Y.; Wen, Y.; Lei, Q.; Duan, Q.; Sun, J.; Wang, Q. , Thermal runaway hazards comparison between sodium-ion and lithium-ion batteries using accelerating rate calorimetry. Process Safety and Environmental Protection 2024, 189, 61–70. [Google Scholar] [CrossRef]
- Zhou, Q.; Li, Y.; Tang, F.; Li, K.; Rong, X.; Lu, Y.; Chen, L.; Hu, Y.-S. , Thermal Stability of High Power 26650-Type Cylindrical Na-Ion Batteries. Chinese Physics Letters 2021, 38, 076501. [Google Scholar] [CrossRef]
- Bischof, K.; Marangon, V.; Kasper, M.; Aracil Regalado, A.; Wohlfahrt-Mehrens, M.; Hölzle, M.; Bresser, D.; Waldmann, T. , Evaluation of commercial 18650 and 26700 sodium-ion cells and comparison with well-established lithium-ion cells. Journal of Power Sources Advances 2024, 27, 100148. [Google Scholar] [CrossRef]
- He, M.; Davis, R.; Chartouni, D.; Johnson, M.; Abplanalp, M.; Troendle, P.; Suetterlin, R.-P. , Assessment of the first commercial Prussian blue based sodium-ion battery. Journal of Power Sources 2022, 548, 232036. [Google Scholar] [CrossRef]
- Bugryniec, P. J.; Resendiz, E. G.; Nwophoke, S. M.; Khanna, S.; James, C.; Brown, S. F. , Review of gas emissions from lithium-ion battery thermal runaway failure — Considering toxic and flammable compounds. Journal of Energy Storage 2024, 87, 111288. [Google Scholar] [CrossRef]
- Larsson, F.; Andersson, P.; Blomqvist, P.; Mellander, B.-E. , Toxic fluoride gas emissions from lithium-ion battery fires. Scientific Reports 2017, 7, 10018. [Google Scholar] [CrossRef] [PubMed]
- Rappsilber, T.; Yusfi, N.; Krüger, S.; Hahn, S.-K.; Fellinger, T.-P.; Krug von Nidda, J.; Tschirschwitz, R. , Meta-analysis of heat release and smoke gas emission during thermal runaway of lithium-ion batteries. Journal of Energy Storage 2023, 60, 106579. [Google Scholar] [CrossRef]
- Drake, S. J.; Martin, M.; Wetz, D. A.; Ostanek, J. K.; Miller, S. P.; Heinzel, J. M.; Jain, A. , Heat generation rate measurement in a Li-ion cell at large C-rates through temperature and heat flux measurements. Journal of Power Sources 2015, 285, 266–273. [Google Scholar] [CrossRef]
- Carter, R.; Huhman, B.; Love, C. T.; Zenyuk, I. V. , X-ray computed tomography comparison of individual and parallel assembled commercial lithium iron phosphate batteries at end of life after high rate cycling. Journal of Power Sources 2018, 381, 46–55. [Google Scholar] [CrossRef]
- Fear, C.; Juarez-Robles, D.; Jeevarajan, J. A.; Mukherjee, P. P. , Elucidating Copper Dissolution Phenomenon in Li-Ion Cells under Overdischarge Extremes. Journal of The Electrochemical Society 2018, 165, A1639. [Google Scholar] [CrossRef]
- He, Y.; Shang, W.; Tan, P. , Insight into rechargeable batteries in extreme environment for deep space exploration. Carbon Neutralization. [CrossRef]
Figure 1.
(A) Galvanostatic charge/discharge curves for each Na-ion battery distinguished by the cathode active material type, (B) capacity retention over 100 cycles, mass (C) and volume (D) specific Ragone plots up to 3C discharge rate for each Na-ion battery and an NCA and LFP based Li-ion battery, mass specific Ragone plot of Na-NMF (E) and Na-tmCN (F) at 0, 25, and 40 °C.
Figure 2.
(A) Skin temperature of various cells during 1C discharge; temperature on the left y-axis and voltage on the right y-axis corresponding to the dashed lines. (B) Peak temperature rise after 1C discharge plotted with respect to cell energy density.
Figure 2.
(A) Skin temperature of various cells during 1C discharge; temperature on the left y-axis and voltage on the right y-axis corresponding to the dashed lines. (B) Peak temperature rise after 1C discharge plotted with respect to cell energy density.
Figure 3.
(A) C/2 galvanostatic charge and discharge followed by a 0V excursion and 5 hour rest, (B) % nominal capacity delivered below the normal cutoff voltage during 0V excursion, and (C) capacity retention over 35 cycles with a 0V excursion and 5 hour rest every 5th cycle.
Figure 3.
(A) C/2 galvanostatic charge and discharge followed by a 0V excursion and 5 hour rest, (B) % nominal capacity delivered below the normal cutoff voltage during 0V excursion, and (C) capacity retention over 35 cycles with a 0V excursion and 5 hour rest every 5th cycle.
Figure 4.
(A) Accelerating rate calorimetry (ARC) heat-wait-seek (HWS) experiment for each Na-ion battery at 100% SOC, (B) temperature rate vs. temperature from A data with Li-NMC and Li-FP data incorporated. C table summarizing important parameters from each cell tested.
Figure 4.
(A) Accelerating rate calorimetry (ARC) heat-wait-seek (HWS) experiment for each Na-ion battery at 100% SOC, (B) temperature rate vs. temperature from A data with Li-NMC and Li-FP data incorporated. C table summarizing important parameters from each cell tested.
Figure 5.
Temperature (left y-axis) and voltage (black, right y-axis) responses to 1500 psi pneumatic nail penetration indicated by a red dashed line for each Na-ion battery (A–D). E table summarizing important parameters from each cell tested.
Figure 5.
Temperature (left y-axis) and voltage (black, right y-axis) responses to 1500 psi pneumatic nail penetration indicated by a red dashed line for each Na-ion battery (A–D). E table summarizing important parameters from each cell tested.
Figure 6.
Thermal ramp of the Na-VPF cell charged to 100% SOC was carried out up to 180°C to examine off gases. The cells were sealed in a pressure vessel purged with N2 and connected with a heated line (180°C) to an FTIR-g system. A The concentration of CO, CO2, CH4, and carbonates is plotted over the duration of the thermal ramp on the left y-axis and with error in the measurement a shaded region above and below the corresponding line. The skin temperature is plotted in magenta on the right y-axis. B The concentration of HF over the duration of the thermal ramp on the left y-axis again with the skin temperature on the right y-axis.
Figure 7.
Thermal ramp of the Na-NFM1 and Na-NMF2 cells charged to 100% SOC was carried out up to 180°C to examine off gases. The cells were sealed in a pressure vessel purged with N2 and connected with a heated line (180°C) to an FTIR-g system. A The concentration of CO, CO2, CH4, NH3 and carbonates is plotted over the duration of the thermal ramp of Na- NMF1 on the left y-axis and with error in the measurement a shaded region above and below the corresponding line. The skin temperature is plotted in orange on the right y-axis. B A lower concentration regime of the same data in A, revealing trends among the electrolyte components upon venting. C The concentration of HF over the duration of the Na- NMF1 thermal ramp on the left y-axis again with the skin temperature again on the right y-axis. D The concentration of CO, CO2, CH4, and carbonates is plotted over the duration of the thermal ramp of Na- NMF2 on the left y-axis and with error in the measurement a shaded region above and below the corresponding line. The skin temperature is plotted in burnt on the right y-axis. E The concentration of HF over the duration of the Na- NMF2 thermal ramp on the left y-axis again with the skin temperature again on the right y-axis.
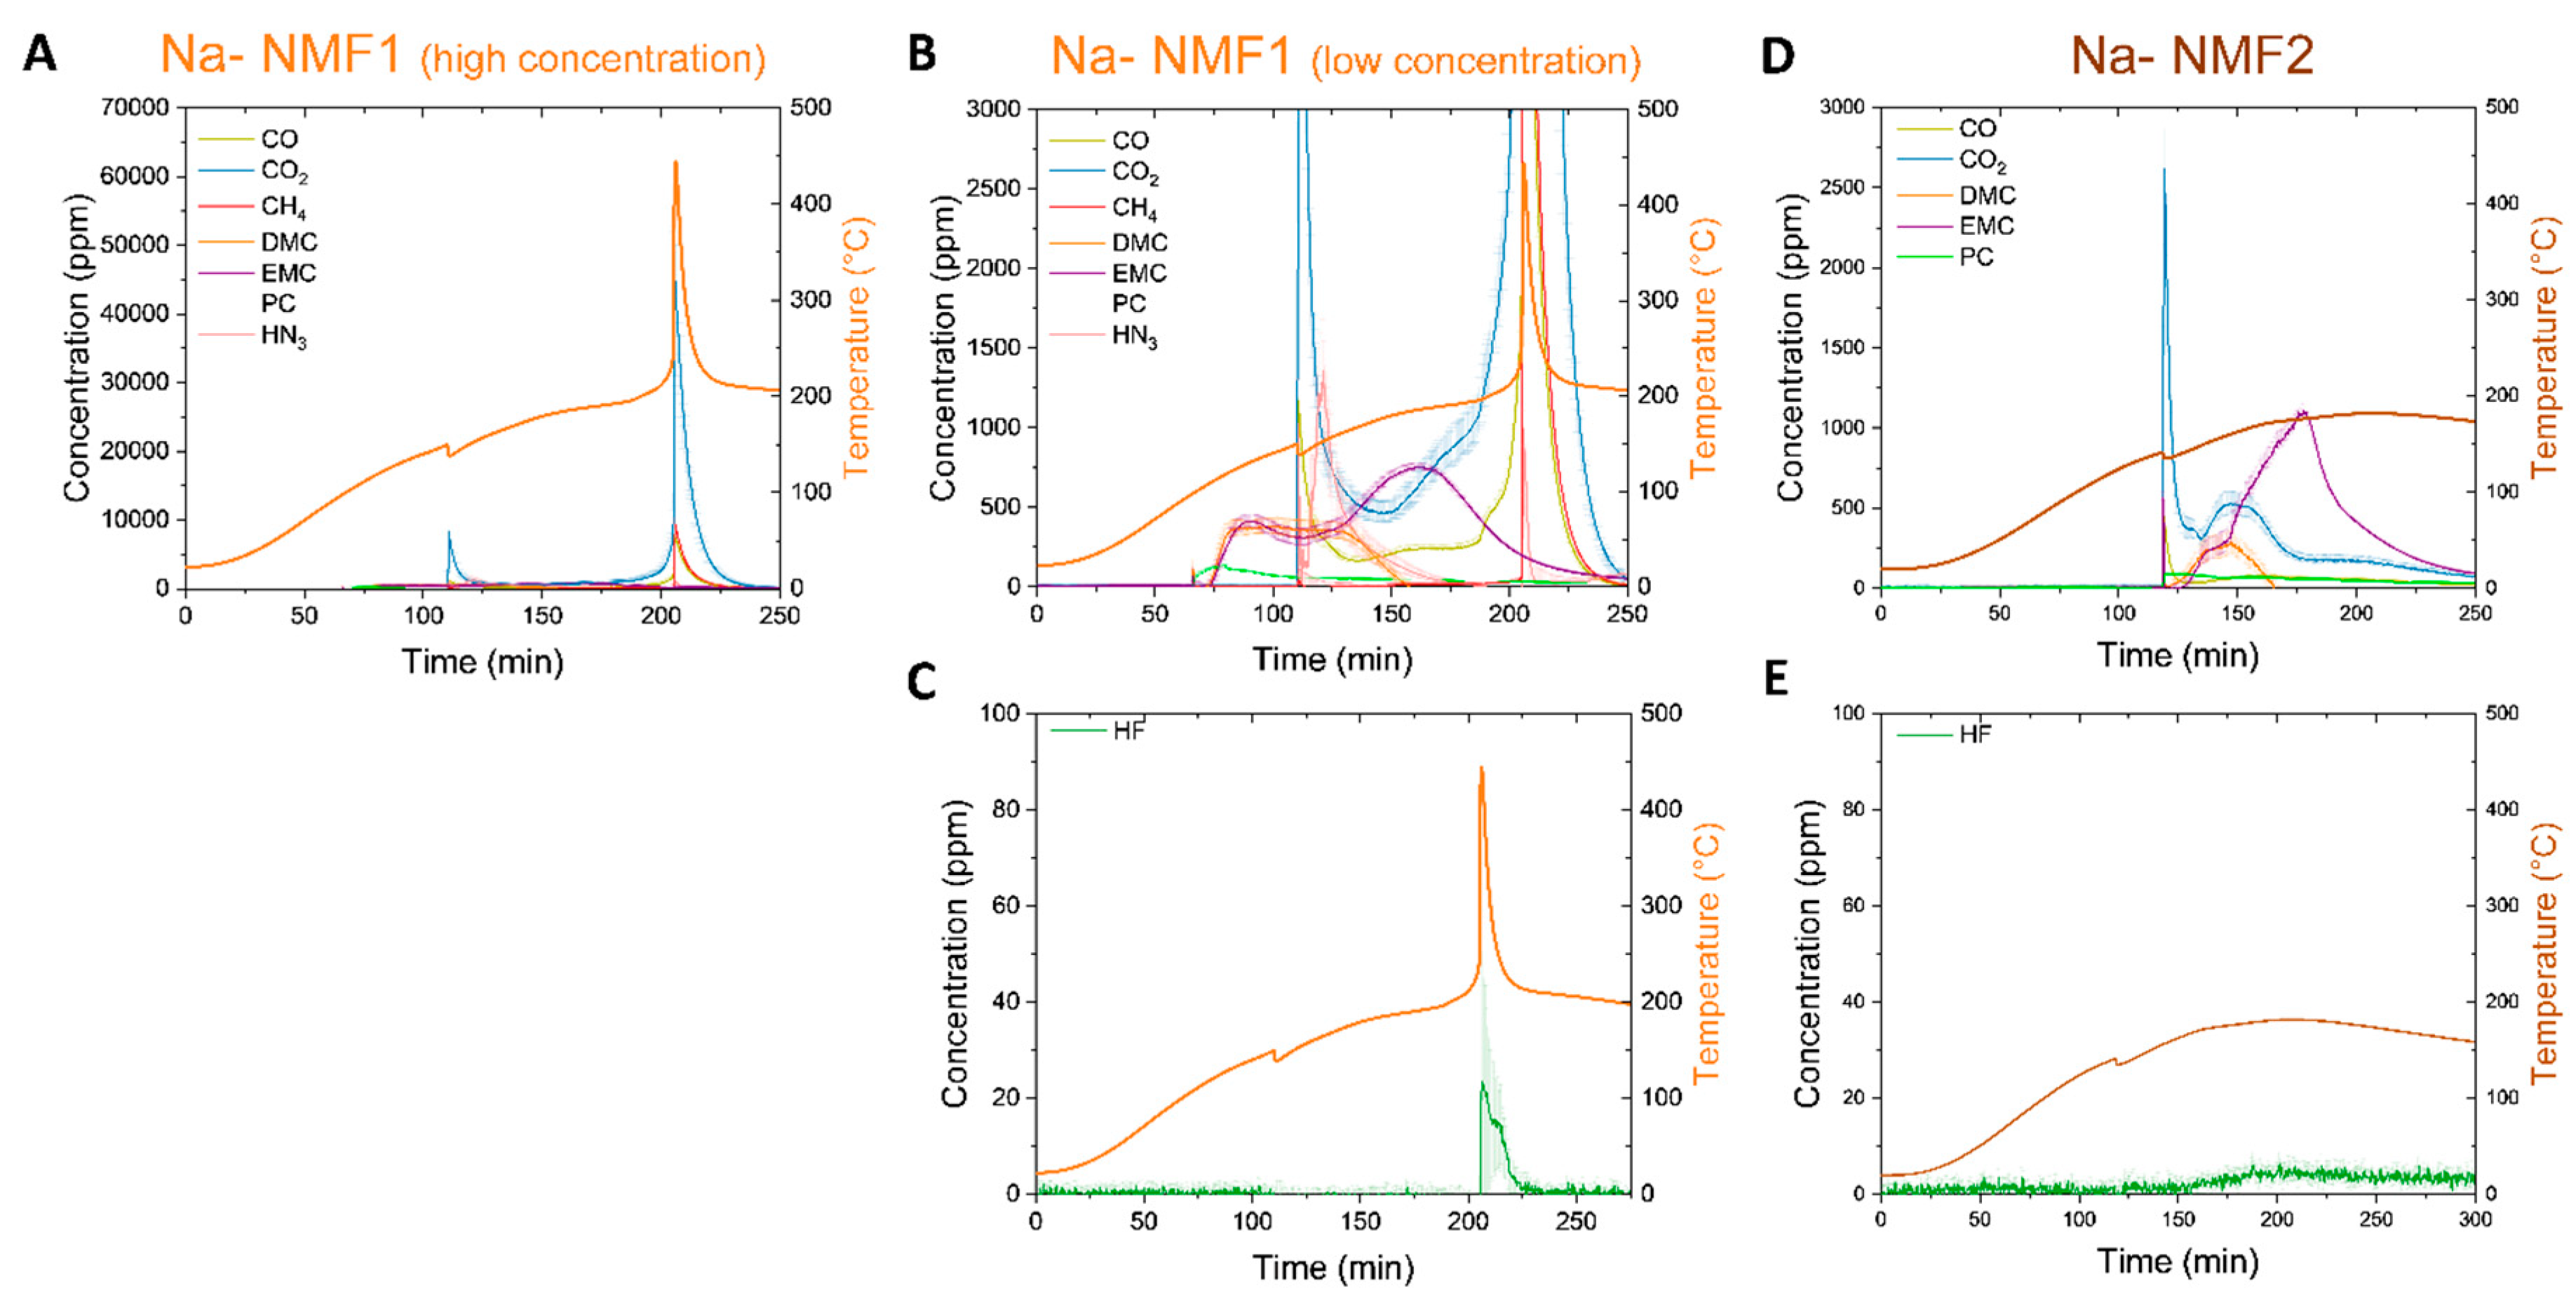
Figure 8.
Thermal ramp of the Na-tmCN cells charged to 100% SOC was carried out up to 180°C to examine off gases. The cells were placed in the ARC chamber, purged with N2, and connected with a heated line (180°C) to an FTIR-g system. A The concentration of CO, HCN, and NH3 is plotted over the duration of the thermal ramp of on the left y-axis and with error in the measurement a shaded region above and below the corresponding line. The skin temperature is plotted in blue on the right y-axis. B A lower concentration regime of the same data in A, revealing delayed increase in CO and NH3 detection.
Figure 9.
total mass of each gas detected over the duration of the thermal ramp via FTIR-g of each Na-ion battery and a Li-NMC and Li-FP cell normalized by cell Wh. A is carbon containing gases and the B is acid gases.
Figure 9.
total mass of each gas detected over the duration of the thermal ramp via FTIR-g of each Na-ion battery and a Li-NMC and Li-FP cell normalized by cell Wh. A is carbon containing gases and the B is acid gases.
Table 1.
Properties and nomenclature of each Na-ion battery tested.
Table 1.
Properties and nomenclature of each Na-ion battery tested.
| Label |
Voltage Range (V) |
Nominal Capacity (Ah) |
Cathode Type |
| Na-VPF |
2- 4.25 |
0.7 |
NavVx(PO4)yFz
|
| Na-NMF1 |
1.5- 4.1 |
1.5 |
Na(NixFeyMnz)O2
|
| Na-NMF2 |
1.8- 3.95 |
1.3 |
Na(NixFeyMnz)O2
|
| Na-tmCN |
1.00- 1.81 |
4.3 |
Naxtm[Fe(CN)6] |
|
Disclaimer/Publisher’s Note: The statements, opinions and data contained in all publications are solely those of the individual author(s) and contributor(s) and not of MDPI and/or the editor(s). MDPI and/or the editor(s) disclaim responsibility for any injury to people or property resulting from any ideas, methods, instructions or products referred to in the content. |
© 2024 by the authors. Licensee MDPI, Basel, Switzerland. This article is an open access article distributed under the terms and conditions of the Creative Commons Attribution (CC BY) license (http://creativecommons.org/licenses/by/4.0/).