
Submitted:
20 December 2024
Posted:
20 December 2024
You are already at the latest version
Abstract
The study focuses on analyzing the Walkability Index of Kalaburagi Railway Station’s surrounding area, experiences significant pedestrian activity. This research employs the Walkability Index as a framework to assess the safety, comfort, and convenience of walking in specific areas. The objective of the study extends beyond merely quantifying walkability; it also seeks to pinpoint critical areas that require enhancement, thereby offering practical recommendations for urban planners and policymakers to improve pedestrian infrastructure. The calculation of the Walkability Index utilized the "Ministry of Urban Development (MOUD) Method," which is particularly applicable to the Indian context. The analysis determined that the walkability score for the vicinity of Kalaburagi railway station is 0.389, reflecting moderate walking conditions. Nonetheless, various challenges remain, including narrow, congested, and obstructed sidewalks, the current safety provisions are inadequate; rendering pedestrians susceptible to various potential dangers that detract from the overall pedestrian experience. The study underscores the importance of addressing these challenges to foster a more pedestrian-friendly environment. Improving walkability can facilitate sustainable and healthy transportation alternatives, alleviate traffic congestion and pollution, and enhance safety. The results offer a comparative framework for assessing other cities and developing strategies to prioritize walkability in urban planning.
Keywords:
kalaburagi
; walkability score
; MOUD
; safety
1. Introduction
As per the 2011 Census of India, Kalaburagi, previously referred to as Gulbarga, recorded a population of around 543,147, establishing it as a significant city within Karnataka. Reflecting its importance as a regional hub, the Kalaburagi railway station occupies an extensive area of about 44.3 hectares (109.5 acres). This expansive space encompasses various essential components, including station buildings, platforms, railway tracks, and associated facilities such as parking areas, waiting lounges, and operational zones. The size and infrastructure of the station underscore its role in catering to the transportation needs of the city and the surrounding areas, supporting both passenger and freight services efficiently. ( www.censusindia.gov.in.). Walking is a simple yet highly beneficial activity that serves as both a practical mode of transportation and an effective form of exercise. For many people, it is a daily means of moving from one place to another, whether for commuting, errands, or leisure. Beyond its functional role, walking is widely recognized for its significant health benefits. Regular walking can control the various physical health issues, such as various types of cancer, heart disease, diabetes, and osteoporosis, by promoting cardiovascular health, improving circulation, and strengthening bones and muscles. Additionally, walking has profound positive effects on mental health system and controls the symptoms such as depression, anxiety and also stress. It encourages the release of endorphins, often referred to as “feel-good” hormones, and provides a calming effect, particularly when done in natural or scenic environments. Thus, walking is an accessible and holistic activity that supports overall well-being [1]. The concept of “walkability” has gained significant attention in recent years, emerging as a central theme in urban planning and city design research. Walkability refers to the degree to which an area is designed to be pedestrian-friendly, prioritizing ease, comfort, and safety for individuals traveling on foot. This includes factors such as well-maintained sidewalks, convenient crosswalks, proper street lighting, green spaces, and the proximity of essential amenities like shops, schools, and public transportation. A walkable environment not only encourages more people to choose walking as their primary mode of travel but also contributes to healthier lifestyles, reduced traffic congestion, and lower environmental pollution. Urban planners now view walkability as a key metric for sustainable development, recognizing its importance in order to enhance quality of life, foster social interactions, & create vibrant, livable communities [2]. Walking is the most basic form of transportation because it’s universal, affordable, and connects people to other types of transport. It also reduces health risks and pollution. A “walkable environment” has four key features: it is “foot-friendly” with good paths, essential places are within walking distance, it has natural elements that make the climate more comfortable, and it brings people together culturally, religiously, and regionally [3]. A successful pedestrian network is designed with six key criteria: it connects neighborhoods to the city’s road network, links to other transport options, is carefully divided into zones for study, keeps crime and accidents low, considers the features of walkways, and includes the design, look, layout, and overall feel of the community’s streets and spaces [4]. In traditional transport planning, walking is often undervalued. Issues include difficulties in measuring it, limited funding, low cost, and benefits that are often overlooked or not taken seriously [5]. The “5 C’s” are a way to evaluate a location’s walkability, connectivity, friendliness, safety (crime-free), comfort, and convenience [6]. Thirty major Indian cities were evaluated using the walkability index, with India’s average walkability rating being at 0.52 [7], Asian Cities’ Clean Air Initiative [8]. Interviewed participants utilizing a questionnaire at Bangkok’s urban train terminals, and its results have been examined applying a multinomial option method. They observed the propensity of people to walk across the stations [9] used the AHP method to measure the importance of different factors that affect walking to urban railway stations in Bangkok [10]. Walkable neighborhoods offer health, sustainability, and safety benefits, but their design often neglects pedestrian and bicyclist safety. This study investigated the link between pedestrian and bicycle collisions in U.S. metropolitan areas and neighborhood walkability. Using geo coded data and multilevel models, the research found that higher walkability, measured through factors like land use, street connectivity, and transit access, correlated with increased pedestrian and bicyclist fatality rates. Conversely, overall traffic fatality rates decreased in more walkable neighborhoods. Vulnerable populations, including low-income and minority groups, faced greater safety risks. The findings highlight the need to redefine walkability by prioritizing safety and improving assessment tools to balance health benefits with reduced risks for vulnerable road users [11].
Accessibility, or the ease of getting to places, has always been a major consideration in transportation design, and several studies have looked at how to measure and adapt it. Over the past 20 years, walkability—a mode-specific type of accessibility—has grown in popularity, highlighting how convenient it is to walk to locations. Recently, research has shifted towards perceived accessibility—how individuals experience ease of access, which may better predict travel behavior than objective measures like elements of the built environment. Although little research has been done, observed walkability or as walk-friendly a place feels is connected to pedestrian frequency, exercising, and mental health. In this overview, research on reported walkability, proposing a conceptual model to connect it with objective measures. Additionally, it presents the A fraction Perceived Walking ability Score and makes recommendations for future study directions to advance expertise, boost walking, and further improve one’s walking environment [12]. Assessing street walkability is crucial for urban sustainability, health, and community cohesion. This study introduces a framework combining subjective and objective measures through three indices: Walking Preferences at the Street, Micro, and Macro Levels. When used in Beijing, it emphasizes the interplay between these aspects and the significance of street-level and community elements.
The framework provides insightful information for developing more inclusive and walkable cities [13]. Assessing street walkability is crucial for urban sustainability, health, and community cohesion. This study introduces a framework combining subjective and objective measures through three indices: Macro-Scale, Micro-Scale, and Street Walking Preferences. Applied in Beijing, it highlights how these factors interact, emphasizing the importance of community and street-level elements. The framework offers valuable insights for creating more inclusive and walkable cities [14]. Active transportation modes, like walking, are vital for sustainable urban mobility and require supportive infrastructure. This study introduces a method to calculate a walkability index for paths leading to transport nodes, such as railway stations, based on pedestrians’ perceptions of infrastructure features like kerb width, greenery, and urban furniture. Tested around Milano Rumored railway station in Italy, the method provides realistic insights into walkability conditions and highlights areas for improvement, aiding in policy development to enhance pedestrian accessibility.
2. Methodology
2.1. The Walkability Index approach was created by India’s Ministry of Urban Development (MOUD). to address the specific urban challenges in India. As a government agency, the MOUD plays a crucial role in shaping urban development by improving infrastructure, transport systems, housing, and governance. The Walkability Index method evaluates essential elements such as footpath availability, pedestrian facilities, safety, and overall comfort, which are vital for creating pedestrian-friendly spaces. The primary goal is to provide urban planners with a measurable framework to design walkable environments that promote walking, reduce traffic congestion, and improve public health and the overall quality of urban life. By focusing on these factors, the method supports the creation of sustainable and livable cities across India. It measures how easy it is to walk in an area by looking at the availability of footpaths and facilities for pedestrians.
Index of Walkability = [(W1 x The presence of a walkway) + (W2 x Ratings of pedestrian facilities)
Where
W1 and W2 stand for weights, both set for fifty percentage
Here, W1 and W2 are Weights, each given an equal value of 50%.
The presence of a walkway= The length of the pathway / The entire length of the Kalaburagi railway station’s surrounding areas
Rating of Pedestrian Facilities = a rating determined on how people perceive about the standard of pedestrian amenities.
2.1. Study Area
Bangalore, Mysuru, and Hubballi-Dharwad are the three largest cities in Karnataka, with Kalaburagi coming in fourth. There were 5, 32,031 people living in Gulbarga as per the 2011 Census. The city has three outgrowths and 58 census wards, with an average of 9,673 people living in each ward. The district’s headquarters are in Kalaburagi. Situated 623 miles north of Bangalore and 230 km from Hyderabad, it is a prominent city in the Hyderabad–Karnataka region and is regarded as one of the state’s most backward areas (Government of Karnataka, 2010). Figure 1, Figure 2 and Figure 3, demonstrate the city’s location, its position within the district, and its geographic location within the nation and the state of Karnataka.
An important railway station in the Indian state of Karnataka is Kalaburagi Junction, which is located in Kalaburagi district. “KLBG” is Kalaburagi Junction’s station code name. Kalaburagi Junction railway station ranks as one of the top 100 Indian Railway train reservation & transportation terminals. The Great Indian Peninsula Railway (GIPR) played a pivotal role in expanding India’s railway network during the 19th century. In 1865, it commenced work on extending its Mumbai–Solapur railway line, aiming to connect the key commercial hub of Mumbai with more regions in southern India.
By 1871, this ambitious project reached a significant milestone with the line being extended all the way to Raichur, located in present-day Karnataka. This development not only facilitated greater connectivity and economic integration but also marked a crucial step in linking northern and southern India, paving the way for enhanced trade, passenger movement, and regional development during the British colonial era [15,16]
The structure itself of the 110-kilometer-long, the railway link between Kalaburagi and Bidar constitutes a significant achievement in enhancing regional connectivity in Karnataka. On October 29, 2017, the Prime Minister of India formally opened this significant railway route, which had been planned and built for years. The new link connects the city of Kalaburagi (formerly known as Gulbarga) with Bidar, providing a direct route that reduces travel time and fosters improved trade, communication, and accessibility between these regions. The project has been hailed as a crucial step toward boosting economic development and strengthening infrastructure in northern Karnataka, benefitting both passengers and freight movement [17,18].
The walkability index of the area surrounding the station is compromised due to several factors. The following are the primary causes and obstacles:
1. Insufficient Nighttime Illumination: The inadequate lighting in the area creates an unsafe environment, particularly for pedestrians walking after dark (Figure 4, Figure 5, Figure 6 and Figure 7). This lack of illumination increases the risk of accidents and crime.
Figure 4, Figure 5, Figure 6 and Figure 7. Illustrates the Lack of Sufficient Lighting in Areas along the Railway Station and Its Surroundings
2. Inaccessible Ramps: The absence of ramps for carriageway connections hinders individuals with disabilities and wheelchairs from navigating the area safely (Figure 8 and Figure 9). This limitation violates accessibility standards and compromises the overall walkability of the area.
Figure 8 and Figure 9 Limitation Falls Short Of Accessibility Standards for the Railway Station And Its Surroundings.
3. Lack of Pedestrian Crossings: The absence of designated pedestrian crossings increases the difficulty and danger of crossing streets (Figure 10 and Figure 11). This oversight puts pedestrians at risk of accidents and injuries.
Figure 10 and Figure 11 Highlights the Safety Concerns Arising From the Lack of Designated Pedestrian Crossings
4. Inadequate Signage and Way finding: The lack of clear signage and way finding systems creates confusion for pedestrians, making it challenging for them to navigate the area (Figure 12 and Figure 13). This inadequacy can lead to frustration, anxiety, and increased risk of accidents.
Figure 12 and Figure 13 Shows the Navigational Challenges Posed by Inadequate Signage and Way finding System
5. Poor Road Surface Conditions: The smoothness and regularity of the walkway and road surface are not well-maintained, leading to accidents (Figure 15, Figure 16, Figure 17 and Figure 18). Furthermore, the absence of pipe railings or handrails separating traffic increases the risk of accidents.
Figure 15, Figure 16, Figure 17 and Figure 18 Demonstrates How Poorly Maintained Walkways and Road Surfaces
6. Encroachment on Walkways: The encroachment on walkways creates problems for pedestrians, leading to traffic congestion (Figure 19, Figure 20, Figure 21 and Figure 22). This encroachment can result in accidents and compromises the overall walkability of the area.
Figure 19, Figure 20, Figure 21 and Figure 22 Shows Walkway Encroachment Can Lead To Traffic Congestion
7. Poor Maintenance and Cleanliness: The area surrounding the station lacks proper maintenance and cleanliness, leading to an unhealthy environment for pedestrians (Figure 23, Figure 24, Figure 25, Figure 26 and Figure 27). This neglect can discourage people from walking in the area.
Figure 23, Figure 24, Figure 25, Figure 26 and Figure 27 Highlights the Poor State of Maintenance and Cleanliness
8. Inadequate Amenities: The lack of sufficient urinals and toilets forces people to use roadside walkways, compromising hygiene and safety (Figure 28). Additionally, the absence of public lounges leads to people resting and sleeping on the roadside, creating an unsafe and insecure environment (Figure 29, Figure 30 and Figure 31).
Figure 29, Figure 30 and Figure 31 Absence of Public Lounges Forces People to Rest and Sleep in Unsafe and Unsanitary Conditions.
These factors collectively contribute to a poor walkability index, compromising the safety, accessibility, and overall experience of pedestrians in the area surrounding the station. Addressing these issues is crucial to creating a more pedestrian-friendly environment.
2.2. Study of Experimental Design
We require ratings for pedestrian amenities and the availability of footpaths in order to compute the Walkability Index. A survey is designed to collect feedback on the design and usage of the pedestrian facilities in the region. A city map, measuring instrument, or Google Maps can be used to determine the length of the main roads and walkways that surround a train station and the surrounding region.
A survey must be carried out in order to ascertain the pedestrian facility grade. The following elements are taken into account in the survey:
- Height and width of the walkway
- Smoothness and regularity of the walkway surface
- Continuity of the walkway
- Ramps connecting the walkway to the road
- Lighting at night
- Barriers like pipe railings or handrails separating traffic
- Obstructions on the walkway
- Maintenance and cleanliness
- Raised crossings for continuous walking
- Walkways available on the correct side of the road.
- The walkway is located on the appropriate side of the carriageway.
- Connectivity
- Zoning and Way finding
- Safety and Security
- Walkway Characteristics
The MOUD method considered 15 factors. The height of the walkway and whether it is on the right side of the road are also included in this pedestrian survey form. For pedestrian facilities to be used effectively, these are essential. The aforementioned elements must be rated by pedestrians on a 5-point scale, with 1 denoting “not usable at all” and 5 denoting “very usable.” They must rate as well as the importance of each factor on a scale of 0 to 100 to show how important it is for providing and using the facility. Furthermore, details as gender, age, the occupation, & yearly revenue from the household are helpful in gaining a deeper understanding of the user’s viewpoints and experiences. A survey was conducted with 200 people, including 50 students (25males and 25 females), 25 employees, and 25 non-employees. The average pedestrian facility rating was calculated based on their responses. The area’s walkability index was then determined by utilizing this average rating in the formula.
3. Results and Discussions
in compliance with MOUD’s process, Figure 32. The GIS map was used to estimate the length of the roads in the vicinity of Kalaburagi railway station, and the result was 3250 meters. A 30-meter tape was used to measure the walkway’s length. The result was 1300 meters. On a scale of 1 to 5, pedestrians scored 15 variables based on their opinions.
Table 1 displays the average ratings of each of these groups that can be classified based upon pedestrian attributes. On a 5-point scale, the average rating for pedestrian facilities was 2.98. This must be divided by 5 in order to be converted to a 1-point scale.
The equation that follows is then used to determine the walkability index:
Index of Walkability = [(W1 x The presence of a walkway) + (W2 x Ratings of pedestrian facilities)
Where
W1 and W2 stand for weights, both set for fifty percentage
Here, W1 and W2 are Weights, each given an equal value of 50%.
The presence of a walkway= The length of the pathway / The entire length of the Kalaburagi railway station’s surrounding areas
Rating for Pedestrian Facilities: A score calculated by evaluating the available pedestrian facilities
W1= [(0.5 × (650/ 3250) + (0.5 × (2.98/5)] = 0.398
Consequently, the MOUD technique yields a W1 of 0.398 for the Kalaburagi railway station’s surrounding regions.
Based on thorough user ratings, the walkability evaluation of the Kalaburagi Railway Station area offers important insights about the condition of the local pedestrian infrastructure as of right now.
The evaluation examined 15 essential parameters, each rated on a scale from 1 to 5, where a score of 5 signifies excellence in meeting pedestrian needs and standards.
These parameters were chosen to comprehensively assess the quality, safety, and convenience of the walking environment. The analysis covered critical aspects such as walkway width, surface condition, cleanliness, and the availability of basic facilities like lighting and seating. The evaluation also took into account safety measures such as crosswalks, signage, and barriers designed to shield pedestrians from vehicle traffic. Accessibility features for individuals with disabilities, including ramps and tactile paving, were assessed, along with elements that contribute to user comfort, such as shaded pathways and attractive landscaping. The analysis presented a varied landscape of strengths and weaknesses. While some aspects, like walkway dimensions and fundamental safety features, received moderate satisfaction ratings from users, other areas revealed notable deficiencies. Major concerns included uneven or damaged sidewalks, insufficient lighting, and a lack of accessible facilities for individuals with disabilities. These results underscore the pressing need for infrastructure enhancements to create a more pedestrian-friendly, secure, and accessible environment for all users. The insights obtained can assist policymakers and urban planners in prioritizing improvements and promoting a more sustainable, walkable community around Kalaburagi Railway Station The walkability assessment of the Kalaburagi Railway Station area based on user ratings highlights key insights into pedestrian infrastructure. The evaluation covered 15 parameters, with scores ranging from 1 to 5 (5 being the best). Key findings include:
The assessment of walkability in the vicinity of Kalaburagi Railway Station, based on user ratings, reveals significant insights regarding pedestrian infrastructure. The evaluation encompassed 15 parameters, with scores ranging from 1 to 5, where 5 represent the highest quality. The principal findings are as follows:
- 1.
-
Strengths:
- a) Walkway Height (3.01): This score suggests that the height of the walkways is generally suitable, although some variability or inconsistencies may be present in specific locations. Overall, it indicates that pedestrians can navigate comfortably, though minor modifications could enhance uniformity.
- b) Walkway Width (3.39): The moderate score reflects that the width of the walkways is generally adequate for pedestrian traffic. However, in areas with high footfall, the walkways may feel narrow or congested, indicating a potential need for expansion to better accommodate larger groups of pedestrians.
- c) Walkway Continuity (3.73): A relatively high score signifies that most walkways are uninterrupted, which is crucial for maintaining pedestrian flow. Nonetheless, there may be certain gaps or obstructions that could hinder convenience for pedestrians
- d) Unobstructed Walkway Access (3.52): This score indicates that the majority of walkways are free from obstructions, facilitating ease of movement. However, there may still be occasional obstacles that could disrupt pedestrian flow.
- e) Maintenance and Cleaning (3.6): This score indicates a generally favorable condition, implying that the walkways are typically well-maintained and receive regular cleaning. Nonetheless, there may be occasional instances of neglect, particularly in areas with high foot traffic or those that are less frequently monitored.
- f) Walkway Location (3.49): This score implies that the majority of walkways are appropriately situated on the correct side of the roadway, facilitating safer movement for pedestrians. However, there may be some cases where walkways are incorrectly positioned or inadequately aligned with the needs of pedestrians.
- g) Connectivity (3.06): This score denotes a moderate level of connectivity among various pedestrian zones. While certain walkways are effectively linked to significant destinations, others may exhibit gaps in connectivity, which can hinder pedestrian access to essential locations.
- h) Walkway Characteristics (3.5): A moderate rating in this category suggests that most walkways possess acceptable features, such as adequate width and essential amenities. However, there is potential for enhancements, including improved landscaping or the incorporation of seating areas.
- 2.
-
Moderate Aspects:
- a) Surface Quality (2.84): This rating indicates a notable issue with the condition of the walkways. The surfaces may be uneven or inadequately maintained in certain areas, posing risks for pedestrians, especially those with mobility impairments. Enhancements are essential to provide smooth and level walkways for safer navigation.
- b) Traffic Separators (2.91): This score implies that while traffic separators, such as railings or barriers, are present in some locations, they are either insufficient in number or not entirely effective. These elements are crucial for safeguarding pedestrians from vehicular traffic, and a more uniform installation could enhance safety.
- 3.
-
Weaknesses:
- a) Nighttime Illumination (2.39): This low rating indicates a lack of adequate lighting, which can pose safety risks for pedestrians at night. Insufficient illumination contributes to an unsafe environment, particularly for individuals walking after dark.
- b) Ramps for Carriageway Connection (2.42): This score indicates that ramps, which are vital for accessibility, are either missing or inadequate. This presents a significant challenge for individuals with disabilities or those using strollers or wheelchairs. Considerable improvements are required to ensure accessible transitions between the walkway and the carriageway.
- c) Raised Continuous crossing (2.01): The very low score in this category suggests that raised crossings are either nonexistent or insufficient. These crossings are essential for pedestrian safety, and their absence increases the difficulty and danger of crossing streets.
- d) Zoning and Way finding (2.27): A low score in this area points to inadequate signage and way finding systems, complicating navigation for pedestrians. Improved signage and better zoning would facilitate pedestrian orientation and enhance ease of movement.
- e) Safety and Security (2.67): This score reflects concerns regarding pedestrian safety and security. While some safety measures may exist, they appear to be insufficient or not effectively enforced, leaving pedestrians vulnerable to accidents or crime.
The findings indicate that while the Kalaburagi Railway Station area exhibits strengths in connectivity, walkway placement, and maintenance, several areas require urgent attention. The lack of raised crossings and ramps for seamless transitions across roadways significantly impacts pedestrian safety and accessibility, particularly for vulnerable users. The moderate scores in walkway width, lighting, and safety suggest inconsistencies in design and infrastructure across different sections of the area. Furthermore, the low scores for surface quality and traffic separators highlight potential safety hazards that could deter pedestrian activity.
4. Conclusions
Overall, the Walkability Index of Kalaburagi Railway Station and its Surroundings in Karnataka, India was found to be 0.48. And it’s unsatisfactory, so there it has to be improving a lot. The Walkability Index shows improvements are needed to make the Railway Station and its Surrounding areas walking conditions better. Since more people will opt to walk instead of drive, improving walking conditions can help minimize hazards like accidents, noise and air pollution, traffic jams, and disease. The walkability graph as shown in Figure 33, demonstrates that below 25 years age, employee and female find walking almost as convenient as others do but male and business man fells inconvenient. The key issues include the lack of traffic separators, pedestrian-friendly crossing facilities, absences of footpaths proper maintenance, smooth walkways, and ramps connecting to the roads.
References
- Ministry of Urban Development, (2008), “Study of traffic and transportation policies in urban areas in India”.
- Litman, T.A. Economic Value of Walkability. Transp. Res. Rec. 2003, 1828, 3–11. [Google Scholar] [CrossRef]
- Burden, D. Building communities with transportation. Transp. Res. Rec. 2001, 1773, 5–20. [Google Scholar] [CrossRef]
- Bradshaw C. (1993), “Creating and Using A Rating System for Neighborhood Walkability towards an Agenda for Local Heroes”, 14th International Pedestrian Conference, Boulder, Colorado.
- Southworth, M. (2005), “Designing the Walkable City”, J. Urban Plann. Dev. vol: 0733-948, pp131:4.
- Litman, T.A. (2011), “Economic Value of Walkability”, Transportation Research Board 2003, pp. 3-11 and in Volume 10.
- Improving Walkability (2005), Transport for London, The London Planning Advisory Committee, Mayor of London, London.
- Walkability in Indian cities, (2011), Clean Air Initiative for Asian cities (CAI-Asia) centre.
- Chalermpong, S., Wibowo, S.S. (2007) Transit Station Access Trips and Factors Affecting Propensity to Walk to Transit Stations in Bangkok Thailand, Journal of the Eastern Asia Society for Transportation Studies, Vol 7, No.0, 1806-1819.
- ((2014) Measuring Pedestrians’ Satisfaction of Urban Environment under Transit Oriented Development (TOD): A case study of Bangkok Metropolitan, Thailand, Lowland Technology International, Vol.16, No.2, 125-134.
- Redefining walkability to capture safety: Investing in pedestrian, bike, and street level design features to make it safe to walk and bike Behram Wali ,wrence D. Frank Volume 181, March 2024, 103968. Transportation Research Part A: Policy and Practice). [CrossRef]
- Jonas De Vos et al., 2020)(Jonas De Vos, Katrin Lättman, Anna-Lena van der Vlugt, Janina Welsch & Noriko Otsuka (2022): Determinants and effects of perceived walkability: a literature review, conceptual model and research agenda, Transport Reviews.
- Huang, X. , Zeng, L., Liang, H. et al. Comprehensive walkability assessment of urban pedestrian environments using big data and deep learning techniques. Sci Rep 14, 26993 2024.
- Huang, X. , Zeng, L., Liang, H. et al. Comprehensive walkability assessment of urban pedestrian environments using big data and deep learning techniques. Sci Rep 14, 26993 2024.
- “Chronology of railways in India, Part 2 (1870–1899). “IR History: Early Days—II”. IRFCA. Retrieved 3 December 2013.
- “Sholapur District Gazetteer”. Gazetteer department. Retrieved 9 December 2013.
- “Railway bridge across Bennethora to be complete in two years”. The Hindu. 24 July 2013. Retrieved 9 December 2013.
- “Bidar-Gulbarga rail service”. Infrastructure. January 2012. Retrieved 9 December 2013.
Figure 1.
Location of Kalaburagi City (Sources KUDA MASTER PLAN-2022).
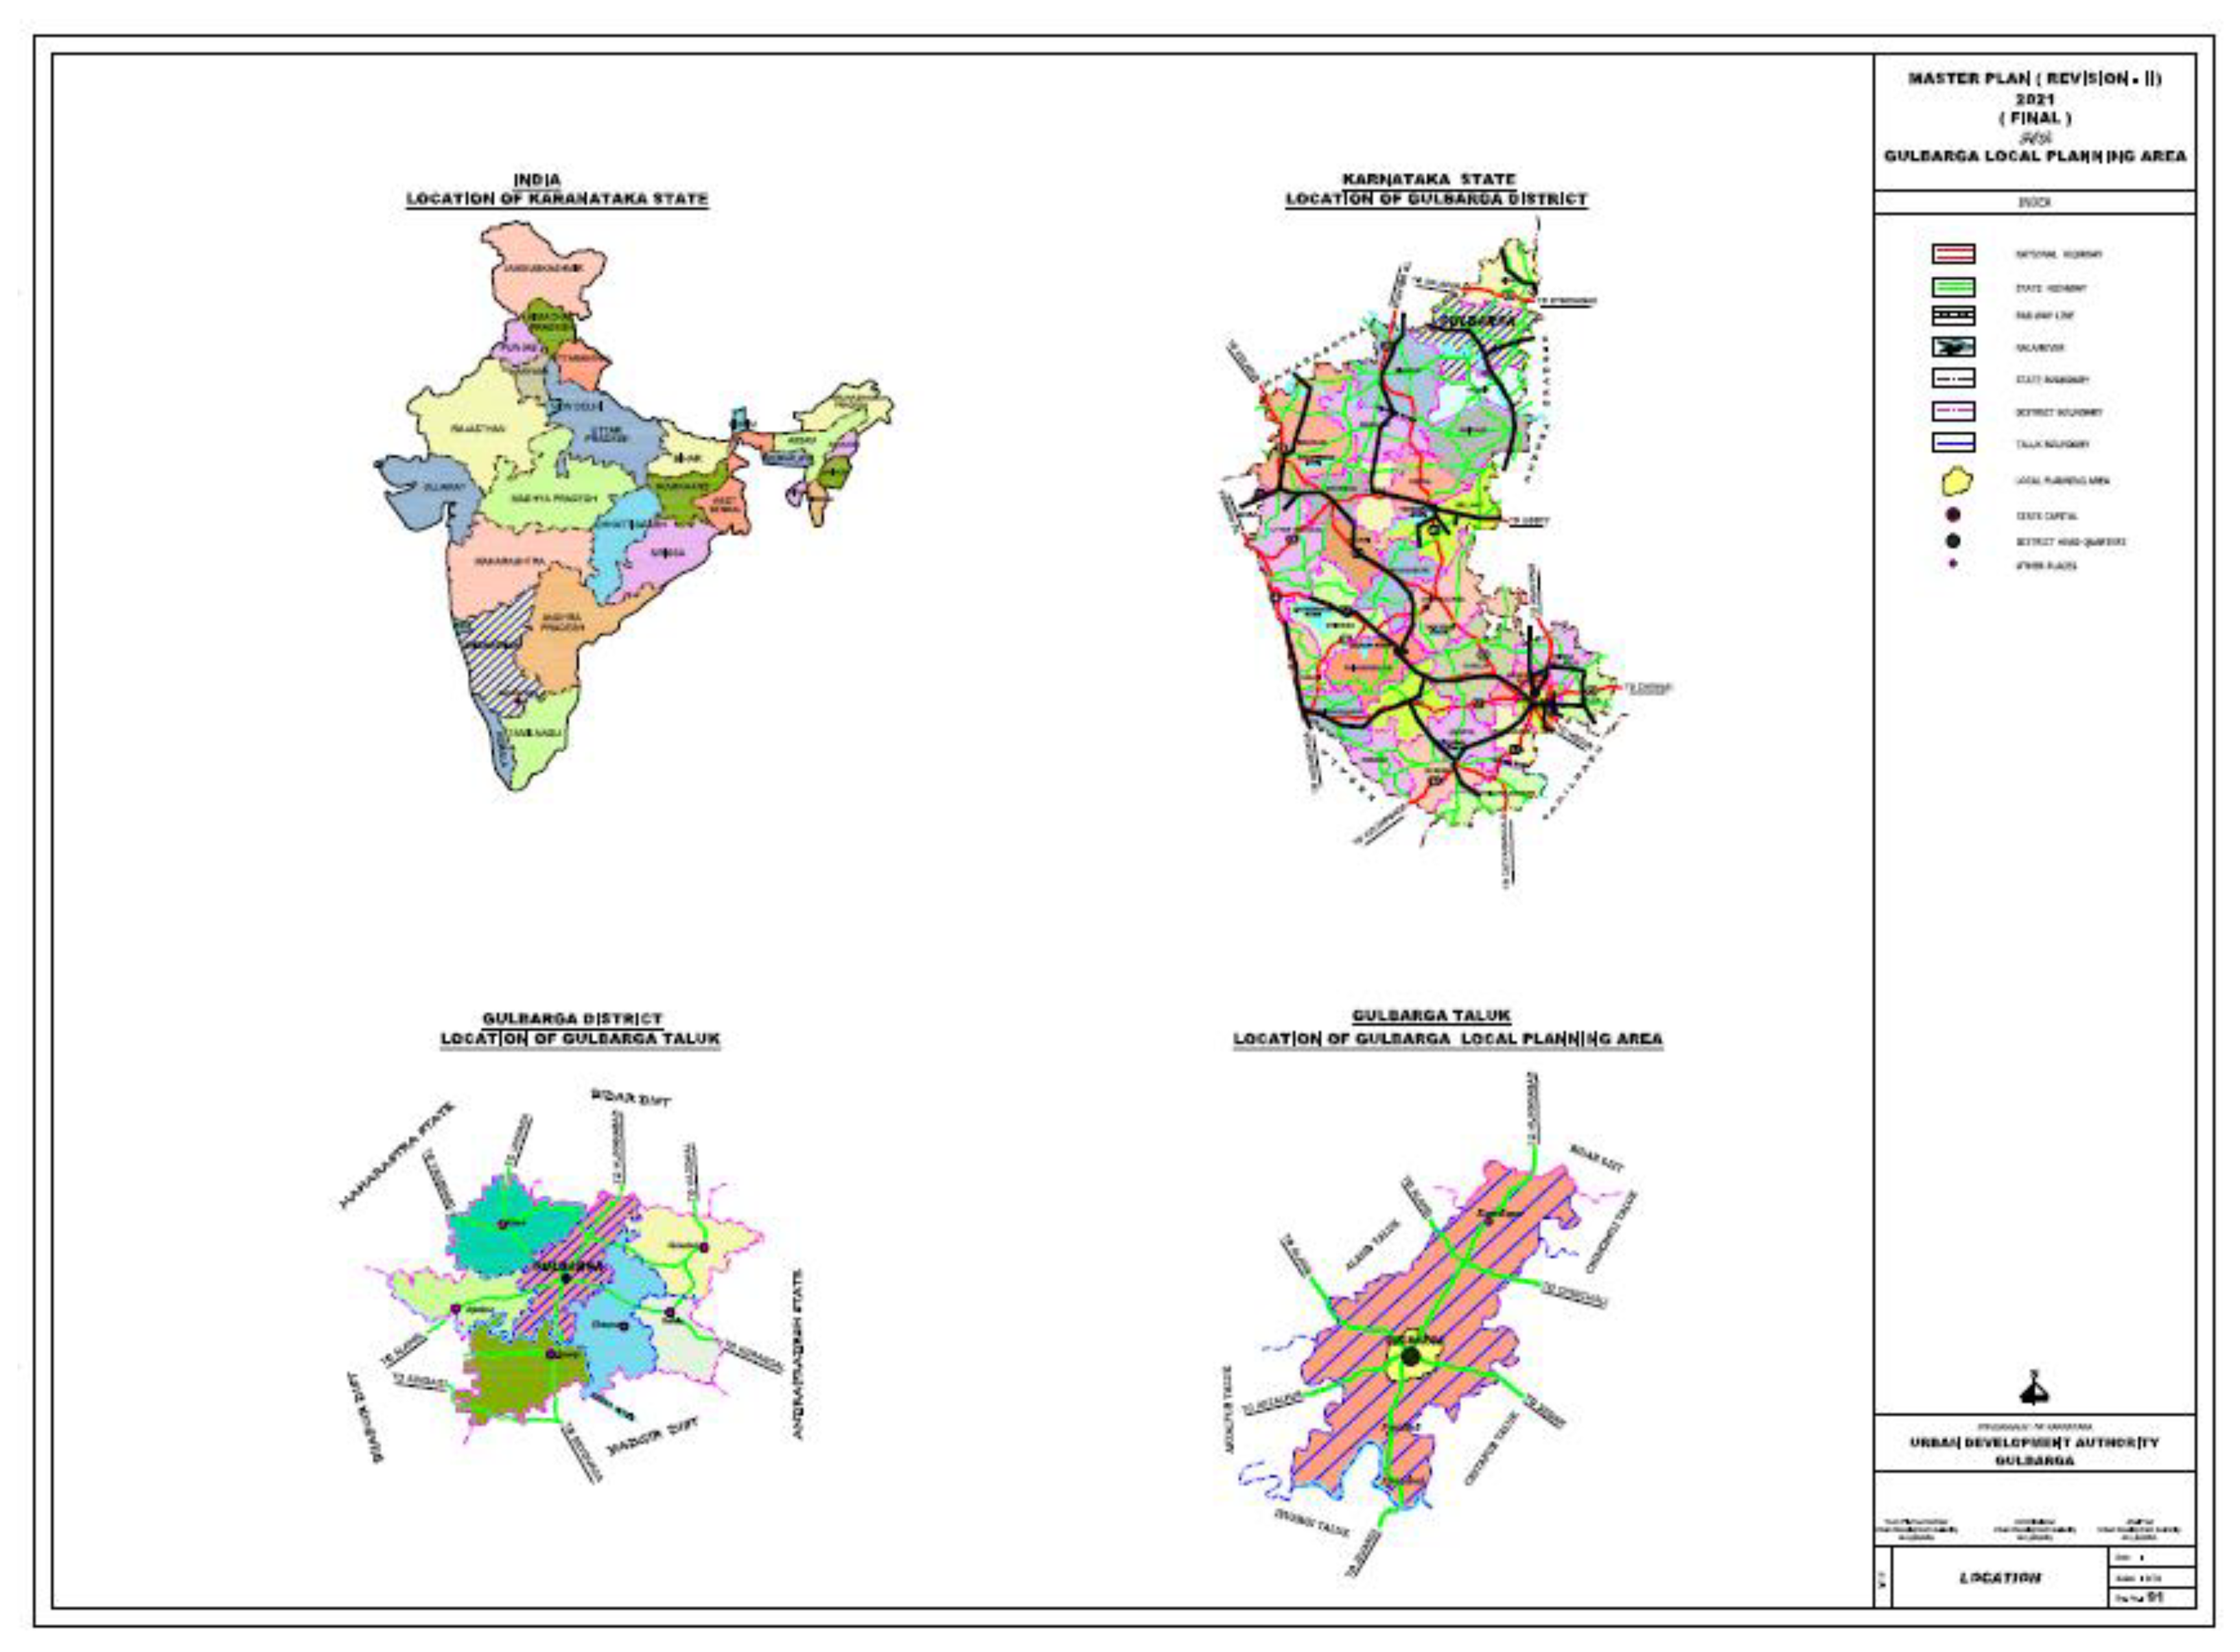
Figure 2.
Map of Kalaburagi City.
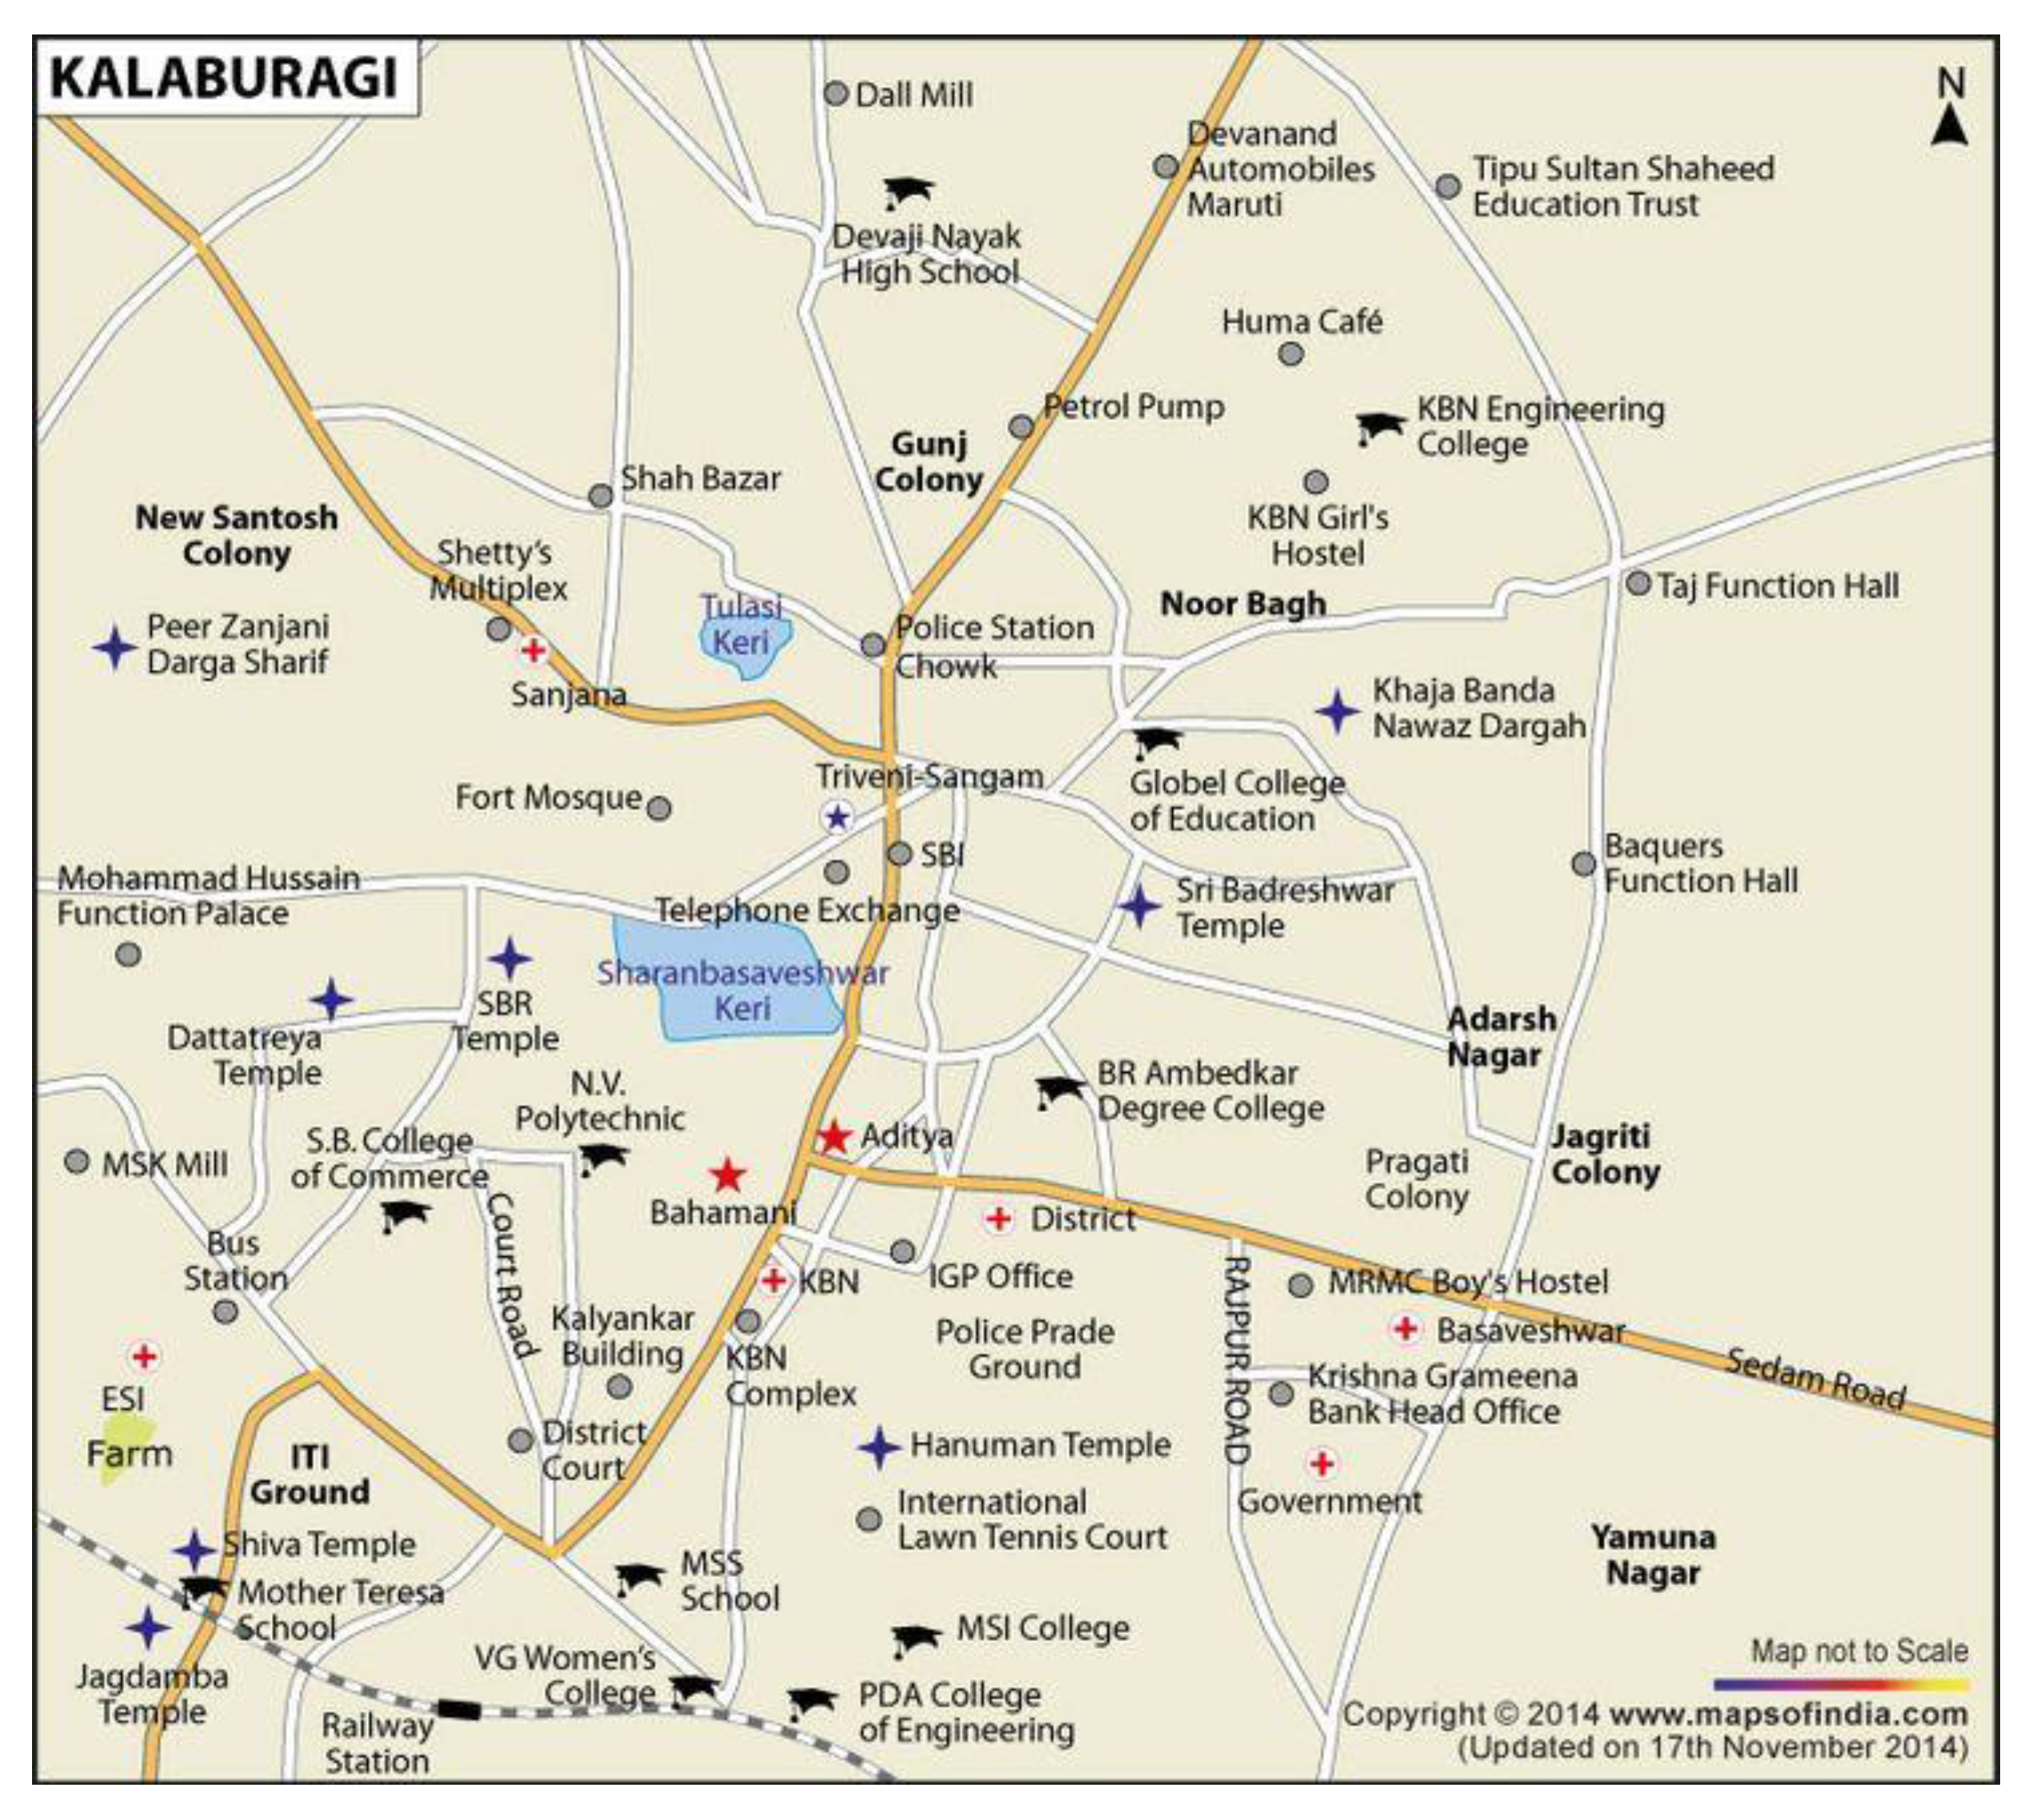
Figure 3.
The Study Was Conducted In Kalaburagi City, Focusing On Areas Along The Railway Line And Its Surroundings.
Figure 3.
The Study Was Conducted In Kalaburagi City, Focusing On Areas Along The Railway Line And Its Surroundings.
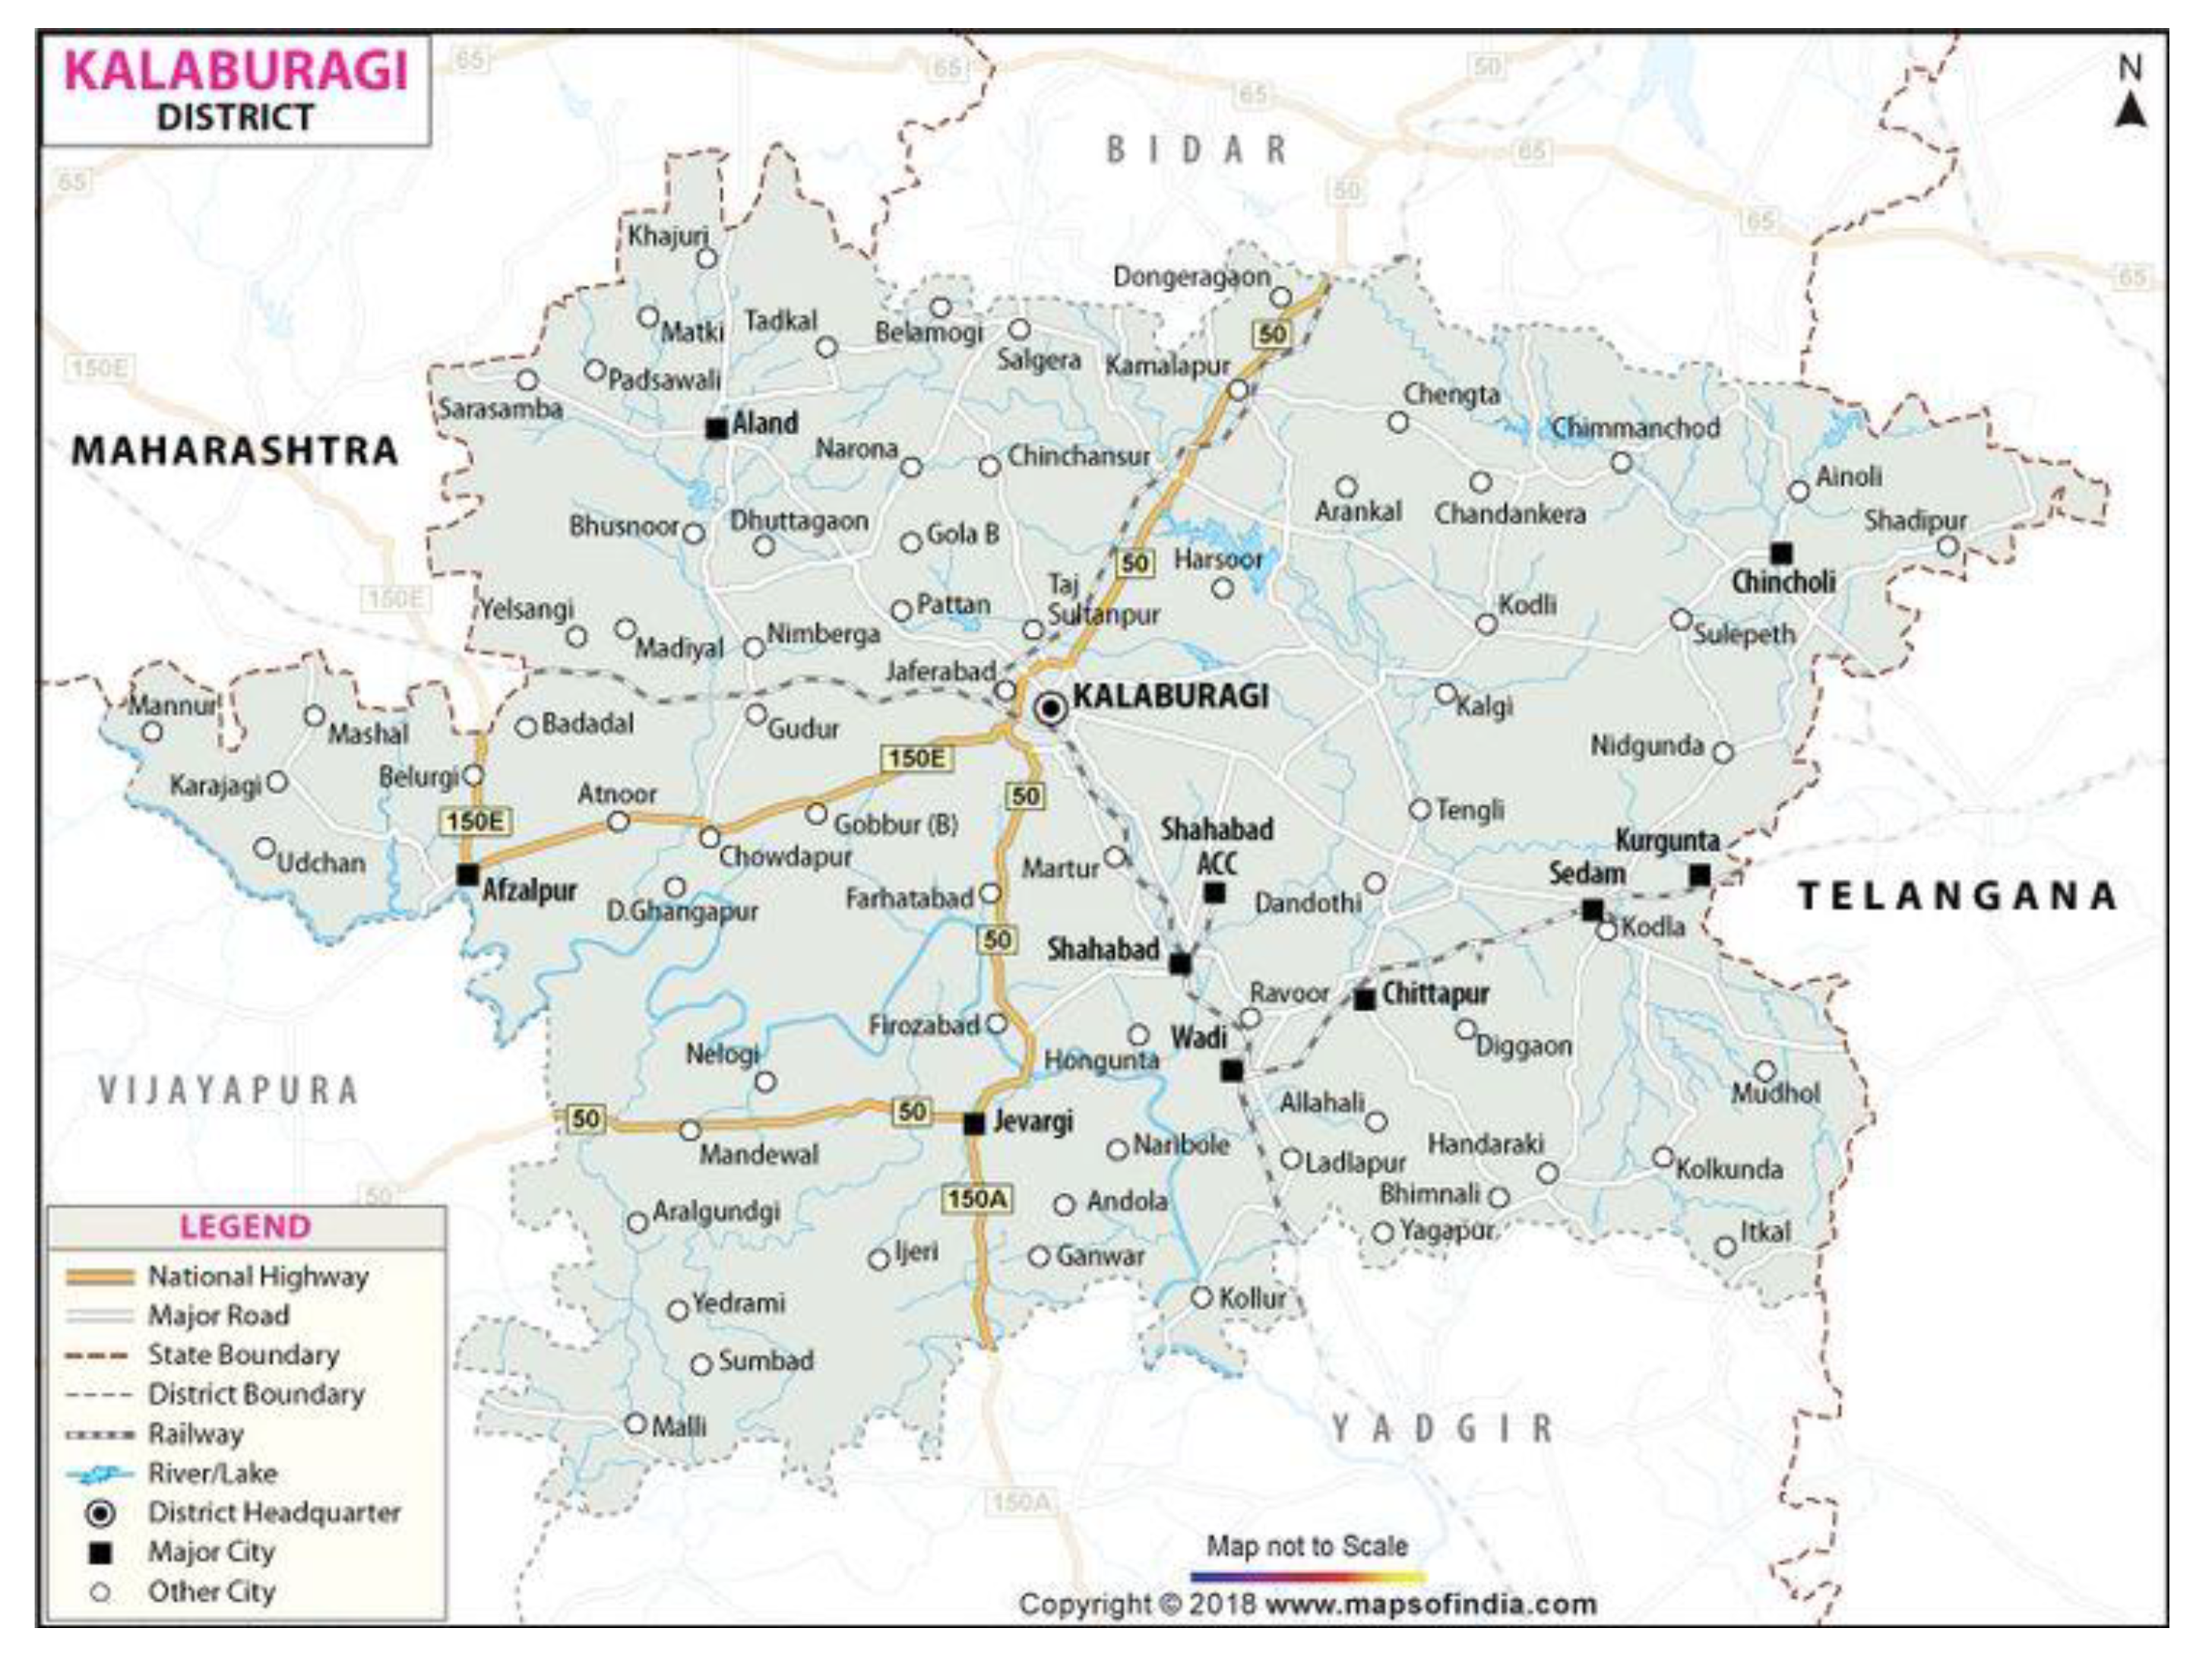
Figure 4.
Figure4. .
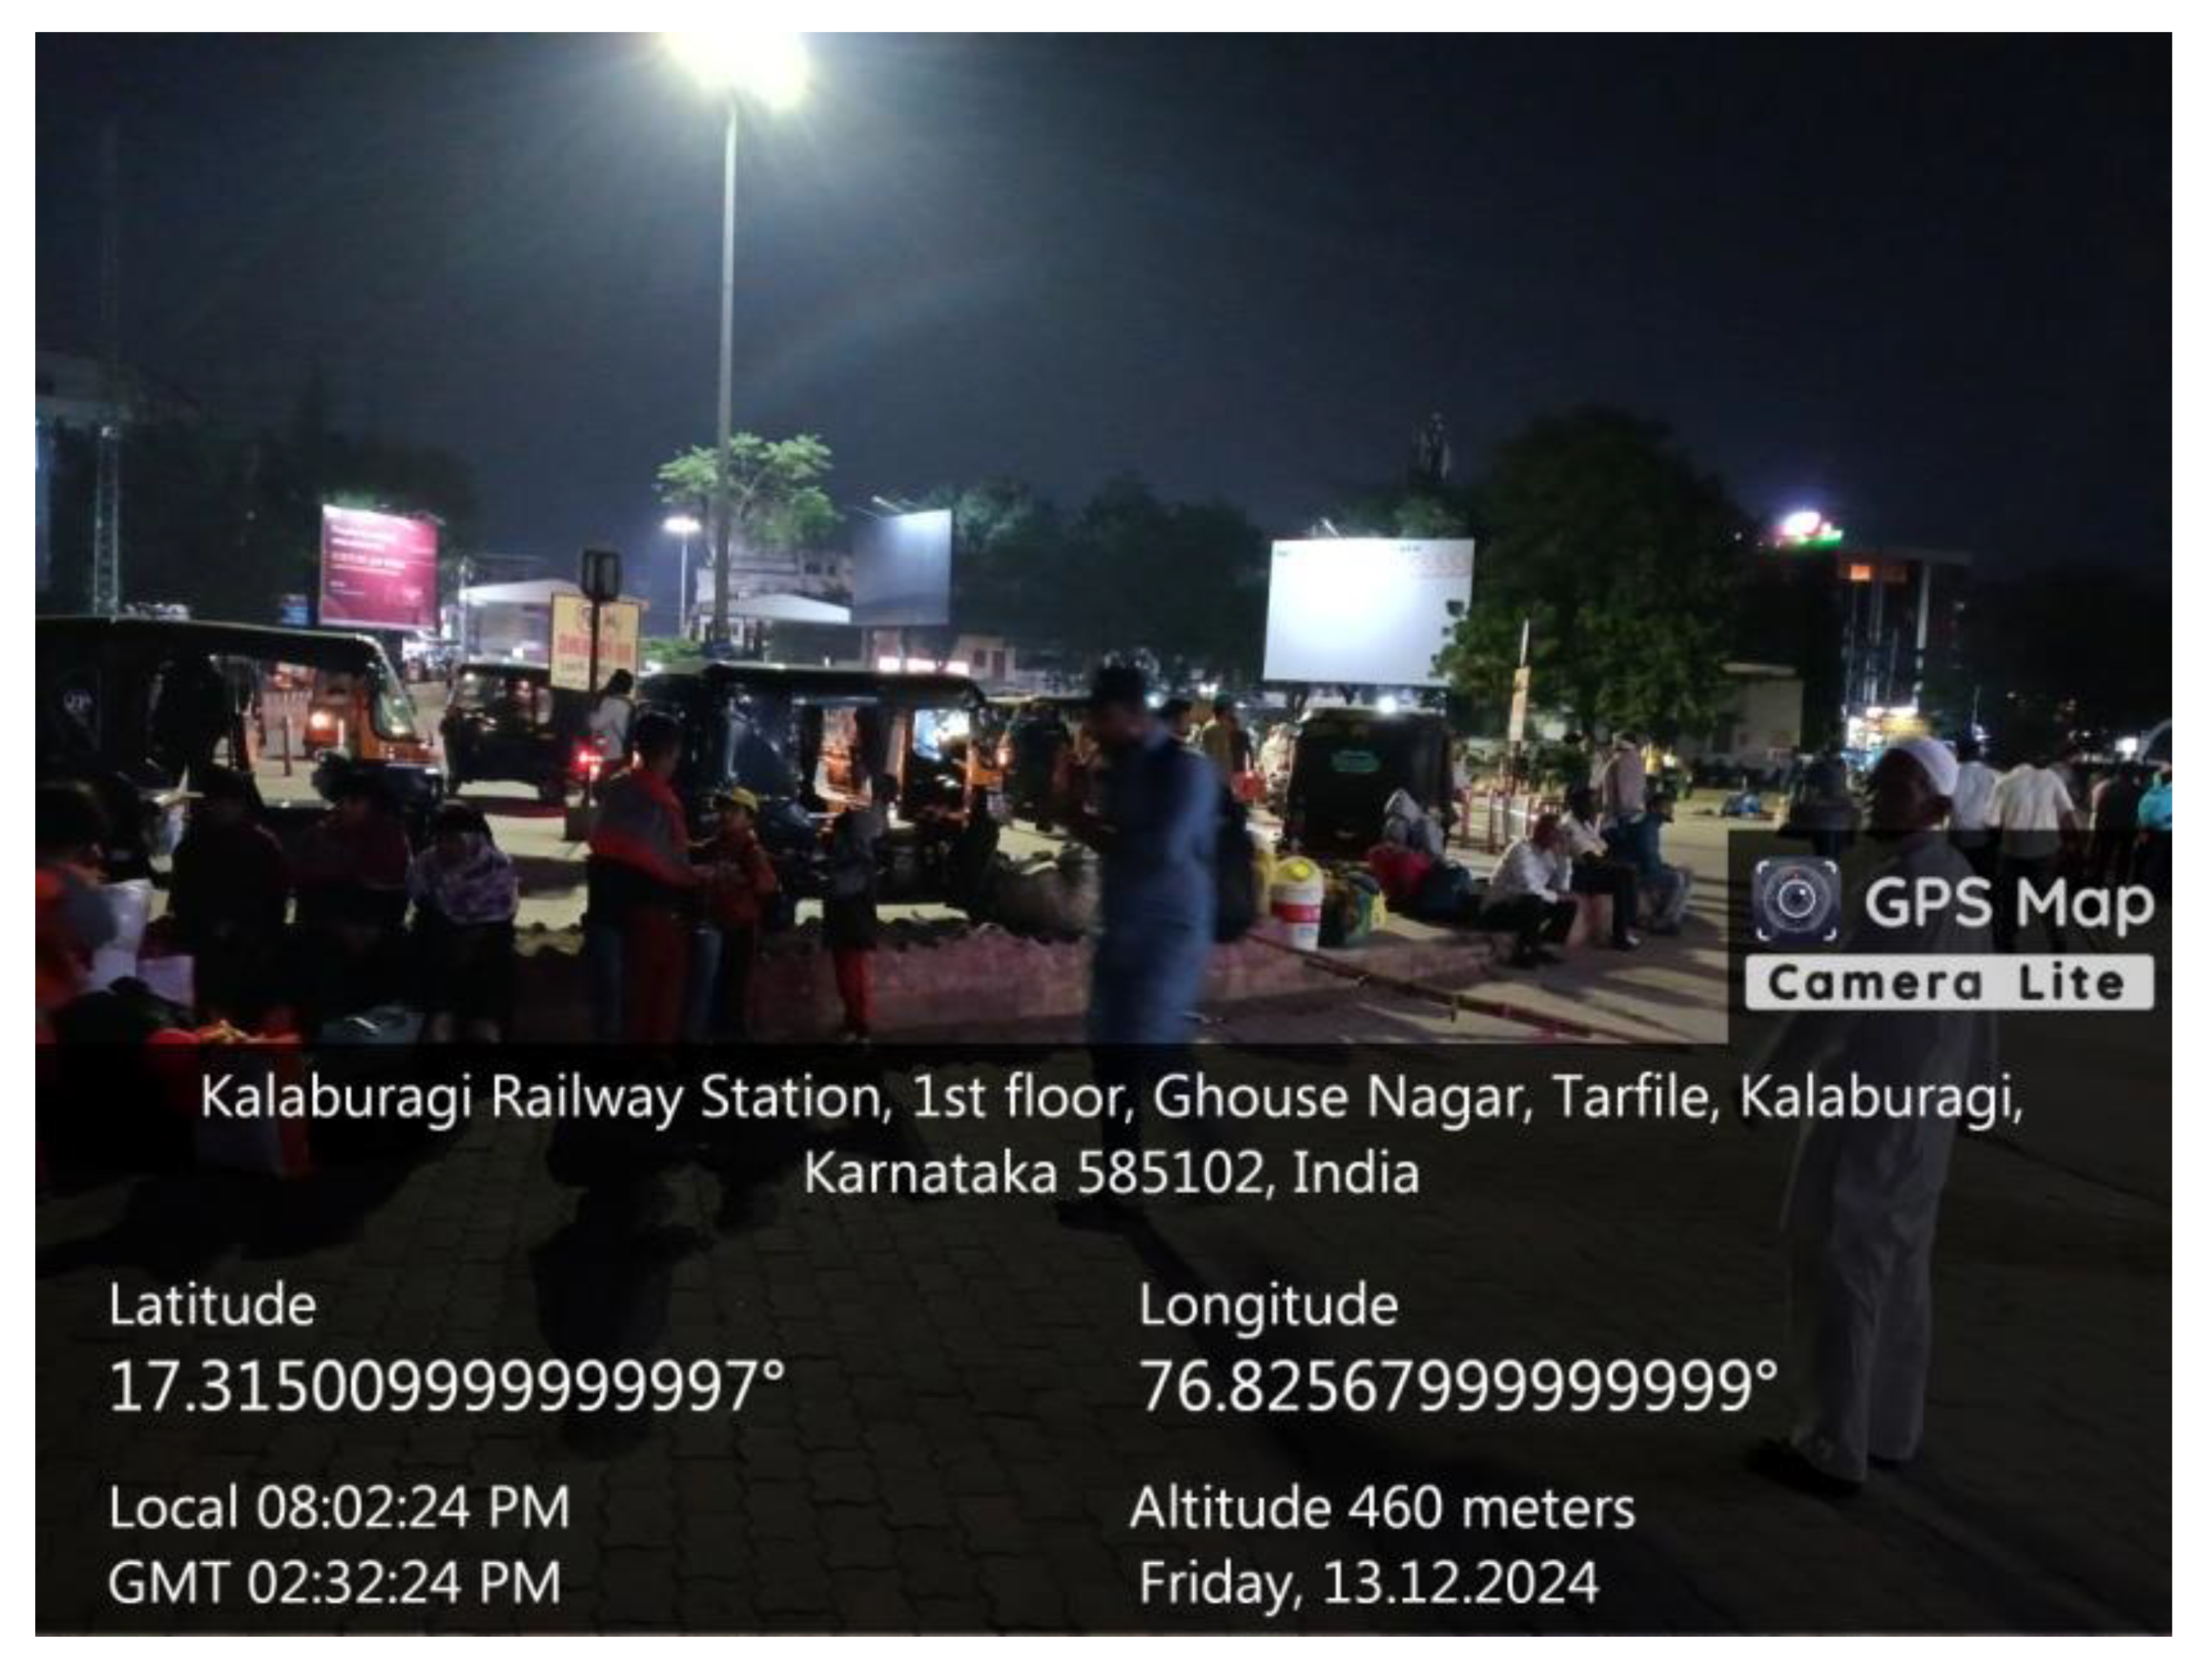
Figure 5.
Figure5. .
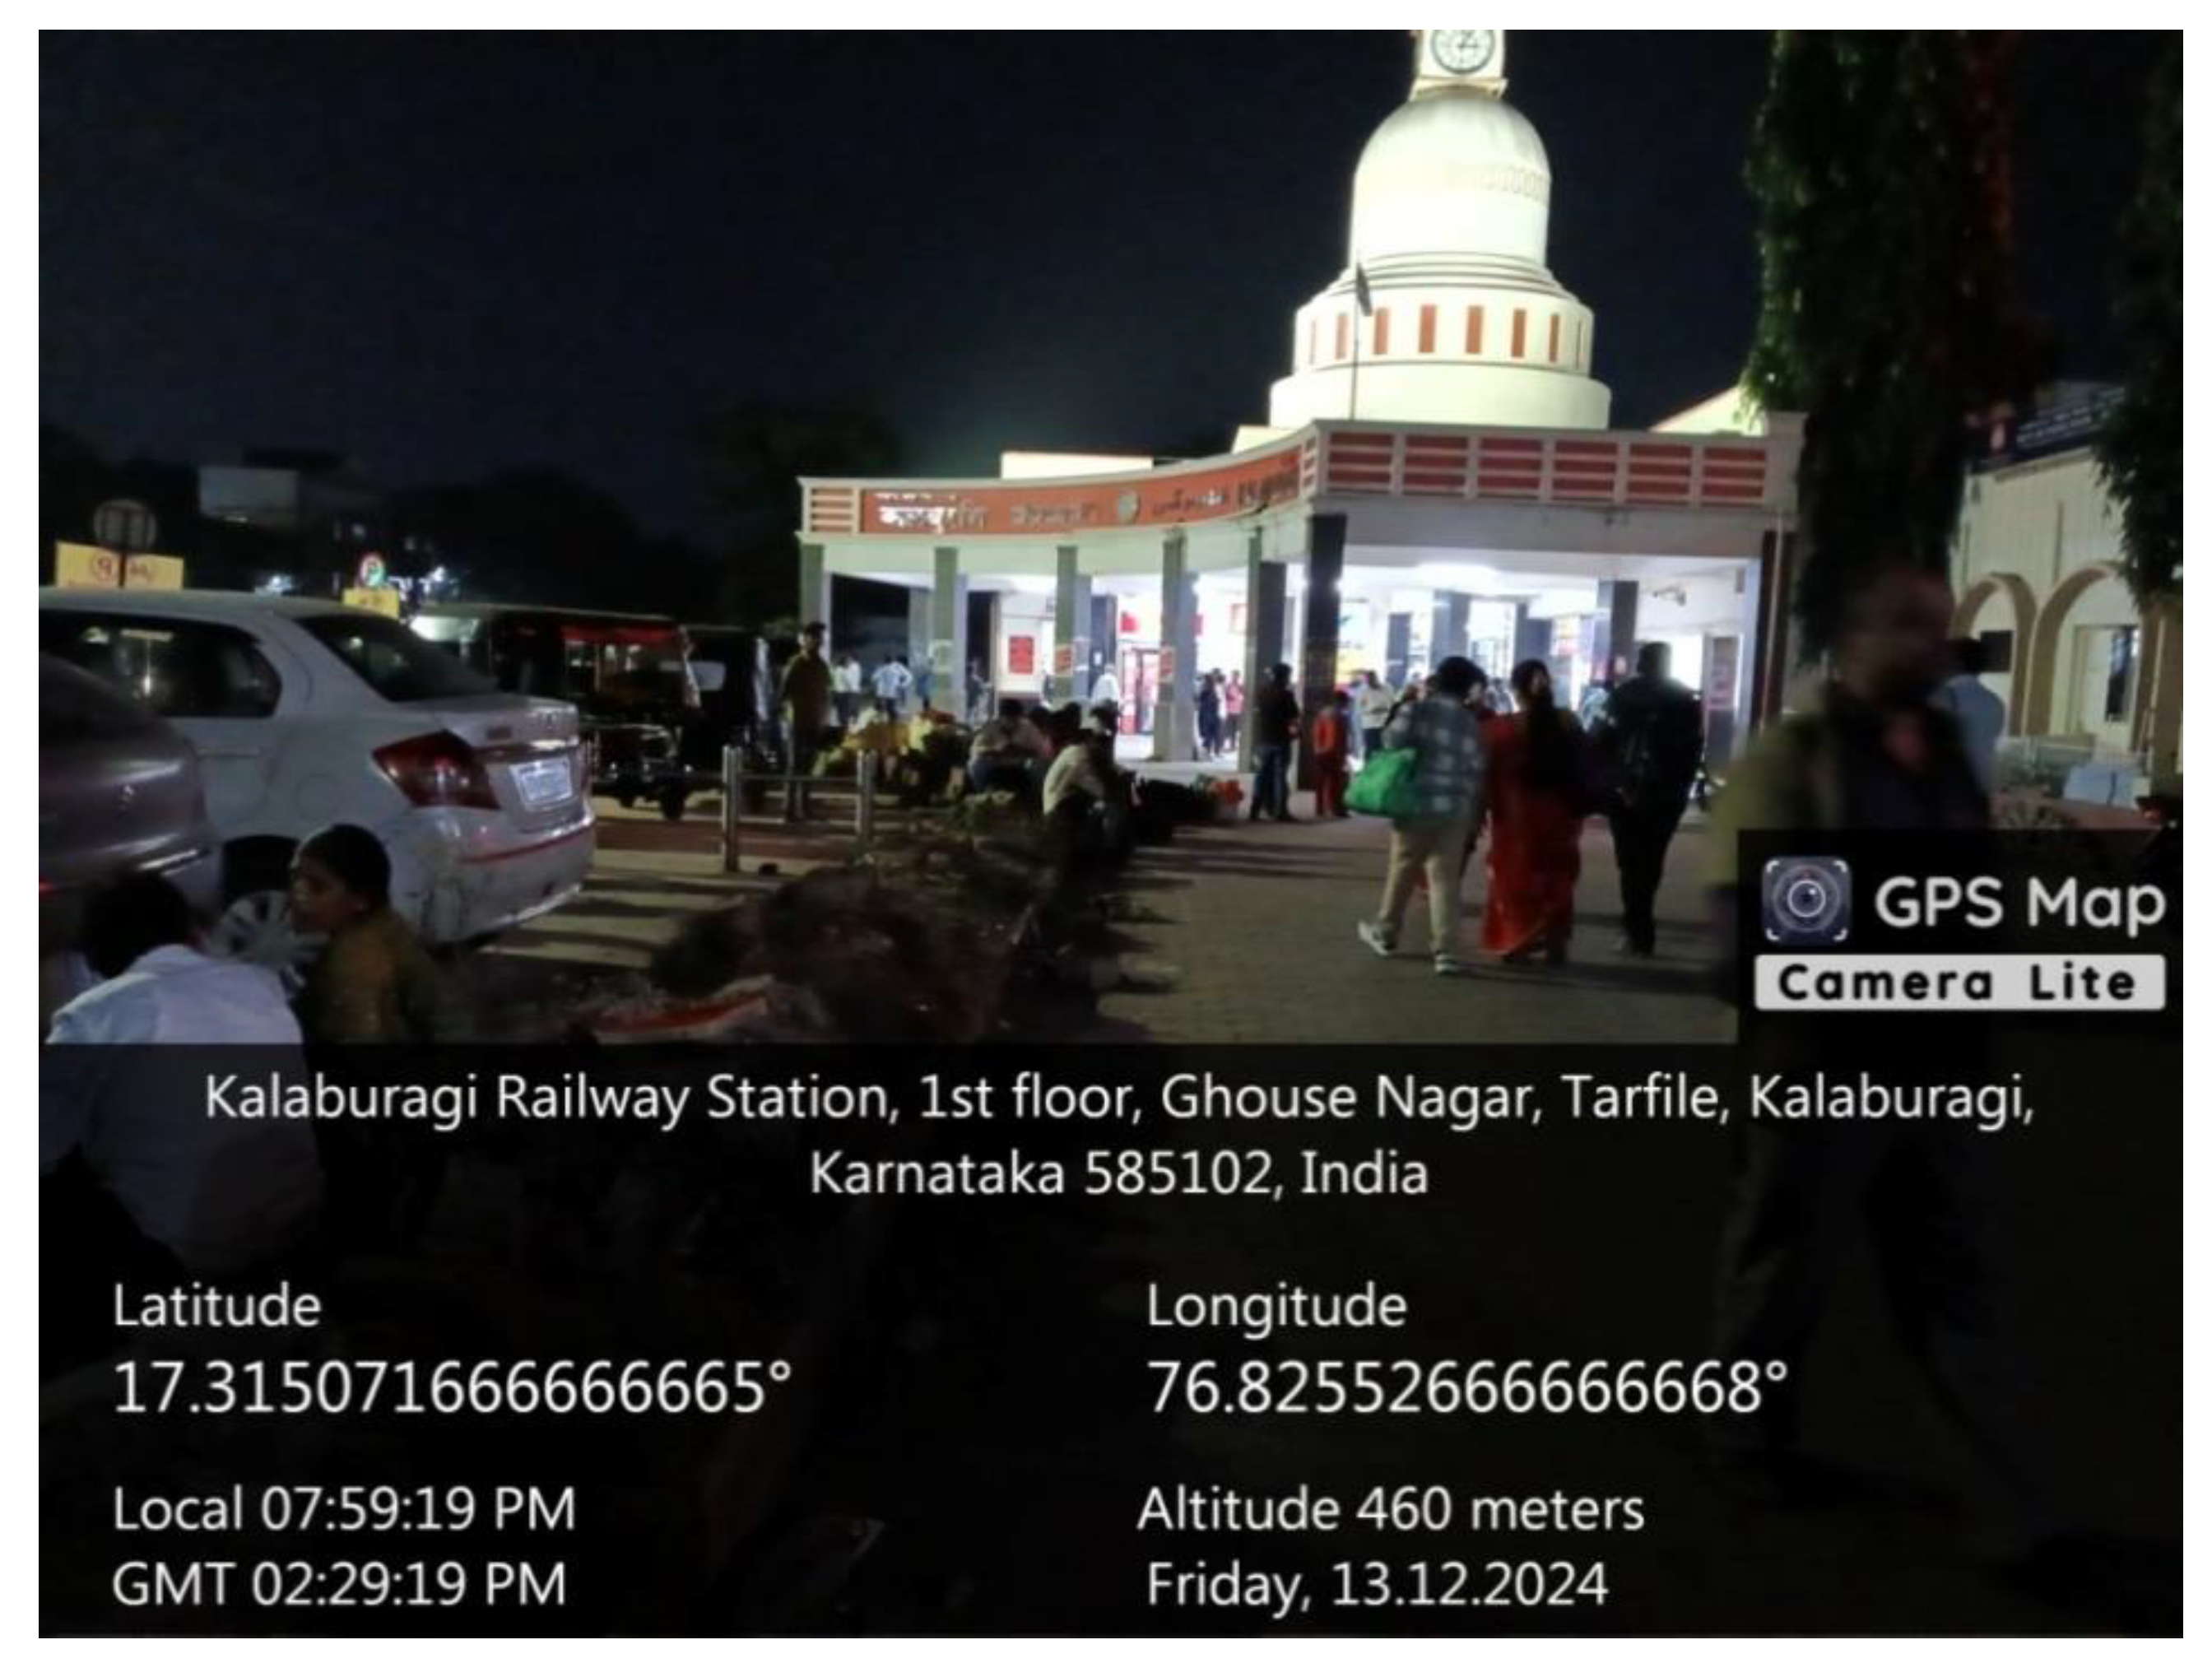
Figure 6.
Figure6. .
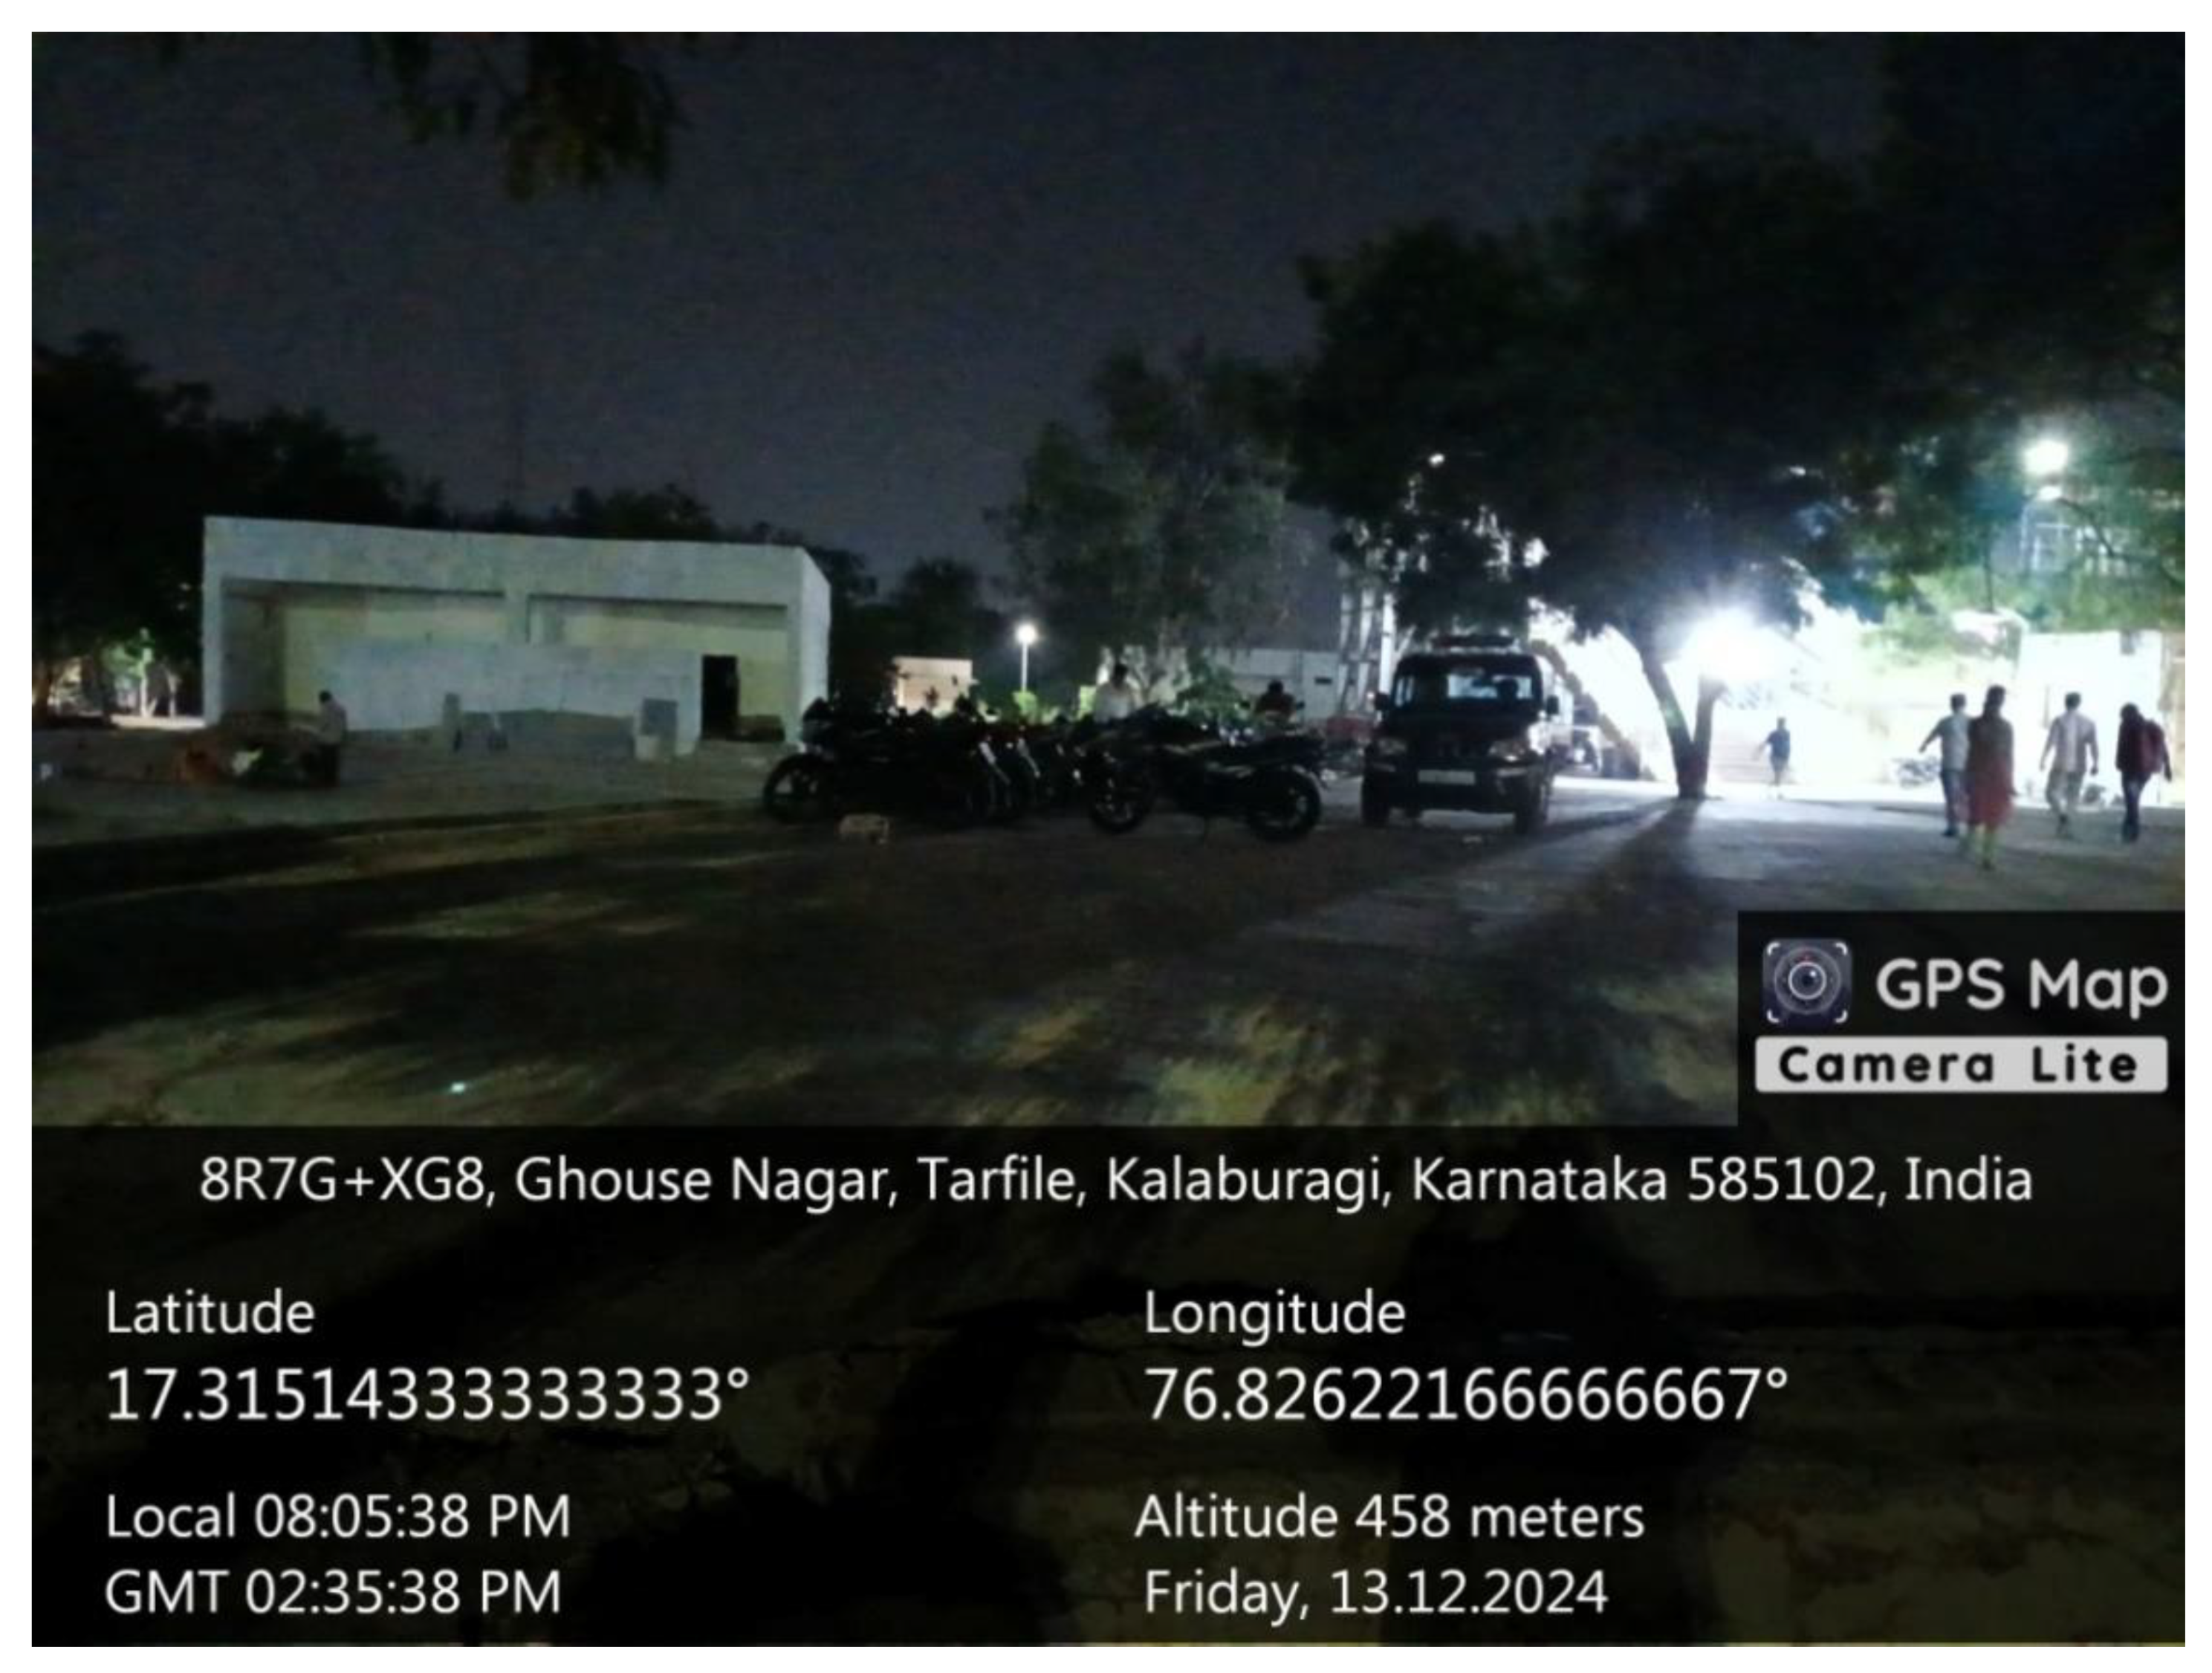
Figure 7.
Figure7. .
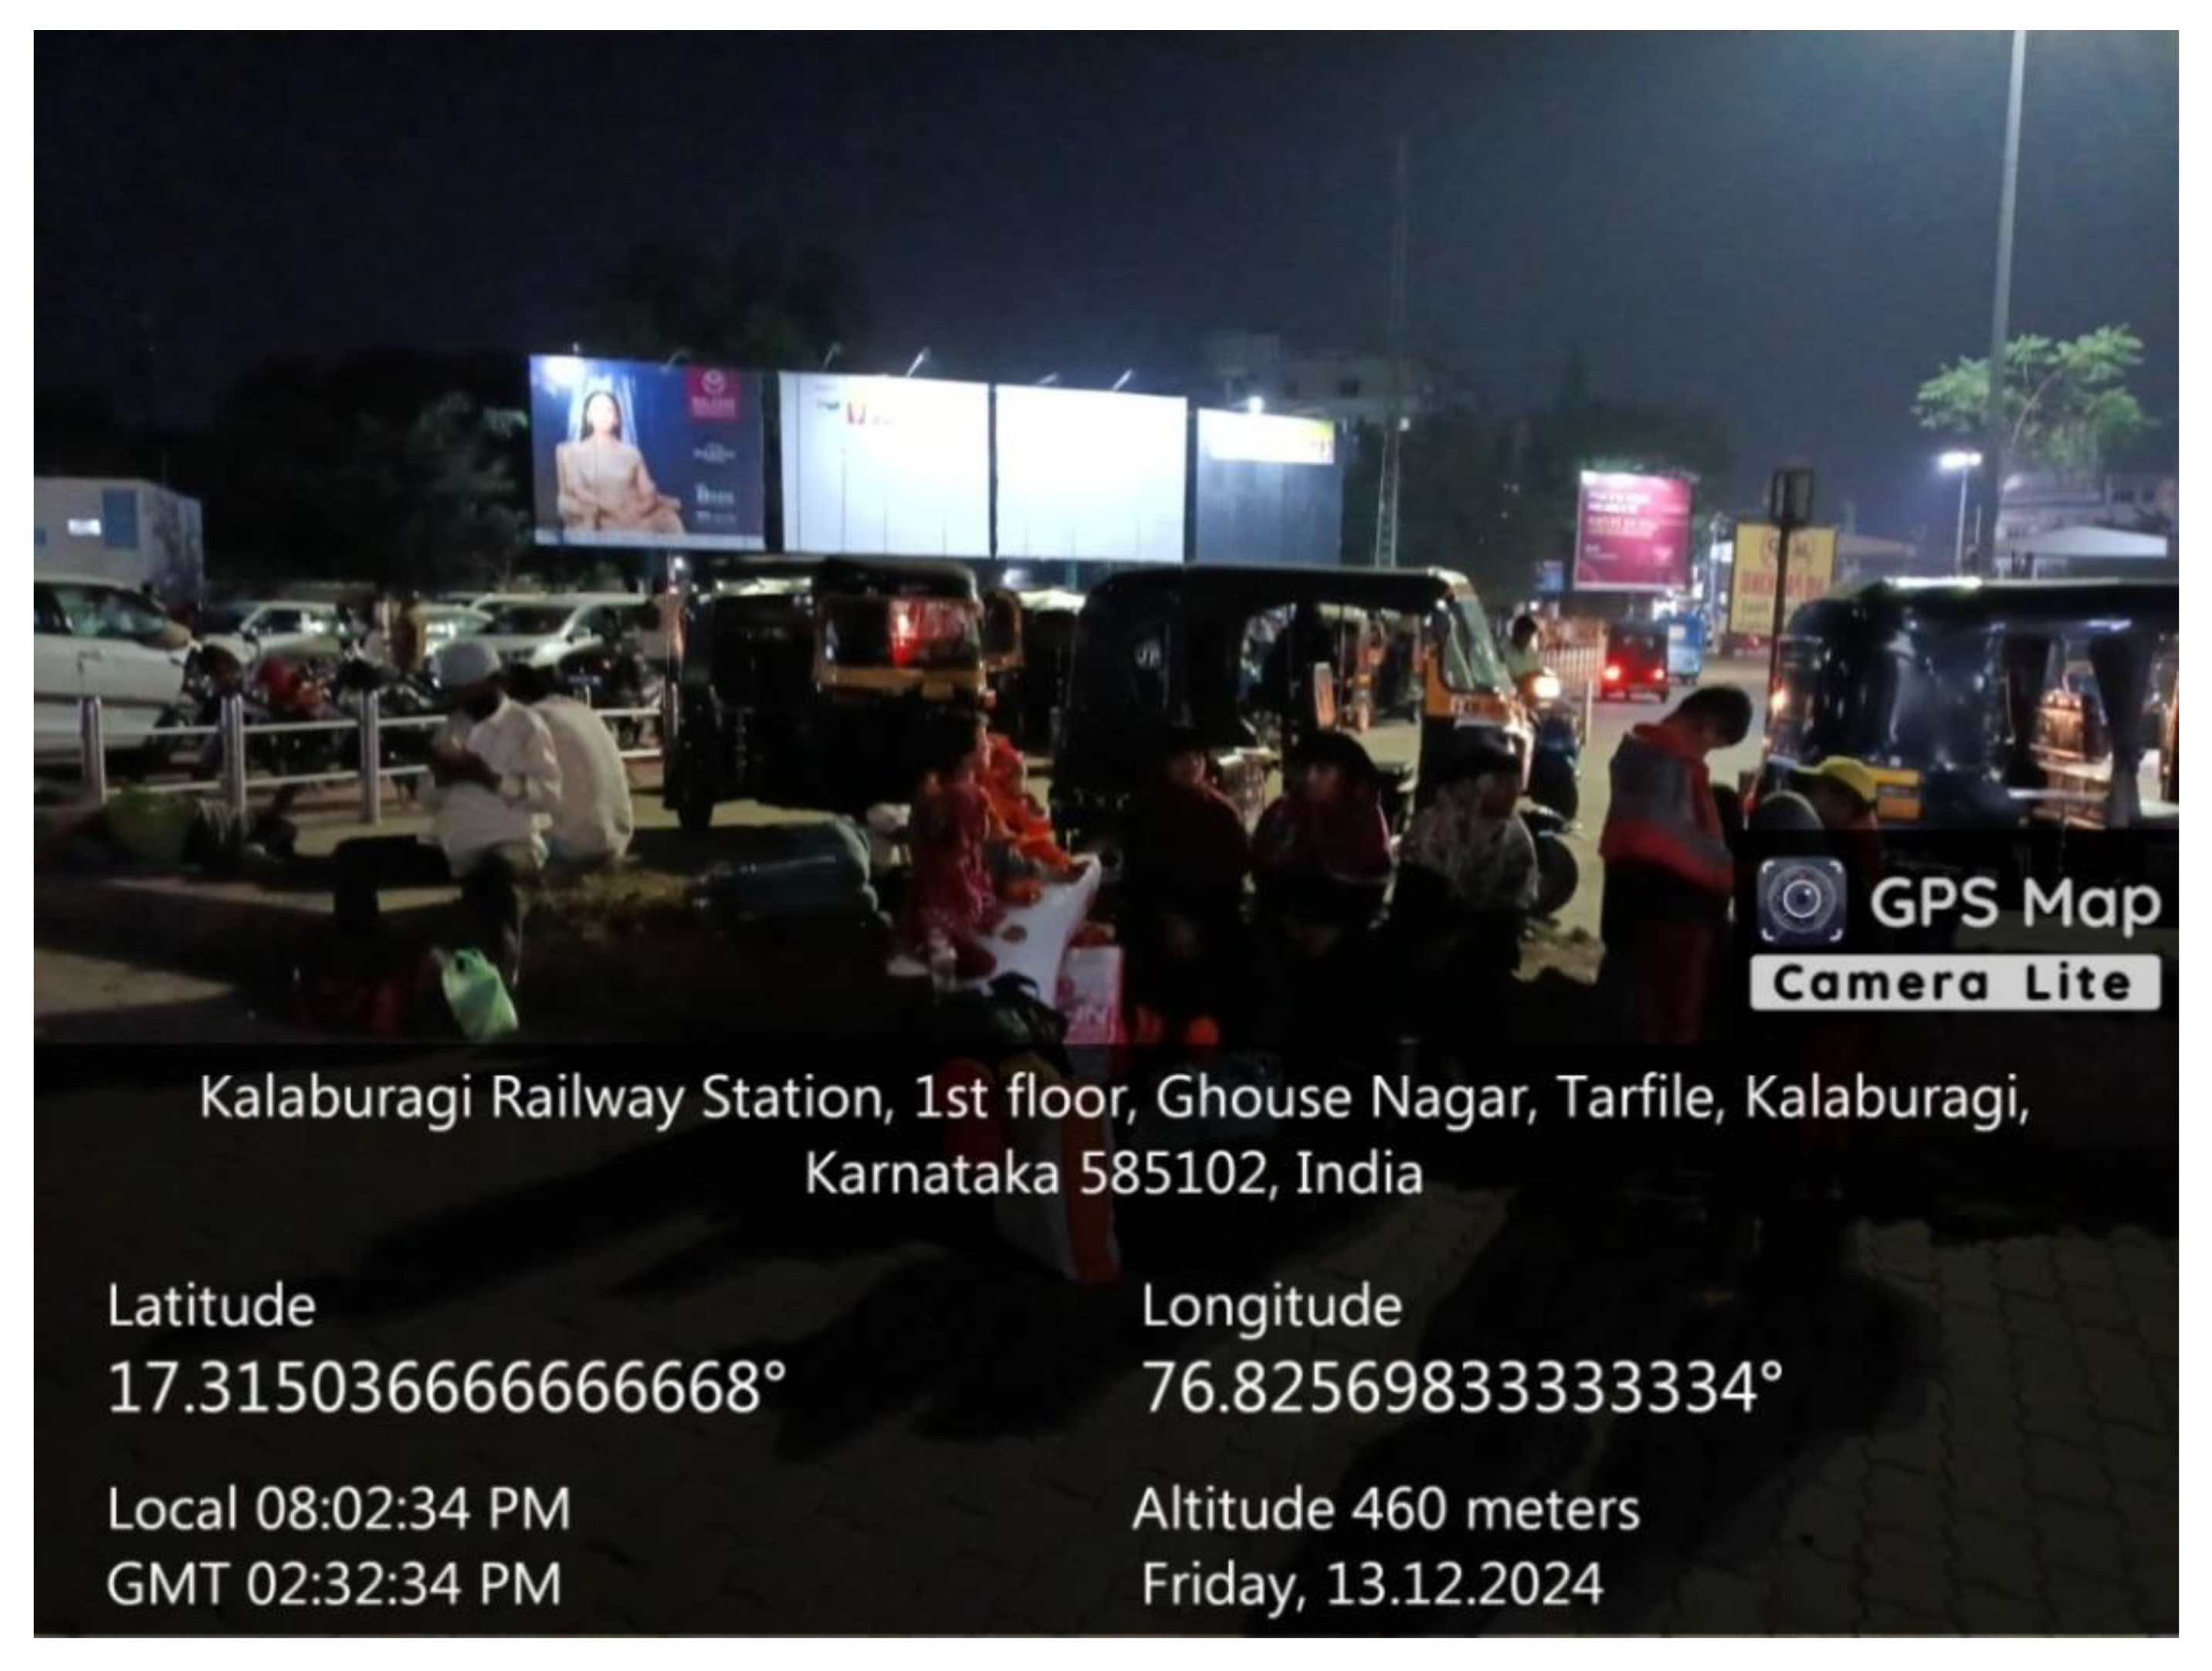
Figure 8.
Figure8. .
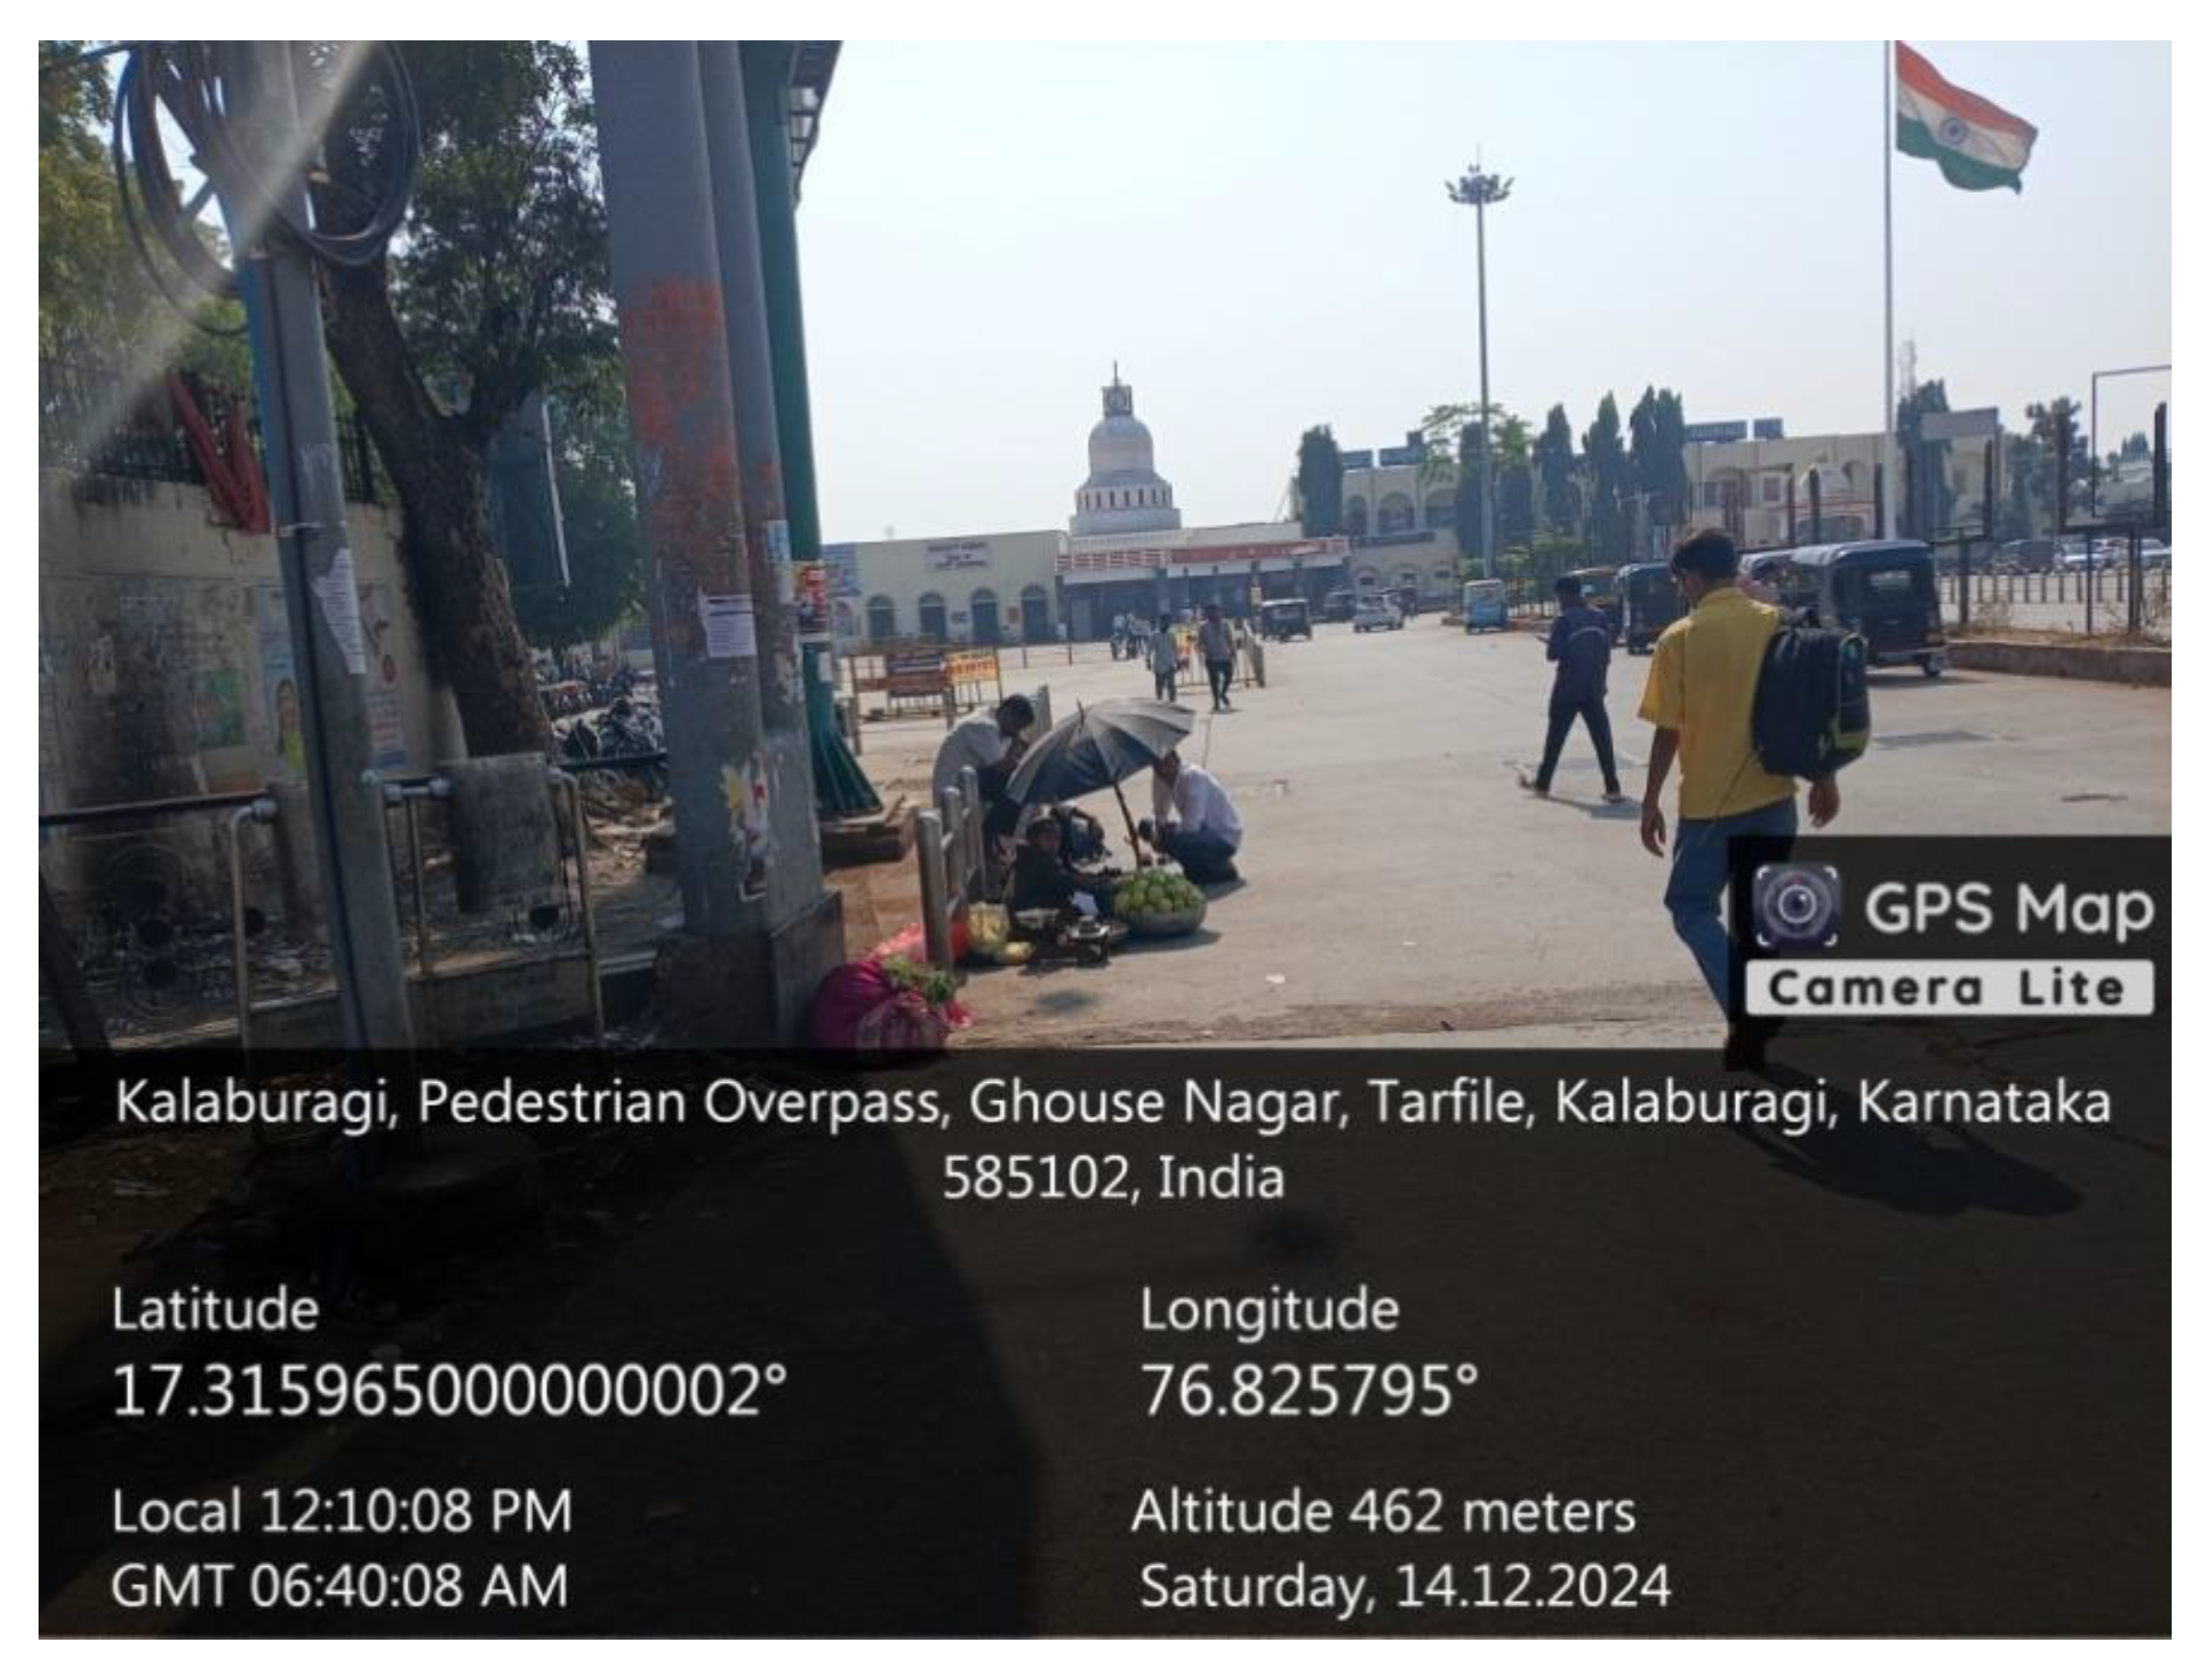
Figure 9.
Figure9. .
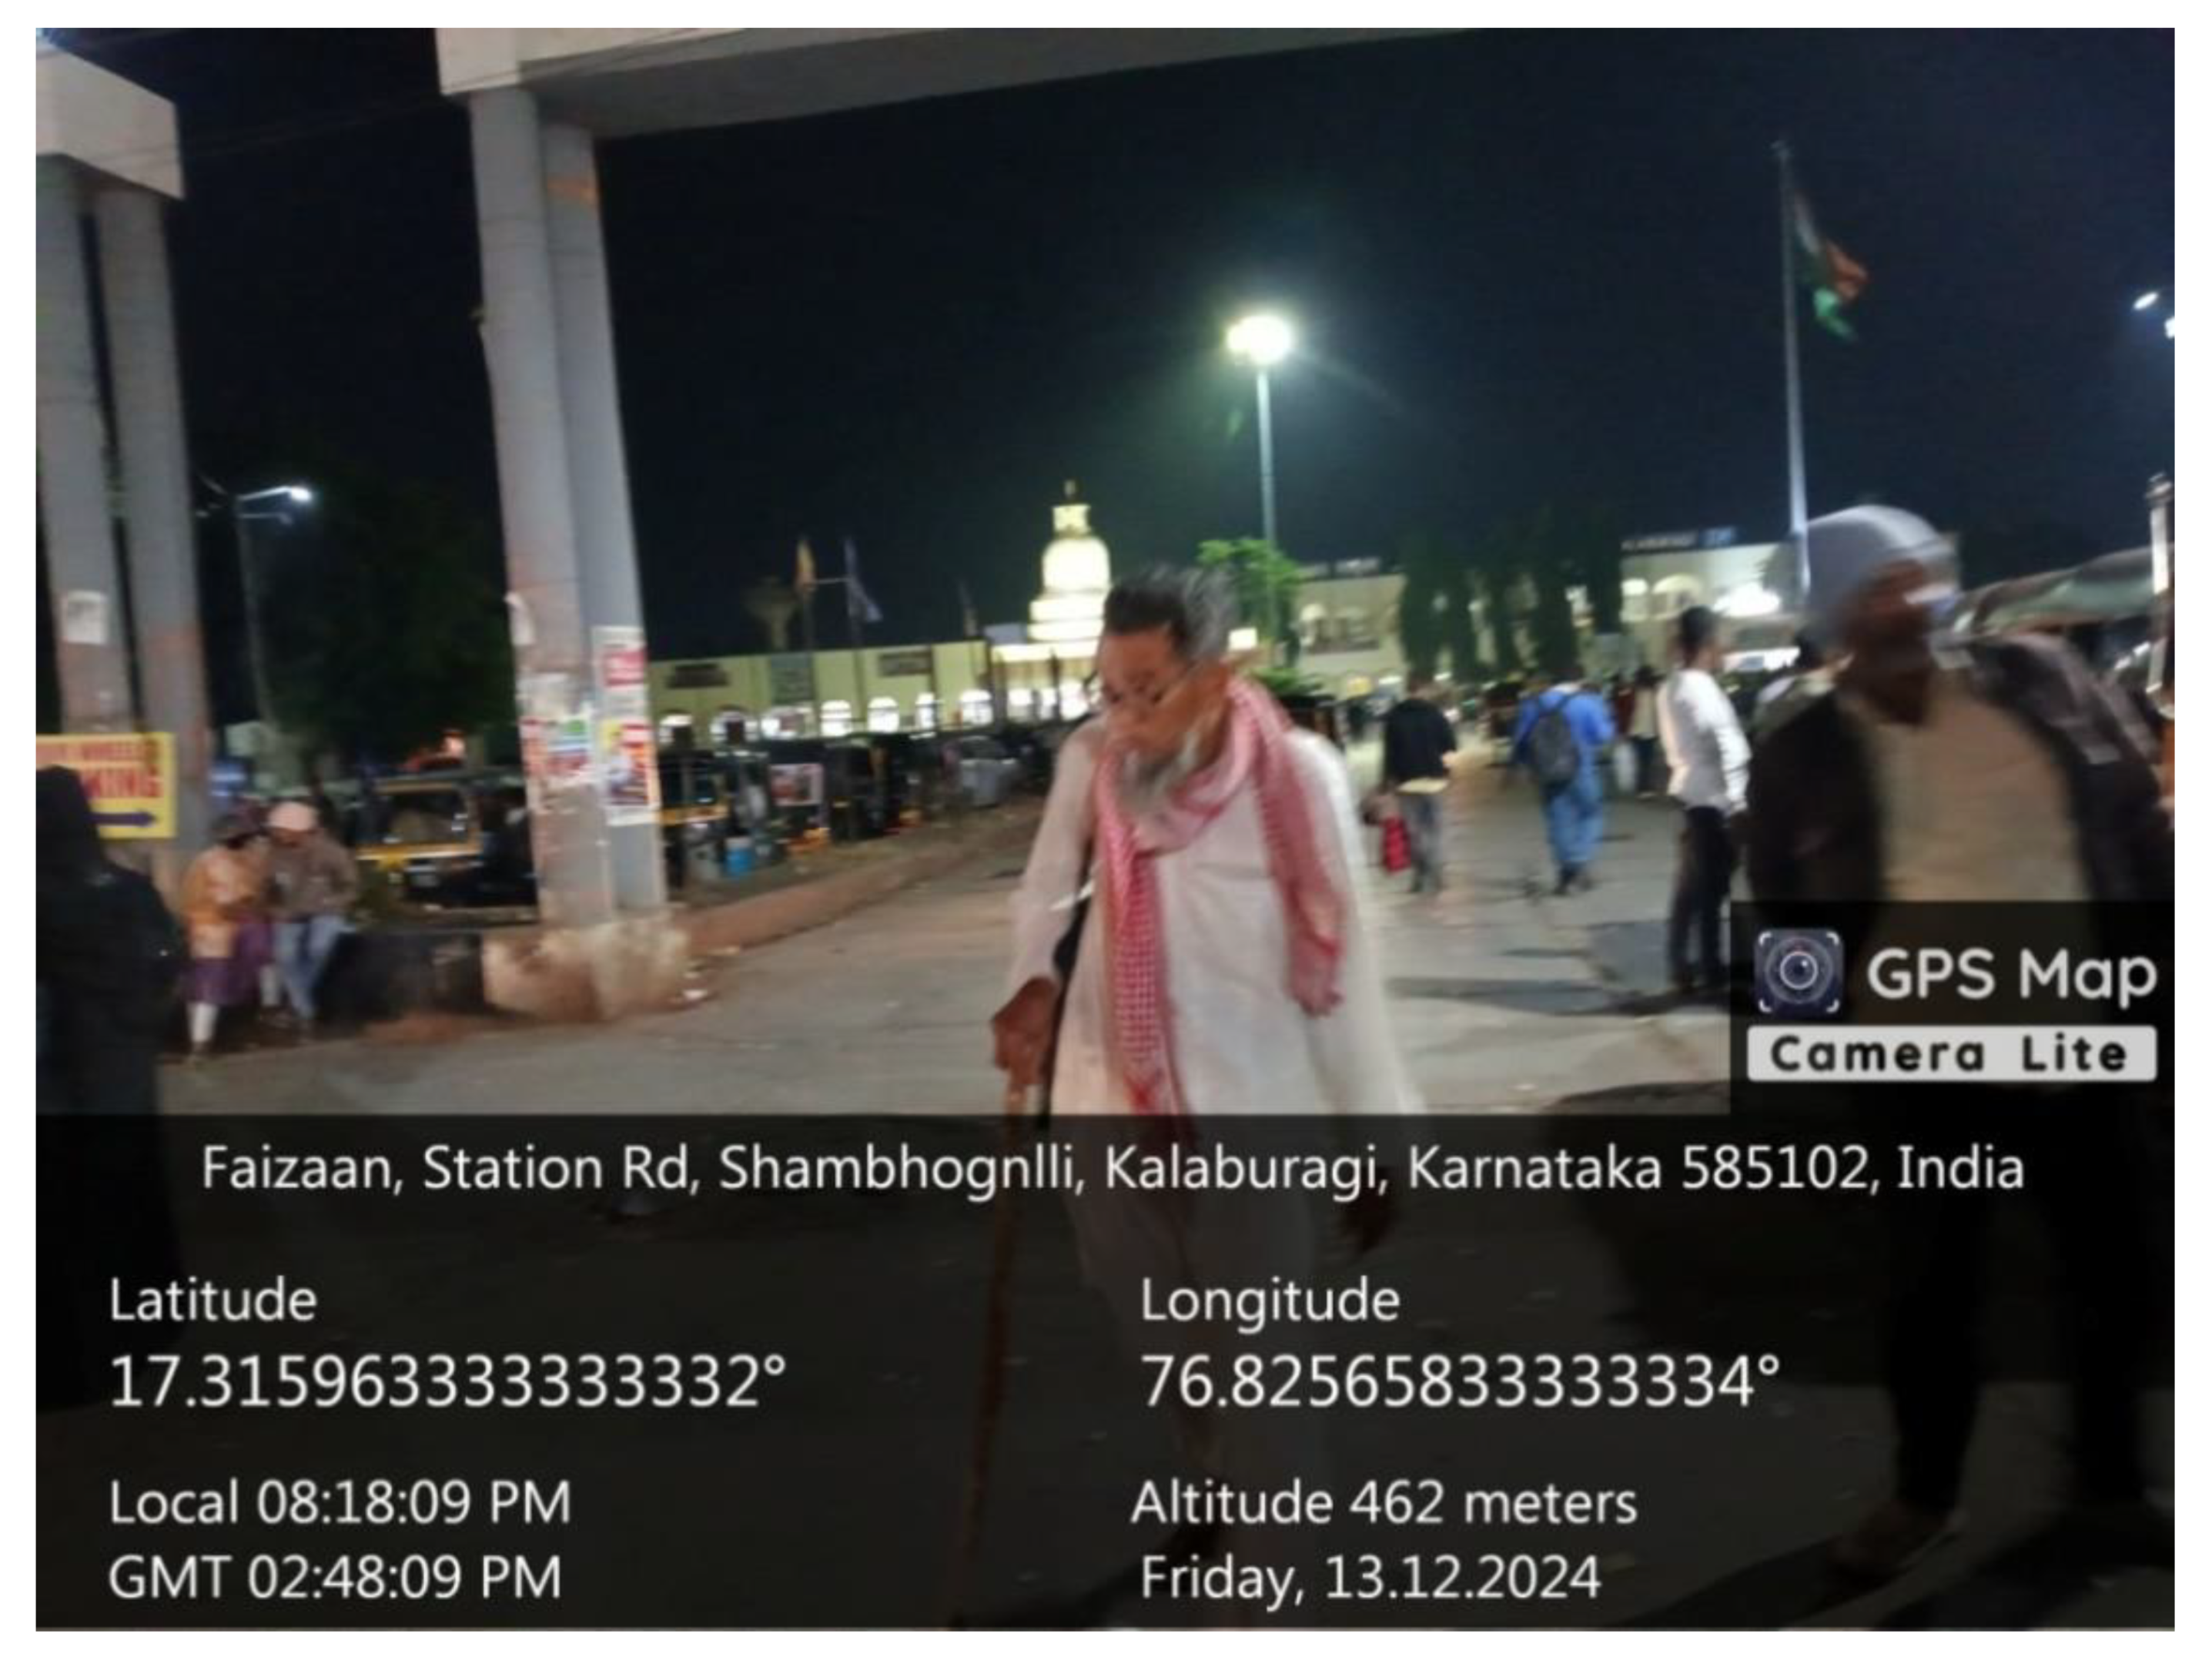
Figure 10.
Figure10. .
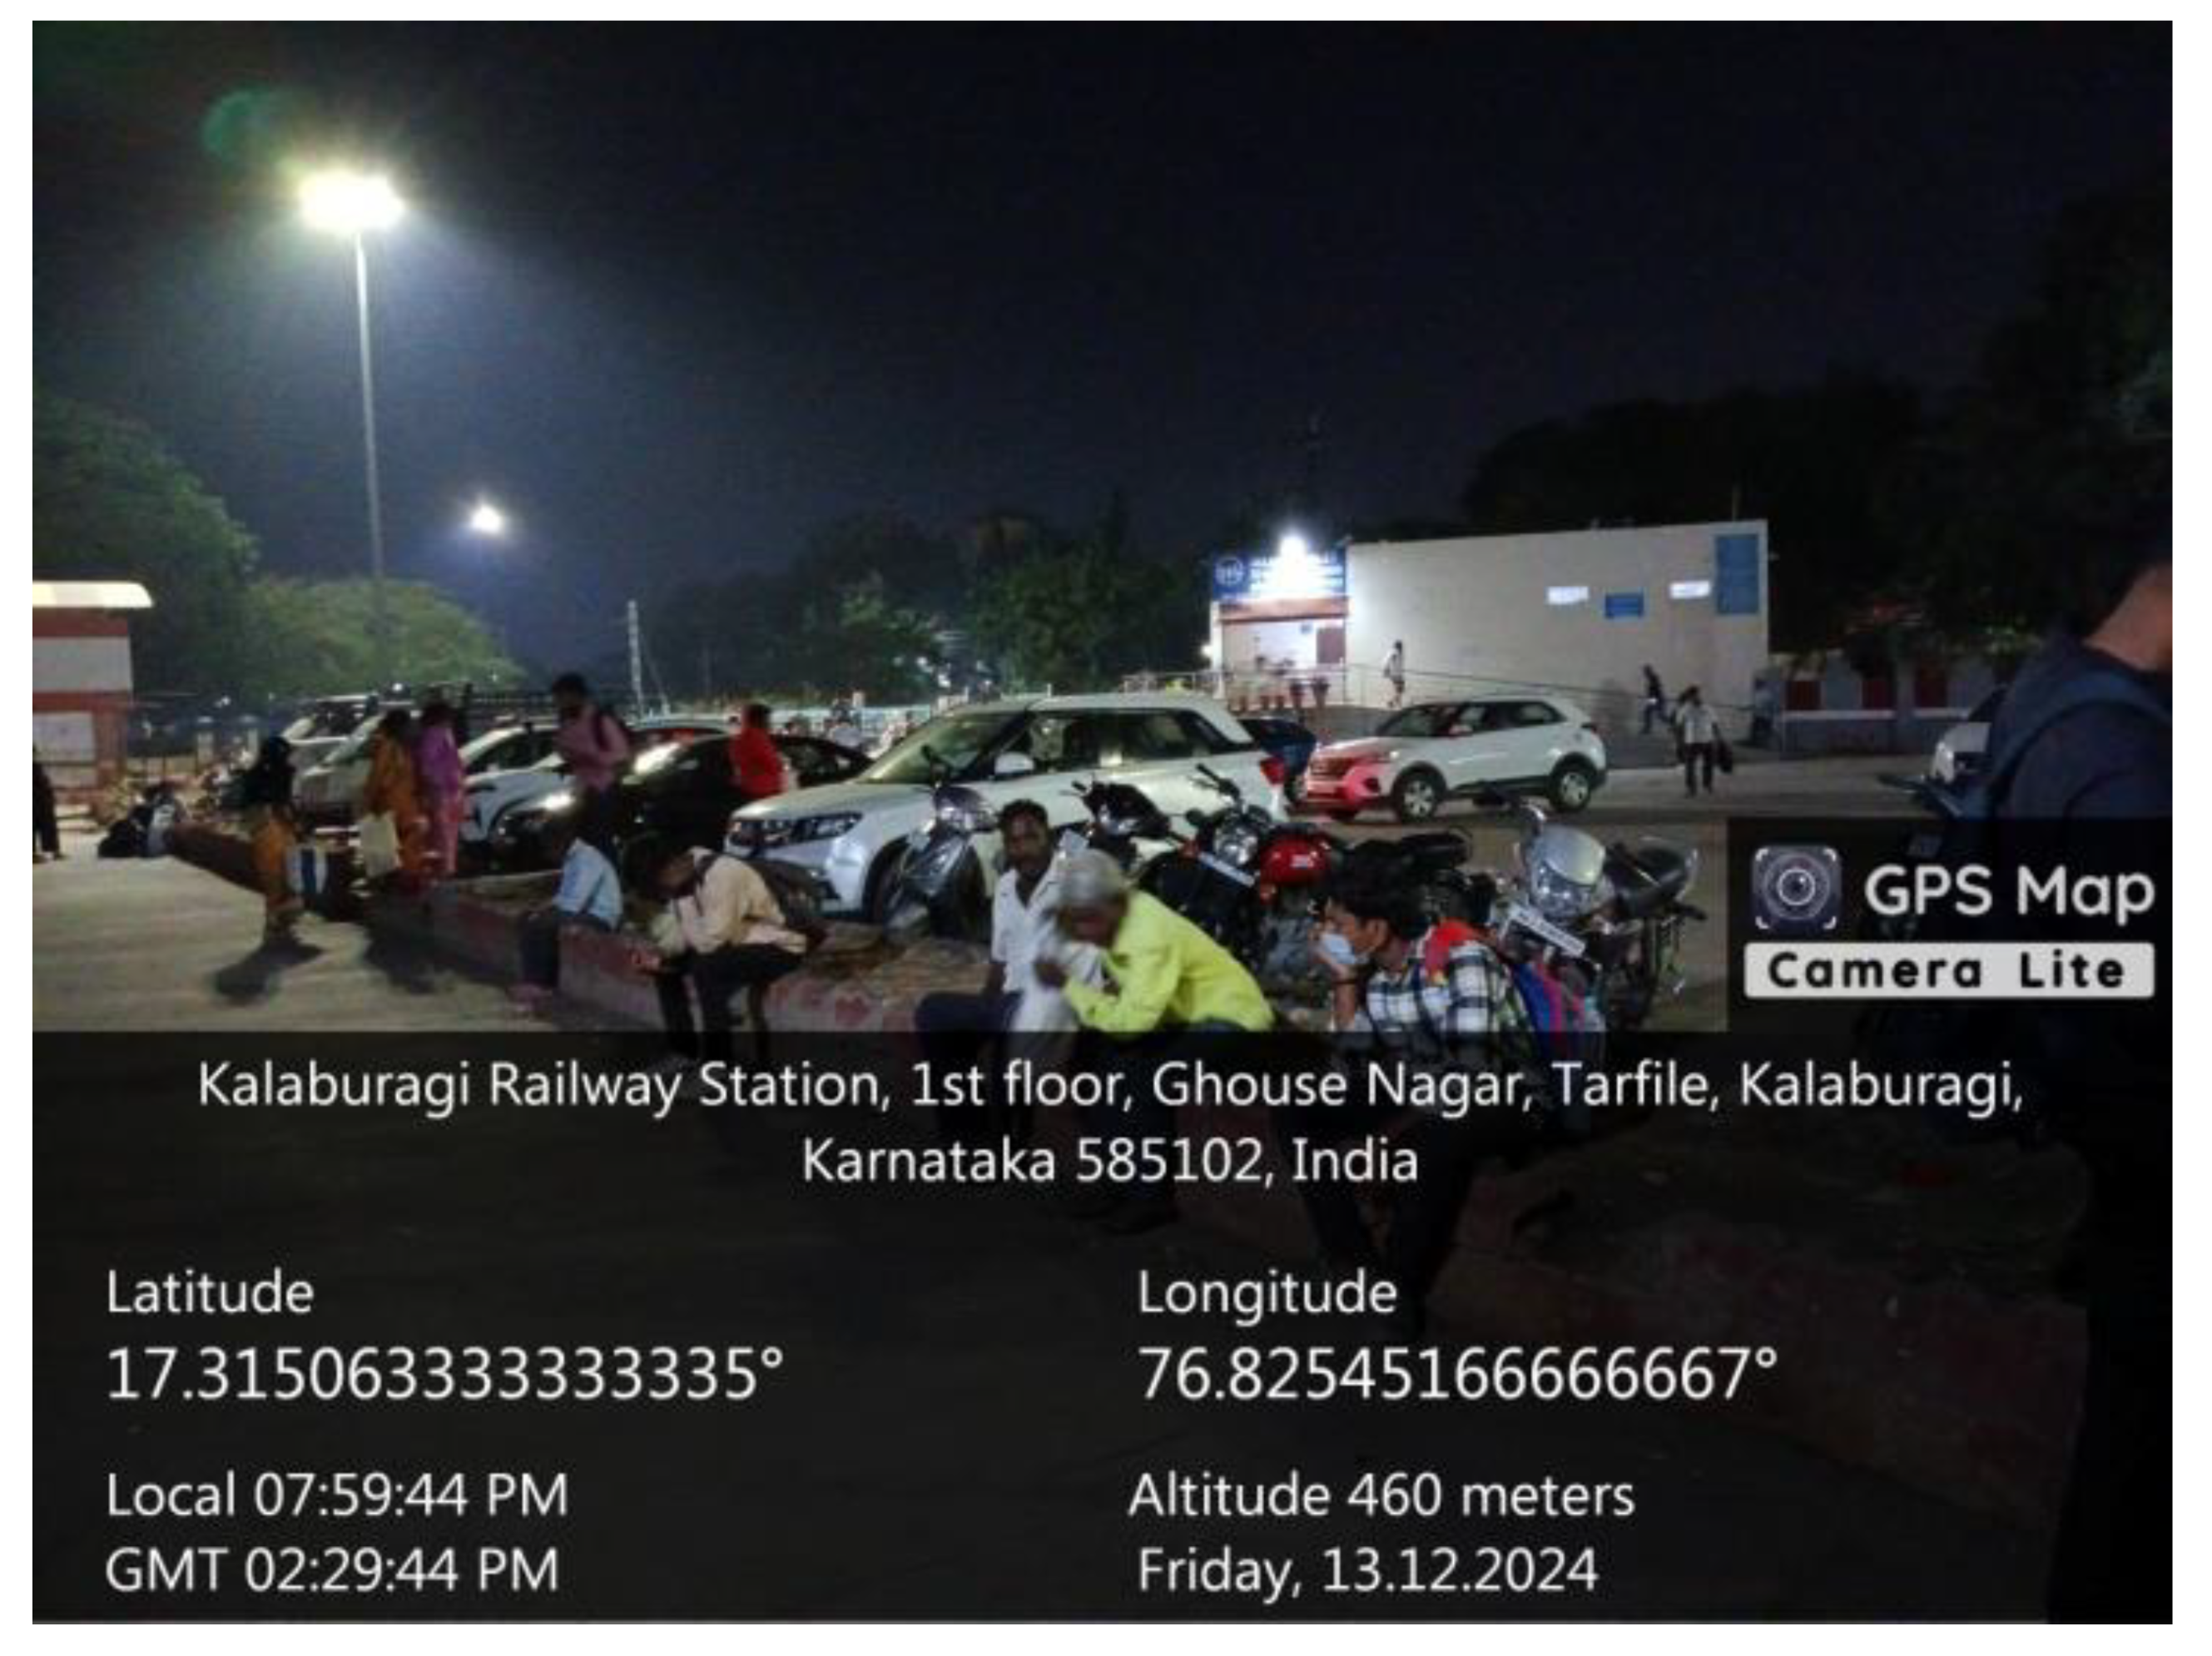
Figure 11.
Figure11. .
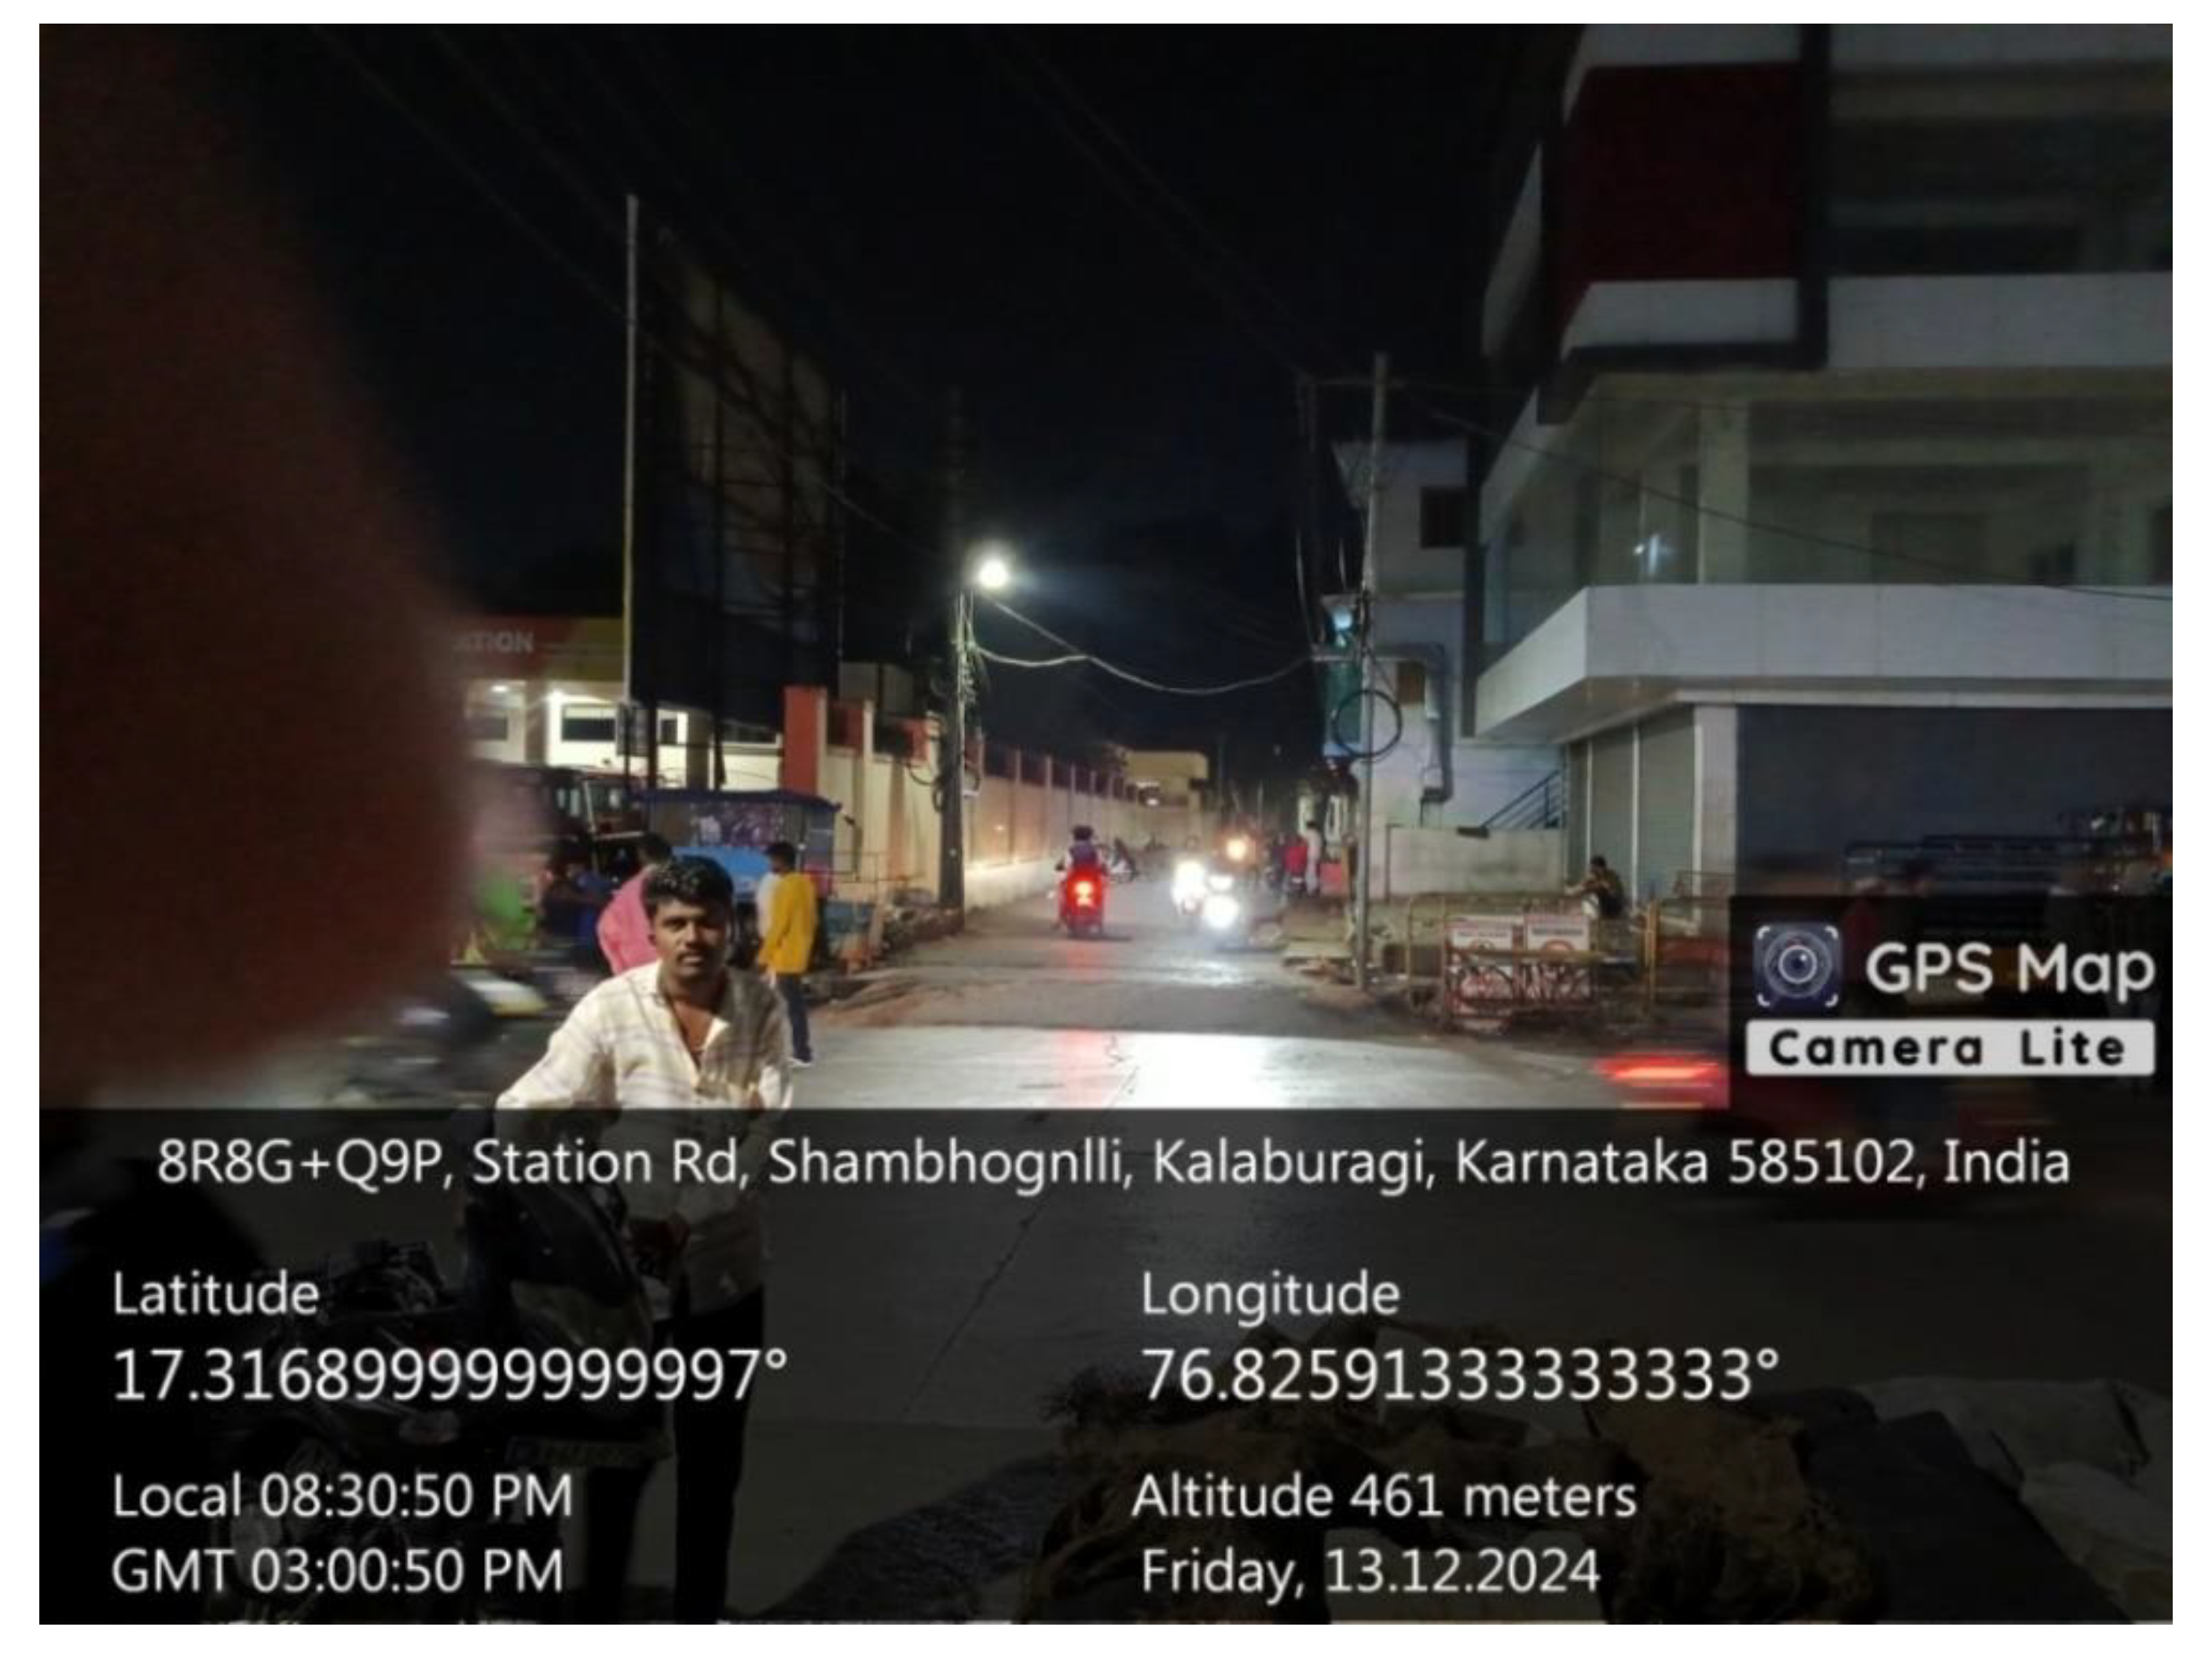
Figure 12.
Figure12. .
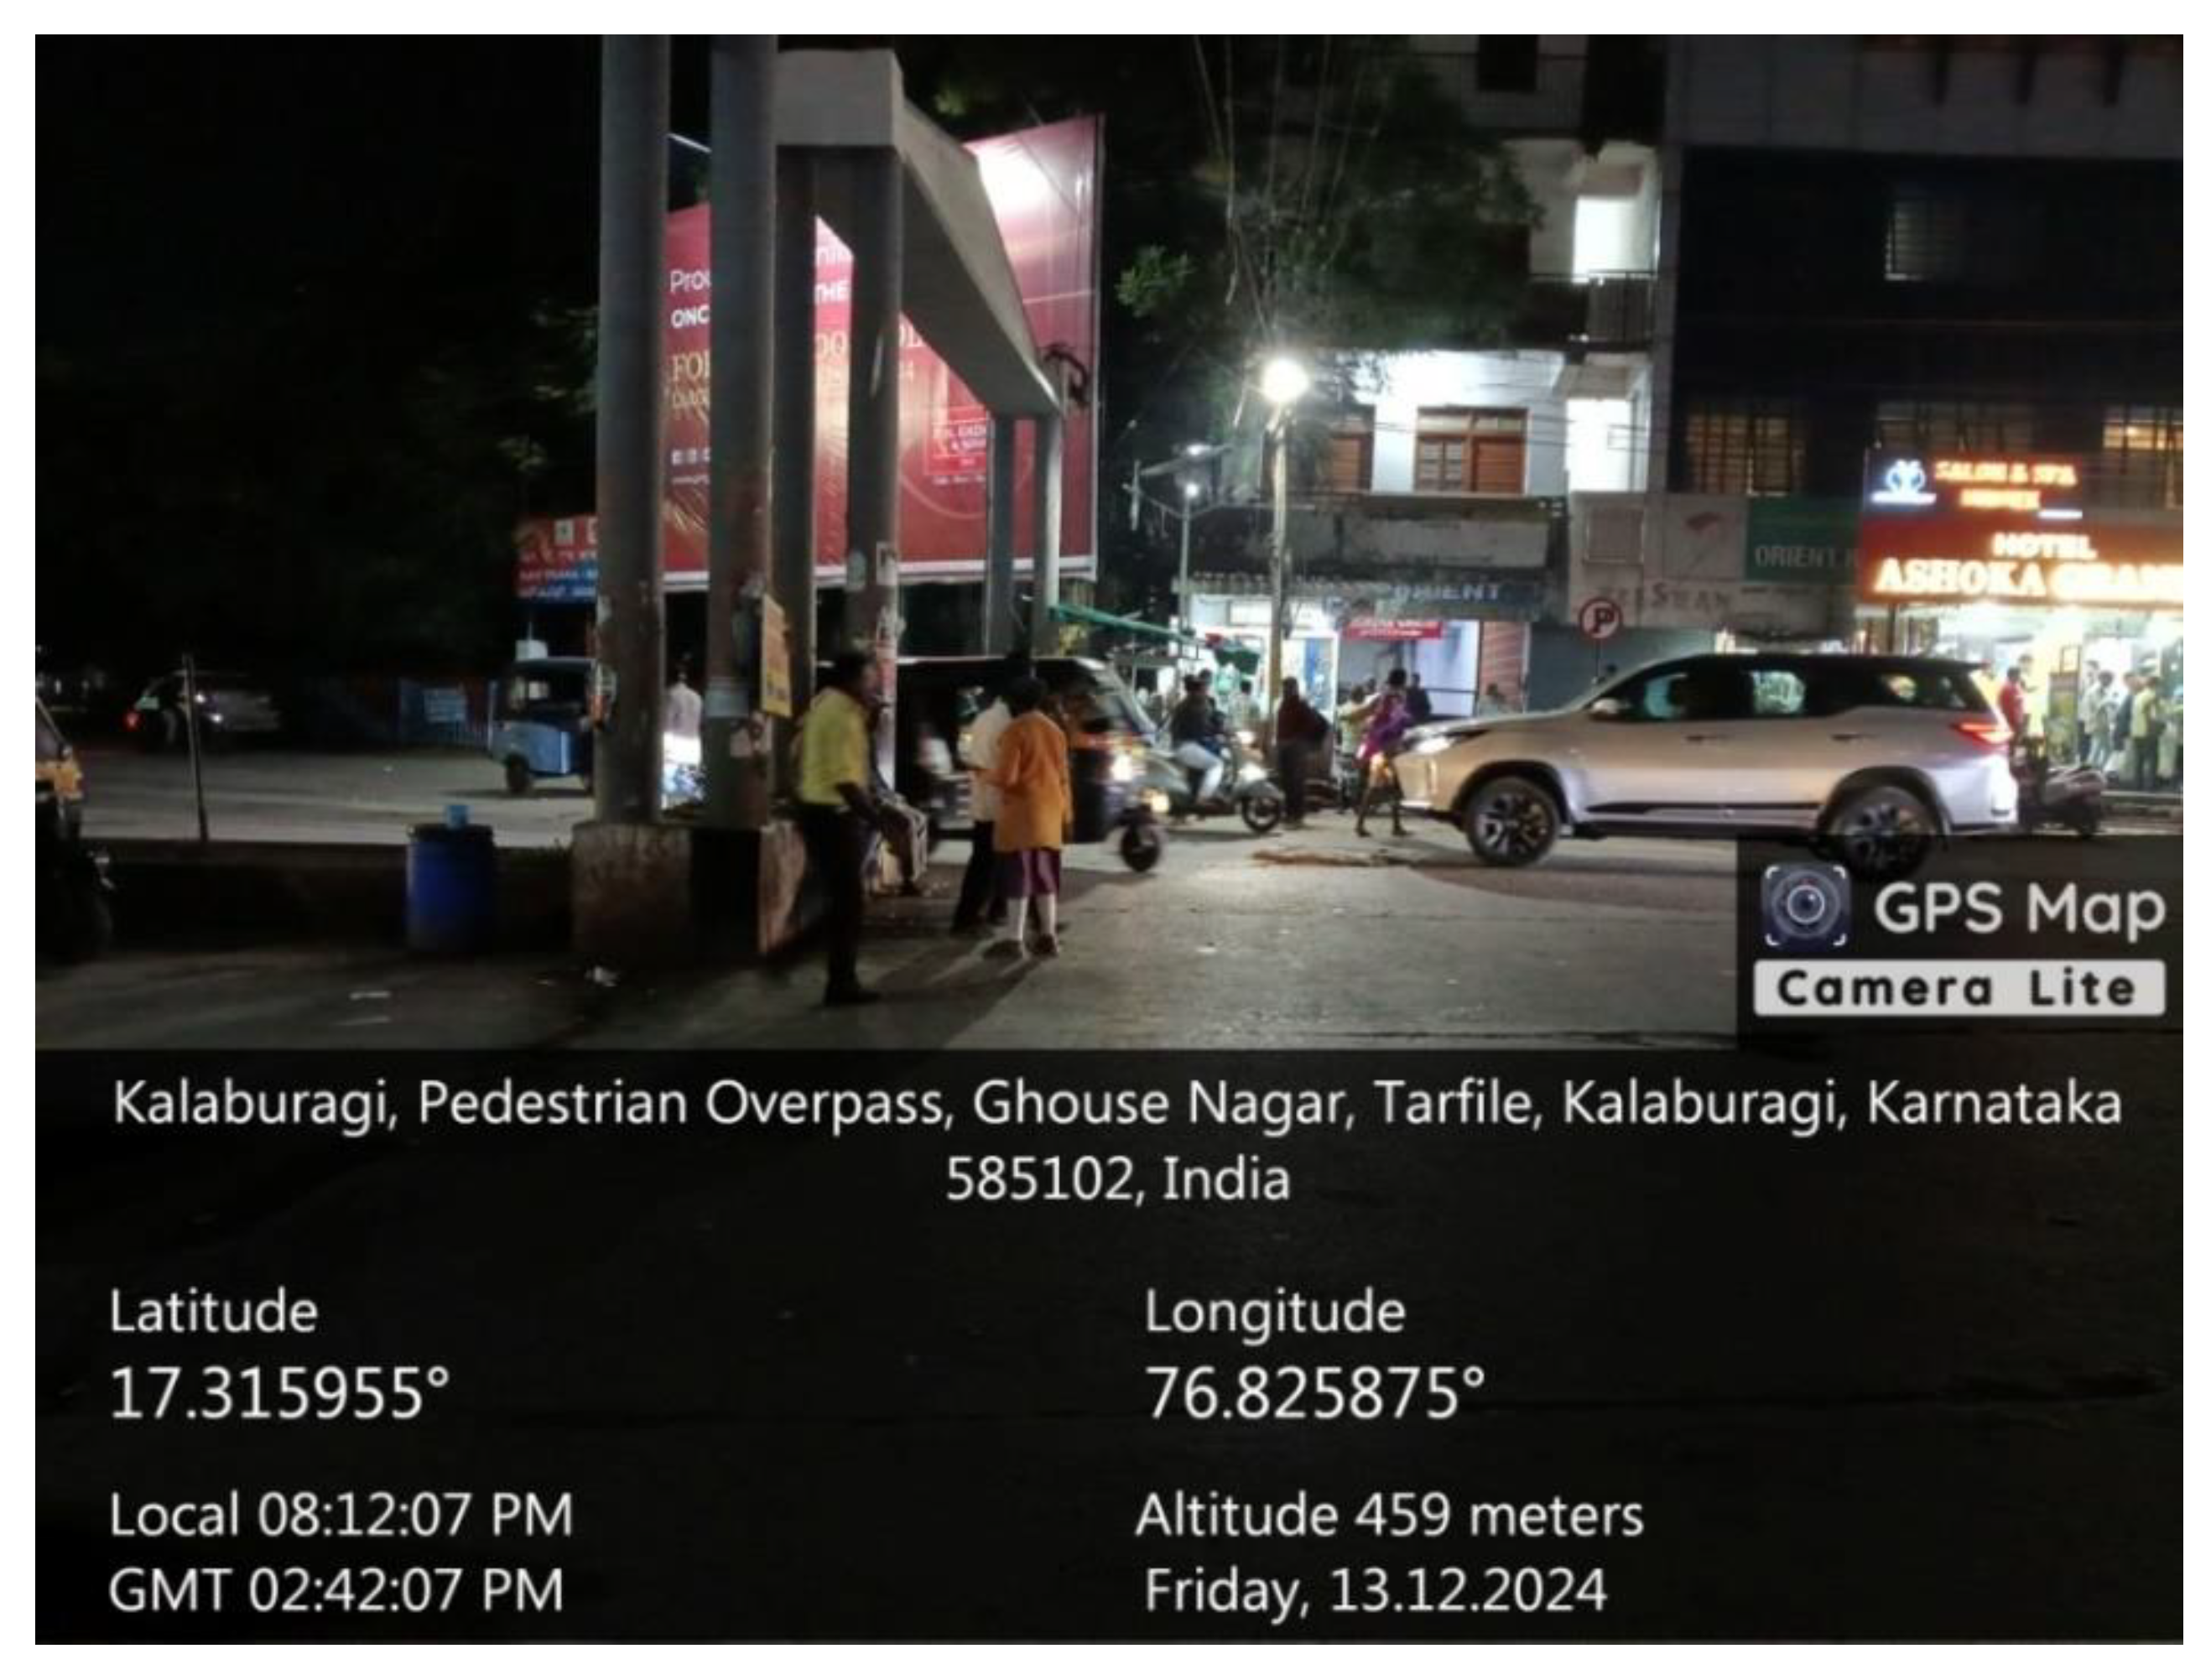
Figure 13.
Figure13. .
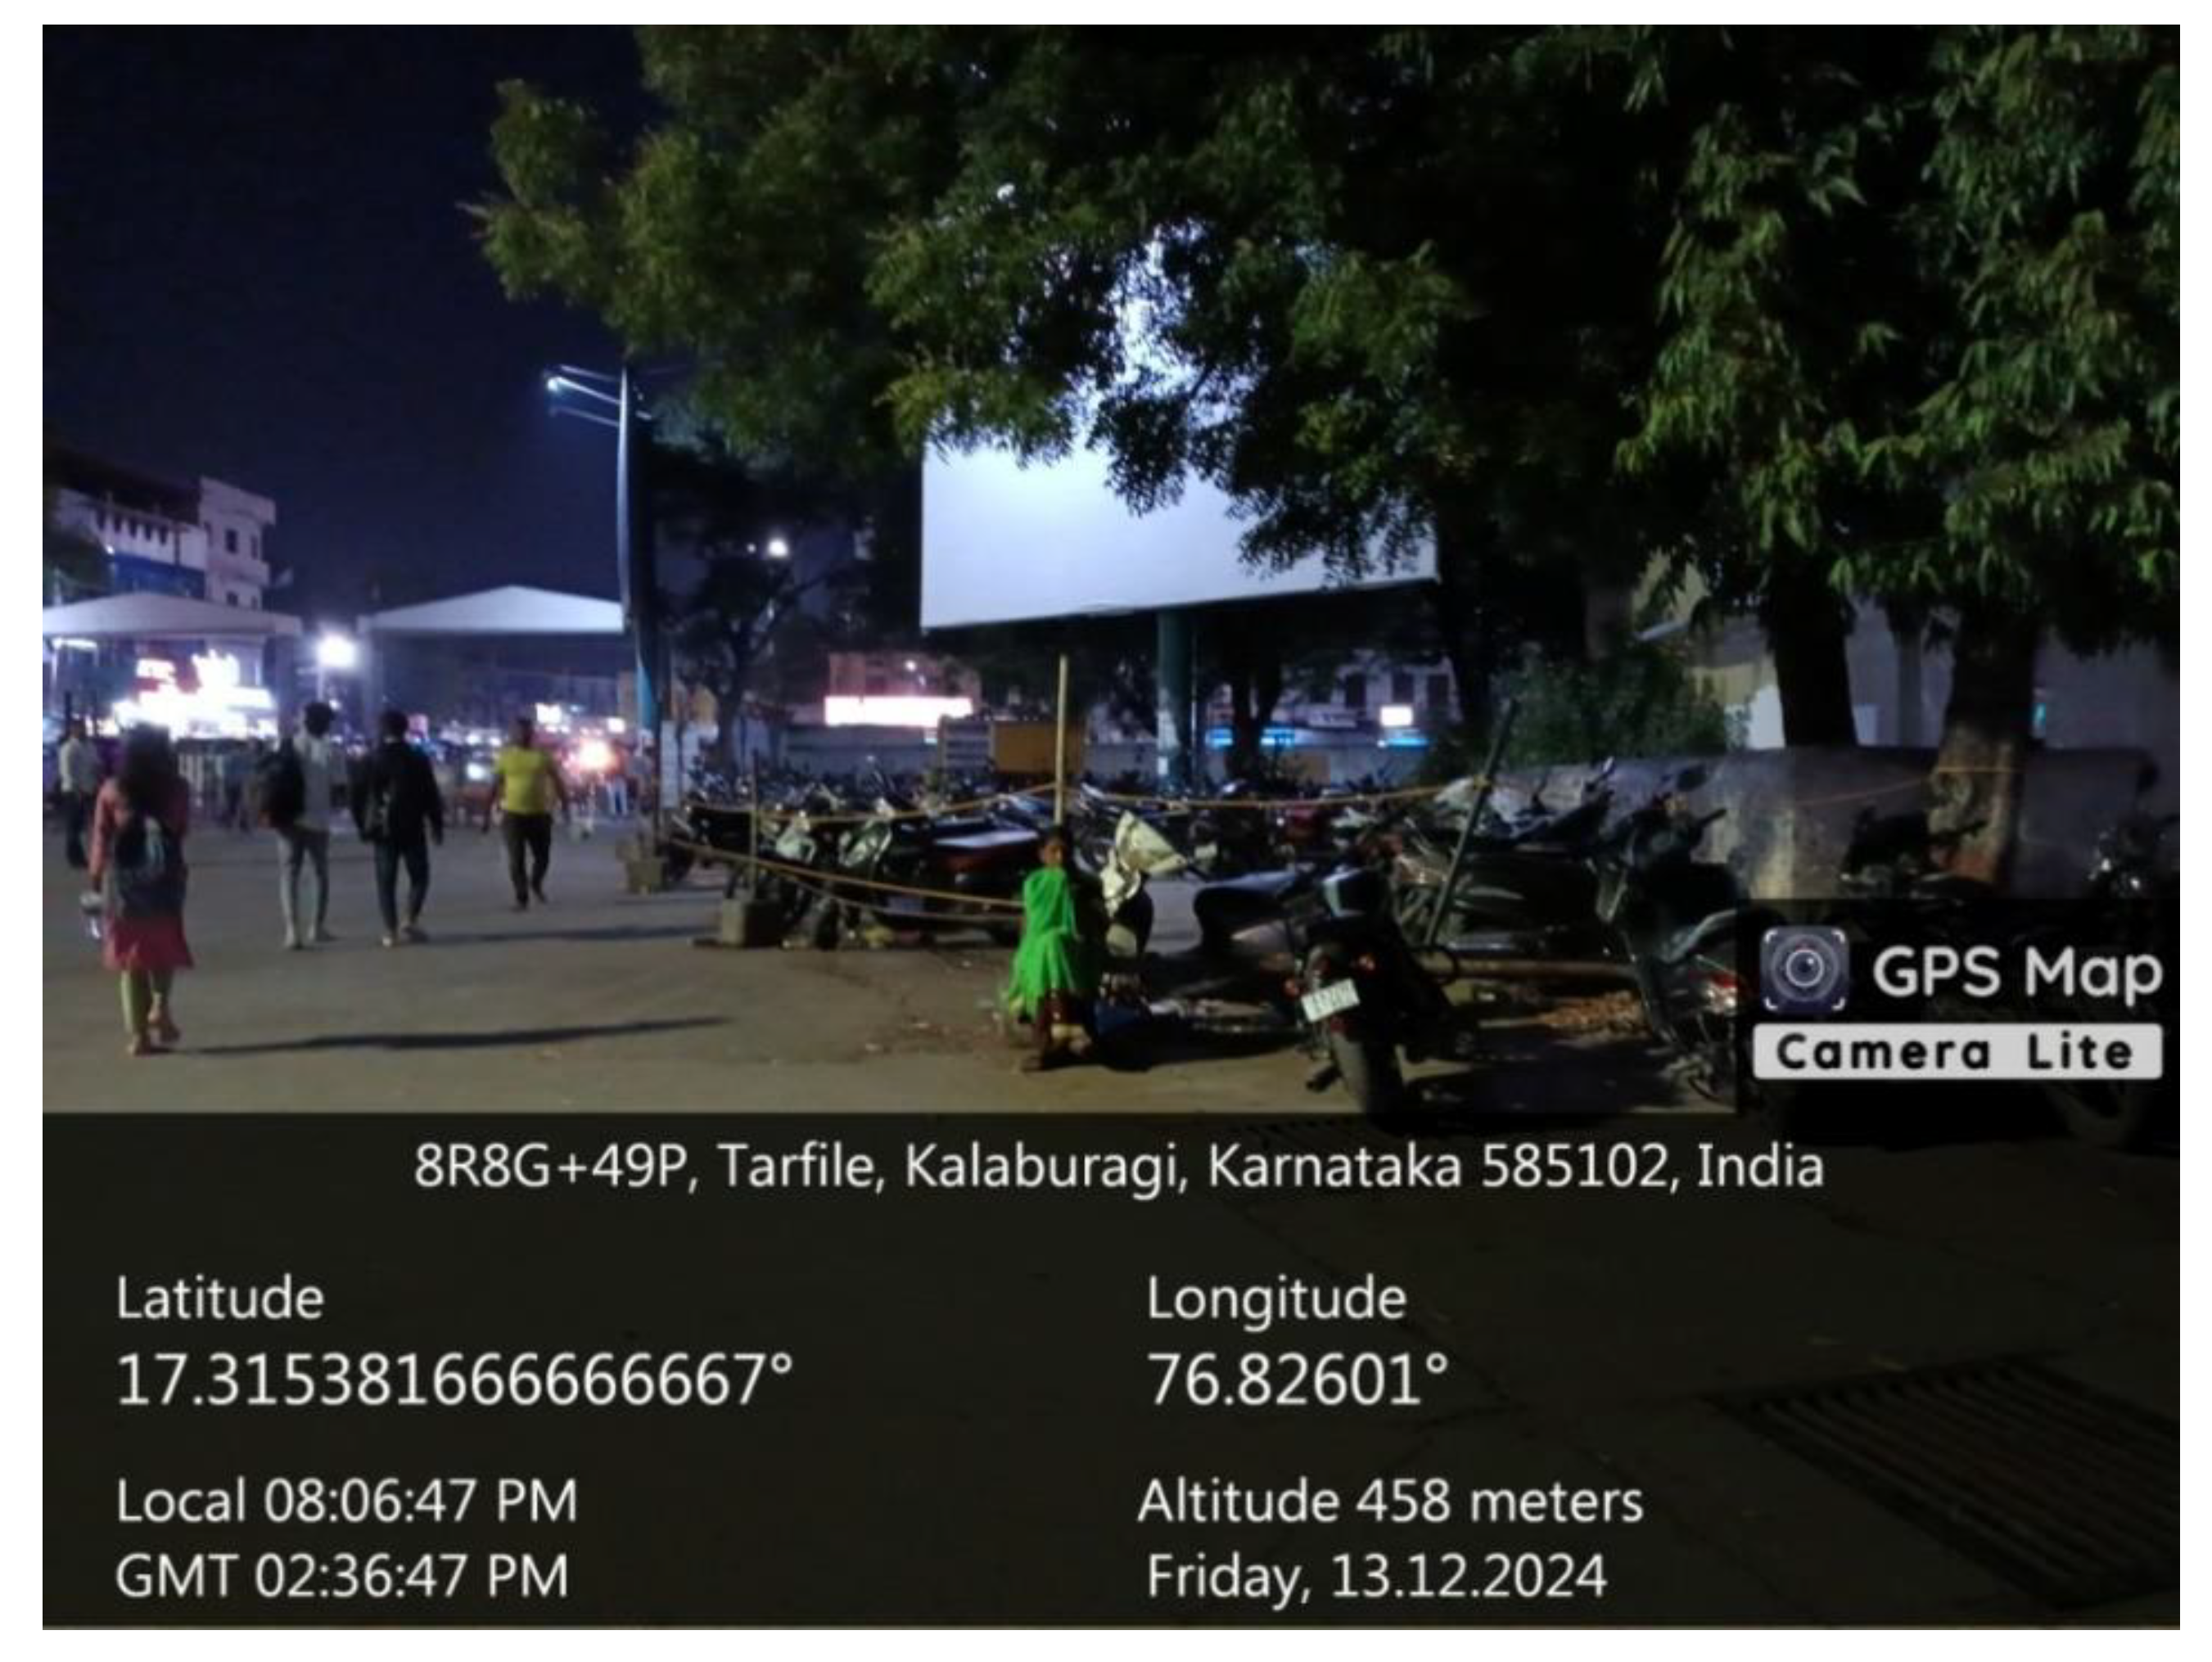
Figure 14.
Figure 14. .
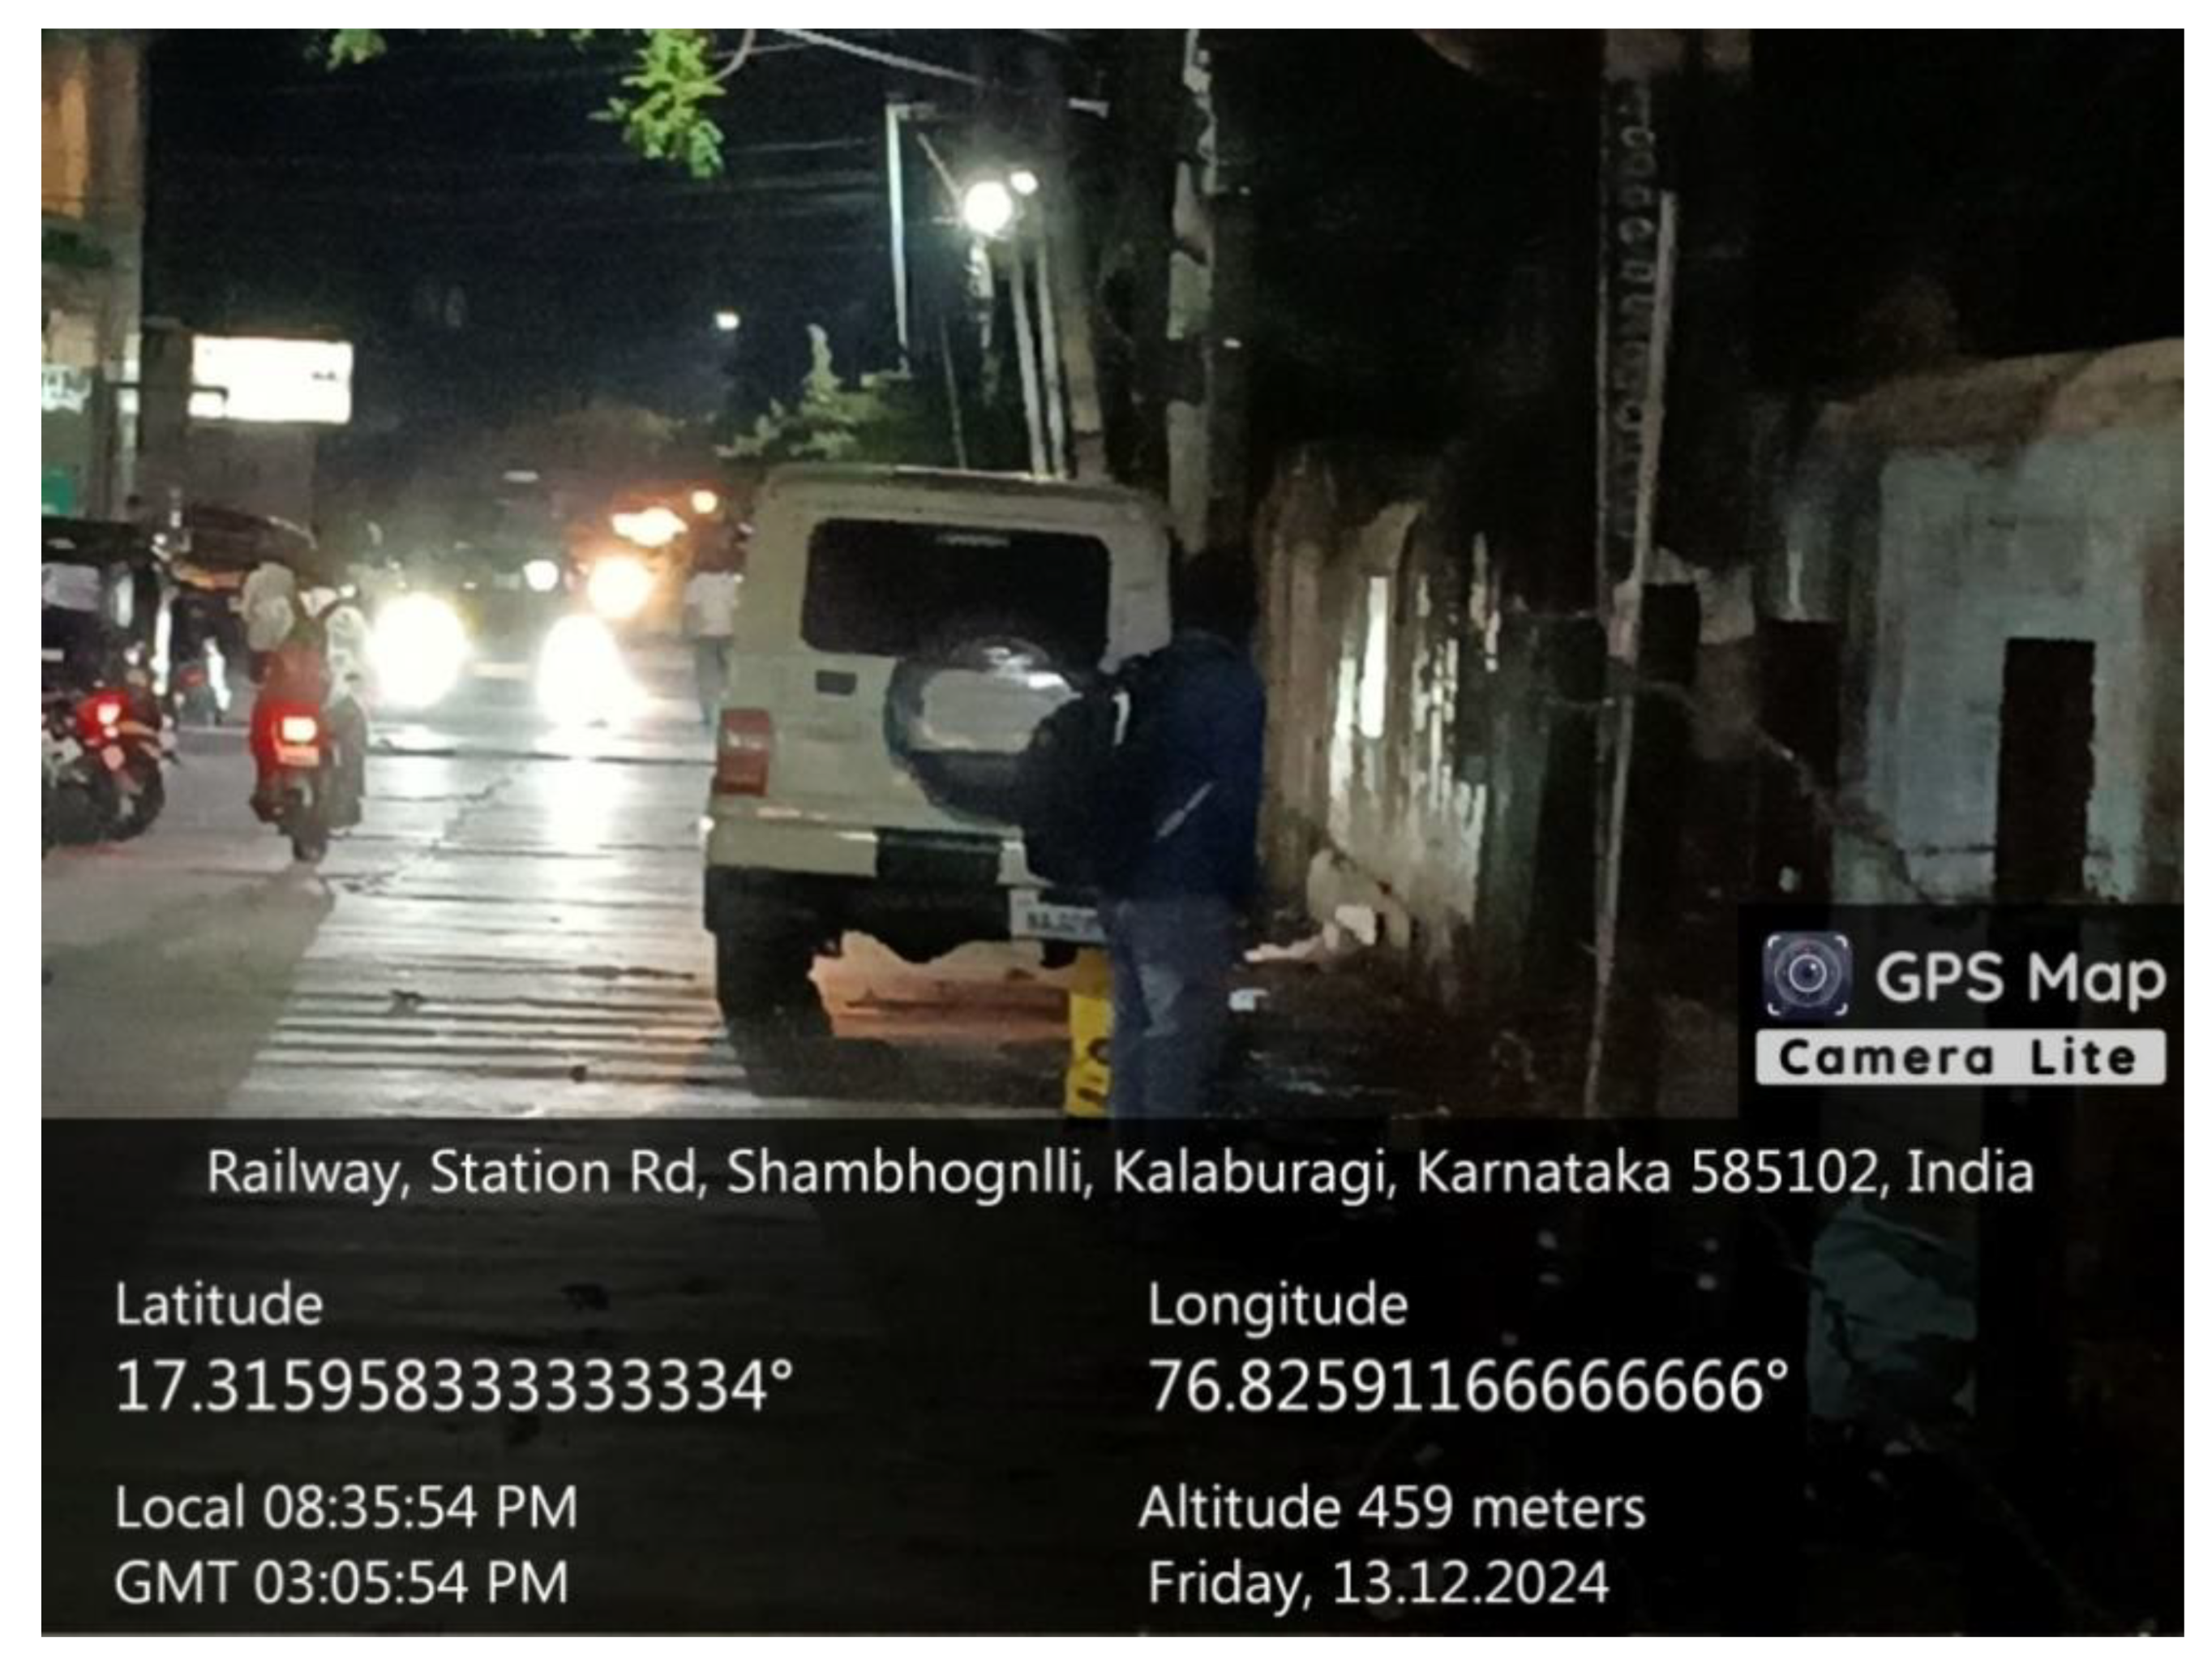
Figure 15.
Figure15. .
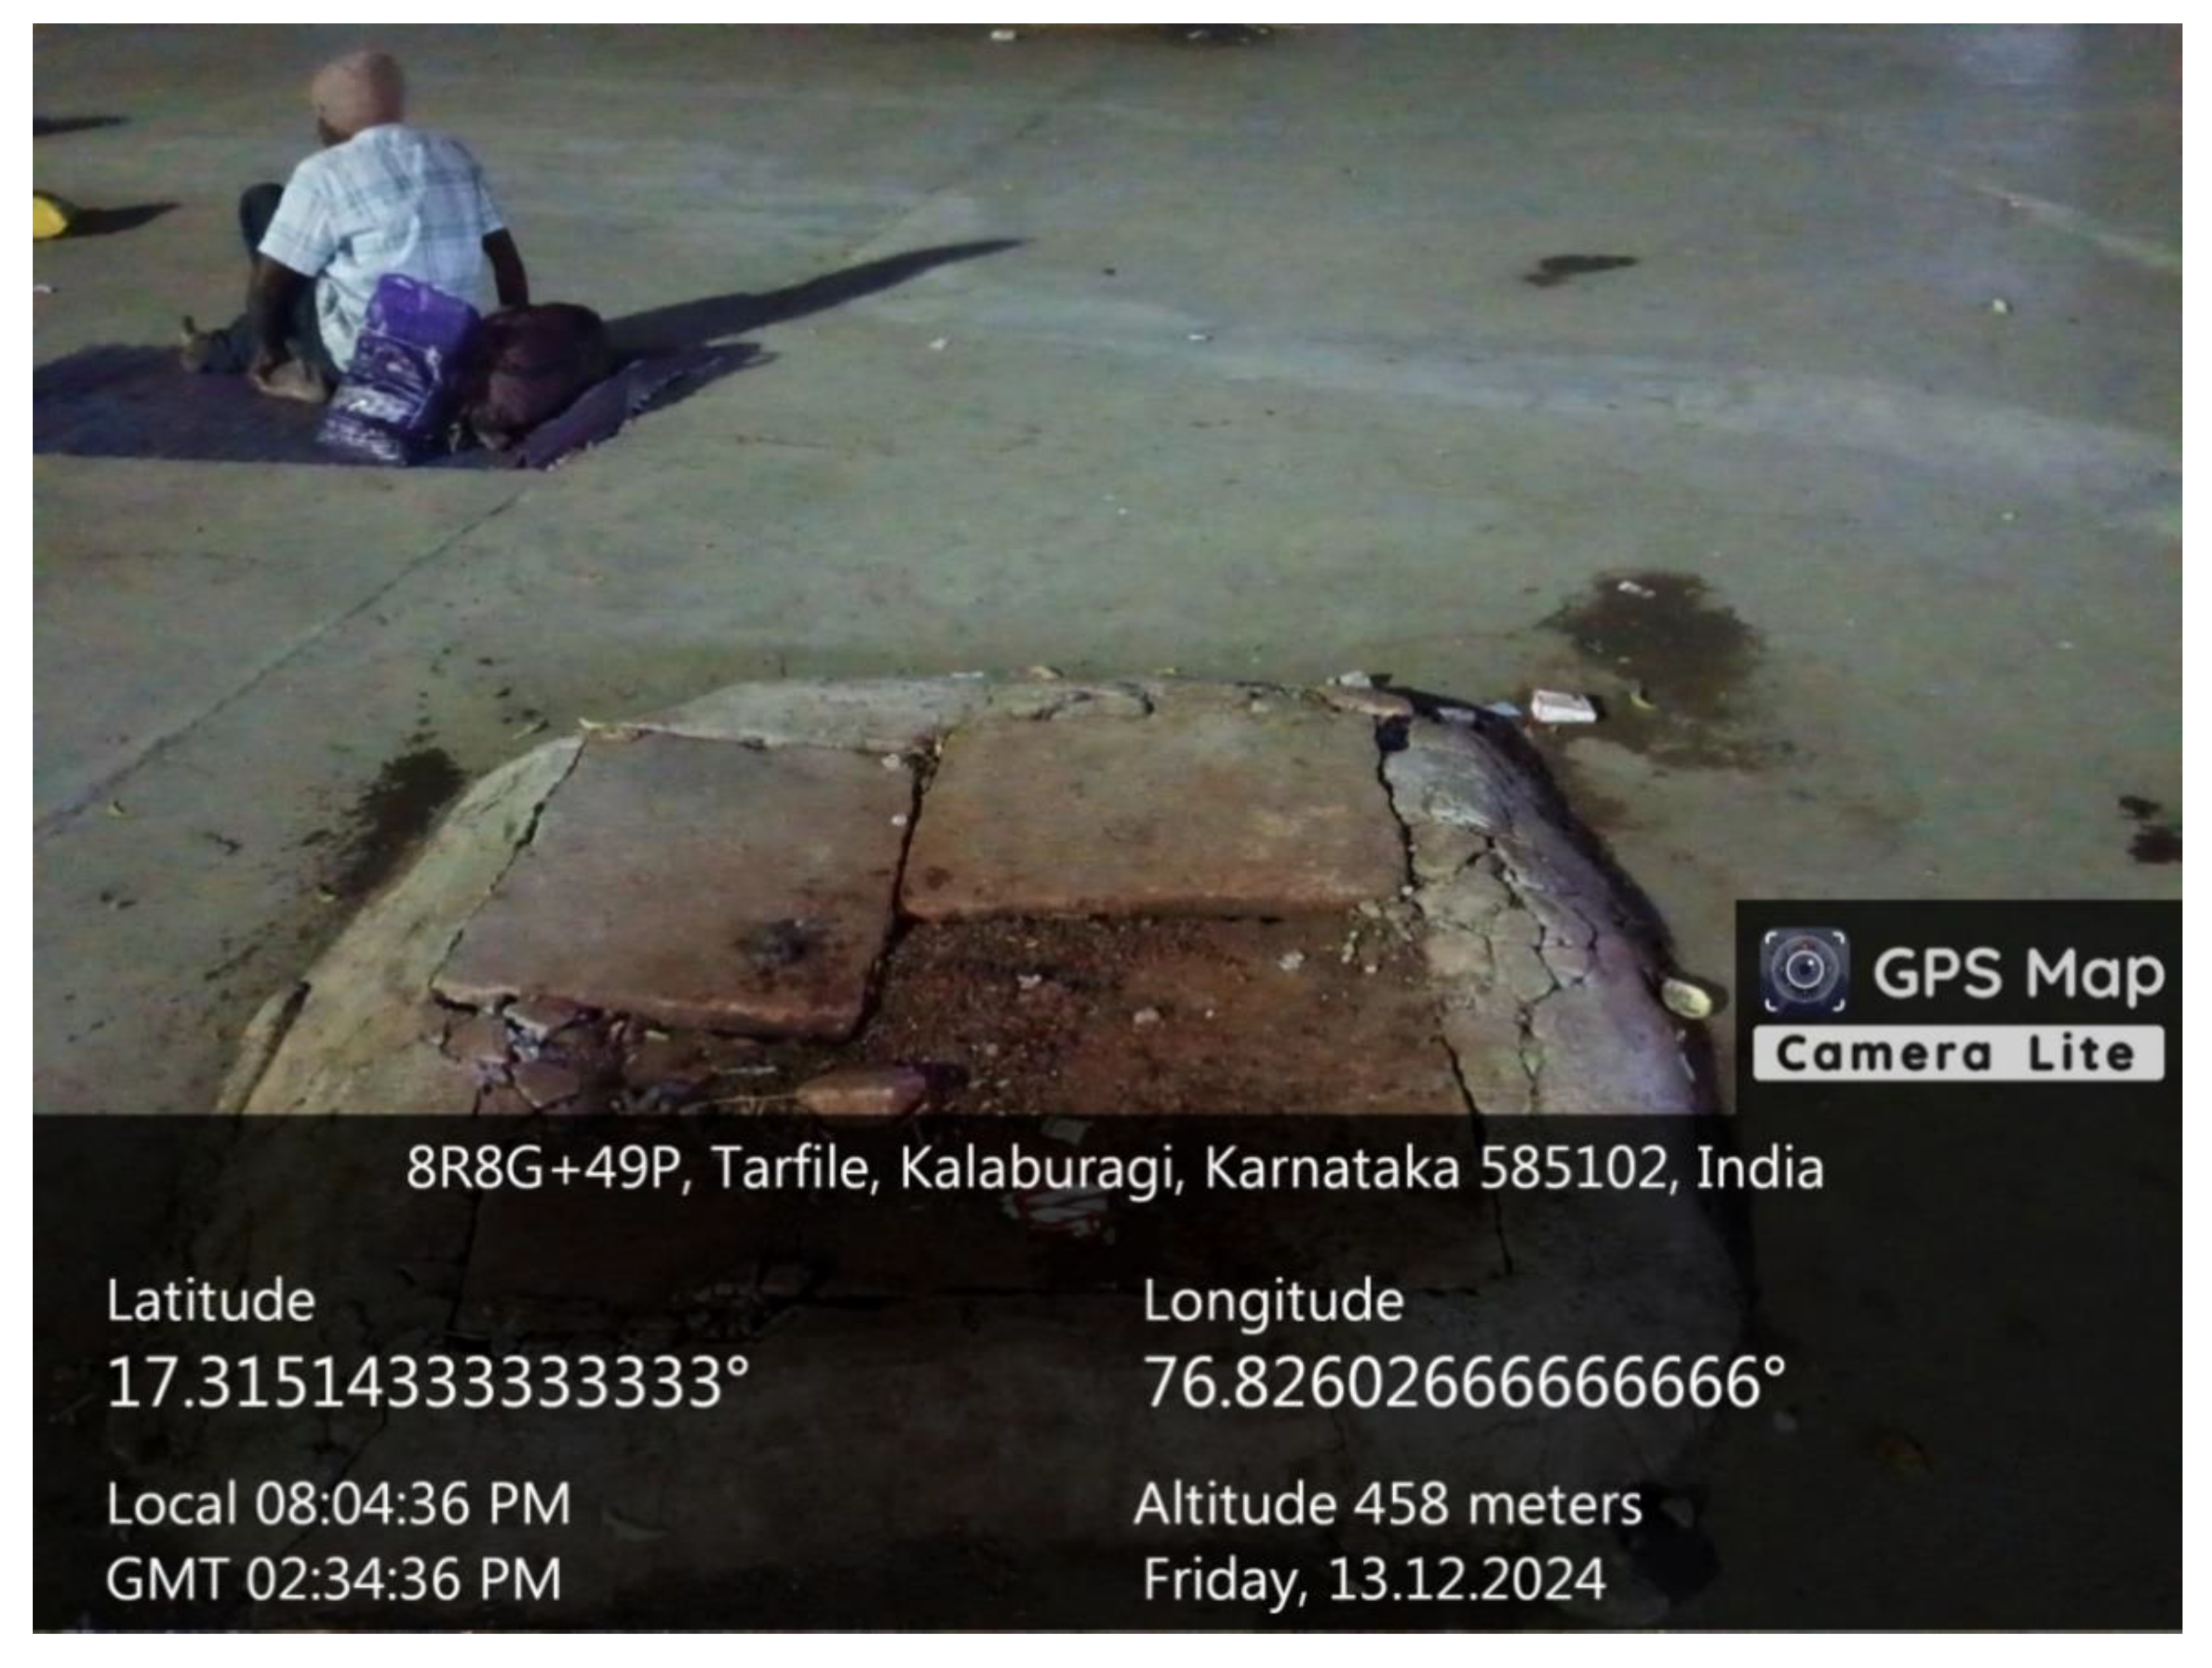
Figure 16.
Figure16. .
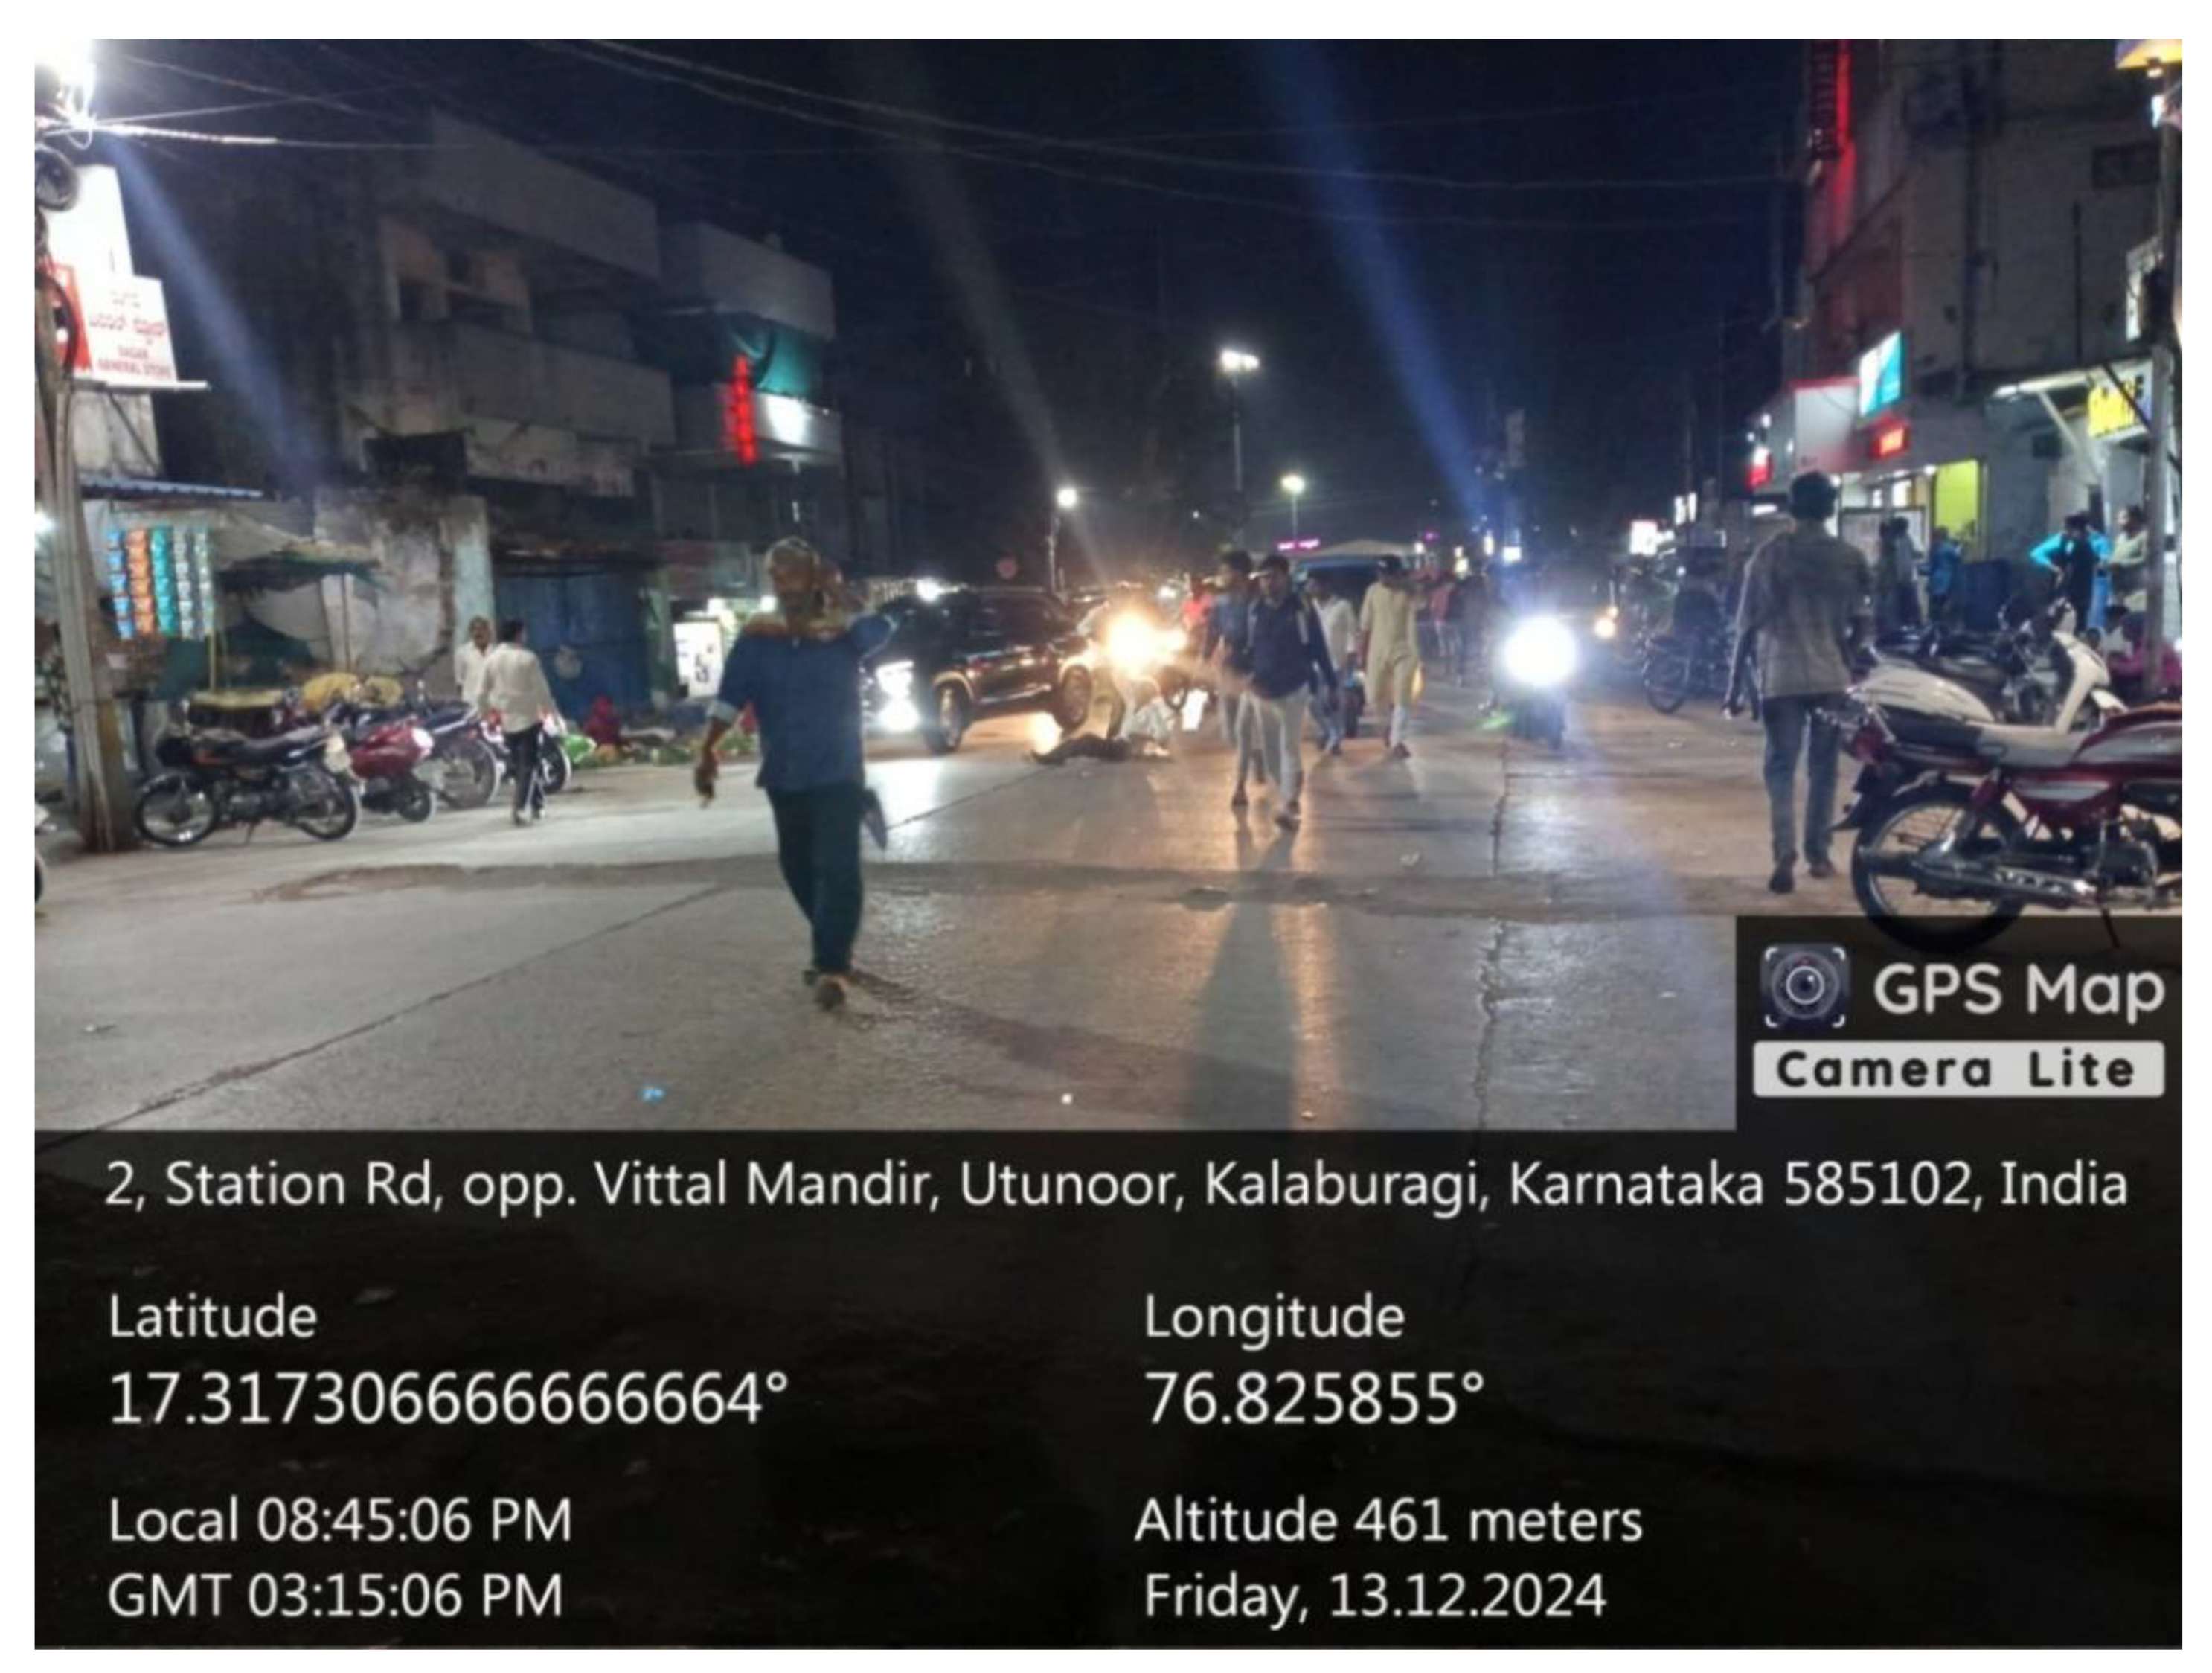
Figure 17.
Figure17. .
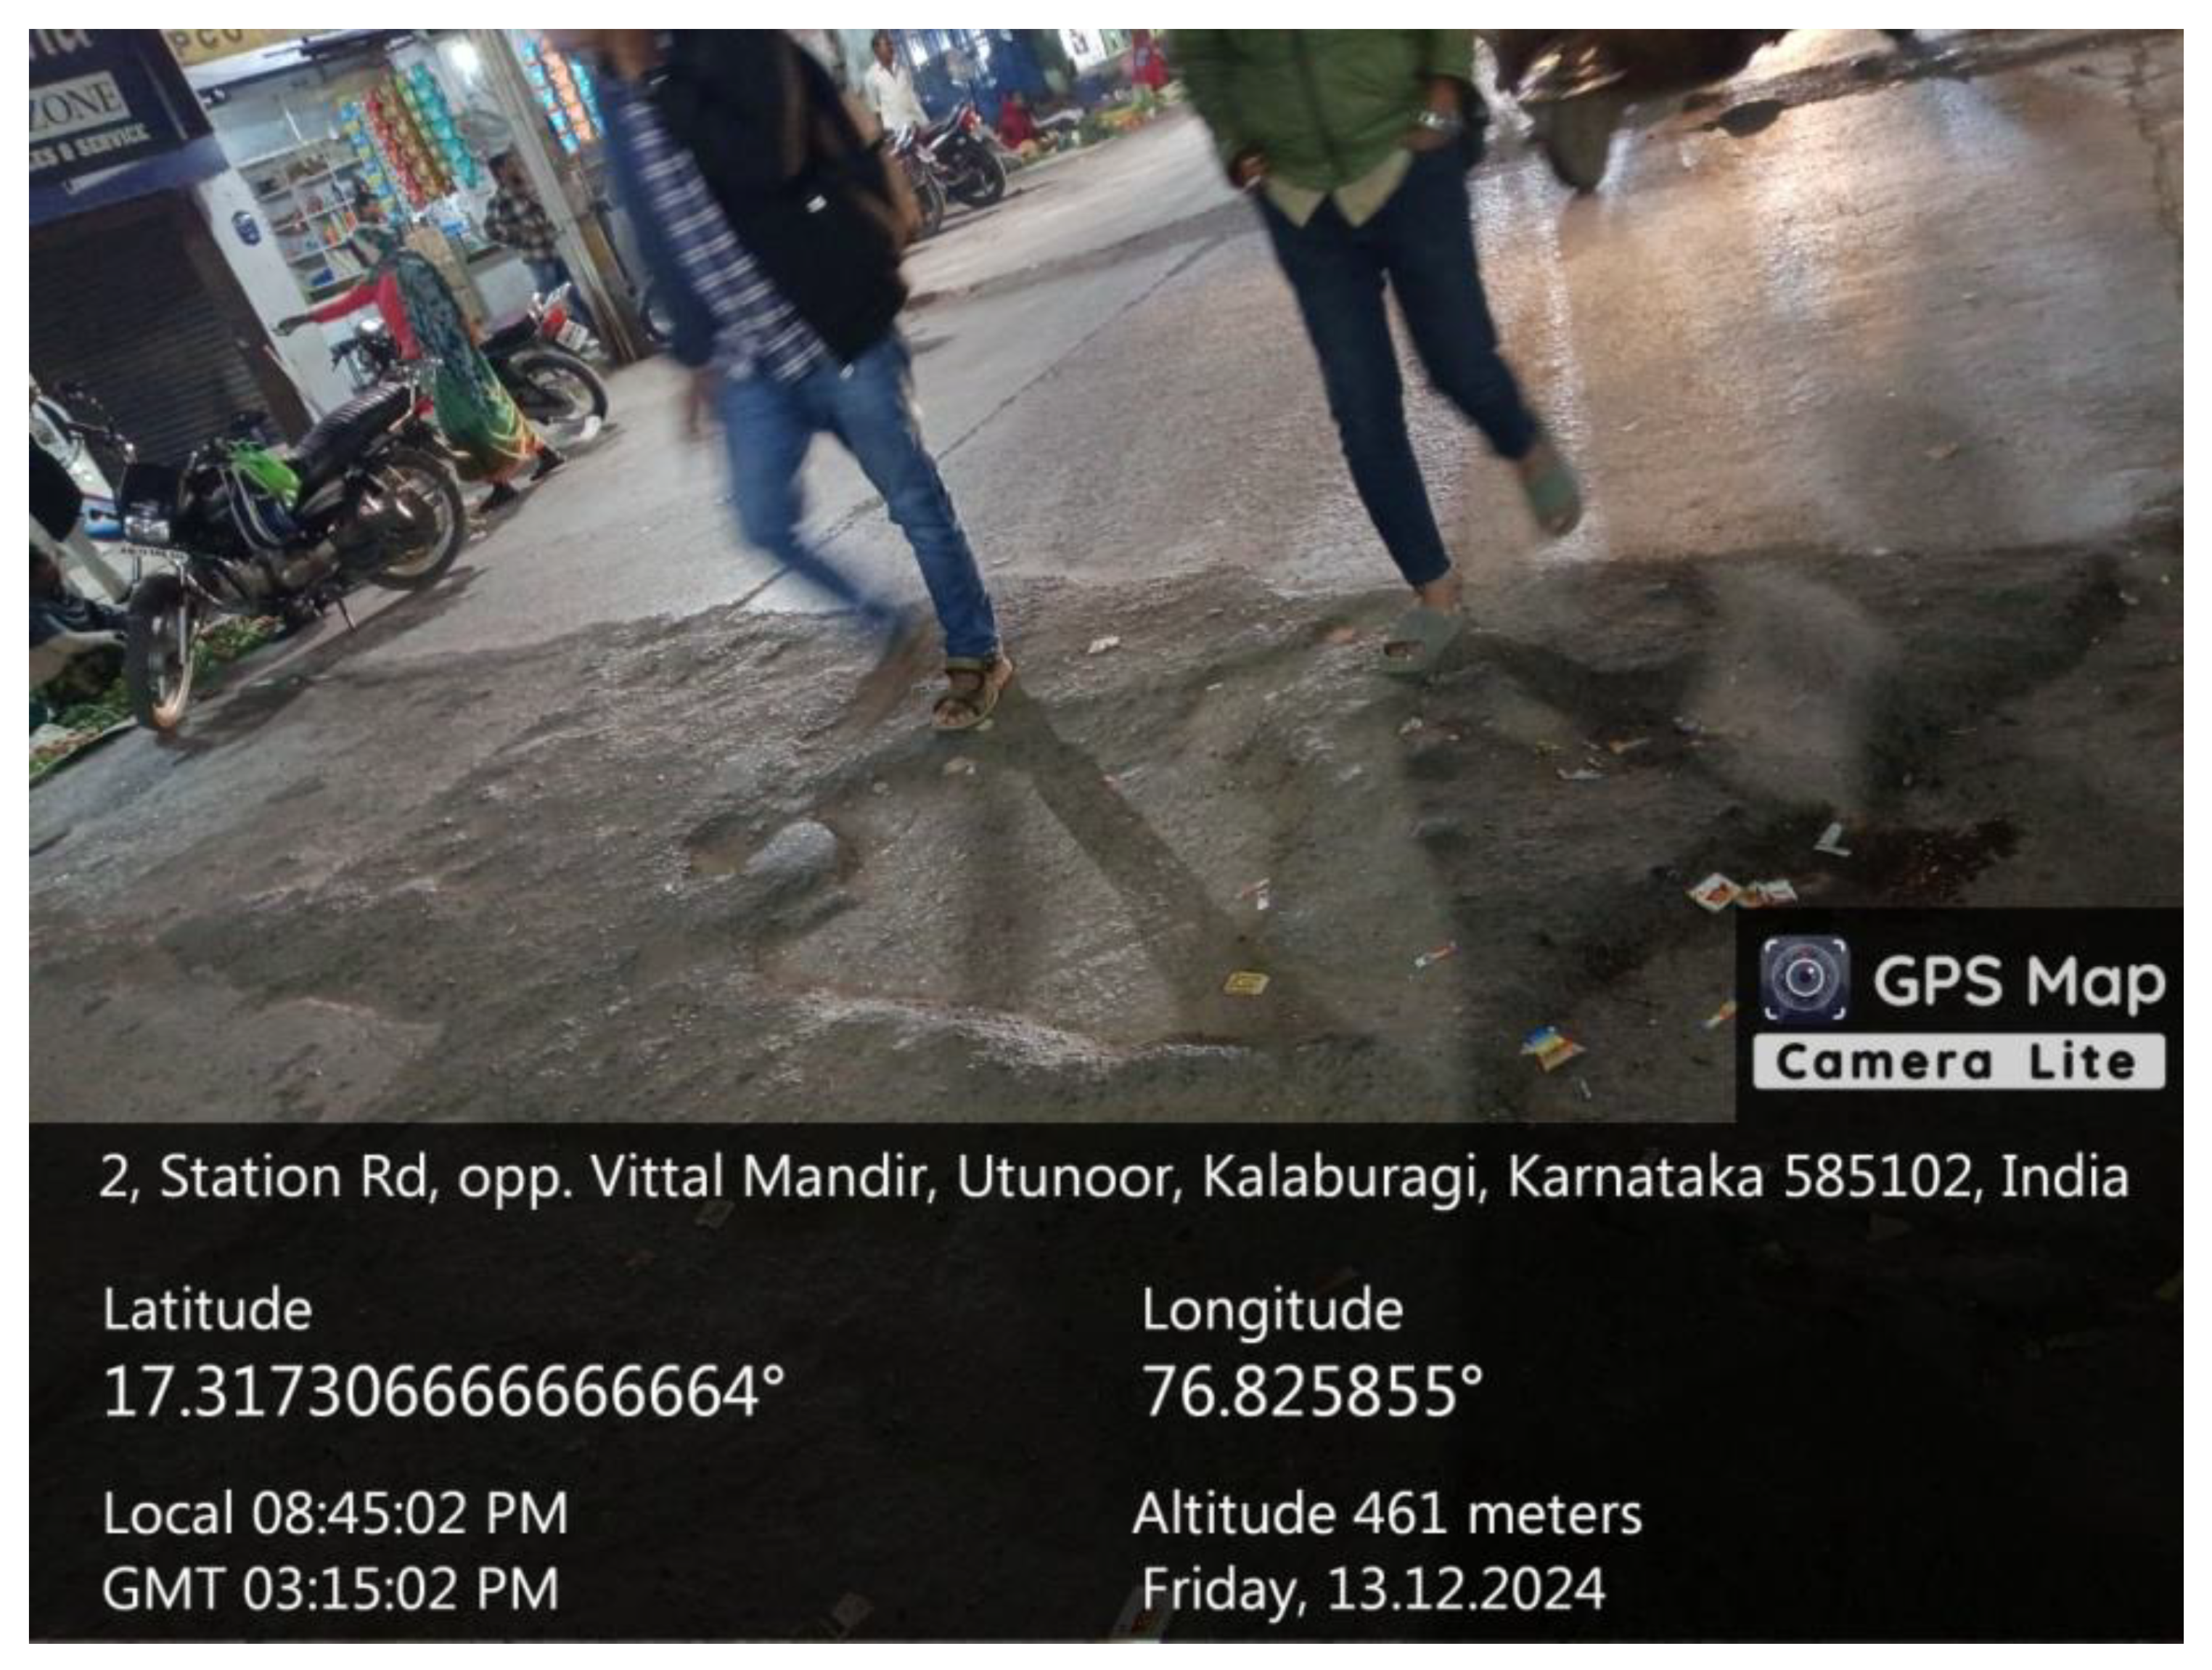
Figure 18.
Figure18. .
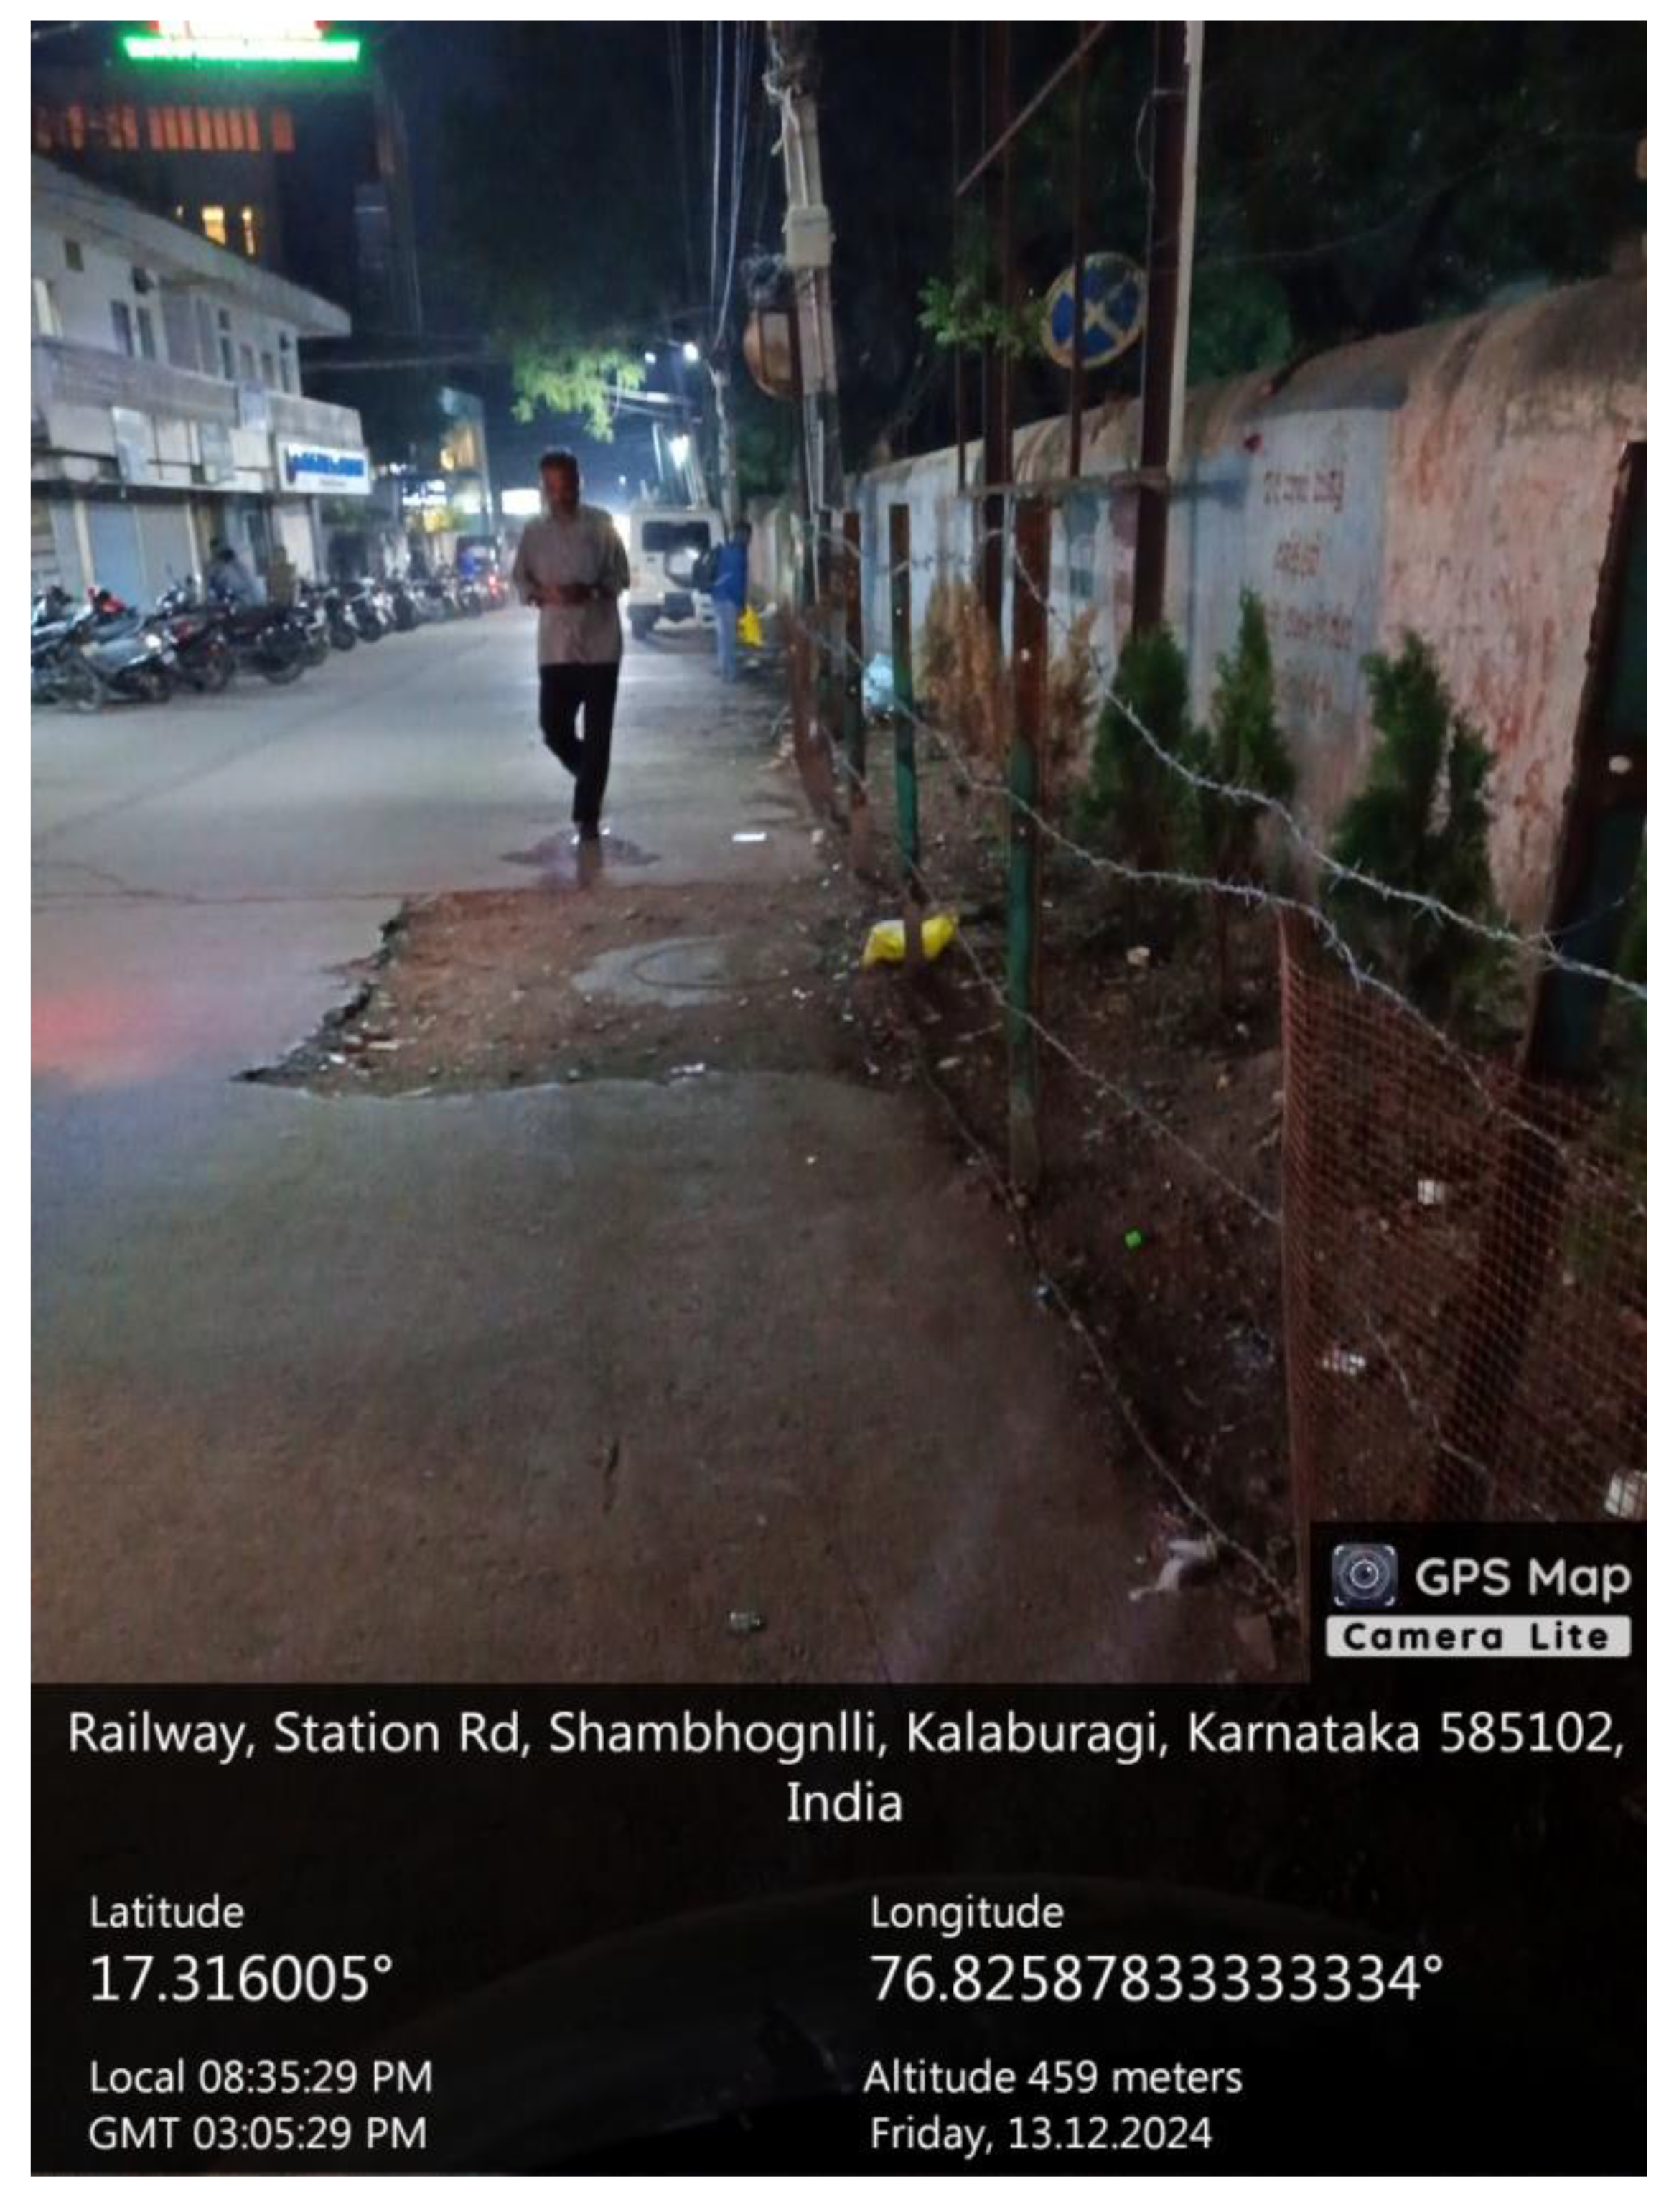
Figure 19.
Figure19. .
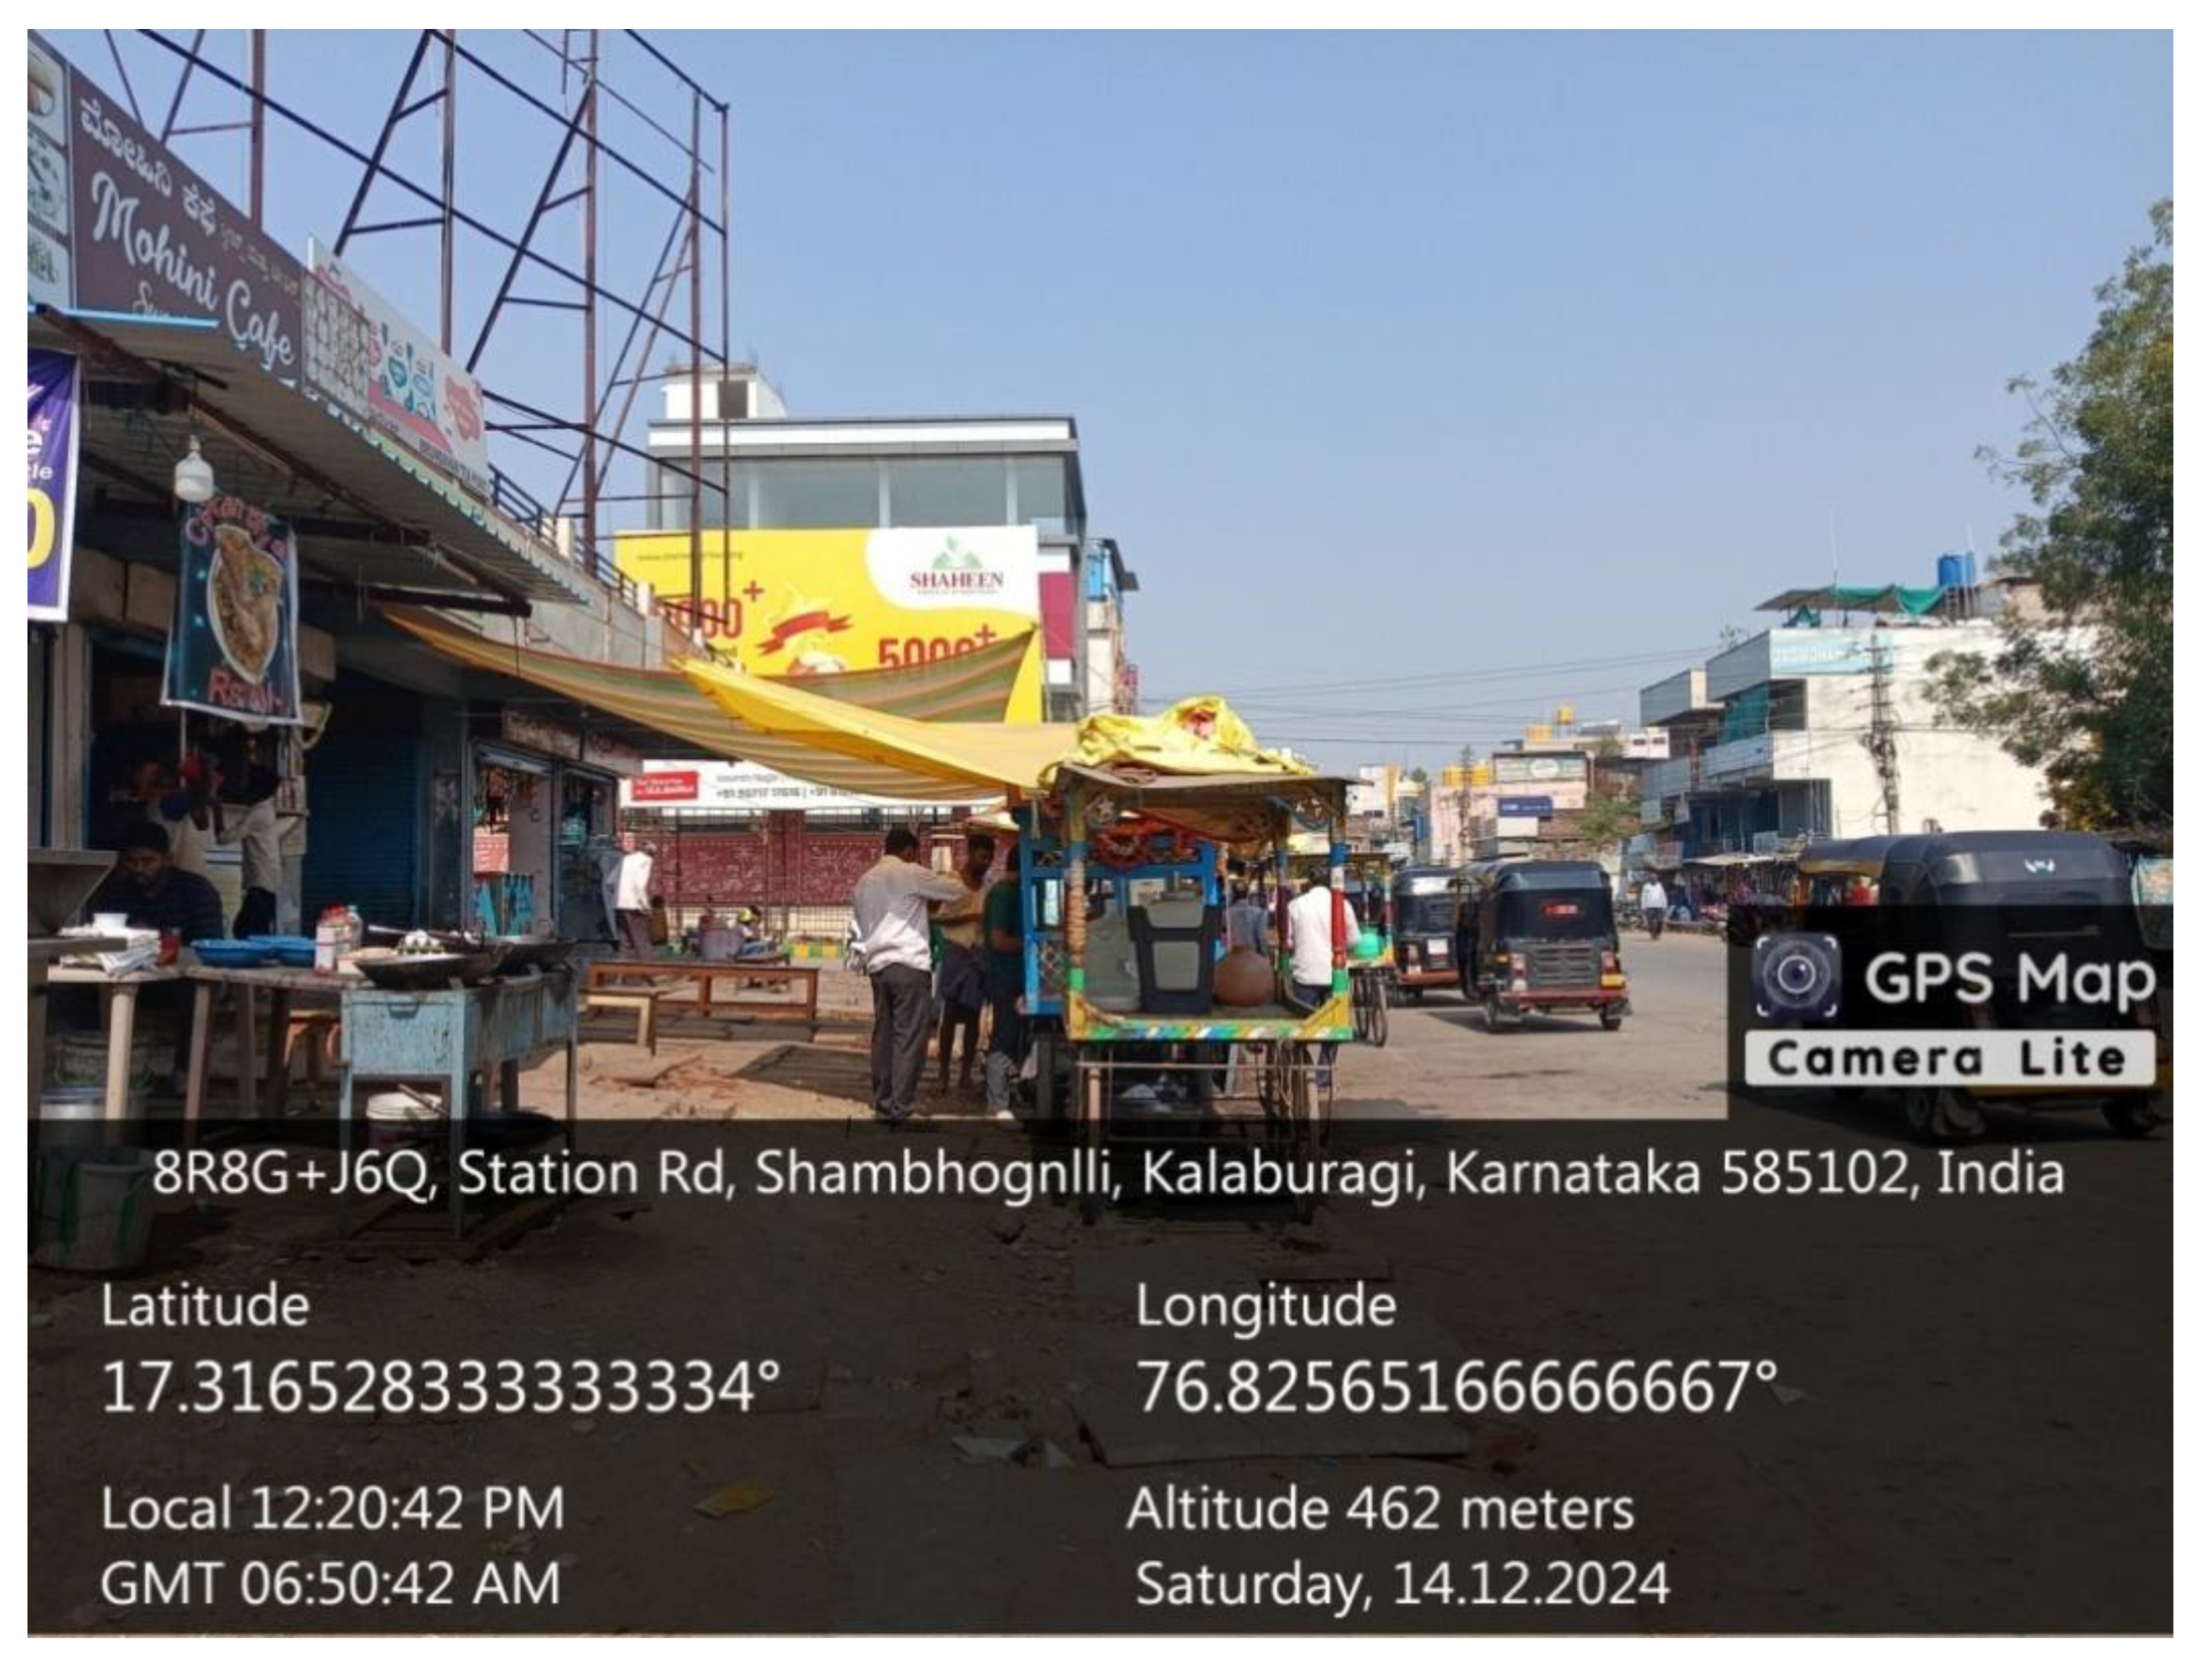
Figure 20.
Figure20. .
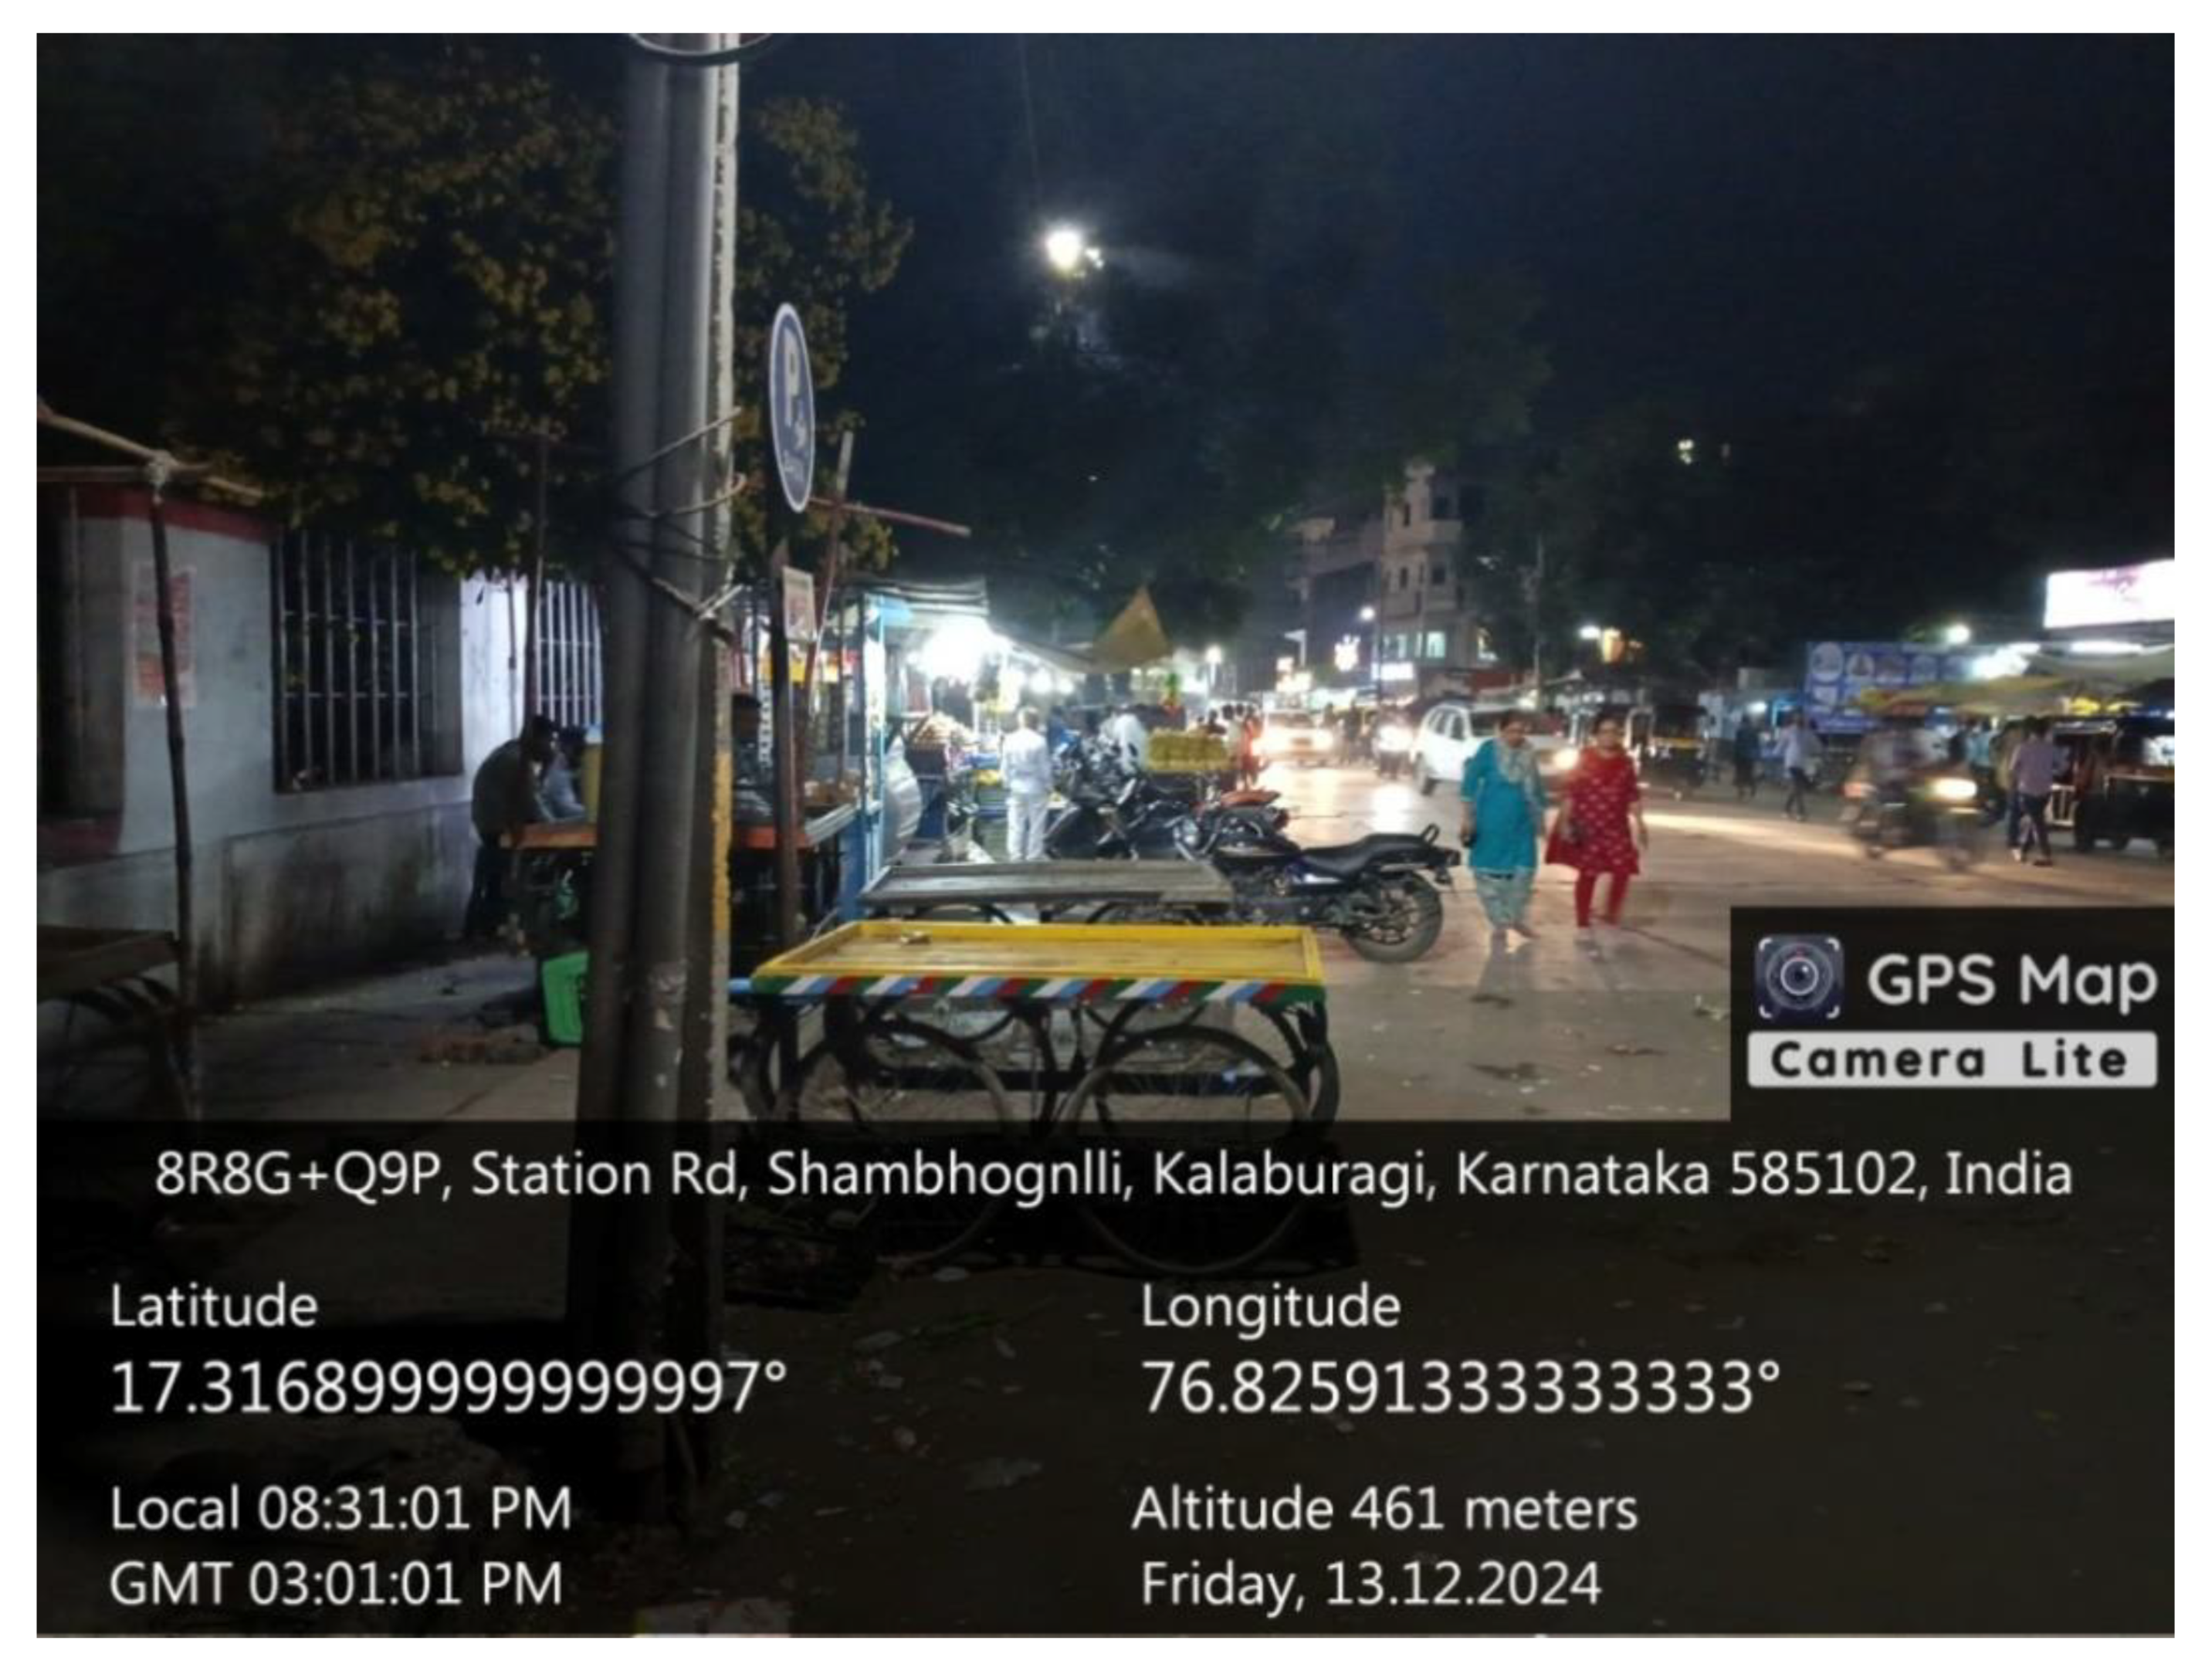
Figure 21.
Figure21. .
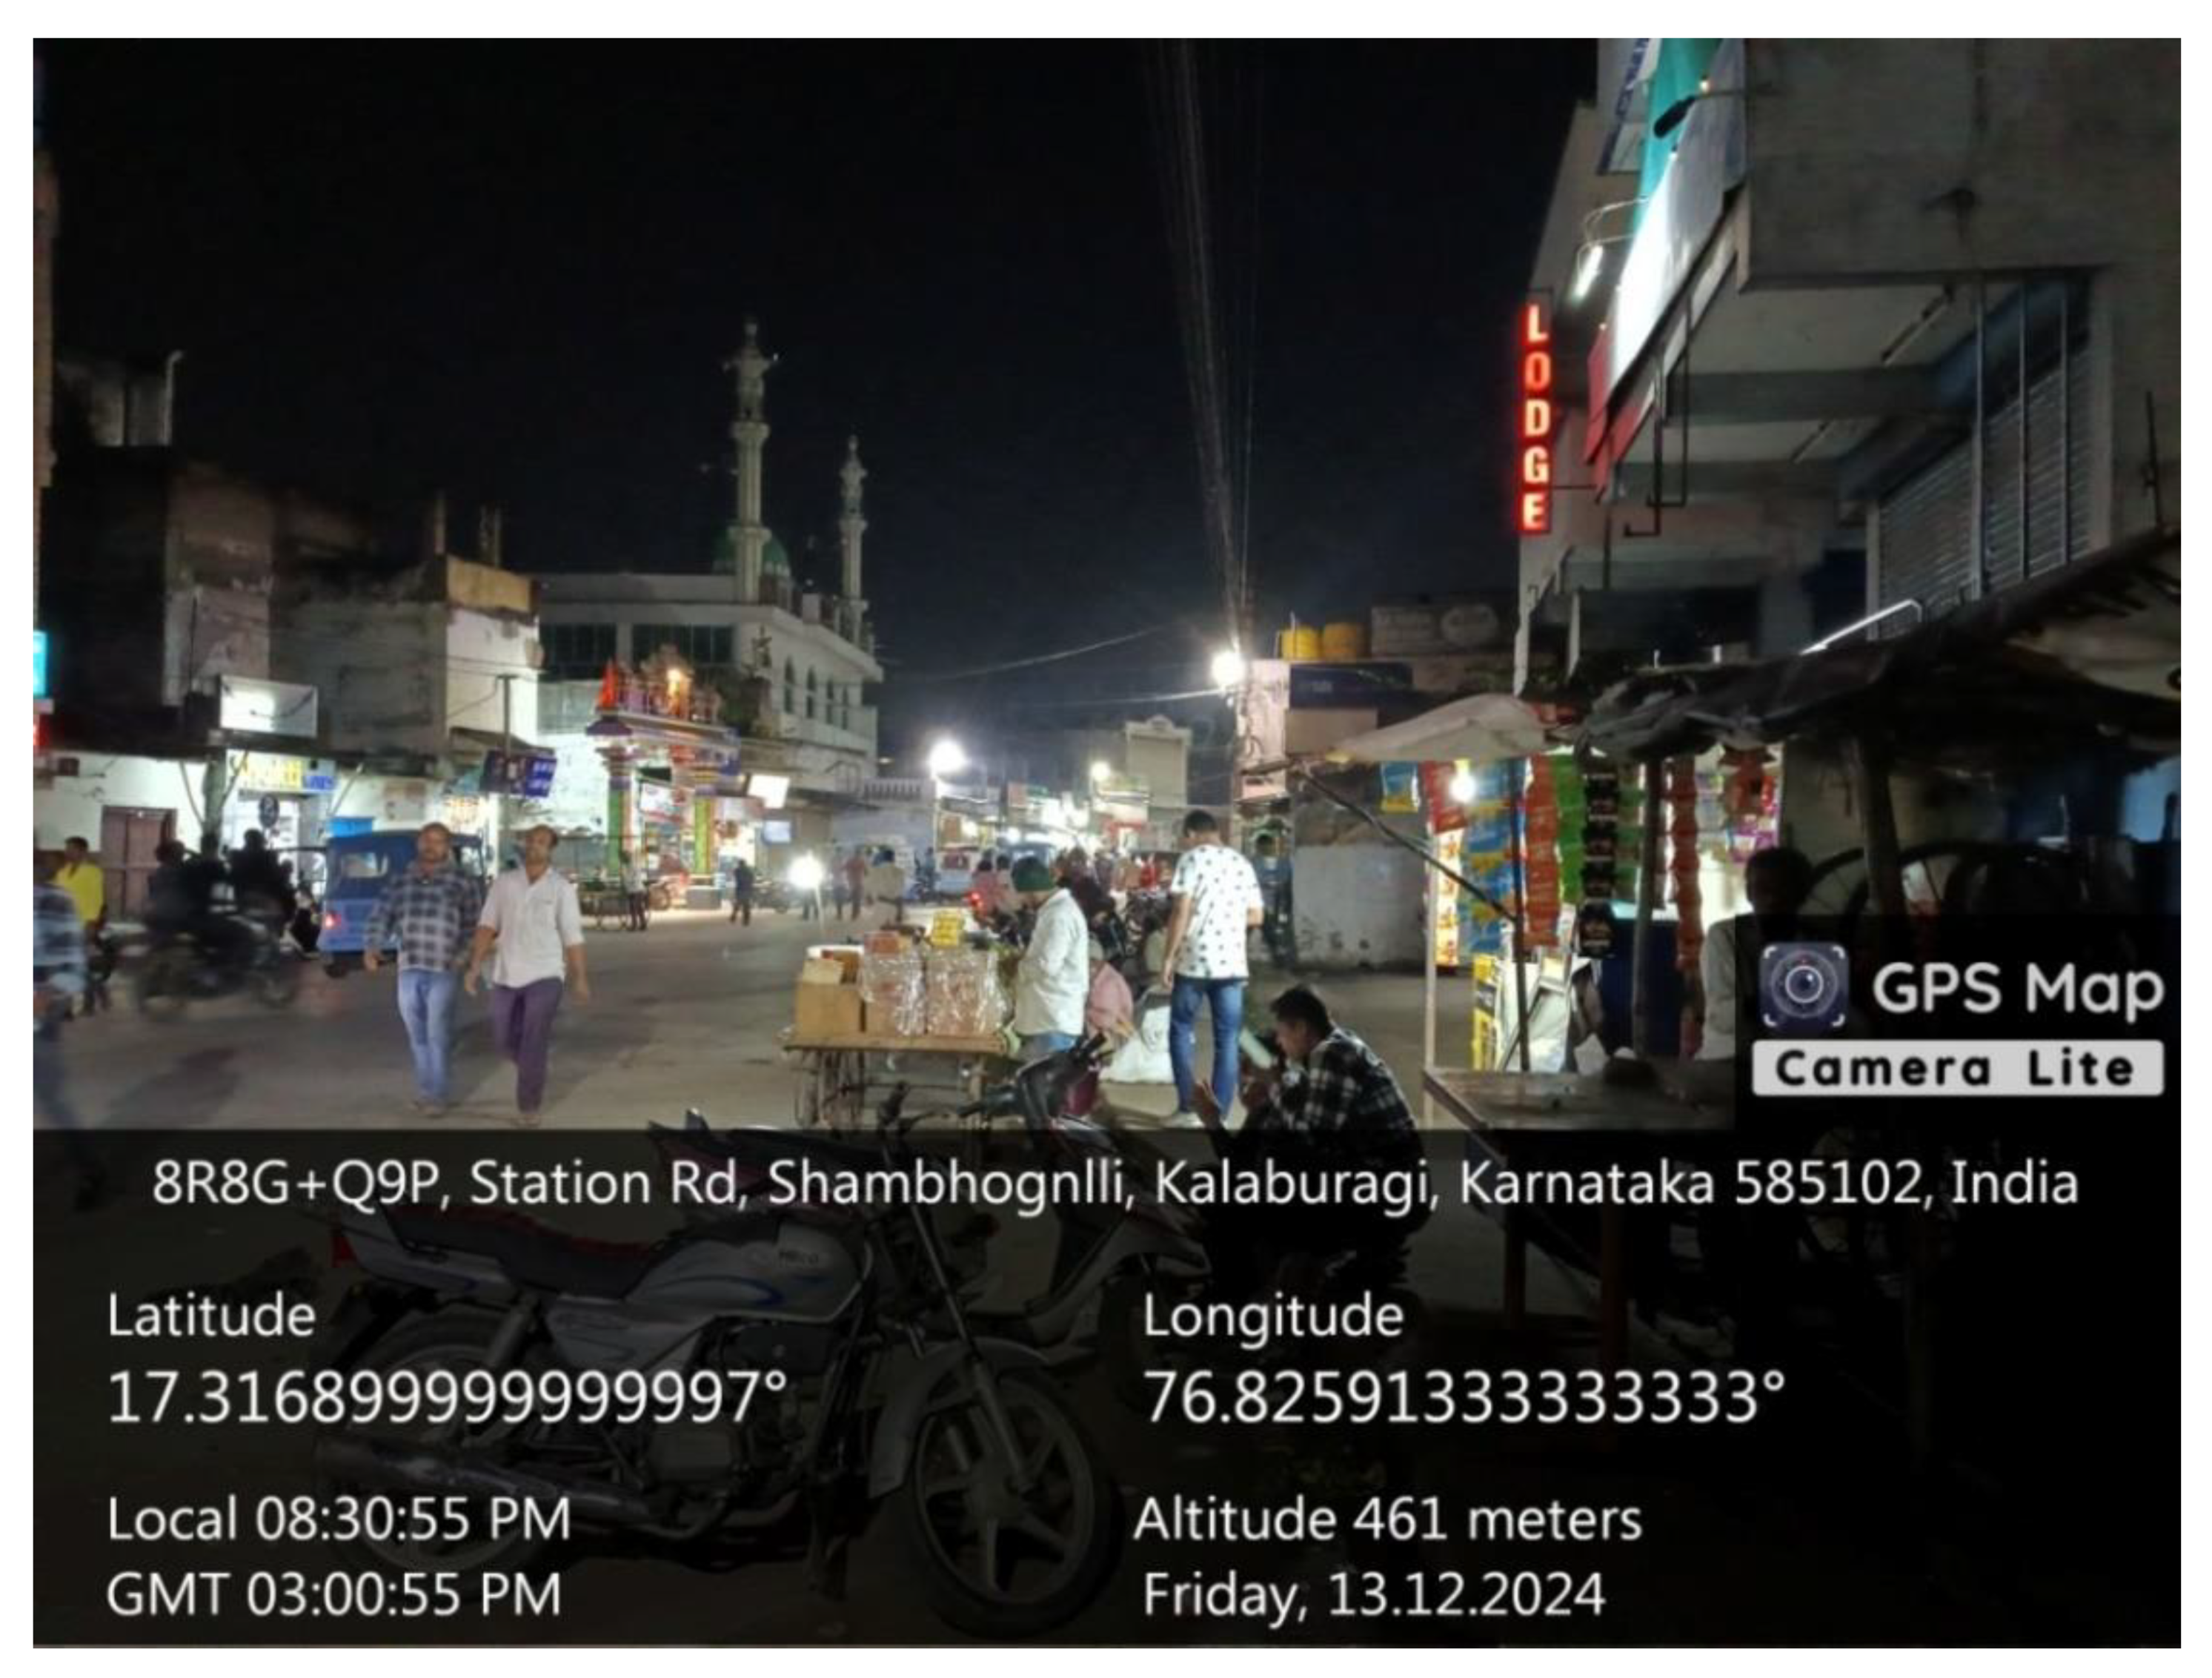
Figure 22.
Figure22. .
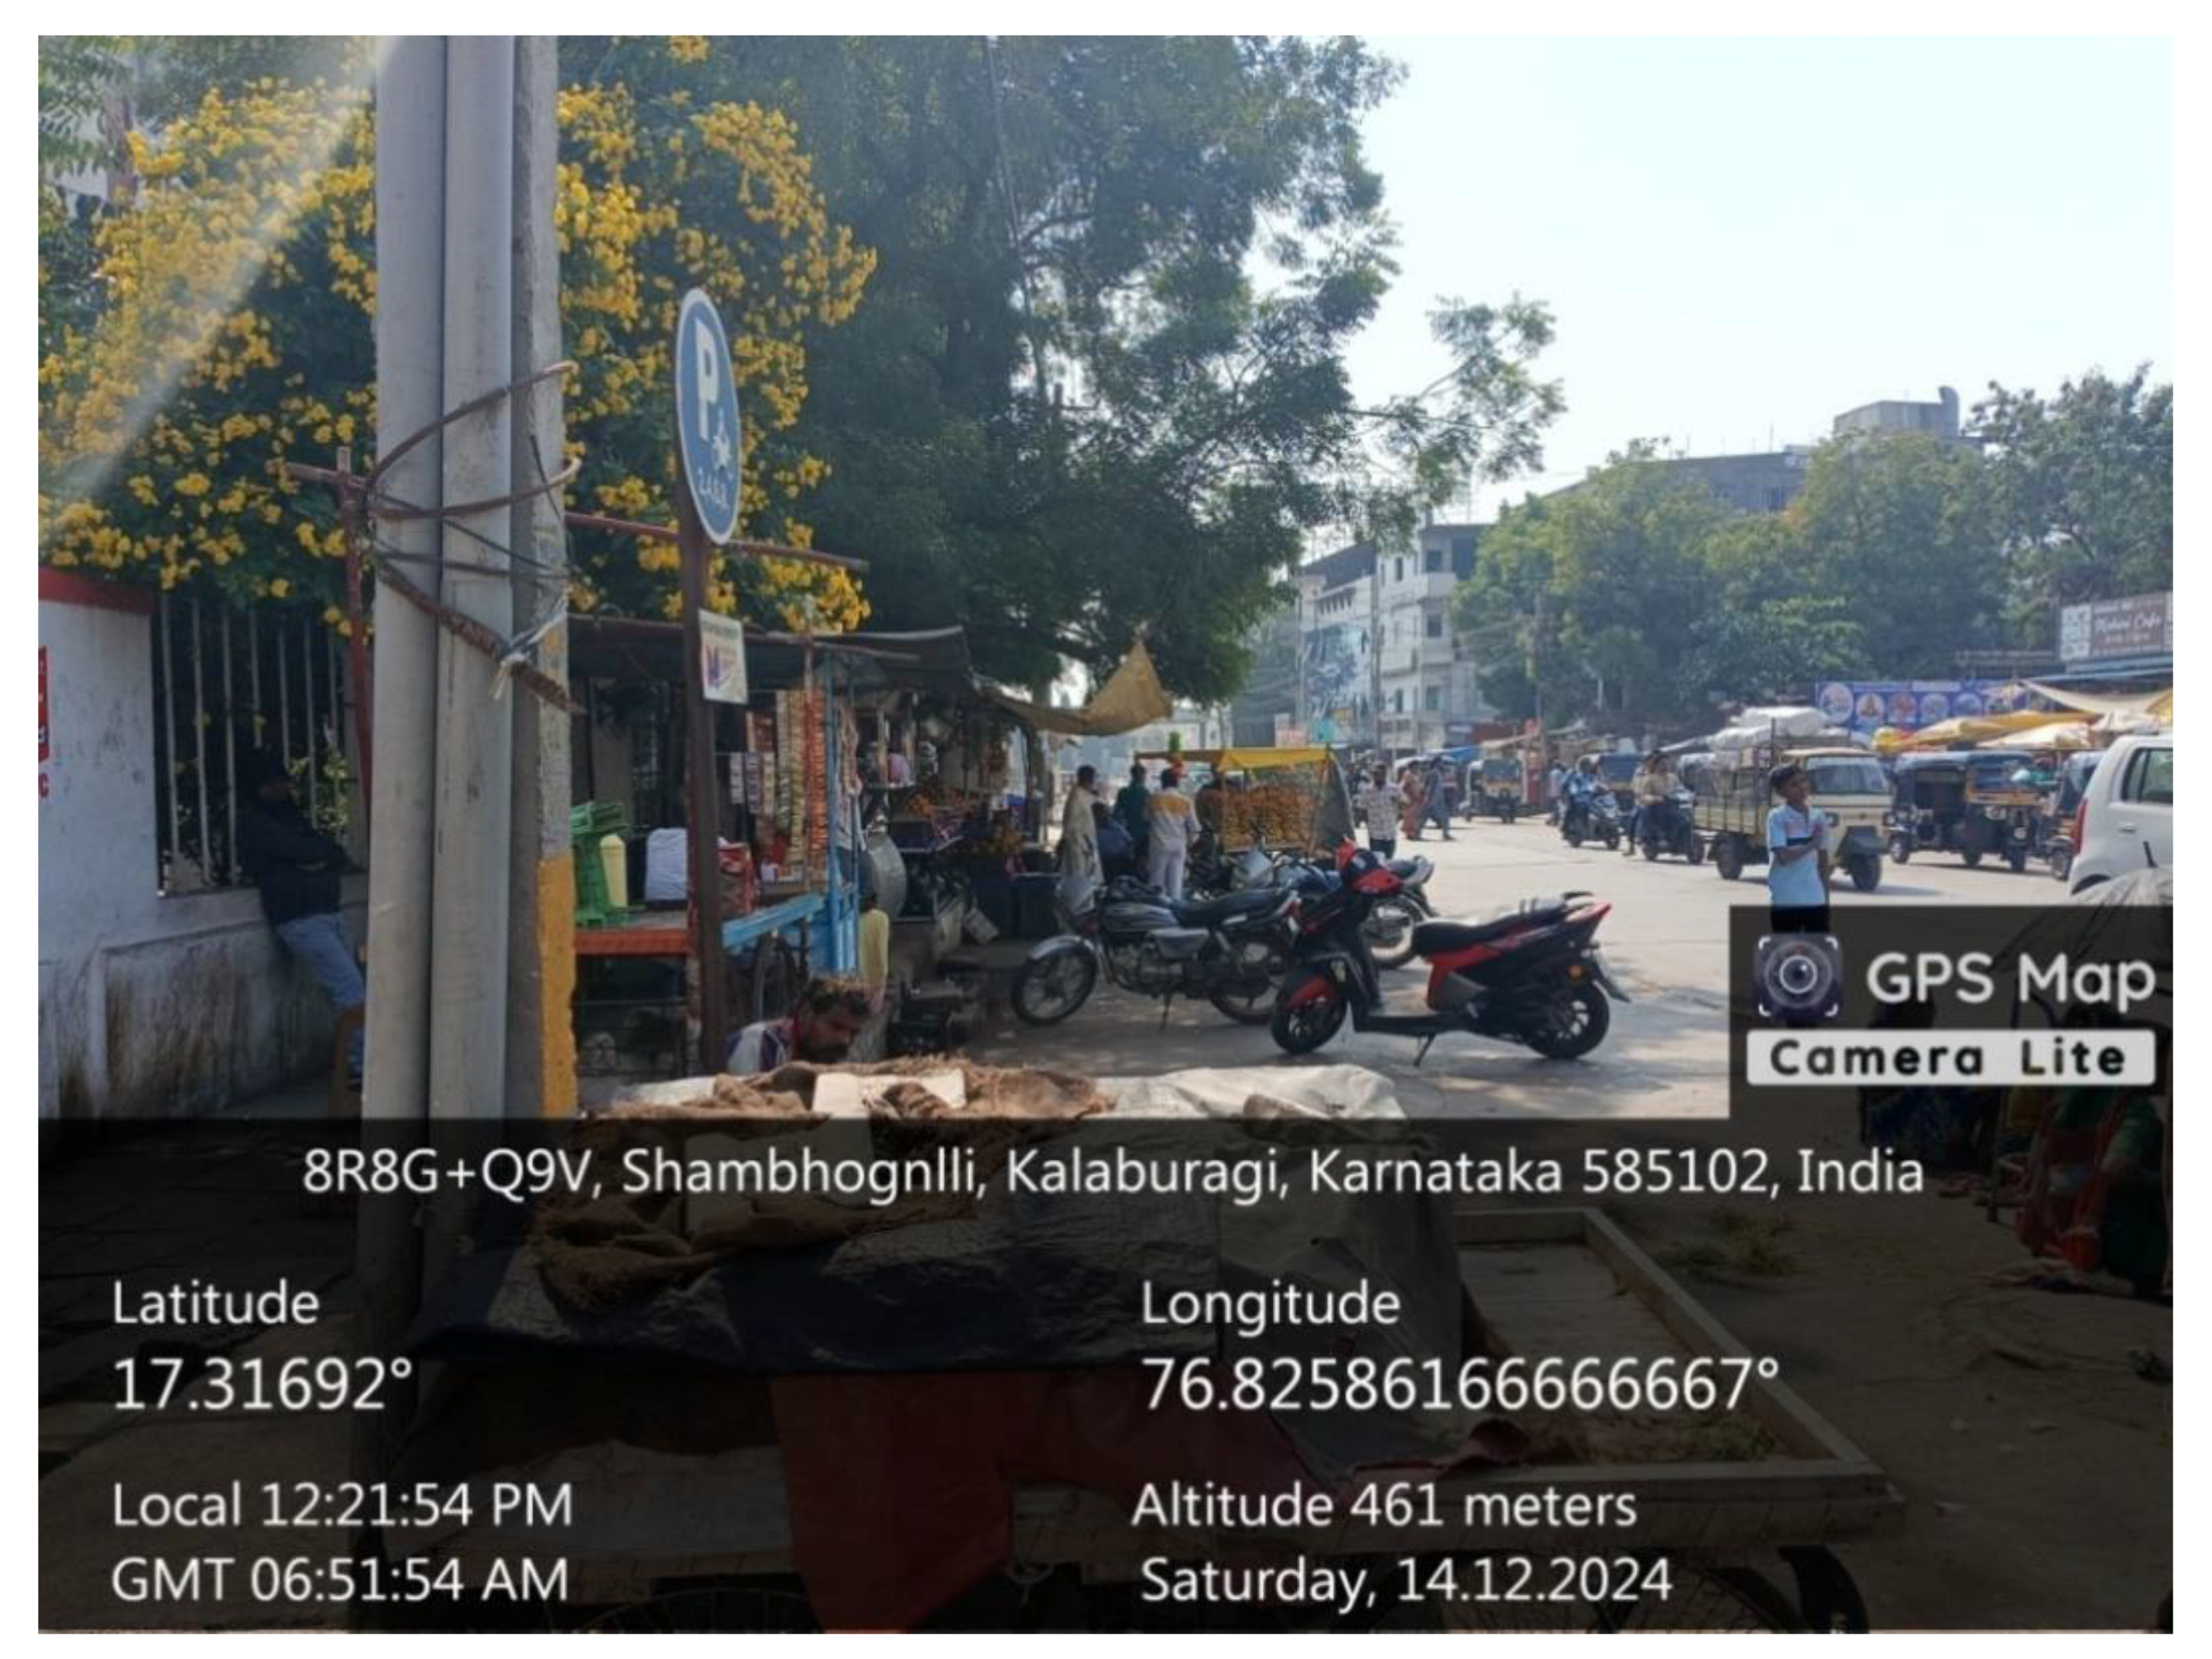
Figure 23.
Figure23. .
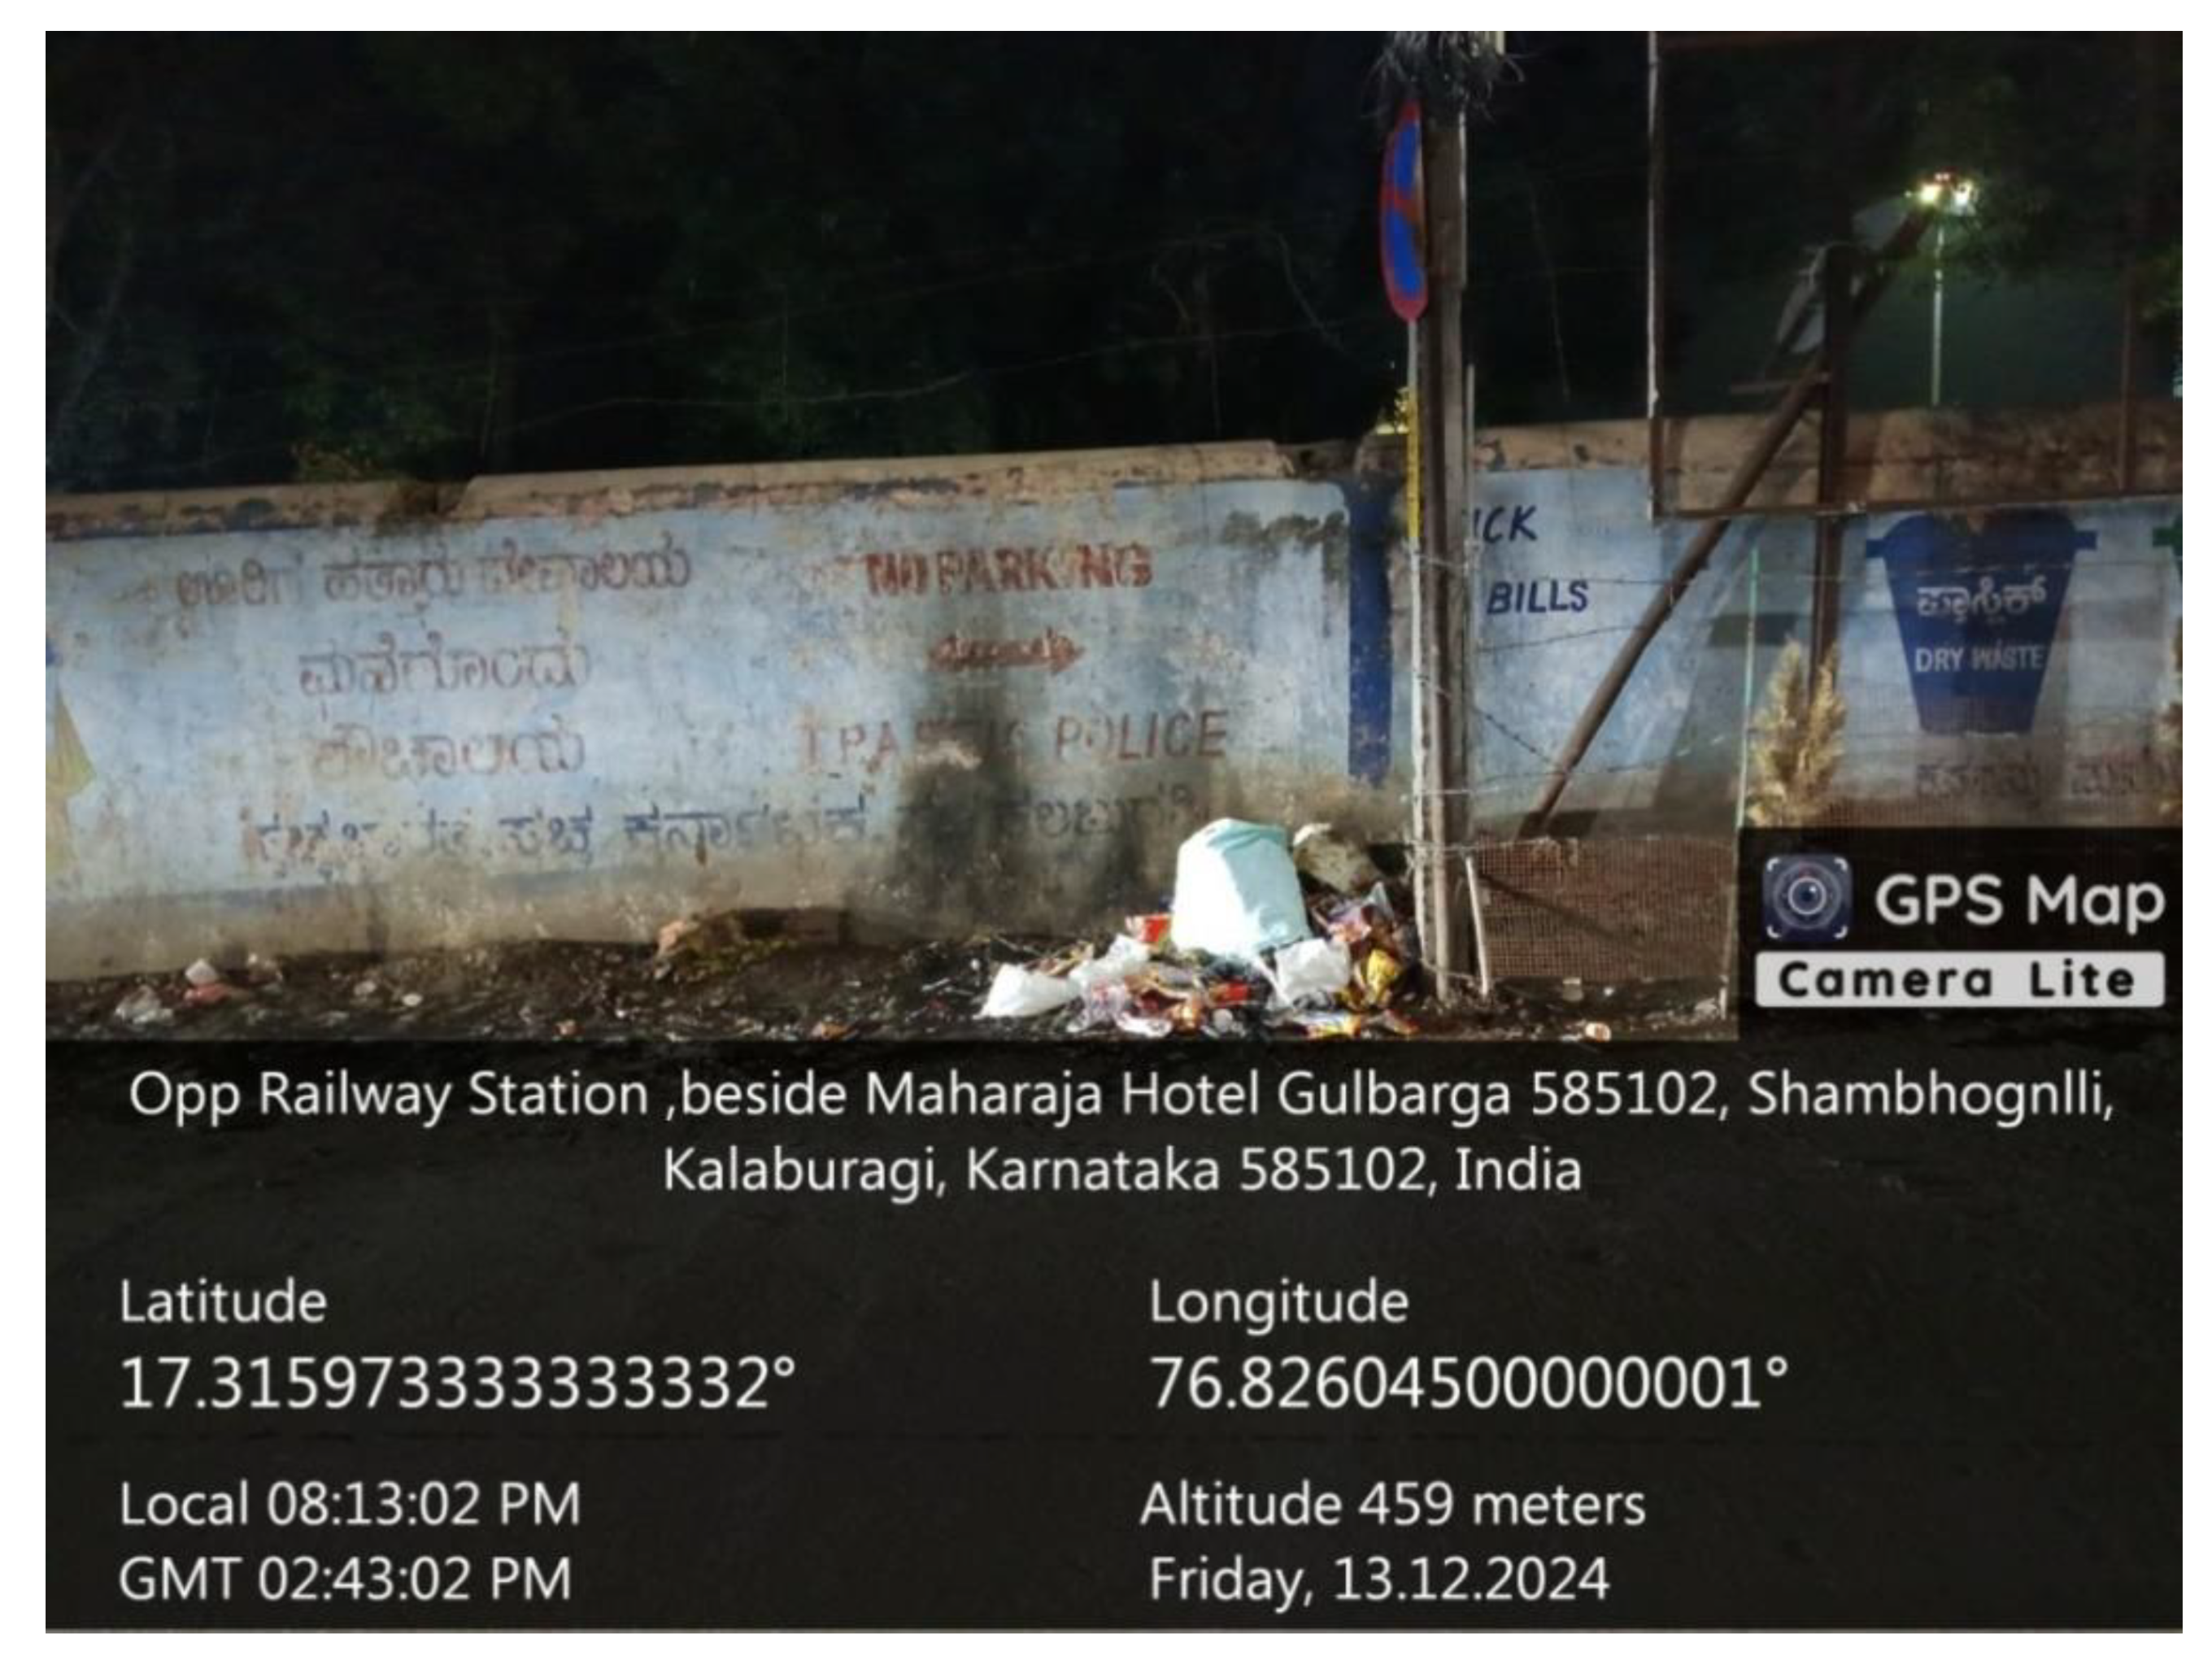
Figure 24.
Figure 24. .
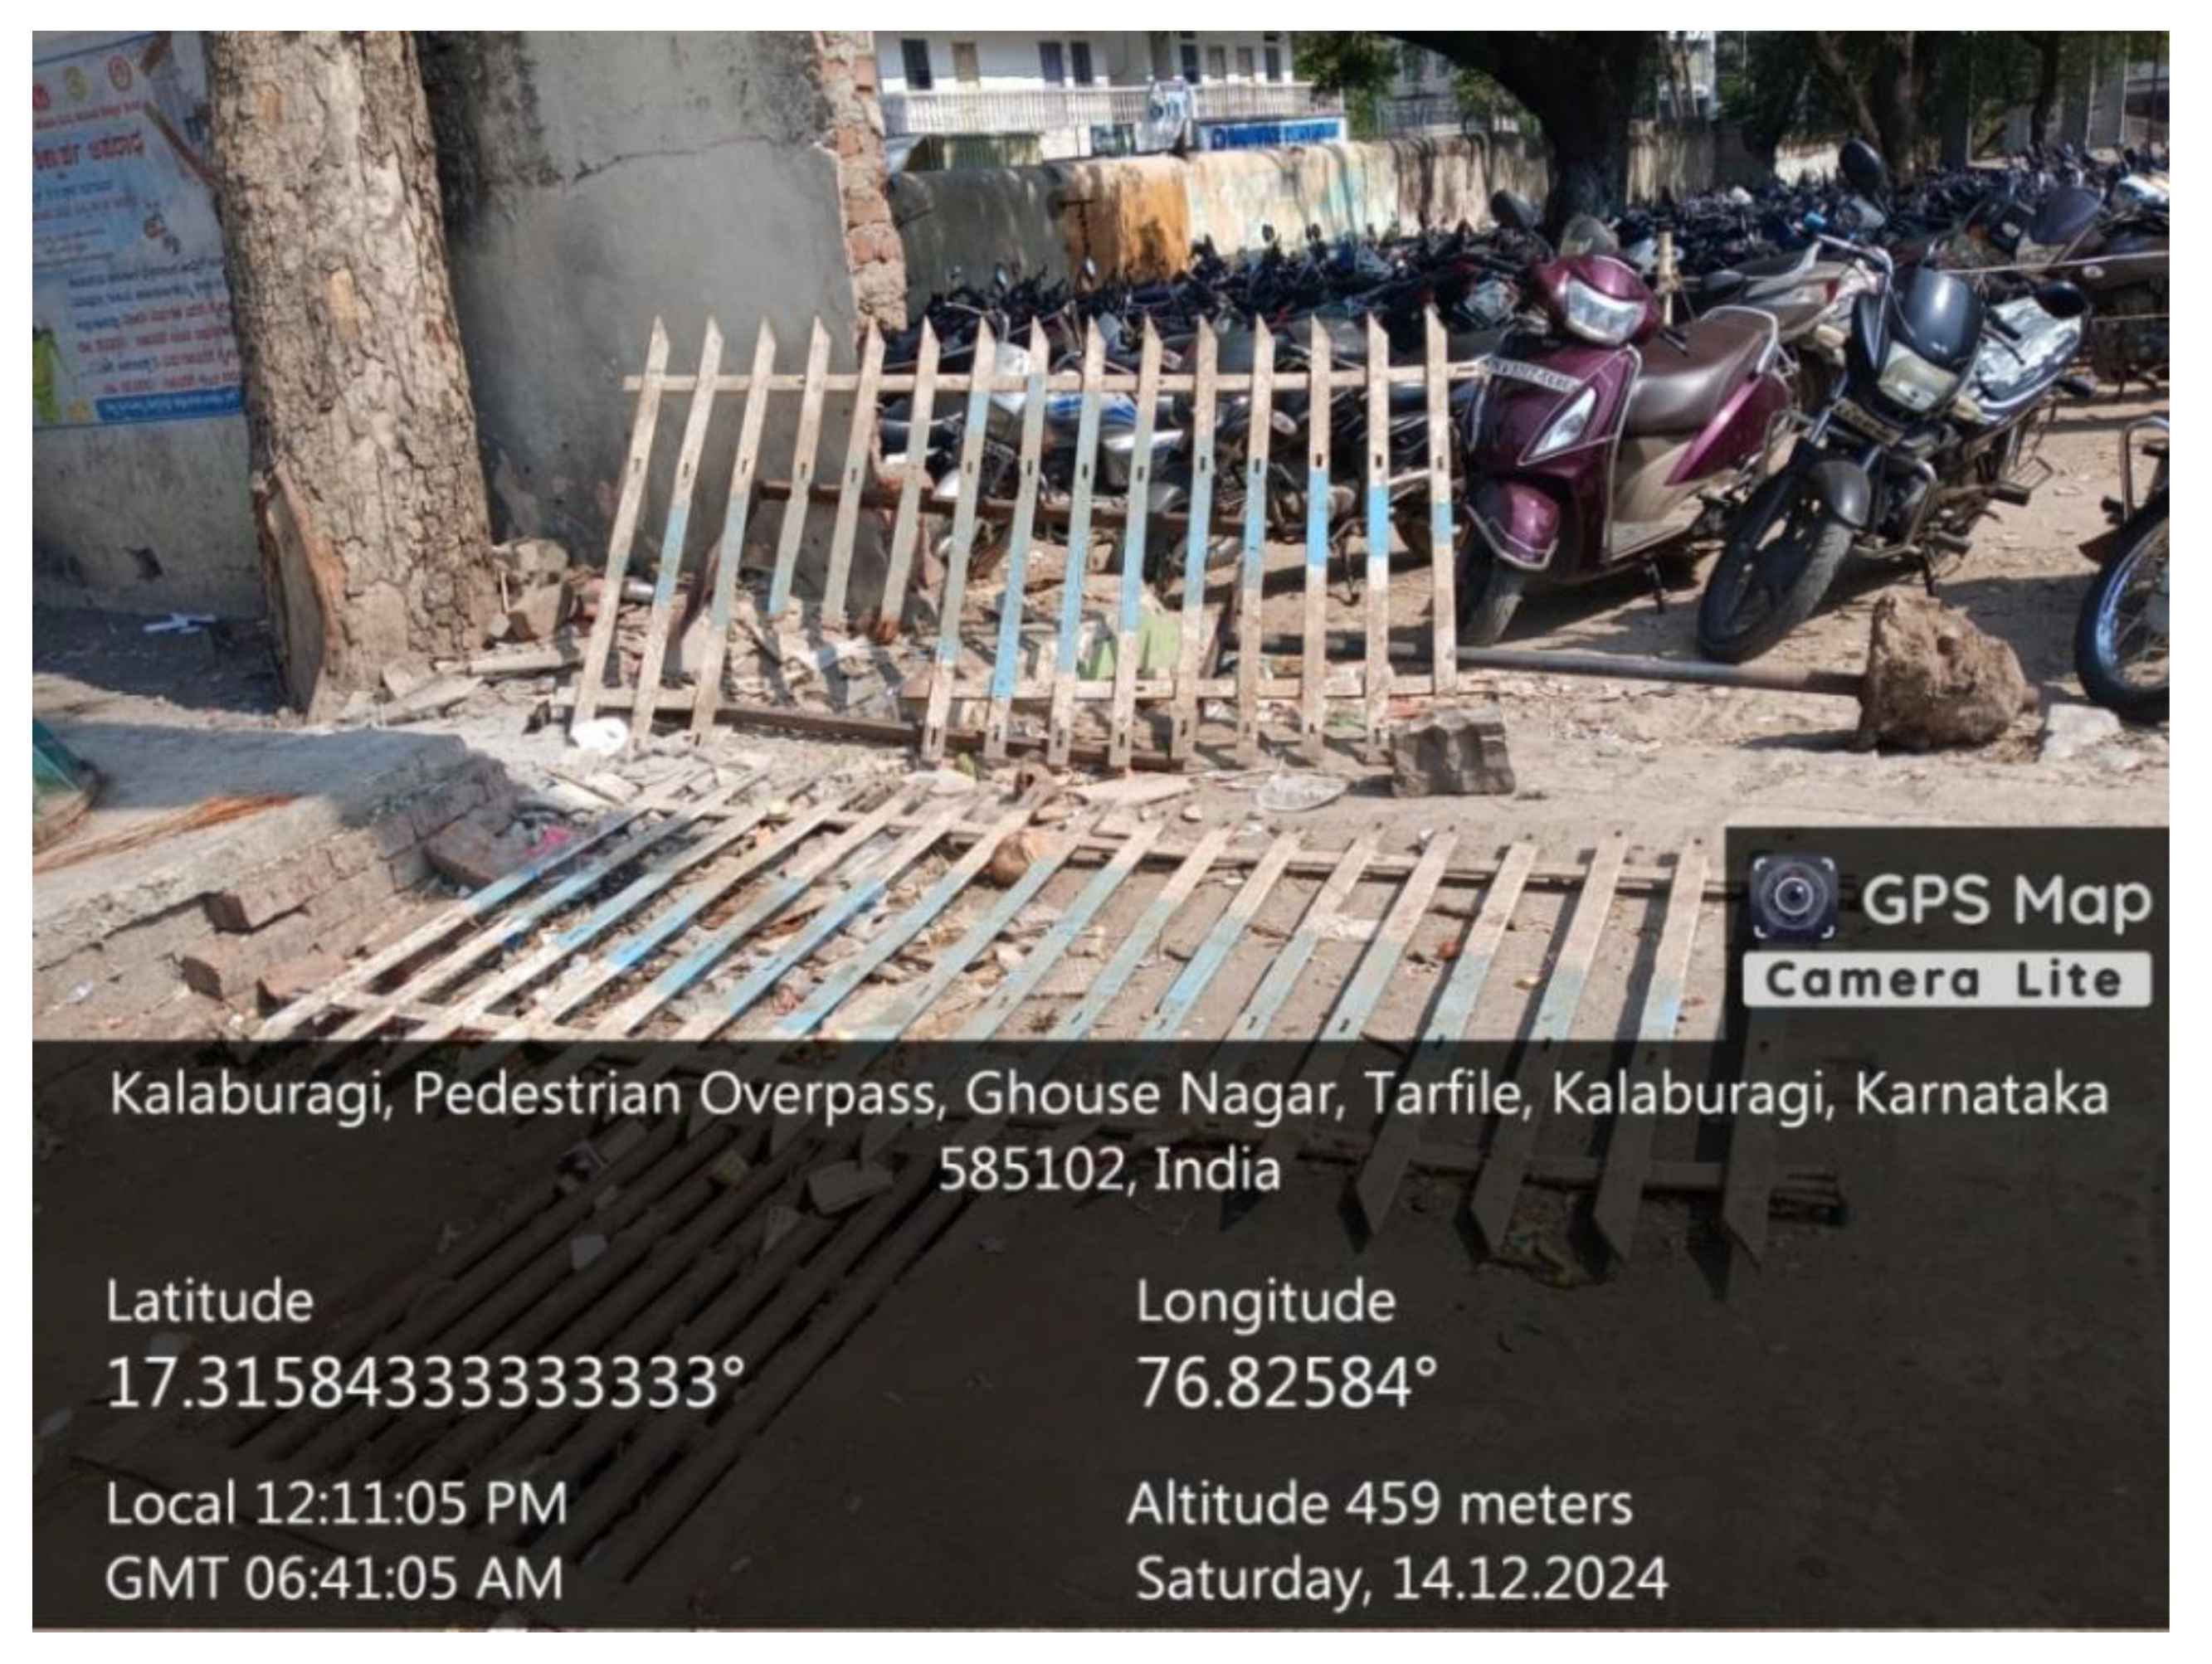
Figure 25.
Figure25. .
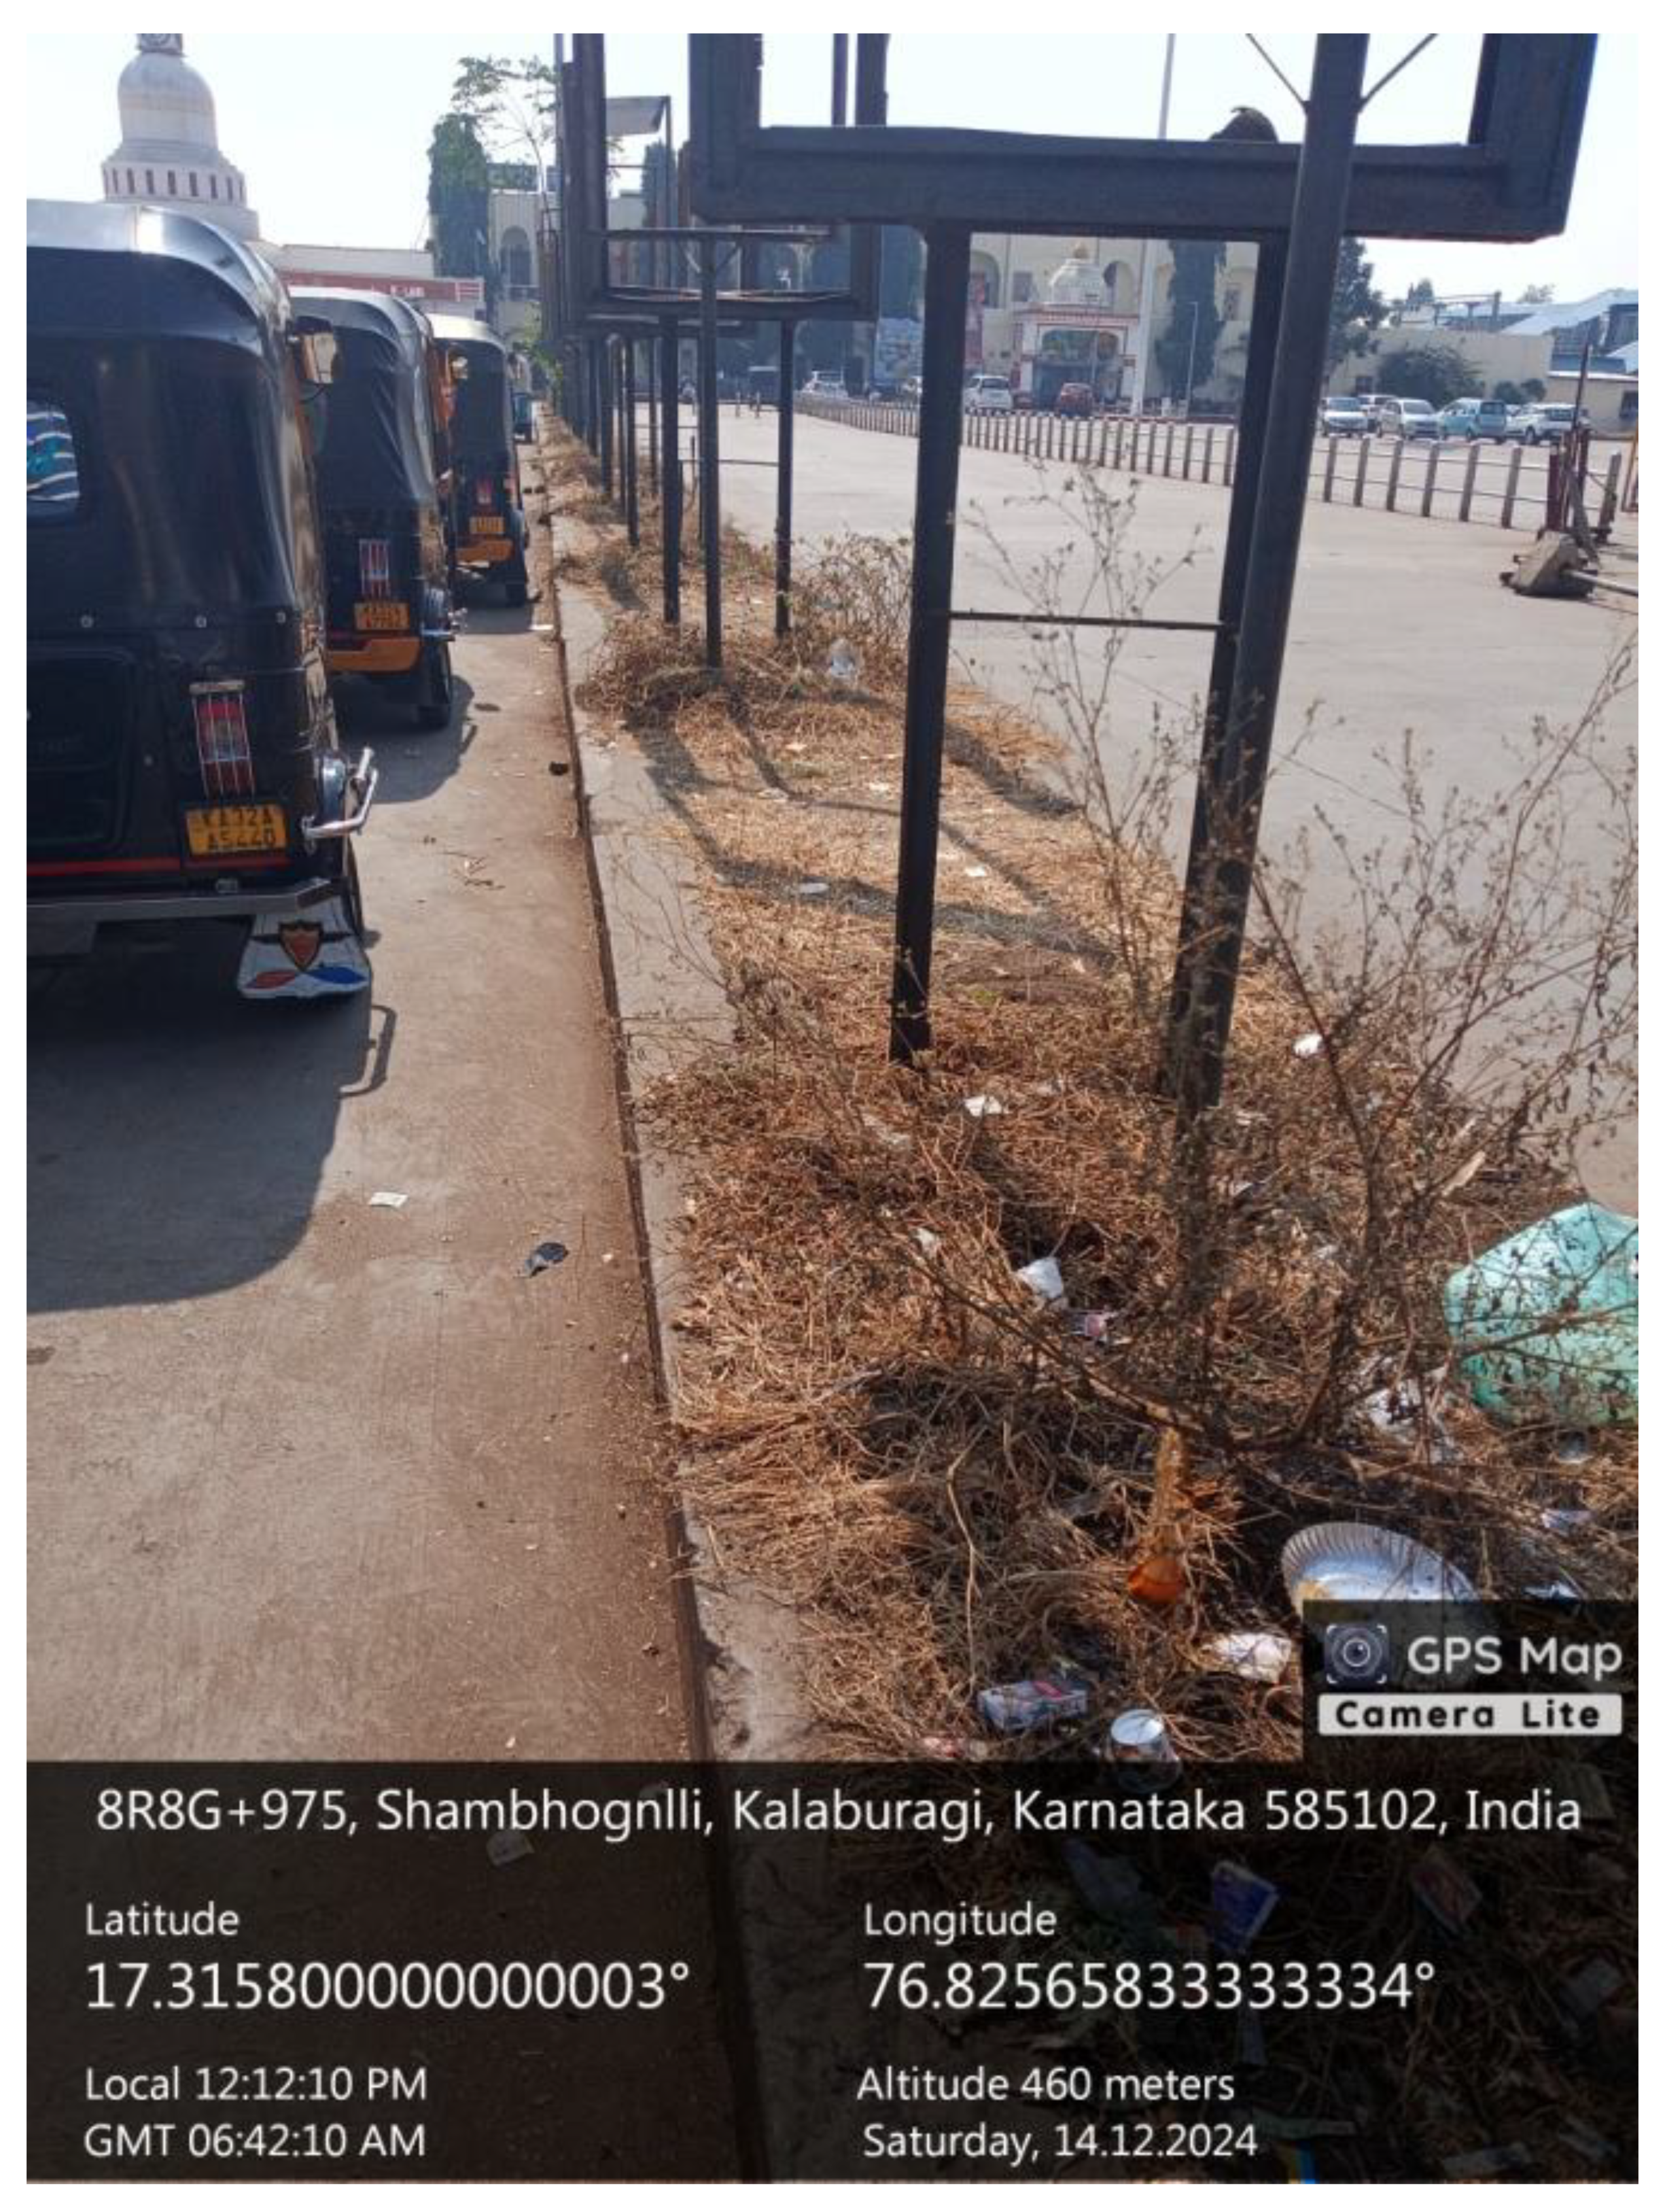
Figure 26.
Figure26. .
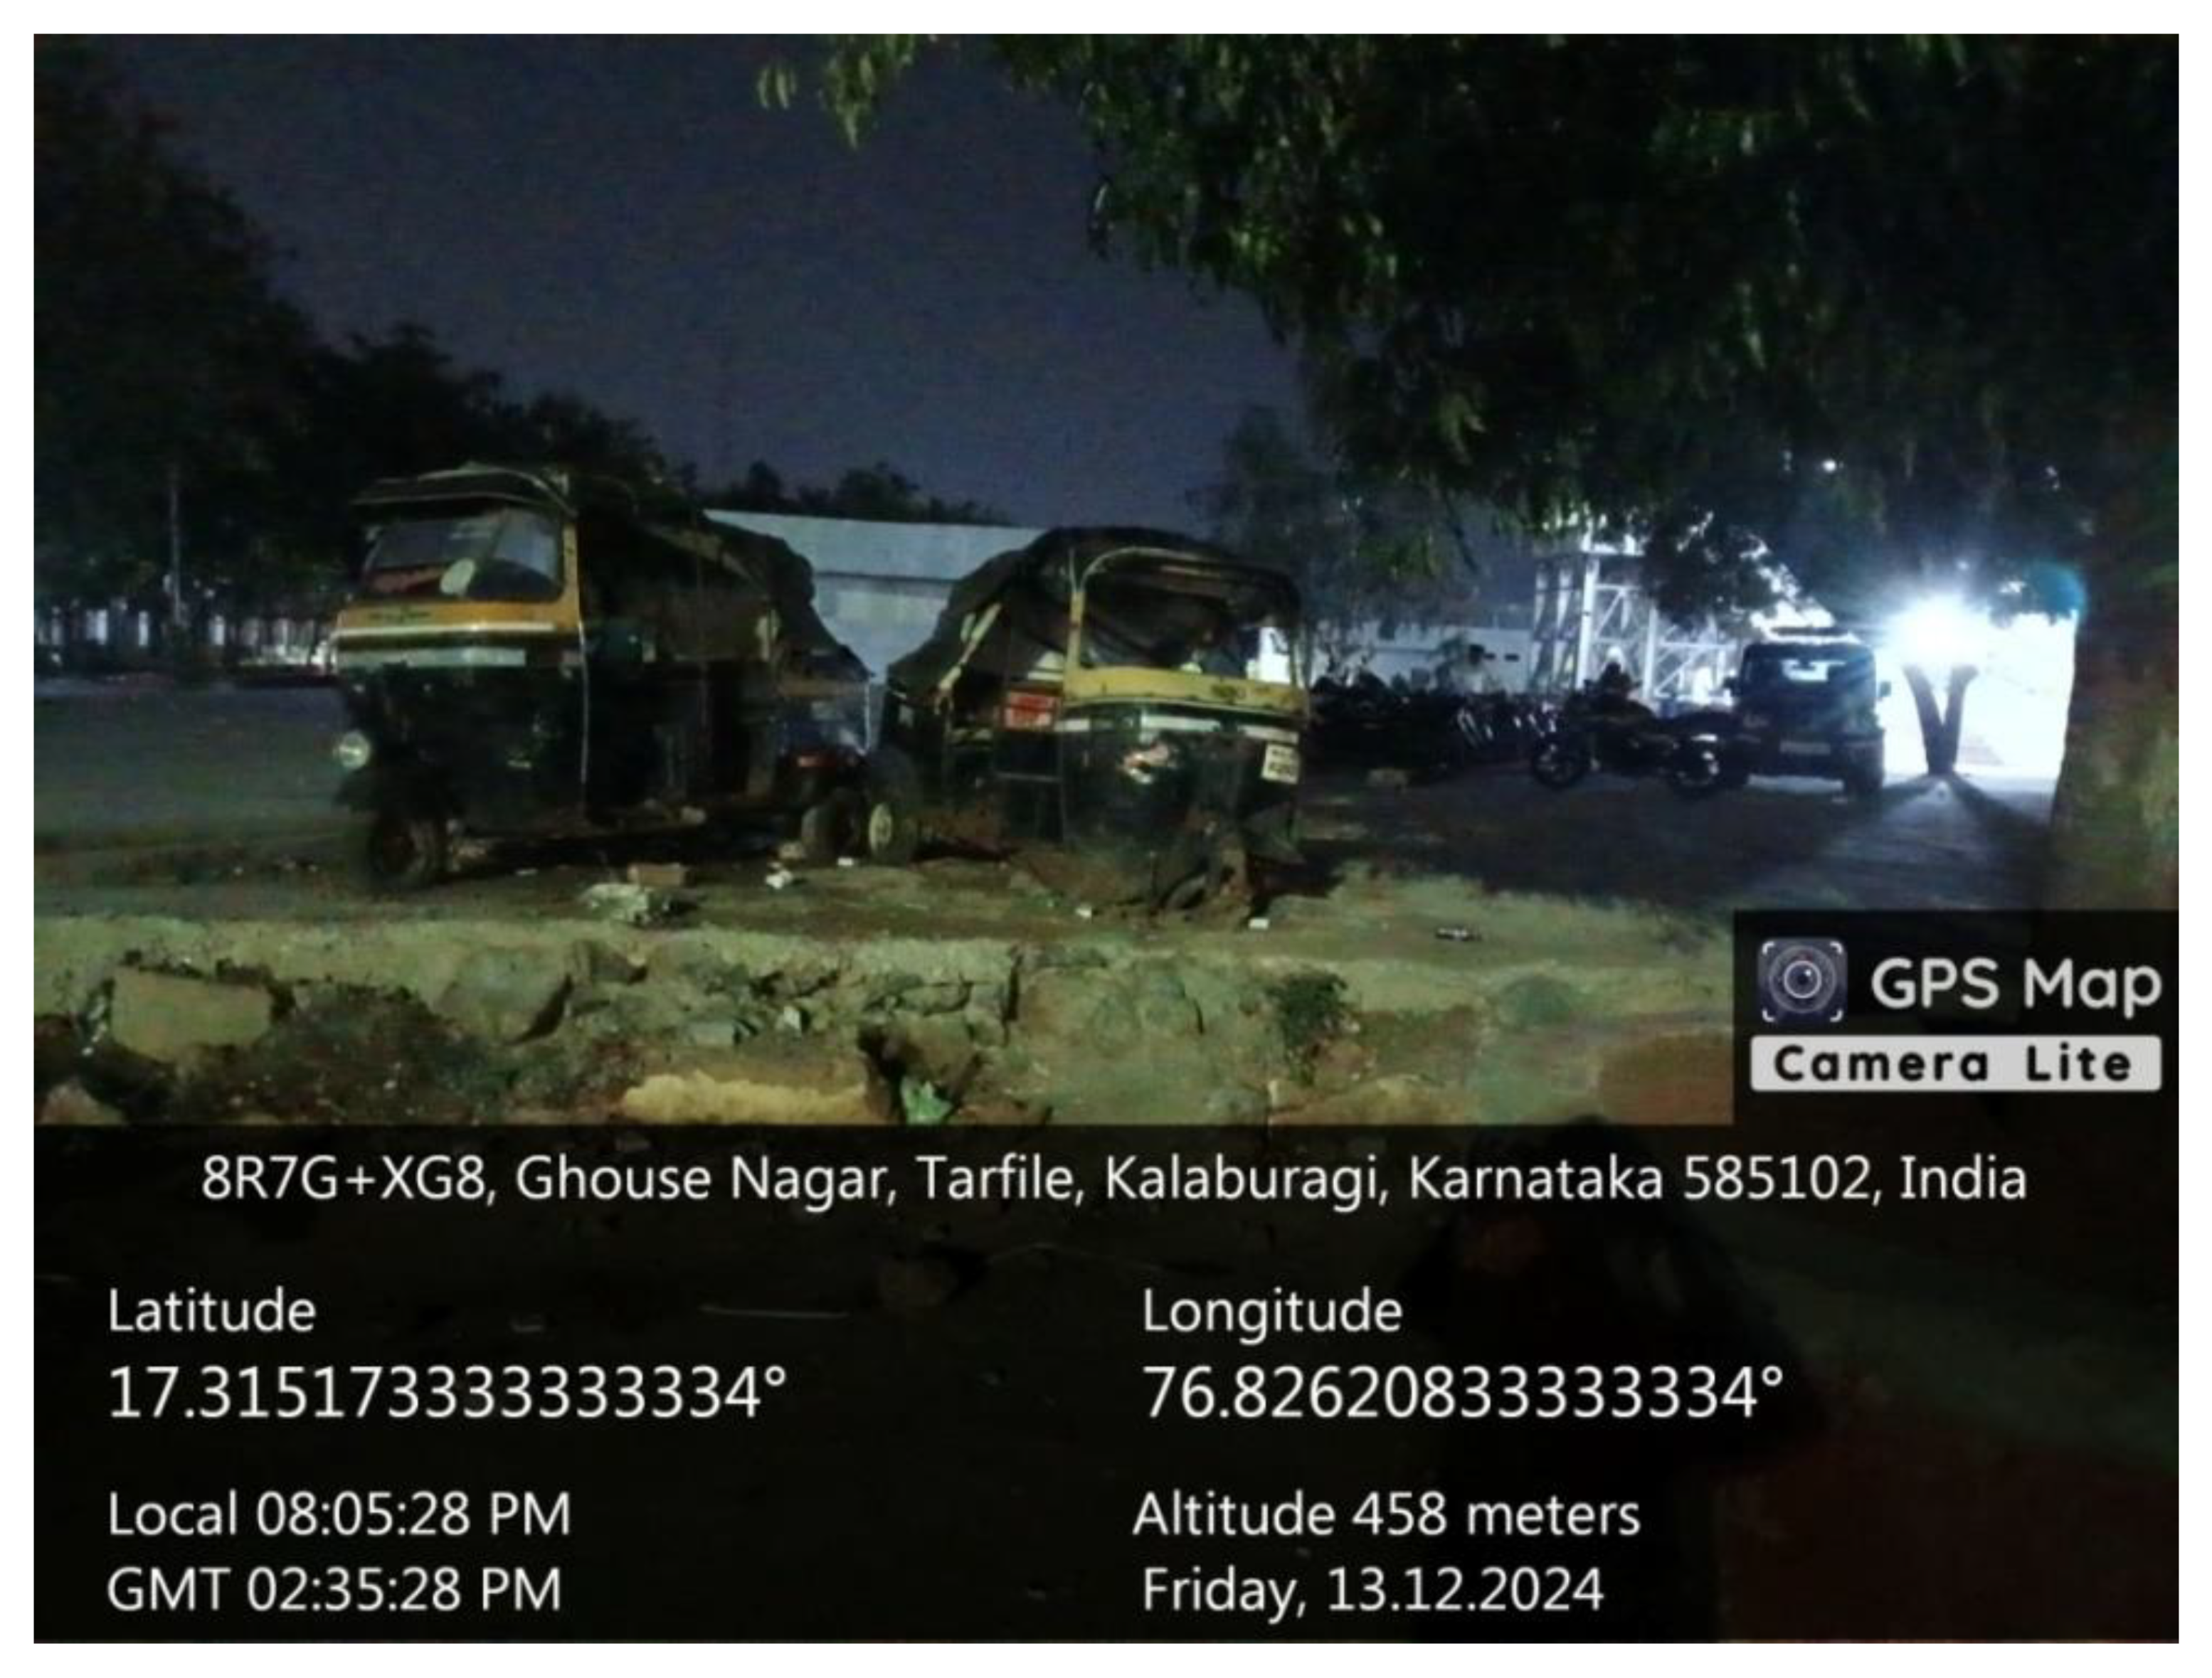
Figure 27.
Figure27. .
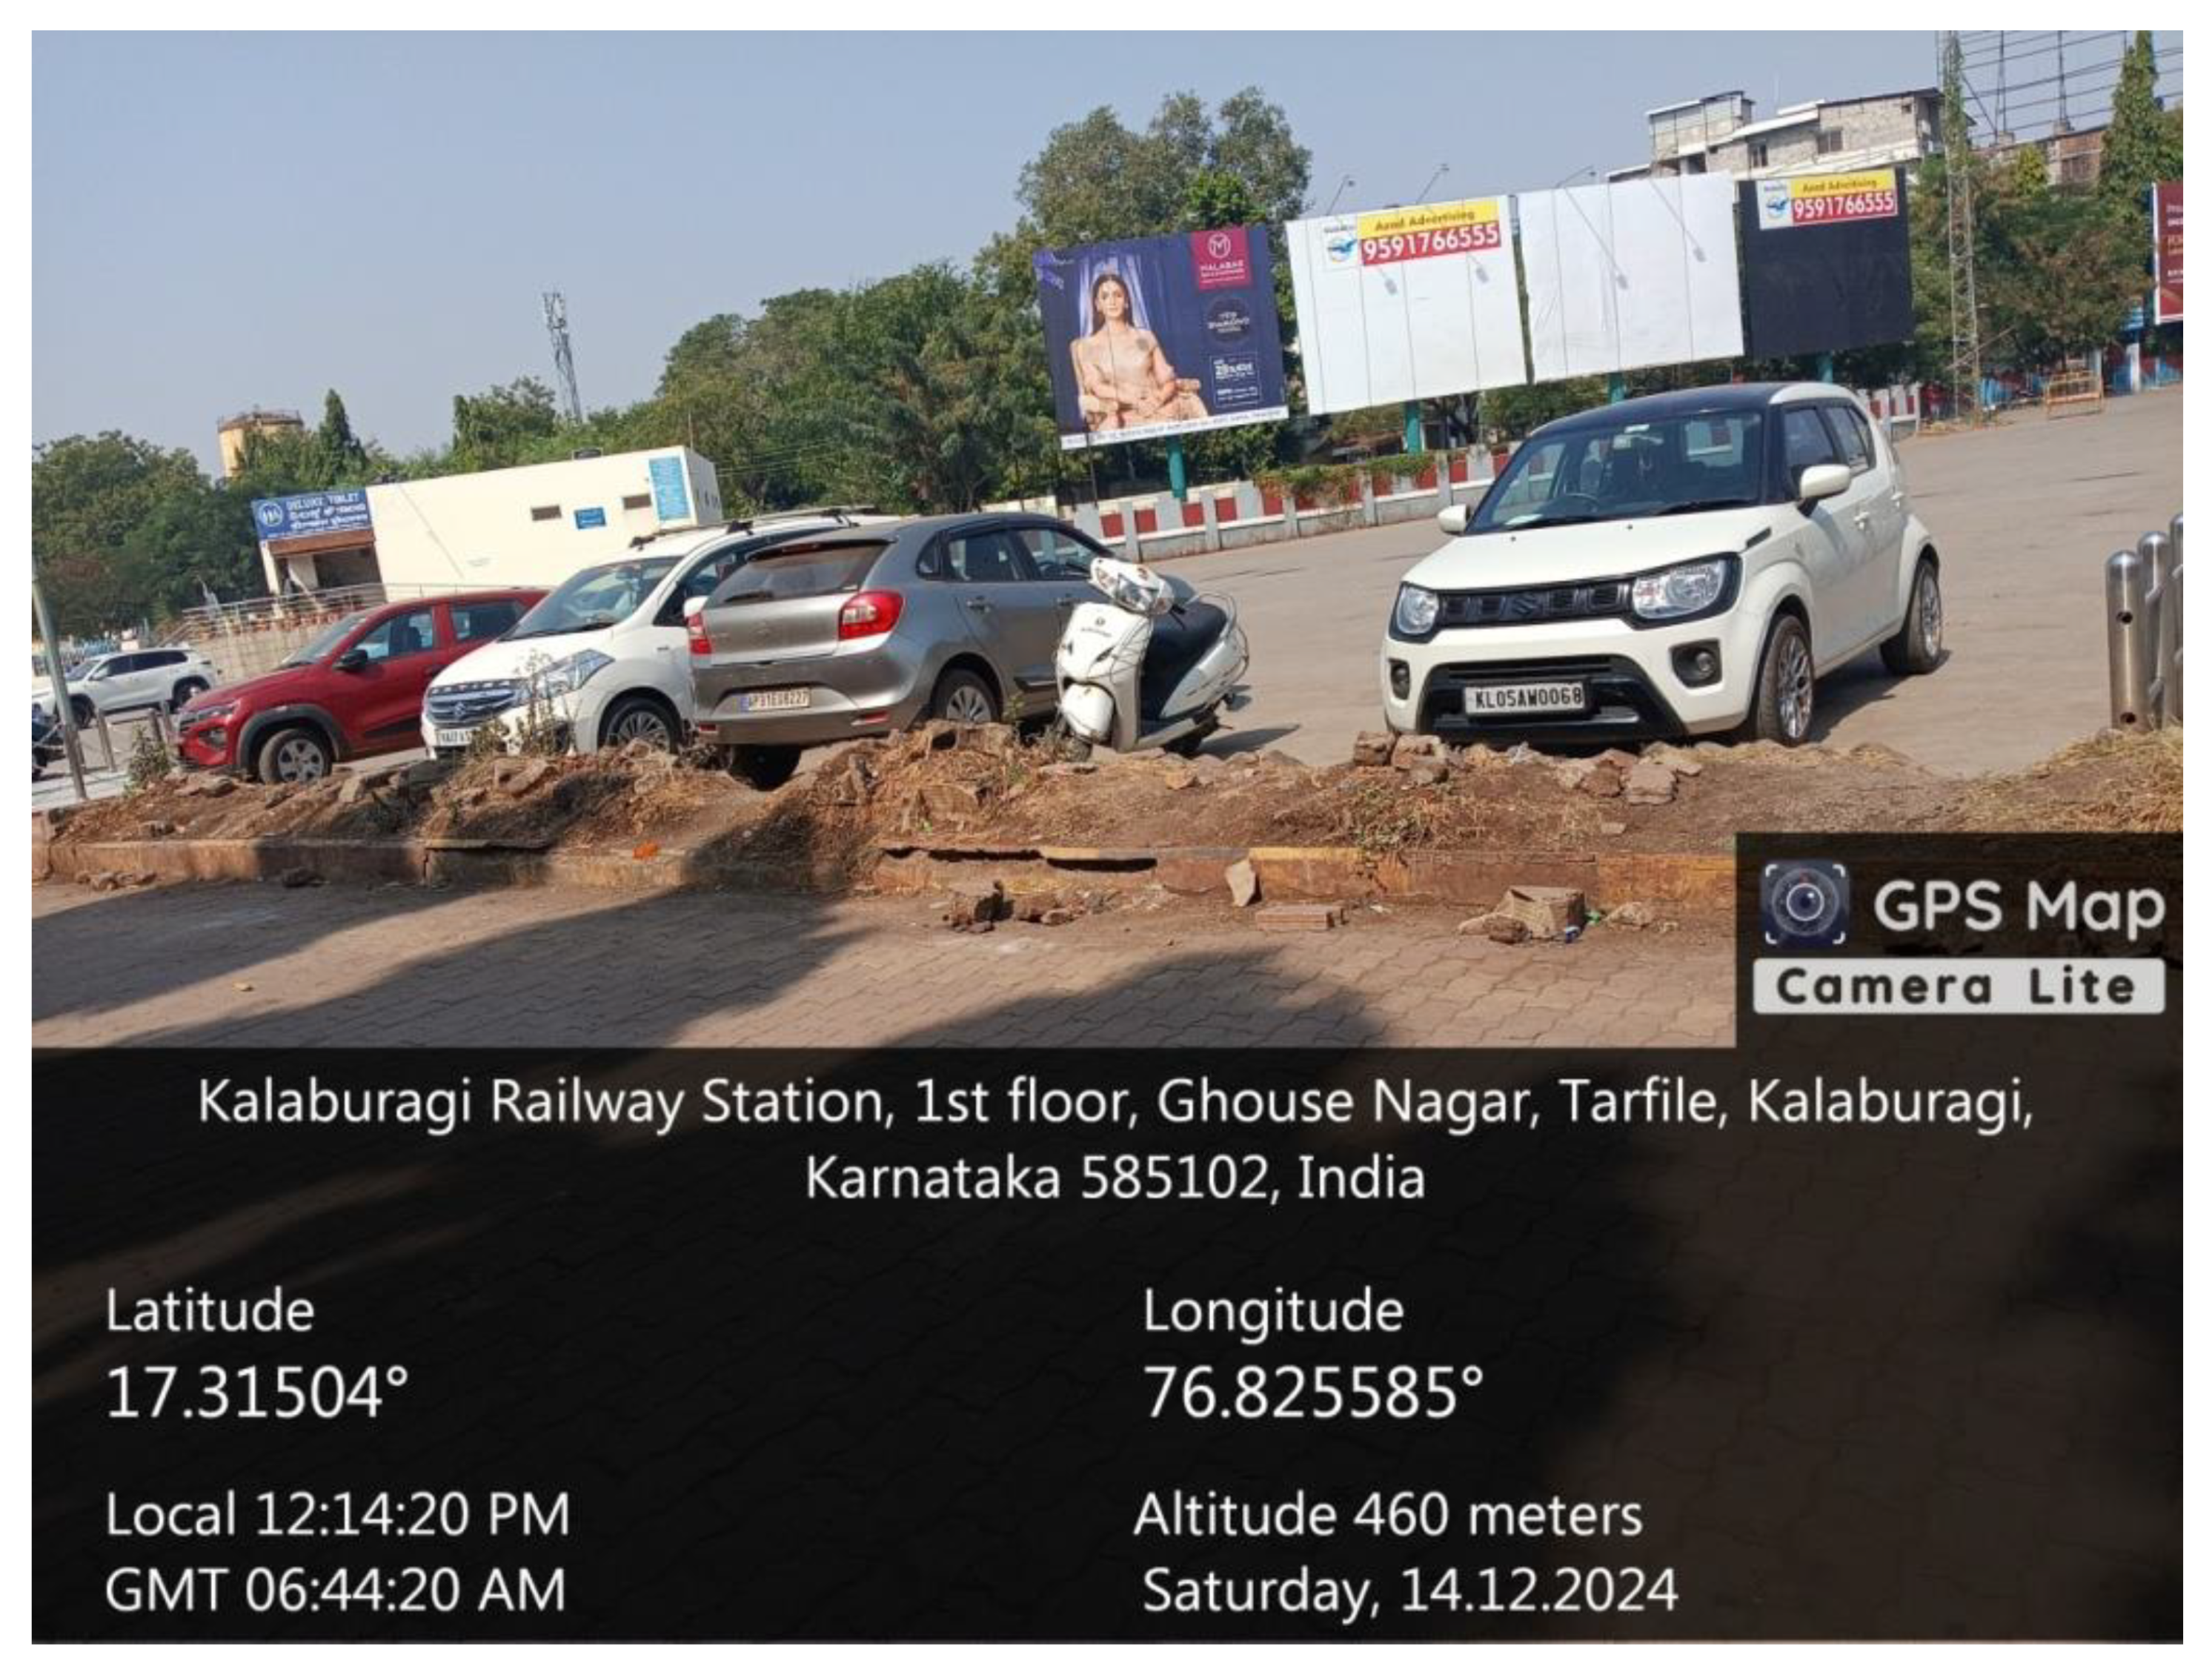
Figure 28.
The Scarcity of Toilets And Urinals.
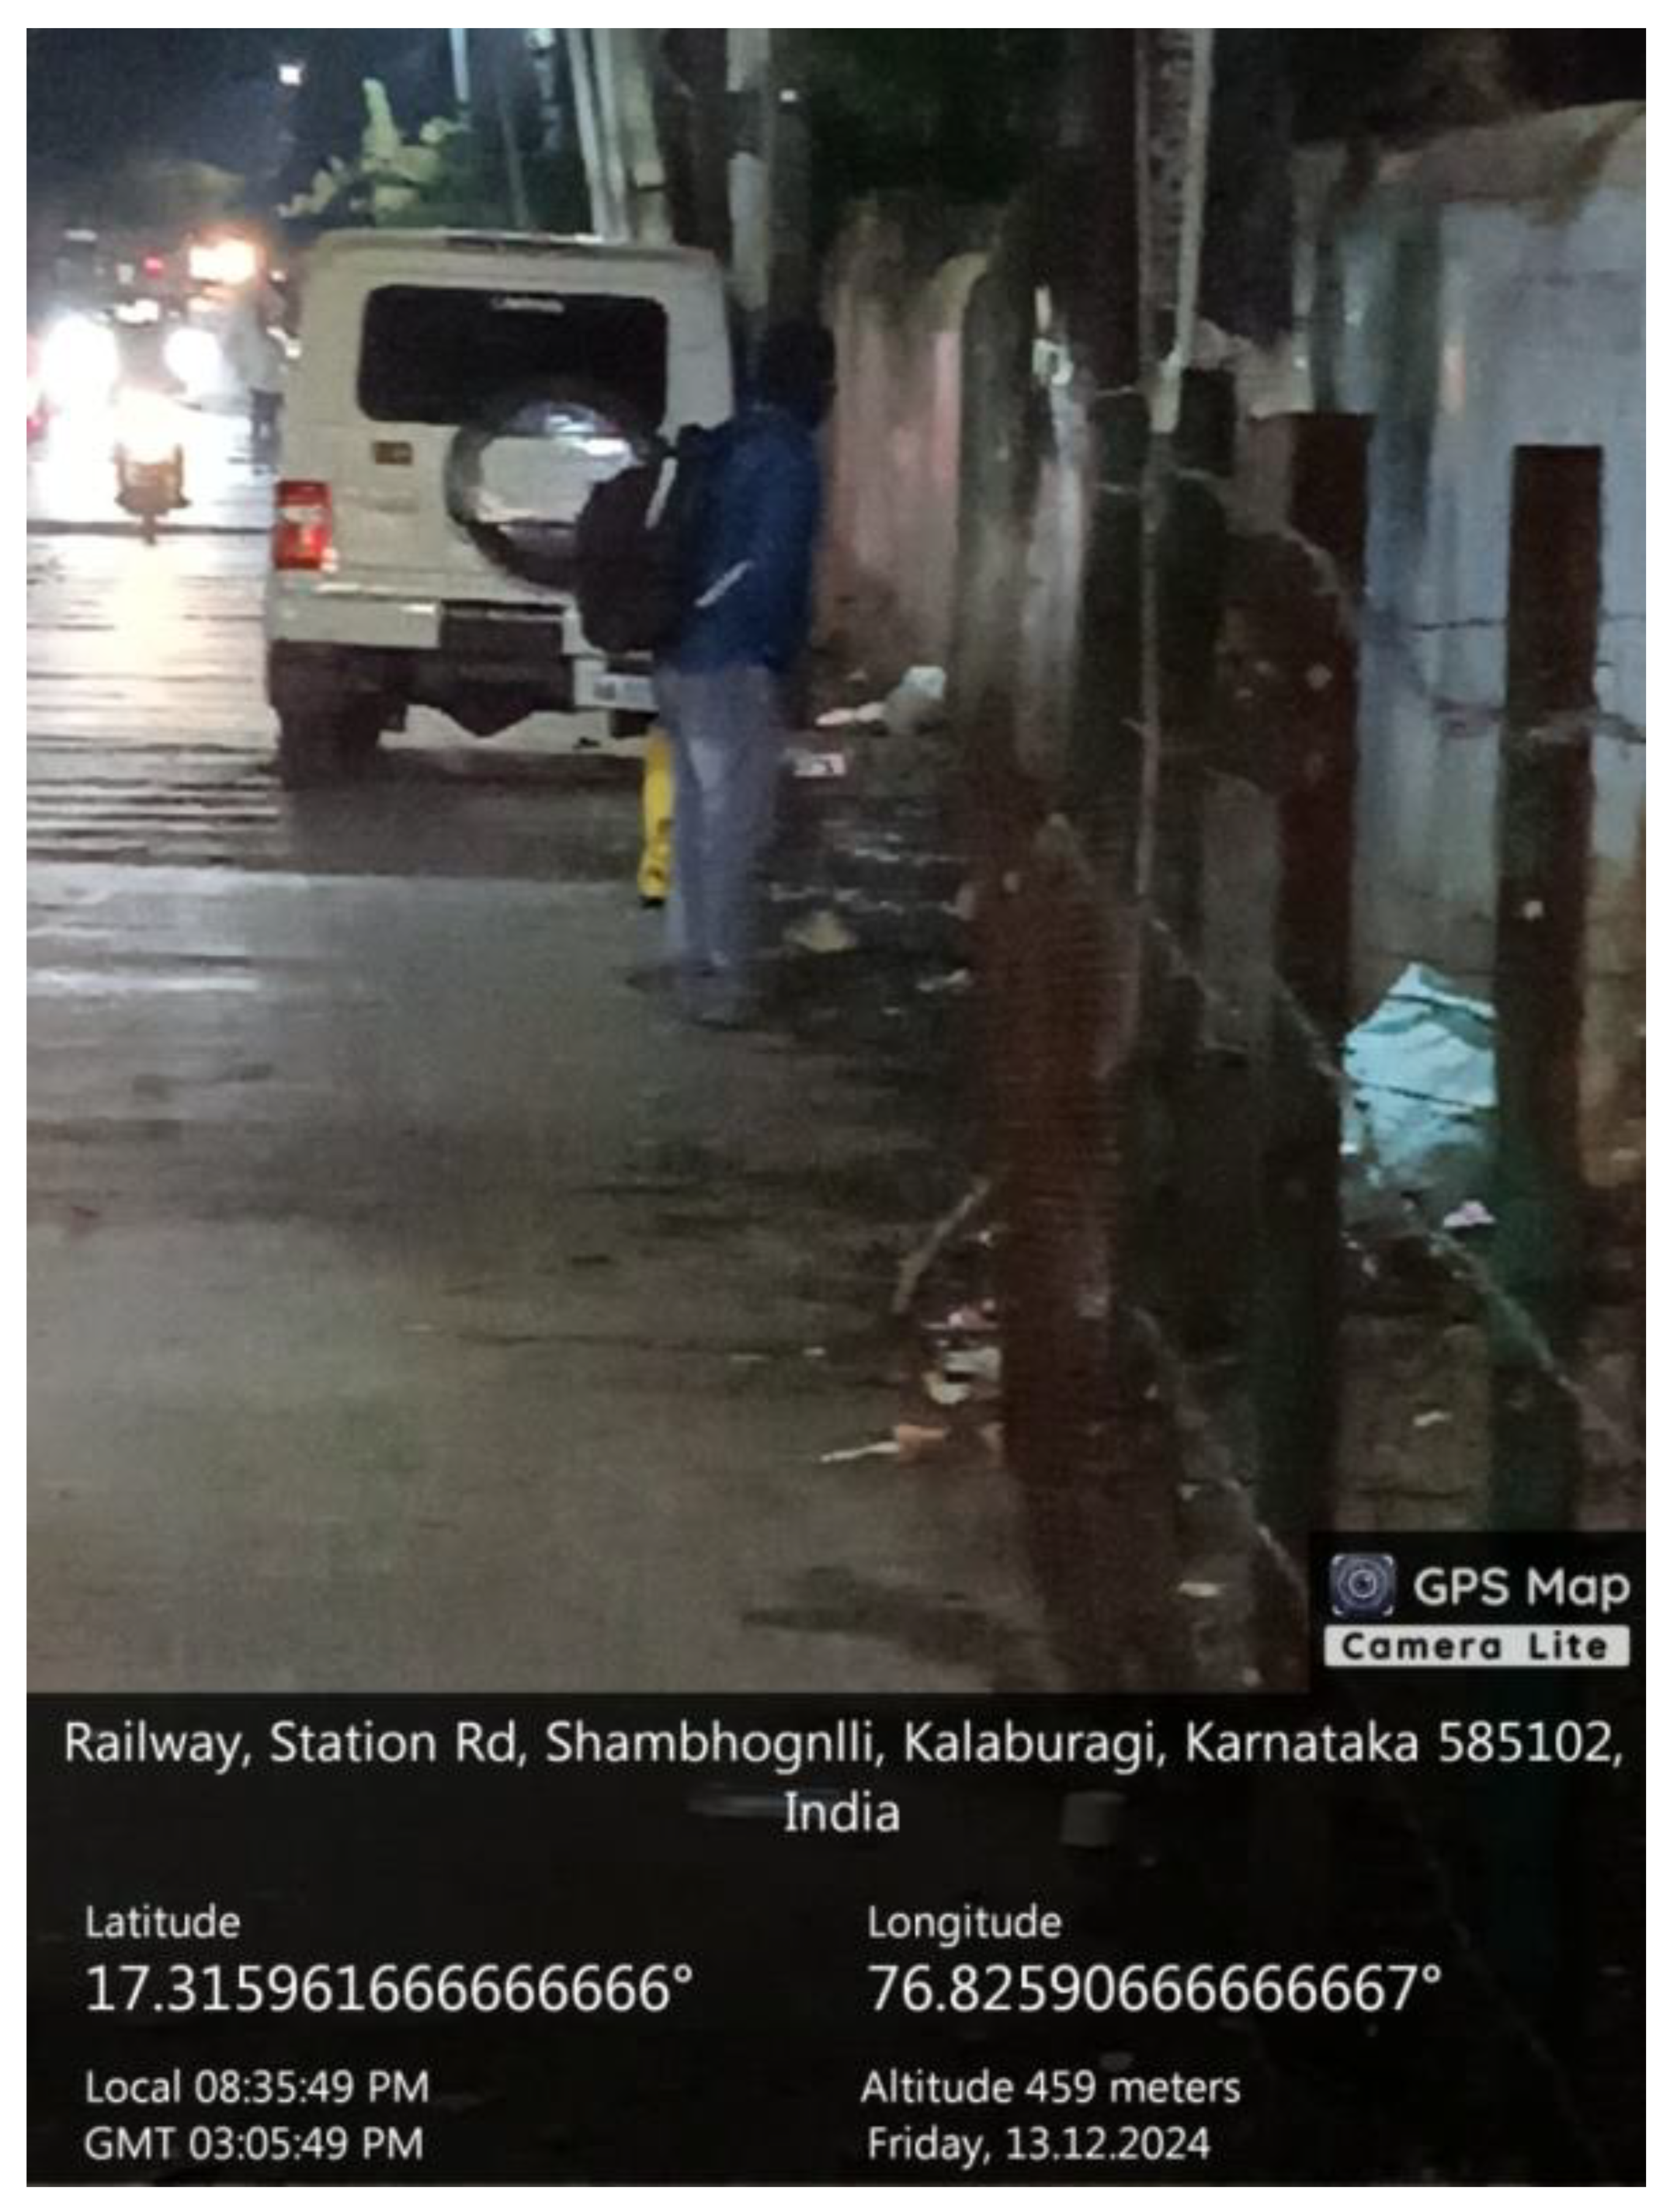
Figure 29.
Figure29. .
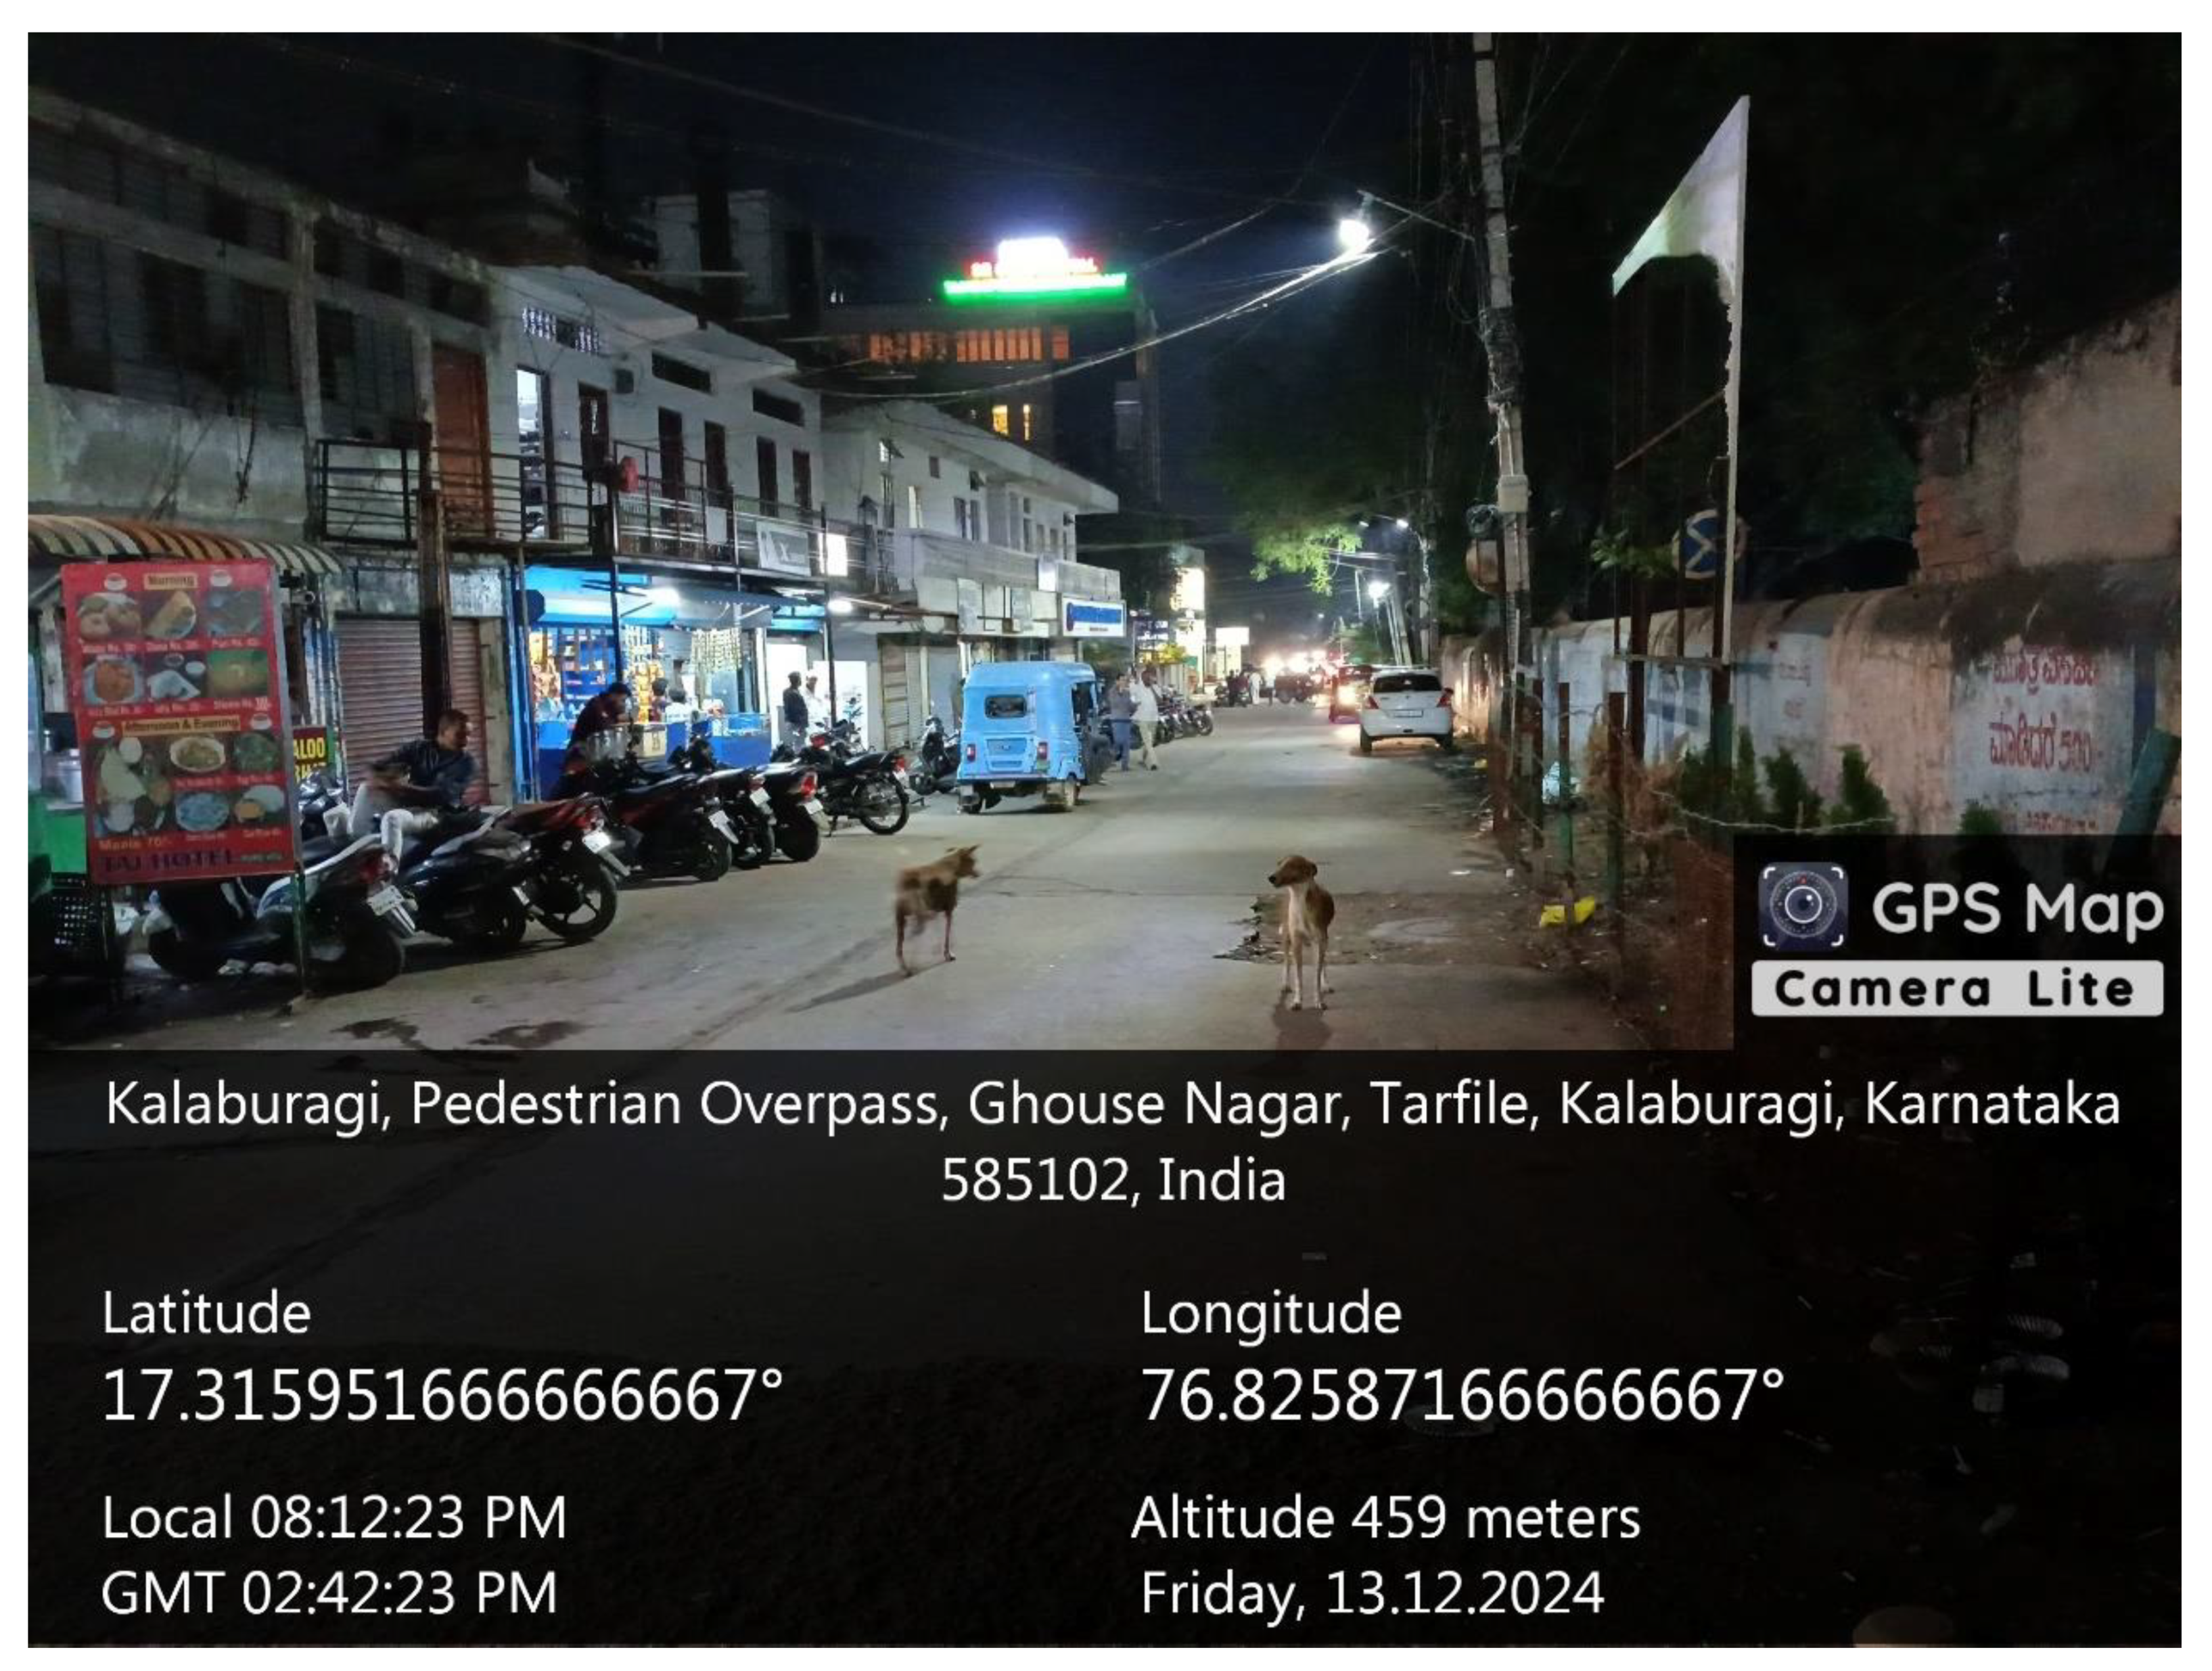
Figure 30.
Figure30. .
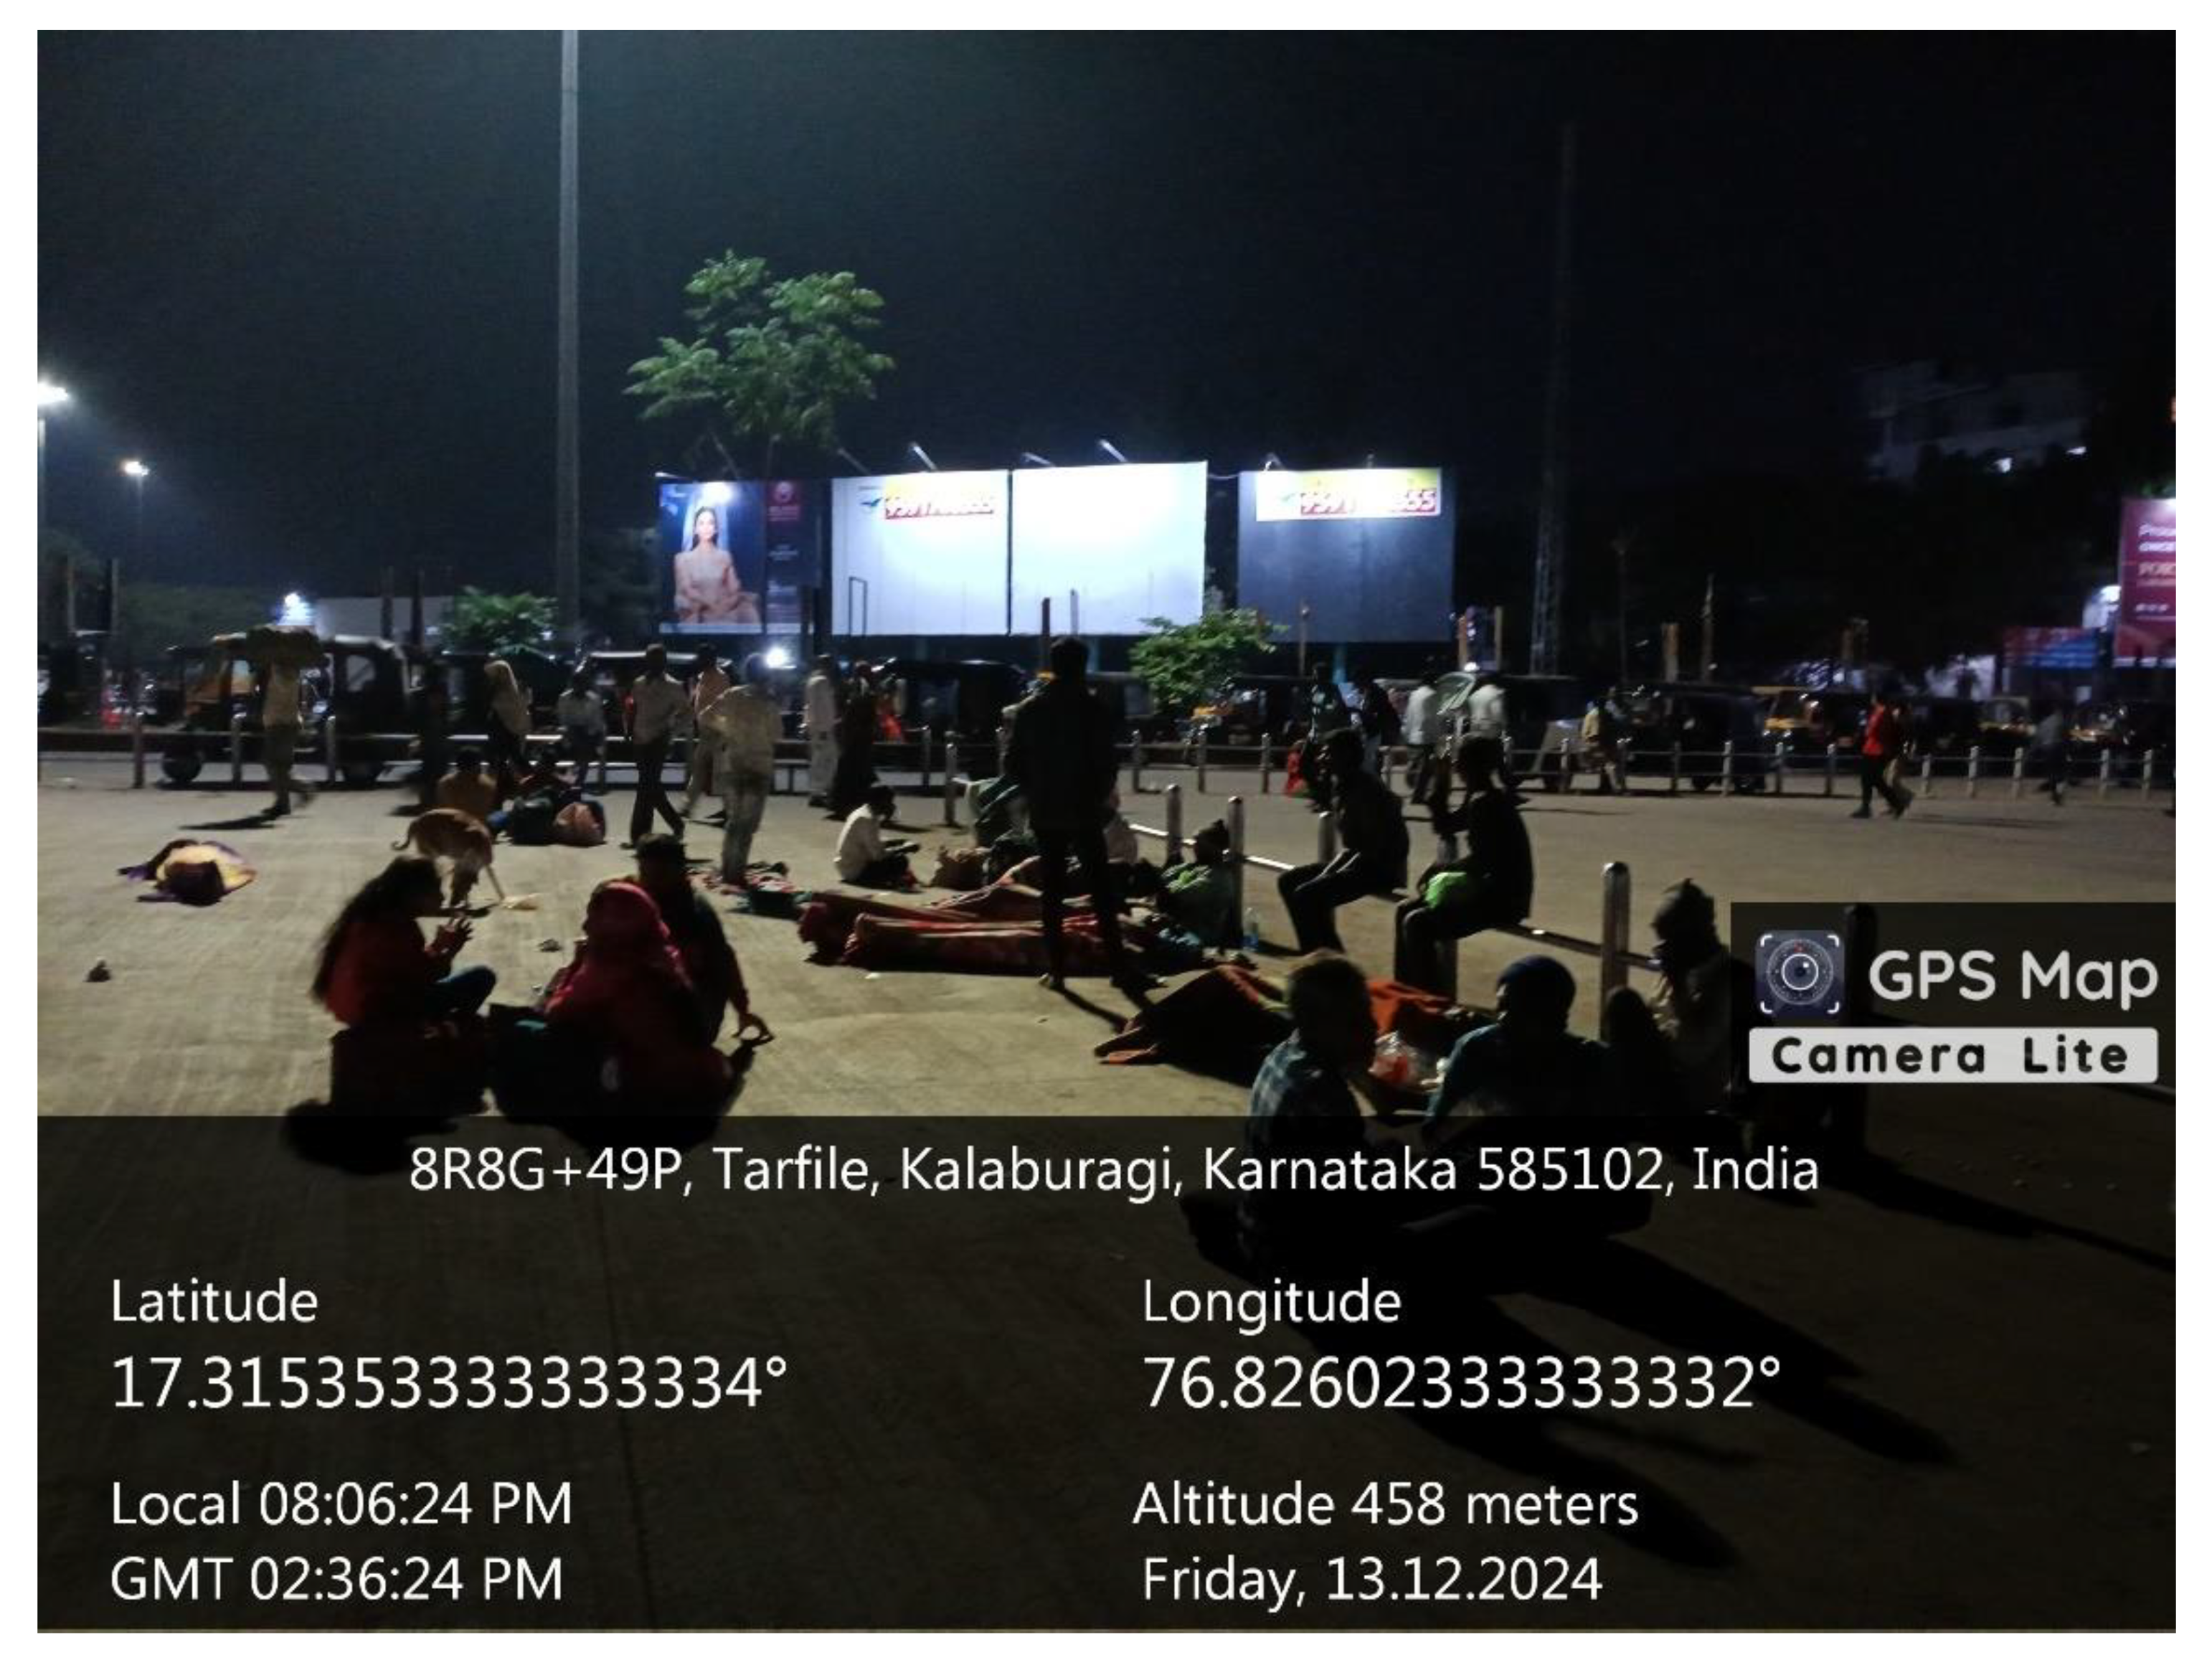
Figure 31.
Figure31. .
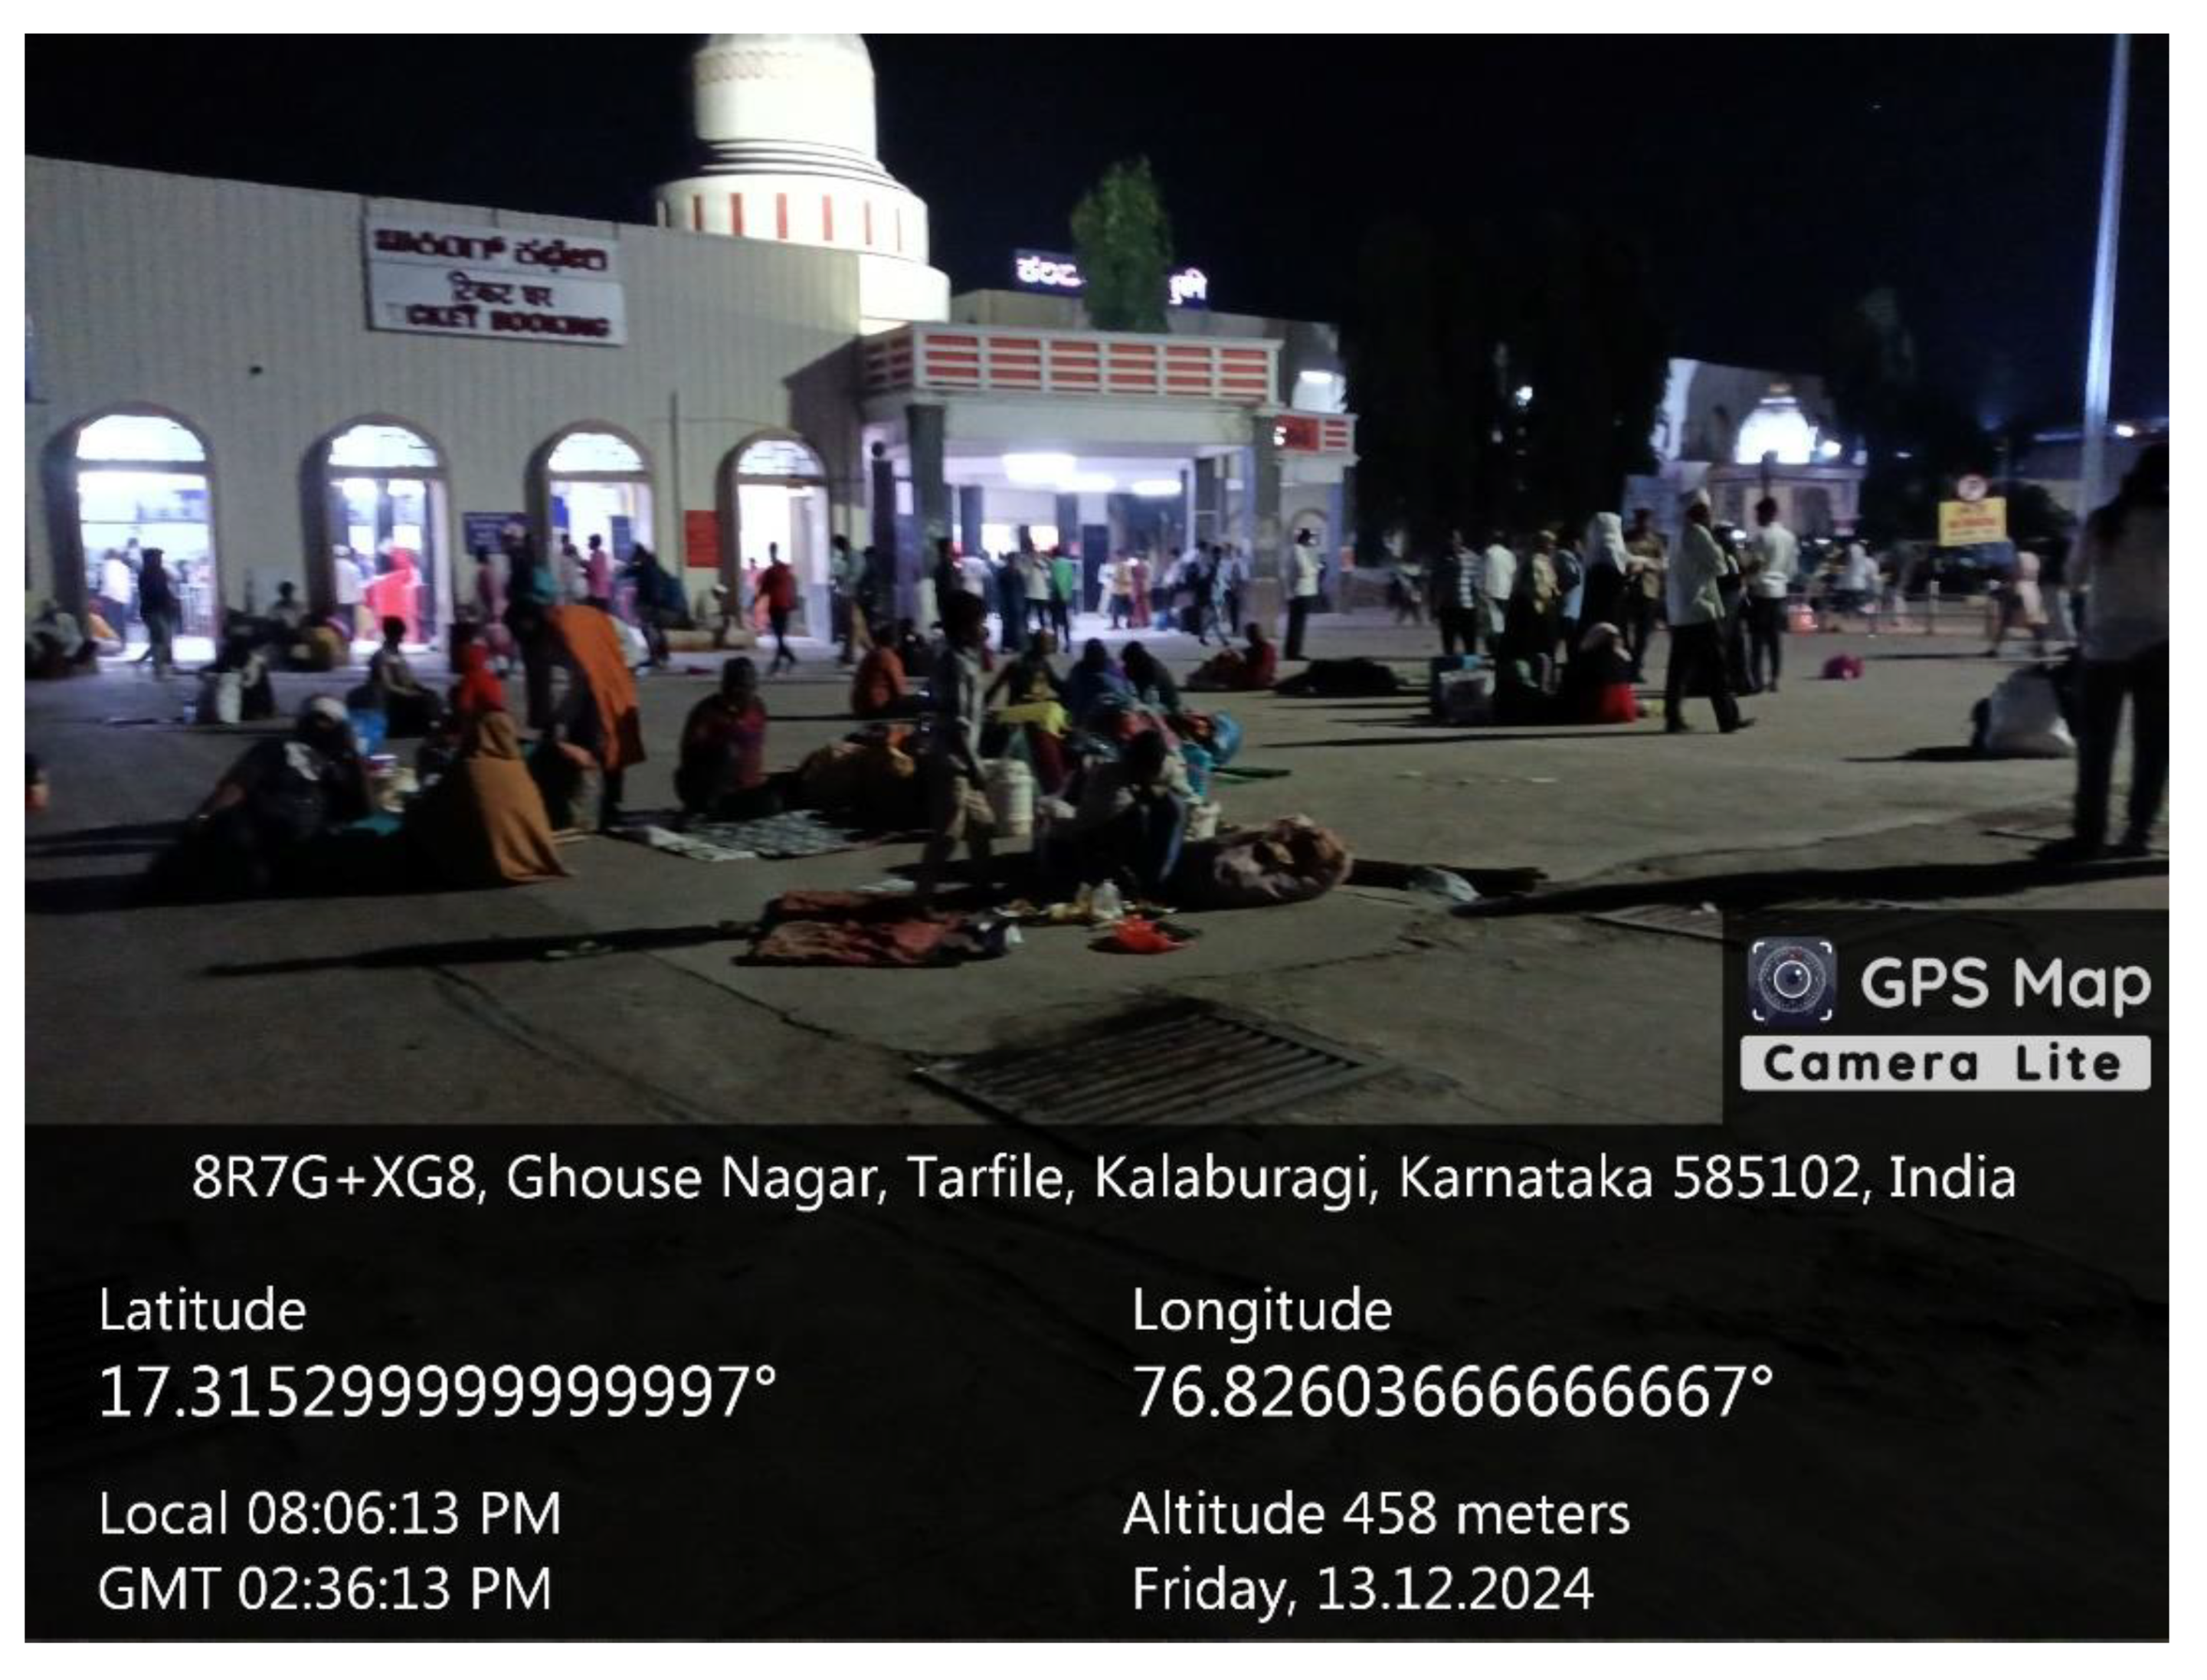
Figure 32.
Showing the Length Of Roads In The Surrounding Parts Of Kalaburagi Railway Station By GIS Map.
Figure 32.
Showing the Length Of Roads In The Surrounding Parts Of Kalaburagi Railway Station By GIS Map.
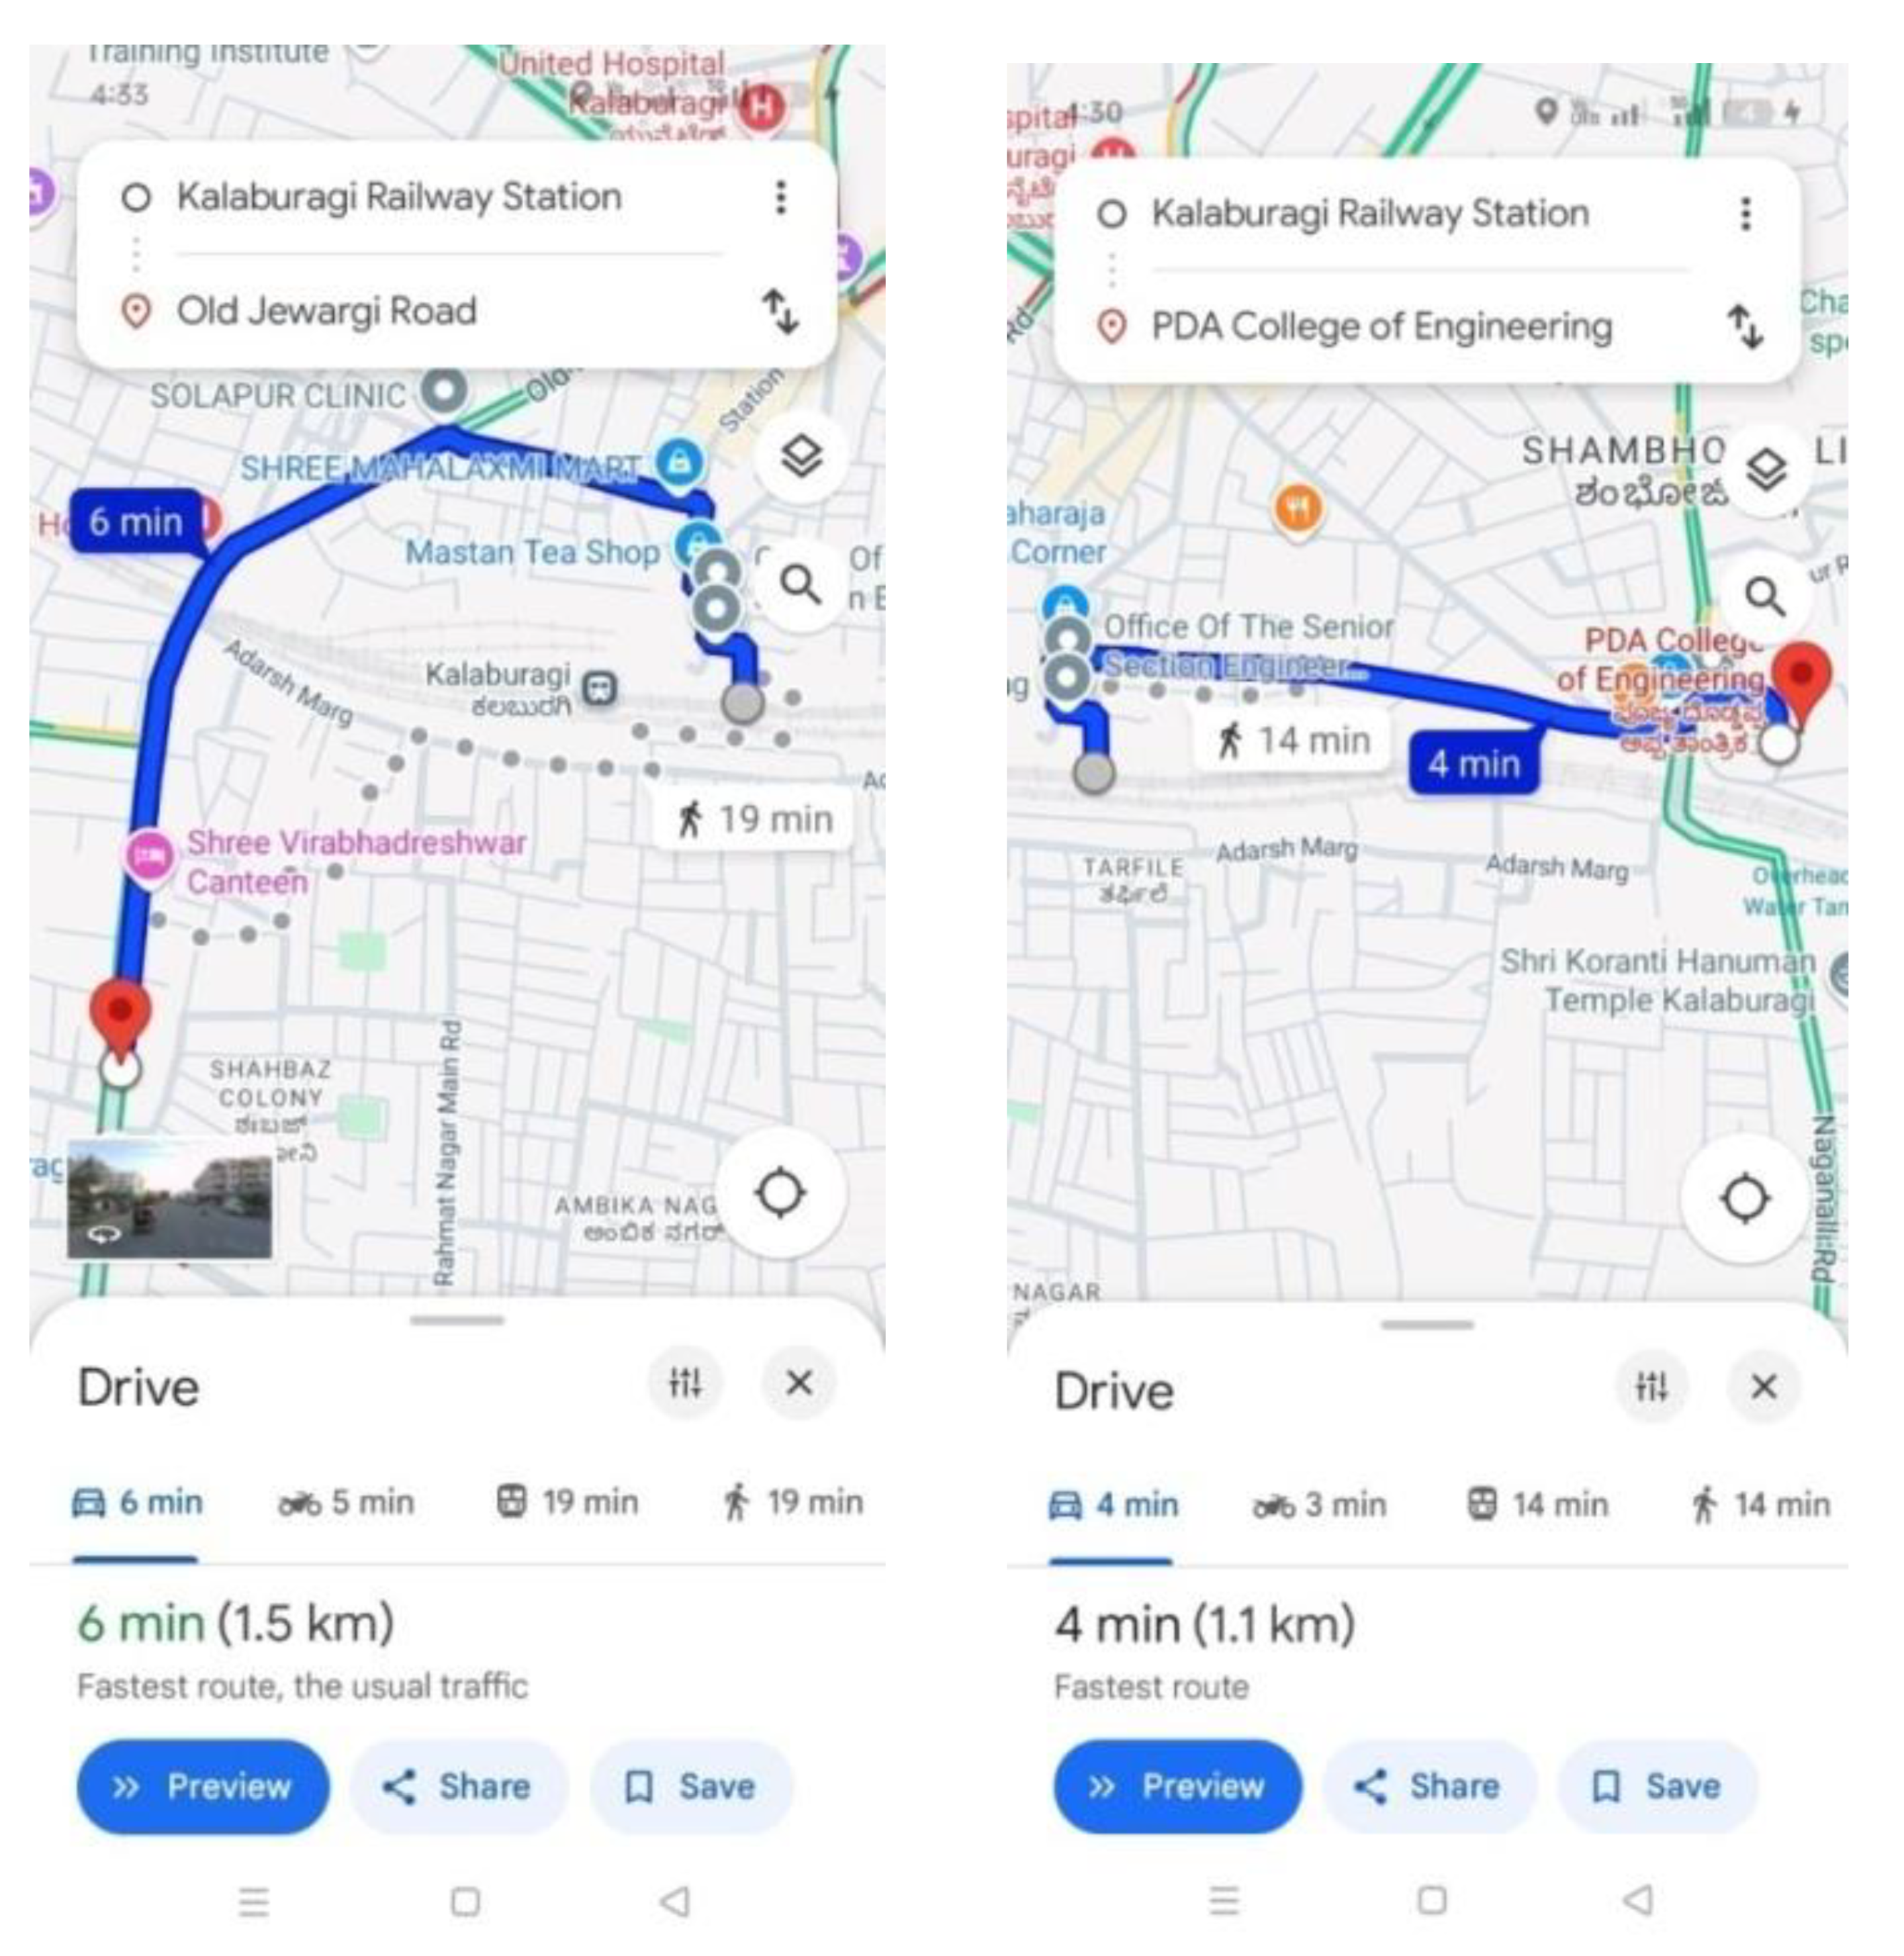
Figure 33.
Showing the Graph of Walkability Index surrounding parts of Kalaburagi Railway Station.
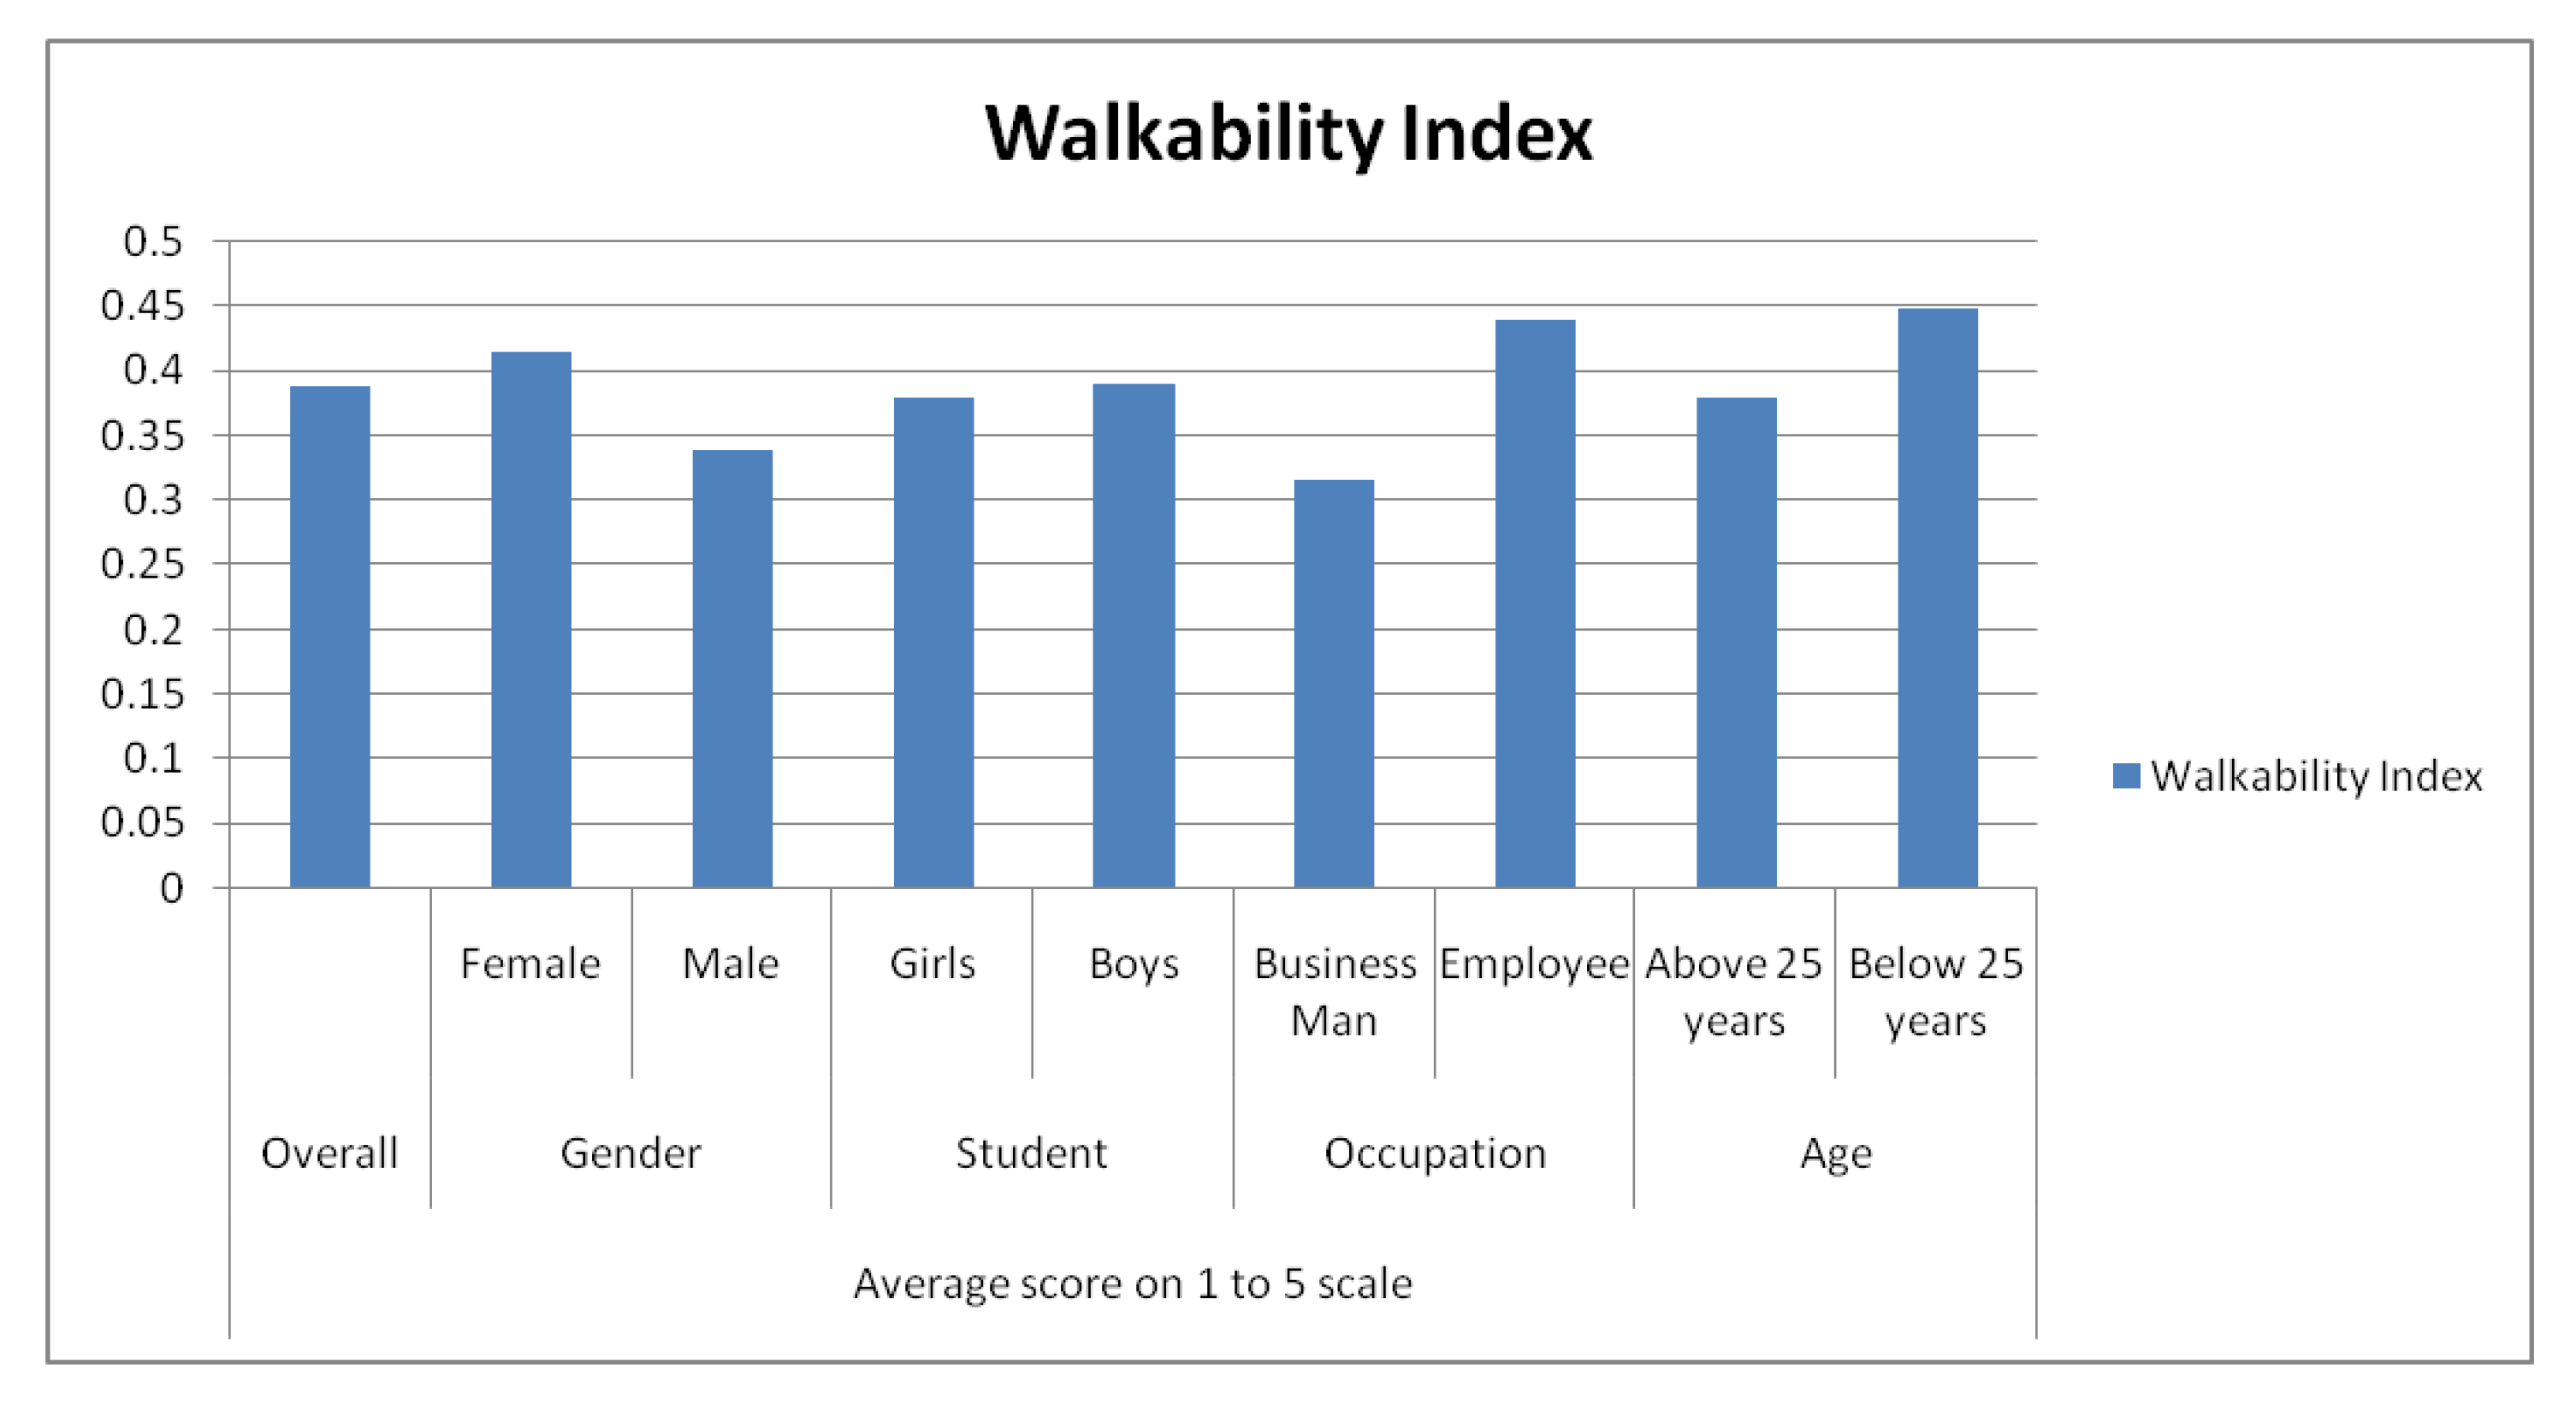

Table 1.
shows the average pedestrian ratings for each group based on survey.
| SL.No | Attribute | Average rating on a scale of 1 to 5 | ||||||||
|---|---|---|---|---|---|---|---|---|---|---|
| Overall | Gender | Student | Occupation | Age | ||||||
| Female | Male | Girls | Boys | Business Man | Employee | Above 25 years | Below 25 years | |||
| 1. | The height of the walkway is suitable. | 3.01 | 2.34 | 3.36 | 2.9 | 3.4 | 2.56 | 3.5 | 2.67 | 3.4 |
| 2. | The path is wide enough. | 3.39 | 3.15 | 3.77 | 3.1 | 3.45 | 3.0 | 3.97 | 3.0 | 3.75 |
| 3. | The surface is flat and smooth. | 2.84 | 2.45 | 3.66 | 3.0 | 1.75 | 2.0 | 3.54 | 2.8 | 3.5 |
| 4. | The walkway is uninterrupted. | 3.73 | 3.32 | 3.76 | 4.5 | 3.7 | 3.45 | 3.83 | 3.5 | 3.78 |
| .5. | Ramps are provided for connection to the carriageway. | 2.42 | 2.33 | 2.9 | 2.1 | 2.5 | 2.1 | 2.6 | 2.2 | 2.6 |
| 6. | Nighttime illumination is adequate. | 2.39 | 2.16 | 2.45 | 2.1 | 2.4 | 1.95 | 2.8 | 2.4 | 2.9 |
| 7. | A traffic separator, such as a pipe railing, is installed. | 2.91 | 3.20 | 3.76 | 2.3 | 3.4 | 2.5 | 2.75 | 2.4 | 3.0 |
| 8. | The entire width is unobstructed and fully accessible. | 3.52 | 3.0 | 3.66 | 2.7 | 4.0 | 3.15 | 4.0 | 3.7 | 4.0 |
| 9. | Walkways are well-maintained and regularly cleaned. | 3.6 | 3.5 | 4.4 | 1.2 | 4.5 | 3.67 | 4.0 | 3.5 | 4.0 |
| 10. | A raised continuous crossing is available. | 2.01 | 1.5 | 2.33 | 1.6 | 2.0 | 1.66 | 2.0 | 2.0 | 3.0 |
| 11. | The walkway is found on the carriageway’s proper side. | 3.49 | 2.5 | 3.66 | 3.2 | 3.6 | 3.54 | 4.0 | 3.4 | 4.0 |
| 12. | Connectivity | 3.06 | 3.5 | 4.3 | 4.6 | 1.3 | 3.67 | 4.0 | 3.5 | 4.0 |
| 13. | Zoning and Way finding | 2.27 | 2.4 | 2.17 | 2.4 | 2.5 | 1.7 | 2.6 | 2.1 | 2.3 |
| 14. | Safety and Security | 2.67 | 3.57 | 2.2 | 3.1 | 1.9 | 2.2 | 3.55 | 1.4 | 3.5 |
| 15. | Walkway Characteristics | 3.5 | 2.5 | 3.66 | 3.3 | 3.6 | 3.54 | 4.0 | 3.4 | 4.0 |
| Average | 2.98 | 3.16 | 3.33 | 2.8 | 2.93 | 2.71 | 3.4 | 2.79 | 3.44 | |
| Walkability Index | 0.389 | 0.416 | 0.34 | 0.38 | 0.39 | 0.317 | 0.44 | 0.379 | 0.449 | |
Disclaimer/Publisher’s Note: The statements, opinions and data contained in all publications are solely those of the individual author(s) and contributor(s) and not of MDPI and/or the editor(s). MDPI and/or the editor(s) disclaim responsibility for any injury to people or property resulting from any ideas, methods, instructions or products referred to in the content. |
© 2024 by the authors. Licensee MDPI, Basel, Switzerland. This article is an open access article distributed under the terms and conditions of the Creative Commons Attribution (CC BY) license (http://creativecommons.org/licenses/by/4.0/).
Copyright: This open access article is published under a Creative Commons CC BY 4.0 license, which permit the free download, distribution, and reuse, provided that the author and preprint are cited in any reuse.


