
Submitted:
12 March 2024
Posted:
13 March 2024
You are already at the latest version
Abstract
In Yaoundé, Cameroon, where walking is a leading transport mode, pedestrian safety remains an issue as they account for a fair share of road traffic casualties, partly due to the lack of walking policies and data on pedestrian facilities safety, hindering targeted intervention. This study investigated road segments using the Pedestrian Safety Index (PSI) and the Global Walkability Index (GWI) across 12 key roads frequented by diverse pedestrian groups, especially students. The indexes were graded from E to A and analyzed using description and rank correlation analysis. Only one segment (R7) achieved a grade C, while the remainder scored D or E, indicating poor pedestrian safety conditions and unpleasant walking experience. The strong correlation coefficient (0.69) between the PSI and GWI at a 99% significance level validated the safety assessment, providing confidence in the safety results. Leveraging these findings, a seven-year (2024-2030) safety strategy was developed aiming to upgrade all roads to grade B. This strategy contains interventions including engineering improvement, proven effective. The study offers evidence for city officials to improve pedestrian safety and informs walking policies development and upcoming projects implementation. Future research should include more road segments and validate indexes with crash or conflict data.
Keywords:
Road safety
; Pedestrian Safety
; Urban environment
; LMICs
; Pedestrian Safety Index
; Global Walkability Index
1. Introduction
Road traffic injuries are a major public health problem and a leading cause of death and injury around the world.
Each year, road traffic crashes result in over 1.19 million fatalities and 50 million injuries or disabilities worldwide, causing immense human suffering and significant economic losses, typically equating to 3% of a country's Gross Domestic Product (GDP) [1]. Shockingly, despite possessing only 60% of the world's vehicles, low- and middle-income countries (LMICs) bear a disproportionate burden, accounting for a heart-wrenching 92% of these fatalities [1], which can represent up to 6% of their GDP [2]. Vulnerable road users (VRU), including cyclists, motorcyclists, and pedestrians, are unfortunately the most affected, representing over 50% of global road traffic deaths.
1.1. Generality
According to the European Road Safety Observatory, pedestrian road users are “person on foot; person pushing or holding bicycle, person who uses a wheelchair, a pram or a pushchair, leading or herding an animal, riding a toy cycle on the footway, person on roller skates, skateboard, or skis. Does not include persons in the act of boarding or alighting from a vehicle” [3]. Pedestrians are among the most vulnerable road user groups. They have a low and vulnerable position on the road, they usually do not wear protective clothing or safety equipment like cyclist and motorcyclist [4], and they are outside motorized vehicle, so they do not benefit from the metallic protection offered by these vehicles [5], making them prone to a high risk of death and injury in the event of vehicular collision as there is little or no external protective shield that could absorb the impact of the collision [6]. This is because the kinetic forces resulting from differences in the mass and speed of various types of vehicles largely determine the severity of a road crash [7]. The latest global assessment of road safety of the World Health Organization (WHO) indicates that pedestrian account for 26% of all road fatalities, which correspond to 309,400 pedestrians deaths in road traffic crashes in 2021 [1]. Pedestrian deaths have risen at nearly twice the rate of road crash deaths and per kilometer travelled, pedestrians are nine times more at risk of death than car occupants [8]
In Europe, 98% of fatalities in pedestrian related crashes are pedestrians themselves, representing 20% of all road fatalities or 4,628 deaths in 2019 [3] and 3,608 deaths in 2021 [9]. In Australia, 12% of deaths from road traffic crashes in 2020 were pedestrians [4]. Similarly, the Center for Disease Control and Prevention revealed that 8,000 pedestrians were killed in road traffic crashes in 2021 in the United Sates, accounting for 17% of the road traffic deaths in the Country. There were also an estimated 104,000 emergency department visits of pedestrians treated for non-fatal crash-related injuries in 2020 [10].
According to the World Health Organization (WHO), there are several risk factors that put pedestrian at risk of crashes, but also death and serious injuries as a result. These factors include speeding, alcohol impairment, inadequate visibility of pedestrians on roads and lack of road infrastructure for pedestrians [11].
The speed at which a car is travelling influences both crash risk and crash consequences [12,13]. The higher the speed of a vehicle, the shorter the time a driver has to stop and avoid a crash, including hitting a pedestrian [14], the higher the energy released during the collision and the higher the risk of death and injury for the pedestrian [7]. Research showed that an adult pedestrian hit by a car moving at 30 km/hr has 99% chance of survival and if hit at 50 km/hr has 80% chance of survival [15]. A meta-analysis of 20 studies assessing the risk of fatality for pedestrians revealed that for every 1 km/hr of speed increase above 30 km/hr, the chance of pedestrian death increases by 11% [16].
Alcohol consumption results in impairment, which increases the likelihood of a crash because it produces poor judgement, increases reaction time, lowers vigilance, and decreases visual acuity, not only for vehicle drivers [17] but also for pedestrians [18]. In the United Sates in 2021, 19% and 30% of crashes that resulted in pedestrian deaths involved a driver and a pedestrian with a blood alcohol concentration (BAC) of at least 0.08 grams per deciliter (g/dL) respectively [19]. Similarly in Australia, approximately one third of all fatally injured adult pedestrians between 1999-2001 were found to have a BAC exceeding 0.08 to 0.1 g/dL [20].
Inadequate visibility of pedestrian is equally associated with increased risk of pedestrian related crashes [21,22]. Poor visibility of pedestrians arises from pedestrians sharing road space with fast-moving vehicles, using motor vehicles that are not equipped with lights, inadequate or lack of roadway lighting [23,24] and pedestrians not wearing reflective accessories or brightly colored clothes [25], especially at night where the risk is greater [26].
Several road parameters are also associated with increased pedestrian crash risk including undivided roads with greater number of lanes [27], lack of protection from motor vehicles [28], lack of wide, grassy walkable areas [29], lack of buffers between the road and the sidewalk [30], intersections without marked pedestrian crosswalks, and locations lacking sidewalks or pedestrian pathways [31].
Despite the evidence on the risk factors associated to pedestrian crashes, the phenomena keep on rising, mainly due to the failure of government to implement road design and land use planning providing infrastructure facilities and traffic control mechanisms that separate pedestrians from motor vehicles and enable pedestrians to cross roads safely [11]. As a results, 80% of pedestrians globally travel along unsafe roads [1].
In Cameroon, as in numerous other African nations, road traffic fatalities remain a major health issue. Current data shows Cameroon's traffic death rate at 11 per 100,000 population, despite the country having only 31,590 vehicles [1]. Pedestrians are among the most exposed and this has been the case for a long time. In 2001 for instance, 29% of the injured and 26 % of the deaths from road traffic crashes in Cameroon were pedestrian, mainly attributed to lack and inadequate pedestrian facilities constraining pedestrian to navigate on the carriageway [32]. In 2016, almost 15 years later, 11% of road traffic deaths in Cameroon in 2016 were pedestrian according to World Bank estimates [33].
According to the World Health Organization, Cameroon does not have national technical standards for news roads that take account of all road users including pedestrian or align with relevant UN convention and regulate compliance with them [1]. Roads in Cameroon do not always have pavements for pedestrians, let alone lanes for buses and/or taxis, or cycle paths [34]. In fact, less than 0.5% of the roads network in Cameroon, include adequate pedestrian facilities [35]. Most of the few roads and pedestrian facilities are poorly maintained, unsafe at all times of the year [36] and clogged with obstacles like cars, bike and streets vendors [35,37]. Yaoundé is particularly affected since 18% of road users are pedestrians [38] generating almost 35% of all the daily trips in the city (Bachmann et al., 2019). In 2007, 6,234 injured people were observed at Central Hospital of Yaoundé's emergency ward during the year 2007. Nearly 60% of the injuries were due to road traffic crashes, 46% of which involved pedestrians [39]. In 2014, in a hospital-based pilot surveillance study, 34% of the 1,655 road traffic crashes victims enrolled were pedestrian [40]. Some efforts to improve pedestrian safety in Yaoundé exist [34], but the issues still pertain. In fact, analysis of 2021 law enforcement agency statistics show that Yaoundé account for most of road traffic crashes in Cameroon, partly due to absence of sidewalk, poor road geometric alignment, lack of access control, absence of crosswalk and lack of channelization at intersections (Michel et al., 2020). Pedestrian deaths are potentially underestimated, as there is a usual under reporting of pedestrian related crashes in law enforcement records [7].
Several engineering interventions to improve pedestrian safety have been proven effective when properly implemented. These include road lighting [41], road narrowing with refuge island [29], raised pedestrian crossing [29,42], reducing speed with 30km/h posted speed limit [43] and traffic calming measures (speed hump, speed table, speed cushion, tight corner radii, etc..) [44,45,46]. Investing in road safety and in pedestrian facilities does not only yield safety benefits, but also health, economic and environmental benefits as a result of increased active mobility. A review of 17 studies showed that commuting by walking or cycling decreased all-cause of mortality by 9% and cardiovascular mortality by 15% [47]. Walking improves mental health, brain health and cognitive function, sleep outcomes, improves self-esteem, overall quality of life and the sense of well-being [48,49,50]. A study conducted by the WHO in Accra, Ghana found that investing in walking and cycling infrastructure could save up to 33,000 lives from increased physical activity over a 35-year period, for a total of USD15 billion from averted healthcare costs [51]. Economic benefits of walking are visible in retails as people who walk or cycle spend up to 40% more over the course of a month that people who drive [52]. After New York City pedestrianized Times Square, the area saw a 22% increase in economic activity compared to a 9% percent increase across the rest of the city [53]. Walking is also viewed as a zero-carbon mode and is associated with a decrease in emission. For instance, the pedestrianization of New York’s Times Square also led to a 60% decrease in nitrous oxide pollution levels and a 41 % reduction in nitrogen dioxide [54]. The implementation of effective and targeted transport and urban planning strategies towards pedestrian safety required clear and detailed evidence of pedestrian safety in relation to the existing transport infrastructure [55].
Survey and interview, walkability index, facilities level of service, and pedestrian safety index are among the most used methods in the literature to investigate the safety of pedestrians in respect to the existing facilities [56,57,58,59,60,61,62,63,64,65].
Surveys and interviews consist of pedestrians self-reporting their walking attitude, their user experience of walking facilities and their general satisfaction toward land use and street type. They are particularly useful not only to gather data on the unique perspective of the pedestrian who are the center of all policies [64]. The largest and most recent survey study is called ESRA (E-Survey of Road Users’ Attitudes), an international online consultation of road users in 60 countries on 6 continents to gather road user behavior including pedestrian but also their perception of safety with regards to walking in other to provide evidence and make international comparison. The first edition of the survey was launched in 2015, and the third 2023 [66]. Survey also allow to analyze the potentials contributing factors (socio-demographics, environmental and infrastructure) affecting pedestrian general satisfaction [67]. However, results from survey are subjective, depend on each respondent perspective and do not provide a clear an objective representation of the state of pedestrian facilities [58].
The walkability index is an assessment method used in determining the environmental quality measures for walking activities [63]. It is a composite approach combining several components (urban life, land use, pedestrian facilities) identified as correlated to increased walking [68,69] in order to capture their co-occurrence, to reduce multicollinearity, and to create actionable index for policy applications compared to individual components [70,71]. There are various methods to compute the walkability index [72,73,74,75]. A pioneer index is the Global Walkability Index (GWI), made of 14 indicators related to the state of pedestrian facilities, behavior of motorized vehicles, availability of funding, stands, guidelines and regulation related to pedestrian safety. Developed by Krambeck in 2006, at the request of the World Bank, the index was applied in location in Washington, Beijing, and New Delhi [76]. In Jakarta, Indonesia, Muhammad used a modified version of the GWI and found that walkability increased by 38.98% in Sudirman-Thamrin central business district as a result of improvement in pedestrian facilities [56]. In an Africa context, the World Bank recently used a global walkability index composed of indicate related to urban life, pedestrian facilities, and safety to conduct a sidewalk safety assessment in Addis Ababa, Ethiopia and provided recommendation to improve pedestrian safety [77].
The Pedestrian Level of Services (PLOS) is another indicator used to assess pedestrian facilities. On the contrary of the walkability index, the PLOS usually also considers the pedestrian flow, if it’s properly served by pedestrian facilities [59]. The PLOS include criteria, such as security, convenience, comfort and attractiveness and studies have focused on applying this approach at intersections, sidewalks [78,79], midblock [80], stairways [81] and segments [82,83]. However, most of these LOS models have not focused on pedestrian safety [84,85,86]. To alleviate this, several studies have developed index focusing on pedestrian safety.
In 2012, during a pedestrian safety evaluation program, Tanaka developed a pedestrian safety index, to evaluate safety of pedestrian at intersections in the city of Ottawa [87]. Considering the exposure of pedestrian to motorized vehicle, some authors have also proposed a pedestrian risk index, measuring the likelihood and severity of potential crashes resulting from vehicles – pedestrian conflicts [60,88]. Most of the pedestrian safety evaluation methods have overlooked roadway segment and have focused on intersection, crosswalk, and midblock crossing [89,90,91]. As an attempt to overcome this, Asadi-Shekari led a study in which they developed a Pedestrian Safety Index (PSI) that consider both roadway segments and intersection and evaluates the essentials needs of pedestrian that ensure they safety while walking [92]. The PSI also considers the special demands of vulnerable pedestrians including older and disabled. The PSI was successfully applied to a collector street in Singapore, to identify pedestrian safety issues and propose improvement [92].
In Cameroon, few studies have tried to investigate pedestrian safety, mainly relying on pedestrian perception of safety rather than assessing the facilities. In Bamenda, Cameroon, in an interviewed based study assessing the state of the road infrastructure, 68.1% of the respondent found the road unsafe for pedestrian [93]. During the second edition of the ESRA survey in Cameroon, 98.5 % of the respondent reported using walking as a mode of transport with a mitigate feeling of safety while walking [94]. Study quantitatively assessing safety of road infrastructure for pedestrian in Cameroon, including Yaoundé are lacking, hindering the possibility to plan and implement evidence based actions [95]. As a matter of fact, the UN habitat reveal that there are no walking and cycling policies in Cameroon and pedestrian safety remain a problem as they account for 12% of road traffic deaths, and 22% of road traffic injuries every year [55], mainly due to poor quality of road infrastructure [38]. In Yaoundé, where walking is the main mode of transport, unsafe pedestrian facilities, lack of sidewalk combined with chaotic traffic poses a major threat to pedestrian’s safety, who are responsible for almost 4 million trips every days [95,96]. It is thus important to investigate pedestrian safety in Yaoundé, to unveil evidence of the issues necessary for targeted intervention, which is the intent of this work.
1.2. Aim
The objective of this study is to investigate the safety of pedestrians along selected streets in Yaoundé, using a sound methodology and to propose actions to improve the safety of pedestrians, but also the walkability and livability of the city.
This work is sequenced as follows: introduction, materials and methods, results, and discussion, and lastly conclusions and future research.
To the best of the author’s knowledge, this work is among the first quantitatively investigating the safety of pedestrian along the streets of an urban area in Cameroon, from the facilities viewpoint.
Therefore, this study is expected to be a valuable contribution to the body of road safety research in this context, providing quantitative insights on pedestrian safety issue, important for elaborating evidence-based intervention, using a method easily replicable in the other cities.
2. Materials and Methods
2.1. Study Context
Yaoundé is the political capital of Cameroon, the second-largest city in the country after Douala, with a total population of 4,100,000 inhabitants with an annual growth rate of 3.5% [96]. It is monocentric, dominated by the tertiary sector (4 out of 5 jobs) and essentially the informal sector, for a low average income level. The city covers a road network estimated at 4,762 km with only 300 km asphalted, composed of 64 km of primary roads and 236 km of secondary and tertiary roads. The transport and mobility system are not efficient, with a lack of public transport service, slow, irregular, and uncomfortable transport option, in addition to congestion and pollution [96]. Safety is also a major issues for mobility in Yaoundé, where road traffic crashes cause around 1,000 deaths and 5,000 serious injuries per year [96]. Particularly affected are pedestrians, as walking is the main mode of transport in the city, yet pedestrians are exposed to a higher risk of crashes, thanks to the flaws of the road infrastructure in accounting to their safety needs [95,96].
To investigate pedestrian safety in this study, the pedestrian safety index (PSI) [92] and the global walkability index (GWI) [77].
The PSI was chosen as it is comprehensive approach that covers both roadway segments and intersection, considers the safety needs of pedestrian of different category including older and disabled people, uses the point system incorporating various safety factors, is based on numerous guidelines and research-based quality standards, and is transferable and easily applicable in a areas with similar context to Yaoundé [92].
The GWI developed by the World Bank was chosen to complement the assessment from the PSI as it includes in addition pedestrian facility, addition factors related to the existing activities, the urban life, the urban furniture, etc., providing different perspective of the walking friendliness of the streets. In addition, the WI is transferable, and was successfully applied in Addis Ababa, Ethiopia, which as similar context to Yaoundé [77].
2.2. Pedestrian Safety Index
The following description the Pedestrian Safety Index (PSI) is derived from [92]. The PSI considers 24 safety indicators carefully identified from over 19 guidelines developed in various countries. The PSI is computed using Equation 1
where:
- PSI = the Pedestrian Safety Index
- i = the indicator number
- c = the coefficient of safety indicator
- SI = Safety Indicator score
The coefficient (c) associated with the safety indicators represents their effectiveness in determining the PSI. It indicates the importance and priority of each indicator within the evaluation. The coefficient is determined by assessing the significance of the indicator across different guidelines including [97,98,99,100,101,102,103,104,105,106]. Table 1 presents the number of guidelines (N) that evaluate the indicator i with the depth of evaluation j (how complete was the indicator fully addressed in the guidelines).
The coefficient of each safety indicator is then computed using Equation 2
where:
- c = the coefficient of safety indicator
- i = the indicator number
- j = depth of the evaluation number
-
D = depth of the evaluation
- ▪
- D1 (incomplete)
- ▪
- D2 (semi complete)
- ▪
- D3 ( complete)
For instance, c1 = 1 x 7 + 2 x 0 + 3 x 10 = 37
Table 2 displays the value of the coefficient of each of the 24 pedestrian safety indicators. e coefficient of each safety indicator is then computed using Equation 2
With all the coefficient values obtained, only the SIi is needed to achieve the PSI. A comparison of design standards of the combined guidelines (combined standards for each indicator) with the actual street conditions is used to calculate the SIi. This is to display the extent to which a street meets the universal pedestrian safety standards. SIi value lies between 0 and 1, representing respectively the lowest and highest compliance of the safety indicators with standards according to several points or conditions to be fulfilled. The standards values of the safety indicator were derived from [92] and from the National Association of City Transportation Officials (NACTO) guides. Especially the urban street design guidelines [107] and the global street design guidelines [108].
To facilitate the understanding of the PSI value in a special rating system, the PSI% is defined. The PSI% value is PSI rating, meaning the percentage of the existing PSI relative to the ideal PSI. The ideal PSI occurs when compliance with the standards occurs for all indicators and when all SIi are equal to 1. The PSI% is computed with Equation 3.
where:
- PSI% = Percentage of pedestrian safety index,
- PSI = Pedestrian safety index
- i = the indicator number
- c = the coefficient of safety indicator
Table 4 shows various classifications for the PSI rating and their interpretations.
As illustration, using data from Table 2, Table 3 and Table 4. PSI = (37 x 1) + (39 x 0.89) + (17 x 0.5) + (28 x 1) + (32 x 0.4) + (38 x 0.47) + (32 x 0.82) + (22 x 0.81) + (32 x 0.25) + (15 x 1) + (39 x 1) + (9 x 0.81) + (23 x 1) + (31 x 0) + (24 x 0.81) + (18 x 0) + (34 x 0.82) + (5 x 0) + (31 x 0.83) + (7 x 0) + (17 x 0.76) + (15 x 1) + (25 x 0.82) + (27 x 0.44) = 408.57.
PSI% = 100 x (408.57/597) = 68, thus the PSI grade for this street (Canberra Road in Singapore) is B.
Further details on the PSI formulation, the definition of each safety indicator, the standards value for each indicators, the criteria to assess them depending on the road type (arterial, collector, local, access), the computation of the coefficient of safety indicator, the computation of the safety indicator score and the pedestrian safety index can be found here [92]. Additional details on the standard values of some indicators can be found in the NACTO urban street design.
2.3. Walkability Index
The Global Walkability Index (GWI) developed by the World Bank was adopted from a similar index built up by the Institute for Transportation and Development Policy [77]. The index quantifies sidewalk walkability based on 9 variables related to the urban inventory notably the urban life and sidewalk conditions (permeable fronts, access to public transport systems, sidewalk dimensions, and pavement conditions), the urban furniture (trees, benches, lighting, and obstacles) and finally the pedestrian crossings, universal accessibility, and safety perception. The GWI is computed using Equation 4.
where:
- GWI = Quantification of the global index the Pedestrian Safety Index
- i = the variable number
- V = Score of the variable
- Y = Weight of the variable
The method to compute the value of the score V of each variable is illustrated in Table 6. The method is derived from [77] and [92].Just like for the SIi, the standards values of the variables were derived safety indicator were derived from the urban street design guidelines [107] and the global street design guidelines [108].
Just like with the PSI, the GWI% was also defined and the same classification level (Class E to A) was used. The GWI% is computed with Equation 5.
where:
- GWI% = Percentage of global walkability index, the rating value
- GWI = Global walkability index
- i = the variable number
- Y = Weight of the variable
Further details on the Global Walkability Index can be found here [77]
2.4. Data Collection
2.4.1. Site Selection and Timing
The study area was composed of two zones, selected by prioritizing high pedestrian hub and by considering diverse profiles, especially students who are particularly exposed as they principally rely on walking for its affordability. The first zone was around the central post and the second zone was around the University of Yaoundé I.
The first zone was around the central post. As previously stated, Yaoundé is monocentric, and the central post zone represents the principal heart of the city, the main attraction, with most of the administration, the commercial center, most of the services such banks, insurance companies and formal and informal commerce activities [109].
The second zone was around the University of Yaoundé I. As the capital of Cameroon, Yaoundé is home to a large share of the schools in the countries, from the primary level up to the advances level. With respect to the later, the University of Yaoundé I is not only considered as the best public university in the city [110], but also the second largest by number of students enrolled [111]. Coincidentally, the zone around the University of Yaoundé I also include the Faculty of Medicine and Biomedical Sciences (FMSB), the National Advanced School of Engineering (ENSP), and the National Advance school of Public Works (ENSTP), which are respectively the leading and largest medical and engineering schools in the city.
In total, 12 road segments were selected (see Table 7), which are essentially the main arteries to the two identified zones.

Table 6.
List of Road segments investigated.
| Start | End | ||||||
|---|---|---|---|---|---|---|---|
| Zone | Road ID | Name | Latitute | Lontitute | Latitute | Lontitute | Length |
| 1st | R1 | Avenue monseigneur vogt | 3.862448 | 11.520995 | 3.865283 | 11.522058 | 350m |
| R2 | Avenue de l’independance 1 | 3.865392 | 11.5219 | 3.866437 | 11.52064 | 190m | |
| R3 | Avenue Kenedy | 3.866020 | 11.520468 | 3.863182 | 11.520002 | 350m | |
| R4 | Avenue Ahidjo | 3.862918 | 11.520542 | 3.866200 | 11.517093 | 550m | |
| R5 | Avenue de l’independance 2 | 3.867472 | 11.517860 | 3.867080 | 11.520097 | 350m | |
| R6 | Rue Goker | 3.866222 | 11.520272 | 3.864765 | 11.518820 | 230m | |
| R7 | Boulevard du 20 Mai | 3.861663 | 11.520118 | 3.865794 | 11.515625 | 700m | |
| 2nd | R8 | Carrefour GP - Carrefour EMIA | 3.862886 | 11.494085 | 3.862244 | 11.503976 | 1200m |
| R9 | Rue Elig Effa | 3.864023 | 11.496598 | 3.867354 | 11.495855 | 1200m | |
| R10 | Mini Ferme - Chapelle Elig Effa | 3.867354 | 11.495855 | 3.869919 | 11.498435 | 400m | |
| R11 | Carrefour EMIA - Chateau | 3.862295 | 11.504052 | 3.856377 | 11.503734 | 750m | |
| R12 | Chateau - Cradat | 3.856377 | 11.503734 | 3.852437 | 11.498658 | 800m | |
2.4.2. Data of Interest and Measurement Procedure
The data collection was done unobtrusively and while respecting the safety regulations. The observers were equipped with clipboards, pen, stopwatch, data collection sheet and the necessary authorization.
The data of interest were essentially related to road, traffic and environment parameter related to the 24 indicators (see Table 1 and 3) of the Pedestrian Safety Index and the 9 variables of the Global Walkability Index (See Table 5 and 6). The road and environment parameters were collected using prepared dedicated sheets. The speed data was collected by recording video of the traffic and subsequently using the application Speed Xpert to compute the average speed. To validate the results from the application, a pilot test was conducted at one location. Typically, the stopwatch method was conducted to collect the speed data while the traffic was recorded. The speed results from the stopwatch method and the Speed Xpert were consistent. To ensure speed value are actual representation of the speeding attitude in the location, the video recording of the traffic was long enough to ensure at least 250 vehicles are recorded, corresponding to a sufficient sample size for speed metrics calculation in this traffic environment [112]. The data collection took place between December 2023 and January 2024, for 14 days spread over four weeks at a rate of 1 day per road segment (8h of actual data collection each day), except for road R8 and R9 which each required two days.
2.5. Data Analysis
After the data collection, the physical sheets were reproduced into Microsoft Office Excel spreadsheet for easier manipulation. During this process, quality control and data cleaning were conducted to ensure the data is consistent and in proper format for analysis. The speed values were extracted from Speed Xpert and added to the excel dataset. The main computation was the Pedestrian Safety Index (PSI) and the Global Walkability Index using the formula presented in section 2.2 and 2.3 respectively. To automate the computation, a custom Visual Basic for Applications (VBA) program was developed and integrated into Excel. To ensure the accuracy and reliability of the program, the data from the article originally developing the PSI was used to compute their PSI and the program was able to generate similar values.
3. Results and Discussion
3.1. Pedestrian Safety Index
Table 7 shows the global results of the 24 safety indicators, the 12 PSI, the 12 PSI% and the 12 grades for all the 12 roads segments inspected.
- SI1: Slower traffic speed
The average speeds on all the road segments were lower than 50km/h, except for road segments R7 “Boulevard du 20 Mai” where the averages speed value was almost a safety km/h as the road is very wide (2x2) and in good condition. As a result, expect for R7 (SI1 =0), all the road segments have a safety indicators value of 1, indicating that their lower average speed makes them safer for pedestrian than R7 [12,13].
- SI3: Fewer travel lanes
Expect for R7 (2x2 road), the number of lanes per travel direction for all road section was 1 (1x1 road). However, both values being lower or equal than 2, the safety indicator for all road segments was found to be 1, as fewer travel lanes mean less crossing distance for pedestrians, limited exposure time to motorized vehicle, and increase safety for pedestrian [27].
- SI5: Shorter crossing distance (mid-block crossing)
Among all road segments, only R7 had standards midblock crossing for pedestrians to cross the road. Consequently, the safety indicators values are zero for all the road segments except for R7 (SI5 = 0.92).
- SI7: Footpath Pavement
All the road segments had some sort of sidewalk. R7 “Boulevard du 20 Mai” (SI7 = 0.99) and R8 “ Carrefour GP - Carrefour EMIA ” (SI7 = 0.96) have the highest safety indicator as their sidewalk were in almost the total length of the road segment and in relatively good condition. On the other hand, R9 “ Rue Elig Effa ” (SI7=0.28), R10 “ Mini Ferme - Chapelle Elig Effa ” (SI7=0.28) and R12 “ Chateau - Cradat ” (SI7=0.16) had the lowest proportion of sidewalk, in bad condition for the most, increasing the risk of crash for pedestrian [31].
- SI8: Marking (crosswalk)
As previously seen, only R7 had standards midblock crossing for pedestrians. However, the marking was not always clearly visible and quite clear for pedestrians. This is why the safety indicator for R7 is a medium value (SI8=0.5). The value is still greater than all the other road segments who didn’t have marked crosswalk for pedestrians.
- SI9: Pedestrian refuge and median
Among all road segments, only R8 “ Carrefour GP - Carrefour EMIA ” had a median in the middle of the road for pedestrian to mark a stop while crossing the roads but the design of the median was not adequate (e.g width less than 1m). Consequently, the safety indicator was only 0.25, which is still greater than for all the other road segment (SI9=0).
- SI11: Sidewalk on both sides
Similarly to SI7, R7 (SI11 = 0.99) and R8 (SI11 = 0.96) have high safety indicator as their sidewalks were not only in better condition (pavement) but also on both side of the roads. On the contrary of SI7 which was 0.56 (average condition of sidewalk pavement), the safety indicator for R2 “ Avenue de independence 1” is 1 as the sidewalk were present on both sides on the total road length. The safety indicator for most the road was also hight expect only R9 “ Rue Elig Effa ” ( SI11 = 0.25) and R12 “ Chateau - Cradat ” (SI11 = 0.29) which had the lowest proportion of sidewalk on both sides.
- SI13: Driveway
The safety indicator for most of the road segments is 1 as there were no driveways, limiting the exposure of pedestrians walking on the sidewalk to motorized traffic coming in/out the driveway. However, there were some drivers in road sections R1, R5, R8, R11 and R11, explaining the lower values of their safety indicators.
- SI14: Lighting
In general, the lighting was not adequate on all the 12 road segments, increasing the risk of crash for pedestrian, especially at night [23,24]. The lighting condition was better on R1, R3, R4, R5, R6, R7 with a safety indicator of 0.6 compared to the remaining road section. This is due to the fact that they had the highest proposition of road length covered by pedestrian lighting.
- SI15: Signing
As previously seen, only road segment R7 had midblock crossing for pedestrians to cross the road even though the marking was not always visible. In addition, there was a general lack of sign signalize in the presence of the crosswalk to pedestrian and especially motorized vehicle. Consequently, the safety indicator for R7 was only 0.25. The safety indicator was all the other road segments was 0 for obvious reason (no crosswalk).
- SI17: Slope
The road segment R7 "Boulevard du 20 Mai" (SI17 =1) and R3 "Avenue Kenedy" (SI17 =0.84) stand out with the highest value of the safety indicator. This is due to the fact that the slope of the sidewalk on these roads was adequate (less than 2%) in almost all the proposition of the length. The proportion of sidewalks with adequate slope was lower for road segments R9 "Rue Elig Effa (SI17=0.56) " and R10 "Mini Ferme - Chapelle Elig Effa" (SI17=0.56) but relatively acceptable. For the reaming road segments, the proportion of sidewalks with adequate slope was very low, indicating lowest safe experience of using these sidewalks by pedestrian (loss of stability, risk of falling, etc.)
- SI22: Ramp
All roads’ segments except R7 have a safety indicator of 0, as there was no ramp provided for Person with Disabilities (PwD) along these road segments. R7"Boulevard du 20 Mai" stands out with a safety indicator of 0.5 as there were few ramps provided in some sections of the road segment. While not at the highest level, this suggests that this road segment is the most PwD friendly, especially for pedestrians with mobility impairments or using wheeled devices [113].
- Others safety indicators
The remaining safety indicator had a value of zero across all the 12 road segments. This can be explained by the fact that on the 12 road segments, there was no buffer and barrier (SI2=0), no curb extension (SI4 =0), no trees (SI6 =0), no corer islands ( SI10 =0), no advance stop bar (SI12 =0), no bollards along the road segments (SI16 =0), no pedestrian lift (SI18 = 0), no curb ramp (SI19 =0), no tactile pavement or guiding tiles for pedestrian with visual impairment (SI20 =0), no warning tiles along the road segments (SI21=0) and no accessible (to all users including PwDs) and adequate pedestrian signal (SI24 =0).
- Overall observation
The road segment R7 "Boulevard du 20 Mai" was the safer road segment for pedestrian, with a PSI of 241.56, representing approximately 40.5% of the maximum PSI achievable. This PSI value correspond to a grade of C, indicating low to average quality requiring attention for improvement. Similarly, roads segment R3, R8, R4, R6, R10, R2, R11, R5, R1, and R9 obtained a PSI value ranging from 210.6 (PSI rating of 35.3%) to 133.1 (PSI rating of 22.3%), falling under grade D, which signifies low quality and low safety consideration for pedestrian requiring considerable improvement. Road segment 12 had the lowest PSI value of 84.54, corresponding to 14.2% of the maximum PSI, resulting in a grade of E, indicating the lowest quality with unpleasant conditions requirement considerable improvement.
In comparison to the Canberra road in Singapore whose grade was B [92], all the road segment investigated felt at or below grade C, indicating the low pedestrian safety level of these road segments, calling for urgent and considerable improvement.
Table 7.
General results of the PSI.
| R 7 | R 3 | R 8 | R 4 | R 6 | R 10 | R 2 | R 11 | R 5 | R 1 | R 9 | R 12 | |
|---|---|---|---|---|---|---|---|---|---|---|---|---|
| SI1 | 0 | 1 | 1 | 1 | 1 | 1 | 1 | 1 | 1 | 1 | 1 | 1 |
| SI2 | 0 | 0 | 0 | 0 | 0 | 0 | 0 | 0 | 0 | 0 | 0 | 0 |
| SI3 | 1 | 1 | 1 | 1 | 1 | 1 | 1 | 1 | 1 | 1 | 1 | 1 |
| SI4 | 0 | 0 | 0 | 0 | 0 | 0 | 0 | 0 | 0 | 0 | 0 | 0 |
| SI5 | 0.92 | 0 | 0 | 0 | 0 | 0 | 0 | 0 | 0 | 0 | 0 | 0 |
| SI6 | 0 | 0 | 0 | 0 | 0 | 0 | 0 | 0 | 0 | 0 | 0 | 0 |
| SI7 | 0.99 | 0.86 | 0.96 | 0.72 | 0.8 | 0.28 | 0.56 | 0.58 | 0.82 | 0.8 | 0.28 | 0.16 |
| SI8 | 0.5 | 0 | 0 | 0 | 0 | 0 | 0 | 0 | 0.14 | 0 | 0 | 0 |
| SI9 | 0 | 0 | 0.25 | 0 | 0 | 0 | 0 | 0 | 0 | 0 | 0 | 0 |
| SI10 | 0 | 0 | 0 | 0 | 0 | 0 | 0 | 0 | 0 | 0 | 0 | 0 |
| SI11 | 0.99 | 0.96 | 0.96 | 0.87 | 0.95 | 0.75 | 1 | 0.89 | 0.98 | 0.89 | 0.25 | 0.29 |
| SI12 | 0 | 0 | 0 | 0 | 0 | 0 | 0 | 0 | 0 | 0 | 0 | 0 |
| SI13 | 1 | 1 | 0.67 | 1 | 1 | 1 | 1 | 0.5 | 0 | 0 | 1 | 0 |
| SI14 | 0.6 | 0.6 | 0.45 | 0.6 | 0.6 | 0.15 | 0.29 | 0.29 | 0.6 | 0.6 | 0.15 | 0.3 |
| SI15 | 0.25 | 0 | 0 | 0 | 0 | 0 | 0 | 0 | 0 | 0 | 0 | 0 |
| SI16 | 0 | 0 | 0 | 0 | 0 | 0 | 0 | 0 | 0 | 0 | 0 | 0 |
| SI17 | 1 | 0.84 | 0.39 | 0.24 | 0 | 0.56 | 0 | 0.21 | 0 | 0 | 0.56 | 0.08 |
| SI18 | 0 | 0 | 0 | 0 | 0 | 0 | 0 | 0 | 0 | 0 | 0 | 0 |
| SI19 | 0 | 0 | 0 | 0 | 0 | 0 | 0 | 0 | 0 | 0 | 0 | 0 |
| SI20 | 0 | 0 | 0 | 0 | 0 | 0 | 0 | 0 | 0 | 0 | 0 | 0 |
| SI21 | 0 | 0 | 0 | 0 | 0 | 0 | 0 | 0 | 0 | 0 | 0 | 0 |
| SI22 | 0.5 | 0 | 0 | 0 | 0 | 0 | 0 | 0 | 0 | 0 | 0 | 0 |
| SI23 | 1 | 0.86 | 0.39 | 0.21 | 0 | 0.56 | 0 | 0.21 | 0 | 0 | 0.56 | 0.08 |
| SI24 | 0 | 0 | 0 | 0 | 0 | 0 | 0 | 0 | 0 | 0 | 0 | 0 |
| PSI | 241.6 | 210.6 | 185.53 | 165.7 | 158.3 | 152.6 | 142.6 | 139.7 | 137.8 | 133.1 | 133.1 | 84.5 |
| PSI% | 40.5 | 35.3 | 30.6 | 27.8 | 26.5 | 25.6 | 23.9 | 23.4 | 23.1 | 22.3 | 22.3 | 14.2 |
| Grade | C | D | D | D | D | D | D | D | D | D | D | E |
| Rank | 1 | 2 | 3 | 4 | 5 | 6 | 7 | 8 | 9 | 10 | 11 | 12 |
3.2. Global Walkability Index
Table 8 shows the results of the 12 Global Walkability Index (GWI), the 12 GWI rating (GWI%) and the 12 grades for all the 12 roads segments inspected.
With respect to the nine variables of the Global Walkability Index, the conclusion is similar to the safety indicator of the PSI in terms of inadequacy of sidewalk (V2), poor pavement condition of footpath (V3), lack of street lighting pedestrian lighting (V5), lack of features for PwDs making crossing inaccessible and non-inclusive (V7), lack of crosswalk, average visibility of crosswalk marking, lack of crosswalk sign (V8), lack of trees (V9), in addition to average access to activities along streets, lack of bus stops (V1), lack of urban furniture (V4) and obstruction of sidewalk by vendors and illegal parking (V6).
Similarly to the results from the PSI, the road segment R7 "Boulevard du 20 Mai" was the most walkable to pedestrian with a GWI of 0.5056, representing 50.56% of the maximum walkability achievable. This GWI value correspond to a grade C, indicating average walkability. The roads segment R5, R3, R4, R8, R6, R1, and R11 obtained a GWI value ranging from 0.369 (GWI rating of 36.9%) to 0.261 (GWI rating of 26.1%), falling under grade D, which signifies low quality and uncomfortable walking experience. Road segment R10, R9, R2, and R12 had the lowest GWI values ranging from 0.155 (GWI rating of 15.5%) to 0.118 (GWI rating of 11.8%), resulting in a grade of E, indicating the lowest quality with poor walkability and unpleasant walking experience.
In comparison to results from Addis Ababa [77], all the road segment investigated felt at or below grade C, indicating a low walkability index an unsafe, poor and uncomfortable walking experience for pedestrian along these roads, calling for significant improvement.
In Table 5, Y1 (general area) values were used to compute GWI for R1 to R7, and Y2 (School area) values for R8 to R12
3.3. Comparison of Indicators
The objective of this comparison was to relatively validate the PSI and GWI. The assumption being that if the two index are valid, they should generate similar and coherent results not only qualitatively in term of the general description of pedestrian facilities (as previously seen) but also quantitatively in terms of the ranking of the 12 road segments inspected by PSI and GWI values (See Table 9). The Spearman’s rank-correlation was used to determine the level of agreement between the rankings obtained using the two indicators. The correlation coefficient is calculated from the two vectors of ranks for the samples: let {Xi; i = 1…n} and {Yi; i = 1…n} be the vectors of ranks for sample 1 and sample 2 respectively, the coefficient is computed using Equation 5 [114]:
where:
- Ps = Spearman’s rank-correlation coefficient (between -1 and 1)
- di = Differences between ranks
- n= Number of paired data sets.
A score of 1.0 represents perfect correlation and a score of zero indicates no correlation. The t-approximation for this statistic, T, is valid for samples of size 8 upwards, and is calculated using Equation 6 [114]:
It has approximately a t-distribution with n-2 degrees of freedom and can be used for a test of the null hypothesis of independence between samples (Ps =0). From Table 9, it can be seen that for 9 out of 12 road segments (R7, R5, R3, R4, R8, R6, R1, R11 and R12), the grade value is the same for both indexes. A similarity coefficient of 75% (100 x 9/12). It means that with respect to the grade, the two indexes are quite coherent, indicating a relative validity. Figure 1 and Table 10 display the results of the Spearman's rank-correlation analysis. A clear tendency can be seen from Figure 1 in terms of similarity of the ranking between the two indexes for the 12 road segments. The value of the Spearman's coefficient (0.69) indicates a strong positive correlation between PSI and GWI. Furthermore, ranking from the PWI and GWI do agree at the 99% significance level, providing further relative validation for the PSI and the GWI.
4. Recommendation
The UN habitat reveal that there are no walking and cycling policies in Cameroon. In Yaoundé, some efforts have been made to improve pedestrian safety in Yaoundé, mainly lead by the city officials [34], but the issues still pertain. All the 12-road segments were found to be of grade C or lower both for the PSI and the GWI, indicating a low level of safety and walkability. Although the study was limited to these 12 road segments, the same conclusion can be made in many other parts of the city. In fact, simple trips around the city by car or while walking allow one to observe the absence of pedestrian facilities in many parts of cities and the inadequacy or poor condition of the few existing ones. The states of the pedestrian facilities observed during the data collection (See Figure 2) are a real picture of the necessity of taking measures. This will require consolidated efforts from various actors centered around the city official. To this end, a pedestrian safety strategy for the city of Yaoundé is Proposed. The strategy covers seven years (2024 – 2030) with the goal of improving the PSI and WKI along all the street to a grade B minimum and along street with 75% of the pedestrian flow to a grade A. The strategy is not only limited to engineering action (pedestrian facilities improvement) but also include legislation/enforcement, policy and land use, training and education, awareness campaign, which have been found effective in improving pedestrian safety [29,41,42,43,44,45,46,115]. The strategy draws from the experience of similar strategies developed for Austin, Texas, and Connecticut in the USA [115,116,117]. For each dimension of the strategy, practical actions are proposed along with potential participating organizations, degree of effectiveness (with respect to pedestrian safety improvement), the timeline for the implementation and the potential barriers [117]. The complete strategy could not be included here to keep the length reasonable, but Figure 3 shows a picture of some engineering action recommended at the road segment R9 to improve its pedestrian safety level from grade E to grade A. The standard values are extracted from two guidelines for pedestrian safety facilities design in African cities [118,119]. Speed management strategies such as speed limit enforcements, lane narrowing is also highly encouraged to keep pedestrians safe. This is a critical issue given that speeding is major contributor of crashes in LMICS [120]
5. Conclusion
Pedestrian safety is a major in Cameroon as they account for almost 12% of road traffic deaths, and 22% of road traffic injuries every year. In Yaoundé, which account for most road traffic deaths in the country, walking is the main mode of transport responsible for almost 35% of daily trips, yet, unsafe pedestrian facilities, lack of sidewalk combined with chaotic traffic poses a major threat to pedestrian’s safety. There are still no walking and cycling polices or a comprehensive pedestrian safety strategy, and the existing efforts seem not to be sufficient. In addition, the lack of study assessing the safety of road infrastructure for pedestrians hinders the opportunity of the city to gather evidence of the issue and to develop and implement data driven intervention. This study aimed to address this by investigating the safety of pedestrians in the city of Yaoundé and providing measures to improve their safety and walking experience.
The study used two sounds and proven approaches, the Pedestrian Safety Index, and the Global Walkability Index, both applicable in Yaoundé and any other cities of similar context. Road infrastructure, environment and traffic data were collected to generate the 24 safety indicators (sidewalk, street lighting, crossing, signing, ramp, etc.) of the PSI and the 9 variables of the GWI (urban furniture, sidewalk, shade, street lighting, etc.). The data were collected during on-field investigation during one month at 12 road segments representing the main arteries to two zone (Central postal and University of Yaoundé I), with high pedestrians of diverse groups, especially. The PSI and GWI were computed and normalized to a percentage to facilitate the understanding of the value in a special rating system from grade E to A. Descriptive statistics were used to unveil the insights from the PSI and GWI across the different safety indicators considered and for all the road segments and to rank the road segments from the safest to the least safe. In addition, Spearman’s rank-correlation was performed to determine the level of agreement between the road segments rankings obtained using the two indicators.
Globally, both for the PSI and GWI, only one road segment had a grade of C (Average quality (rarely acceptable)) making it the safest among all road segments. The reaming road segment had a grade of D and E, indicating the lowest quality (uncomfortable) and minimal pedestrian safety facilities. In fact, most of these road segments were characterized by lack of adequate sidewalk, poor condition of the existing sidewalk, lack of bollards, inaccessibility of the sidewalk to PwDs (mobile and visual impairment), lack of pedestrian crossing, lack of sign of the few crossings, lack of shade, lack of street lighting, just to mention these. A correlation was found between the two indexes for the ranking of the 12 road segments. The value of the Spearman's coefficient (0.69) indicated a strong positive correlation between PSI and GWI. Furthermore, ranking from the PWI and GWI did agree at the 99% significance level, providing further relative validation for the PSI and the GWI.
To improve pedestrian safety in Yaoundé, based on these findings, a pedestrian safety strategy for the city of Yaoundé is proposed, covering seven years (2024 – 2030) with the goal of improving the PSI and WKI along all the street to a grade B minimum and along street with 75% of the pedestrian flow to a grade A. The strategy includes engineering action, legislation/enforcement, policy and land use, training and education, awareness campaign, which have been found effective in improving pedestrian safety.
This study, which is one the few on the topic in Yaoundé to the best of the author’s knowledge, provides clear evidence of the safety level of pedestrian facilities using sound and transferable methods.
The findings from this study and the pedestrian safety strategy proposed could help city officials to implement targeted intervention to improve pedestrian safety in Yaoundé, not only to save lives but to generate health, economic and environmental benefits associated with increased active mobility in the city. The finding could also help city officials to develop or adopt walking and cycling polices which are currently lacking. Finally, the study can also help city official in the implementing of the upcoming major in the city which all have a component relent to pedestrian safety, notary the sustainable urban mobility plan of the city, the project Yaoundé Coeur de Ville, the MoVe project just to mention these.
The study can also be improved in many ways: The study focused on pedestrian facilities assessment, which provides an objective measure of the safety level. Addition, the walking experience, and the perception of safety of pedestrian could also be studied to have another perspective of the issue. In addition, although the validity of the two indexes were proven foe this case study, it was a relative validity. Further research could explore more absolute validity using for instance crash data if available. Despite these areas of potential amelioration, the current study represents a huge and significant contribution to enhancing pedestrian safety in the city of Yaoundé with potential transferability to other cities of Cameroon.
Author Contributions
Conceptualization, Methodology, Writing—original draft preparation, Steffel Ludivin Feudjio Tezong; Investigation, Data curation, Formal analysis, Tchaheu Tchaheu Dimitri; Writing—review and editing, Stephen Kome Fondzenyuy; Writing—review and editing, Isaac Ndumbe Jackai II; Methodology, Writing—review and editing, Davide Shingo Usami; Supervision, Luca Persia.
Funding
This research received no external funding.
Institutional Review Board Statement
Not applicable.
Informed Consent Statement
Not applicable.
Data Availability Statement
The data presented in this study are available upon request.
Acknowledgments
We acknowledge the administrative support of the National Advance School of Public Work and La Sapienza University of Rome.
Conflicts of Interest
The authors declare no conflicts of interest.
References
- World Health Organization, “Global status report on road safety 2023,” 2023. Available online: https://www.who.int/teams/social-determinants-of-health/safety-and-mobility/global-status-report-on-road-safety-2023 (accessed on 18 February 2024).
- World Bank Group, “Saving lives through private investment in Road Safety,” 2022. Available online: http://documents.worldbank.org/curated/en/099525002222214332/P1750030e6c58506b08d5b05ccba3311628 (accessed on 18 February 2024).
- European Commission, “Facts and Figures Pedestrians. European Road Safety Observatory,” 2021. Available online: https://road-safety.transport.ec.europa.eu/document/download/aaeb811d-f455-4fb0-8a79-7a373626952d_en?filename=FF_pedestrians_20220209.pdf (accessed on 25 February 2024).
- Australian Government, “Fact sheet: Vulnerable road users.” 2020. Available online: https://www.roadsafety.gov.au/nrss/fact-sheets/vulnerable-road-users#:~:text=Pedestrians have limited protection (unlike,the most vulnerable road users. (accessed on 14 February 2024).
- ENO Center for Transportation, “Protecting Pedestrians, Our Most Vulnerable Road Users,” 2022. https://enotrans.org/article/guest-op-ed-protecting-pedestrians-our-most-vulnerable-road-users/.
- G. Yannis, D. Nikolaou, A. Laiou, Y. A. Stürmer, I. Buttler, and D. Jankowska-Karpa, “Vulnerable road users: Cross-cultural perspectives on performance and attitudes,” IATSS Res., vol. 44, no. 3, pp. 220–229, 2020. [CrossRef]
- OECD/ITF, “Cycling, Health and Safety,” 2013. Available online: http://www.oecd-ilibrary.org/transport/cycling-health-and-safety_9789282105955-en (accessed on 05 March 2024).
- Sustainable Mobility for All, “Global Mobility Report 2017: Tracking Sector Performance,” 2017. [CrossRef]
- European Commission, “Facts and Figures Pedestrians. European Road Safety Observatory,” 2023. Available online: https://road-safety.transport.ec.europa.eu/document/download/58883bdc-4312-4665-a424-d5796658e14f_en?filename=ff_pedestrians_20230213.pdf (accessed on 18 January 2024).
- Center for Disease Control and Prevention, “Pedestrian Safety,” 2023. https://www.cdc.gov/transportationsafety/pedestrian_safety/index.html#print.
- World Health Organization, “PEDESTRIAN SAFETY. A road safety manual for decision-makers and practitioners,” 2023. Available online: https://www.who.int/publications/i/item/pedestrian-safety-a-road-safety-manual-for-decision-makers-and-practitioners (accessed on 18 February 2024).
- G. A. Davis, “Relating severity of pedestrian injury to impact speed in vehicle-pedestrian crashes: Simple threshold model,” Transp. Res. Rec., no. 1773, pp. 108–113, 2001. [CrossRef]
- B. C. Tefft, “Impact speed and a pedestrian’s risk of severe injury or death,” Accid. Anal. Prev., vol. 50, pp. 871–878, 2013. [CrossRef]
- M. Aj, A. Rwg, F. Mjb, L. Bh, B. Cg, and A. McLean Anderson, R., Farmer, M., Lee, B. & Brooks, C, “Vehicle Travel Speeds and The Incidence of Fatal Pedestrian Collisions,” Accid. Anal. Prev., vol. 29, no. 5, pp. 667–674, 1994. [CrossRef]
- E. Rosén, H. Stigson, and U. Sander, “Literature review of pedestrian fatality risk as a function of car impact speed,” Accid. Anal. Prev., vol. 43, no. 1, pp. 25–33, 2011. [CrossRef]
- Q. Hussain, H. Feng, R. Grzebieta, T. Brijs, and J. Olivier, “The relationship between impact speed and the probability of pedestrian fatality during a vehicle-pedestrian crash: A systematic review and meta-analysis,” Accid. Anal. Prev., vol. 129, no. April, pp. 241–249, 2019. [CrossRef]
- World Health Organization, “Drinking and driving,” 2007. [CrossRef]
- V. Živković, V. Lukić, and S. Nikolić, “The influence of alcohol on pedestrians: A different approach to the effectiveness of the new traffic safety law,” Traffic Inj. Prev., vol. 17, no. 3, pp. 233–237, 2016. [CrossRef]
- National Highway Traffic Safety Administration, “Traffic Safety Facts 2021 Data: Pedestrians. U.S. Department of Transportation,” 2023. Available online: https://crashstats.nhtsa.dot.gov/Api/Public/ViewPublication/813458 (accessed on 05 March 2024).
- P. Cairney, W. Stephenson, and J. Macaulay, “Preventing Crashes Involving Intoxicated Pedestrians Stage 1 Report:The extent and Nature of the Problem Stage 2: An Analysis of Australian Coronial Records, 1999-2001,” 2004. Available online: https://austroads.com.au/publications/road-safety/ap-r260-04 (accessed on 17 February 2024).
- K. Gonz, “Evaluating Pedestrians ’ Safety on Urban Intersections: A Visibility Analysis,” Sustainability, vol. 11, no. 23, p. 6630, 2019. [CrossRef]
- World Health Organization, “World report on road traffic injury prevention,” 2004. Available online: https://www.who.int/publications/i/item/world-report-on-road-traffic-injury-prevention (accessed on 11 January 2024).
- M. Gomaa, N. Saunier, L. F. Miranda-moreno, and S. V Ukkusuri, “A clustering regression approach: A comprehensive injury severity analysis of pedestrian – vehicle crashes in New York, US and Montreal, Canada,” Saf. Sci., vol. 54, pp. 27–37, 2013. [CrossRef]
- K. J. Clifton, C. V Burnier, and G. Akar, “Severity of injury resulting from pedestrian – vehicle crashes: What can we learn from examining the built environment ?,” Transp. Res. Part D, vol. 14, no. 6, pp. 425–436, 2009. [CrossRef]
- M. Masoud and M. Mahdian, “Pedestrians: The Vulnerable Forgotten Road Users,” Int. Arch. Heal. Sci., vol. 9, no. 1, pp. 1–2, 2022. [CrossRef]
- J. Mian and J. Caird, “Conspicuity of Pedestrians at Night_ How to Maximize Visibility and Safety (poster),” J. Transp. Heal., vol. 7, 2017. [CrossRef]
- C. Lee and M. Abdel-aty, “Comprehensive analysis of vehicle – pedestrian crashes at intersections in Florida,” Accid. Anal. Prev., vol. 37, pp. 775–786, 2005. [CrossRef]
- H. Abou-senna, E. Radwan, F. Asce, and A. Mohamed, “A methodology to quantify pedestrian crash rates against statewide averages for roadways and intersection,” 2003. Available online: https://www.diva-portal.org/smash/get/diva2:922457/FULLTEXT02.pdf (accessed on 07 March 2024).
- Federal Highway Administration, “An Analysis of Factors Contributing to ‘ Walking Along Roadway ’ Crashes: Research Study and Guidelines for Sidewalks and Walkways,” 2002.
- C. S. Hanson, R. B. Noland, and C. Brown, “The severity of pedestrian crashes: an analysis using Google Street View imagery,” J. Transp. Geogr., vol. 33, pp. 42–53, 2013. [CrossRef]
- Federal Highway Administration, “Investigations of Exposure Based on Pedestrian Areas: Crosswalks, Sidewalks, Local Streets AND Major Arterials,” 1999. Available online: https://safety.fhwa.dot.gov/saferjourney1/library/countermeasures/notes.htm (accessed on 18 February 2024).
- B. Minkoumou, “Circulation des piétons et des deux-roues: cas du Cameroun, Ministère des travaux publics,” 2001. Available online: https://www.piarc.org/ressources/documents/actes-seminaires06/c31-togo06/8734,7-DIAPOS_PRESENTATION_BEKOLO_MINKOU.pdf (accessed on 28 February 2024).
- World Bank Group, “Road Safety in Cameroon _ Traffic accidents, crash, fatalities,” 2022. https://www.roadsafetyfacility.org/country/cameroon.
- United Nations Economic Commission for Africa, “Évaluation de la performance en matière de sécurité routière ( EPSR ),” 2018, Available online: https://unece.org/fr/transport/publications/evaluation-de-la-performance-en-matiere-de-securite-routiere-epsr-cameroun (accessed on 17 October 2023).
- Cameroon Tribune, “Sécuroute plaide pour les piétons,” 2013. http://ct2015.cameroon-tribune.cm/index.php?option=com_content&view=article&id=73858:securoute-plaide-pour-les-pietons&catid=4:societe&Itemid=3.
- Country report, “Traffic and Road Conditions in Cameroon,” 2024. https://www.countryreports.org/country/Cameroon/traffic.htm.
- M. A. Hadji, “Efficacité des mesures de prévention routière sur le comportement des usagers de la voie publique au cameroun,” 2018. https://www.memoireonline.com/11/19/11307/m_Efficacite-des-mesures-de-prevention-routiere-sur-le-comportement-des-usagers-de-la-voie-publique12.html.
- African Development Bank, “La sécurité des deux-roues motorisés en Afrique,” 2022. Available online: https://www.afdb.org/sites/default/files/documents/publications/la_securite_des_deux_roues_motorises_en_afrique_web.pdf (accessed on 14 December 2023).
- C. Juillard, G. Alain, E. Mballa, and A. A. Hyder, “Patterns of Injury and Violence in Yaounde ́Cameroon:An Analysis of Hospital Data,” World J. Surg., vol. 35, no. 1, pp. 1–8, 2011. [CrossRef]
- J. Mcgreevy et al., “Road traffic injuries in Yaounde´, Cameroon: A hospital-based pilot surveillance study,” Injury, vol. 45, no. 11, pp. 1687–1692, 2014. [CrossRef]
- Is. Namatovu et al., “Interventions to reduce pedestrian road traffic injuries: A systematic review of randomized controlled trials, cluster randomized controlled trials, interrupted,” PLoS One, vol. 17, no. 1, pp. 1–17, 2022. [CrossRef]
- S. Sonduru, S. Shahriar, G. Fountas, K. Majka, and P. Ch, “Do high visibility crosswalks improve pedestrian safety ? A correlated grouped random parameters approach using naturalistic driving study data,” Anal. Methods Accid. Res., vol. 30, p. 100155, 2021. [CrossRef]
- L. Fridman et al., “Effect of reducing the posted speed limit to 30 km per hour on pedestrian motor vehicle collisions in Toronto, Canada - a quasi experimental, pre-post study,” BMC Public Health, vol. 20, no. 56, pp. 1–8, 2020. [CrossRef]
- S. r. Zein, E. Geddes, S. Hemsing, and M. Johnson, “Pedestrian Studies,” Transp. Res. Rec., vol. 1578, no. 1, pp. 3–10, 1997. [CrossRef]
- R. Ewing, “Impacts of Traffic Calming,” 2001. Available online: https://nacto.org/docs/usdg/impacts_of_traffic_calming_ewing.pdf (accessed on 24 November 2023).
- F. Bunn, T. Collier, C. Frost, K. Ker, and R. W. I Roberts, “Traffic calming for the prevention of road traffic injuries: systematic review and meta - analysis,” Inj. Prev., vol. 9, no. 3, pp. 200–204, 2003. [CrossRef]
- F. Dutheil, S. Pélangeon, M. Duclos, P. Vorilhon, and M. Mermillod, “Protective Effect on Mortality of Active Commuting to Work: A Systematic Review and Meta - analysis,” Sport. Med., vol. 50, no. 12, pp. 2237–2250, 2020. [CrossRef]
- U.S. Department of Health and Human Services, “Physical Activity Guidelines for Americans,” 2018. Available online: https://health.gov/physical-activity-guidelines/current-guidelines (accessed on 05 January 2024).
- World Health Organization, “Who guidelines on physical activity and sedentary behaviour,” 2020. Available online: https://www.who.int/publications/i/item/9789240015128 (accessed on 17 October 2023).
- World Health Organization, “Compendium of WHO and other UN guidance on health and environment Chapter 9. Safe environments and mobility,” 2021. Available online: https://www.who.int/tools/compendium-on-health-and-environment/safe-environments-and-mobility (accessed on 05 January 2024).
- World Health Organization, “Health and economic impacts of transport interventions in Accra, Ghana,” 2020. Available online: https://www.who.int/publications/i/item/9789240017306 (accessed on 18 February 2024).
- Transport for London, “Walking and Cycling: The economics benefits,” 2014. Available online: https://content.tfl.gov.uk/walking-cycling-economic-benefits-summary-pack.pdf (accessed on 18 February 2024).
- Future place leadership, “The effect of pedestrianisation and bicycles on local business,” 2020. Available online: https://futureplaceleadership.com/wp-content/uploads/2017/05/Tallinn-High-Street-Case-studies-Future-Place-Leadership.pdf (accessed on 18 December 2023).
- World Bank Group, “Investing for Momemtum in active mobility,” 2021. Available online: https://elibrary.worldbank.org/doi/abs/10.1596/36617 (accessed on 16 December 2023).
- UN habitat, “Walking and Cycling in Africa,” 2022. Available online: https://www.unep.org/resources/report/walking-and-cycling-africa-evidence-and-good-practice-inspire-action (accessed on 19 December 2023).
- Muhammad, A. Verani, R. Sihombing, H. Hendrawan, A. Vitriana, and A. Nugroho, “Transportation Research Interdisciplinary Perspectives Walkability and importance assessment of pedestrian facilities on central business district in capital city of Indonesia,” Transp. Res. Interdiscip. Perspect., vol. 16, 2022. [CrossRef]
- T. M. Lam et al., “Development of an objectively measured walkability index for the Netherlands,” Int. J. Behav. Nutr. Phys. Act., vol. 19, no. 50, pp. 1–16, 2022. [CrossRef]
- Consoli, A. Nettel-aguirre, J. C. Spence, T. Mchugh, K. Mummery, and G. R. M. Id, “Associations between objectively-measured and self-reported neighbourhood walkability on adherence and steps during an internet- delivered pedometer intervention,” PLoS One, vol. 15, no. 12, pp. 1–16, 2020. [CrossRef]
- T. Campisi, G. Tesoriere, A. Skoufas, D. Zeglis, C. Andronis, and S. Basbas, “ScienceDirect ScienceDirect Perceived Pedestrian Level of Service: The case of Thessaloniki, Perceived Pedestrian Level of Service: The case of Thessaloniki, Greece,” Transp. Res. Procedia, vol. 60, pp. 124–131, 2022. [CrossRef]
- E. Aprilnico and M. L. Siregar, “Pedestrian risk analysis at Jl. Raya Citayam – Jl. Boulevard Raya Grand Depok City intersection leg using pedestrian risk index,” MATEC Web Conf., vol. 276, 2019. [CrossRef]
- G. Salvalai, J. Diego, B. Cadena, G. Sparvoli, G. Bernardini, and E. Quagliarini, “Pedestrian Single and Multi-Risk Assessment to SLODs in Urban Built Environment: A Mesoscale Approach,” Sustainability, vol. 14, no. 18, pp. 1–30, 2022. [CrossRef]
- S. Marisamynathan, “Pedestrian perception-based level-of-service model at signalized intersection crosswalks,” J. Mod. Transp., vol. 27, no. 4, pp. 266–281, 2019. [CrossRef]
- L. Juhardi et al., “Analysis of Walkability Index and Handling of Pedestrian Facilities of Slamet Riyadi Street, Surakarta Analysis of Walkability Index and Handling of Pedestrian Facilities of Slamet Riyadi Street, Surakarta,” J. Phys. Conf. Ser., vol. 1858, 2021. [CrossRef]
- E. Bhaduri, M. BS, J. Sen, B. Maitra, and A. K. Goswami, “Measuring User Satisfaction of Pedestrian Facilities and its Heterogeneity in Measuring User Satisfaction of Pedestrian Facilities and its Heterogeneity in Urban India – A Tale of Three Cities,” J. East. Asia Soc. Transp. Stud., vol. 13, 2019. [CrossRef]
- N. Al-Mukaram and S. S. Musa, “Determination of Pedestrian Level of Service on Sidewalks in Samawah City Determination of Pedestrian Level of Service on Sidewalks in Samawah City,” IOP Conf. Ser. Mater. Sci. Eng., vol. 928, 2020. [CrossRef]
- ESRA, “ESRA, Who are we and what do we do?,” 2020. https://www.esranet.eu/.
- S. Lee, M. Han, K. Rhee, and B. Bae, “Identification of Factors Affecting Pedestrian Satisfaction toward Land Use and Street Type,” Sustainability, vol. 13, no. 19, pp. 1–14, 2021. [CrossRef]
- S. Barbosa, P. H. Guerra, C. D. O. Santos, A. Paula, D. O. Barbosa, and G. Turrell, “Walkability, Overweight, and Obesity in Adults: A Systematic Review of Observational Studies,” Int. J. Environ. Res. Public Health, vol. 16, no. 17, 2019. [CrossRef]
- B. E. Saelens and S. L. Handy, “Built Environment Correlates of Walking: A Review Brian,” NIH Public Access, vol. 40, no. 7, 2008. [CrossRef]
- D. J. Mayne, G. G. Morgan, A. Willmore, N. Rose, and B. Jalaludin, “An objective index of walkability for research and planning in the Sydney Metropolitan Region of New South Wales, Australia: an ecological study,” Int. J. Health Geogr., vol. 12, no. 61, pp. 8–10, 2013. [CrossRef]
- J. Feng, T. A. Glass, F. C. Curriero, W. F. Stewart, and B. S. Schwartz, “Health & Place The built environment and obesity: A systematic review of the epidemiologic evidence,” Health Place, vol. 16, no. 2, pp. 175–190, 2010. [CrossRef]
- D. A. Rodríguez, “An easy to compute index for identifying built environments that support walking An easy to compute index for identifying built environments that support walking,” 2006. Available online: https://www.researchgate.net/publication/252050684_An_easy_to_compute_index_for_identifying_built_environments_that_support_walking (accessed on 18 October 2023).
- L. D. Frank et al., “The development of a walkability index: application to the Neighborhood Quality of Life Study,” Br. Journals Sport. Med., vol. 44, no. 13, pp. 924–933, 2010. [CrossRef]
- Hall Planning & Engineering, “HPE’s Walkability Index – Quantifying the Pedestrian Experience,” 2010. Available online: https://hpe-inc.com/hpes-walkability-index-quantifying-the-pedestrian-experience/ (accessed on 18 December 2023).
- G. R. Mccormack et al., “The association between sidewalk length and walking for different purposes in established neighborhoods,” Int. J. Behav. Nutr. Phys. Act., vol. 9, no. 92, pp. 1–12, 2012. [CrossRef]
- K. H. Virginia, “The Global Walkability Index,” Massachusetts Institute of Technology, 2006. Available online: https://dspace.mit.edu/handle/1721.1/34409#files-area (accessed on 18 January 2024).
- World Bank Group, “Addis Ababa Sidewalk Safety and Improvement Study,” 2022. Available online: https://documents1.worldbank.org/curated/en/099414303282215574/pdf/IDU0050ff322056220452a0978409bb2e7268adf.pdf (accessed on 18 December 2023).
- M. Mōri and H. Tsukaguchi, “Transportation Research Part A: General A new method for evaluation of level of service in pedestrian facilities,” Transp. Res. Part A, vol. 21, no. 3, pp. 5–6, 1987. [CrossRef]
- T. A. N. Dandan and W. Wei, “Research on Methods of Assessing Pedestrian Level of Service for Sidewalk,” J. Transp. Syst. Eng., vol. 7, no. 5, pp. 5–6, 2007. [CrossRef]
- B. R. Kadali and P. Vedagiri, “Evaluation of pedestrian crosswalk level of service ( LOS ) in perspective of type of land-use,” Transp. Res. Part A, vol. 73, pp. 113–124, 2015. [CrossRef]
- Y. Wen and K. Y. Yan, “Level of Service Standards for Pedestrian Facilities in Shanghai Metro Stations,” Int. Conf. Transp. Eng., pp. 5–6, 2007. [CrossRef]
- Z. Asadi-shekari, M. Moeinaddini, and M. Z. Shah, “Non-motorised Level of Service: Addressing Challenges in Pedestrian and Bicycle Level of Service Non-motorised Level of Service: Addressing Challenges in Pedestrian and Bicycle Level of Service,” Transp. Rev., vol. 33, no. 2, pp. 166–194, 2013. [CrossRef]
- T. A. Petritsch et al., “Pedestrian Level-of-Service Model for Urban Arterial Facilities with Sidewalks,” J. Transp. Res. Board, vol. 1982, no. 1, pp. 84–89, 2006. [CrossRef]
- Z. Asadi-shekari, M. Moeinaddini, and M. Z. Shah, “Land Use Policy A pedestrian level of service method for evaluating and promoting walking facilities on campus streets,” Land use policy, vol. 38, pp. 175–193, 2014. [CrossRef]
- M. Moeinaddini, Z. Asadi-shekari, C. Ros, and M. Zaly, “Land Use Policy A practical method for evaluating parking area level of service,” Land use policy, vol. 33, pp. 1–10, 2013. [CrossRef]
- T. Muraleetharan, T. Adachi, T. Hagiwara, S. Kagaya, and S. Member, “Method To Determine Overall Level-Of-Service Of Pedestrians On Sidewalks Based On Total Utility Value,” Infrastruct. Plan. Rev., vol. 3, no. 10, pp. 8–11, 2005. [CrossRef]
- K. Tanaka, “Ottawa Pedestrian Safety Evaluation Tool,” in 2012 Conference of the Transportation Association of Canada Fredericton, 2012, pp. 1–16. Available online: http://conf.tac-atc.ca/english/annualconference/tac2012/docs/session16/tanaka.pdf (accessed on 03 November 2023).
- R. Chaudhari et al., “Deriving Pedestrian Risk Index by Vehicle Type and Road Geometry at Midblock Crosswalks under Heterogeneous Traffic Conditions,” J. Transp. Eng. Part A Syst., vol. 146, no. 10, 2020. [CrossRef]
- M. J. King, D. Soole, and A. Ghafourian, “Illegal pedestrian crossing at signalised intersections: Incidence and relative risk,” Accid. Anal. Prev., vol. 41, pp. 485–490, 2009. [CrossRef]
- M. C. Diogenes and L. A. Lindau, “Evaluation of Pedestrian Safety at Midblock Crossings, Porto Alegre, Brazil,” J. Transp. Res. Board, vol. 2193, no. 1, pp. 37–43, 2010. [CrossRef]
- S. Cafiso, M. Alfonso, and R. Rojas, “Crosswalk Safety evaluation using a Pedestrian Risk Index as Traffic Conflict Measure,” in 3rd International Conference on Road Safety and Simulation, 2011. Available online: https://trid.trb.org/view/1286233 (accessed on 05 March 2024).
- Z. Asadi-shekari, M. Moeinaddini, and M. Zaly, “Pedestrian safety index for evaluating street facilities in urban areas,” Safety, vol. 74, pp. 1–14, 2015. [CrossRef]
- L. Ntumngia and L. Fombe, “Agony Of Circulation In The Bamenda Metropolitan Area Of The North West Region Of Cameroon,” Int. J. Arts, Humanit. Soc. Sci., vol. 03, no. 02, pp. 78–84, 2022. [CrossRef]
- VIAS Institute, “E survey of road users attitude: Cameroon,” 2020. Available online: https://www.esranet.eu/storage/minisites/esra2019countryfactsheetcameroon-fr.pdf (accessed on 28 December 2023).
- World Bank, “Pedestrian Mobility for Urban Growth: Walking and its Links to Transportation,” 2018. Available online: https://openknowledge.worldbank.org/entities/publication/863a9943-2c47-52a1-b431-378229f7e3d4 (accessed on 01 December 2023).
- Bachmann et al., “Plan de Mobilité Urbaine Soutenable pour la Communauté Urbaine Rapport de de Yaoundé synthèse,” 2019. Available online: https://www.mobiliseyourcity.net/sites/default/files/2020-01/PMUS Yaoundé - Septembre 2019.pdf (accessed on 05 December 2023).
- Clarke, “City of Ottawa Road Corridor Planning & Design Guidelines October 2008,” 2008. Available online: https://documents.ottawa.ca/sites/documents/files/documents/con040685.pdf (accessed on 31 December 2023).
- Sutherland and G. M. Petersen, “Street design guidelines,” 2006. Available online: https://pdfcoffee.com/download/street-design-2-pdf-free.html (accessed on 04 March 2024).
- City of Chicago, “STREET AND SITE PLAN DESIGN STANDARDS,” 2007. Available online: https://www.chicago.gov/dam/city/depts/cdot/StreetandSitePlanDesignStandards407.pdf (accessed on 05 March 2024).
- City of New York, “Street Design Manual,” 2009. Available online: https://nacto.org/wp-content/uploads/2011/03/NYCDOT-Street-Design-Manual-2009.pdf.
- City of Aurora, “Aurora Urban Street Standards,” 2003. Available online: https://cdnsm5-hosted.civiclive.com/UserFiles/Servers/Server_1881137/File/Business Services/Zoning and Codes/Building and Zoning/005478.pdf (accessed on 07 March 2024).
- Federal Highway Administration, “Accessible Sidewalks and Street Crossings - an informational guide,” 2001. Available online: https://nacto.org/wp-content/uploads/2015/04/accessible_sidewalks_and_street_crossings_boodlal.pdf (accessed on 01 March 2024).
- City of Minneapolis, “DESIGN GUIDELINES FOR STREETS AND SIDEWALKS,” pp. 1–14, 2017, Available online: https://lims.minneapolismn.gov/Download/RCAV2/2921/25f-Design-Guidelines-for-Streets-and-Sidewalks-Assessment-11-21_.pdf (accessed on 09 March 2024).
- Charlotte Department of Transportation, “Urban Street Design Guidelines,” 2007. Available online: https://www.charlottenc.gov/files/sharedassets/city/v/1/growth-and-development/documents/dev-center-fees/manual/usdg-full-document.pdf (accessed on 04 March 2024).
- City of Tacoma, “Mobility Master Plan Bicycle and Pedestrian Design Guidelines,” 2009. Available online: https://cms.cityoftacoma.org/Planning/MoMaP/MoMaPDesignGuidelines_PublicReviewDraft.pdf (accessed on 01 March 2024).
- City of Whittlesea, “Guidelines for Urban Development,” 2009. Available online: https://www.whittlesea.vic.gov.au/media/kqbf1mg1/guidelines-for-urban-development-manual-accessible.pdf (accessed on 05 February 2024).
- National Association of City Transportation Officials, “Urban Street Design Guide,” 2013. Available online: https://nacto.org/publication/urban-street-design-guide/ (accessed on 05 March 2024).
- National Association of City Transportation Officials, “Global Street Design Guide,” pp. 1–4, 2016, Available online: https://nacto.org/publication/global-street-design-guide/ (accessed on 05 January 2024).
- Mfoulou, “Urbanisation, mobilité et fonctionnement de l ’ offre de transport à Yaoundé,” in 8th Africa Population Conference, 2019, pp. 1–14. Available online: https://uaps2019.popconf.org/abstracts/190063 (accessed on 05 March 2024).
- EduRANK, “List of 4 best universities in Yaounde,” 2024. https://edurank.org/geo/yaounde/#google_vignette.
- Ambassade de France au Cameroun, “FICHE CAMEROUN 2018 I-Organisation de l’enseignement supérieur,” 2018. Available online: https://www.diplomatie.gouv.fr/IMG/pdf/2018_06_cameroun_curie_es_cle0b7d9f.pdf (accessed on 15 October 2023).
- S. K. Fondzenyuy et al., “Evaluating Speeding Safety Performance Indicators in an Urban Area of a LMIC: A Case Study of Evaluating Speeding Safety Performance Indicators in an Urban Area of a LMIC: A Case Study of,” Preprints, 2024. [CrossRef]
- M. Aghaabbasi, M. Moeinaddini, Z. Asadi-shekari, and M. Z. Shah, “The equitable use concept in sidewalk design,” Cities, vol. 88, no. August 2018, pp. 181–190, 2019. [CrossRef]
- Montella, C. Guida, J. Mosca, J. Lee, and M. Abdel-aty, “Systemic approach to improve safety of urban unsignalized intersections: Development and validation of a Safety Index ☆,” Accid. Anal. Prev., vol. 141, no. July 2019, p. 105523, 2020. [CrossRef]
- Austin City Council, “City of Austin Pedestrian Safety Action Plan,” 2018. Available online: https://www.austintexas.gov/department/pedestrian-safety-action-plan (accessed on 07 March 2024).
- Connecticut Department of Transportation, “Pedestrian Safety Strategy,” 2021. Available online: https://portal.ct.gov/-/media/DOT/PLNG_PLANS/Pedestrian-Safety-Strategy-webpage/Webpage/Reports-Brochures-etc/Comprehensive-Pedestrian-Safety-Strategy---JanFeb-2021.pdf (accessed on 07 March 2024).
- Texas Department of Transportation, “Pedestrian Safety Strategies,” 2017.
- United Nations Environment programme, “Share the Road: Design Guidelines for Non Motorised Transport in Africa,” 2019. Available online: https://www.unep.org/resources/toolkits-manuals-and-guides/share-road-design-guidelines-non-motorized-transport-africa (accessed on 09 March 2024).
- UN Habitat, “Streets for walking & cycling,” 2018. Available online: https://unhabitat.org/sites/default/files/2020/06/streets-for-walking-and-cycling.pdf (accessed on 10 March 2024).
- S. K. Fondzenyuy, B. M. Turner, A. F. Burlacu, and C. Jurewicz, “Title: The Contribution of Excessive or Inappropriate Speeds to Road Traffic Crashes and Fatalities: A Review of Literature,” 2024. [CrossRef]
Figure 1.
Rank correlation of the 12 road segments.
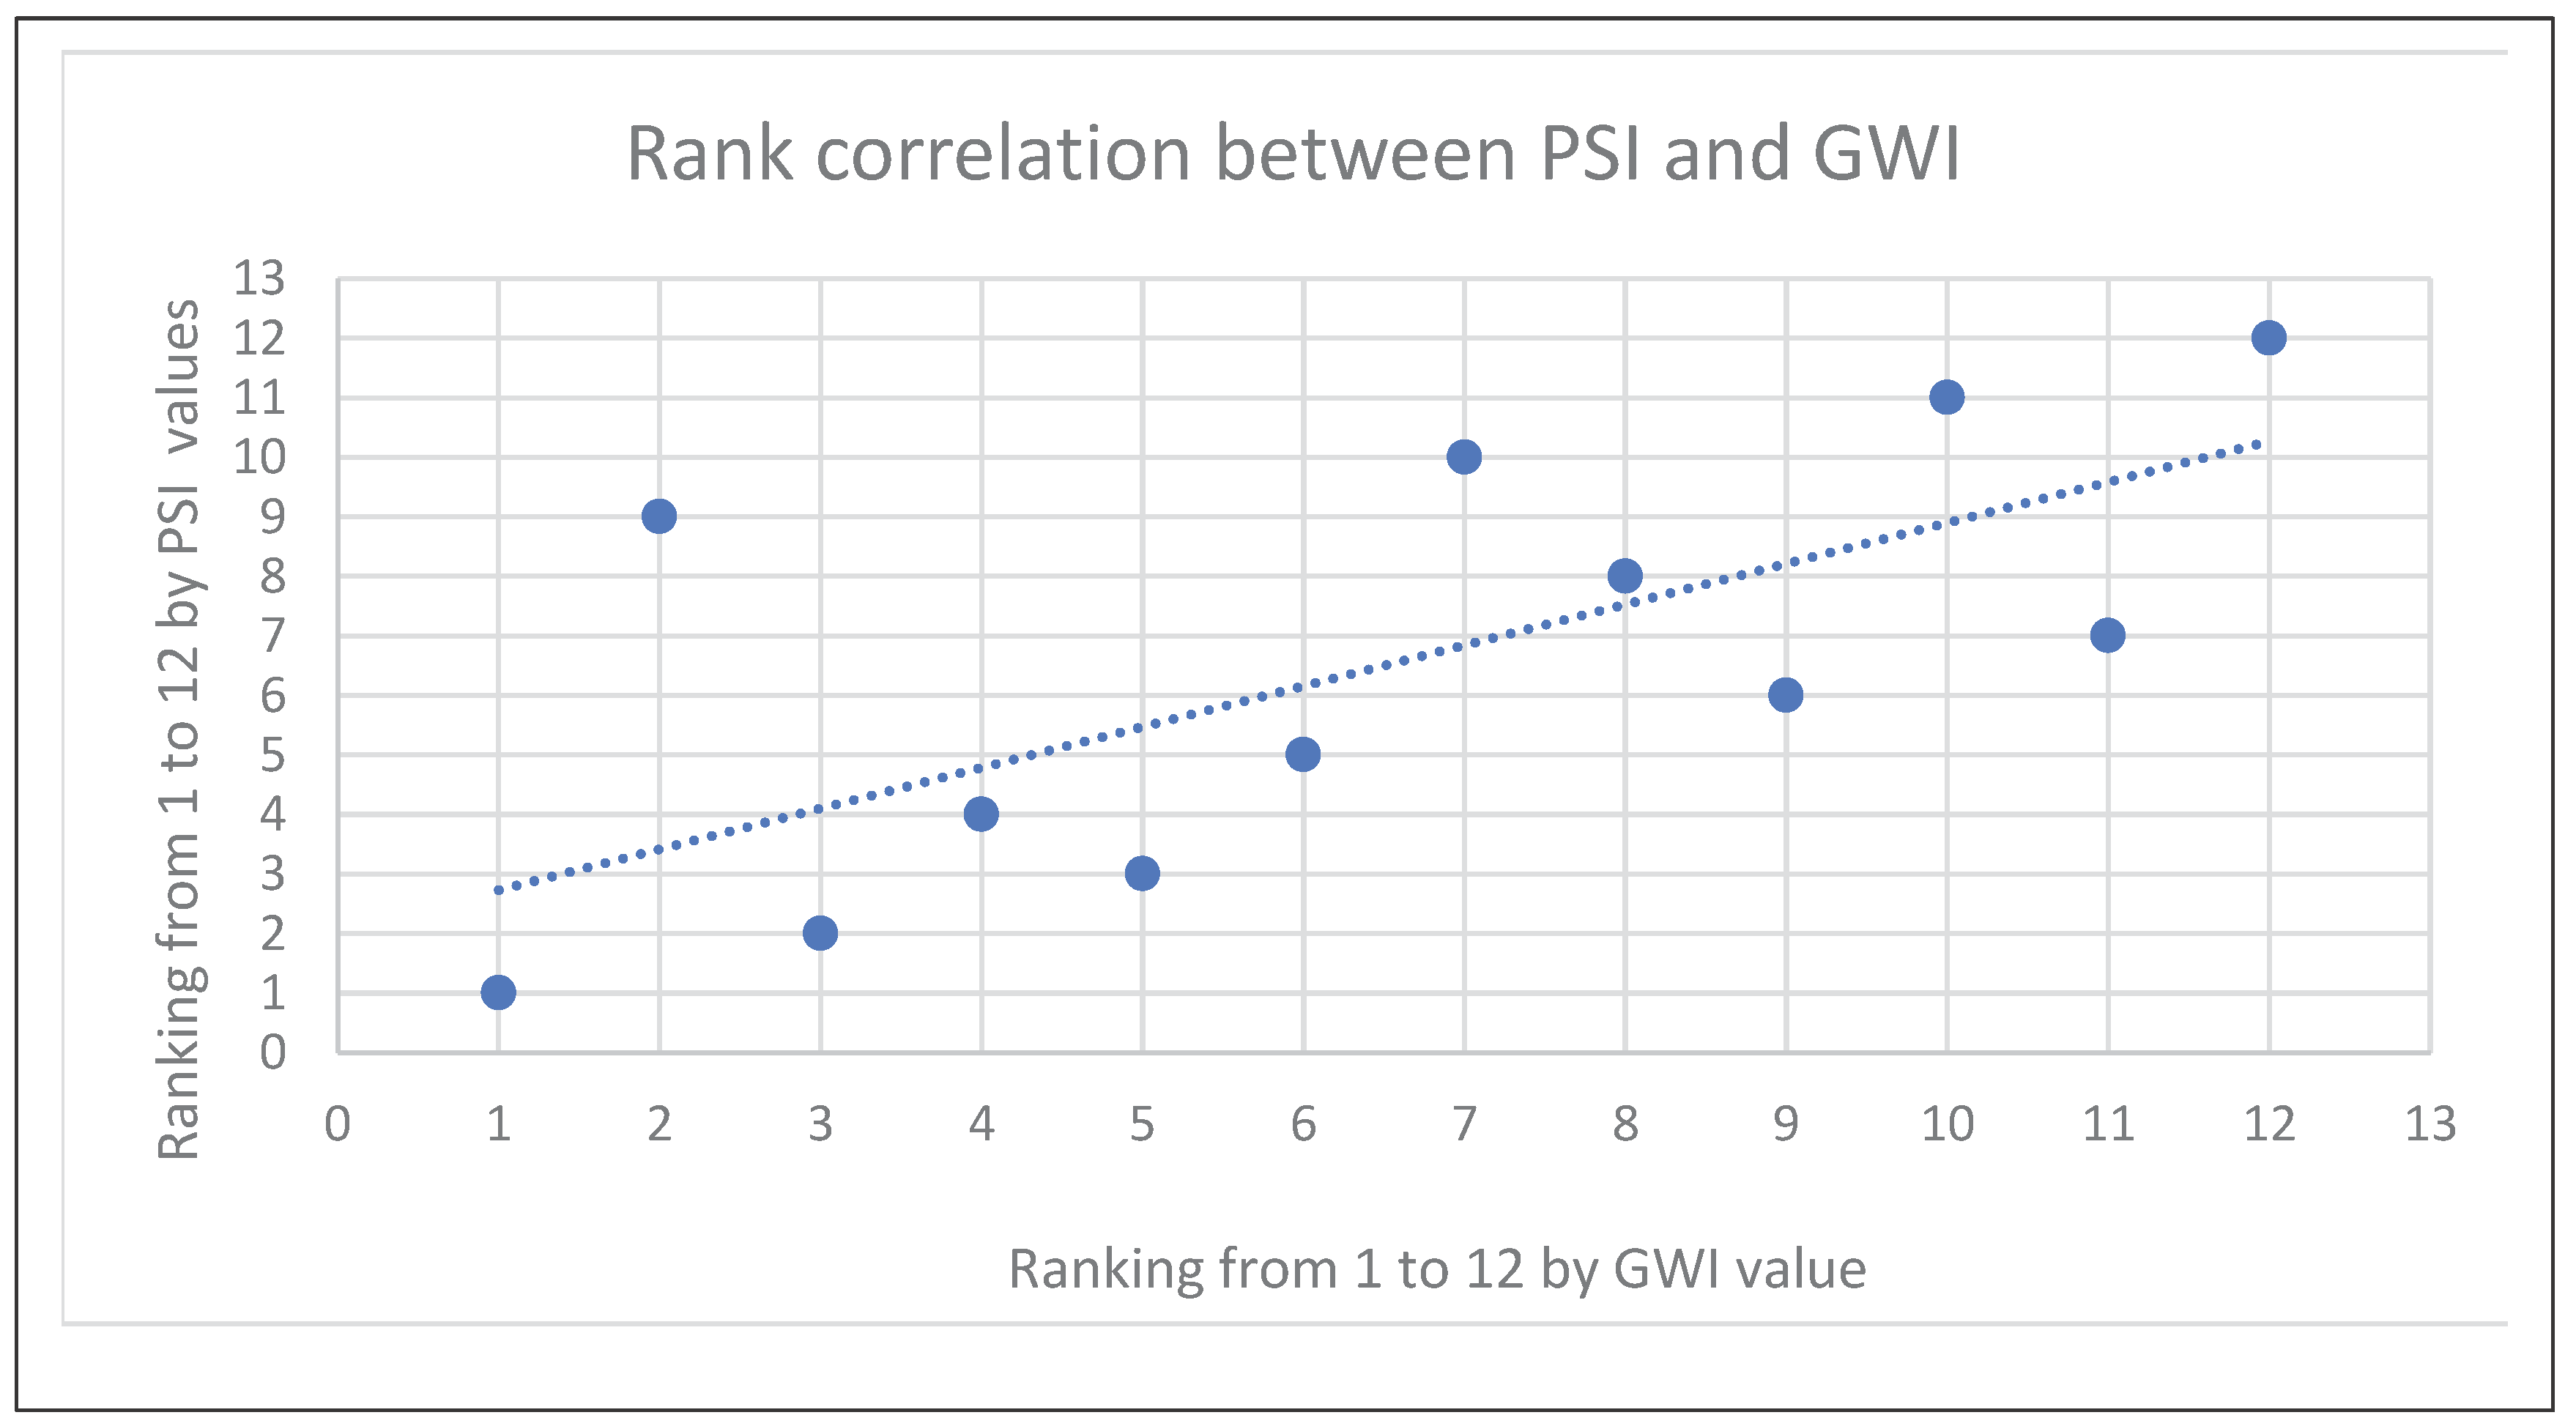
Figure 2.
Predominant existing sidewalk condition on the road segment investigated: (a) existing sidewalk already in poor condition obstructed by cars and vendors. (b) total absence of sidewalk. (c) Existing sidewalk obstructed by motorcycle and vendors. (d) lack of adequate sidewalk and obstruction of informal sidewalk (available space as well drainage).
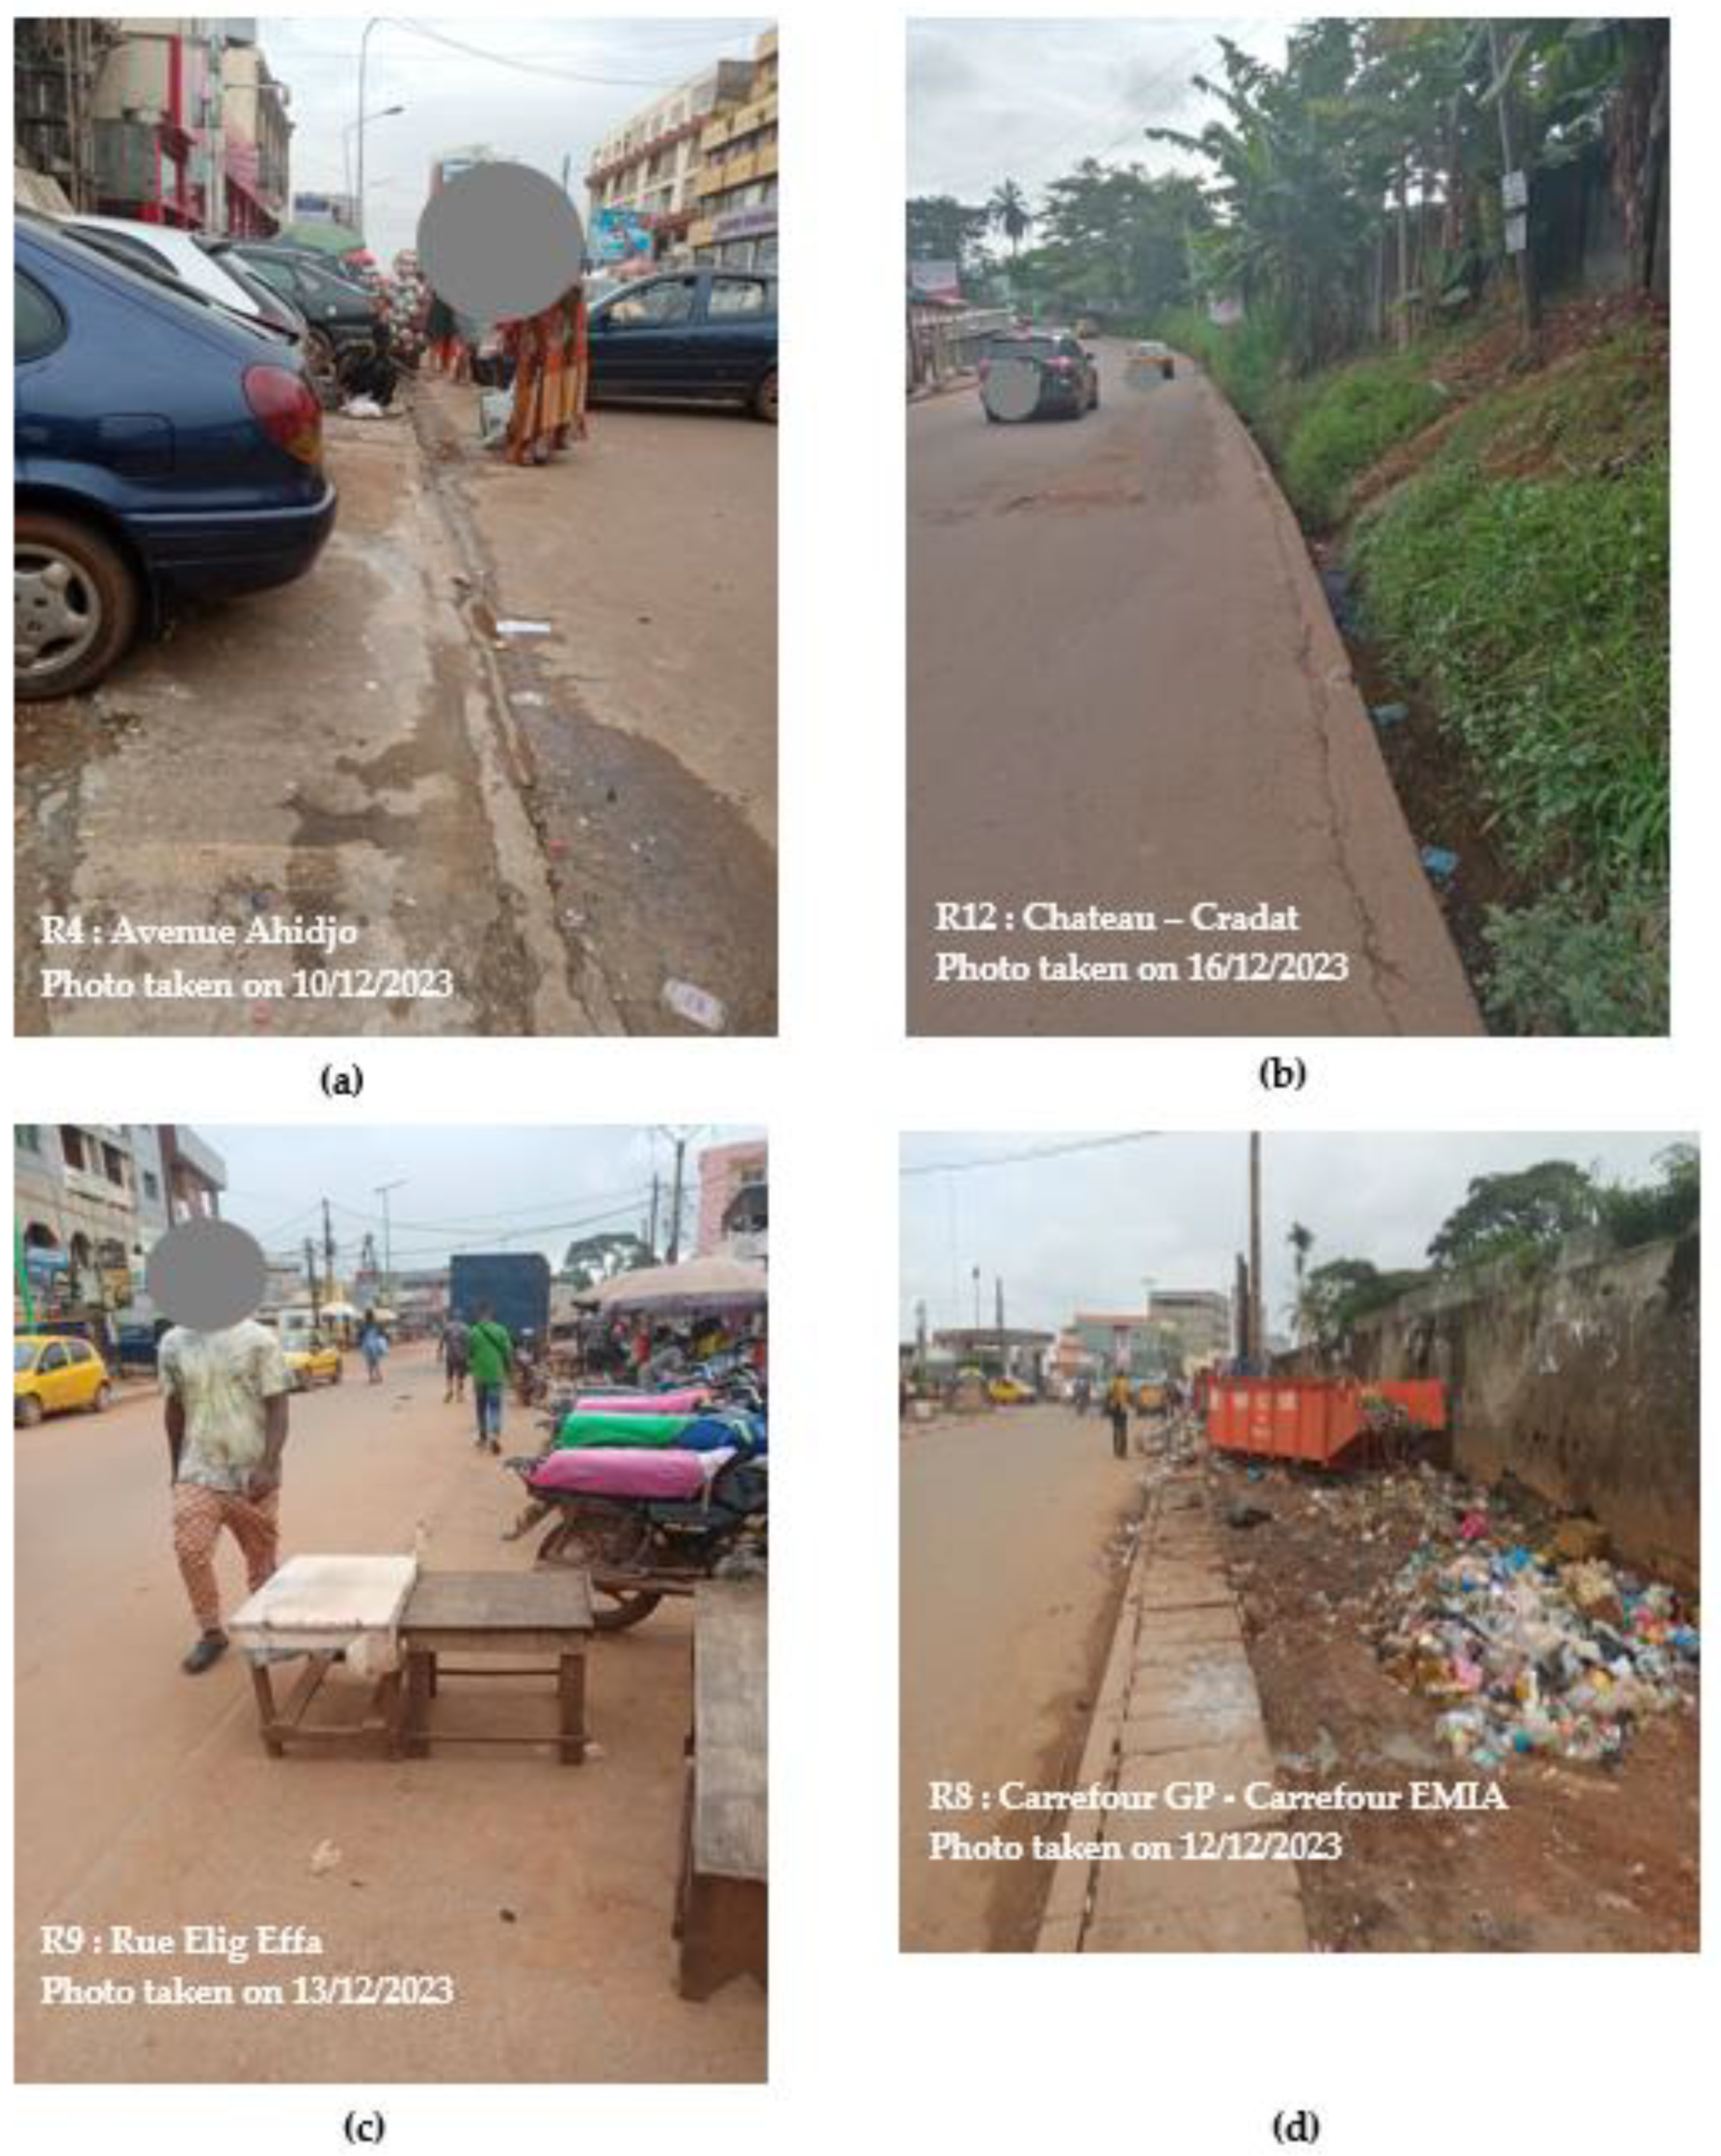
Figure 3.
Engineering intervention at road segment R9 to improve its pedestrian safety grade from E to A.
Figure 3.
Engineering intervention at road segment R9 to improve its pedestrian safety grade from E to A.
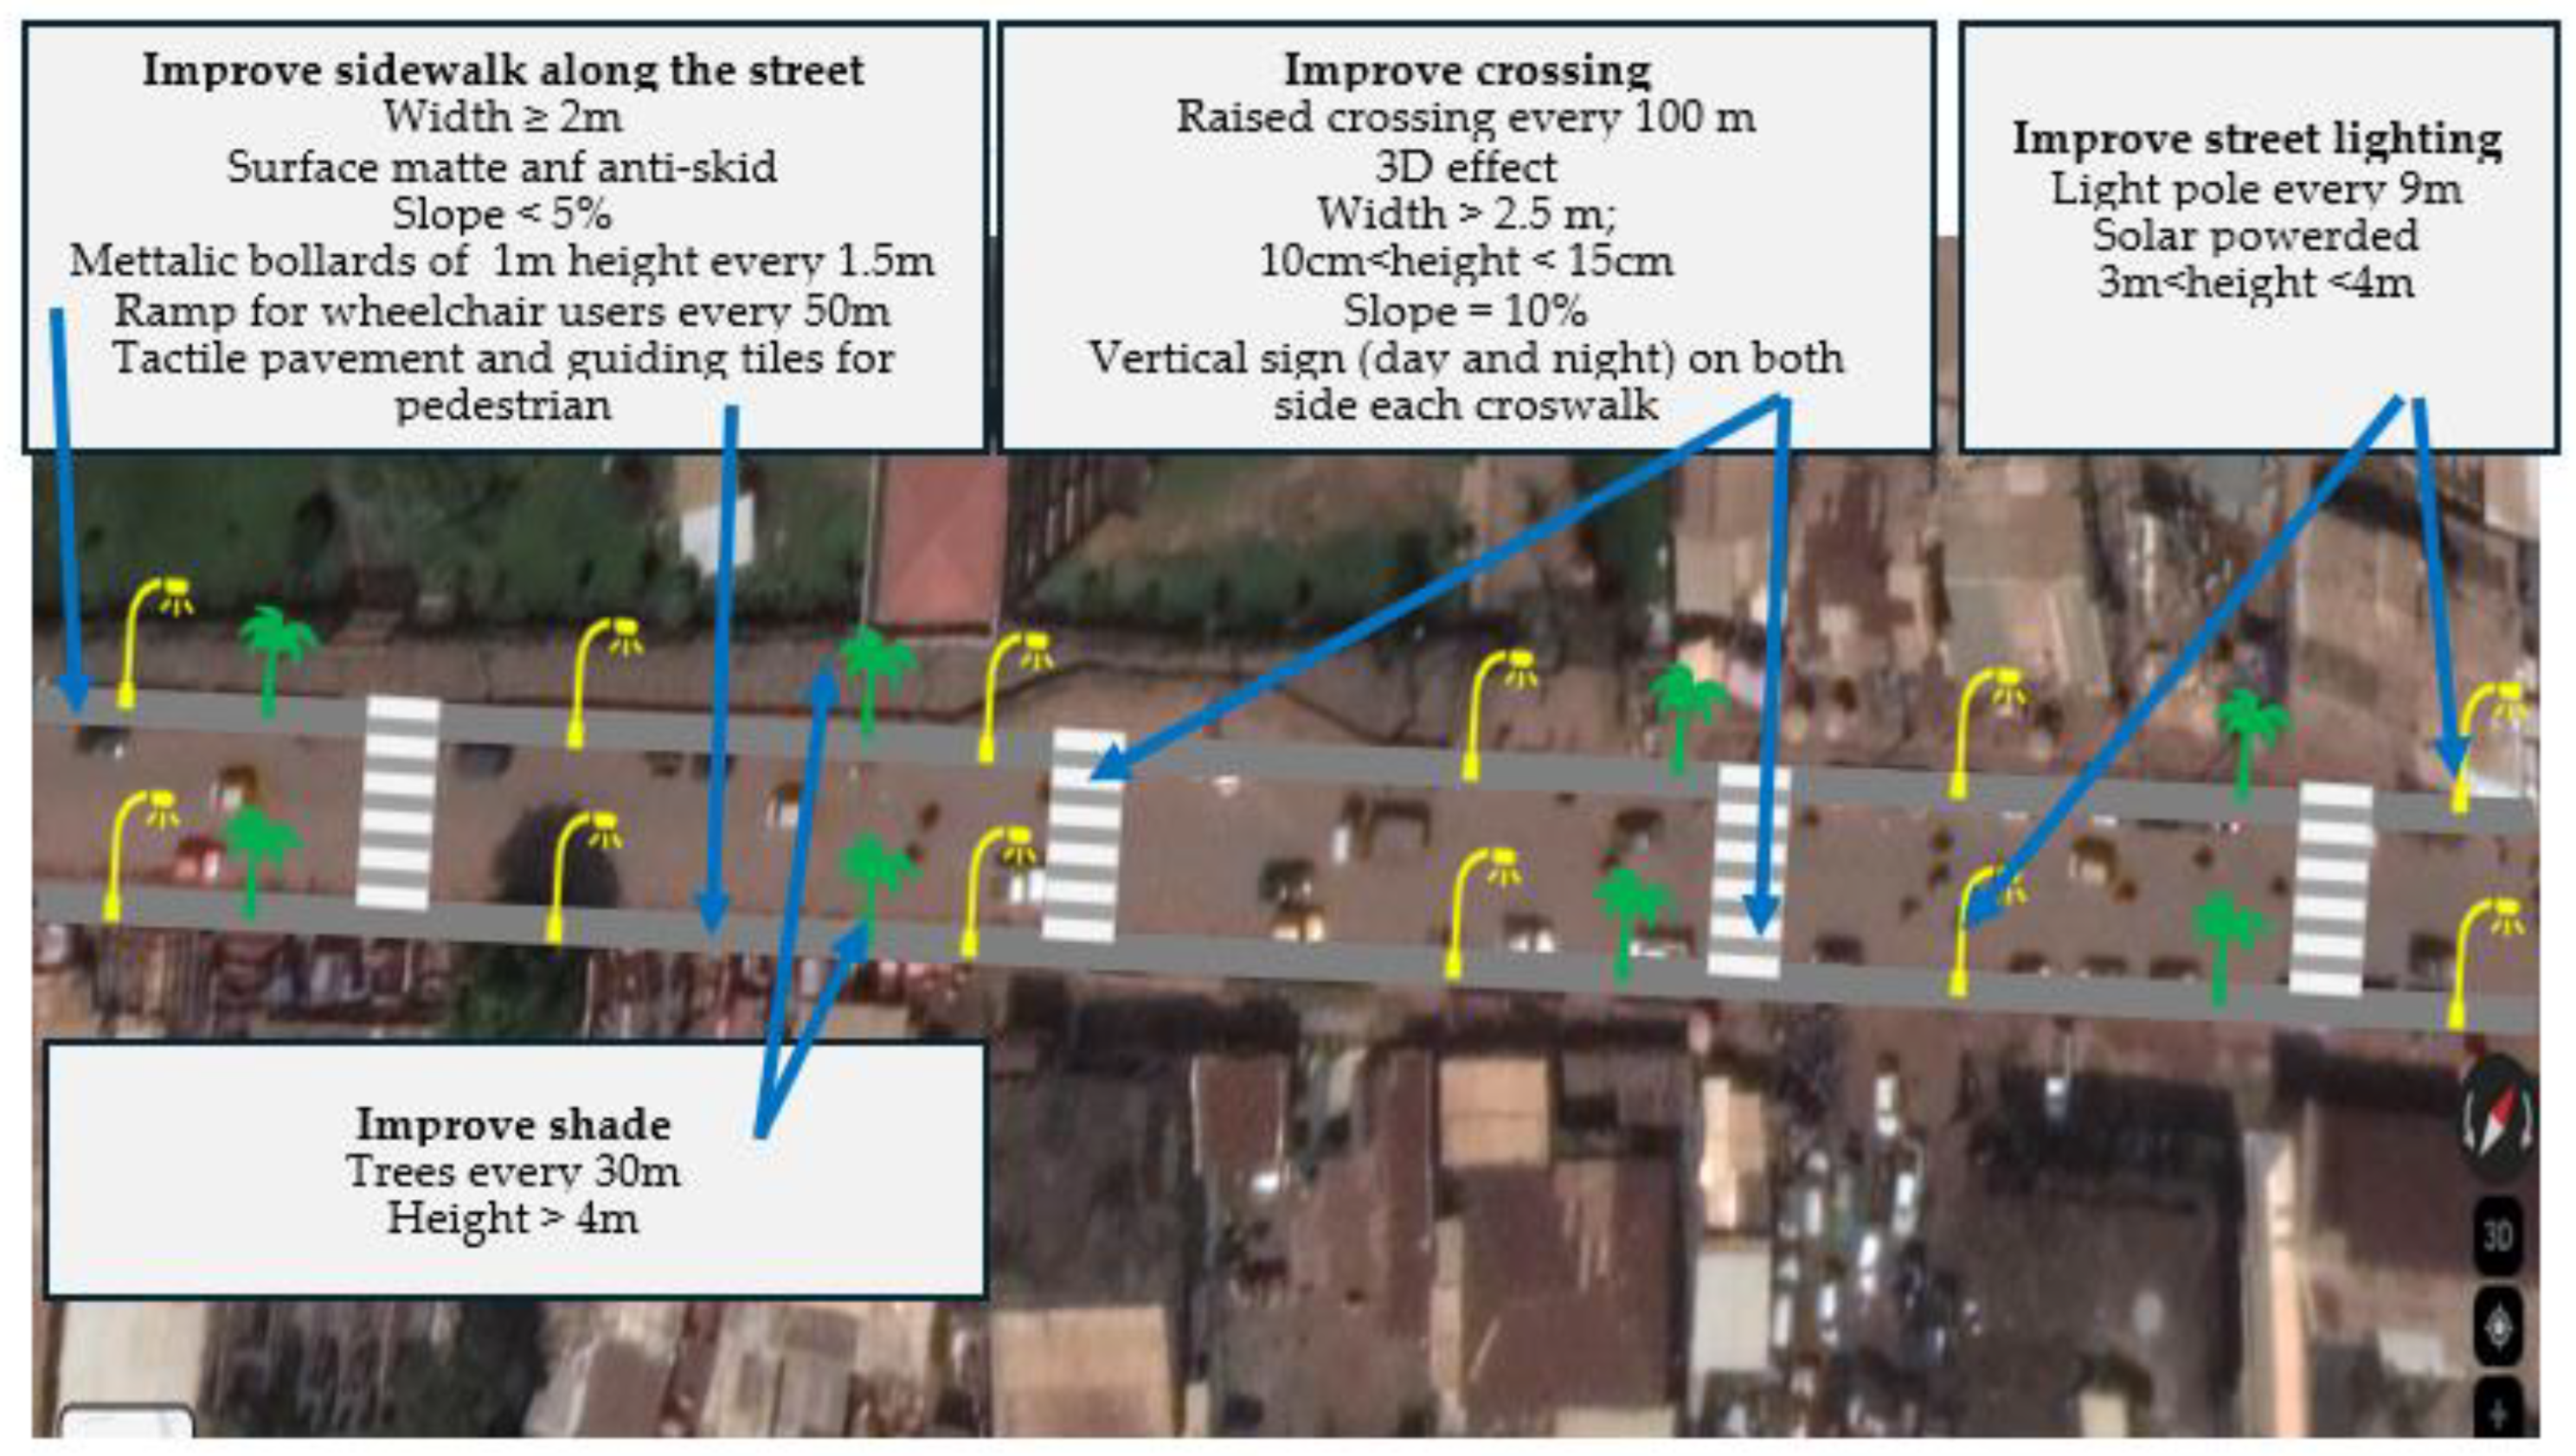
Table 1.
Number (per depth level) of guidelines addressing each of the 24 safety indicators.
| Db | Indicatorsa | |||||||||||||||||||||||
|---|---|---|---|---|---|---|---|---|---|---|---|---|---|---|---|---|---|---|---|---|---|---|---|---|
| 1 | 2 | 3 | 4 | 5 | 6 | 7 | 8 | 9 | 10 | 11 | 12 | 13 | 14 | 15 | 16 | 17 | 18 | 19 | 20 | 21 | 22 | 23 | 24 | |
| 1 | 7 | 3 | 3 | 4 | 3 | 3 | 6 | 7 | 3 | 2 | 0 | 1 | 2 | 5 | 11 | 4 | 6 | 2 | 2 | 4 | 4 | 4 | 3 | 5 |
| 2 | 0 | 9 | 1 | 6 | 7 | 10 | 1 | 3 | 7 | 5 | 0 | 1 | 3 | 7 | 2 | 7 | 2 | 0 | 4 | 0 | 2 | 4 | 2 | 2 |
| 3 | 10 | 6 | 4 | 4 | 5 | 5 | 8 | 3 | 5 | 1 | 13 | 2 | 5 | 4 | 3 | 0 | 8 | 1 | 7 | 1 | 3 | 1 | 6 | 6 |
a 1 – Slower traffic speed,2 – buffer and barriers (curb and furnishing zone), 3 – fewer traffic lane, 4 – shorter crossing distance (curb extension), 5 – mid block crossing, 6 –landscape and tree, 7 – footpath pavement, 8 – marking (crosswalk), 9 – pedestrian refuge and median, 10 – corner island, 11 – sidewalk on both sides, 12 – advance stop bar, 13 – driveway,14 – lighting, 15 – signing, 16 – bollard, 17 – slope, 18 – lift, 19 – curb ramp, 20 – tactile pavement (guiding), 21 – tactile pavement (warning), 22 – ramp, 23 – grade, 24 – signal. b D1 = 1 (incomplete), D2 = 2 (semi complete), D3 = 3 (complete).
Table 2.
Pedestrian safety coefficient values.
| c1 | c2 | c3 | c4 | c5 | c6 | c7 | c8 | c9 | c10 | c11 | c12 | c13 | c14 | c15 | c16 | c17 | c18 | c19 | c20 | c21 | c22 | c23 | c24 |
|---|---|---|---|---|---|---|---|---|---|---|---|---|---|---|---|---|---|---|---|---|---|---|---|
| 37 | 39 | 17 | 28 | 32 | 38 | 32 | 22 | 32 | 15 | 39 | 9 | 23 | 31 | 24 | 18 | 34 | 5 | 31 | 7 | 17 | 15 | 25 | 27 |
Table 3.
Safety Indicator (SIi) computation.
| Indicator evaluation description | Illustration |
|---|---|
|
S = Average vehicle speed in street (km/h) |
50 km/h average speed SI1=1 |
|
(2) Buffer and barriers SI2 = (CI + FI)/2 CI = CL/N1 CL = Standard curb length (m) N1 = Length of curb that street needs (m) FI = C/N2 C = Area of furnishing zone adjacent to the curb (m2 W = Width of furnishing zone adjacent to the curb (m) If W varies in different parts of street Wi = Width of furnishing zone adjacent to the curb in section i (m)/(length of street (both sides) – length of intersections) i = 1, 2, 3, .., k (different parts of street with various widths of the furnishing zone) FICi = Ci/Ai Ci = Area of furnishing zone adjacent to the curb in section i (m2 Li = Length of street in section i (m) |
CL = 1367 m N1 = 1367 m CI = 1 W1 = 5.5 W2 = 1.3 C1 = 280×5.5 = 1540 m2 C2 = 1087 × 1.3 = 1413.1 m2 A1 = 280×5.5 = 1540 m2 A2 = 1087 × 1.8 = 1956.6 m2 FIC1 = 1540/1540 = 1 FIC2 = 1413.1/1956.6 = 0.72 L1 = 280 L2 = 1087 FI = (1×280+0.72×1087)/1367 = 0.78 SI2 = (1 + 0.78)/2 =0.89 |
| Number of lanes = 2 SI3 = 1 |
|
| There is no on street parking and there is sidewalk SI4 = 1 |
|
|
Pci = ci/ni i = 1, 2, 3, …, k (different sections of street between intersections that are more than 120 m)ci = Number of standard mid block crossing in section i ni = Length of street in section i/120 |
c1 = 1 c2 = 1 n1 = 256/120 = 2 n2 = 437/120 = 3 P c1 = 1/2 = 0.5 P c2 = 1/3 = 0.3 P1 = 0.5 P2 = 0.3 SI5 = (0.5 + 0.3)/2 = 0.4 |
|
(6) Landscape and tree SI6 = (P1 + P2)/2 P1 = F/N F = Length of street that has vertical clearance standard condition N = Length of street (both sides)-total length of intersections and their considered standard limitations (m) P2 = NI/I NI = Number of intersections with second standard condition I = Number of total intersections |
F = 1242.20 N = 1325.20 P1 = 1242.20/1325.20 = 0.94 NI = 0 I=3 P2 = 0/3 = 0 SI6 = (0.94 + 0)/2=0.47 |
|
(7) Footpath pavement SI7 = C/N C = Area of standard pavement (m2) Li = length of intersections L = length of street(both sides) W = Width of footpath (m) If W varies in different parts of street Wi = Width of footpath in section i /(length of street (both sides) – length of intersections) i = 1, 2, 3, …, k (different parts of street with various width of the footpath) PCi = Ci/Ni Ci = Area of standard pavement in section i (m2 Li = Length of street in section i (m) |
W = 1.5 C = (1367×1.5)˘(12× 1.5×2) = 2014.5m2 N = 1367 × 1.80 = 2460.6 SI7 = 2014.5/2460.6 = 0.82 |
|
P = C/N C = Number of standard crosswalk markings N = Number of crosswalks that street needs (mid block and cross walk at intersections) |
C = 25 N = 31 P = 25/31 = 0.81 SI8 = 0.81 |
|
P = C/N C = Number of standard crosswalk markings N = Number of crosswalks that street needs (mid block and cross walk at intersections) |
C=1 N=4 P = 1/4 = 0.25 SI9 = 0.25 |
|
(10) Corner island SI10 = C/N C = Number of standard corner islands N = Total corner islands that street has SI10 = 1if there is no corner island |
C = 12 N = 12 SI10 = 1 |
|
(11) Sidewalk on both sides SI11 P1 = l1/N1 l1= Length of sidewalk in one side (m) N1= Length of street – length of intersections in one side (m) P2 = l2/N2 l2= Length of sidewalk in opposite side (m) N2= Length of street – length of intersections in other side (m) |
l1 = 250+430 = 680 N1 = 680 P1 = 680/680 = 1 a=1 l2 = 256+431 = 687 N2 = 687 P2 = 687/687 = 1m =1 SI11 = (1+1)/2 = 1 |
|
P = C/N C = Number of standard advance stop bars N = Total advance stop bars that street needs |
C = 26 N = 32 P = 26/32 = 0.81 SI12 = 0.81 |
|
(13) Driveway SI13= C/N C = Number of standard driveways N = Total driveways that street has SI13= 1 if there is no driveway |
There is no driveway SI13 = 1 |
|
P = C/N LSL = Length of street with pedestrian lighting D= Distance between light poles (m) N = (length of street (both sides) - intersections length) (m) i = 1, 2, 3, … k (different parts of street with various distances between light poles) Ni = length of street in section i (m) |
C=0 N = 680 + 687 = 1367 P = 0/1367 = 0 SI14 = 0 |
|
(15) Signing SI15= C/N C = Total crossing facilities that have signs N = Total crossing facilities that street needs |
C = 25 N = 31 P = 25/31 = 0.81 SI15 = 0.81 |
|
P = C/N C = Number of standard bollards rows N = (total crosswalks + total median crosswalk sections that street needs)×2 |
C=0 N = (31+4)×2 = 70 P = 0/70 = 0 SI16 = 0 |
|
(17) Slope SI17= C/N C = Area of sidewalk with the standard slope (m2) L = length of street(both sides) W = Width of the sidewalk (m) If W varies at different parts of street: Wi = Width of sidewalk (m) in section i i = 1, 2, 3, …, k (different parts of street with various width of the sidewalk) DICi = Ci/Ni Ci = Area of the sidewalk with the standard slope in section i (m2 Li = Length of street in section i (m) |
W = 1.5 C = (1367×1.5)−(12× 1.5×2) = 2014.5m2 N = 1367 × 1.80 = 2460.6 SI17 = 2014.5/2460.6 = 0.82 |
|
(18) Lift SI18= C/N |
C=0 N=2 SI18 = 0/2 = 0 |
|
P = C/N C = Number of standard curb ramps N = Total number of curb ramps the street needs |
C = 58 N = 70 P = 58/70 = 0.83 SI19 = 0.83 |
|
P = C/N C = Length of standard guiding tactile pavement (m) N = Length of guiding tactile pavement that street needs (m) |
C=0 N = 1367 P = 0/1367 = 0 SI20 = 0 |
|
P = C/N C = Number of standard warning tactile pavement rows N = Number of warning tactile pavement rows that street needs |
C=0 N = 1367 P = 0/1367 = 0 SI20 = 0 |
|
P = C/N C = Number of standard ramps N = Number of ramps that street needs |
C=6 N=6 P = 6/6 = 1 SI22 = 1 |
|
(23) Grade SI23= C/N C = Area of sidewalk with the standard grade (m2) L = length of street(both sides) W = Width of the sidewalk (m) If W varies at different parts of street: Wi i = 1, 2, 3, …, k (different parts of street with various width of the sidewalk) DICi = Ci/Ni Ci = Area of the sidewalk with the standard slope in section i (m2 Li = Length of street in section i (m) |
W = 1.5 C = (1367×1.5)−(12× 1.5×2) = 2014.5 m2 N = 1367 × 1.80 = 2460.6 SI23= 2014.5/2460.6 = 0.82 |
|
(24) Signal SI24 A = Signals with sixth condition SI24= 0 if there is no signal |
SP = 14 N = 32 P1 = 14/32 = 0.44 SPI = 0.44 C = 14 P2 = 14/32 = 0.44 CPI = 0.44 W = 14 P3 = 14/32 = 0.44 WPI = 0.44 A = 14 P4 = 14/32 = 0.44 API = 0.44SI24 = (0.44 + 0.44 +0.44+0.44)/4 = 0.44 |
Table 4.
PSI rating (PSI%) interpretation.
| PSI rating (PSI%) | Value range | Interpretation |
|---|---|---|
| A | 80 - 100 | Highest quality (very pleasant), many important pedestrian safety facilities present |
| B | 60 – 79 | High quality (acceptable), some important pedestrian safety facilities present |
| C | 40 – 59 | Average quality (rarely acceptable), pedestrian safety facilities present but room for improvement |
| D | 20 – 39 | Low quality (uncomfortable), minimal pedestrian safety facilities |
| E | 0 - 19 | Lowest quality (unpleasant), no pedestrai safety facilities |
Table 5.
Weigh value of each variable.
| ID | Variable | General weight factor Y1 | School area weight factor Y2 |
|---|---|---|---|
| V1 | Permeable Fronts | 0.08 | 0.06 |
| V2 | Sidewalk Dimensions | 0.18 | 0.2 |
| V3 | Pavement Conditions | 0.18 | 0.18 |
| V4 | Seating Infrastructure | 0.09 | 0.08 |
| V5 | Street Lighting | 0.09 | 0.06 |
| V6 | Obstacle | 0.05 | 0.05 |
| V7 | Crossing Accessibility | 0.14 | 0.2 |
| V8 | Improper Crossing | 0.05 | 0.05 |
| V9 | Trees | 0.14 | 0.12 |
Table 6.
Score of each variable of the global walkability index.
| Indicator evaluation description | Illustration (R1) |
|---|---|
|
(1)
|
There is no bus stop P = 1/5 = 0.2 V1 = P = 0.2 |
|
W = Average width of a street If W varies at different parts of street: |
W = 1.5 m |
|
SI7 = the seventh safety index for pedestrian safety index SI20 = the twentieth safety index for pedestrian safety index SI21 = the twenty-first safety index for pedestrian safety index c7,c20,c21 are the respective coefficients ofSI7,SI20,SI21 |
SI7 = 0.8 SI20 = 0 SI21 = 0 0.46 |
|
NS_G is the number of seating infrastructure which are in fair or good conditions. NS is the number of seating infrastructure that street need. |
There is no seating infrastructure V4 = 0 |
|
(5) Street Lighting V5= SI14 SI14 fourteenth safety index for pedestrian safety index |
SI14 = 0.6 V5 = SI14 = 0.6 |
|
(6) Obstacle V6 = C/N W = Width of footpath (m) If W varies in different parts of street Wi /(length of street (both sides) – length of intersections) i = 1, 2, 3, …, k (different parts of street with various width of the footpath) PCi = Ci/Ni Ci Li = Length of street in section i (m) |
W = 1.5 C = (700 × 1.5) − (25 × 1.5 × 2) = 975 m 2 N = 673 × 1.80 = 1211.4 m 2 V6 = 975/1211.4 = 0.80 |
|
SI8 = the eighth safety index for pedestrian safety index SI9 = the ninth safety index for pedestrian safety index SI12 = the twelfth safety index for pedestrian safety index c8,c9,c12 are the respective coefficients ofSI8,SI9,SI12 |
SI8 = 0.8 SI9 = 0 SI12 = 0 0 |
| There is no crossing section. V8 = 0 |
|
|
|
 V9 = 0 |
Table 8.
General results of the GWI.
| R7 | R5 | R3 | R4 | R8 | R6 | R1 | R11 | R10 | R9 | R2 | R12 | |
| V1 | 0.77 | 0.63 | 0.83 | 0.94 | 0.32 | 0.77 | 0.2 | 0.6 | 0.4 | 0.087 | 0.2 | 0.6 |
| V2 | 1 | 0.6 | 0.6 | 0.6 | 0.8 | 0.6 | 0.6 | 0.6 | 0.4 | 0.4 | 0.4 | 0.2 |
| V3 | 0.56 | 0.47 | 0.49 | 0.41 | 0.55 | 0.45 | 0.46 | 0.33 | 0.16 | 0.16 | 0.32 | 0.091 |
| V4 | 0 | 0 | 0 | 0 | 0 | 0 | 0 | 0 | 0 | 0 | 0 | 0 |
| V5 | 0.6 | 0.6 | 0.6 | 0.6 | 0.45 | 0.6 | 0.6 | 0.29 | 0.15 | 0.15 | 0.29 | 0.3 |
| V6 | 0.99 | 0.82 | 0.86 | 0.72 | 0.6 | 0.8 | 0.8 | 0.57 | 0.28 | 0.28 | 0.56 | 0.16 |
| V7 | 0.17 | 0.048 | 0 | 0 | 0 | 0 | 0 | 0 | 0 | 0 | 0 | 0 |
| V8 | 0.7 | 0.5 | 0 | 0 | 0 | 0 | 0 | 0 | 0 | 0 | 0 | 0 |
| V9 | 0 | 0 | 0 | 0 | 0,1 | 0 | 0 | 0 | 0 | 0 | 0 | 0 |
| GWI | 0.5056 | 0.37 | 0.3605 | 0.347 | 0.346 | 0.345 | 0.301 | 0.261 | 0.155 | 0.137 | 0.199 | 0.118 |
| GWI% | 50.56 | 36.9 | 36.05 | 34.7 | 34.6 | 34.5 | 30.1 | 26.1 | 15.5 | 13.7 | 19.9 | 11.8 |
| Grade | C | D | D | D | D | D | D | D | E | E | E | E |
| Rank | 1 | 2 | 3 | 4 | 5 | 6 | 7 | 8 | 9 | 10 | 11 | 12 |
Table 9.
Ranking of the 12-road segment per PSI and GWI values.
| R7 | R5 | R3 | R4 | R8 | R6 | R1 | R11 | R10 | R9 | R2 | R12 | |
|---|---|---|---|---|---|---|---|---|---|---|---|---|
| GWI | 0.5056 | 0.369 | 0.3605 | 0.347 | 0.346 | 0.345 | 0.301 | 0.261 | 0.155 | 0.137 | 0.199 | 0.118 |
| GWI% | 50.56 | 36.9 | 36.05 | 34.7 | 34.6 | 34.5 | 30.1 | 26.1 | 15.5 | 13.7 | 19.9 | 11.8 |
| Grade | C | D | D | D | D | D | D | D | E | E | E | E |
| Rank | 1 | 2 | 3 | 4 | 5 | 6 | 7 | 8 | 9 | 10 | 11 | 12 |
| PSI | 241.6 | 137.8 | 210.6 | 165.7 | 182.53 | 158.3 | 133.1 | 139.7 | 152.6 | 133.1 | 142.6 | 84.5 |
| PSI% | 40.5 | 23.1 | 35.3 | 27.8 | 30.6 | 26.5 | 22.3 | 23.4 | 25.6 | 22.3 | 23.9 | 14.2 |
| Grade | C | D | D | D | D | D | D | D | D | D | D | E |
| Rank | 1 | 9 | 2 | 4 | 3 | 5 | 10 | 8 | 6 | 11 | 7 | 12 |
Table 10.
Relative validation results.
| Ps | T | P-value | |
|---|---|---|---|
| GWI ranking vs PSI ranking | 0.69 | 3.015 | <0.01 |
Disclaimer/Publisher’s Note: The statements, opinions and data contained in all publications are solely those of the individual author(s) and contributor(s) and not of MDPI and/or the editor(s). MDPI and/or the editor(s) disclaim responsibility for any injury to people or property resulting from any ideas, methods, instructions or products referred to in the content. |
© 2024 by the authors. Licensee MDPI, Basel, Switzerland. This article is an open access article distributed under the terms and conditions of the Creative Commons Attribution (CC BY) license (http://creativecommons.org/licenses/by/4.0/).
Copyright: This open access article is published under a Creative Commons CC BY 4.0 license, which permit the free download, distribution, and reuse, provided that the author and preprint are cited in any reuse.


