
Submitted:
29 February 2024
Posted:
29 February 2024
You are already at the latest version
Abstract
In Yaoundé, Cameroon, excessive and inappropriate speeding remains a major public health concern. Part of the problem are the unsafe speed limits, lack of evidence, and effective evaluation of speeding safety performance indicators (SSPIs), and the absence of speed management, hindering the city's ability to mitigate the risks associated with speeding. This study aimed to address this knowledge gap by assessing SSPIs using a well-defined methodology and suggesting speed management strategies. Data on speed, traffic volumes and road attributes were collected from a random selection of 16 representative road sections in Yaoundé. Seven SSPIs were calculated, and weights were assigned to evaluate city-level SSPIs. The findings showed that 66.8% of drivers drive within the speed limit, generally operating at speeds of 54 km/h with a speed variation of 26 km/h. Based on the speed analysis, evidence-based strategies are proposed, and implementing these strategies could potentially reduce fatalities and serious injuries by 16% to 84% across study locations, as indicated by Elvik's model. These findings have significant policy implications for reducing speeding in Yaoundé, and the methodological approach can be replicated in other urban settings. Future research should extend SSPI evaluation to the national level and test the effectiveness of the recommended strategies.
Keywords:
speeding
; road safety
; speed management
; speed compliance
; safety performance indicators
; urban areas
1. Introduction
Road traffic crashes and fatalities remain a global challenge despite the various improvements in road safety over the years. The situation is most significant for low- and middle-income countries (LMICs), accounting for a substantial 92% of the 1.19 million global deaths [1]. The major cause of crashes and fatalities is consistently linked to speeding (inappropriate or excessive speeds). Speeding is estimated to contribute to about 54% of fatalities worldwide, 57% in LMICs, and 28% in HICs [2]. The figures show that around one person dies every 49 seconds due to speeding with a probability of about 95% that these deaths occur in LMICs. In Europe and OECD countries, past statistics show that speeding accounts for 30% of all fatal cases[3,4]. However, despite the consequences of speeding some drivers fail to recognize speeding as a critical road safety issue and often report speeding, especially in the African context[5].
The outcome of speeding is expected to be critical in LMICs due to the presence of high vulnerable road users population sharing the same road space with motorized vehicles [6]. This is reflected in the recent WHO report showing high vulnerable road user fatalities in LMICs [1]. However, traffic deaths are preventable, and the issue of speed is solvable. This is proven by effective countermeasures such as speed humps, raised pedestrian crossings, speed tables, chicanes, and lane narrowing that has shown great reduction in crashes[7,8,9].
In Cameroon, as in many other African countries, there is a high incidence of road traffic fatalities, with speeding being a significant issue. Recent WHO statistics indicate that the traffic death rate in Cameroon stands at 11 per 100,000 population, despite the presence of only 31,590 vehicles [1]. Part of the problem of these crashes may the absent of safe speed limits. According to the WHO (2023) report, Cameroon has national speed limit laws of 60km/h in urban areas and 110km/h in rural areas, which exceed the recommended speed limits by 30km/h and 40km/h respectively. These elevated speed limits directly contribute to the high toll of fatalities in the country. This is proven by evidence which show that the speed at which a vehicle travels directly impacts the risk of a crash, the severity of injuries sustained, and the likelihood of death resulting from that crash[10,11,12].
Speeding is often reported as an issue in most urban areas in Cameroon, but there is lack of basic empirical studies on the prevalence of speeding. The latest ESRA survey for Cameroon shows that about 40% of drivers reported speeding in built up areas [13].
The capital city of Cameroon, Yaoundé, despite being a growing urban center with increasing vehicular traffic, continues to face significant challenges related to speeding and road safety. The lack of evidence and effective evaluation of speeding safety performance indicators and the absence of speed management strategies hinders the city's ability to mitigate the risks associated with speeding. A critical review of existing literature reveals a conspicuous absence of studies exploring SSPIs in the context of Cameroon and LMICs countries in general, suggesting a significant research gap. This research aimed to bridge the knowledge gap through two objectives.
- i.
- To evaluate the speeding safety performance indicators on selected road sections in Yaoundé using a clearly defined and replicable methodology and applying traditional data collection methods
- i.
- ii. To propose strategies to reduce speeding and improve road safety in the selected locations.
This study holds significance for policy settings to reduce speeding in the city of Yaoundé and outlines a simple and transferable methodology for evaluating SSPIs for other urban settings in LMICs.
2. Materials and Methods
2.1. Speeding Safety performance indicators (SSPI)
Safety performance indicators are useful for monitoring and assessing the operational conditions of the road safety system that influence road safety[14]. Speeding is one of the many safety performance indicators. The speeding indicator can be used to evaluate the effectiveness of strategies related to speed management (such as speed limits). The most widely adopted definition of the speeding indicators is the “Percentage of vehicles travelling within the speed limit” [15]. However, other indicators such as average speeds, excessive speeds (e.g., above the speed limit by 10km/h, 20km/h), 85TH Percentile speeds and speed variation, can provide useful information on specific road safety targets.
Within this study, data (speed, traffic, and road attributes) will be collected to evaluate these indicators adapting the methodological guidelines prescribed in the baseline project (a European study) [16]. The Baseline project was designed to address the need for a comprehensive approach to assessing road safety across Europe and had developed methodological guidelines for measuring and monitoring speeding.
2.2. Site selection
The selection of locations was done randomly ensuring a representative sample for the urban road network in Yaoundé. The GIS system (ArcGIS) was used to provide automatic random selection of road locations within the city. This was adjusted through visual inspection of maps to ensure a wide geographical coverage. This procedure was later complemented by manual selection of specific observation points to ensure they aligned with our prerequisite (defined in 2.3). After these procedures were implemented a total of sixteen (16) locations were selected to represent the urban network. It is worth noting that this number is above the minimum sample requirements of 10 stipulated in SPI guidelines [16,17]. The chosen locations are depicted in Figure 1.
2.3. Identification and selection of observation points
Several factors were considered when selecting the exact observation points to ensure an unbiased representation of the target population as well as to isolate the influence of factors affecting speed. The following points were implemented to identify and select the exact observation points.
- Free flow traffic conditions were ensured by excluding locations with stop signs, traffic lights, intersections and potential areas where vehicles were likely to stop, accelerate, or brake;
- Locations beside speed calming measures such as speed humps and cameras and with any known local speed issues (like over speeding) were avoided;
- A minimum traffic flow of 100 vehicles passing per hour was required to ensure a good representative of the speed data;
- Straight and uniform road section with good pavement conditions was a requirement to isolate the influence of curves and roughness on speed;
- Observation points had to be away from intersections, roadworks, pedestrian crossings and any traffic calming measures by at least 500m.
2.4. Sample size
According to the baseline SSPI methodology, to ensure representative results for the entire road network, the minimum required number of locations is 10 for urban roads (or roads inside urban areas) with a minimum of 500 vehicle observations[16].
However, a different approach was considered for this study. This was to ensure a more representative statistical sample size for determining the mean speed and 85th percentile speeds, as these parameters were amongst the interested SSPIs. A commonly used method for determining sample size for any percentile speed employed by several researchers is considered [18,19,20].
Where, N = minimum number of measured speeds; estimated sample standard deviation; K = constant corresponding to desired confidence level; U = constant corresponding to the desired percentile speed; E = permitted error in the average speed estimation. The values for determining the sample size are shown in Table 1.
For this study, we consider a permissible error of 2km/h, a standard deviation of 12km/h and at 95% confidence interval, the minimum sample size for 85th percentile speed is 213. Given this number, it was ensured that all locations where speed data was collected met this sample requirements.
2.5. Data collection
The data collected in the observation points included speed data, vehicle data, traffic volumes and road attributes. The speed data is useful for calculating the SSPI for the different locations, the vehicle data is useful to differentiate the SSPI according to vehicle type, the traffic volume is useful for weighting the various SSPI and the road attributes is useful to have information on the road type and also to understand the correlation between the attributes and speed. The following considerations were made in collecting the different data:
- Speed and vehicle data: The speed data was collected using a traditional approach (stopwatch method) which still hold strong significance as a low-cost method in a LMIC like Cameroon. University students were trained and employed to carry out the speed survey. This method consisted of two groups of observers positioned at fixed distances (60m) within a road section. One observer is stationed at the start point and a timekeeper located at the endpoint of the 60-meter distance. The observer at the start point notifies the timekeeper when a vehicle passes by the start line. The timekeeper starts and stops the stopwatch as the identified vehicle crosses the finish line. The recorded time and the distance are then used to calculate the vehicles average space speed within the road. The vehicle type for which the time was recorded is noted on the data collection sheet using a predefined code. The vehicle types of focus were taxis, private cars, and motorcycles. During the speed collection, free flow conditions was ensured considering headways between vehicles of at least 5 seconds and ensuring no interference in the speeds of vehicles. Whenever the vehicle stopped or slowed down due to traffic incidents, the speeds were discarded. The observers also stood at suitable locations to avoid drivers noticing that their speeds were being recorded. The overall speed data collection method had the advantage of its simplicity which required little training. However, this method may prone to parallax errors, time consuming and difficult to use when the traffic volumes are high.
- Traffic volume: The speed measurement was conducted in a unidirectional manner, with two collaborators responsible for manual traffic counts working concurrently with the speed survey team. Both teams stopped at the same time (often around 1 to 2 hours), ensuring that the traffic count and speed data are synchronized. Given the differences in stopping times between the study locations, the traffic counts for all locations were normalized to 1 hour to ensure comparison.
- Geometric features: Road characteristics like lane width, number of lanes, median presence, and shoulder width were documented to provide insights into the infrastructure and how it may affect speeds.
In addition, data collection occurred during weekdays and weekends in non-peak hours to capture representative traffic patterns. This approach allowed for a more comprehensive assessment of typical traffic conditions in the city.
2.6. Quality Assurance and Data Treatment
Data quality checks were implemented to ensure accuracy and consistency in the dataset. Outliers and inconsistencies were identified and addressed through a combination of statistical analysis and manual inspection. Any outliers or inconsistencies that were found were corrected or removed from the data set.
2.7. Calculations of the speed performance indicators
The following formulas and methods were used for calculating various speed safety performance indicators.
- Percentage (%) of vehicles traveling within the speed limit (SSP1)
- 2.
- Percentage (%) of drivers driving 10km/h, 20km/h, or 30km/h faster than the speed limit (SSP2, SSP3, SPP4, respectively)
- 3.
- Average speed (SSP5)
- 4.
- 85th percentile (SSP6):
The 85th percentile speed defined as the speed at or below which 85% of vehicles are observed to be traveling. The calculations were automated in excel using the PERCENTILE function.
- 5.
- Speed variation (SSP7)
Speed variation is expressed by the difference between the lowest and highest 10% of speeds. This indicator is calculated as the difference between the 90th percentile speed and the 10th percentile speed. The 10th percentile speed represents the speed below which 10% of the speeds fall, and the 90th percentile speed represents the speed below which 90% of the speeds fall. The speed variation is calculated as below:
Speed variation = (Highest 10% speed - Lowest 10% speed)
2.8. Weighted safety performance indicator
To provide a representative value of the SSPI for the whole city, it was necessary to assign weights to the individual SSPI calculated in the different locations. The weighting takes in to account the varying traffic volumes and the relative importance of each road. The formula for calculating the weighted KPI is shown below.
Where,
3. Results and discussion
The analysis was performed using Excel and SPSS statistical package V20. Descriptive statistics for the speed data is shown in Table 2. It provides information and understanding of the main characteristics of the dataset, such as its central tendency, variability, and the shape of the distribution. The results obtained for all SPSS indicators and the weighted SSPI is summarized in Table 3.
The posted speed limit recorded for most of the locations was 50km/h. In areas where this was not evident the posted speed limit in the nearest road was assumed (due to spillover effect) and in all cases it was 50km/h. This assumption was also aided by local knowledge. The descriptive statistics in Table 2 revealed a generally moderate traffic flow, but with some noteworthy variations. The mean speed and the median speeds generally aligned with the posted limit. However, the standard deviations were very high in certain locations which is explained by the high combination of slow-moving vehicles and fast-moving vehicles. These varying standard deviations indicates a mix of speeds clustering around the average but also some deviation on both sides.
Table 3 presents the speeding safety performance indicators (SSPIs) for the individual locations as well as the weighted value which represents the city level SSPIs. The results provide crucial insights into the speed performance of drivers in the specific locations as well as a representative of the entire city. The study revealed several interesting findings. Firstly, the percentage of drivers driving 10km/h, 20km/h, or 30km/h faster than the speed limit were found to be 28km/h, 9km/h, and 4km/h respectively. This observation shows the extent of speeding violations in the entire city and has some implications for safety policies. However, while the aggregated city values these three indicators are quite modest, it is worth noting that some locations present very high-speed violations suggesting the need for targeted speed management interventions.
The average speed for the city level was determined to be around 45km/h (below the speed limit), while the 85th percentile speed (operating speed), which represents the speed at or below which 85% of vehicles are traveling, was found to be about 54km/h. However, while the operating speed is around the speed limit for the city level, it does not necessarily reflect good safety performance as several individual locations presented high values of operating speed. This operating speed is not survivable for pedestrians and cyclist from the safe system perspective [21,22]. Moreover, the speed variations (the difference between the 10th and 90th percentile speeds), was quite high (25km/h) due to the mix of slow moving and fast-moving vehicles. This high variation is problematic from the safety perspective as there is evidence of a positive relationship between speed variance and crash rates[23,24]. A summary comparison of the levels of some SSPIs between the individual locations and the city level is shown in Figure 2.
A Pearson correlation analysis was conducted (Table 4) to examine the relationship between the road attribute features and the speeds (mean speed and operating speeds) at different locations. Specifically, a statistically significant positive correlation (p<0.05) was observed between the median width and the speed variables. The lane width and shoulder width also exhibited a good correlation, but this was not statistically significant at p<0.05. As anticipated, the lateral clearance showed a negative relationship with speed, although this relationship was not statistically significant. Overall, these correlations provide insights for any speed management strategies that involves infrastructure changes.
4. Recommendation for speed management in the city and expected benefits
To mitigate the speeding issue in city and in specific locations, an integrated speed management is needed with diverse interventions including speed limit change (according to road function), engineering measures, enforcement strategies, and educational campaigns. These interventions are expected to be implemented simultaneously so that in synergy the expected outcome would be optimized.
In line with the recommendations of setting speed limits following the safe system approached [7], we propose speed limits for the different locations following their road function. For locations with schools, hospitals, and shops and where there is high interaction between pedestrians, other vulnerable road users share and motorized vehicles, we propose speed limits of 30km/h. In areas where there is need for mobility but also with high vulnerable road user presence, we propose speed limits of 40km/h.
To ensure compliance, setting speed limits is not enough, and necessitate other interventions to work in synergy. Table 5 provides a list of suggested interventions which have been proven effective [7,8,9,25], also for some LMICs like Ghana [26,27].
After the implementation of these measures, it is critical to monitor and evaluate the results. Assuming these suggested speed interventions are applied causing drivers to operate at the set speed limits, it is possible to estimate the expected benefits of these interventions following the exponential model developed by Elvik [11]. According to the exponential model, a 1 km/h reduction in speed corresponds to a 7.7% reduction in fatalities and 5.8% reduction in injury crashes. This model is applied to estimate the expected impact at the different locations for reduction in the current operating speeds to the proposed speed limits. The benefits in terms of fatalities and serious injuries are reflected in Figure 3.
Overall, it is recommended that concerted efforts should be directed towards fostering inter-agency coordination (Police, ministry of transport, city councils, universities) and synergy to orchestrate a cohesive response to speeding challenges in the city of Yaoundé.
5. Conclusions
Speeding is recognized as the major contributory factor to road crashes, especially in low- and middle-income countries (LMICs). The capital city of Cameroon, Yaoundé, despite being a growing urban center with increasing vehicular traffic, continues to face significant challenges related to speeding and road safety. Part of the problem is the absence of safe speed limits. Another issue is the lack of effective evaluation of speeding safety performance indicators and the absence of speed management, hindering the city's ability to mitigate the risks associated with speeding. The study aimed to address this knowledge gap by assessing indicators of speeding safety performance (SSPIs) using a clearly defined methodology and providing recommendations for speed management. The methodology, which aligns with international guidelines, is easily replicable in areas with a similar context to Cameroon.
The weighted values for the SSPIs, representing the city level, indicate that 66.8% of drivers drive within the speed limit, generally operating at speeds of 54 km/h. The speed variation indicator (the difference between the 10th and 90th percentile speeds) is 25.75 km/h, indicating a high mix of slow- and fast-moving vehicles. The percentage of drivers exceeding the speed limit by 10 km/h, 20 km/h, or 30 km/h was found to be 28%, 9%, and 4% respectively. Based on the speed analysis, recommendations are provided for speed management, which involve an integrated approach including speed limit changes, infrastructure modifications, enforcement, and education. Evidence-based strategies are proposed, and implementing these strategies to maintain speeds within the proposed speed limits could potentially reduce fatalities and serious injuries by 16% to 84% across the study locations, as indicated by Elvik's model.
Overall, the study provides insights into the methods (including low-cost alternatives) for calculating SSPIs. It provides estimates for these SSPIs for the city of Yaoundé and links the results of the SSPIs to strategies for mitigating speeds. These findings could empower policymakers and stakeholders to implement data-driven interventions, ultimately saving lives and reducing the devastating impact of excessive speed.
However, the study has some limitations that must be acknowledged. While the stopwatch method for speed data collection is a low-cost measure, it is usually labor-intensive and can introduce parallax errors in the measurements. It may also be difficult to remain fully hidden from drivers, which may cause them to slow down. Future studies may explore the use of other data collection methods like RADAR systems, LiDAR, or cameras. Regarding data limitations, the study was limited to selected road sections in the city of Yaoundé, with a study boundary consisting of only 16 locations. Further studies may explore evaluating the SSPI for the entire country, considering different road types.
Author Contributions
Conceptualization, writing and original draft preparation by Stephen Kome Fondzenyuy.; data curatioin and analysis by Mbogshikeh Divine Moh.; review and editing by Steffel Ludivin Feudjio Tezong. Methodology, review and editing by Davide Shingo Usami. Supervision and review by Luca Persia.
Funding
This research received no external funding.
Institutional Review Board Statement
Not applicable.
Informed Consent Statement
Not applicable.
Data Availability Statement
The data is available upon request.
Acknowledgments
We acknowledge the administrative staff and students at the National Advanced School of Publics.
Conflicts of Interest
The authors declare no conflicts of interest.
References
- WHO, “Global status report on road safety 2023,” 2023. Accessed: Dec. 13, 2023. [Online]. Available online: https://www.who.int/publications/i/item/9789240086517.
- S. K. Fondzenyuy, B. M. Turner, A. F. Burlacu, and C. Jurewicz, “Title: The Contribution of Excessive or Inappropriate Speeds to Road Traffic Crashes and Fatalities: A Review of Literature,” 2024. [CrossRef]
- European Commission, “Road Safety Thematic Report - Speeding,” European Road Safety Observatory, 2021.
- OECD/ECMT, “Speed Management,” 2006. [CrossRef]
- K. Torfs, S. Delannoy, L. Schinckus, B. Willocq, W. Van den Berghe, and U. Meesmann, “Road Safety culture in Africa Results from the ESRA2 survey in 12 African countries.ESRA project (E-Survey of Road users’ Attitudes). Brussels, Belgium: Vias institute,” Vias institute, Belgium, 2021.
- P. Tankasem, T. Satiennam, W. Satiennam, S. Jaensirisak, and W. Rujopakarn, “Effects of automated speed control on speeding intention and behavior on mixed-traffic urban arterial roads,” IATSS Research, vol. 46, no. 4, pp. 492–498, Dec. 2022. [CrossRef]
- Eva M Eichinger-Vill, Blair M Turner, and Alina F Burlacu, “SPEED MANAGEMENT: A road safety manual for decision-makers and practitioners,” 2023. Accessed: Feb. 17, 2024. [Online]. Available online: https://www.who.int/publications/m/item/speed-management--a-road-safety-manual-for-decision-makers-and-practitioners.-2nd-edition.
- T. Makwasha and B. Turner, “Safety of raised platforms on urban roads,” J Australas Coll Road Saf, vol. 28, no. 2, pp. 20–27, 2017, [Online]. Available online: http://acrs.org.au/publications/journals/current-and-back-issues/%0Ahttps://trid.trb.org/view/1471203.
- B. Turner, S. Job, and S. Mitra, “Guide for Road Safety Interventions,” Guide for Road Safety Interventions, 2020. [CrossRef]
- C. Jurewicz, A. Sobhani, J. Woolley, J. Dutschke, and B. Corben, “Exploration of Vehicle Impact Speed - Injury Severity Relationships for Application in Safer Road Design,” Transportation Research Procedia, vol. 14, pp. 4247–4256, 2016. [CrossRef]
- R. Elvik, A. Vadeby, T. Hels, and I. van Schagen, “Updated estimates of the relationship between speed and road safety at the aggregate and individual levels,” Accid Anal Prev, vol. 123, no. October 2018, pp. 114–122, 2019. [CrossRef]
- C. Kloeden, G. Ponte, and A. McLean, “Travelling Speed and the Risk of Crash Involvement on Rural Roads,” Ponte, vol. 1, p. 61, 2001, [Online]. Available online: http://raru.adelaide.edu.au/ruralspeed.
- vias institute, “Cameroon – ESRA2 Country Fact Sheet. ESRA2 survey (E-Survey of Road users’ Attitudes). Brussels, Belgium: Vias institute.,” 2020. [Online]. Available online: https://www.esranet.eu/storage/minisites/esra2019countryfactsheetcameroon.pdf.
- A.S. Hakkert and V. Gitelman (Eds.), “Road Safety Performance Indicators: Manual. Deliverable D3.8 of the EU FP6 project SafetyNet,” 2007.
- European Commission, “Road safety thematic report – Speeding. European Road Safety Observatory.Brussels, European Commission, Directorate General for Transport,” 2021.
- B. B. Van den, A. Letty, and P. Silverans, “Baseline report on the KPI Speeding. Baseline project, Brussels: Vias institute,” 2023, Accessed: Feb. 18, 2024. [Online]. Available online: https://road-safety.transport.ec.europa.eu/system/files/2023-03/Baseline_KPI_Speeding.pdf.
- A. , Laiou et al., “KPI Speed. Methdological Guidelines. Report produced as part of the Trendline project, supported by the European Union,” 2023.
- A. Abdul-Mawjoud and G. G. Sofia, “Development of models for predicting speed on horizontal curves for two-lane rural highways,” Arab J Sci Eng, vol. 33, no. 2 B, pp. 365–377, 2008.
- D. R. Jessen, K. S. Schurr, P. T. McCoy, G. Pesti, and R. R. Huff, “Operating speed prediction on crest vertical curves of rural two-lane highways in Nebraska,” Transp Res Rec, no. 1751, pp. 67–75, 2001. [CrossRef]
- R. Bennett, “A speed prediction model for rural two-lane highways,” no. March, p. 476, 1994.
- Q. Hussain, H. Feng, R. Grzebieta, T. Brijs, and J. Olivier, “The relationship between impact speed and the probability of pedestrian fatality during a vehicle-pedestrian crash: A systematic review and meta-analysis,” Accid Anal Prev, vol. 129, no. April, pp. 241–249, 2019. [CrossRef]
- S. D. Doecke, C. N. Kloeden, J. K. Dutschke, and M. R. J. Baldock, “Safe speed limits for a safe system: The relationship between speed limit and fatal crash rate for different crash types,” Traffic Inj Prev, vol. 19, no. 4, pp. 404–408, 2018. [CrossRef]
- P. Choudhary, M. Imprialou, N. R. Velaga, and A. Choudhary, “Impacts of speed variations on freeway crashes by severity and vehicle type,” Accid Anal Prev, vol. 121, no. January, pp. 213–222, 2018. [CrossRef]
- M. Quddus, “Exploring the Relationship Between Average Speed, Speed Variation, and Accident Rates Using Spatial Statistical Models and GIS,” Journal of Transportation Safety and Security, vol. 5, no. 1, pp. 27–45, 2013. [CrossRef]
- T. Makwasha and B. Turner, “Safety of raised platforms on urban roads,” pp. 1–2, 2016.
- J. Damsere-Derry, F. K. Afukaar, P. Donkor, and C. Mock, “Assessment of vehicle speeds on different categories of roadways in Ghana.,” Int J Inj Contr Saf Promot, vol. 15, no. 2, pp. 83–91, 2008. [CrossRef]
- F. K. Afukaar, “Speed control in developing countries: issues, challenges and opportunities in reducing road traffic injuries.,” Inj Control Saf Promot, vol. 10, no. 1–2, pp. 77–81, 2003. [CrossRef]
Figure 1.
Geographic distribution of study locations.
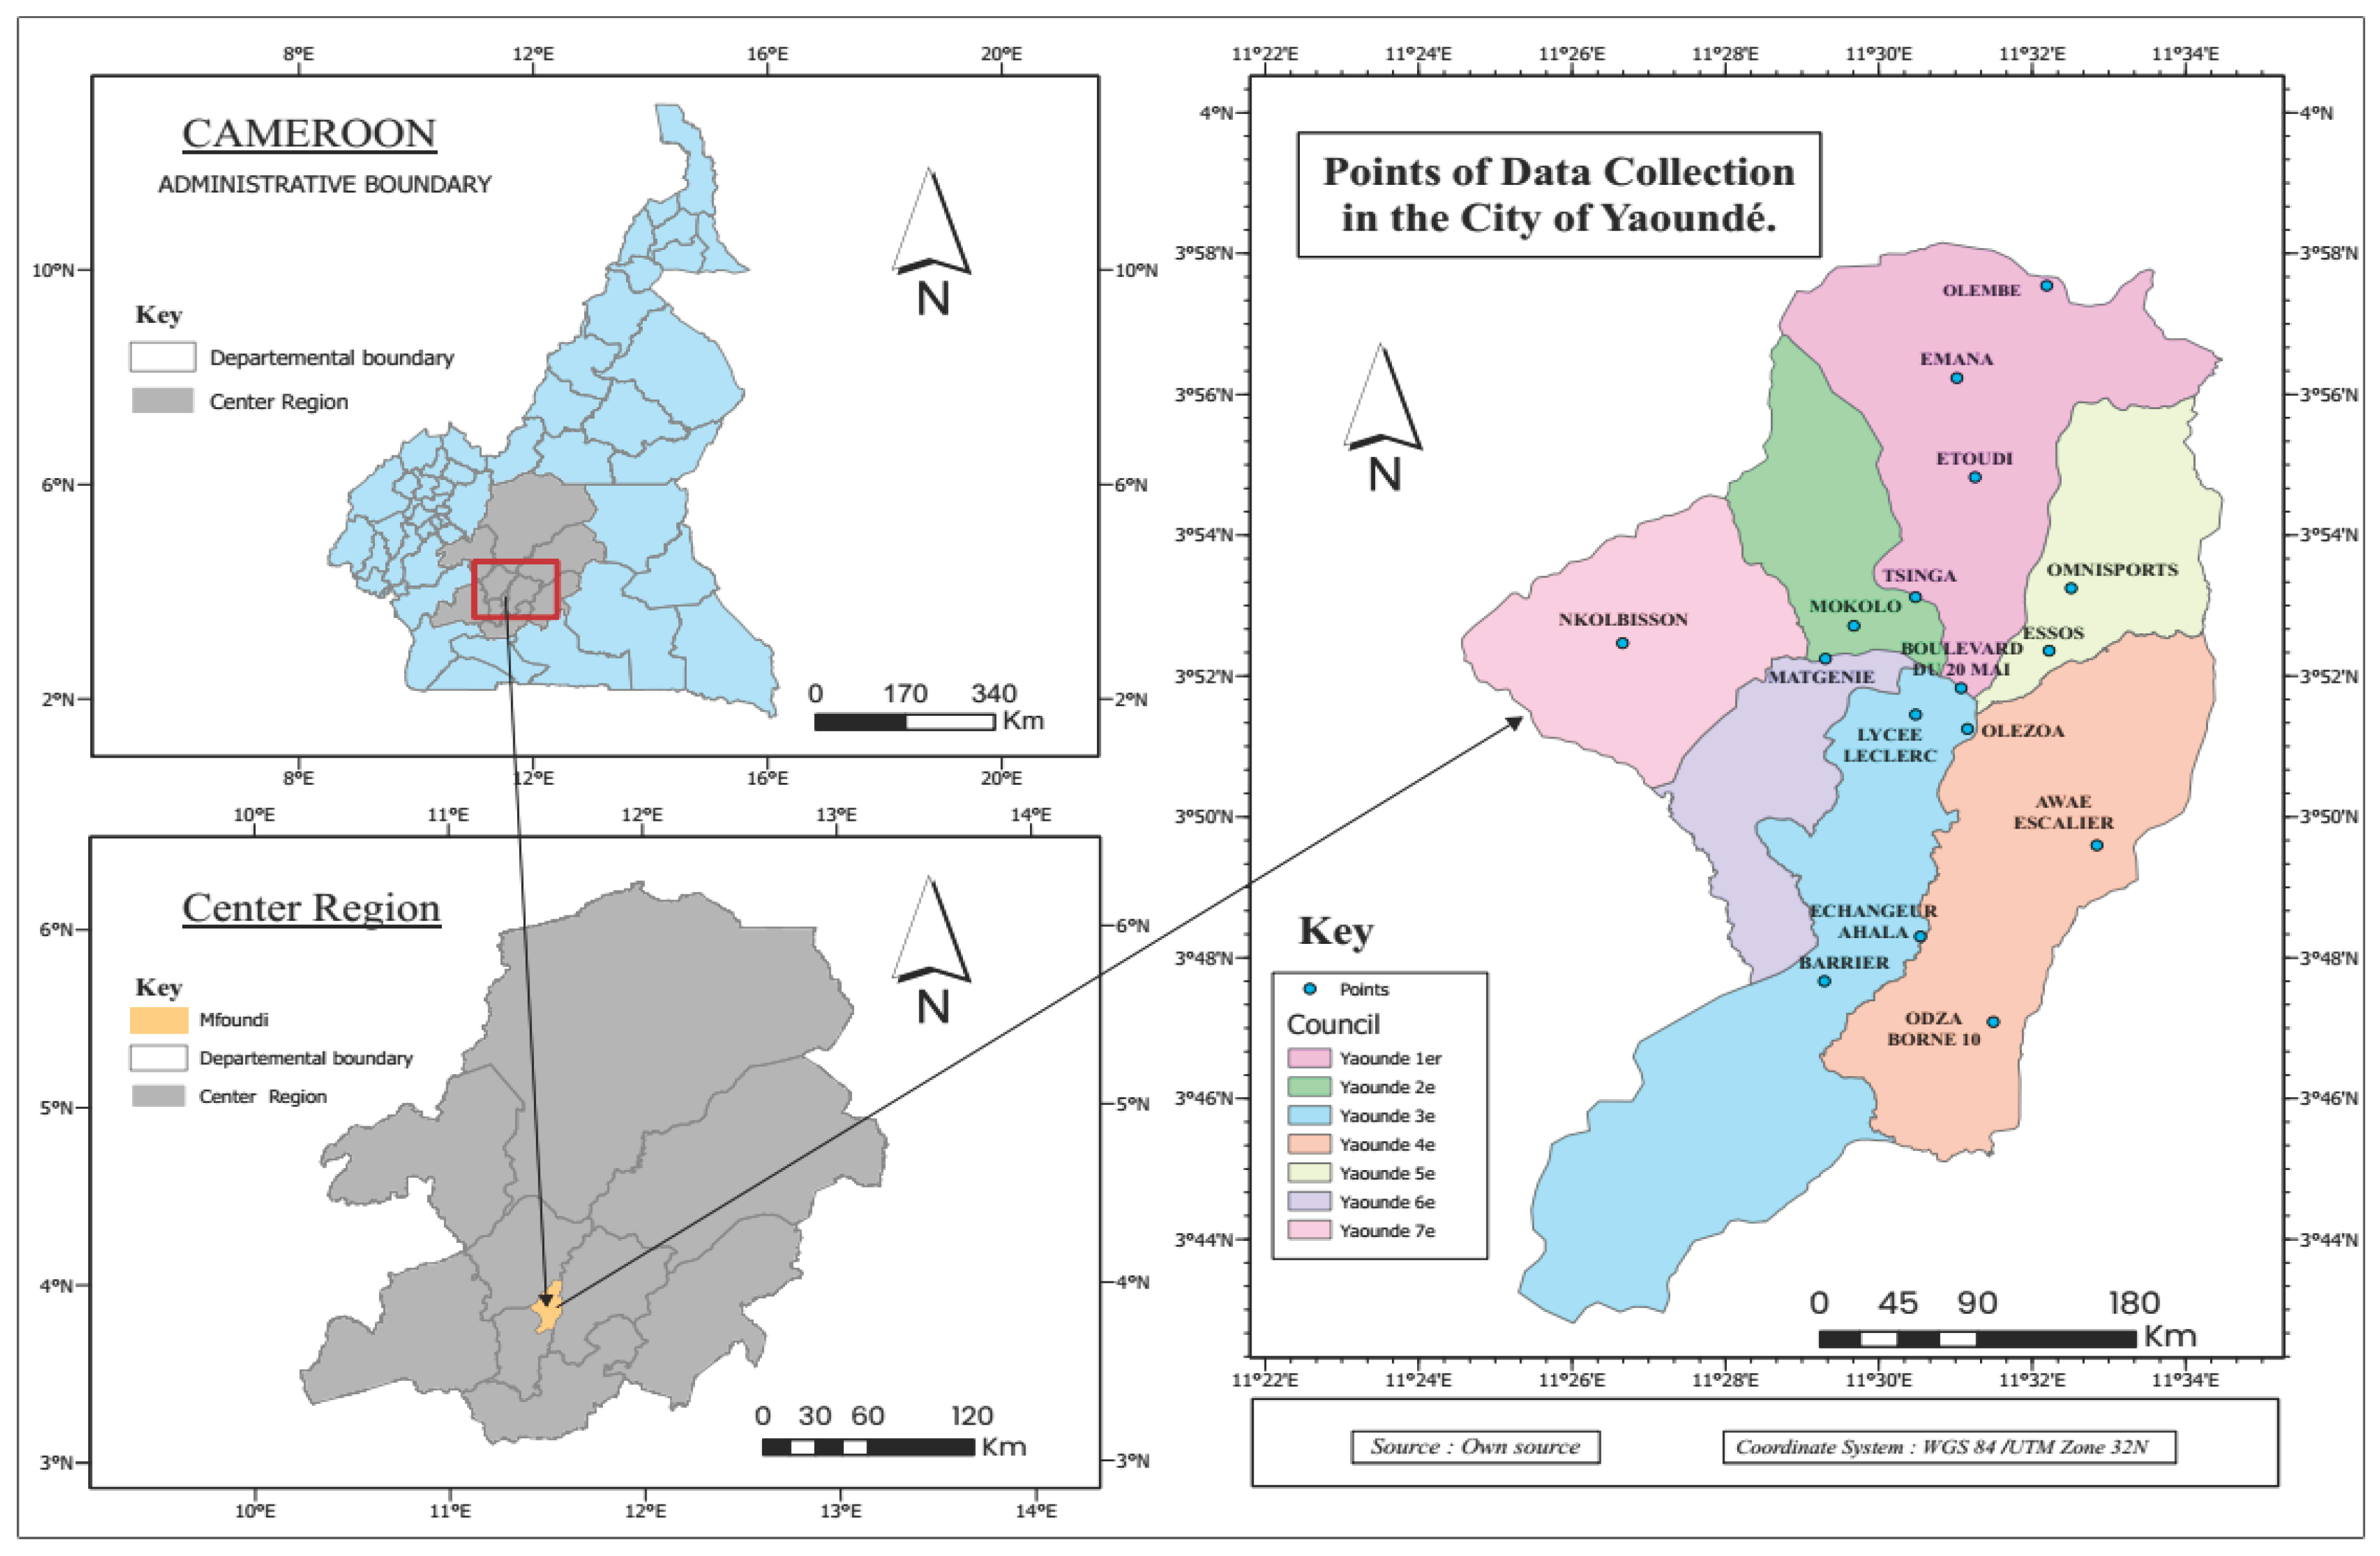
Figure 2.
Comparison of SSPIs between locations and the aggregated city level.
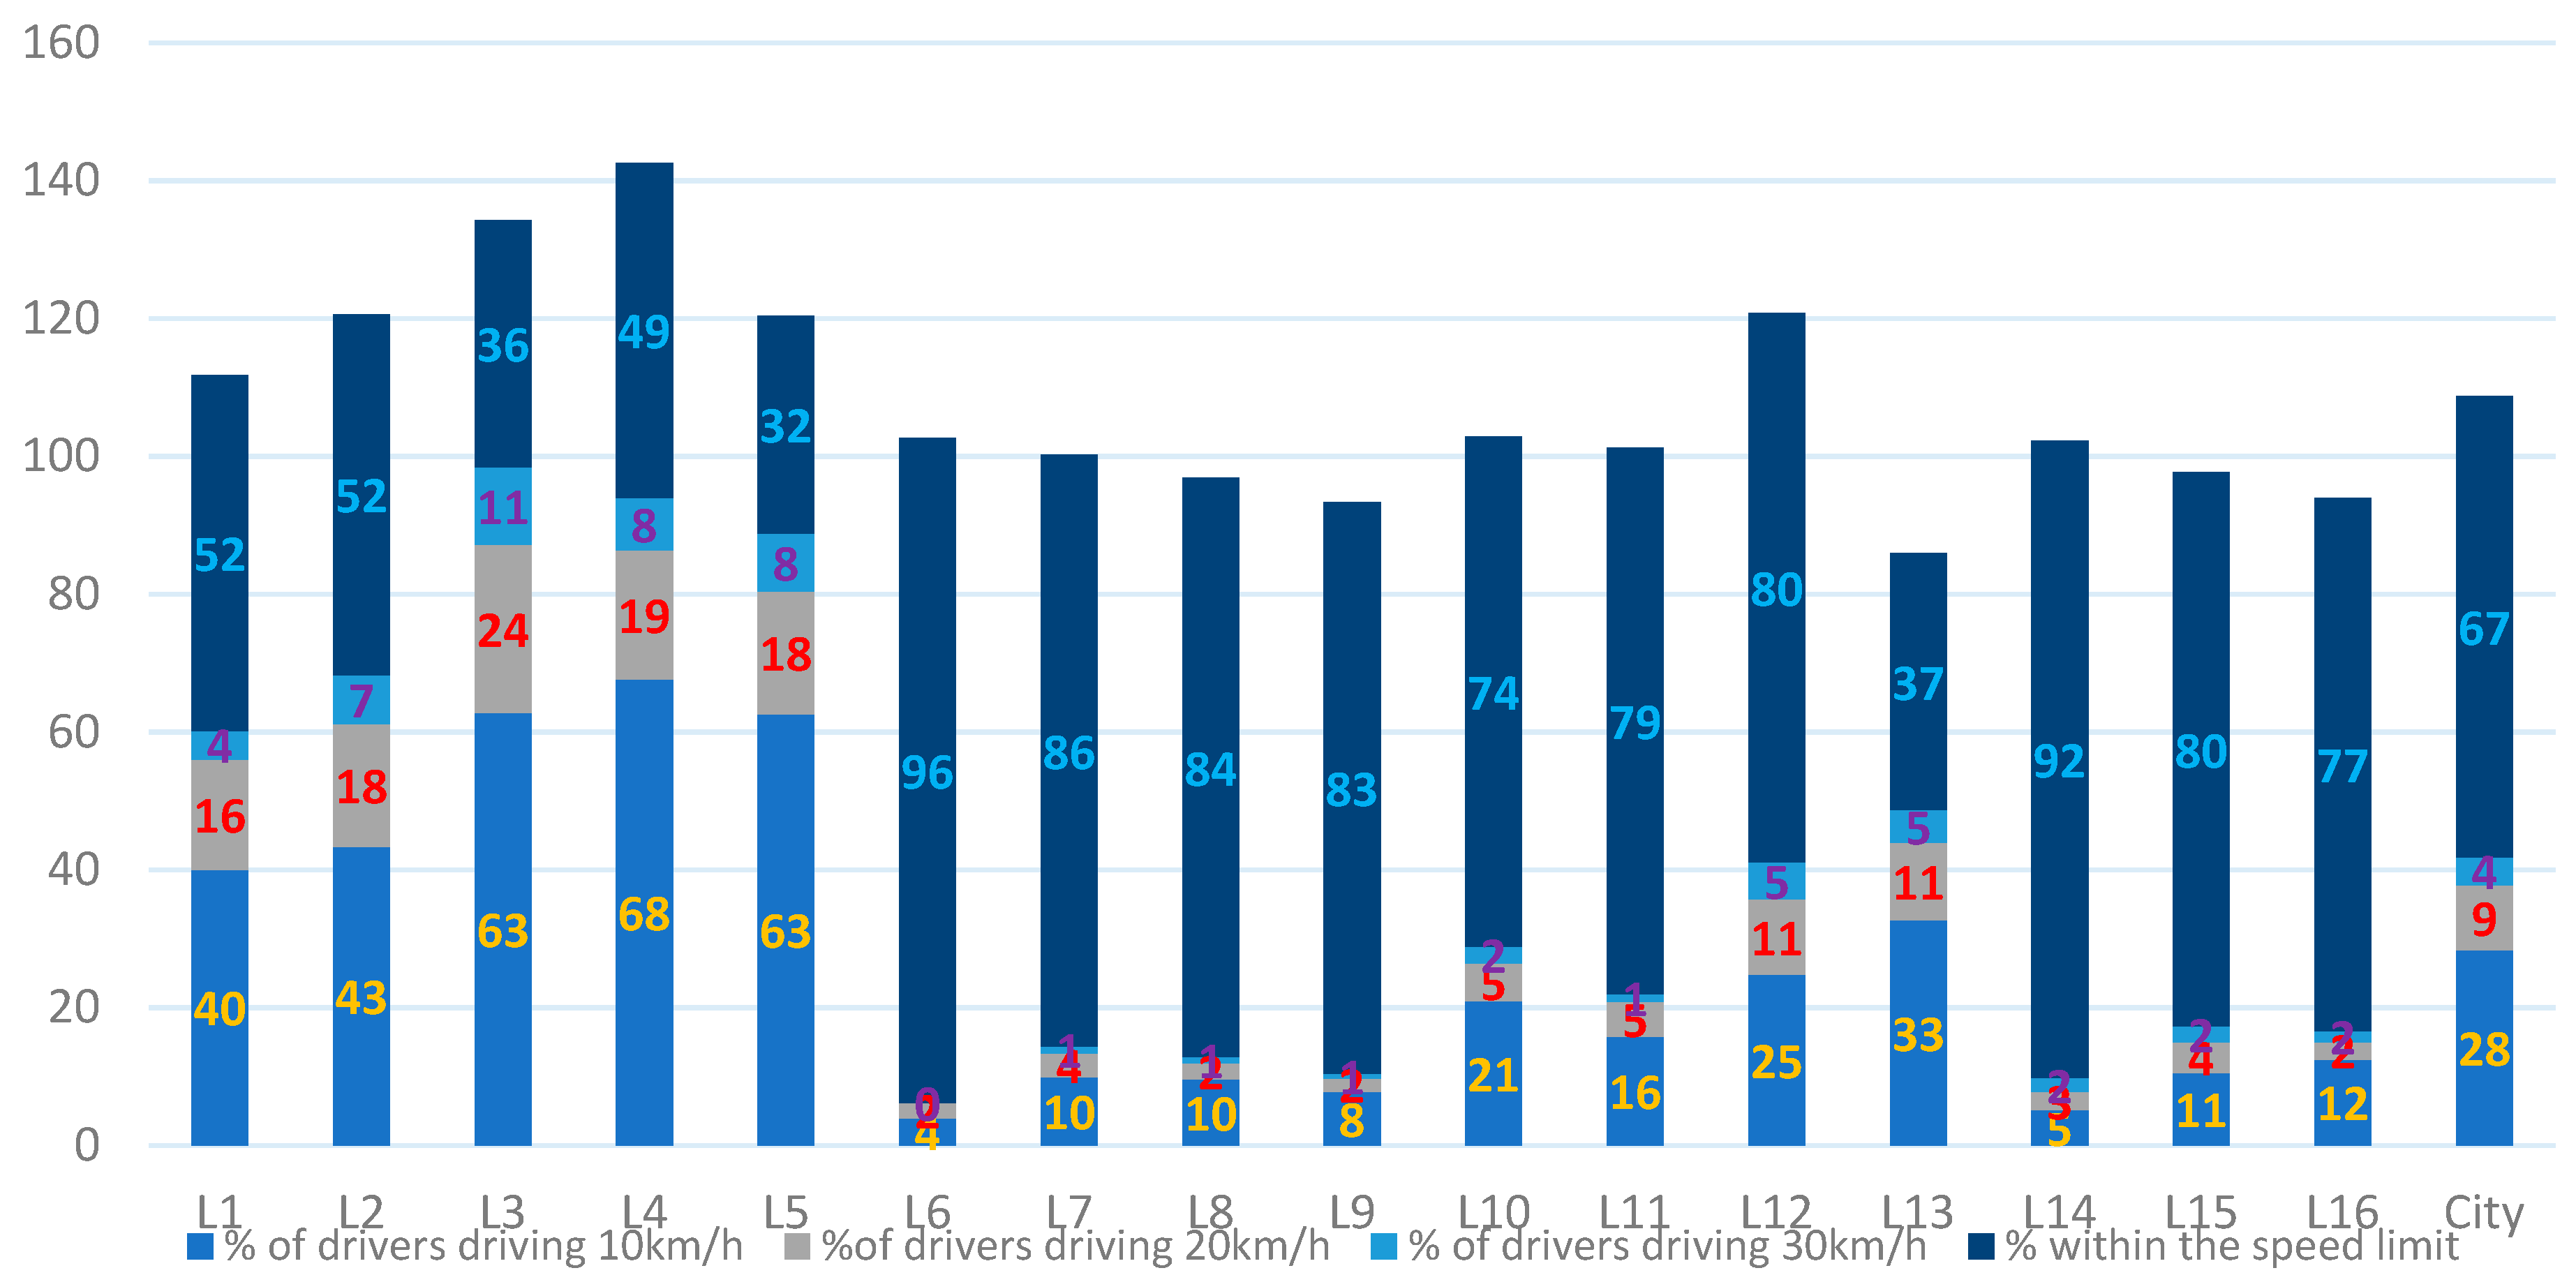
Figure 3.
Safety Impacts of Speed Reduction at study locations using Elvik's exponential model.
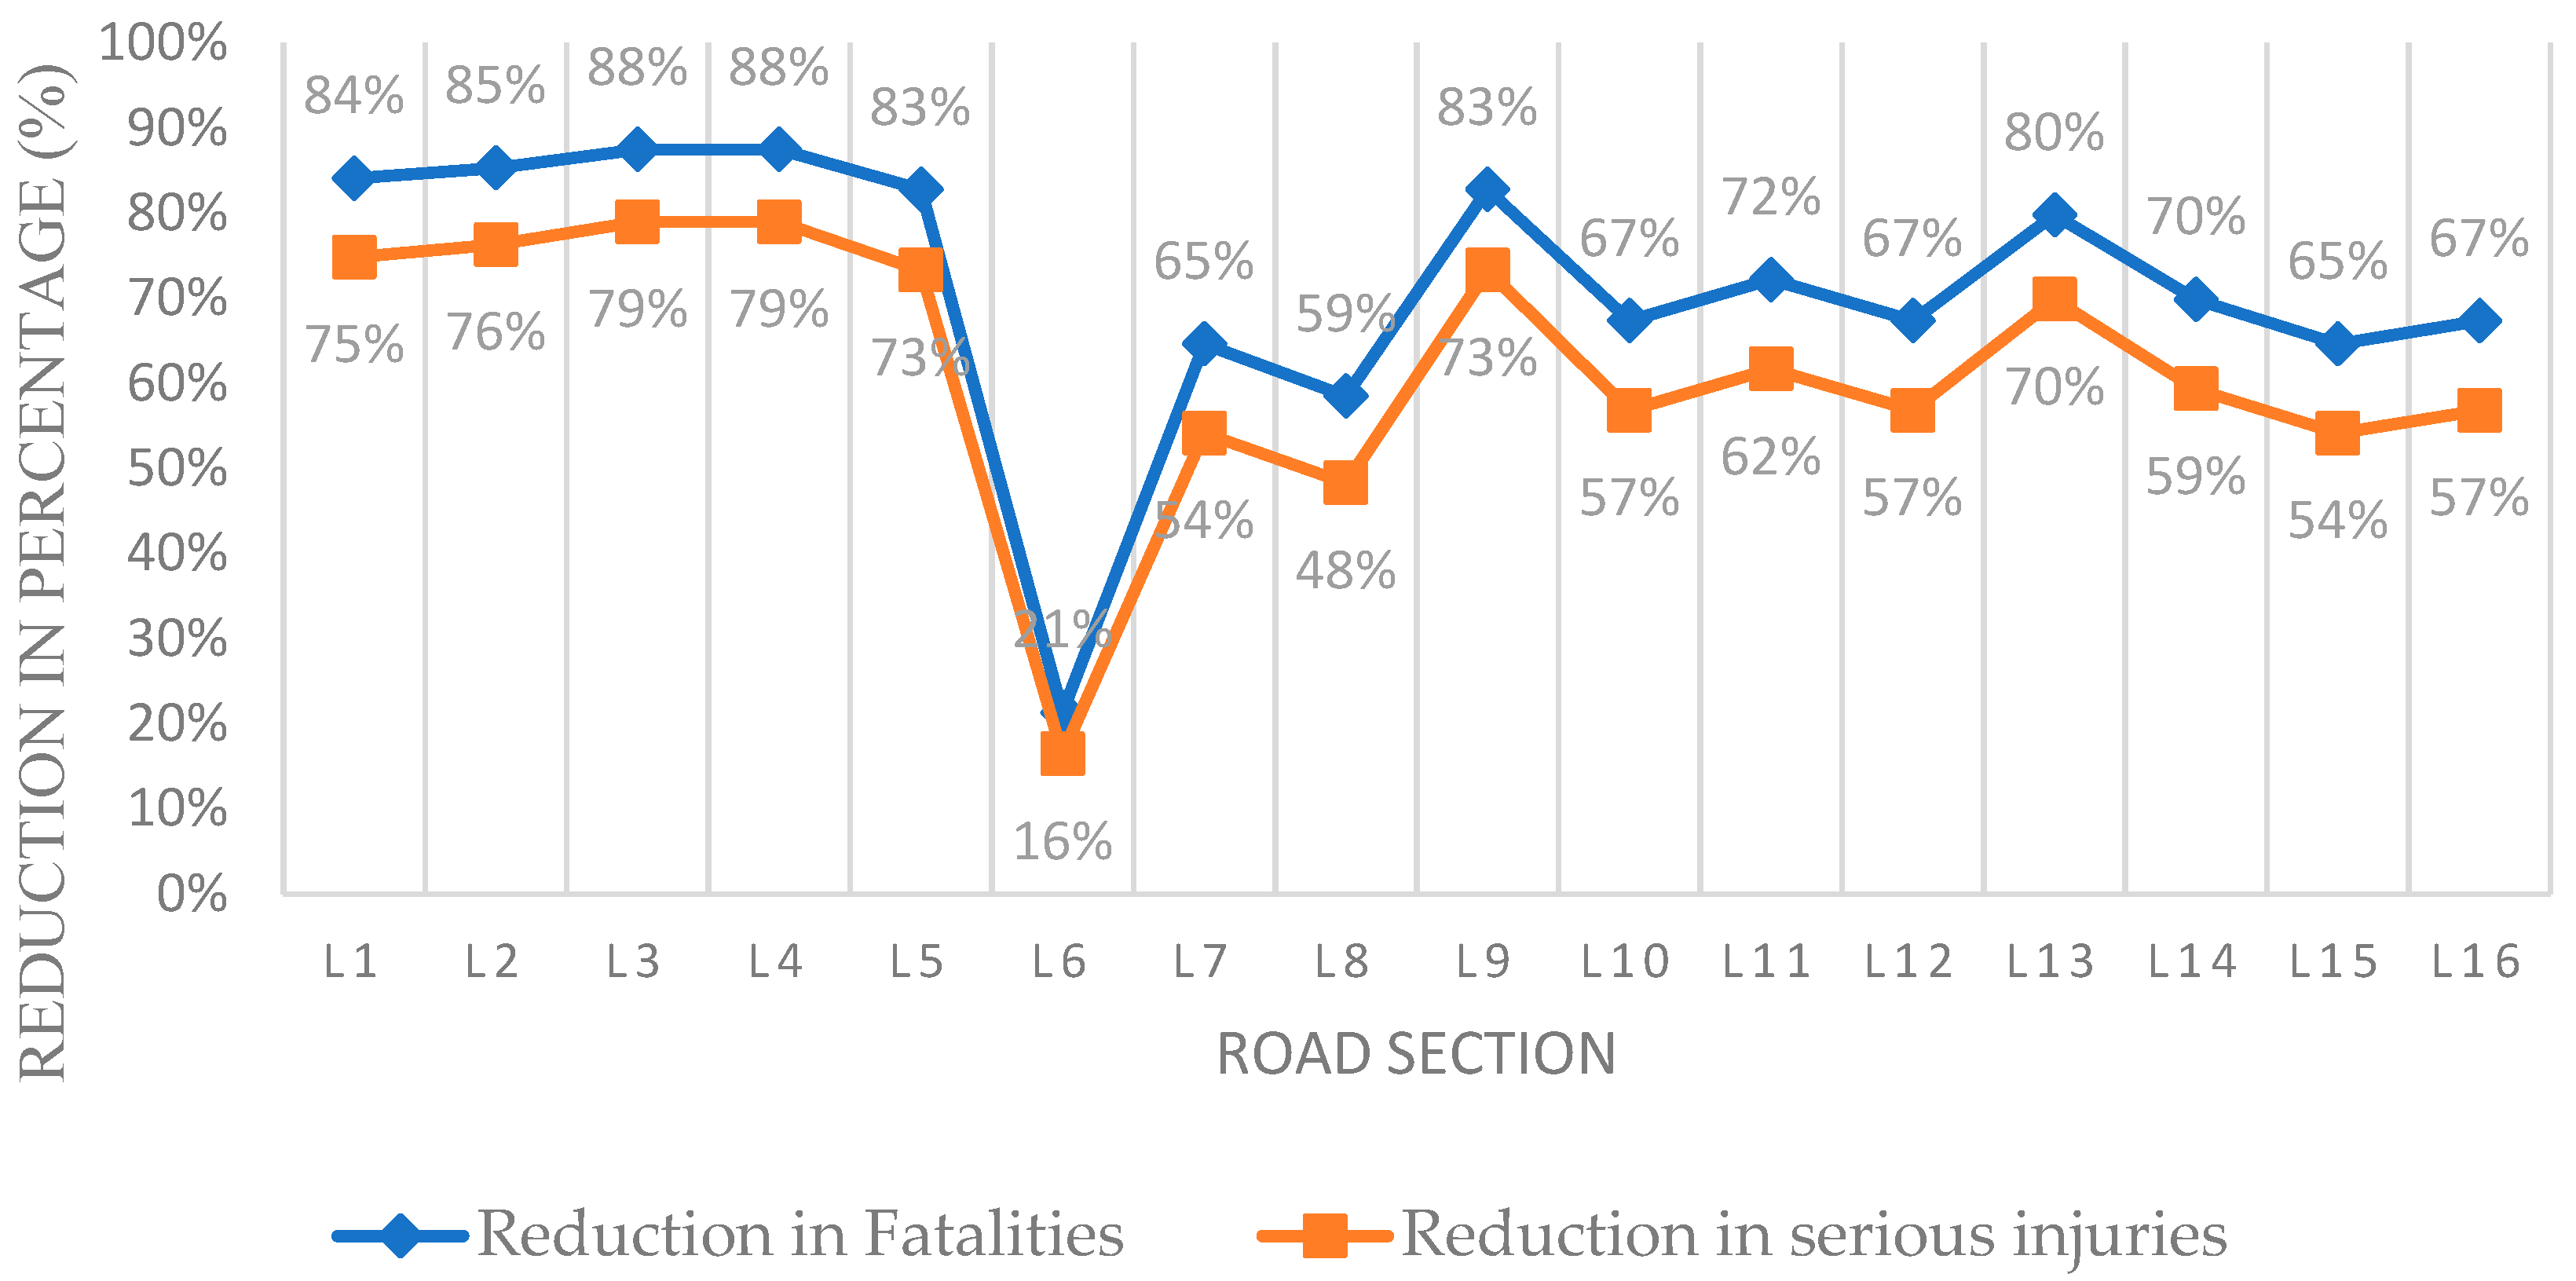

Table 1.
Constants for determining sample size. Source: Bennett, 1994.
| Confidence Level (%) | K | Percentile Speed | U |
|---|---|---|---|
| 68.3 | 1.00 | ||
| 90.0 | 1.65 | 50th | 0.00 |
| 95.0 | 1.96 | 15th or 85th | 1.04 |
| 95.0 | 2.00 | 7th or 93rd | 1.48 |
| 99.0 | 2.58 | 5th or 95th | 1.67 |
| 99.7 | 3.00 |
Table 2.
Descriptive statistics for speed data at data collection sites.
| Location Name | ID | Sample size | Median | Mean | Standard Deviation | Standard Error | Min | Max |
|---|---|---|---|---|---|---|---|---|
| Olembe - nkozoa | L1 | 423 | 49.32 | 50.88 | 13.9 | 0.68 | 19.73 | 142.11 |
| Boulevard du 20 Mai - poste centrale | L2 | 487 | 49.09 | 50.96 | 14.64 | 0.66 | 20.61 | 135.85 |
| Etoudi - tongolo | L3 | 412 | 53.47 | 55.25 | 14.78 | 0.73 | 24.11 | 154.29 |
| Mokolo - carrefour marche madagascar | L4 | 560 | 52.3 | 53.63 | 13.68 | 0.58 | 22.06 | 123.43 |
| Carrefour matgenie - carrefour meec | L5 | 595 | 52.43 | 52.98 | 10.58 | 0.43 | 19.41 | 115.51 |
| Sous prefecture tsinga - carrefour de la guete | L6 | 450 | 33.23 | 34.13 | 9.84 | 0.46 | 12.76 | 78.26 |
| Barrier - nomayos | L7 | 647 | 42.77 | 42.96 | 10.37 | 0.41 | 16.1 | 89.26 |
| Carrefour mobile olezoa - wouari municipal | L8 | 400 | 40.99 | 41.7 | 10.89 | 0.54 | 15.55 | 122.73 |
| Rue rueunification - cetic ngoa ekele | L9 | 221 | 43.2 | 43.58 | 9.6 | 0.65 | 18.57 | 80.6 |
| Carrefour mvan- Base Aérien | L10 | 601 | 43.29 | 44.54 | 10.71 | 0.44 | 15.79 | 105.37 |
| Echangeur ahala - mvan | L11 | 586 | 41.3 | 43.01 | 12.17 | 0.5 | 16.1 | 108 |
| Carrefour awae escalier - carrefour friendship | L12 | 515 | 39.56 | 42.28 | 15.48 | 0.68 | 12.56 | 151.05 |
| Total ernergies odza borne 10 - terminus odza | L13 | 354 | 48.98 | 50.53 | 13.29 | 0.71 | 24.55 | 167.44 |
| Express union avenue germaine - chapelle essos | L14 | 413 | 33.44 | 35.49 | 10.46 | 0.51 | 11.21 | 93.91 |
| Texaco omnisports - mobile omnisports | L15 | 526 | 42.94 | 43.74 | 11.17 | 0.49 | 16 | 120.67 |
| Carrefour claretains - nkolbisson | L16 | 361 | 43.29 | 43.96 | 10.78 | 0.57 | 18.77 | 118.68 |
Table 3.
The Speeding Safety Performance Indicators (SPI) and weights per location.
| ROAD SECTION | Percentage of drivers driving 10km/h, 20km/h, or 30km/h faster than the speed limit | % within the speed limit | average speed | 85th percentile speed | speed variations | traffic volume | Weights | ||
|---|---|---|---|---|---|---|---|---|---|
| 10km/h | 20km/h | 30km/h | |||||||
| L1 | 40.02 | 16.02 | 4.14 | 51.53 | 57.01 | 63.06 | 33.19 | 826 | 0.027993 |
| L2 | 43.36 | 17.78 | 7.11 | 52.36 | 50.84 | 62.93 | 30.53 | 2028.5 | 0.068745 |
| L3 | 62.81 | 24.36 | 11.23 | 35.81 | 55.29 | 67.43 | 32.93 | 1778 | 0.060255 |
| L4 | 67.61 | 18.71 | 7.61 | 48.65 | 51.81 | 63.52 | 29.25 | 2176 | 0.073743 |
| L5 | 62.58 | 17.81 | 8.34 | 31.66 | 53.65 | 62.09 | 24.18 | 3297 | 0.111734 |
| L6 | 3.92 | 2.25 | 0 | 96.45 | 33.7 | 42.025 | 22.23 | 1011 | 0.034262 |
| L7 | 9.85 | 3.53 | 0.93 | 85.88 | 41.05 | 49.52 | 21.73 | 1292.5 | 0.043802 |
| L8 | 9.56 | 2.36 | 0.9 | 84.025 | 27.79 | 34.77 | 16.47 | 2271 | 0.076963 |
| L9 | 7.79 | 1.95 | 0.65 | 82.96 | 42.94 | 51.105 | 21.5 | 1632 | 0.055308 |
| L10 | 20.92 | 5.48 | 2.49 | 73.92 | 44.52 | 52.98 | 22.82 | 1857.5 | 0.06295 |
| L11 | 15.8 | 5.06 | 1.11 | 79.29 | 41.94 | 52.58 | 25.97 | 1464 | 0.049614 |
| L12 | 24.77 | 10.92 | 5.42 | 79.71 | 41.82 | 53.51 | 30.72 | 1072.5 | 0.036346 |
| L13 | 32.7 | 11.2 | 4.76 | 37.27 | 50.77 | 60.36 | 25.69 | 1459 | 0.049445 |
| L14 | 5.09 | 2.65 | 2.03 | 92.42 | 35.26 | 45.1 | 23.24 | 3077 | 0.104278 |
| L15 | 10.52 | 4.46 | 2.31 | 80.38 | 43.75 | 52.61 | 23.07 | 2580.69 | 0.087458 |
| L16 | 12.48 | 2.49 | 1.66 | 77.33 | 43.93 | 54.245 | 25.34 | 1685 | 0.057104 |
| Weighted SPIs | 28.37759 | 9.384744 | 4.073009 | 66.85647 | 44.62932 | 54.16241 | 25.04083 | ||
Table 4.
Correlation matrix between road attributes and speed.
| VARIABLES | Shoulder width (m) | lane Width (m) | Median Width (m) | Lateral Clearance (m) | Mean speed | 85th Percentile speed |
|---|---|---|---|---|---|---|
| Shoulder width (m) | 1 | 0.26 | 0.29 | 0.10 | 0.49 | 0.42 |
| lane Width (m) | 0.26 | 1 | 0.37 | 0.00 | 0.48 | 0.46 |
| Median Width (m) | 0.29 | 0.37 | 1 | 0.11 | .598* | .560* |
| Lateral Clearance (m) | 0.10 | 0.00 | 0.11 | 1 | -0.14 | -0.14 |
*. Correlation is significant at the 0.05 level (2-tailed).
Table 5.
Proposed speed management interventions.
| Speed interventions | |
|---|---|
| Speed limit change | |
| 1 | 30km/h is proposed for location 4 and 9 while 40km/h is proposed for all other locations. This is set according to road function |
| Infrastructure modification | |
| 2 | Speed humps or speed tables should be implemented at areas with pedestrian crossings. |
| 3 | Lane narrowing should be introduced at locations with lane width greater than 3.5. This may be achieved through road markings as low cost measures or through kerb extensions in long tem |
| 4 | Rehabilitation of all footpaths at the locations and construction of cycle lanes especially around school zone areas |
| Enforcement and education | |
| 5 | Routine police enforcements as a short-term measure and introduction of automated speed enforcement in long term. Interventions can commence at locations where there is a speed issue like Locations 3 to 5 |
| 6 | Public campaigns to support enforcement and compliance |
Disclaimer/Publisher’s Note: The statements, opinions and data contained in all publications are solely those of the individual author(s) and contributor(s) and not of MDPI and/or the editor(s). MDPI and/or the editor(s) disclaim responsibility for any injury to people or property resulting from any ideas, methods, instructions or products referred to in the content. |
© 2024 by the authors. Licensee MDPI, Basel, Switzerland. This article is an open access article distributed under the terms and conditions of the Creative Commons Attribution (CC BY) license (http://creativecommons.org/licenses/by/4.0/).
Copyright: This open access article is published under a Creative Commons CC BY 4.0 license, which permit the free download, distribution, and reuse, provided that the author and preprint are cited in any reuse.


