
Submitted:
19 December 2024
Posted:
20 December 2024
You are already at the latest version
Abstract
Urbanization, driven by socio-economic development, has significantly impacted river ecosystems, particularly in plain city regions, leading to disruptions in river network structure and function. These changes have exacerbated hydrological fluctuations and ecological degradation. This study focuses on the central urban area of Changzhou, using a MIKE11 model to assess the effects of four hydrological connectivity strategies—water diversion scheduling, river connectivity, river dredging, and sluice connectivity—across 13 different scenarios. Results show that water diversion, river dredging, and sluice connectivity scenarios provide the greatest improvements in water environmental capacity, with maximum increases of 54.76%, 41.97%, and 25.62%, respectively. The spatial distribution of improvements reveals significant regional variation, with some areas, particularly in Tianning and Zhonglou districts, experiencing declines in environmental capacity under sluice diversion and river connectivity scenarios. In addition, the Lao Zaogang river is identified as crucial for improving the overall water quality in the network. Based on a multi-objective evaluation combining environmental and economic factors, the study recommends optimizing water diversion scheduling at sluices (Weicun, Zaogang, and Xiaohe) with flow rates between 20-40 m³/s, enhancing connectivity at key river hubs, and focusing management efforts on the Lao Zaogang and Xinmeng rivers to strengthen hydrological and water quality linkages within the network.
Keywords:
plain city river network
; hydrological connectivity
; water diversion scheduling
; multi-objective evaluation
1. Introduction
Rivers are critical to the ecological balance and sustainable development of urban areas, especially in cities with complex river networks[1,2,3]. They provide water, support biodiversity, regulate water quality, and help mitigate the effects of urbanization on hydrological cycles[4,5]. In cities with flat topography, where river systems are more interconnected, the role of rivers in water management becomes even more significant[6,7,8]. The interconnectivity of water bodies in such cities directly impacts surface water hydrology and quality[9,10,11]. A well-functioning river network in flood control, irrigation, and acts as a natural purifier by facilitating water exchange between different parts of the system. Effective management of water quality and flow regulation through these networks is essential for maintaining aquatic ecosystem health[12,13]. However, rapid urbanization and industrialization often subject these rivers to heavy pollution, highlighting the need for Hydrological Connectivity targeted planning and engineering interventions[14,15]. Understanding the role of river connectivity is therefore vital for fostering sustainable urban development.
In recent decades, extensive research has examined how river network connectivity influences urban water quality and hydrological characteristics[16,17,18]. Engineering approaches, such as water diversion, sluice-and-dam construction, and river dredging, aim to enhance flow dynamics, water quality, and ecological health[19,20]. Meanwhile, the use of pumping stations to transfer cleaner water from external sources has emerged as a promising solution to improve water quality in polluted urban rivers, it is also an important measure to improve hydrological connectivity [21,22]. Despite numerous studies, there is limited comparison of these engineering solutions in terms of both hydrological and water quality outcomes. Especially, the optimization schemes for different hydrological connectivity projects are not yet clear, and the constraints set are not scientific enough. Additionally, regional differences in the effectiveness of these interventions remain underexplored. For example, some areas may benefit more from pumping stations, while others may see greater improvements from dredging or sluice diversions. Therefore, a comprehensive evaluation of different hydrological connectivity engineering strategies based on effective constraints is crucial for improving river water environment and for guiding the optimization of engineering measures.
This study employ an integrated approach that combines hydrological simulations with water environmental capacity models to evaluate the impact of various hydrological connectivity engineering interventions on the water quality and flow dynamics of an urban river network. Unlike traditional case studies that often focus on one or two interventions, and the constraints are too singular. this study simulates 13 distinct scenarios, systematically comparing the effectiveness of multiple strategies, such as pumping station diversion, sluice diversion, river connectivity, and river dredging in improving water quality. Additionally, the study incorporates a multi-objective evaluation framework that assesses not only the environmental benefits of each intervention but also their economic feasibility and operational practicality within the study area. This comprehensive evaluation offers a holistic understanding of how various interventions can be integrated into a broader urban water management strategy. Furthermore, this study accounts for regional disparities in the effectiveness of engineering solutions, an aspect often overlooked in studies that focus solely on aggregate improvements across the entire river network.
The primary objective of this study is to assess the effectiveness of various hydrological connectivity engineering interventions, to quantify improvements in key water quality parameters, resulting from these interventions, and to identify the most effective strategies for enhancing the water environment. In addition, the study explores regional variability in the effectiveness of these interventions, recognizing that different districts within the study area may respond differently to specific measures. This regional analysis is essential for developing tailored solutions that address local environmental conditions and community needs. The findings will provide policymakers and urban planners with evidence-based recommendations on how to prioritize and optimize water environmental improvement strategies for river network cities. To support these objectives, the study proposes a multi-objective evaluation framework that integrates both environmental and economic considerations. This framework highlights the importance of sustainable, cost-effective interventions that can deliver long-term benefits for both the environment and urban populations.
2. Study Area and Data
This study focuses on the central urban area of Changzhou, which encompasses the four administrative districts of Tianning, Xinbei, Zhonglou, and Wujin[23,24]. The study area is geographically situated within the coordinates 119°08′ - 120°12′ longitude and 31°09′ - 32°04′ latitude, and is located in the core region of the Yangtze River Delta. The area is characterized by its advanced economy, dense river network, and complex water management system, making it a representative example of a plain city river network.
The study area is bordered to the north by the Yangtze River, to the east by Taihu Lake. The Grand Canal (Beijing-Hangzhou Canal) divides the water system of Changzhou into the northern and southern tributaries of the Canal. The river network within the region is intricate, with a wide distribution of lakes, ponds, reservoirs, and other water bodies, forming an interconnected hydrological system involving lakes, the Yangtze River, the Grand Canal, and numerous rivers and canals.
The core waterway of the Lake District Water System is the Jing-Hang Canal, which links several major rivers and plays a key role in water exchange across the network. The Yangtze River Mainstream Water System primarily consists of the Desheng river, Xinmeng river, and Zaogang river, which are major waterways directly connected to the Yangtze River.
Changzhou has a total of 2,226 rivers and channels, with an overall length of 4,671.2 km. According to the water conservancy census report for Changzhou, the city is home to 376 large-scale water gates. Despite these extensive water resources, the overall water environmental and ecological conditions of Changzhou remain challenging, with significant tasks in water management and flood control. Hydrological and water quality data for this study were sourced from the Changzhou Hydrology Bureau and monitoring results from the research team. The 44 rivers shown in Figure 1 are represented in Table A1 of the Appendix A.
3. Method
In this study, we selected four administrative districts in Changzhou as the research area. Four water management planning scenarios were established, and a MIKE11 model was developed for each scenario to analyze the variations in water environmental capacity. Finally, a multi-objective decision function was used to identify the planning scheme that achieves the greatest environmental improvement with the lowest economic cost. The specific process is illustrated in Figure 2.
3.1. Hydrological Connectivity Scenario Schemes
- (1)
- Water Diversion Scheduling Scheme
The study area is located in a plain river network with weak hydrodynamics, primarily relying on the Yangtze River for water resource supplementation, water environment improvement, and hydrodynamic regulation. Hydrological connectivity is a critical factor influencing the water environment. To clarify the effects of scheduling models and diversion volumes on the water environment, various water diversion scheduling schemes are proposed. The main sluice gates involved in the scheduling are the Xiaohe Gate, Weicun Gate, and Zaogang Gate.

Table 1.
Scheduling scheme.
| Scenario | Flow (m³/s) | Type |
|---|---|---|
| Scenario 1 | 0 | -- |
| Scenario 2 | 20 | Pump Diversion |
| Scenario 3 | 40 | Pump Diversion |
| Scenario 4 | 60 | Pump Diversion |
| Scenario 5 | 100 | Pump Diversion |
| Scenario 6 | 20 | Gate Diversion |
| Scenario 7 | 40 | Gate Diversion |
| Scenario 8 | 60 | Gate Diversion |
| Scenario 9 | 100 | Gate Diversion |
| Scenario 10 | Actual Scenario | -- |
The sluice gates involved in the scheduling are located along the Yangtze River, including the Weicun Gate, Zaogang Gate, and Xiaohe Gate. In Scenarios 2-5, “pump diversion” refers to the closure of all sluice gates along the river, with pumps operating 24 hours a day to divert water from the Yangtze River into the Changzhou water system. In Scenarios 6-9, “gate diversion” refers to opening the sluice gates based on the actual tidal water level of the Yangtze River, with the gates open for 6-8 hours daily to divert water into the Changzhou water system. Scenario 1 represents a situation where the sluice gates are closed, and the upstream diversion flow is 0 m³/s. Scenario 10 represents the actual flow in the study area’s water system.
- (2)
- River Connectivity Scheme
Based on the future planning of the Changzhou water system connectivity, this study selects the Beigan river, Caoqiao river, Dingheng river, Luheng river, and Taige Canal as the rivers for simulation of connectivity. These rivers represent Scenario 11, with the engineering route shown in Figure 3. During the simulation, the sluice gates and dams located along these rivers are fully opened, and their scheduling rules are removed.
- (3)
- River Dredging Scheme
Enhancing the capacity for flood disaster risk prevention and alleviating the flood control pressure on river embankments are critical measures for improving the hydrological connectivity composite index. The Xinmeng river dredging project is one of the six major projects approved by the State Council in the “Comprehensive Water Environment Management Plan for the Taihu Basin”. This project plays a vital role in improving flood control, drainage capacity, water environmental quality, and water resource utilization within the basin. Additionally, it is expected to accelerate the flow of water in the northwestern region of Taihu Lake, shorten the lake’s water exchange cycle, improve the water environment of Ge Lake and Taihu Lake, and increase flood control standards and water resource supply. The Xinmeng river dredging project involves widening and dredging the existing river channel, extending from the Yangtze river in the north to Beigan river in the south. The project also connects with Ge Lake through Beigan river, and further links and expands the Tai-Ge Canal and Caoqiao river, eventually discharging into Taihu Lake (see Figure 4). The total project length is 116.47 kilometers, with an investment of 13.462 billion yuan. The river mouth will be widened to 128-150 meters, and the riverbed will be expanded to 70 meters. Upon completion, the Xinmeng river project is expected to significantly impact the hydrological connectivity and water environment of the study area’s river network. Based on the above analysis, a simulation of the Xinmeng river dredging plan (Scenario 12) was conducted to assess the project’s effect on the improvement of the water environment in the Changzhou’ river network.
- (4)
- Sluice Connectivity Scheme
Field investigations have revealed that the connectivity levels of the Luheng river, Dingheng river, Beitang river, and Hexi river sluices are relatively low (Figure 5). Among these, the Luheng river and Dingheng river sluices are essentially in a state of disconnection. Since the connectivity of sluices directly affects the hydrology and water quality of the river network, a simulation of the sluice connectivity (Scenario 13) was conducted to analyze the impact of improved connectivity on the water environment.
3.2. Model Simulation
This study primarily uses the hydrodynamic module (HD) and the advection-diffusion module (AD) in MIKE11 to simulate and analyze different scenarios. The details are as follows:
- (1)
- Model Principles
The HD module is based on the Saint-Venant equations, which consist of the mass conservation continuity equation and the momentum conservation energy equation. The discretization is performed using a six-point central implicit scheme, and the numerical solution is obtained via the Thomas algorithm[25]. The basic equations are as follows:
Where, x is the spatial coordinate (m); t is the time coordinate (s); A is the cross-sectional area of the river(m2); Q is the flow rate at the river cross-section (m3/s); q is the lateral inflow per unit length (positive for inflow, negative for outflow, m³/s); is the momentum correction factor (dimensionless); g is the gravitational acceleration, m/s2; h is the water level, m; X is the Chezy coefficient.
The control equation of the AD module is a one-dimensional advection-diffusion equation, which is coupled with the HD module to calculate the hydrodynamic conditions. The basic equation is given as follows:
Where, C is the pollutant concentration (mg/L); D is the longitudinal diffusion coefficient (m²/s); K is the degradation coefficient (1/d); S is the source or sink concentration (mg/L).
- (2)
- Model Calibration and Validation
In this study, the model simulation accuracy is evaluated using the Nash-Sutcliffe efficiency coefficient (Nash-Sutcliffe, ENS) and the relative error (RE) between the observed and simulated values. The calculation formulas are as follows:
In Formulas (4) and (5), is the measured value of the t time series data; is the simulation value of the t order in the long time series data; is the average value of measured values in long time series data; n is the number of measured values. Between - and 1, close to 1, indicating high model reliability; Close to 0 indicates that the simulation results are close to the average level of the observed values, that is, the overall results are credible, but the process simulation error is large. less than 0, the model results are not reliable. The value of RE determines the closeness between the measured value and the simulated value. When RE is close to 0, it means that the simulated value is close to the measured value.
3.3. Water Environmental Capacity Measurement
Water environmental capacity refers to the maximum permissible pollutant discharge that a water body can accommodate without impairing its environmental functions. It consists of two components: dilution capacity and self-purification capacity[25].
The dilution capacity is given by the following formula:
Where, is dilution capacity, kg/d; S is the water quality standard, mg/L; is the river background concentration, mg/L; is the river flow, m3/s.
The self-purification capacity is represented by the following formula:
Where, is the self-purification capacity, kg/d; S is the water quality standard, mg/L; is the sum of river flow and wastewater flow, m3/s; L is the length of the reach, m; k is the comprehensive attenuation coefficient, 1/d; v is the velocity of the river, m/s.
The comprehensive water environmental capacity is the sum of the dilution and self-purification capacities, expressed by the following formula:
Where, E is the comprehensive capacity of water environment, the dilution capacity, and the self-purification capacity.
3.4. Multi-Objective Constraint Model
This study employs a multi-objective evaluation method to analyze the environmental benefits and economic costs of different control schemes. The objective is to select the schemes that provide the best improvement in water environment quality at the lowest economic cost. The evaluation method is expressed in Equation (9).
In the formula, y(i) is a multi-objective function, i represents different schemes, Ei is the environmental benefit function, Mi is the economic cost function. The optimal value of y(i) is the ideal state with the highest environmental benefit and the lowest economic cost. is the average value of environmental benefits, is the average value of economic costs. In order to facilitate the analysis and comparison of different schemes, the environmental benefits and economic costs of each scheme are standardized without dimensions.
The environmental benefit function is the improvement rate of water environmental capacity (Equation (10)):
where CEi is the water environmental capacity after the implementation of plan i, and CE0 is the water environmental capacity before the implementation of plan.
The economic cost function is divided into three categories: 1) the annual operation and management cost of the gate; 2) water diversion fees; 3) river excavation costs. The economic cost function is shown in Equation (11), and the important parameters are shown in Table 2.
Where Mi is the economic cost (in million yuan per year); m is the annual operation management fee of gate station (10,000), n is the number of gate stations in the study area; Q is the diversion water flow (m3/s); v is the river dredging volume (m3), mv is the dredging cost (yuan /m3).
It should be noted that the sluice management costs are derived from the detailed maintenance and operational expenditure records of sluices in Changzhou City; the dredging costs are based on the project cost breakdown; and the dredging volumes are obtained from the computational results of the MIKE11 model.
4. Result and Discussion
4.1. Model Calibration Results
The comparison between the simulated water levels produced by the MIKE11 model and the observed water levels indicates a high degree of agreement. As presented in Table 3, the Nash-Sutcliffe Efficiency (NSE) coefficients for the Wujin Port and Yapu Port cross-sections during the calibration period were 0.82 and 0.90, respectively. During the verification period, the NSE coefficients for these sections were 0.79 and 0.84, respectively. These results demonstrate that the model achieves a high level of accuracy in simulating water level variations, rendering it suitable for further applications in water level change simulations.
Additionally, as shown in Table 4, the maximum relative error (RE) in flow simulation was observed at Caoqiao Bridge, amounting to 13.77%, while the RE for other cross-sections remained below 6%. These findings suggest that the model can reliably simulate flow variations. Overall, the hydrological simulation results of the MIKE11 model are deemed acceptable and applicable for water quality simulations and scenario analysis.
The calibration process for water quality parameters follows a similar methodology to that of the hydrodynamic parameters. Initially, default values were employed in the model, and adjustments were subsequently made to critical parameters. The resulting simulation values demonstrated a high degree of fit with the observed data. The mean relative error for all key water quality indicators across the river network was below 11%, as illustrated in Figure 6. This analysis confirms that the model achieves a high degree of accuracy in water quality simulations, making it suitable for conducting scenario-based water quality assessments.
4.2. The Impact of Different Scenarios on Water Environmental Capacity
Chemical Oxygen Demand (CODCr) Capacity:As illustrated in Figure 7, scenarios 2–9 and 11–13 exhibit varying degrees of improvement in CODCr capacity across the river network, with the environmental capacity increasing alongside upstream diversion flow. Overall, the pump diversion scenarios yielded more significant improvements in CODCr capacity compared to gate diversion. Table 5 indicates that the pump diversion scenario achieved an average improvement rate of up to 54.76%, whereas the gate diversion scenario only achieved 2.01%.
Additionally, while river connectivity projects contributed to enhanced CODCr capacity, their impact was less significant than that of river dredging and water diversion projects, with an average improvement rate of 0.89%. Notably, the river dredging project demonstrated the highest improvement in CODCr capacity, with R37 (Xinmeng river) achieving a 94.71% increase, reaching 170,000 t/a. Furthermore, the sluice connectivity scenarios significantly enhanced CODCr capacity in the study area, with an average improvement rate of 23.18%.
These findings underscore that pump diversion, river dredging, and sluice connectivity scenarios notably improve CODCr capacity. Conversely, the impact of river connectivity projects and gate diversion scenarios on CODCr capacity was relatively minor. This suggests that increasing river flow and optimizing river network connectivity are the primary means of enhancing water environmental capacity.
Key rivers connecting the study area’s network to Lake Taihu include the Taige Canal, Caoqiao river, Wujin Port, and Yapu Port. For the Taige Canal and Caoqiao river, the highest CODCr capacities were observed in Scenario 12, reaching 18,899 t/a and 32,678 t/a, with improvement rates of 70.88% and 71.24%, respectively. Meanwhile, the highest CODCr capacities for Wujin Port and Yapu Port were observed in Scenario 5, achieving 12,550 t/a and 2,319 t/a, with improvement rates of 29.67% and 20.33%, respectively. Thus, river dredging and water diversion scenarios substantially contribute to improving the water environment of Lake Taihu.
Total Phosphorus (TP) Capacity: The variation in total phosphorus capacity across the river network mirrors that of CODCr capacity. Under water diversion scenarios, the improvement in TP capacity is positively correlated with the diversion flow rate. Among these, pump diversion scenarios demonstrated the highest average improvement rate of 51.05%, while gate diversion scenarios achieved a maximum average improvement rate of only 3.58%.
River connectivity projects, river dredging projects, and sluice connectivity projects effectively reduced TP concentrations and improved TP capacity. However, the average improvement rate of river connectivity projects was only 1.2%, whereas river dredging and sluice connectivity projects achieved average improvement rates of 36.99% and 22.29%, respectively. For the Xinmeng river, river dredging projects resulted in the highest TP capacity improvement, reaching 1,000 t/a. Scenario 12 demonstrated the most significant improvement for the Taige Canal and Caoqiao river, with TP capacities increasing by 135 t/a and 193 t/a, and improvement rates of 93.87% and 82.12%, respectively. Scenario 13 resulted in the highest TP capacity improvement for Wujin Port and Yapu Port, increasing by 50.82 t/a and 3.54 t/a, with improvement rates of 13.13% and 10.33%, respectively.
Ammonia Nitrogen (NH₃-N) Capacity: Figure 7 shows that pump and gate diversion scenarios under water diversion projects significantly improved ammonia nitrogen capacity for R10 (Desheng river), reaching maximum values of 3,568 t/a and 1,801 t/a, respectively. The average improvement rate for NH₃-N capacity across the river network was 51.32%. In contrast, river connectivity, river dredging, and sluice connectivity projects had less impact on NH₃-N capacity compared to water diversion projects (see Table 5). Notably, river connectivity projects led to a negative average improvement rate of -5.21%, reducing NH₃-N capacity. This finding highlights that enhanced connectivity does not always equate to improved water environmental capacity.
For the Taige Canal and Caoqiao river, Scenario 12 yielded the most significant improvements in NH₃-N capacity, increasing by 645 t/a and 782 t/a, with improvement rates of 78.72% and 71.45%, respectively. Scenario 5 demonstrated the highest improvement for Wujin Port, with an increase of 414 t/a and an improvement rate of 31.24%. Scenario 13 showed the most significant improvement for Yapu Port, with an increase of 80 t/a and an improvement rate of 21.97%.
Comprehensive analysis improving hydrological connectivity contributes to enhancing the overall water environmental capacity of the river network. However, the improvement effects vary across different river sections. To effectively enhance the water environment quality of Lake Taihu, it is crucial to focus on key rivers and develop reasonable water environment management strategies.
4.3. Spatial Variability in Water Environmental Capacity Under Different Scenarios
Section 4.2 analyzed the improvement effects of various schemes on water environmental capacity. It was observed that certain scenarios resulted in a reduction of the water environmental capacity of the river network. In order to investigate the underlying reasons for this decline, this section presents a spatial distribution map of changes in water environmental capacity under different scenarios.
As shown in Figure 8, the water environmental capacity reduction in the scenarios involving diversion scheduling and sluice-gate control, as well as the river connectivity scheme, is primarily concentrated in the Tianning and Zhonglou districts. The proportion of rivers experiencing a decline in water environmental capacity in these areas is 35.23% and 45.45%, respectively. It is noteworthy that Laozaogang river is located upstream of key structural connection rivers, namely Luoheng river and Dingheng river. The structural connectivity of these rivers facilitates the diffusion of pollutants from Laozaogang river into other waterways. Given that Laozaogang river has relatively slow flow and poor connectivity, it is unable to sufficiently dilute the pollutant concentration, leading to an increase in the number of rivers with deteriorating water quality under the river connectivity scenario.
The pump diversion and sluice-gate connection schemes in the diversion scheduling scenario, however, significantly improved the hydrological conditions of Laozaogang river. Under these scenarios, the proportion of rivers with water environmental capacity risks decreased to 8.52% and 13.64%, respectively. This suggests that improving the hydrological conditions of Laozaogang river can effectively enhance the water quality of surrounding rivers.
River dredging projects have played an important role in improving the water environmental capacity of the river network. However, while river dredging projects are effective in improving the overall water quality, they do not improve the hydrological conditions of Laozaogang river itself. Unlike the sluice-gate control and river connectivity schemes, the dredging project, as the largest water conservancy project in Jiangsu Province since the 21st century, relies on substantial water diversion to dilute the pollutants in the at-risk rivers[26]. As a result, 9.09% of the rivers in this scenario are at risk of experiencing a decline in water environmental capacity.
In conclusion, Laozaogang river is a critical waterway for the improvement of water environmental capacity in the study area. In order to enhance the overall water quality of the river network, it is essential to reduce the pollutant concentration in Laozaogang river. The impact of different schemes on the spatial distribution of water environmental capacity shows significant regional variability. Due to its poor connectivity and pollutant diffusion issues, Laozaogang river exhibits a risk of water environmental capacity decline under certain scenarios. The analysis indicates that the pump diversion and sluice-gate connection schemes have a significant positive effect, while the river dredging project has a limited impact on Laozaogang river. Therefore, in efforts to improve the water environmental capacity of the study area, it is recommended that a comprehensive regulatory strategy be developed for Laozaogang river to achieve an overall improvement in regional water quality.
4.4. Analysis of Different Scenario Options Based on Environmental and Economic Benefits
Based on the results of the multi-objective function calculations, this study analyzes the performance of different scenario options in terms of environmental benefits, economic benefits, and objective function values (see Figure 9). Regarding COD, Scenario 3 exhibits the most favorable environmental-economic benefit, while Scenario 11 shows the least advantageous outcome. For total phosphorus, ammonia nitrogen, and the comprehensive index, Scenario 2 demonstrates the best environmental-economic benefits, with Scenario 11 performing the worst. Therefore, Scenarios 2 and 3 (i.e., with pump flow rates ranging from 20-40 m³/s) are considered the optimal solutions for enhancing the water environmental capacity of the river network.
Although Scenarios 4, 12, and 13 show slightly lower environmental-economic benefits compared to Scenarios 2 and 3, their objective function values are close to those of the optimal solution. Moreover, Scenarios 4, 12, and 13 have shown significant positive effects in improving the water environmental capacity of key inflow rivers to Taihu Lake, such as Caoqiao river, Taige Canal, Wujin Port, and Yapu Port. Therefore, Scenarios 4, 12, and 13 can be considered as viable alternative options.
The water diversion scheduling in Changzhou primarily aims to ensure water resource security and improve water environmental quality. Optimizing the water diversion strategy not only enhances the utilization efficiency of water resources but also contributes to the improvement of water environmental quality. It is noteworthy that the main water source for the study area is the Yangtze River, with the water quality in the Changzhou section classified as surface water grade II-III, while the water quality of the Changzhou river network is classified as surface water grade IV to subgrade V. Consequently, utilizing water diversion to improve the water environment of the river network is highly feasible. Previous research results indicate that when the pump flow rate (at Weicun Gate, Xiaohe Gate, and Zaogang Gate) is within the range of 20-40 m³/s, the optimal environmental-economic benefits can be achieved.
5. Conclusion
The improvement of water environmental quality is a critical factor for the ecological and sustainable development of urban areas. This study employed the MIKE11 and water environmental capacity models to analyze four engineering scenarios, comprising a total of 13 distinct simulations. These simulations focused on the hydrological and water quality responses under each scenario. The analysis of water diversion scheduling indicates that hydrological changes within the river network are positively correlated with upstream water diversion flow. Furthermore, the use of pumping stations demonstrated a more significant impact on the improvement of both hydrological and water environmental conditions compared to the use of sluices. Additionally, the river connectivity and river dredging schemes were found to be more effective in enhancing the hydrological conditions of the study area’s river network.
The analysis of the river network’s environmental capacity revealed that the highest average improvements in the capacity for Chemical Oxygen Demand (CODCr), Total Phosphorus (TP), and Ammonia Nitrogen (NH3-N) were observed in the following scenarios: pumping station diversion (54.76%), sluice diversion (25.49%), river connectivity (1.2%), river dredging (41.97%), and sluice-dam connectivity (25.62%). Further investigation suggests that the impact of different engineering schemes on the water environment exhibits regional disparities. Specifically, the sluice diversion and river connectivity schemes resulted in a decrease in water environmental capacity by 35.23% and 45.45%, respectively, with the most affected regions being Tianning district and Zhonglou district. The study identifies Laozaogang river as a critical waterway influencing the improvement of the river network’s environmental quality. Therefore, enhancing the water environmental quality of Laozaogang river emerges as a key measure for improving the ecological conditions of the study area.
Lastly, based on a multi-objective evaluation method that considers both environmental and economic benefits, several regulatory strategies and recommendations for water environmental improvement are proposed.
(1) Optimization of Water Diversion Scheduling: Improving the efficiency of water resource utilization is essential. The primary water source for the study area is the Yangtze River, whose water quality in the Changzhou section is superior to that of the local river network. Therefore, utilizing water diversion as a means to improve the river network’s environmental quality is both feasible and an important strategy for enhancing the water quality within the study area. The results indicate that the highest environmental and economic benefits are achieved when the sluice diversion flow rate ranges between 20-40 m³/s.
(2) Strengthening Sluice-Dam Connectivity: Enhancing the hydrological connectivity within the study area can significantly improve the river network’s water quality. The connectivity of the Dingheng river, Luheng river, Beitang river, and Hexi river hubs should be prioritized to enhance the overall water environmental quality.
(3) Improving the Water Quality of Key Waterways: Laozaogang river, identified as a crucial waterway in the study area, plays a significant role in the overall water quality of the river network. Consequently, targeted measures to improve water quality along this river are essential for achieving broader environmental improvements.
(4) Enhancing Connectivity between Xinmen river and the river Network: The dredging of Xinmen river has proven to be instrumental in improving both the flow and water quality within the river network. Therefore, leveraging the hydrological and water quality regulatory functions of Xinmen river is recommended as a key strategy for optimizing the study area’s water environment.
Credit authorship contribution statement: Jiuhe Bu
Software, Writing: original draft, Writing: review & editing. Chunhui Li: Methodology, Supervision. Tian Xu, Tao Wang: Conceptualization, Data curation, Software. Jinrong Da, Xiaoyun Li, Hao Chen, Weixin Song, Mengjia Sun: Data curation, Validation.
Data Availability Statement
The original contributions presented in the study are included in the article, further inquiries can be directed to the corresponding author.
Data availability
The authors do not have permission to share data.
Acknowledgments
This research was funded by the Natural Science Foundation of Jiangsu Province (BK20230174), National Natural Science Foundation of China (52070023, 82101339) the Foundation of Basic Science (Natural Science) research in Jiangsu Province (22KJB570008), the National Key Research and Development Program of China (2022YFC3202001), and Wuxi University Research Start-up Fund for Introduced Talents (552424056). We would like to extend special thanks to the editor and the reviewers for their valuable comments in greatly improving the quality of this research.
Declaration of Competing Interest
The authors declare that they have no known competing financial interests or personal relationships that could have appeared to influence the work reported in this paper.
Appendix A
Table A1.
River code and name.
| Rivers code | River name |
| R1 | Beitang river |
| R2 | Beitongzi river |
| R3 | Biandan river |
| R4 | Butai river |
| R5 | Cailing river |
| R6 | Caoqiao river |
| R7 | Caotang river |
| R8 | Changbei river |
| R9 | Datong river |
| R10 | Desheng river |
| R11 | Dingtang river |
| R12 | Fenghuang river |
| R13 | Guan river |
| R14 | Hengtang river |
| R15 | Hexi river |
| R16 | Houyu river |
| R17 | Beijing-Hangzhou river |
| R18 | Beijing-Hangzhou urban river |
| R19 | Jinong river |
| R20 | Laozaogang river |
| R21 | Laozaogang western river |
| R22 | Li river |
| R23 | Lijia river |
| R24 | Lingqing river |
| R25 | Mengjin river |
| R26 | Nantognzi river |
| R27 | Nanyun river |
| R28 | Sanshan river |
| R29 | Shiliheng river |
| R30 | Taige river |
| R31 | Wujin river |
| R32 | Wunan river |
| R33 | Wuyi river |
| R34 | Xiaxi river |
| R35 | Xili river |
| R36 | Xinlong river |
| R37 | Xinmeng river |
| R38 | Xinwuyi river |
| R39 | Xinzaogang river |
| R40 | Xinzaogang eastern river |
| R41 | Yapu river |
| R42 | Yongan river |
| R43 | Zengchan river |
| R44 | Zhengping river |
References
- Li, F.; Liu, X.; Zhang, X.; Zhao, D.; Liu, H.; Zhou, C.; Wang, R. Urban Ecological Infrastructure: An Integrated Network for Ecosystem Services and Sustainable Urban Systems. Journal of Cleaner Production 2017, 163, S12–S18. [Google Scholar] [CrossRef]
- Qi, X.; Zhang, Z.; Jing, J.; Hu, W.; Zhao, X. Regional Planning for Ecological Protection of Rivers in Highly Urbanized Areas. Ecological Indicators 2023, 149, 110158. [Google Scholar] [CrossRef]
- Zhu, Q.; Fang, K.; Zhu, D.; Li, X.; Chen, X.; Han, S.; Chen, F.; Gao, C.; Sun, J.; Tang, R.; et al. Simulation and Analysis of Water Quality Improvement Measures for Plain River Networks Based on Infoworks ICM Model: Case Study of Baoying County, China. Water 2024, 16, 2698. [Google Scholar] [CrossRef]
- Raquel Calapez, A.; Serra, S.R.Q.; Mortágua, A.; Almeida, S.F.P.; João Feio, M. Unveiling Relationships between Ecosystem Services and Aquatic Communities in Urban Streams. Ecological Indicators 2023, 153, 110433. [Google Scholar] [CrossRef]
- Liu, B.; Zhang, F.; Qin, X.; Wu, Z.; Wang, X.; He, Y. Spatiotemporal Assessment of Water Security in China: An Integrated Supply-Demand Coupling Model. Journal of Cleaner Production 2021, 321, 128955. [Google Scholar] [CrossRef]
- Mallareddy, M.; Thirumalaikumar, R.; Balasubramanian, P.; Naseeruddin, R.; Nithya, N.; Mariadoss, A.; Eazhilkrishna, N.; Choudhary, A.K.; Deiveegan, M.; Subramanian, E.; et al. Maximizing Water Use Efficiency in Rice Farming: A Comprehensive Review of Innovative Irrigation Management Technologies. Water 2023, 15, 1802. [Google Scholar] [CrossRef]
- Zhang, S.; Zheng, H.; Tratnyek, P.G. Advanced Redox Processes for Sustainable Water Treatment. Nat Water 2023, 1, 666–681. [Google Scholar] [CrossRef]
- Ahmed, A.A.; Sayed, S.; Abdoulhalik, A.; Moutari, S.; Oyedele, L. Applications of Machine Learning to Water Resources Management: A Review of Present Status and Future Opportunities. Journal of Cleaner Production 2024, 441, 140715. [Google Scholar] [CrossRef]
- Wang, W.; Chen, Y.; Wang, W.; Zhu, C.; Chen, Y.; Liu, X.; Zhang, T. Water Quality and Interaction between Groundwater and Surface Water Impacted by Agricultural Activities in an Oasis-Desert Region. Journal of Hydrology 2023, 617, 128937. [Google Scholar] [CrossRef]
- Qu, S.; Wang, C.; Yang, N.; Duan, L.; Yu, R.; Zhang, K.; Li, M.; Sun, P. Large-Scale Surface Water-Groundwater Origins and Connectivity in the Ordos Basin, China: Insight from Hydrogen and Oxygen Isotopes. Environmental Research 2023, 236, 116837. [Google Scholar] [CrossRef]
- Li, L.; Knapp, J.L.A.; Lintern, A.; Ng, G.-H.C.; Perdrial, J.; Sullivan, P.L.; Zhi, W. River Water Quality Shaped by Land–River Connectivity in a Changing Climate. Nat. Clim. Chang. 2024, 14, 225–237. [Google Scholar] [CrossRef]
- Giri, S. Water Quality Prospective in Twenty First Century: Status of Water Quality in Major River Basins, Contemporary Strategies and Impediments: A Review. Environmental Pollution 2021, 271, 116332. [Google Scholar] [CrossRef]
- Ji, X.; Shu, L.; Chen, W.; Chen, Z.; Shang, X.; Yang, Y.; Dahlgren, R.A.; Zhang, M. Nitrate Pollution Source Apportionment, Uncertainty and Sensitivity Analysis across a Rural-Urban River Network Based on δ15N/δ18O-NO3− Isotopes and SIAR Modeling. Journal of Hazardous Materials 2022, 438, 129480. [Google Scholar] [CrossRef] [PubMed]
- Zhao, Z.; Wang, H.; Zhang, Y.; Deng, C.; Xie, Q.; Wang, C. Problems and Countermeasures of River Management in the Process of Rapid Urbanization in China. Water 2020, 12, 2260. [Google Scholar] [CrossRef]
- Wu, Y.; Zong, T.; Shuai, C.; Jiao, L. How Does New-Type Urbanization Affect Total Carbon Emissions, per Capita Carbon Emissions, and Carbon Emission Intensity? An Empirical Analysis of the Yangtze River Economic Belt, China. Journal of Environmental Management 2024, 349, 119441. [Google Scholar] [CrossRef]
- Wang, Y.; Wang, W.; Liu, L.; Wang, R.; Tang, X.; Li, Y.; Li, X. Spatial Heterogeneity of the Effects of River Network Patterns on Water Quality in Highly Urbanized City. Science of The Total Environment 2024, 937, 173549. [Google Scholar] [CrossRef]
- Li, X.; Mo, X.; Zhang, C.; Wang, Q.; Xu, L.; Ren, Z.; McCarty, G.W.; Cui, B. Unraveling the Impacts of River Network Connectivity on Ecological Quality Dynamics at a Basin Scale. Remote Sensing 2024, 16, 2370. [Google Scholar] [CrossRef]
- Liu, T.; Jia, P.; Hu, C.; Zhang, B.; Zhang, A. Research on the Connectivity of Urban River Network–Wetland and Water Quality Simulation. Water Science and Technology 2024, 89, 2416–2428. [Google Scholar] [CrossRef] [PubMed]
- Yang, S.; Wan, R.; Yang, G.; Li, B. A Novel Framework to Assess the Hydrological Connectivity of Lake Wetlands in Plain River Networks with Dense Hydraulic Facilities: Comparing Natural and Disturbed States over a Century. Journal of Hydrology 2024, 630, 130787. [Google Scholar] [CrossRef]
- Lan, F.; Haisen, W.; Yan, Y. Spatial–Temporal Variations of Water Quality in Urban Rivers after Small Sluices Construction: A Case in Typical Regions of the Taihu Lake Basin. IJERPH 2022, 19, 12453. [Google Scholar] [CrossRef]
- Yang, S.; Liang, M.; Qin, Z.; Qian, Y.; Li, M.; Cao, Y. A Novel Assessment Considering Spatial and Temporal Variations of Water Quality to Identify Pollution Sources in Urban Rivers. Sci Rep 2021, 11, 8714. [Google Scholar] [CrossRef]
- Yang, L.; Wang, Y.; Wang, Y.; Wang, S.; Yue, J.; Guan, G.; Guo, Y.; Zhang, Y.; Zhang, Q. Water Quality Improvement Project for Initial Rainwater Pollution and Its Performance Evaluation. Environmental Research 2023, 237, 116987. [Google Scholar] [CrossRef]
- Bu, J.; Li, C.; Wang, X.; Zhang, Y.; Yang, Z. Assessment and Prediction of the Water Ecological Carrying Capacity in Changzhou City, China. Journal of Cleaner Production 2020, 277, 123988. [Google Scholar] [CrossRef]
- Bu, J.; Zhang, S.; Li, C.; Xu, X.; Wang, X.; Liu, Q.; Wang, X. A Longitudinal Functional Connectivity Comprehensive Index for Multi-Sluice Flood Control System in Plain Urban River Networks. Journal of Hydrology 2022, 613, 128362. [Google Scholar] [CrossRef]
- Bu, J.; Zhang, S.; Wang, X.; Li, C.; Wang, X.; Liu, Q.; Xu, X.; Wang, X. Study on the Influence of Industrial Structure Optimization on Water Environment and Economy: A Case Study of Changzhou City. Front. Earth Sci. 2023, 10. [Google Scholar] [CrossRef]
- Tao, F.; Pi, Y.; Zhang, M.; Yuan, C.; Deng, M. Hidden Danger Association Mining for Water Conservancy Projects Based on Task Scenario-Driven. Water 2023, 15, 2814. [Google Scholar] [CrossRef]
Figure 1.
Geographical location of Changzhou city.
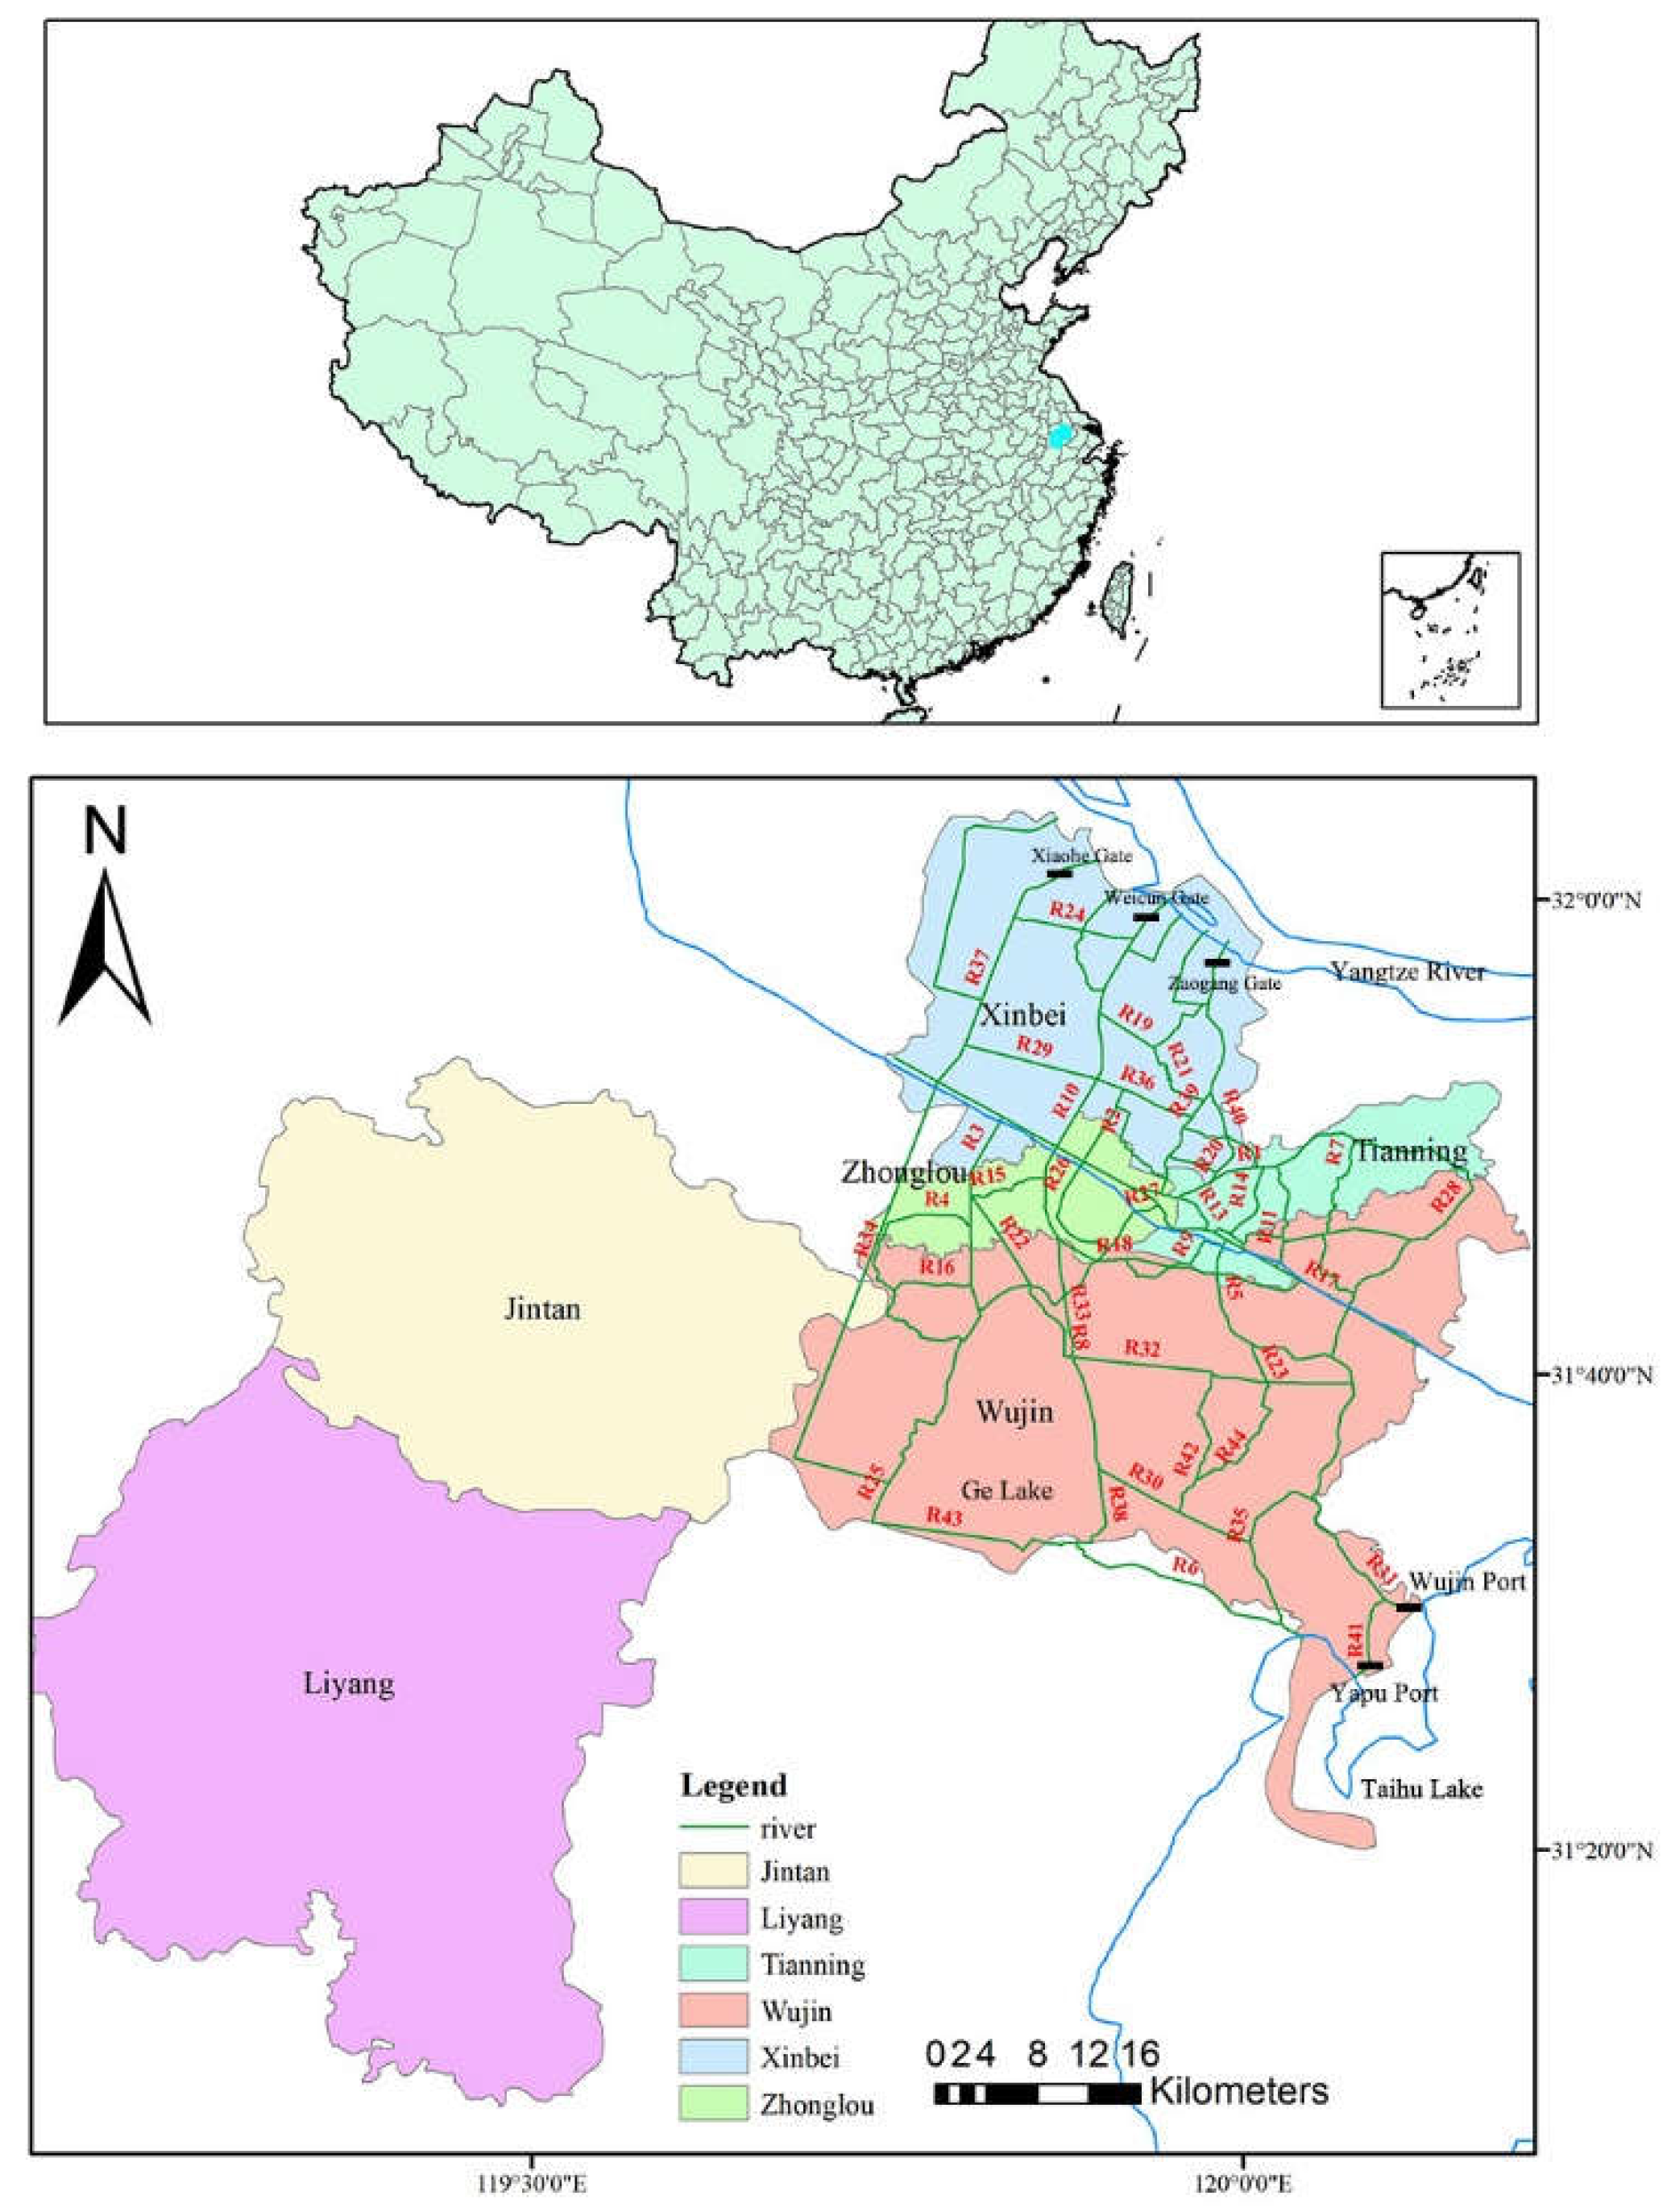
Figure 2.
Flow chart.
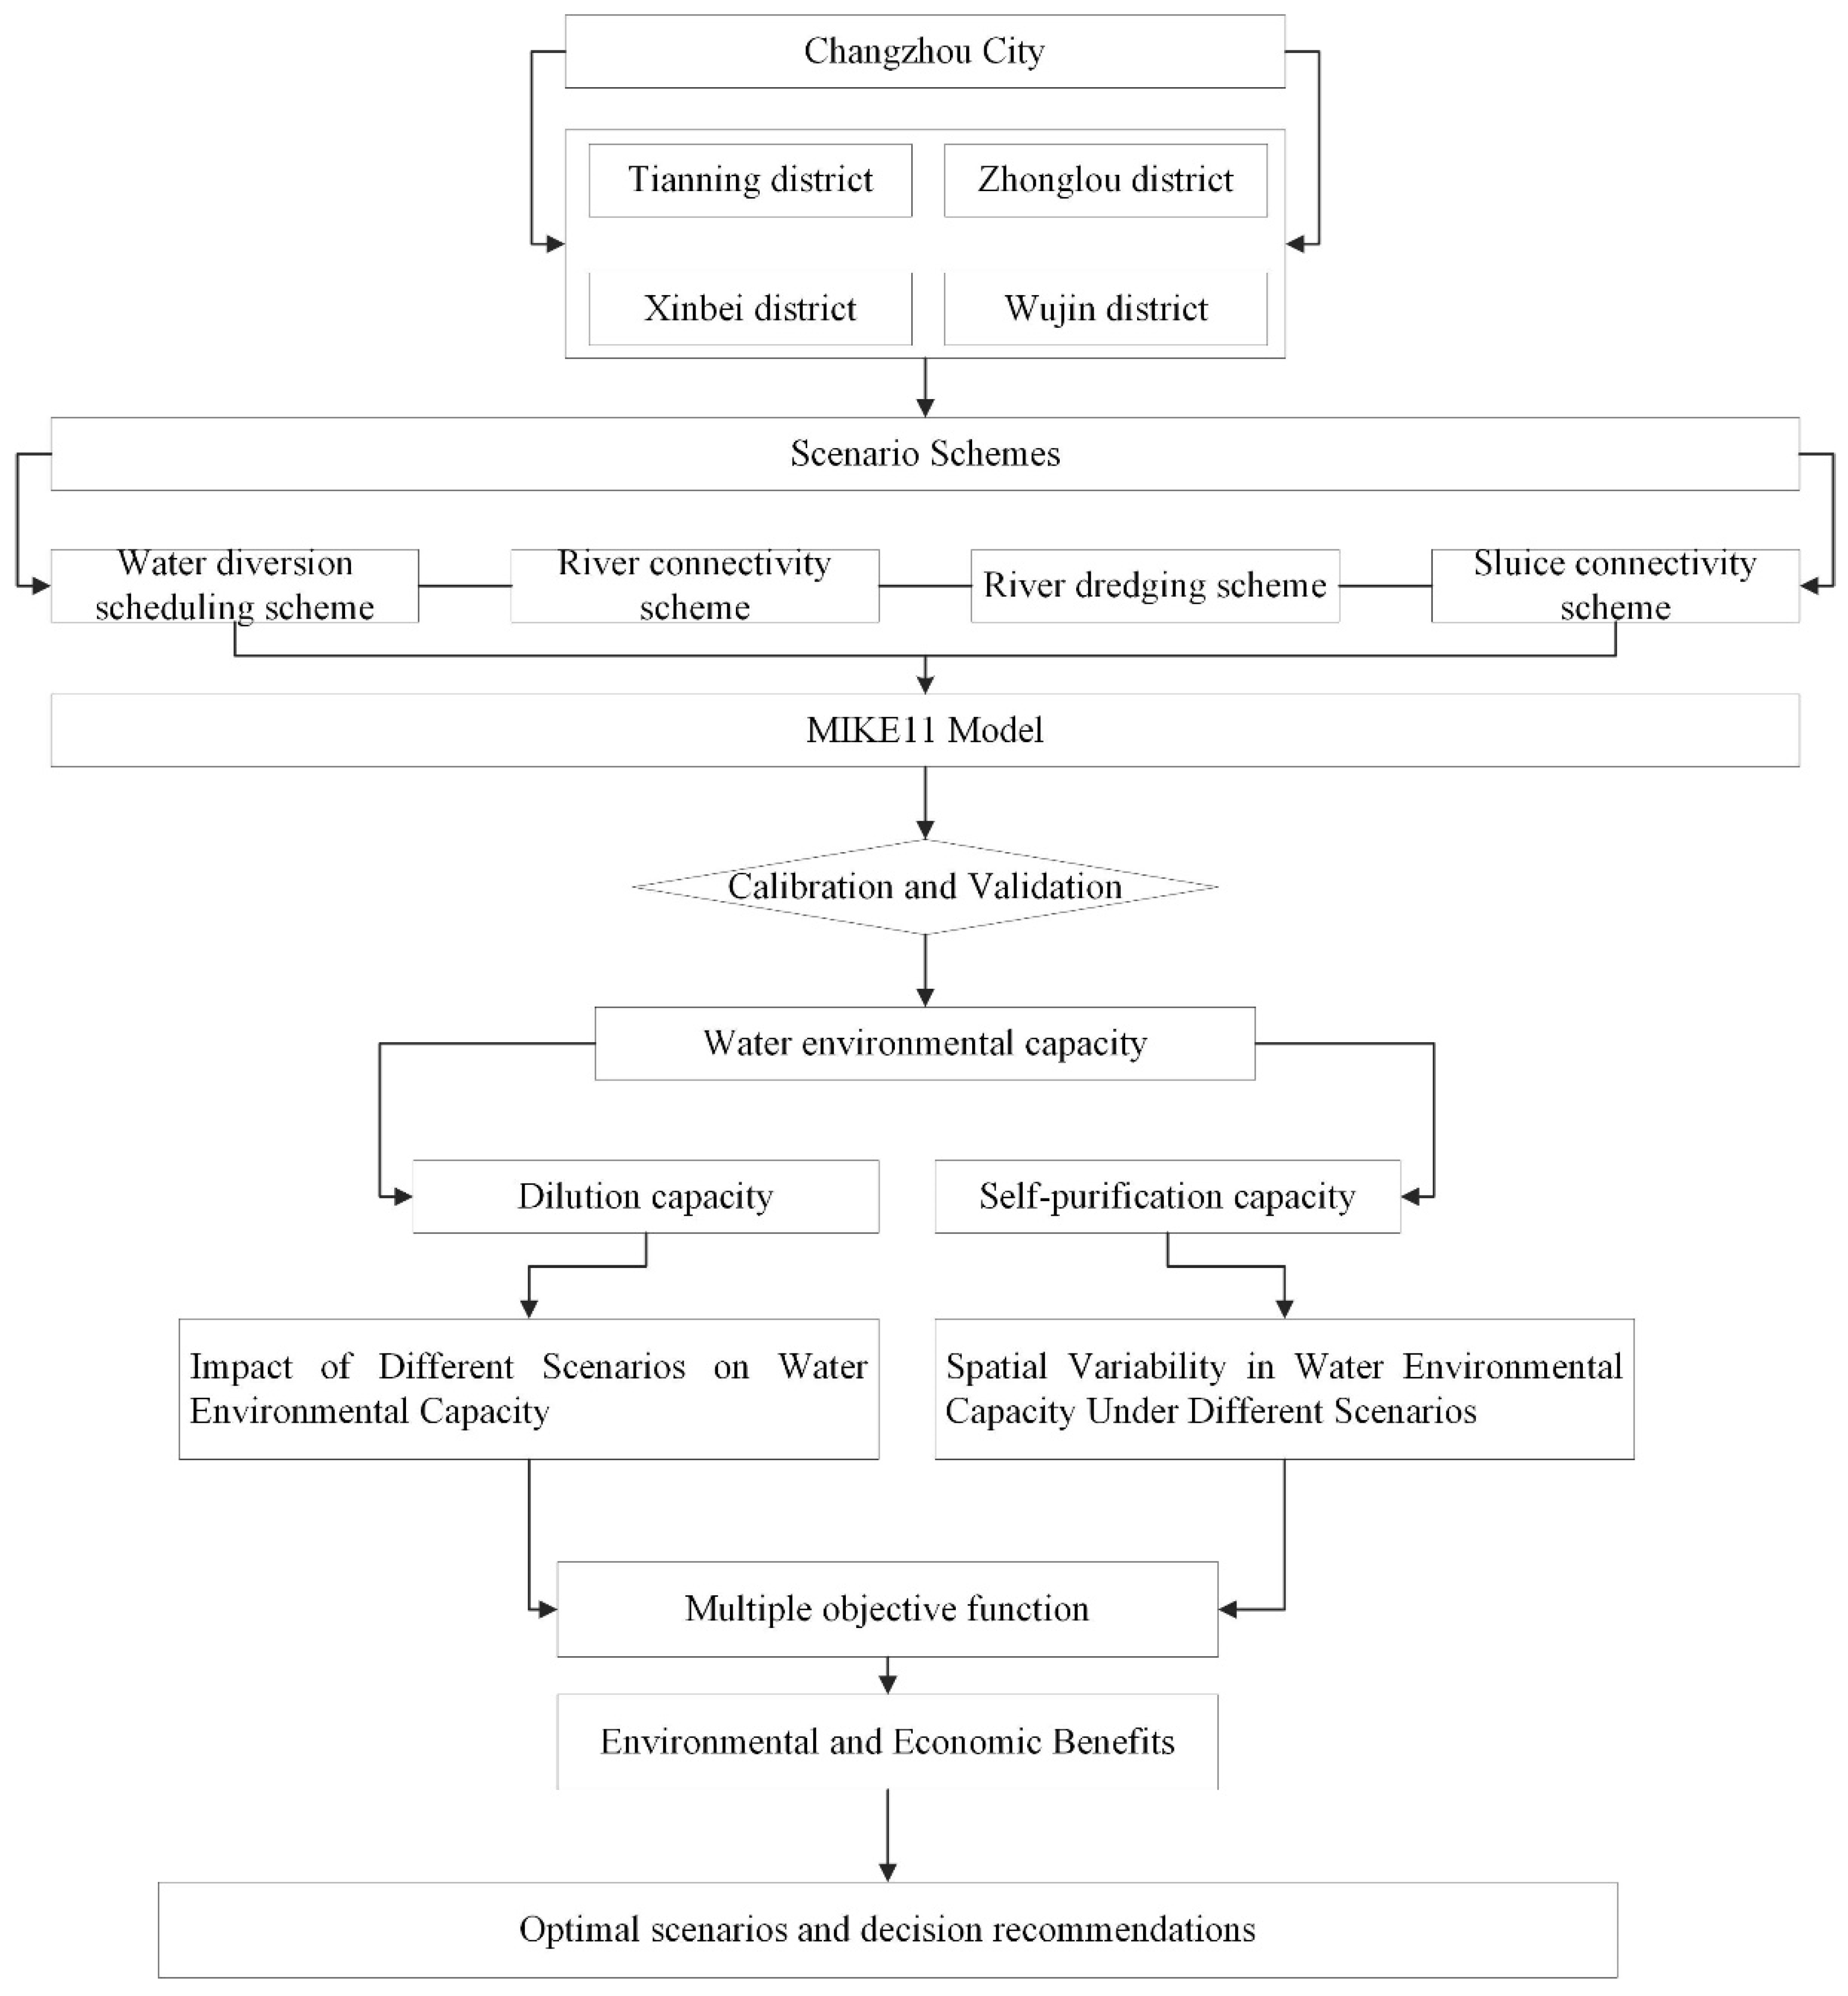
Figure 3.
Route of hydrological connectivity engineering. Note: The green segments represent the river connectivity channels in the engineering plan.
Figure 3.
Route of hydrological connectivity engineering. Note: The green segments represent the river connectivity channels in the engineering plan.
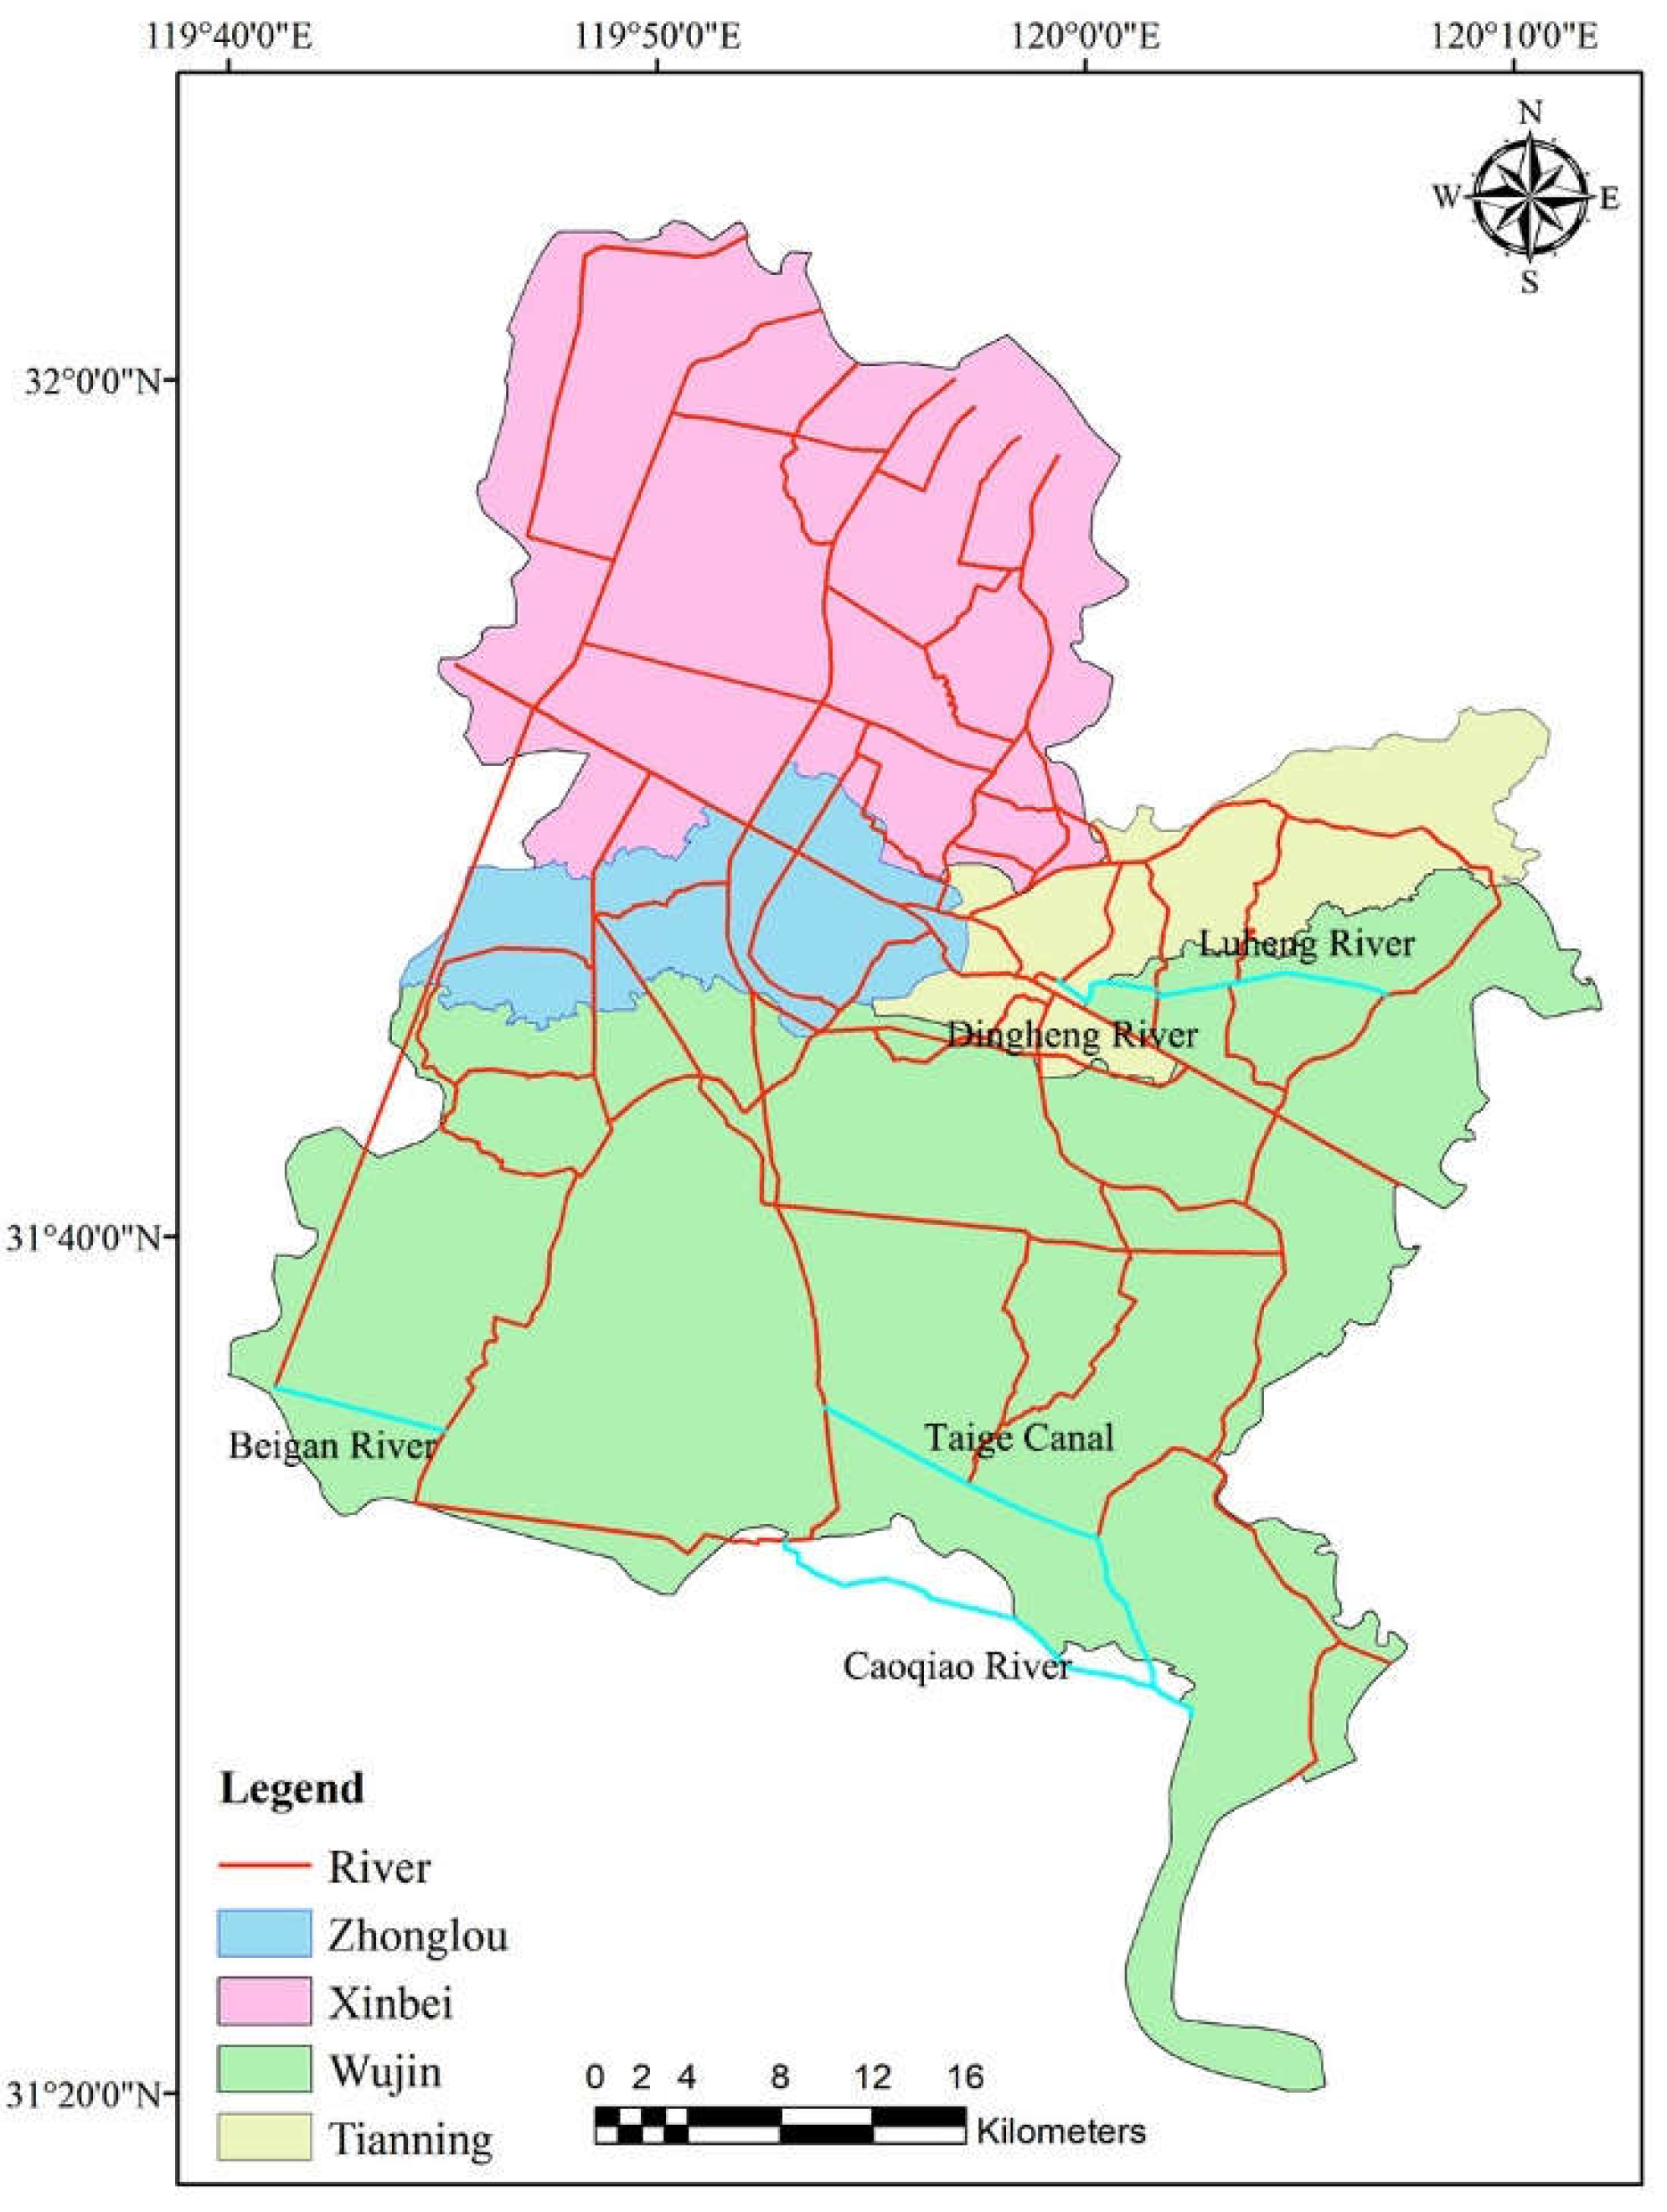
Figure 4.
Extension of dredging project in Xinmeng river. Note: The green segments represent the river connectivity channels in the engineering plan.
Figure 4.
Extension of dredging project in Xinmeng river. Note: The green segments represent the river connectivity channels in the engineering plan.
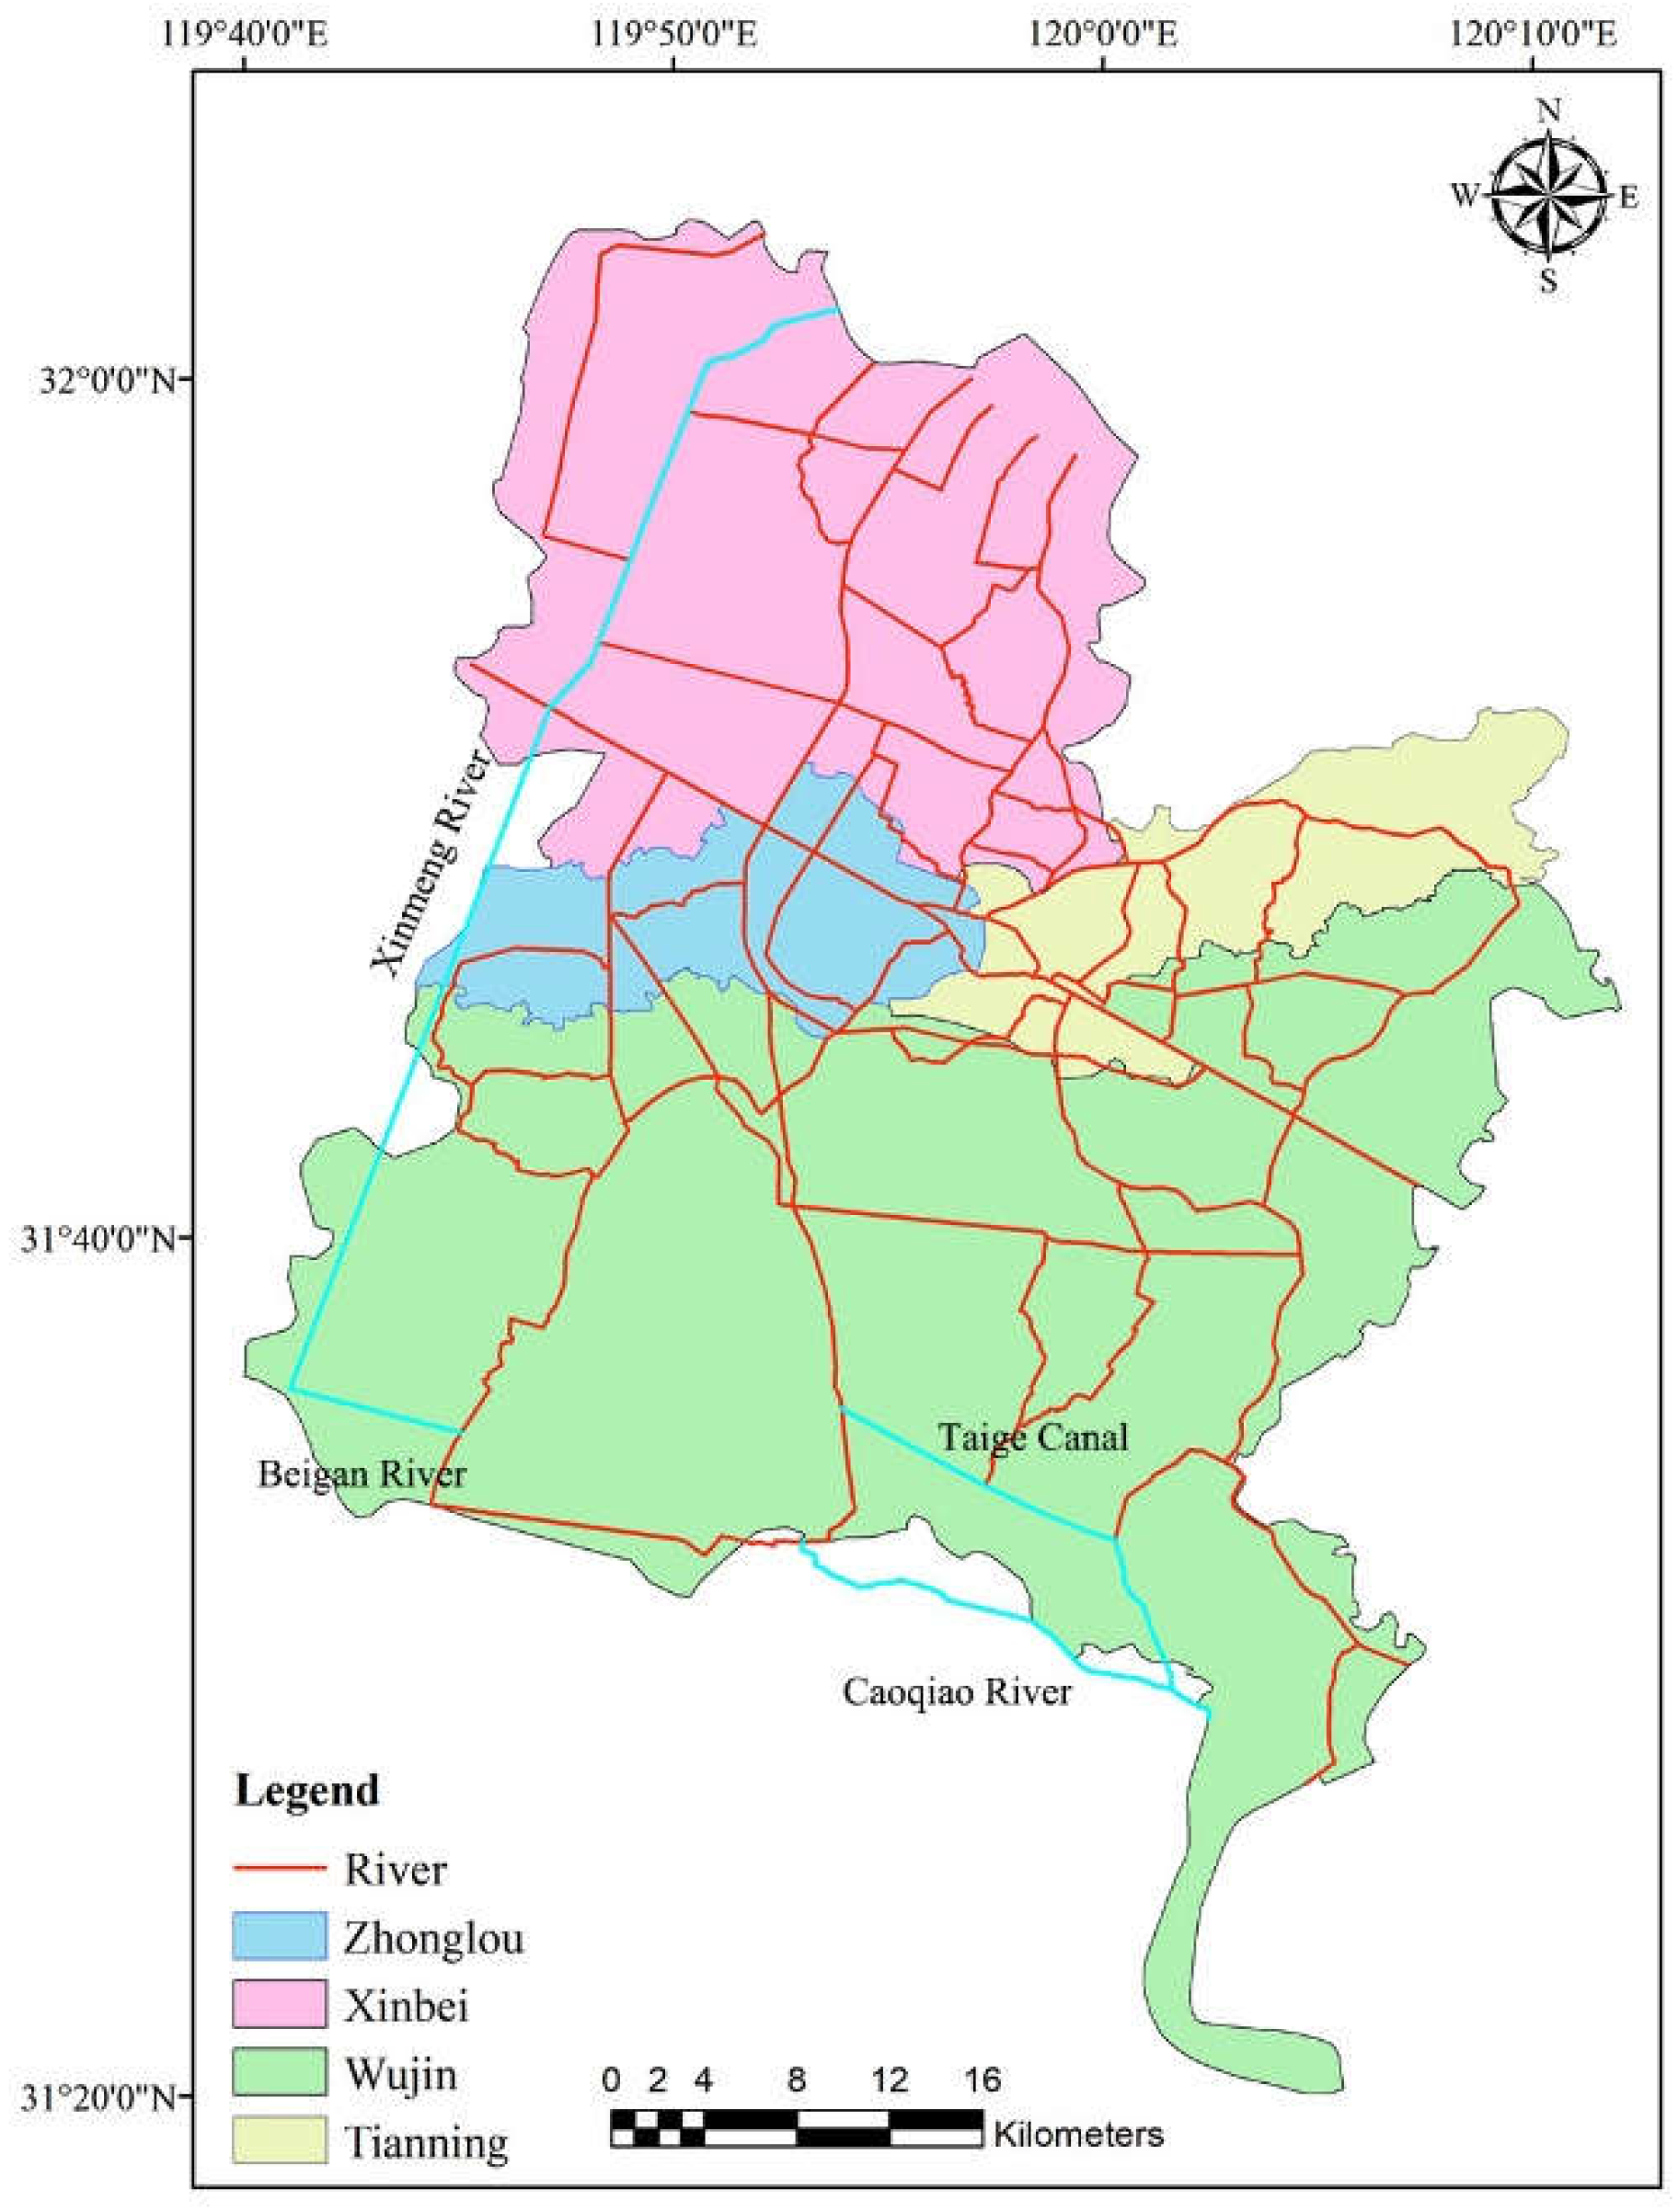
Figure 5.
Connecting points of sluices.
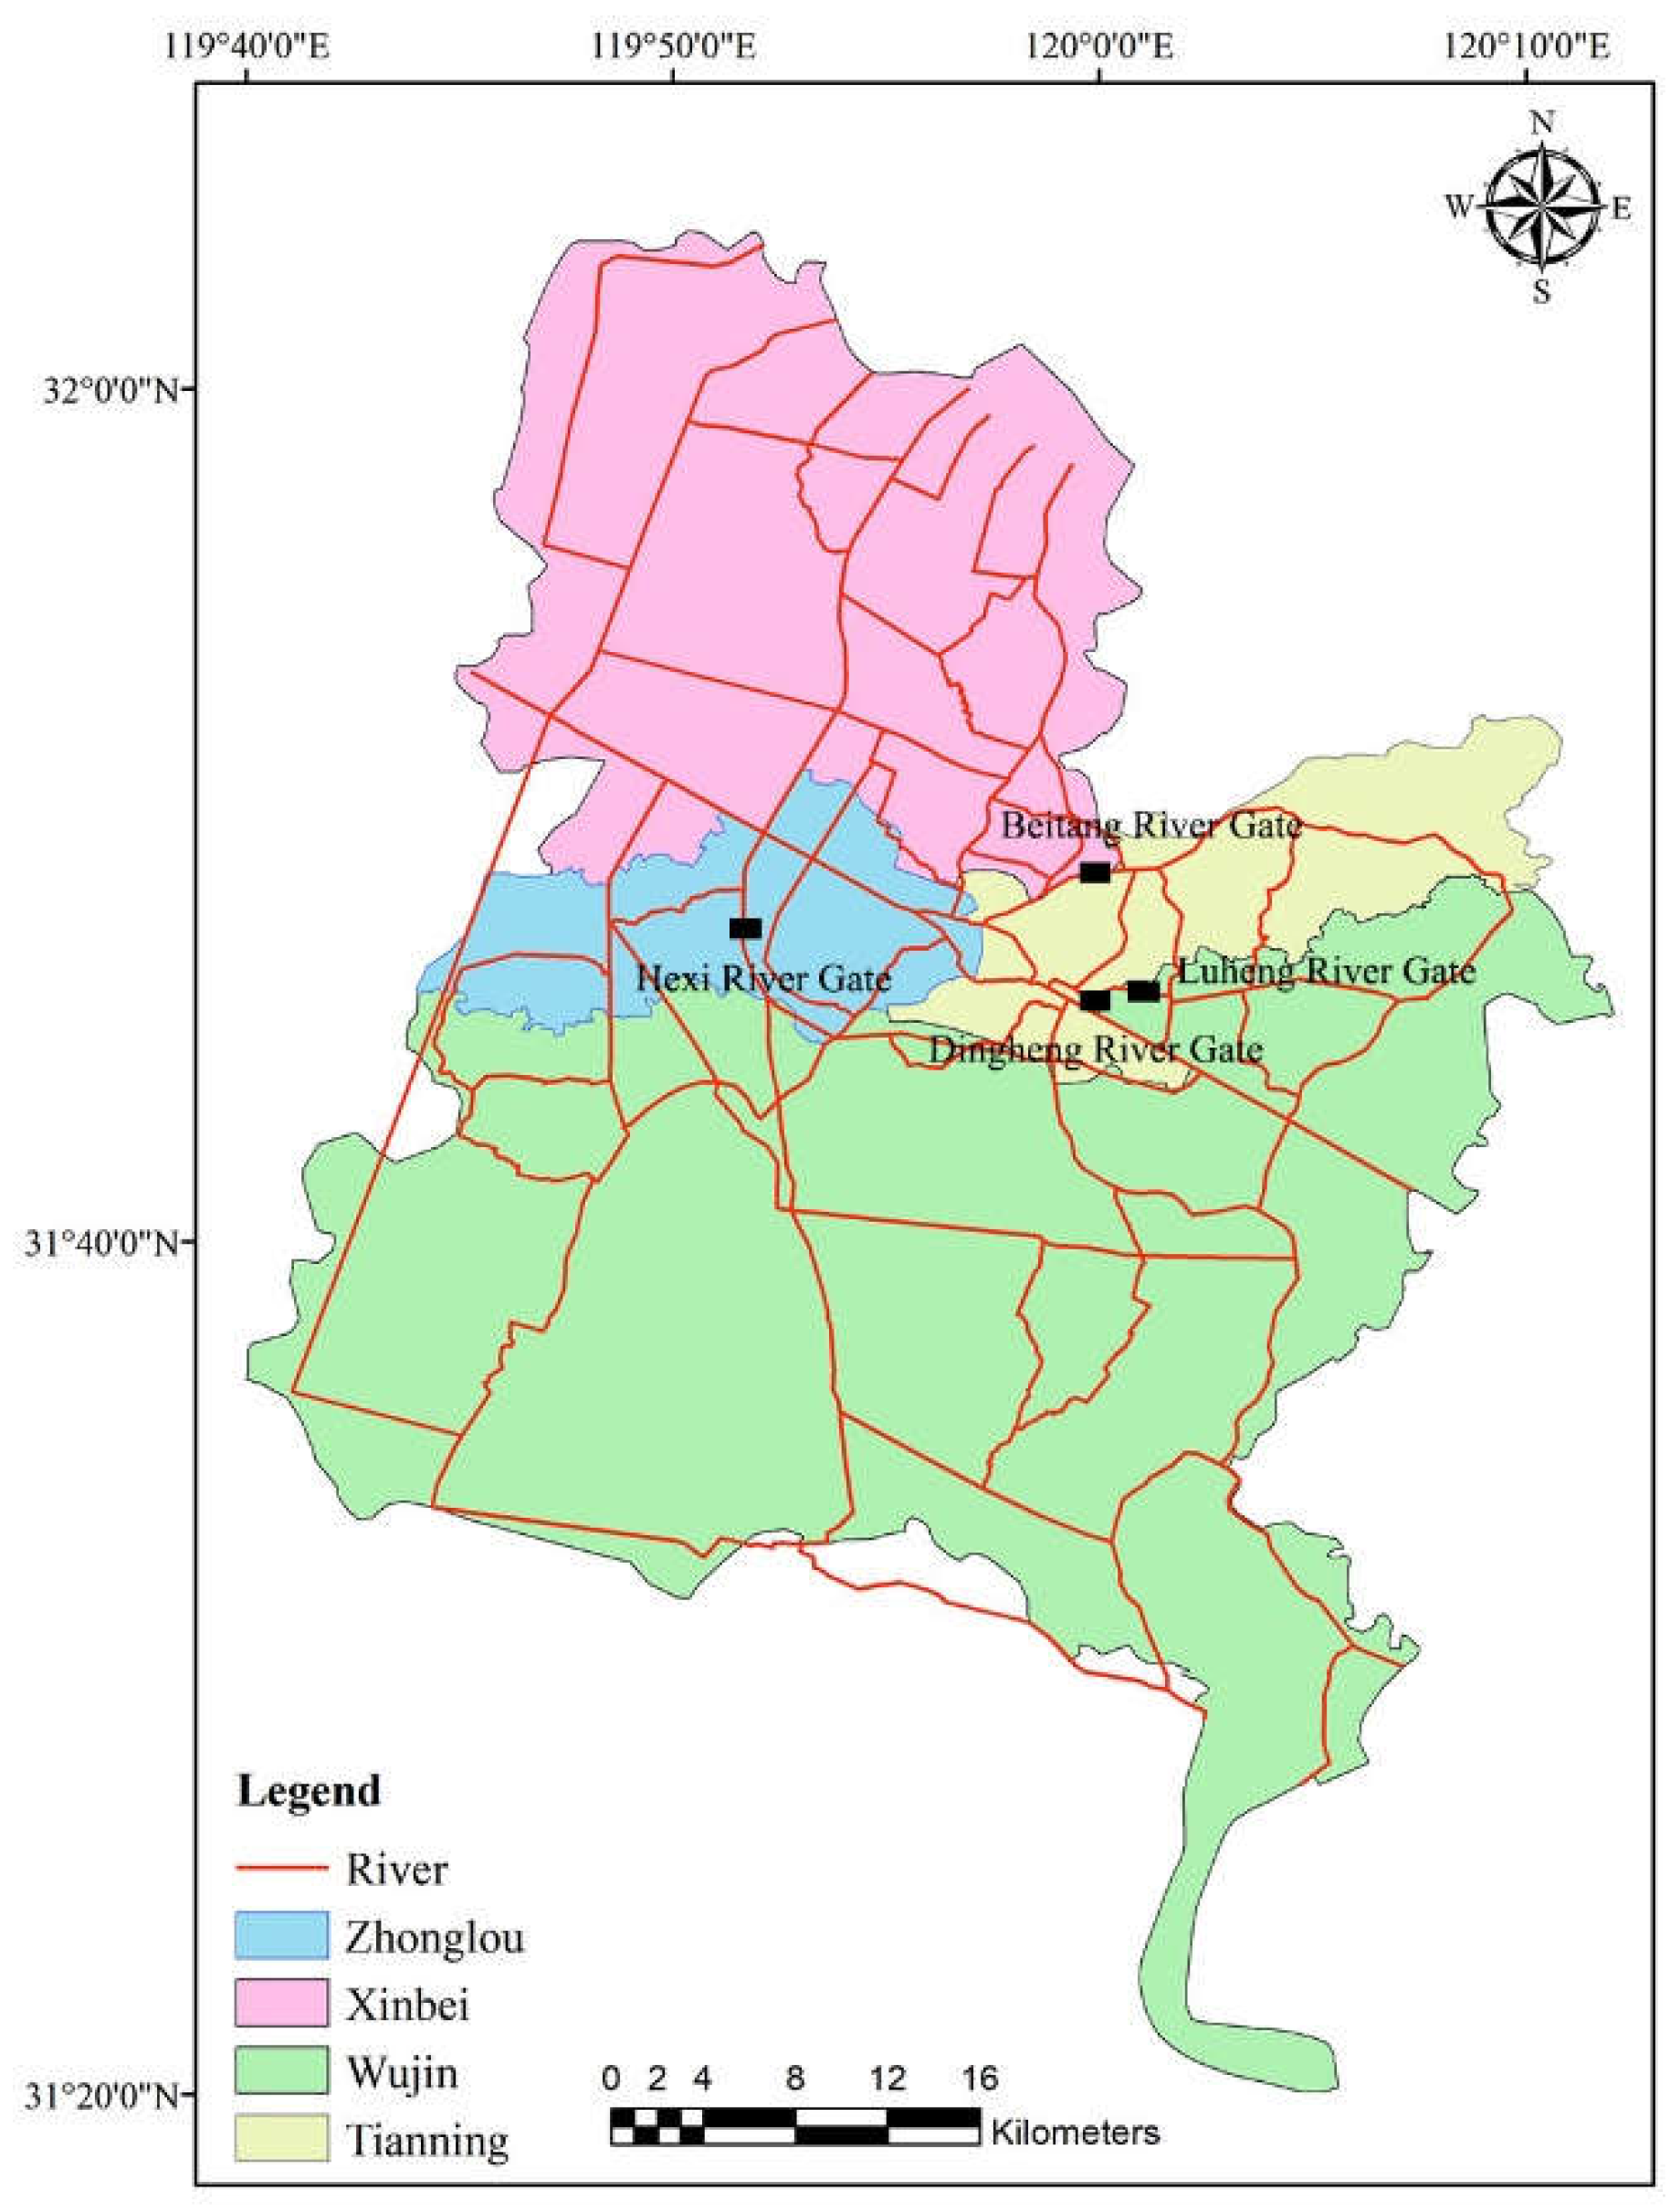
Figure 6.
Average relative error of river network water quality in the study area.
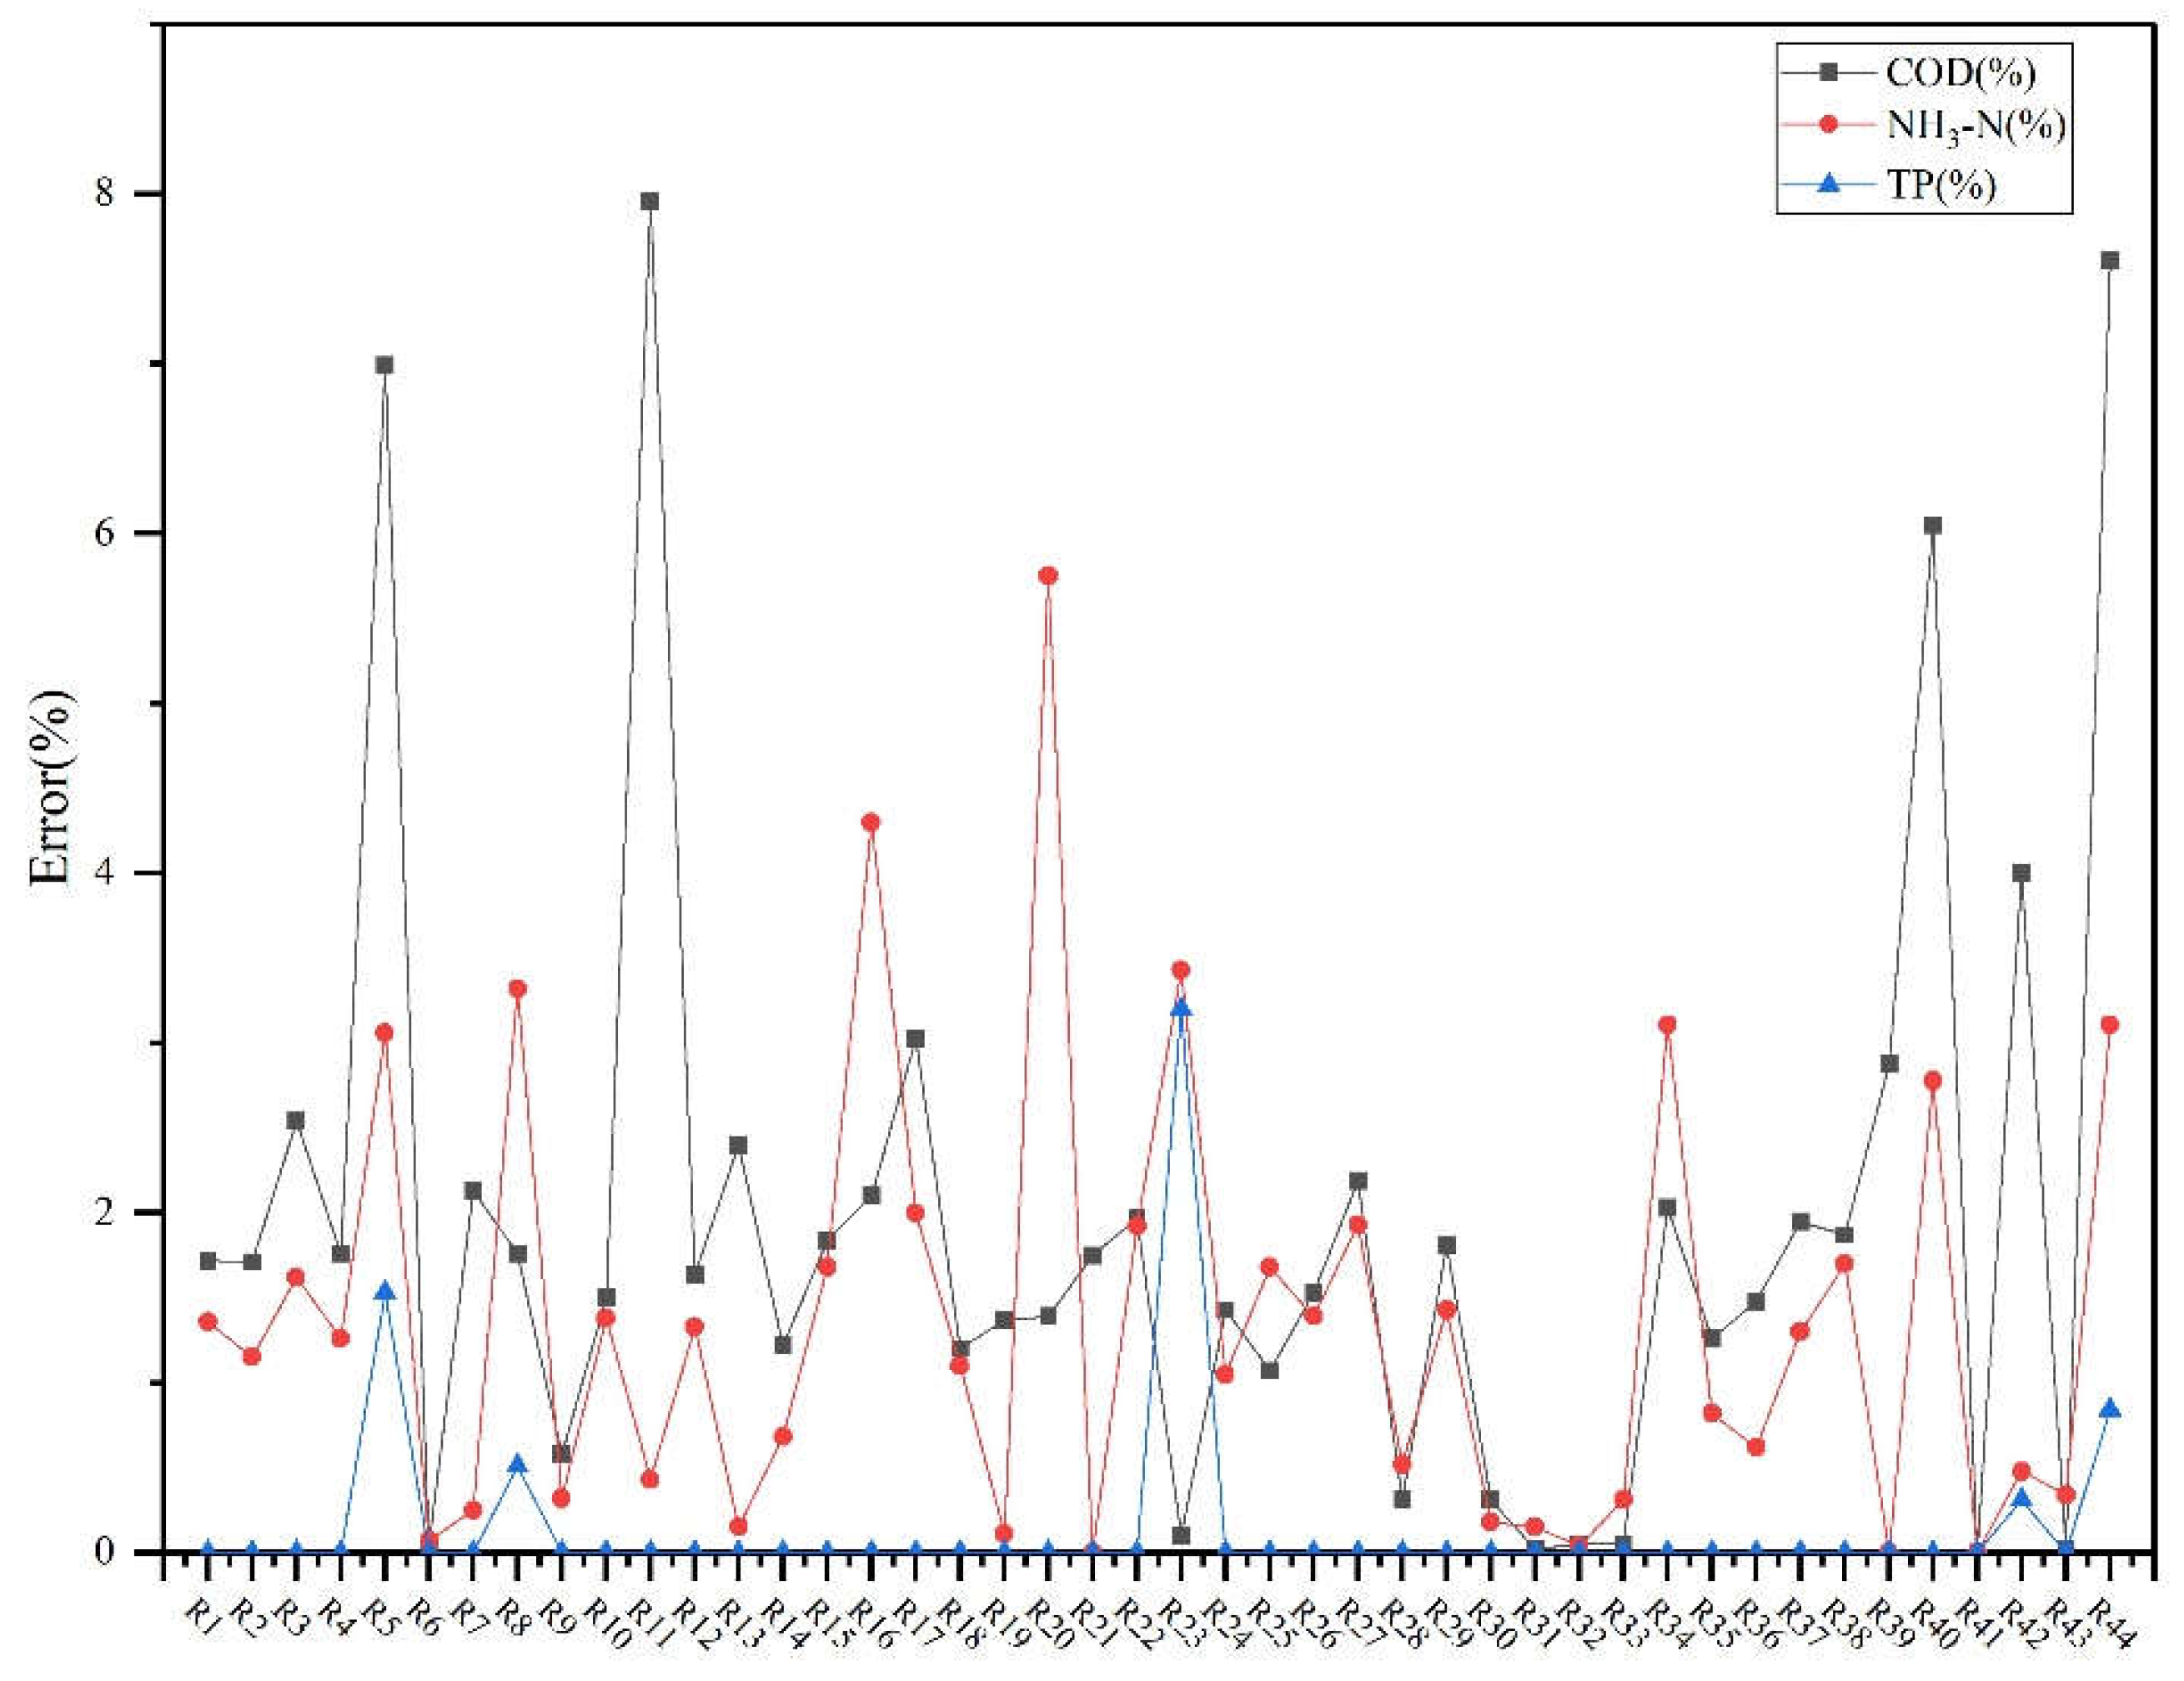
Figure 7.
Variation of water environmental capacity of river network under different schemes (t/a).
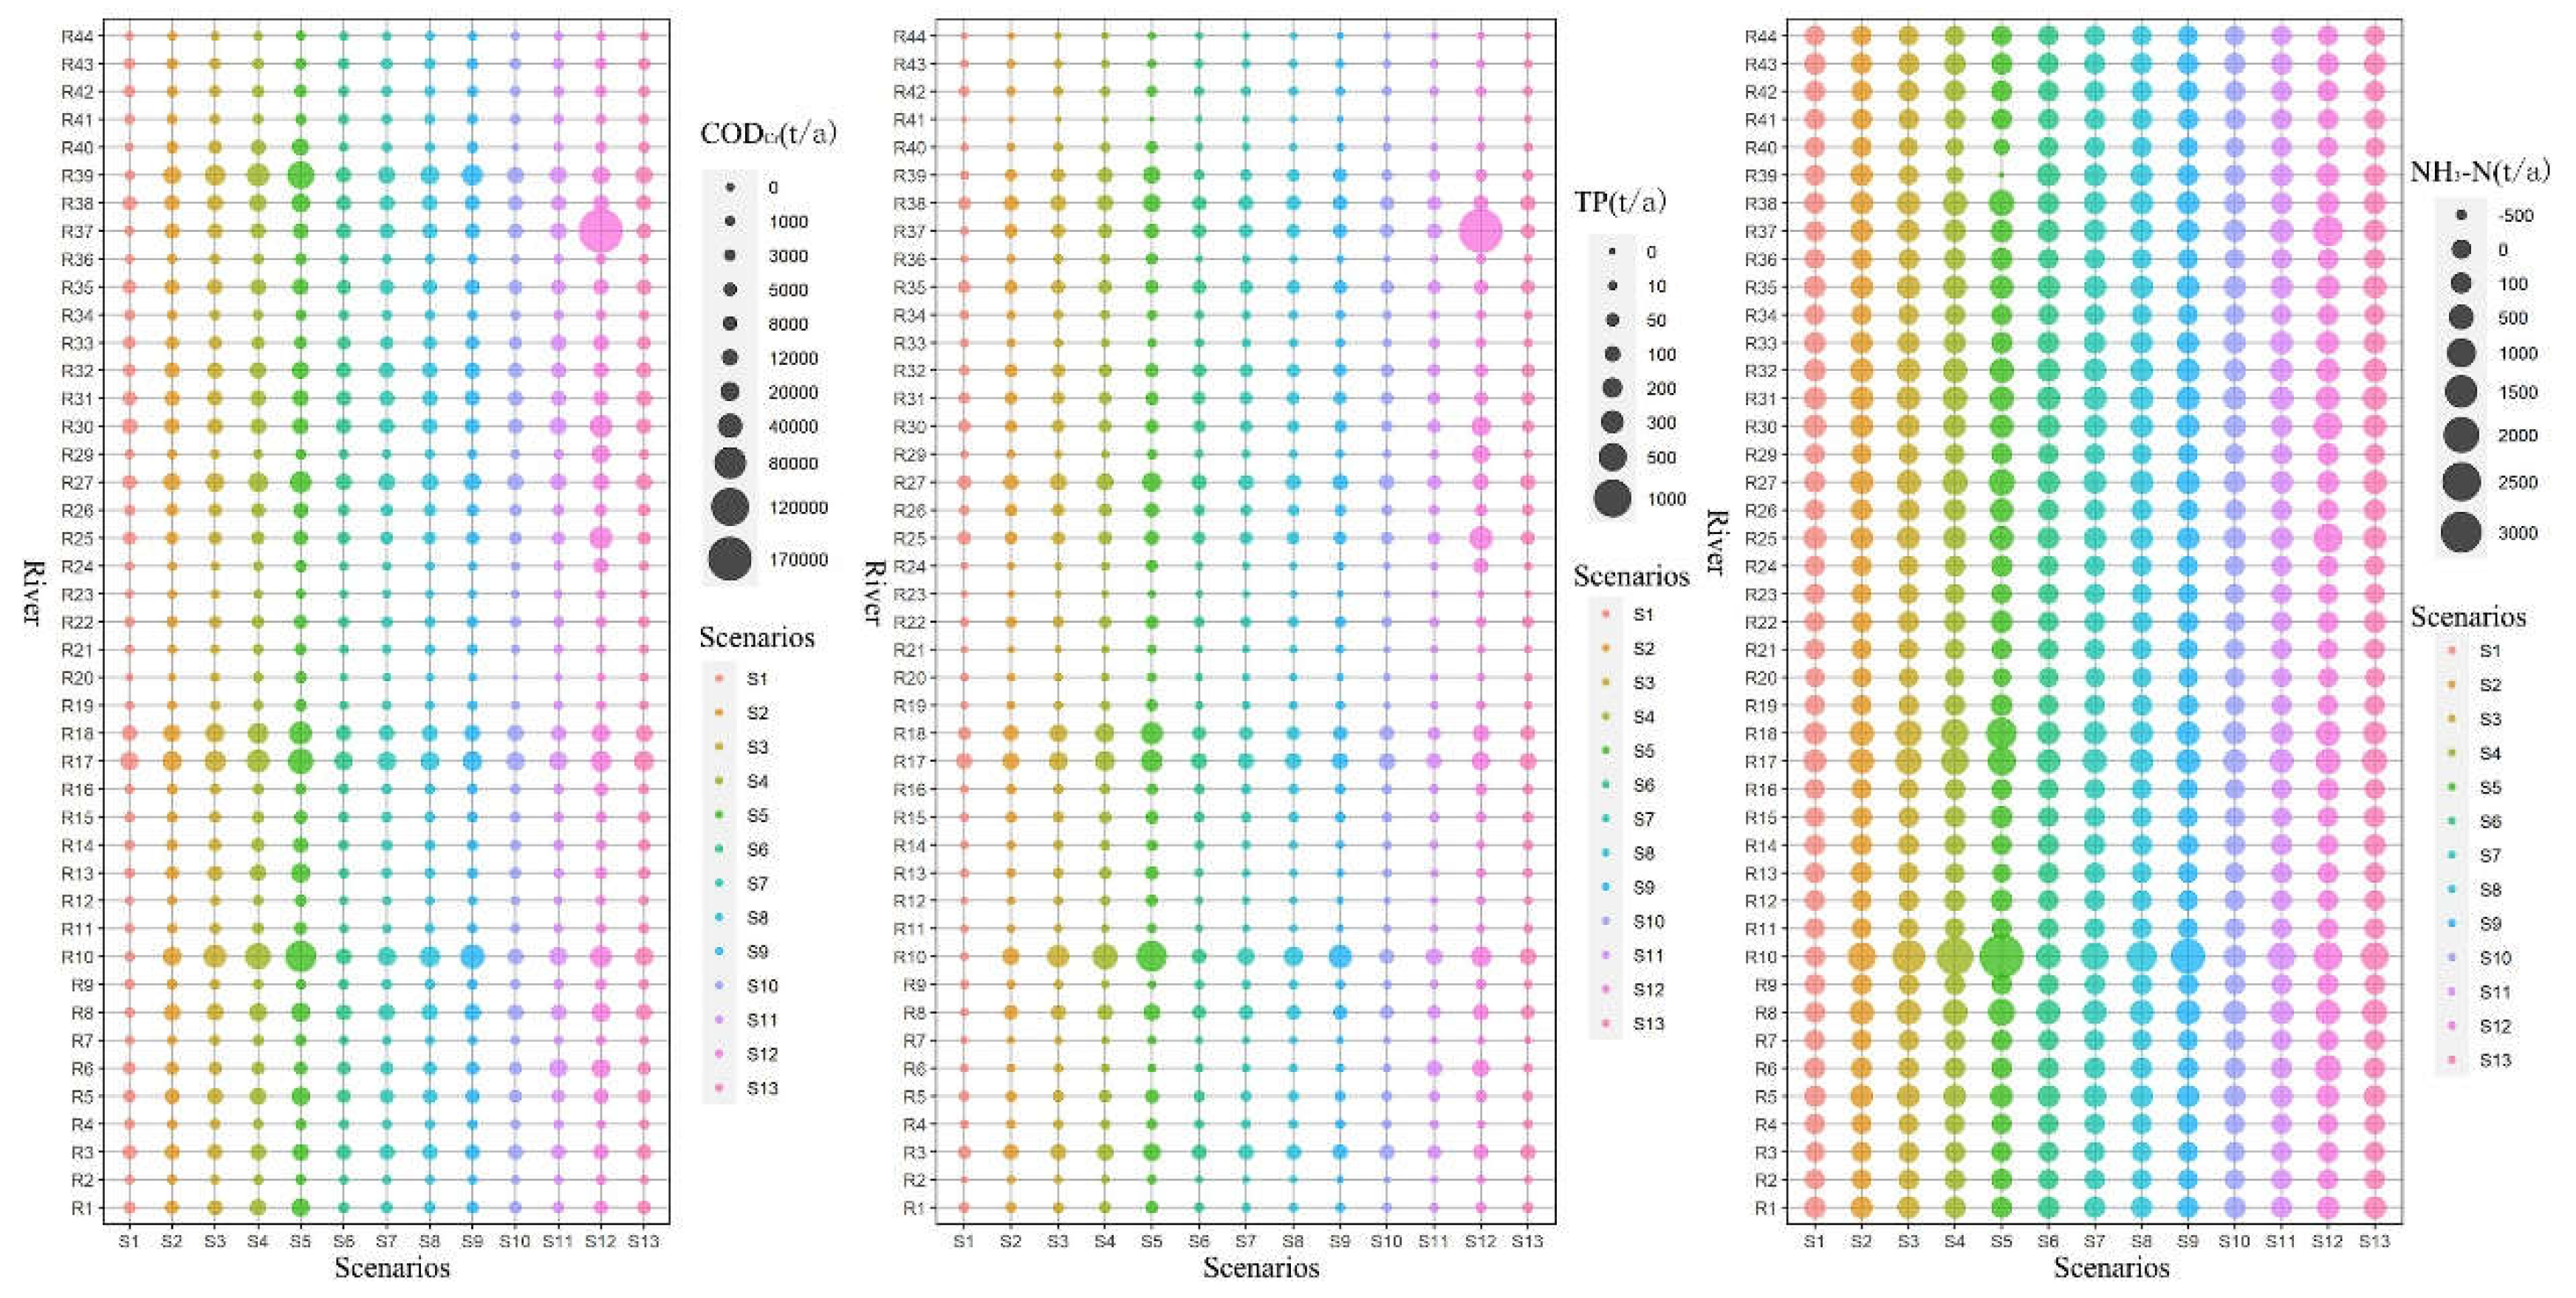
Figure 8.
Spatial distribution of river environmental capacity under different scenarios. Note: Green rivers indicate an improvement in water environmental capacity, while black rivers indicate a decrease in water environmental capacity.
Figure 8.
Spatial distribution of river environmental capacity under different scenarios. Note: Green rivers indicate an improvement in water environmental capacity, while black rivers indicate a decrease in water environmental capacity.
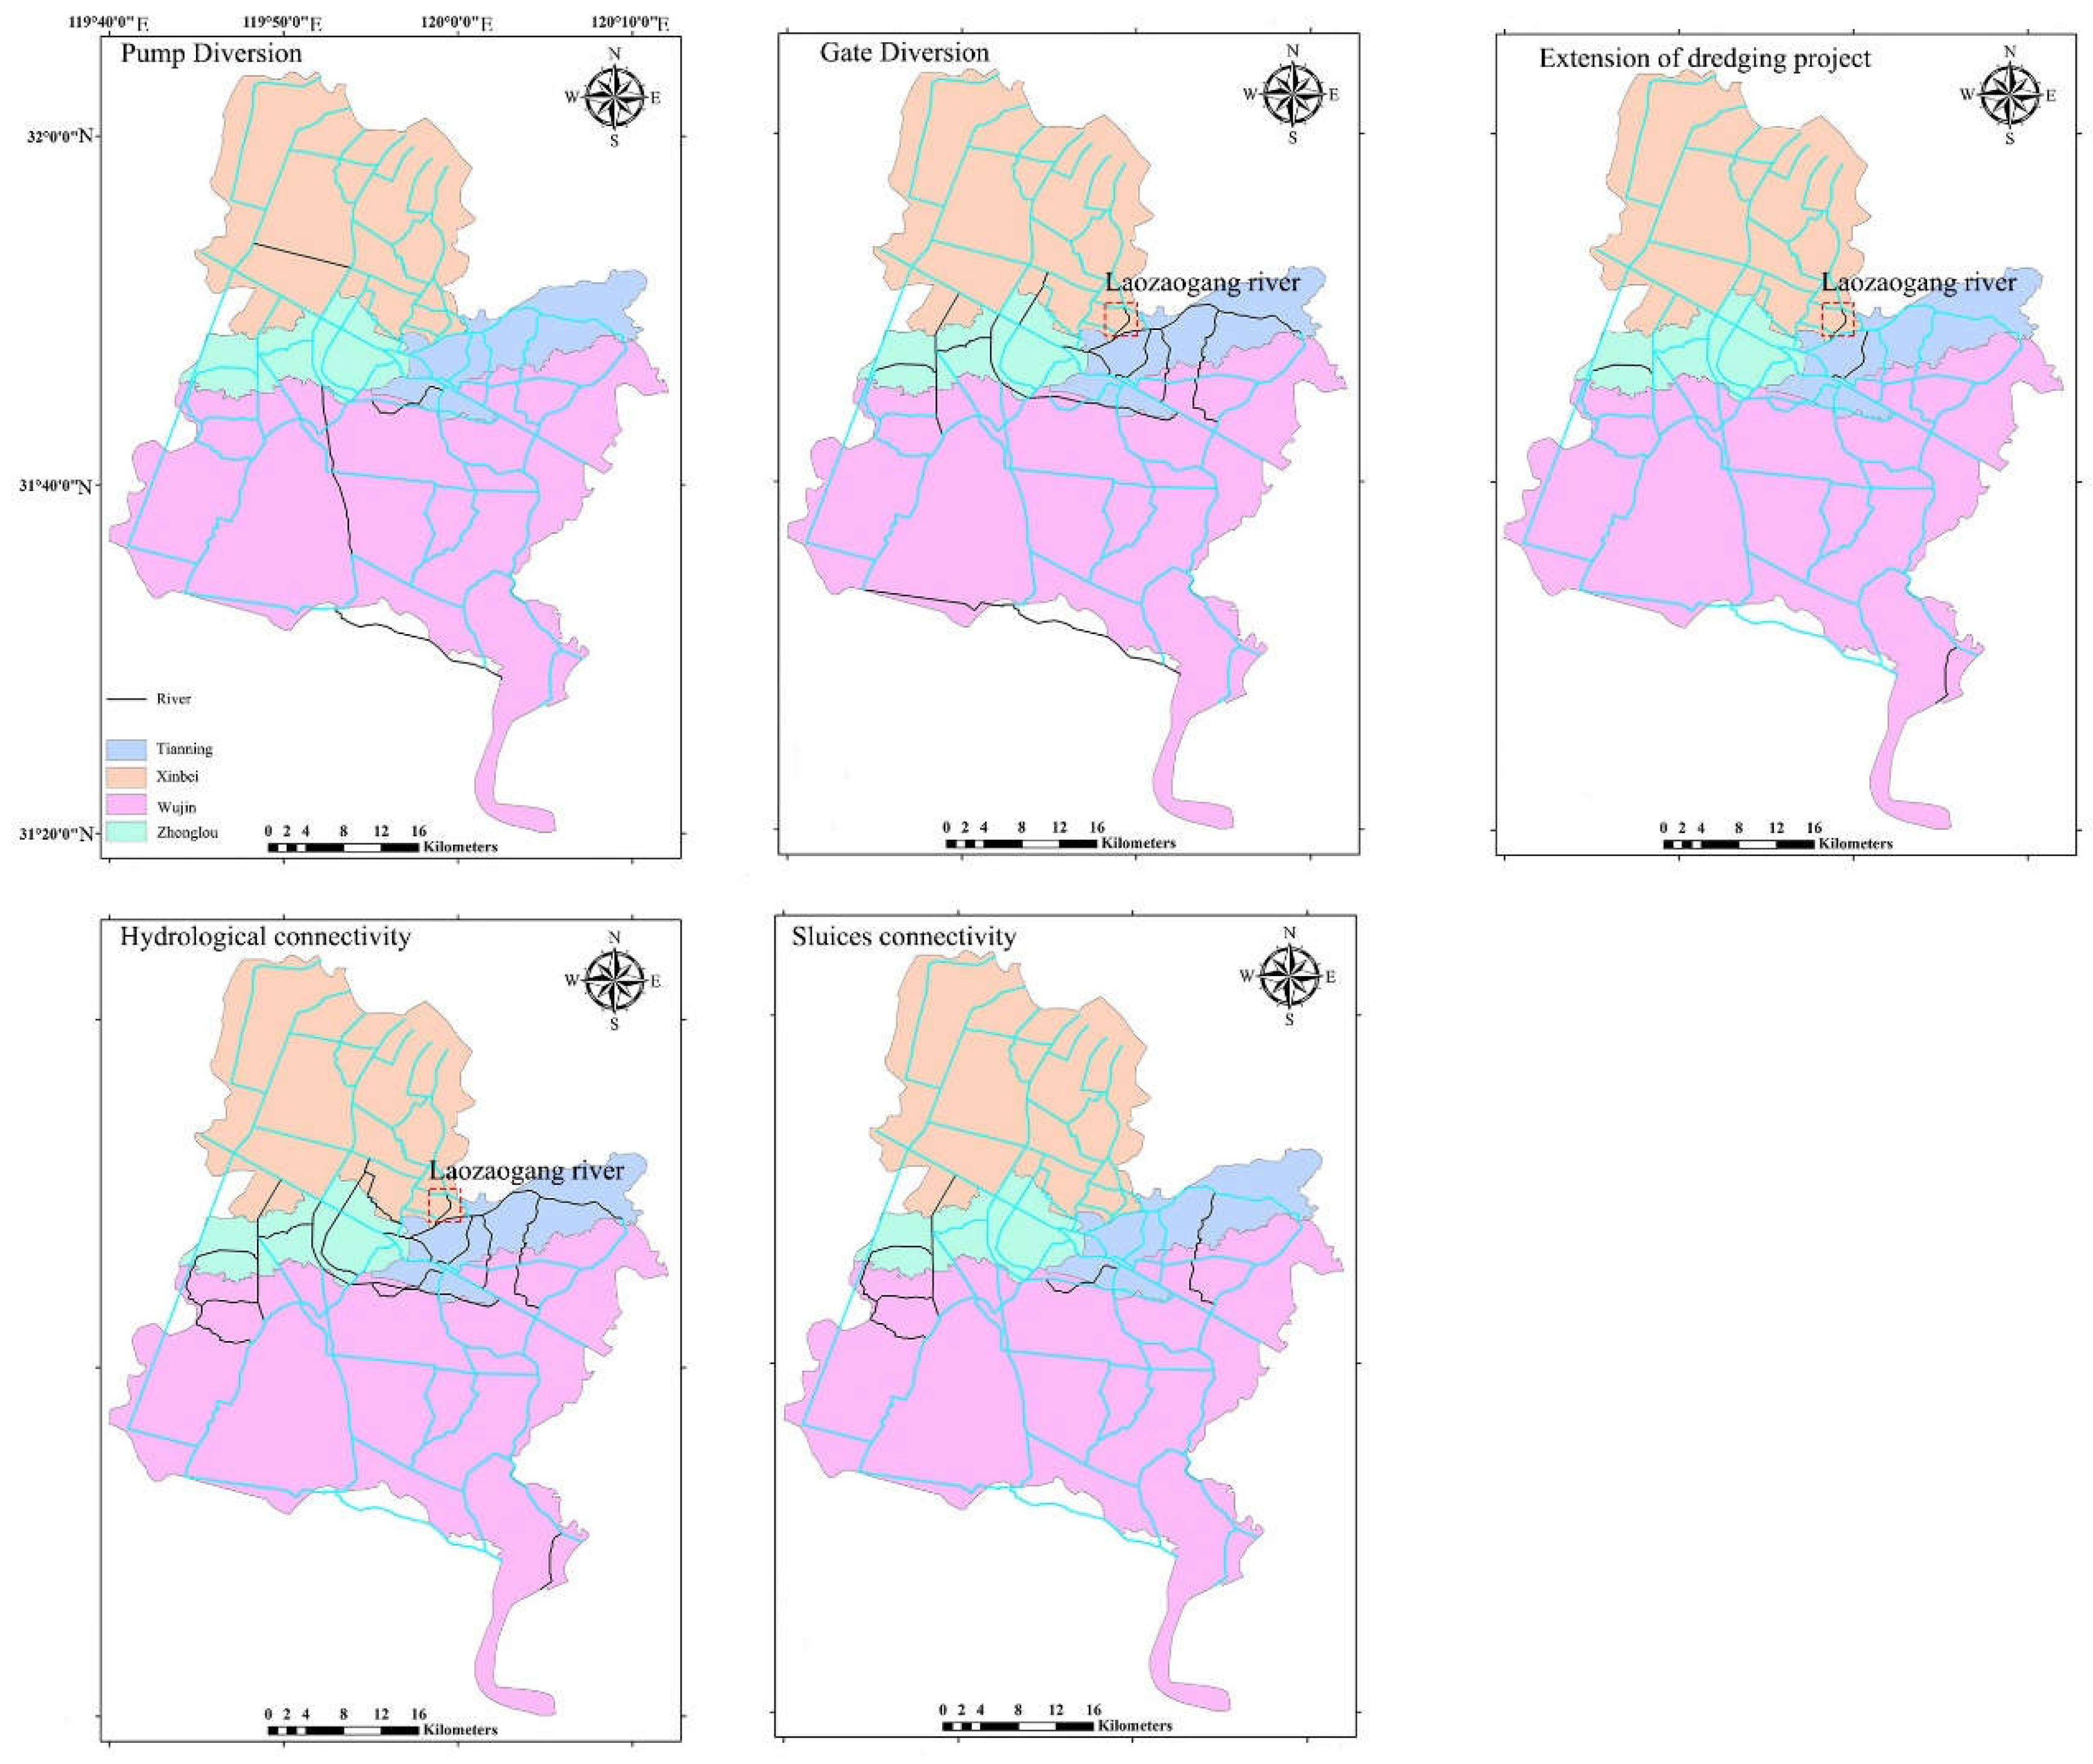
Figure 9.
Environment, economy and objective function values under different scenarios.

Table 2.
Important parameters of economic cost function.
| Key Parameters | Value | Unit |
|---|---|---|
| Dingheng river dredging volume | 465480 | m3 |
| Luheng river dredging volume | 909,730 | m³ |
| Caoqiao river dredging volume | 1,846,500 | m³ |
| Taige river dredging volume | 1,808,910 | m³ |
| Beigan river dredging volume | 684,920 | m³ |
| Dredging cost (per m³) | 30 | CNY/m³ |
| Sluice management cost (annual) | 250,000 | CNY/year |
Table 3.
Calibration and verification errors of Wujin and Yapu.
| Section | Calibration | Verification |
|---|---|---|
| Wujin Port | 0.82 | 0.79 |
| Yapu Port | 0.90 | 0.84 |
Table 4.
Relative Error (RE) of Flow Simulations Across Cross-Sections.
| Section | RE (%) |
|---|---|
| Buyi Bridge | 3.02 |
| Caoqiao | 13.77 |
| Jiuli | 2.74 |
| Henglin | 5.60 |
| Wujin Port | 3.59 |
Table 5.
Improvement rate of water environmental capacity of river network under different schemes.
| Scenario | CODCr(%) | TP(%) | NH3-N(%) | ||||||
|---|---|---|---|---|---|---|---|---|---|
| Minimum value | Average | maximum value | Minimum value | Average | maximum value | Minimum value | Average | maximum value | |
| Scenario 1 | -93 | -44 | 7.31 | -72.99 | -50.86 | 4.83 | -50.89 | -32.08 | 6.09 |
| Scenario 2 | -2.31 | 15.55 | 46.79 | -1.23 | 18.58 | 45.69 | 0.76 | 32.14 | 83.22 |
| Scenario 3 | -2.3 | 36.28 | 69.83 | -8.23 | 31.24 | 64.72 | -0.90 | 34.82 | 90.94 |
| Scenario 4 | -5.04 | 43.85 | 76.09 | -2.53 | 39.25 | 78.62 | -3.36 | 51.32 | 94.01 |
| Scenario 5 | -10.54 | 54.76 | 89.01 | -7.04 | 51.05 | 90.82 | -10.92 | 47.08 | 96.80 |
| Scenario 6 | -56.54 | -7.96 | 10.97 | -26.92 | -0.50 | 24.10 | -24.83 | 11.99 | 46.71 |
| Scenario 7 | -45.46 | -3.48 | 13.04 | -21.10 | -1.05 | 35.66 | -4.70 | 13.22 | 53.04 |
| Scenario 8 | -32.13 | -4.13 | 31.51 | -19.00 | -0.92 | 36.19 | -4.66 | 13.50 | 65.60 |
| Scenario 9 | -46.17 | 2.01 | 49.63 | -14.46 | 3.58 | 49.87 | -4.45 | 25.49 | 75.42 |
| Scenario 11 | -21.47 | 0.89 | 37.97 | -28.77 | 1.20 | 31.70 | -39.07 | -5.21 | 25.84 |
| Scenario 12 | -5.50 | 26.58 | 94.71 | -0.82 | 36.99 | 95.93 | -5.10 | 41.97 | 81.28 |
| Scenario 13 | -7.84 | 23.18 | 40.45 | -7.99 | 22.29 | 78.53 | -18.75 | 25.62 | 72.85 |
Disclaimer/Publisher’s Note: The statements, opinions and data contained in all publications are solely those of the individual author(s) and contributor(s) and not of MDPI and/or the editor(s). MDPI and/or the editor(s) disclaim responsibility for any injury to people or property resulting from any ideas, methods, instructions or products referred to in the content. |
© 2024 by the authors. Licensee MDPI, Basel, Switzerland. This article is an open access article distributed under the terms and conditions of the Creative Commons Attribution (CC BY) license (http://creativecommons.org/licenses/by/4.0/).
Copyright: This open access article is published under a Creative Commons CC BY 4.0 license, which permit the free download, distribution, and reuse, provided that the author and preprint are cited in any reuse.


