Submitted:
08 September 2025
Posted:
11 September 2025
You are already at the latest version
Abstract
With population growth and rapid socioeconomic development, water demand has increased, exacerbating conflicts between human activities and water resources, significantly impacting the balance between blue and green water supply and demand. Existing research lacks a spatial perspective to analyze the intrinsic relationship between blue and green water supply and demand, particularly regarding the spatial differentiation characteristics and rational allocation of blue and green water supply-demand balance in inland river basins. Taking the Taolai River Basin as a case study, this paper employs the distributed hydrological model SWAT from a blue-green water resources perspective to simulate the spatiotemporal distribution characteristics of blue and green water resources at the sub-basin scale for the period 2002–2021. The supply and demand balance relationship of blue and green water resources within the basin was analyzed, the assessment index system of water resources security was constructed, and the realizable potential of blue water resources under different indicators was quantified. The results indicate that during the study period, the average annual green water resources in the Taolai River Basin were 1.95 times higher than blue water resources, constituting the dominant component of regional water resources. Spatially, both blue and green water resources exhibited pronounced latitudinal zonality, showing a decreasing trend from south to north, with highly consistent distribution patterns. Blue water resources demonstrated significant spatial heterogeneity, with a safety index exceeding 1, indicating that supply-demand imbalances were primarily concentrated in the upper and middle reaches of the irrigated area and the desert zone, where safety levels were relatively low. In contrast, green water resources exhibited a safety index ranging from 0.7 to 1.0, suggesting overall high safety and minimal spatial variability. Based on the analysis of cross-regional water resource allocation potential, the calculated average annual theoretical transferable blue water resources during the study period reached 4.06×10⁸ m³. This demonstrates significant potential for optimizing regional water resource allocation, providing strong support for efficient water utilization within the Tala River basin and regional economic development. In summary, the evaluation system established in this study provides a scientific basis for optimizing water resource allocation and sustainable management within river basins. It offers technical support for constructing water network systems in inland river basins, playing a crucial role in achieving rational water resource allocation across different regions within these basins.
Keywords:
SWAT model
; blue and green water resources
; the Taolai River Basin
; supply and demand balance
; water resource allocation
1. Introduction
With socioeconomic development, water resources emerge as a critical strategic asset for national development and security [1]. However, climate change and accelerated urbanization have increased the frequency of extreme weather events while significantly altering hydrological processes in watershed ecosystems [2,3,4]. Under the coupled pressures of climate change and economic development, water scarcity and spatial distribution imbalances have emerged as increasingly critical challenges. Effective water resource management and utilization now represent paramount concerns requiring immediate attention.
Falkenmark et al. [5] first conceptualized the hydrological partitioning of blue and green water resources in 1995, which are now commonly referred to as freshwater resources. Blue water refers to liquid water resources on the surface and underground that are eventually transformed into human-related products and services [6]; green water represents soil moisture stored in the unsaturated zone that is directly utilized by vegetation through transpiration processes, constituting a critical component of the terrestrial water cycle [7]. The blue-green water paradigm expands traditional water resource conceptualization, while quantitative assessment methodologies significantly improve regional water management strategies and provide a scientific foundation for sustainable development planning [8]. Blue water resource assessment methodologies primarily incorporate water balance analyses and hydrological modeling. For green water evaluation, researchers employ integrated approaches combining crop water requirement analysis, distributed hydrological modeling, and geospatial techniques incorporating remote sensing and GIS. SWAT [9], VIC [10], and TOPMODEL [11] are examples of commonly used hydrological models. Among them, the SWAT (Soil and Water Assessment Tool) model is a widely used tool for hydrological, water quality, and land management studies. This approach enables comprehensive watershed-scale water cycle simulation and enhanced quantification of blue-green water resources through the integration of digital elevation models (DEMs), land use/cover data, soil type distributions, and meteorological variables. Wenhua Qi et al. [12] used the SWAT model to quantify blue and green water resources in the Tumen River Basin across various time periods, as well as to investigate the balance of water supply and demand. Hao Yang et al. [13] employed the SWAT model to investigate the geographical and temporal distribution features of blue and green water in the Jialing River Basin, as well as the Mann-Kendall trend test to examine inter-annual changes in blue and green water resources. Yiju Gao et al. [14] employed the SWAT model to simulate the evolution of runoff in the Beijiang River Basin, assessing the geographical and temporal variations of blue-green water resources, as well as their drought response characteristics. Abate et al. [15] used the CMIP6 and SWAT models to estimate the amount of future climate change in the Kobo-Golina River Basin in the upper Danakil Basin, Ethiopia, as well as the effects on blue-green water resources. Woldesenbet [16] used the SWAT model to investigate the effects of changes in land use and land cover types on blue and green water resources, as well as ecology. Koycegiz, C et al. [17] A semi-distributed soil and water assessment tool (SWAT) model is used to simulate streamflow at the headwater of Caramba River, located at the Konya Closed Basin, Turkey. At present, the majority of existing research, both domestically and internationally, primarily focuses on analyzing influencing factors and temporal evolution trends. However, there is a notable lack of exploration into the potential spatial connections between blue and green water supply and demand. This is particularly evident in the analysis of the balance between blue and green water resources supply and demand within inland river basins, which remains insufficiently studied from a spatial perspective. Comprehensive assessment of blue-green water resource supply-demand dynamics is essential for enhancing ecological sustainability and optimizing cross-regional water allocation strategies.
The Taolai River Basin, a critical component of the Heihe River subsystem, is situated in the arid to semi-arid inland region of northwestern China. Originating in the Qilian Mountains, the basin's hydrology is primarily sustained by precipitation, snowmelt, and groundwater recharge. The Taolai River Basin is experiencing compounding water resource challenges, including intensifying human-water conflicts, growing supply-demand imbalances, deteriorating water quality, progressive ecosystem degradation, and accelerating groundwater depletion, all driven by rapid industrialization and urbanization. The concept of blue-green water, as well as the establishment of an assessment system for the balance of supply and demand for blue-green water, offers novel methodological approaches for addressing the trade-offs between economic development and ecological conservation in river basins, while advancing research on sustainable regional water resource governance. This study employs the Soil and Water Assessment Tool (SWAT) to simulate hydrological processes and quantify the spatiotemporal dynamics of blue-green water resources (2002-2021) in the Taolai River Basin, providing critical insights for evidence-based water resource management and sustainable regional development in arid northwest China.
2. Data and Methods
2.1. Research Approach
This study employs the Soil and Water Assessment Tool (SWAT) to examine the supply-demand dynamics of blue and green water resources in the central Hexi Corridor, utilizing the Taolai River Basin as a representative case study. The comprehensive methodological framework is illustrated in Figure 1. First, the model parameters were calibrated and validated using SWAT-CUP (SWAT Calibration and Uncertainty Analysis Program), with streamflow data from two hydrological stations within the basin serving as benchmark references. Model performance was quantitatively evaluated through three statistical metrics: the coefficient of determination (R²), Nash-Sutcliffe efficiency (NSE), and percent bias (PBIAS) to evaluate model simulation performance. Subsequently, the quantitative assessment of blue-green water resources was performed using SWAT-CUP simulated runoff data (monthly/annual scales) coupled with OUTPUT-derived hydrological components, including water yield, actual evapotranspiration, soil water content, and deep aquifer recharge, which collectively characterize the basin's integrated water partitioning dynamics. In SWAT model, the variations in hydrological processes are represented by Hydrological Response Units (HRUs) [18]. The blue-green water resource supply and demand assessment index system is built on this foundation, with a statistical analysis of the Taolai River Basin's average production, ecological, and living water need throughout time. Finally, based on this score, the best distribution of blue water resources for the region will be suggested.
2.2. Overview of the Study Area
The Taolai River, a primary tributary of the Heihe River system, drains a watershed extending from the Maying River (eastern boundary) to the Black Mountain of Jiayuguan City (western boundary), and from the Shule River Basin (southern margin) to the Horsehair Mountain of Jinta Basin (northern limit). The basin spans 97°22'-99°27' E and 38°24'-40°56' N, the overview of the study area is shown in Figure 2. The river basin is 27,000 km2 in size and 370 km long, encompassing three topographic regions ranging from the Qilian Mountains in the south to the Jiuquan Basin in the central corridor to the Jinta Basin in the north, with climates ranging from a typical alpine semi-arid climate to a continental temperate arid climate. The Taolai River Basin has an average annual discharge of 637 million m3, a total population of roughly 875,400 people, and a GDP of approximately 64.231 billion yuan.
The Jiayuguan Hydrological Station is located at the Taolai River Canal Head Water Diversion Hub Project Office. It serves as the control station at the Taolai River's exit from the mountain and is also a representative station of the Taolai River Basin. At the same time, it can be regarded as the entry station of Jiayuguan City.
Yuanyangchi (Dam) Station is located downstream of the basin, which serves as the catchment region for the Taolai River's main stream, and is responsible for the Yuanyang Irrigation District's water supply and flood management.
2.3. Data Sources
As shown in Table 1, the digital elevation data (DEM) was obtained from the geospatial data cloud with a resolution of 30 m; the land use data was obtained from the Resource Environment and Data Center of the Chinese Academy of Sciences (REDC), with two periods of data in 1980 and 2020; and the soil data was obtained from the Harmonized World Soil Database (HWSD), constructed by the Food and Agriculture Organization of the United Nations (FAO) and the International Institute HWSD); Meteorological data were taken from the daily meteorological data of the Taolai River Basin and its nearby meteorological stations from 1959 to 1980 and 2000 to 2021 from China Meteorological Data Network (CMDN); Hydrological statistics were compiled from month-by-month measured runoff data from Jiayuguan Station and Yuanyangchi Station (Dam) in the upper Taolai River Basin from 1959 to 2021, sourced from the Water Resources Bulletin. In addition, population density and water use information were included. The ArcGIS10.2 software was used to process the data, including cropping, projection coordinate transformation, and full classification. The raster data of the processed SWAT model, namely land use in 1980, land use in 2020, and soil types in 2020, are shown in Figure 3(a, b, c).
2.4. Trend Analysis and Mutability Tests
The time series trends and mutations of the annual average flow at Yuanyangchi Station from 1959 to 2021 were analyzed by using Matlab R2018a software and HDMS2016 software developed by Yusen Wang [19]. Fourteen approaches, including the linear trend method, Mann-Kendall (M-K) test [20], Pettitt test [21], sliding t-test [22], sliding F-test [23], and Mann-Whitney-Pitt method, were utilized to fully assess the time-series trends and detect mutation spots. Using the mutation point as the boundary, the flow time series was separated into stationary and mutation periods.
2.5. Interpolation Extension Reduction Calculation
The existing Jiayuguan Station serves as the Taolai River's control cross-section hydrological station. The original outflow Binggou Station was built in 1948 and remained operational until 2002, when it was decommissioned due to the construction of a power station, and the portion was relocated to the Jiayuguan Station location at 32 kilometers. The observed values at Jiayuguan Station after 2003 could not represent the Taolai River's runoff from the mountain because some of the water volume was lost through evaporation, converted to groundwater, or introduced into the Dacaotan Reservoir after the river exited the mountain. As a result, the observed values of Jiayuguan Station after 2003 were interpolated and extended to be reduced to the data of Binggou Station. The data of Jiayuguan Station used in this paper are the reduced data of Binggou Station, and the runoff reduction is calculated using the following formula as Eq. (1).
Where, is the measured runoff volume at Binggou Station; is the amount of precipitation in the river channel between the two stations; is the measured runoff volume at Jiayuguan Station; is the amount of water diverted from the Dacaotan Reservoir; is the amount of seepage in the river channel between the two stations; is the amount of water surface evaporation between the two stations.
2.6. SWAT Hydrologic Model
The SWAT (Soil and Water Assessment Tool) model, developed by the Agricultural Research Service of the United States Department of Agriculture, is a semi-fractional hydrologic model used to assess watersheds [24]. The model splits the hydrologic process into two phases, production and catchment, based on the water balance concept. Model simulation time scales include annual, monthly, and daily [25], with the monthly scale being employed for modeling and analysis in this study.
The Taolai River Basin was divided into 29 sub-basins and 182 hydrologic response units (HRUs) based on the DEM elevation map. Land use types were classified into 7 categories, soil types into 15 categories, slope classes were set into three levels (0°-20°, > 20°-40°, > 40°), and thresholds for basin land use, soil, and slope were 10%, 10%, and 10%, respectively. The SWAT-CUP program was used to grade and validate the SWAT model by selecting 28 runoff-related factors, with a total of 600 model runs. The parameters were more sensitive when the SUFI-2 algorithm had a higher t-value and a lower P-value. The results were validated using three indicators: coefficient of determination (R2), Nash efficiency coefficient (NSE), and percentage bias (PBIAS) [26], Table 2 shows the evaluation metrics formula and performance assessment levels.
2.7. Quantification and Evaluation of Blue-Green Water Resources
The SWAT model may be used to estimate the quantity of blue and green water resources [27]. The sum of water yield WYLD (mm) and recharge of deepwater content DA_RCHG (mm) in each sub-basin under the OUTPUT output file was used to represent the basin's blue water resources [28], while the sum of actual evapotranspiration ET (mm) and soil water content SW (mm) was used to represent the green water resources, which were calculated as shown in Eqs. (2) and (3). The multi-year average approach was used to determine the distribution of blue and green water resources in each sub-basin, and the area-weighted average method was used in each sub-basin to calculate the multi-year change in blue and green water resources in the basin, as stated in Eq. (4).
Where, is the blue water availability (mm), is the green water availability (mm), is the weighted average, is the area of the sub−basin, is the value of the sub−basin, and n is the number of samples.
2.8. Assessment of the Security of Supply and Demand for Blue and Green Water
The change in the blue water supply and demand assessment index over time can be calculated using the ratio of blue water demand to blue water resources, which is suitable for the planned deployment of blue water resources, the calculation formula is presented in Eq. (5). Blue water demand encompasses household, industrial, and agricultural water demands. In this work, we define annual blue water demand as the sum of the yearly average of total water consumption for agricultural irrigation, industry, and residential use in the water resources bulletin from 2002 to 2021. The available blue water resources are calculated by subtracting the flow required to maintain the ecological ecosystem.
Where, is the blue water demand, is the amount of available blue water resources, is the index of supply and demand of blue water resources in time period of t in region x. The smaller the index is, the better is the relationship between the supply and demand of blue water and the higher is the security.
The environmental flow, or the flow required to support the ecosystem, is computed using the approach described by Richter B [29] and others. The environmental flow accounts for 80% of total runoff, with the remaining 20% utilized to determine the quantity of blue water resources available for human use. Eqs. (6) and (7) indicate the relationship between environmental flow and accessible blue water supplies, Table 3 shows the supply and demand for blue and green water, as well as the risk of water consumption in the region.
Where, is the environmental flow at time t in area x, is the natural runoff.
The green water supply and demand assessment index can assess the extent to which available green water resources are occupied within a geographical area by comparing the consumption of green water (i.e., green water demand) to the supply of absolute green water (i.e., initial soil moisture) [30], with the calculation formula shown in Eq. (8). The sum of the initial soil water content of SW and the actual evapotranspiration ET, derived from SWAT simulation results, is the amount of green water resources; and the actual evapotranspiration ET, which is the amount of water stored in the soil, as outputted from HRU results, is the amount of water stored in soil roots and used by plants for evaporation and transpiration, which is the green water demand [31,32].
Where, is the index of supply and demand of green water resources in region x at time t, is the green water demand, is the amount of green water resources.
2.9. Inter-Regional Allocation of Blue Water Volumes
The mismatch between supply and demand for water resources within a basin can be alleviated by allocating water resources between basins. The particular quantity of water resources to be distributed may be computed using the blue water resources supply and demand security assessment index obtained from Eq. (5), as illustrated in Eq. (10).
Where, is the amount of water that sub-basin x transfers outward in time period t; denotes the stage of division of the blue water assessment index, 、、; is the amount of blue water resources that sub-basin x can utilize in time period t;and is the amount of blue water demand in sub-basin x in time period t. If , it is taken to be 0, indicating that no water is transferred out of the region.
3. Results and Analysis
3.1. Runoff Trends and Sudden Points of Change
Figure 4 shows the variation trend of runoff at Yuanyangchi Station in the Taolai River Basin obtained by the linear trend method and M-K trend test analysis. The slopes of the runoff time series from 1959-1983 and 1984-2021 were 0.039 and 0.211, respectively, indicating that runoff increased from 1959 to 2021. The M-K test (P < 0.05) showed a significant increase in runoff between 1984 and 2021.
The time series of 1959-2021 annual mean flow at Yuanyangchi Station in the Taolai River Basin was subjected to trend analysis and mutability testing at a significance threshold of P = 0.05, as shown in Table 4. The mutation points obtained by different mutation test methods differ, and the test results show that the earliest mutation began in 1983 and the latest in 2015, with the majority of the results concentrated in the period 2005-2010, indicating that climate change and human activities had less impact on the Taolai River Basin's runoff prior to 1983. The goal of this paper is to investigate the spatial and temporal distribution of blue and green water resources. Because the SWAT model is better suited for runoff time series that are close to the natural state or smooth, we use the Mann-Whitney-Pitt test results to determine the runoff mutation point of the Yuanyangchi Station as 1983, and divide the study period into two periods: smooth (1959-1982) and variant (1982-2021).
3.2. Rate Determination and Validation of the SWAT Model
Based on the results of the runoff variability test at Yuanyangchi Station in the previous section, the parameters of the hydrological model were determined by using the rate of the model before the point of mutation, and the measured meteorological data of the corresponding years of the Taolai River Basin were inputted into the SWAT model, which simulated the hydrological process of the years 2000-2021, which can be considered as an approximation of the natural flow process. In this research, hydrological models of the Taolai River Basin for 1959-1980 and 2000-2021 were developed utilizing land use data from 1980 and 2020, respectively.
The runoff data from Jiayuguan Station after interpolation extension reduction and the measured data from Yuanyangchi (Dam) Station during the steady period were used to rate and validate the model, and the SWAT model was set up for the warm-up period (1959-1960), rate period (1961-1975), and validation period (1976-1980). Parameters with P < 0.5 were identified as more sensitive and adjusted using the SUFI-2 algorithm to determine rate values (Table 5).
The SWAT hydrological model was built between 2000 and 2021, with a warm-up period (2000-2001), a rate-setting period (2002-2016), and a validation period (2017-2021). The rate-determined model parameters, 2020 land use data, and observed meteorological data of the watershed were entered into the SWAT model, and the natural runoff model of the Taolai River watershed was used to create the natural runoff data from 2002–2021. The runoff data from Jiayuguan Station after interpolation extension reduction, as well as the simulated approximate natural runoff data, were used to calculate R2, NSE, and PBIAS for the rate-setting and validation periods, respectively, to ensure that the parameters were correctly established and the SWAT model was applicable. The simulation findings in Figure 5 demonstrate that both R2 and NSE are > 0.7, indicating that the simulation results are satisfactory and may be utilized to examine the quantity of blue-green water resources in the basin.
3.3. Characterization of the Spatial and Temporal Distribution of Blue-Green Water Resources
3.3.1. Inter-Annual Variability
The SWAT model's simulation output was used to examine the Taolai River Basin's rainfall and blue and green water resources from 2002 to 2021, and the findings are given in Figure 6. The figure shows that the multi-year precipitation in the Taolai River Basin from 2002 to 2021 ranged from 146.3 to 233.1 mm, with a multi-year average precipitation of 176.8 mm, a multi-year average blue water of 45.3 to 84.6 mm, a multi-year average blue water of 64.4 mm, and an average annual green water amount of 121.6 mm in the range of 100.9-166.3 mm, indicating an increasing trend in both blue and green water amounts. The annual average blue water volume reaches its peak of 84.6 mm in 2017 and falls to a low of 45.3 mm in 2021; the annual average green water volume reaches its peak of 166.3 mm in 2019 and a low of 100.9 mm in 2014.
The annual average value of blue and green water resources in the Taolai River Basin is 184 mm, with green water resources accounting for 66.10 %, much more than blue water resources (33.90 %). In terms of resource ratio, the green water resource is approximately 1.95 times larger than the blue water resource, indicating that the green water resource dominates the basin's water resource system. Therefore, including green water resources into river basins' comprehensive management systems can efficiently maximize water resource allocation efficiency, providing novel solutions for the sustainable development and usage of water resources in arid regions.
3.3.2. Spatial Distribution
Based on the SWAT model's hydrologic response unit division results, the Taolai River Basin was divided into 29 sub-basins (Figure 7). Simulating and evaluating hydrological aspects from 2002 to 2021 yielded spatial and temporal distribution characteristics of multi-year average precipitation and blue-green water resources in each subbasin. In terms of precipitation pattern (Figure 7a), the basin precipitation exhibits significant geographical variation due to continental climate and topographic uplift effects. High-value areas are primarily distributed in the northern foothills of the Qilian Mountains in the south (sub-basins 23-27 and 29), with annual precipitation exceeding 300 mm, with a maximum of 343 mm; second-high-value areas include the middle reaches of the main streams of the Taolai River (sub-basins 20 and 22), the Wenshusha River Basin (sub-basin 21), and the Hongshui River Basin (sub-basin 28), with annual precipitation ranging from 110 to 300 mm. This precipitation distribution pattern clearly depicts topography's redistributive effect on water vapor movement, resulting in a typical precipitation gradient zone between mountains, oasis, and desert.
As shown in Figure 7(b), the average annual blue water resources in the Taolai River Basin from 2002 to 2021 exhibit significant spatial differentiation, ranging from 0 to 200 mm. The high-value zones are mostly located along both sides of the Taolai River's main stream and in the southern Qilian Mountains (sub-basins 23-29). Affected by the effect of topographic uplift, the region has abundant precipitation, coupled with the topographic features of high mountains and deep valleys, the conditions of flow production are superior, forming the main blue water enrichment zone of the basin; in the central Jiuquan oasis area (sub-basin No. 18-22), the population is concentrated, industry and agriculture are developed, and the exploitation of upstream water and the central groundwater make it. In contrast, the northern Jinta basin area has a continental temperate desert climate, with low annual precipitation and high potential evaporation. Strong evaporation and concentration result in a severe dearth of blue water resources in the region. Only the irrigated area around Jinta County has a limited supply of blue water due to artificial water extraction, whereas the vast surrounding area is desertified.
Figure 7(c) depicts the spatial distribution pattern of green water resources in the Taolai River Basin, which ranges from 70 to 400 mm. The research demonstrates that the regional distribution trend of green water and blue water is essentially the same, and that green water and blue water resources have comparable spatial differentiation features, both of which follow the gradient distribution law of decreasing from south to north. The southern Qilian Mountains are characterized by forest and grassland ecosystems, with substantial green water resources. Irrigated agriculture has a significant impact on the central agricultural oasis area, and crop evapotranspiration is critical in regulating green water resources. The SWAT model's water balance theory states that total precipitation in the basin is roughly equal to the sum of blue water, green water, and hydrological dissipation. The distribution law for the difference between precipitation and blue water volume within the basin is nearly identical to that of green water volume.
3.4. Assessment of the Balance Between Supply and Demand of Blue and Green Water Resources
3.4.1. Statistical Analysis of the Balance of Supply and Demand for Blue-Green Water Resources
The assessment of the balance between supply and demand for water resources can reflect the relationship between supply and demand, assisting in the effective allocation and efficient use of water resources. Figure 7 depicts the findings of an assessment of the supply and demand for blue and green water in the Churai River Basin for 2020-2021.
As illustrated in Figure 8(a), the supply and demand for blue water were in constant deficit throughout the research period, with water demand constantly surpassing available resources. The dynamics of total water demand in the basin displayed apparent stage characteristics: a fluctuating and consistent trend of growing and then dropping between 2003 and 2014, and a tiny oscillation pattern from 2014 to 2021. In 2002, water consumption reached 1363.3 × 10⁶ m³, whereas in 2003, it fell to 843.3 × 10⁶ m³. In terms of water use structure, agricultural water use takes the lead, accounting for 85 % of total water use; the fraction of water used for human activities remains relatively consistent, at around 3.5 %. The availability of blue water varied significantly from year to year, and its trend was closely related to precipitation. In 2003, the driest year in the study period (with the lowest precipitation per unit area), the volume of blue water available plummeted to its lowest level of 266.0 × 10⁶ m³, confirming the decisive influence of precipitation recharge on water resources in the basin.
As demonstrated in Figure 8(b), the interannual variation of green water resources in the Taolai River Basin is substantially lower than that of blue water resources, and the overall change is very stable. Small changes occurred between 2007, 2009-2011, and 2016-2021, with a peak value of 2723.0 × 10⁶ m³ in 2019 and a trough value of 1657.1 × 10⁶ m³ in 2014. The research location, which is a typical desert zone in the Hexi Corridor, has a strong continental climate with high temperatures, significant evapotranspiration, and a severe soil moisture deficit. This unique climate-soil condition brings the basin's green water demand closer to its available supply.
3.4.2. Spatial and Temporal Distribution of Blue-Green Water Supply and Demand Security
Figure 9 depicts the temporal and geographical properties of the blue and green water supply and demand security assessment indexes in the Taolai River Basin. In terms of time, as shown in Figure 9(a), the average value of the blue water security assessment index in the basin was 2.85 from 2002 to 2021, with a fluctuation range of 2.40-3.66, and the overall pattern of change was dropping, then increasing, then declining. The trend line demonstrates that the index has a substantial lowering trend, showing that the basin's scarcity of blue water resources has been relieved during the last two decades. As shown in Figure 9(b), the high-safety zones with an index <1 are primarily located in the basin's outlet area, near Yuanyangchi Reservoir, and the foothills in the southern part of the upper reaches. These areas are relatively rich in blue water resources due to better hydrothermal conditions, high vegetation cover, and sufficient precipitation recharge. The low-safety zones are primarily found in urban agglomeration zones in the middle and lower reaches (Jiayuguan City, Jiuquan Suzhou District, and Jinta County), where the high demand for irrigated agriculture and urban water use, combined with the predominance of arable land and deserts as ground cover, and the high consumption of blue water resources, result in a significant reduction in their safety.
Figure 9(c) shows that the assessment index of green water supply and demand security in the Taolai River Basin fluctuated between 0.89 and 0.97 from 2002 to 2021, with a gentle inter-annual trend consistent with the basin's relatively stable vegetation cover status. The spatial distribution pattern is shown in Figure 9(d); each sub-basin's assessment index is less than one, the spatial variability is significantly lower than that of the blue water safety index, and the overall distribution is gradient, with high in the north and low in the south. The forest-grassland coverage area in the south (sub-basins 23-29), the cultivated land concentration area in the center (sub-basins 19-22 in Jiayuguan-Suzhou district), and the Jinta Basin in the north (sub-basins 6-7,9-14) form a relatively rich reserve of usable green water resources due to the strong water-source containment capacity and precipitation retention effect.
3.5. Quantity of Water Resources Available for Interregional Allocation
The distribution of transportable water in the research area for various values of s is estimated using Eq. (10), and the results are presented in Figure 10. It is clear that the distribution of blue water supply and demand in the northern part of the Taolai River Basin is tense, whereas the distribution of abundance in the southern part of the basin determines the distribution of deliverable water, which follows the same pattern.
According to Figure 10(a), most sub-basins in the northern part of the basin do not have the capacity to deliver water outward when s = 0.5, and five sub-basins (7, 8, 23, 25, and 27) can only export a limited amount of water, while some sub-basins (22, 24, 26, and 29) can redistribute water within the basin. Figure 10(b) depicts the more ideal s = 1 scenario, in which the sub-basins deliver water out of the basin while maintaining the local blue water supply and demand balance. Compared to the s = 0.5 scenario, the overall water delivery of the basin is greatly improved, the red region is significantly decreased, and each sub-basin scattered along the main stream of the Taolai River has varying degrees of outward water delivery capability. When s = 1.5, as shown in Figure 10(c), the basin's blue water system is in the critical water delivery state under the high safety condition. At this point, the basin can provide blue water up to a maximum of 4.06 × 10⁸ m³ per year on average. The upstream area (subbasins 22, 24, and 26) has a huge quantity of blue water delivery to the outside. Subbasin 22 has an annual average deliverable of up to 7.89 × 10⁸ m³, which is the largest amount of blue water that may be provided by a single subbasin in the basin.
The findings of the comprehensive study show that blue water resources that can be transported in the Taolai River Basin are relatively abundant, but the spatial distribution is highly heterogeneous, particularly in the downstream area where the contradiction between supply and demand is most evident. As a result, it is critical to construct a scientific water resource management system that balances the supply and demand for blue water resources in the basin using an optimal allocation mechanism, in order to effectively relieve the problem of water scarcity in downstream areas.
4. Deliberation
4.1. The Contradiction Between the Supply and Demand of Blue and Green Water Resources in the Basin and Its Regulation
This study uses the SWAT model to systematically analyze the spatial and temporal dynamic characteristics of the blue-green water resources supply-demand balance and security in the Taolai River Basin, with the sub-basin serving as the spatial unit. On the temporal scale, the inter-annual distribution of blue-green water resources is disclosed; on the geographical scale, the regional differentiation of water resources is highlighted. The study's findings demonstrate that: (1) the basin's total water resources have a substantial positive connection with precipitation, with blue water resources being especially susceptible to precipitation fluctuations. In years with low precipitation (e.g., 2003, 2004, and 2014), the amount of blue water resources decreased significantly (Figure 8a), whereas green water resources fluctuated relatively gently from year to year, owing primarily to the water-holding function of the watershed's forested vegetation (which accounted for 41.8 % of the total area). (2) The spatial distribution shows obvious vertical zonal differences: as an important water conservation area, the southern mountainous region, with its abundant precipitation and high vegetation coverage, has effectively achieved the functions of runoff regulation and soil and water conservation through the interception of the canopy and the regulation and storage of soil moisture, and the blue and green water resources are the most abundant; the central oasis agricultural area has formed a man-made-natural composite water cycle system through the irrigation system, which maintains a relatively stable green water resources reserve; the northern desert area is most deprived of blue and green water resources due to the double effects of scarce precipitation and surface desertification.
The security evaluation of blue water supply and demand in the Churai River Basin for the period 2002-2021 revealed (Figure 9a) a considerable rising trend in the basin's average security index, but with significant regional variation (Figure 9b). According to the research, the basin has 18 sub-basins with supply-demand imbalances, accounting for 50.4 % of the total area. Insecurity zones are mostly located in the middle and lower oasis agricultural zones. The land use/cover changes caused by human activities led by population expansion, as well as the dynamic transformation mechanism of blue and green water resources, have a substantial influence on the basin's blue water resource availability and water use security. However, the frequency of extreme drought events in the context of global warming may exacerbate the risk of a supply-demand imbalance for blue and green water resources. As a result, the following adaptive management measures are recommended: (1) implementing water conservation projects such as terrace construction and reservoir dams to increase water retention capacity; (2) optimizing water resource management to reduce ineffective evaporation losses; (3) establishing a scientifically based water conservation system; and (4) developing an optimal water resource allocation system. These actions are critical to ensuring regional water security.
4.2. SWAT Model Uncertainty
All existing hydrological models have difficulty accurately reproducing the real hydrological system. The SWAT model, being a distributed hydrological model based on physical mechanisms, can better represent the hydrological cycle process on a macro scale, although it still has high simulation uncertainty. Human activities are one of the most important variables contributing to model uncertainty. To lessen the impact of human actions on model accuracy, this study uses the following methods: (1) Runoff data from Jiayuguan Station is interpolated to the old ice gully site at the outflow pass; (2) Data from the Yuanyangchi site's pre-mutability plateau are chosen for parameter rate setting based on the findings of the mutability test. In terms of SWAT model uncertainty optimization, several methods have been proposed: Schuol et al. [33] improved model accuracy by integrating large reservoirs and wetland modules when assessing the availability of freshwater resources in West Africa; and Faramarzi et al. [34] calibrated the model with actual crop yield data when studying blue-green water resources in Iran. Future study should focus on optimizing parameters to correct the SWAT model and produce more accurate simulation results.
5. Conclusion
In this study, the hydrological processes of the Taolai River Basin in the Northwest Arid Zone are simulated using the distributed hydrological model SWAT during the baseline era (1961-1980) and the status quo period (2002-2021). Using the sub-basin as a scale, the spatial and temporal distribution characteristics of blue and green water resources, as well as the dynamic changes in availability and water demand from 2002 to 2021, are quantified, and an indicator system for assessing the balance between supply and demand of blue and green water in the basin is constructed. The response relationship between water security and resource endowment is established. On this premise, a technique for calculating the availability of water resources across regions is provided. The primary research conclusions are as follows:
- (1)
- The R2 and NSE of the model rate period and the verification period are both ≥ 0.7. The results show that the simulated flow values have a good consistency with the measured values, verifying the applicability of the SWAT model in the study of blue and green water resources in this basin.
- (2)
- Analyzing the time scale of the entire basin, the amount of green water resources is approximately 1.95 times that of blue water resources, which dominate the basin's water cycle. During the period from 2002 to 2021, the demand of the blue water system was greater than the available amount, showing a continuous deficit state, while the demand of the green water system was approximately equal to the available amount, maintaining a basic balance between supply and demand.
- (3)
- From the perspective of the spatial pattern of each sub-basin, blue water resources showed significant spatial heterogeneity from 2002 to 2021. Approximately 50% of the sub-basins, mainly distributed in the upper and middle reaches irrigation areas and desert zones, were in a state of supply and demand imbalance. In contrast, the Green Water assessment index is all < 1, demonstrating good spatial balance, high resource security and strong stability.
- (4)
- The analysis of cross-regional allocation potential shows that the average annual theoretical blue water resources that can be allocated during the study period amounted to 4.06 × 10⁸ m³, showing a strong potential for optimal allocation of regional water resources.
This study analyzes the water cycle process in the Taolai River Basin from a spatio-temporal scale, constructs a blue-green water safety assessment system based on supply and demand balance, and deeply understands the eco-hydrological process, providing a scientific basis for the optimal allocation and sustainable management of water resources in inland river basins in the arid northwest region.
Funding
This project was supported by the National Natural Science Foundation of China (13798128); The Major Science and Technology Project of Gansu Province (22ZD6WA043); Project of Gansu Province Water Conservancy Science Experiment Research and Technology Promotion Program (5GSLK053, 5GSLK059); Lanzhou Science and Technology Plan Project (Science and Technology Support Special Project, No.2024-3-84).
References
- Qiting Zuo, Desheng Hu, Ming Dou, et al. Research framework and core system of the strictest water resources management system based on the concept of human-water harmony [J]. Resource Science 2014, 36, 906912.
- Jun Xia, Jinliang Zhai, Chesheng Zhan. Some thoughts on the research and development of water resources in China. Progress in Earth Science 2011, 26, 905–915.
- Jing Tian, Shenglian Guo, Dedi Liu, Qihui Chen, Qiang Wang, Jiabo Yin, Xushu Wu, Shaokun He. Impacts of climate and land use change on runoff in the Han River Basin. Journal of Geography 2020, 75, 2307–2318.
- Lu Hao, Ge Sun. A review of studies on the impact of urbanization on ecohydrological processes in watersheds. Journal of Ecology 2021, 41, 13–26.
- Falkenmark, M.; Rockström, J. Building Water Resilience in the Face of Global Change: From a Blue-Only to a Green-Blue Water Approach to Land-Water Management. J. Water Resour. Plan. Manag. 2010, 136, 606–610. [Google Scholar] [CrossRef]
- Veettil, A.V.; Mishra, A.K. Potential influence of climate and anthropogenic variables on water security using blue and green water scarcity, Falkenmark index, and freshwater provision indicator. J. Environ. Manag. 2018, 228, 346–362. [Google Scholar] [CrossRef] [PubMed]
- Falkenmark, M.; Rockström, J. The New Blue and Green Water Paradigm: Breaking New Ground for Water Resources Planning and Management. J. Water Resour. Plan. Manag. 2006, 132, 129–132. [Google Scholar] [CrossRef]
- Yen, H.; Park, S.; Arnold, J.G.; Srinivasan, R.; Chawanda, C.J.; Wang, R.; Feng, Q.; Wu, J.; Miao, C.; Bieger, K.; et al. IPEAT+: A Built-In Optimization and Automatic Calibration Tool of SWAT+. Water 2019, 11, 1681. [Google Scholar] [CrossRef]
- Meng, C.; Zhou, J.; Tayyab, M.; Zhu, S.; Zhang, H. Integrating Artificial Neural Networks into the VIC Model for Rainfall-Runoff Modeling. Water 2016, 8, 407. [Google Scholar] [CrossRef]
- Peng, D.; Chen, J.; Fang, J. Simulation of Summer Hourly Stream Flow by Applying TOPMODEL and Two Routing Algorithms to the Sparsely Gauged Lhasa River Basin in China. Water 2015, 7, 4041–4053. [Google Scholar] [CrossRef]
- Wenhua Qi, Yehua Jin, Zhenhao Yin, et al. Analysis of blue-green water supply and demand balance in the Tumen River Basin based on SWAT model [J]. Journal of Ecology, 2023, 43(08): 3116-3127. Journal of Ecology 2023, 43, 3116–3127.
- Hao Yang, Fuquan Ni, Yu Deng, et al. Characteristics of spatial and temporal changes of blue and green water resources in Jialing River Basin based on SWAT model [J]. Journal of Water Resources and Water Engineering 2022, 33, 18–26.
- Yikang Gao, Yueying Zhou, Zufa Liu, et al. SWAT-based assessment of blue-green water and its drought response in the Beijiang River Basin [J]. Journal of Changjiang Academy of Sciences 2021, 38, 18–26.
- Abate, B.Z.; Alaminie, A.A.; Assefa, T.T.; Tigabu, T.B.; He, L. Modeling climate change impacts on blue and green water of the Kobo-Golina River in data-scarce upper Danakil basin, Ethiopia. J. Hydrol. Reg. Stud. 2024, 53. [Google Scholar] [CrossRef]
- Woldesenbet, T.A. Impact of land use and land cover dynamics on ecologically-relevant flows and blue-green water resources. Ecohydrol. Hydrobiol. 2022, 22, 420–434. [Google Scholar] [CrossRef]
- Koycegiz, C.; Buyukyildiz, M. Calibration of SWAT and Two Data-Driven Models for a Data-Scarce Mountainous Headwater in Semi-Arid Konya Closed Basin. Water 2019, 11, 147. [Google Scholar] [CrossRef]
- Nkwasa, A.; Chawanda, C.J.; Msigwa, A.; Komakech, H.C.; Verbeiren, B.; van Griensven, A. How Can We Represent Seasonal Land Use Dynamics in SWAT and SWAT+ Models for African Cultivated Catchments? Water 2020, 12, 1541. [Google Scholar] [CrossRef]
- Yusen Wang. Development and application of hydrological time series trend and mutation analysis system [J]. Gansu Science and Technology, 2016, 32(9): 36-37.
- Shan, C.; Zhao, F.; Wang, Y.; Yang, C.; Wei, F.; Zhou, X. Study on the Evolvement Trend Process of Hydrological Elements in Luanhe River Basin, China. Water 2024, 16, 1169. [Google Scholar] [CrossRef]
- Ishak, E.; Rahman, A. Examination of Changes in Flood Data in Australia. Water 2019, 11, 1734. [Google Scholar] [CrossRef]
- Wang, H.; Xiao, W.; Wang, J.; Wang, Y.; Huang, Y.; Hou, B.; Lu, C. The Impact of Climate Change on the Duration and Division of Flood Season in the Fenhe River Basin, China. Water 2016, 8, 105. [Google Scholar] [CrossRef]
- LIU X, ZHANG W, JIA D, et al. Research of Abrupt Changes of Sandstorm Frequency in Hexi Corridor in Recent 50 Years[J]. , 2011, 31(6): 1579-1584. Journal of Desert Research 2011, 31, 1579–1584.
- Neitsch S, Armold J, Kiniry J, Williams J R. Soil and water assessment tool theoretical documentation version 2009. Texas Water Resources Institute, 2011.
- Wenting Li, Shaoli Yang, Liliang Ren, et al. Characterization of spatial and temporal distribution of blue/green water resources in the Yellow River source area based on SWAT model [J]. China Rural Water Conservancy and Hydropower, 2021(8): 59-66.
- Moriasi, D.N.; Arnold, J.G.; van Liew, M.W.; Bingner, R.L.; Harmel, R.D.; Veith, T.L. Model evaluation guidelines for systematic quantification of accuracy in watershed simulations. Trans. ASABE 2007, 50, 885–900. [Google Scholar] [CrossRef]
- Jiang, J.; Lyu, L.; Han, Y.; Sun, C. Effect of Climate Variability on Green and Blue Water Resources in a Temperate Monsoon Watershed, Northeastern China. Sustainability 2021, 13, 2193. [Google Scholar] [CrossRef]
- Leiting Lv, Xiaorui Wang, Yuan Jiang, Caizhi Sun. Characterization of spatial and temporal distribution of blue and green water in the Dongjiang River Basin based on SWAT model. Water Resources Conservation 2017, 33, 53–60.
- Richter B D, Davis M M, Ape C, Konradl C. A presumptive stranded for environmental flow protection. River Research and Applications 2012, 28, 1312–1321. [CrossRef]
- Xie P X, Zhuo L., Yang X, Huang H R, Gao X R, Wu P T. Spatial-temporal variations in blue and green water resources, water footprints and water scarcities in a large river basin; a case for the Yellow River Basin. Journal of Hydrology 2020, 500, 125222.
- Rodrigues D B B, Gupta H V, Merdiondo E M. A Blue/Green Water-based Accounting Framework for Assessment of Water Security. Water Resources Research 2014, 50, 7187–7205. [CrossRef]
- Ablaspour к C, Rouholahnejad E., Vaghef S, Srinivasan R, Yang H, Klove B. A continental-scale hydrology and water quality model for Europe: Calibration and uncertainty of a high-resolution large-scale SWAT model. Journal of Hydrology 2015, 524, 733–752. [CrossRef]
- Schuol, J.; Abbaspour, K.C.; Srinivasan, R.; Yang, H. Estimation of freshwater availability in the West African sub-continent using the SWAT hydrologic model. J. Hydrol. 2008, 352, 30–49. [Google Scholar] [CrossRef]
- Faramarzi, M.; Abbaspour, K.C.; Schulin, R.; Yang, H. Modelling blue and green water resources availability in Iran. Hydrol. Process. Int. J. 2009, 23, 486–501. [Google Scholar] [CrossRef]
Figure 1.
Research thought map.
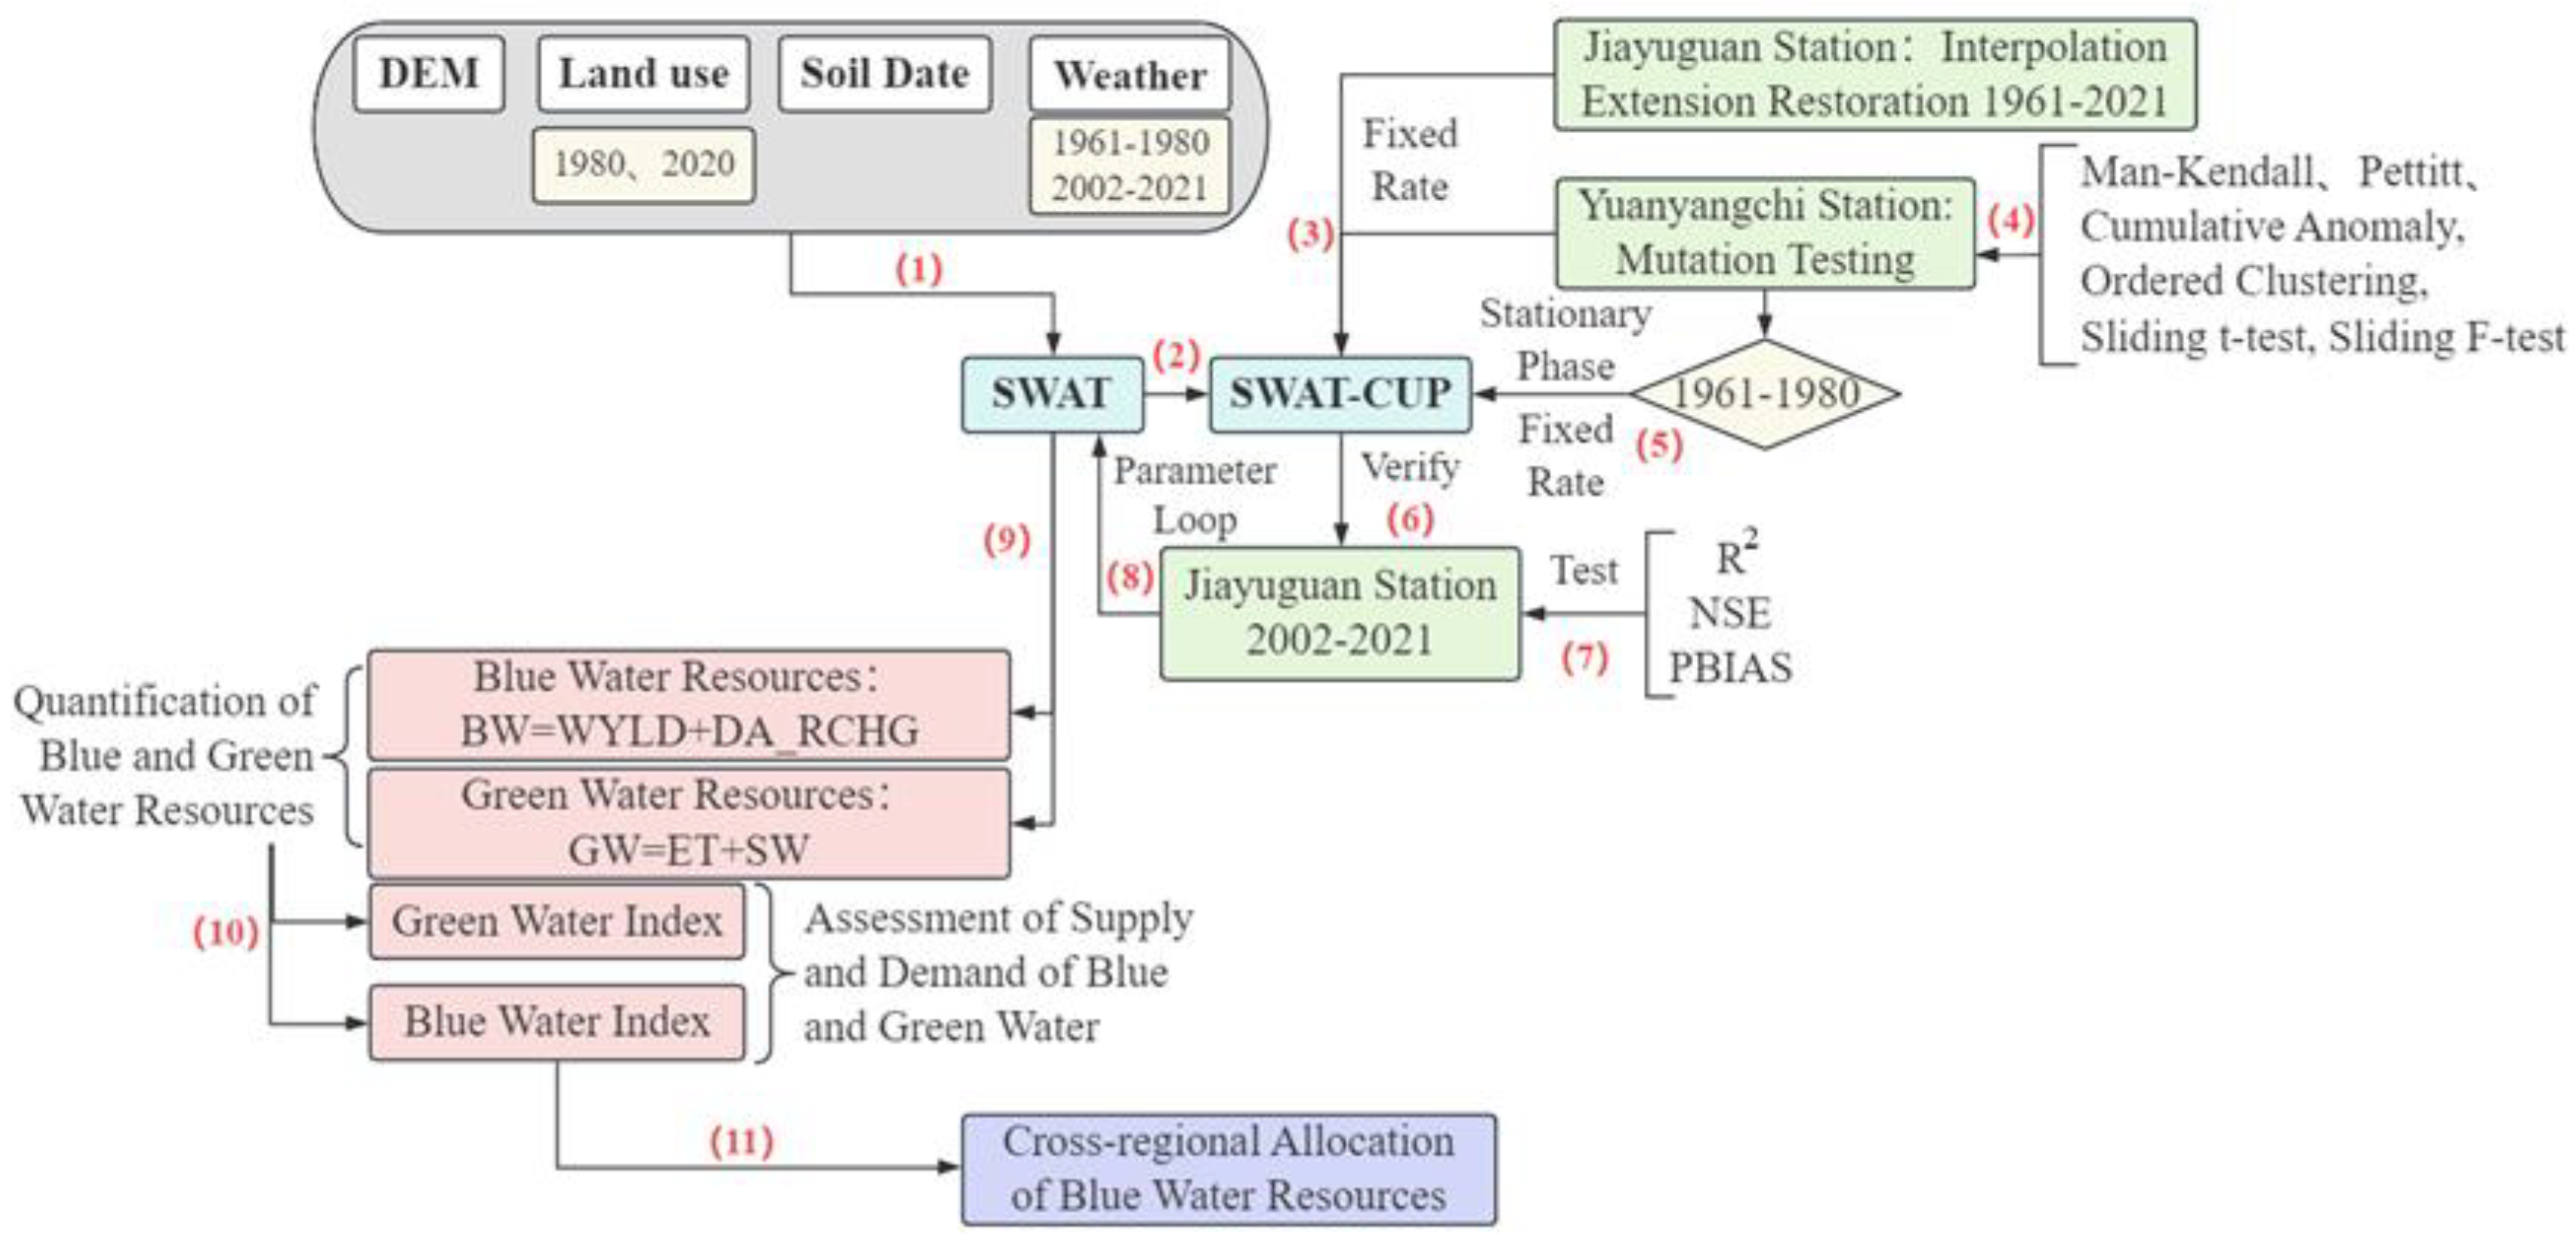
Figure 2.
Overview of Study Area.
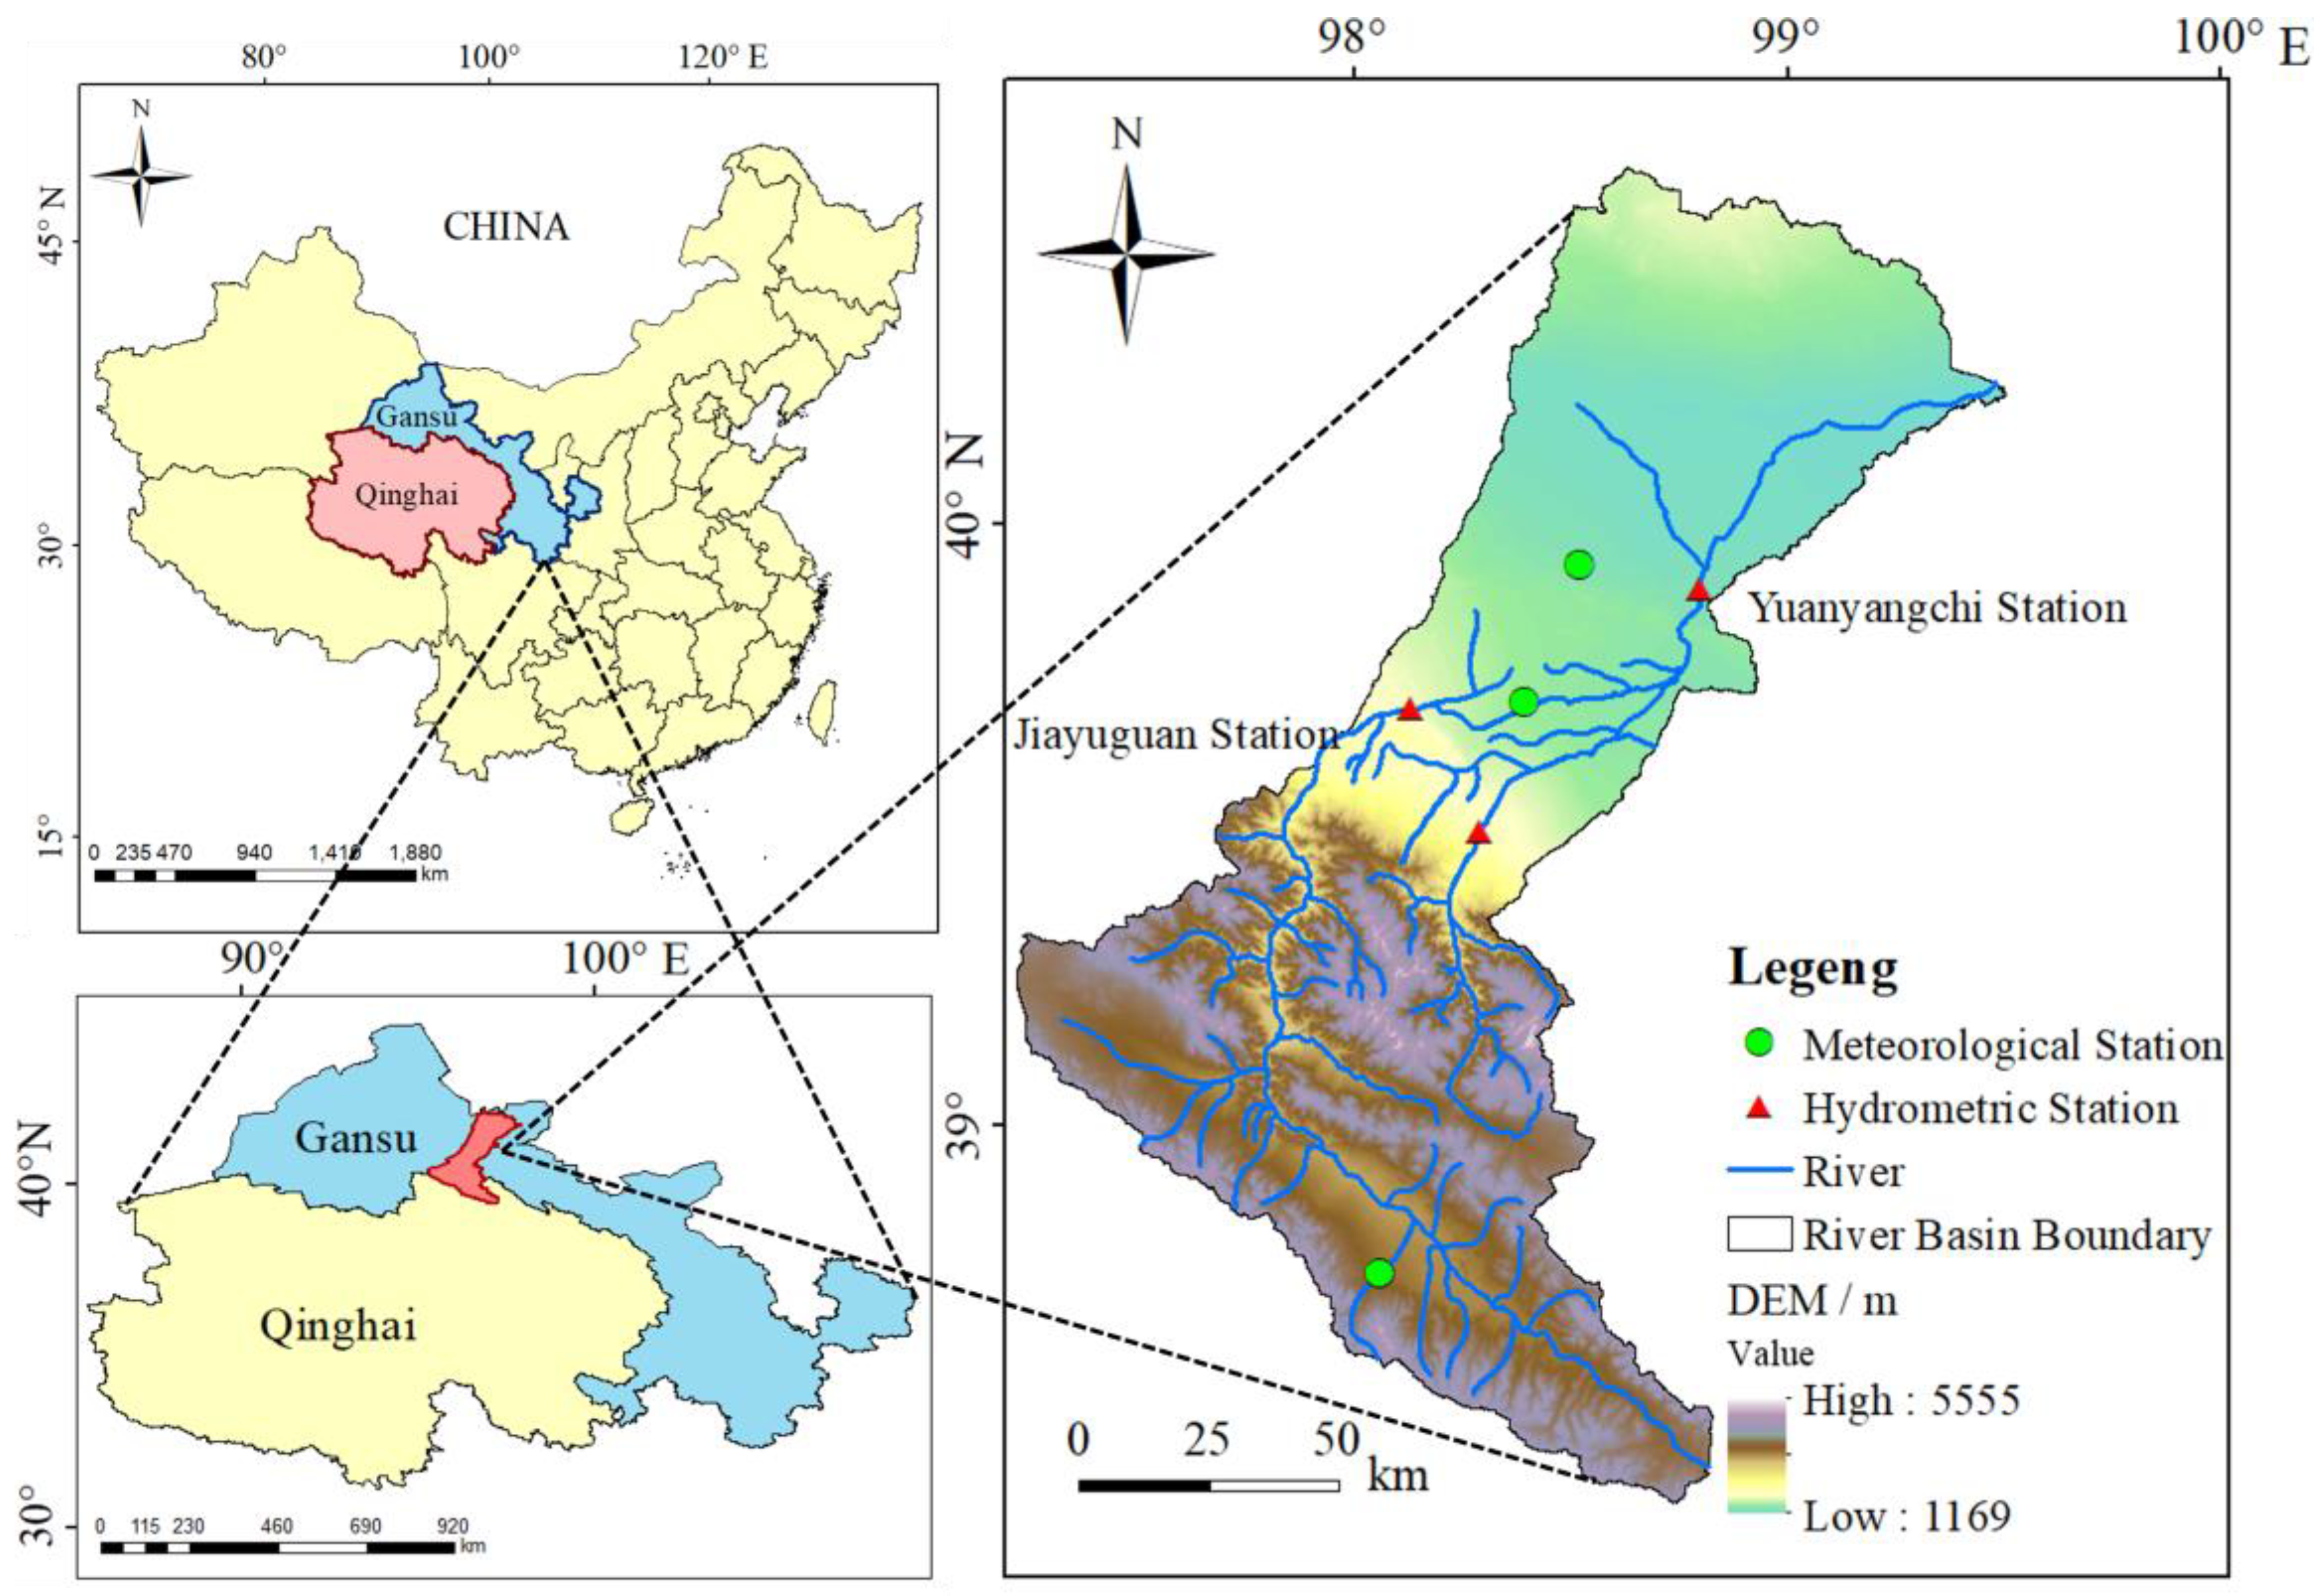
Figure 3.
Raster of SWAT Model (a) Land Use Type in 1980 (b) Land Use Type in 2020 (c) Soil Type.
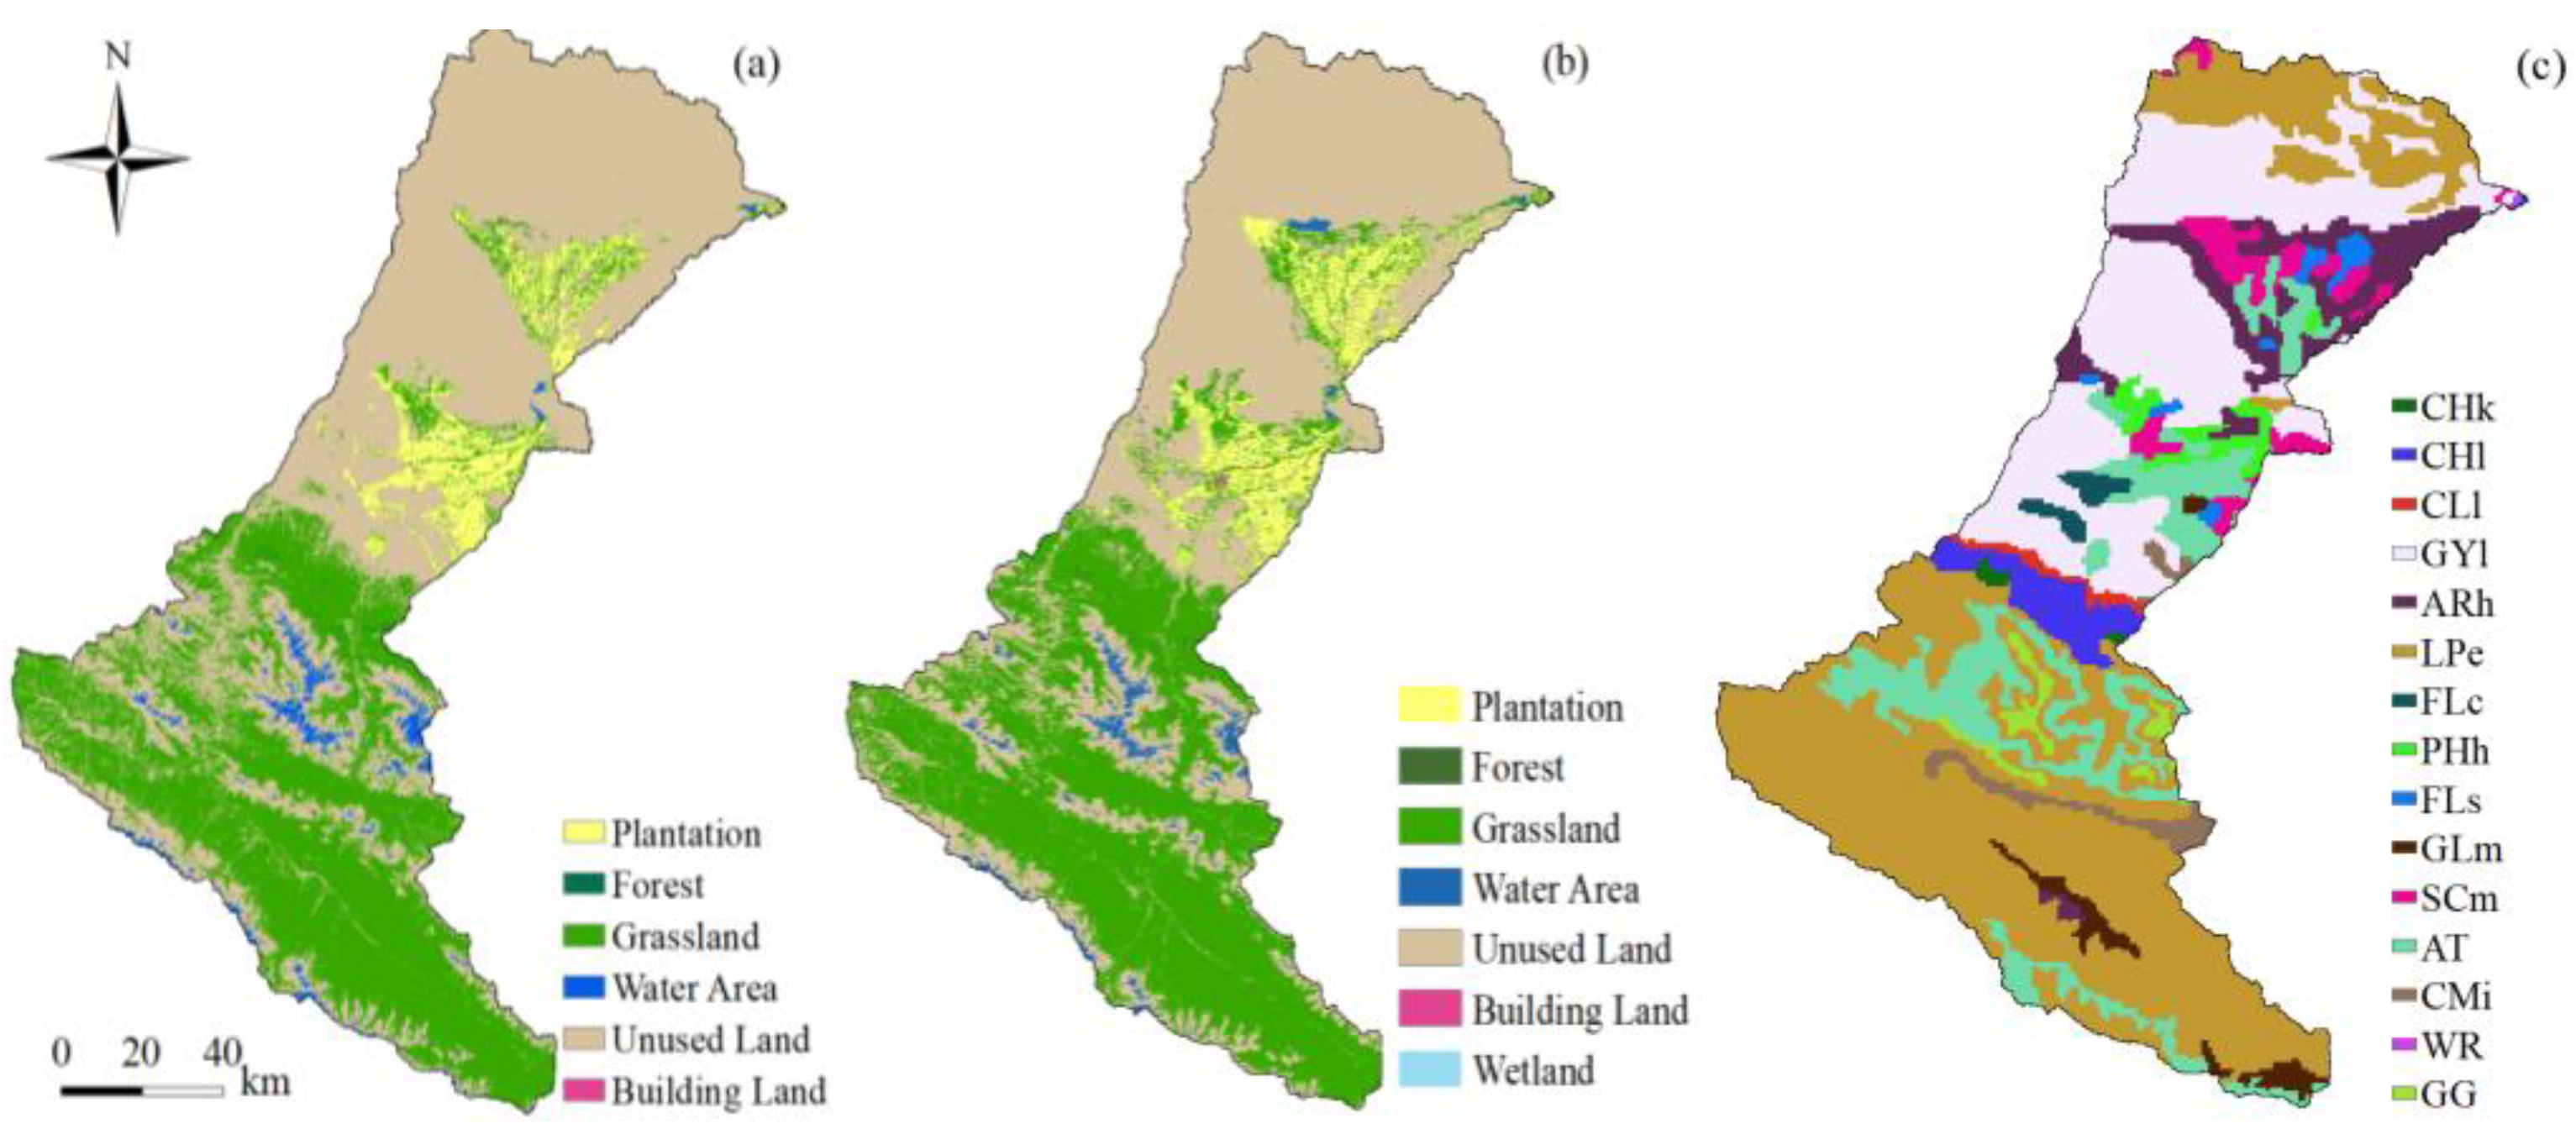
Figure 4.
Runoff Trend at Yuanyangchi Station on the Taolai River.
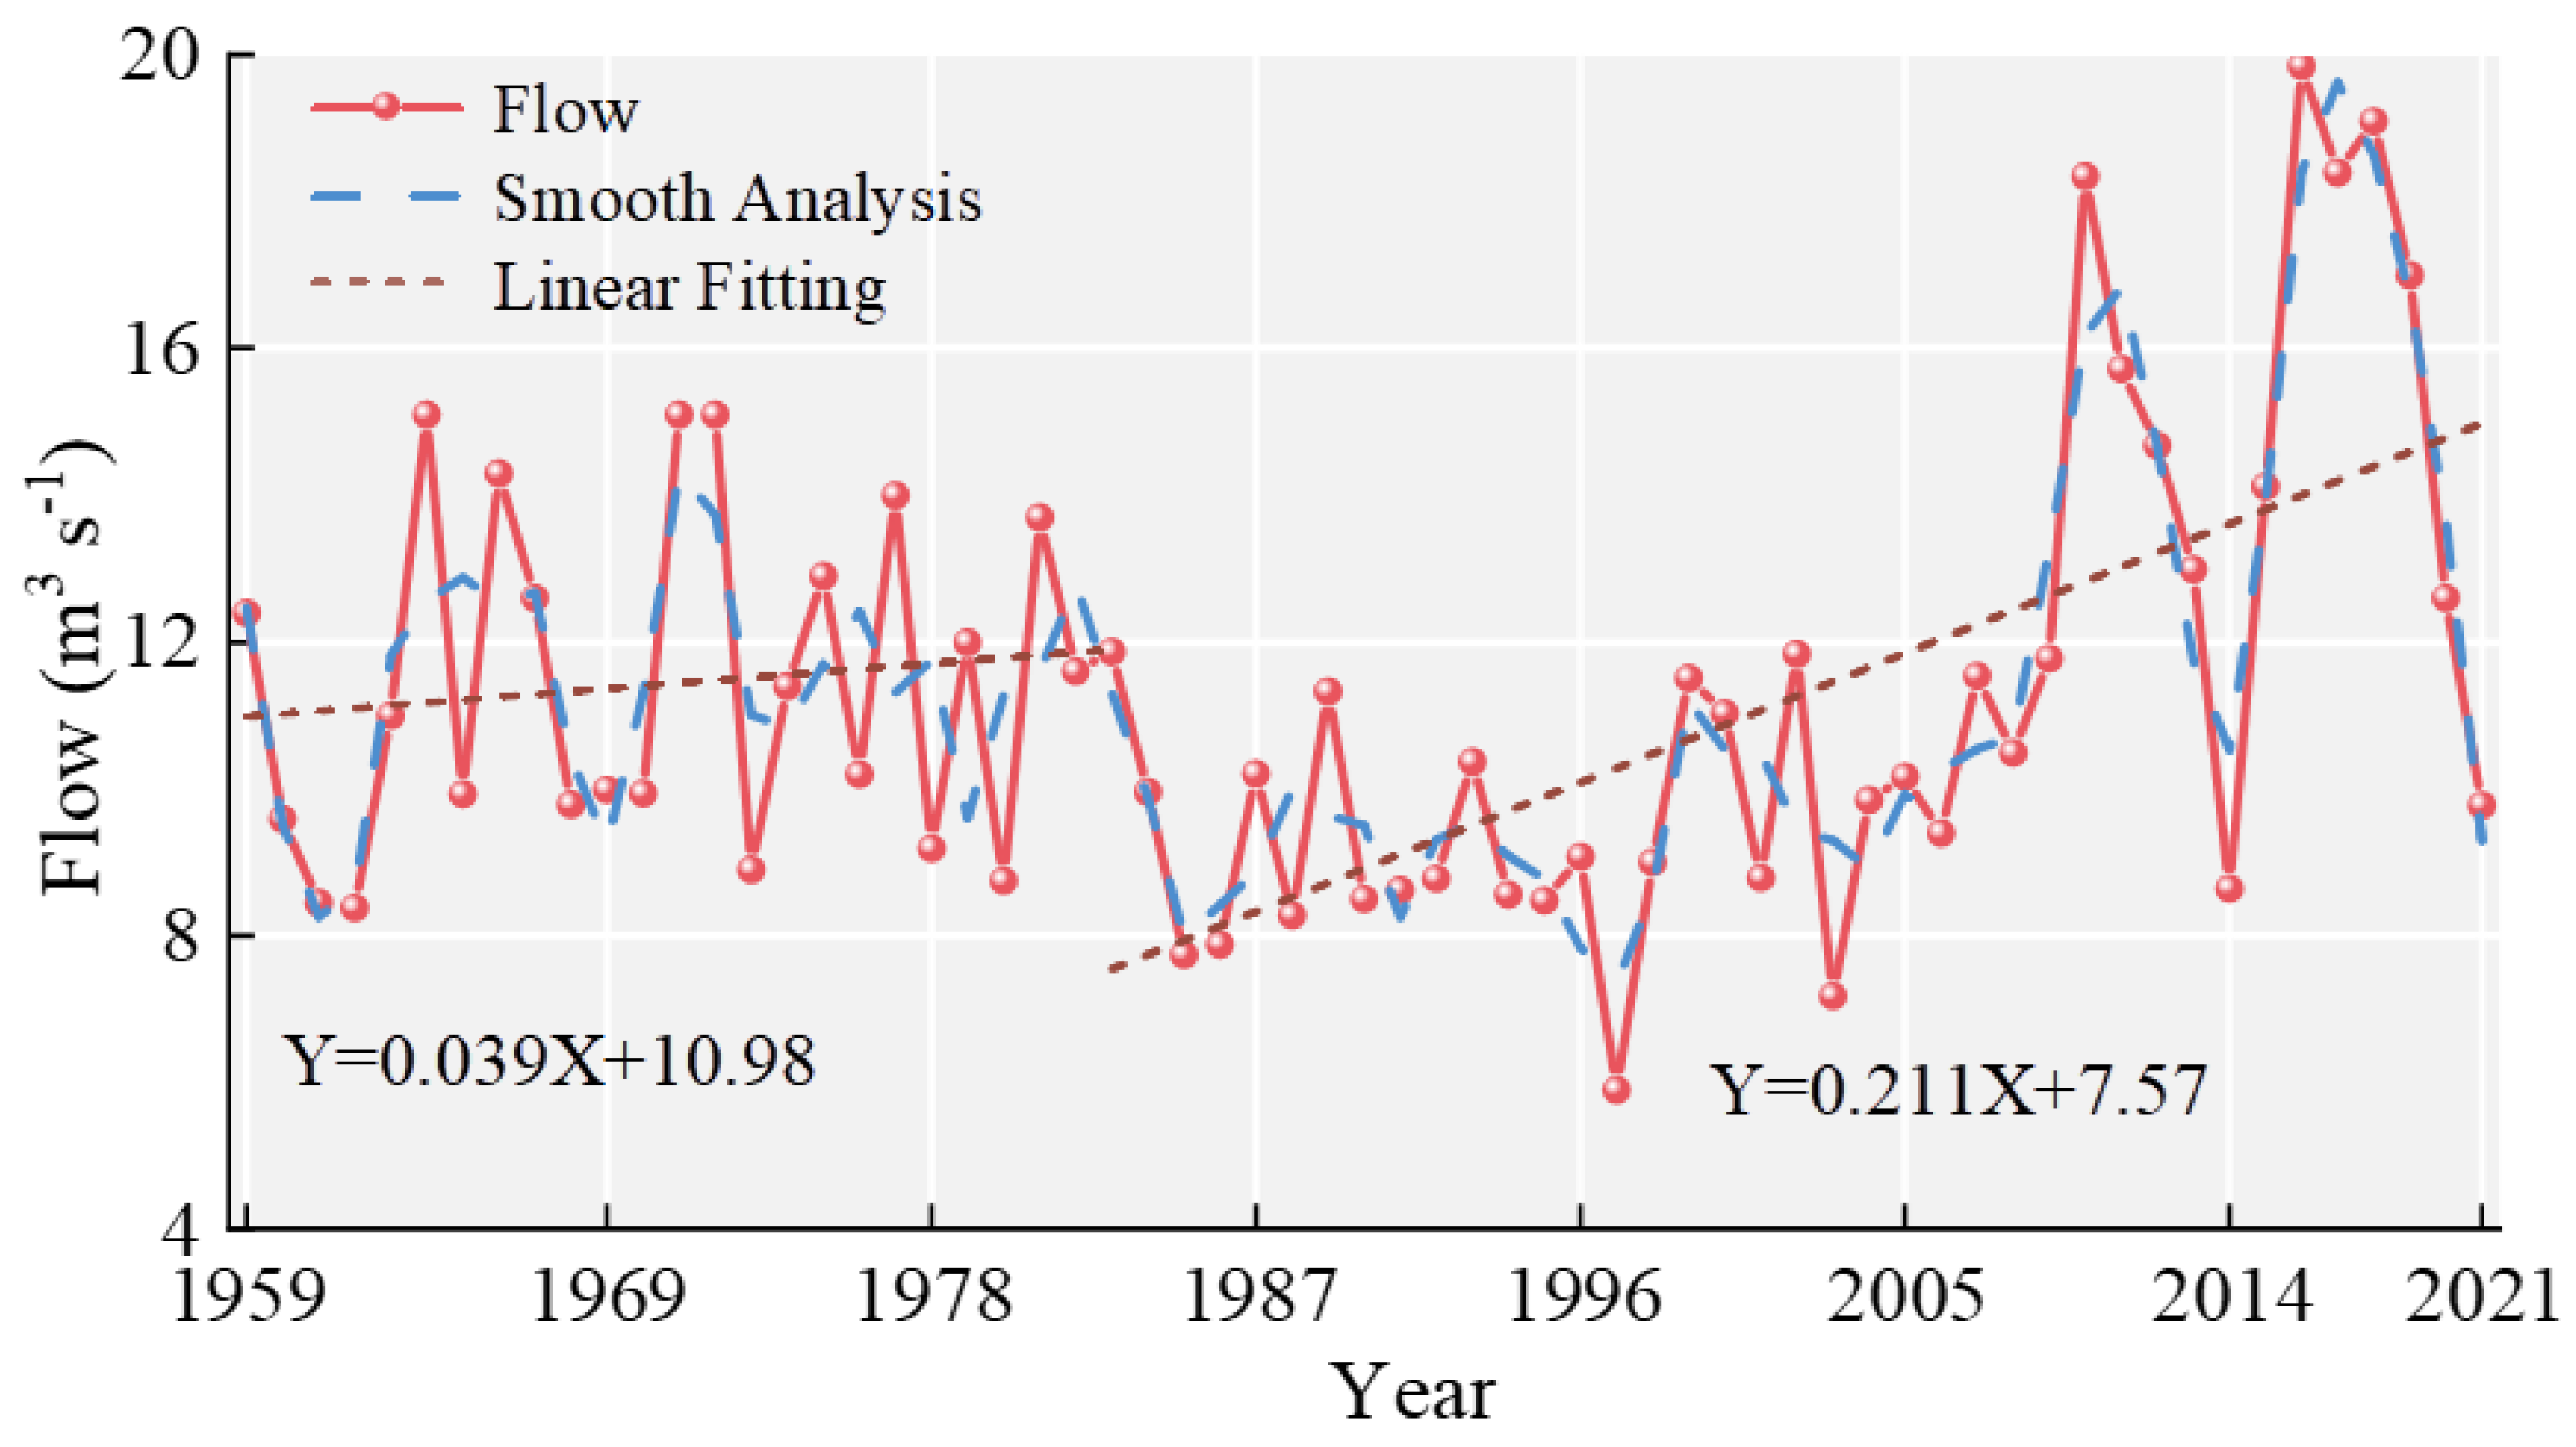
Figure 5.
(a) Simulation results of Yuanyangchi Station from 1961 to 1980 (b) Simulation results of Jiayuguan Station from 1961 to 1980 (c) Simulation results of Jiayuguan Station from 2002 to 2021. Note, NSE: The Nash-Suteliffe efficieney coefficient; PBIAS: Percent bias.
Figure 5.
(a) Simulation results of Yuanyangchi Station from 1961 to 1980 (b) Simulation results of Jiayuguan Station from 1961 to 1980 (c) Simulation results of Jiayuguan Station from 2002 to 2021. Note, NSE: The Nash-Suteliffe efficieney coefficient; PBIAS: Percent bias.
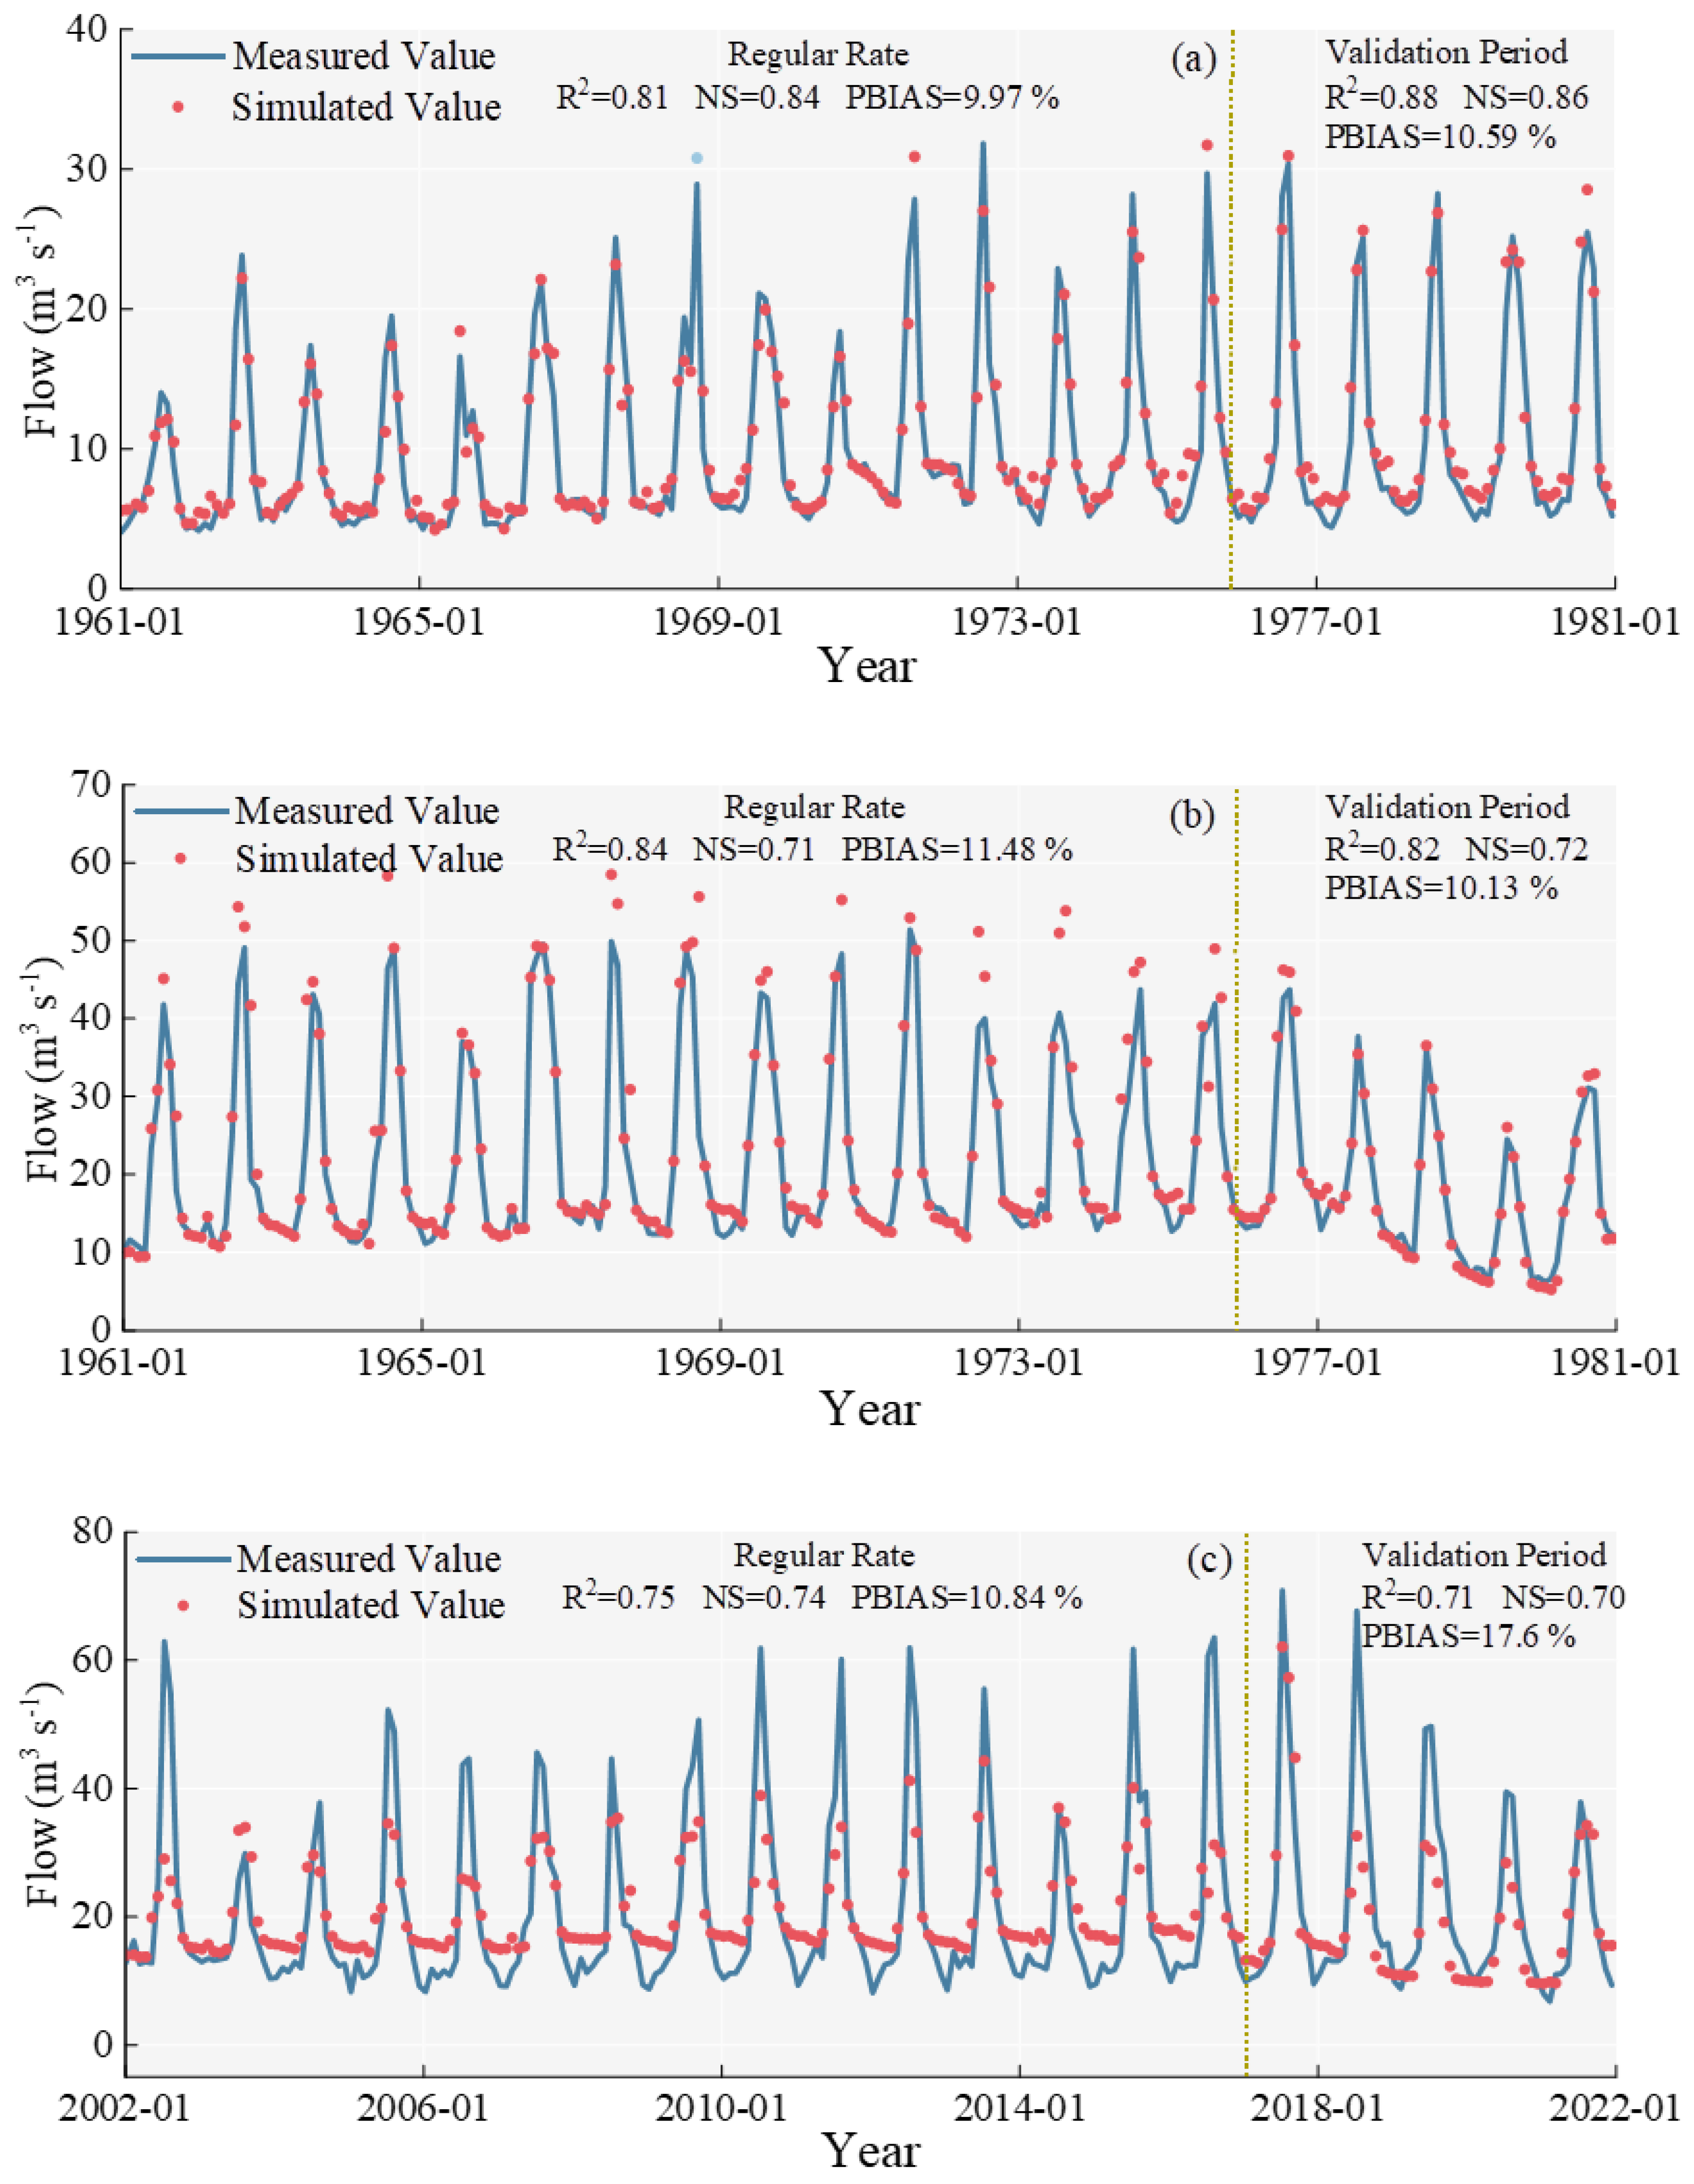
Figure 6.
Trends of Rainfall and Blue-green Water Changes from 2002 to 2021.
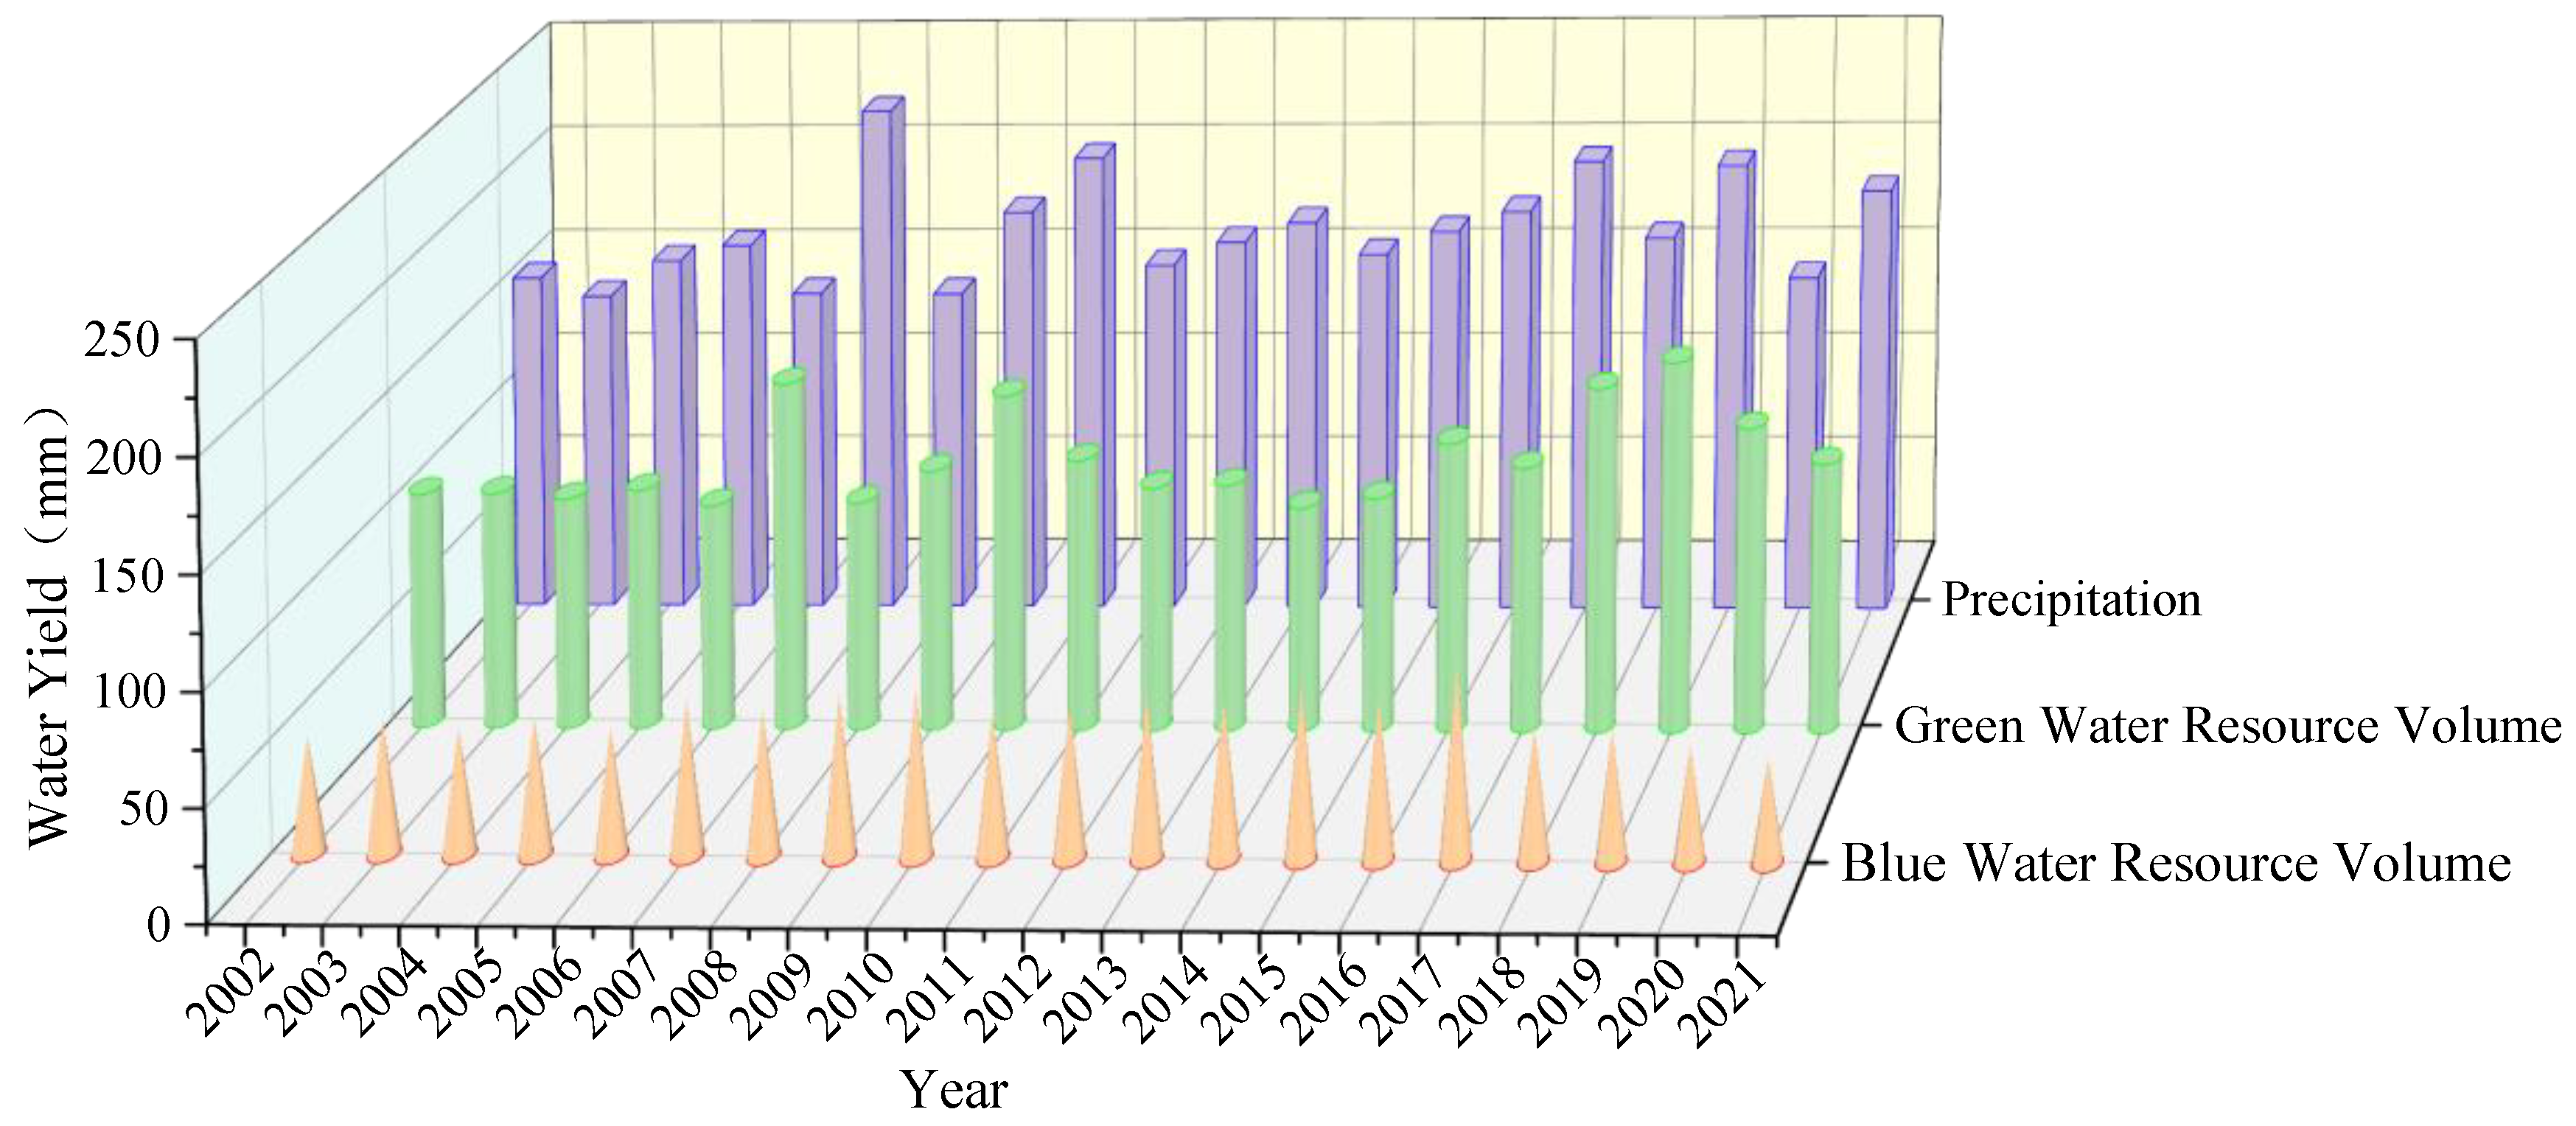
Figure 7.
Spatial Distribution map of water resources in the Taolai River Basin from 2002 to 2021 (a) Spatial distribution map of precipitation (b) Spatial distribution of blue water resources (c) Spatial distribution of green water resources.
Figure 7.
Spatial Distribution map of water resources in the Taolai River Basin from 2002 to 2021 (a) Spatial distribution map of precipitation (b) Spatial distribution of blue water resources (c) Spatial distribution of green water resources.
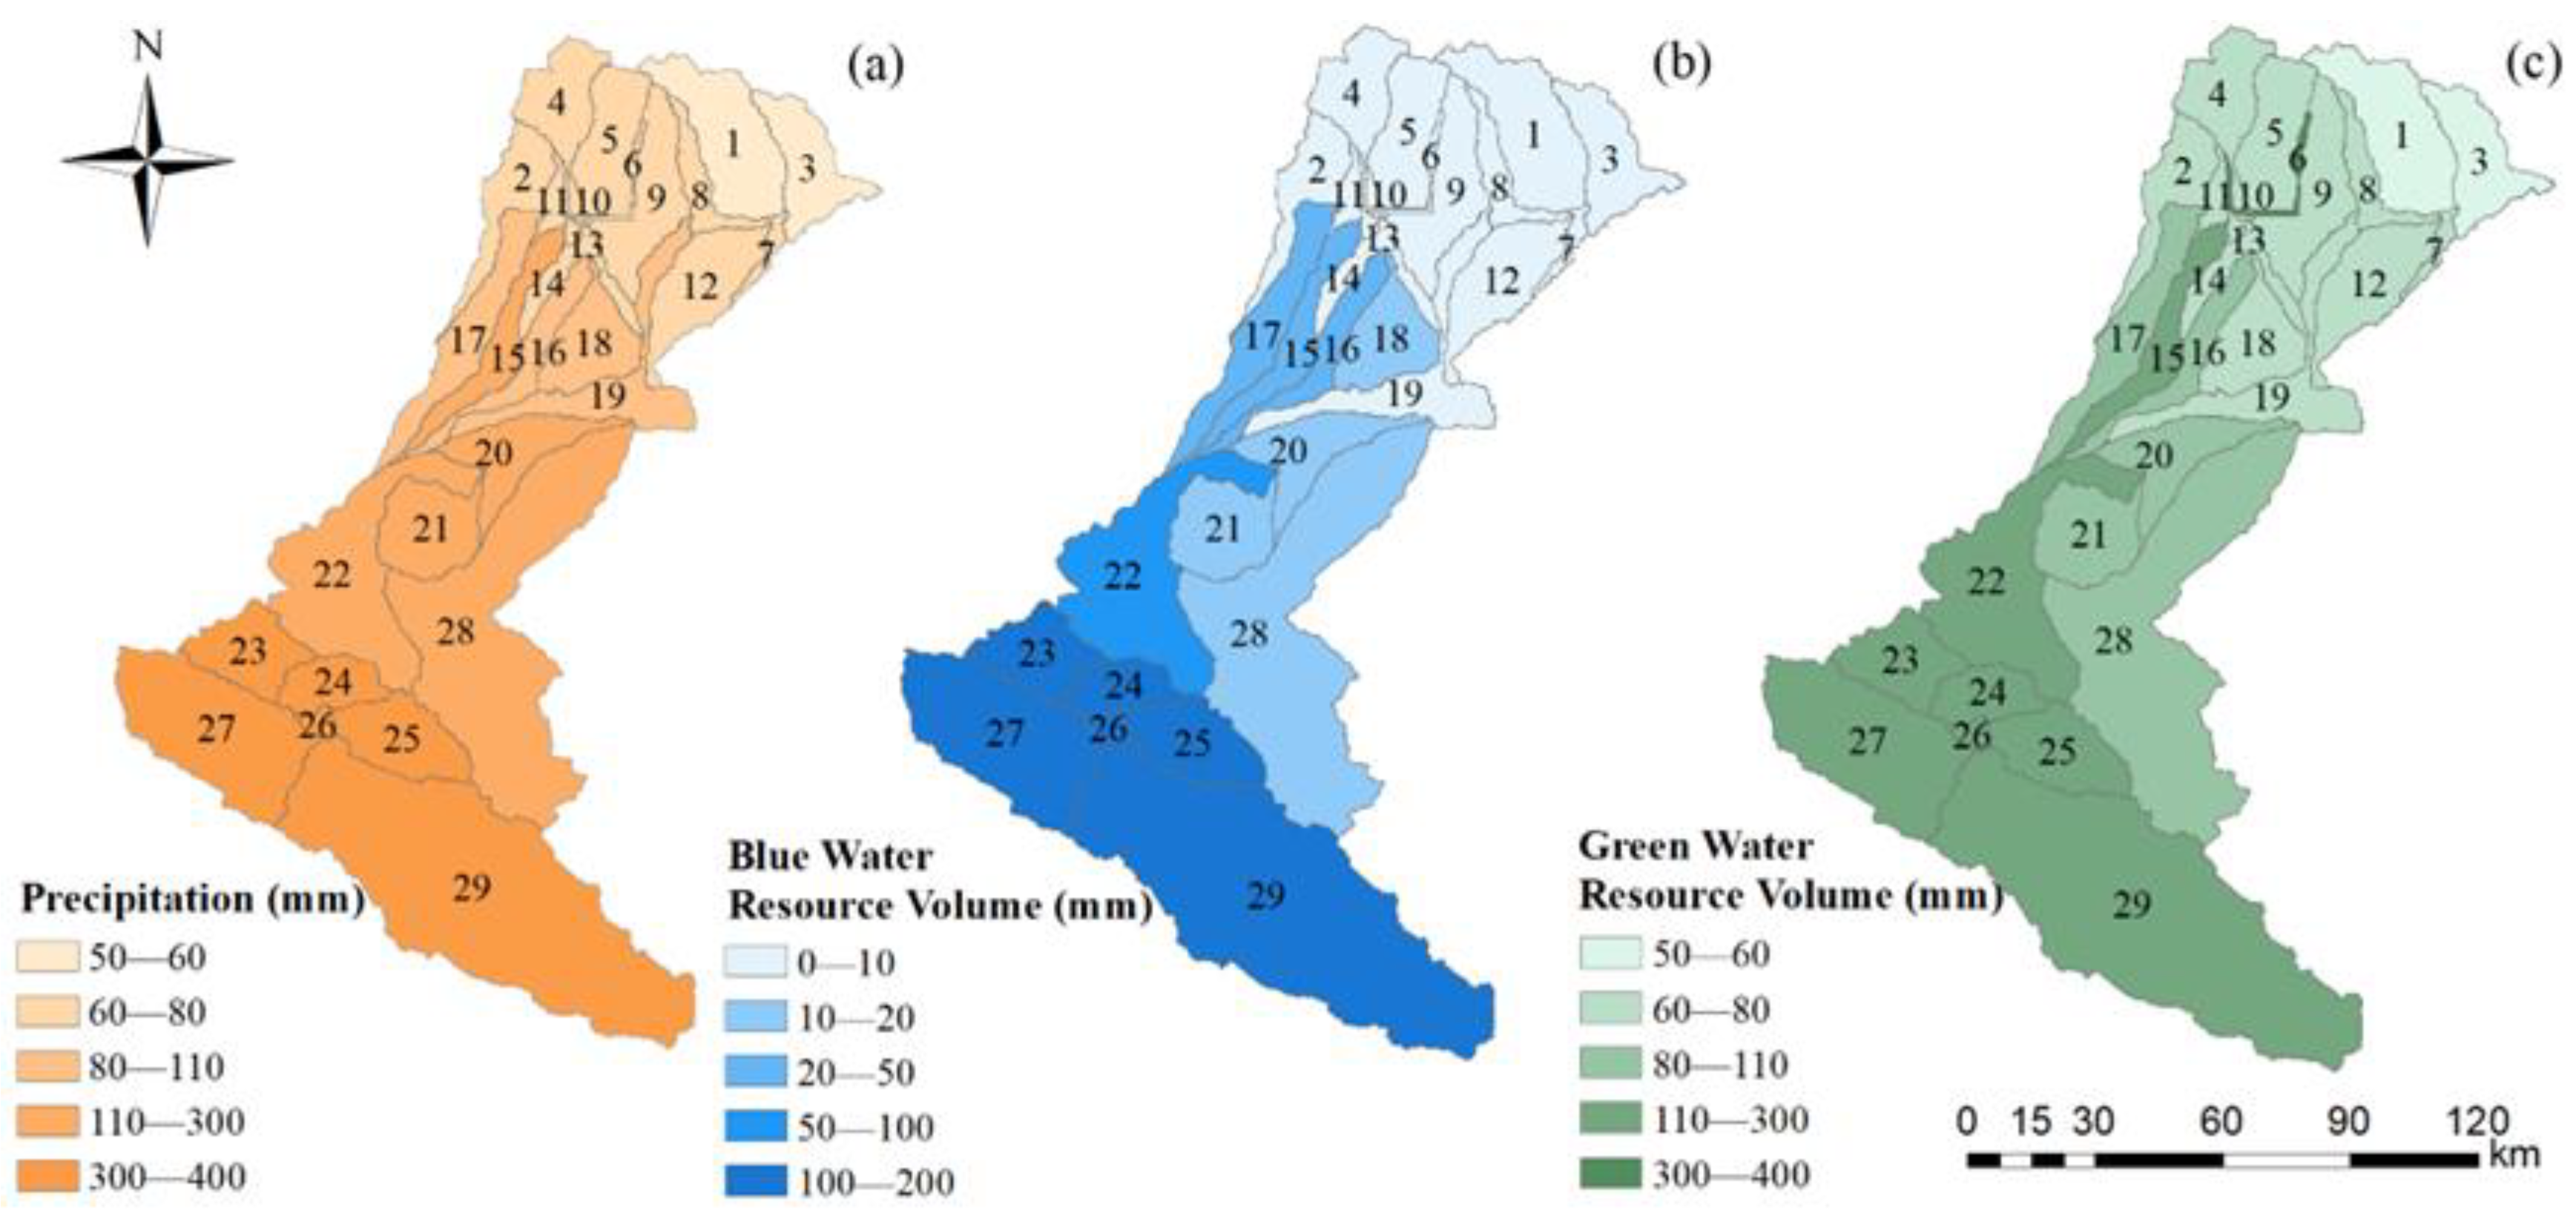
Figure 8.
Analysis of Supply and Demand Balance of Blue and Green Water from 2002 to 2021 (a) Blue Water Resources Volume (b) Green Water Resources Volume.
Figure 8.
Analysis of Supply and Demand Balance of Blue and Green Water from 2002 to 2021 (a) Blue Water Resources Volume (b) Green Water Resources Volume.
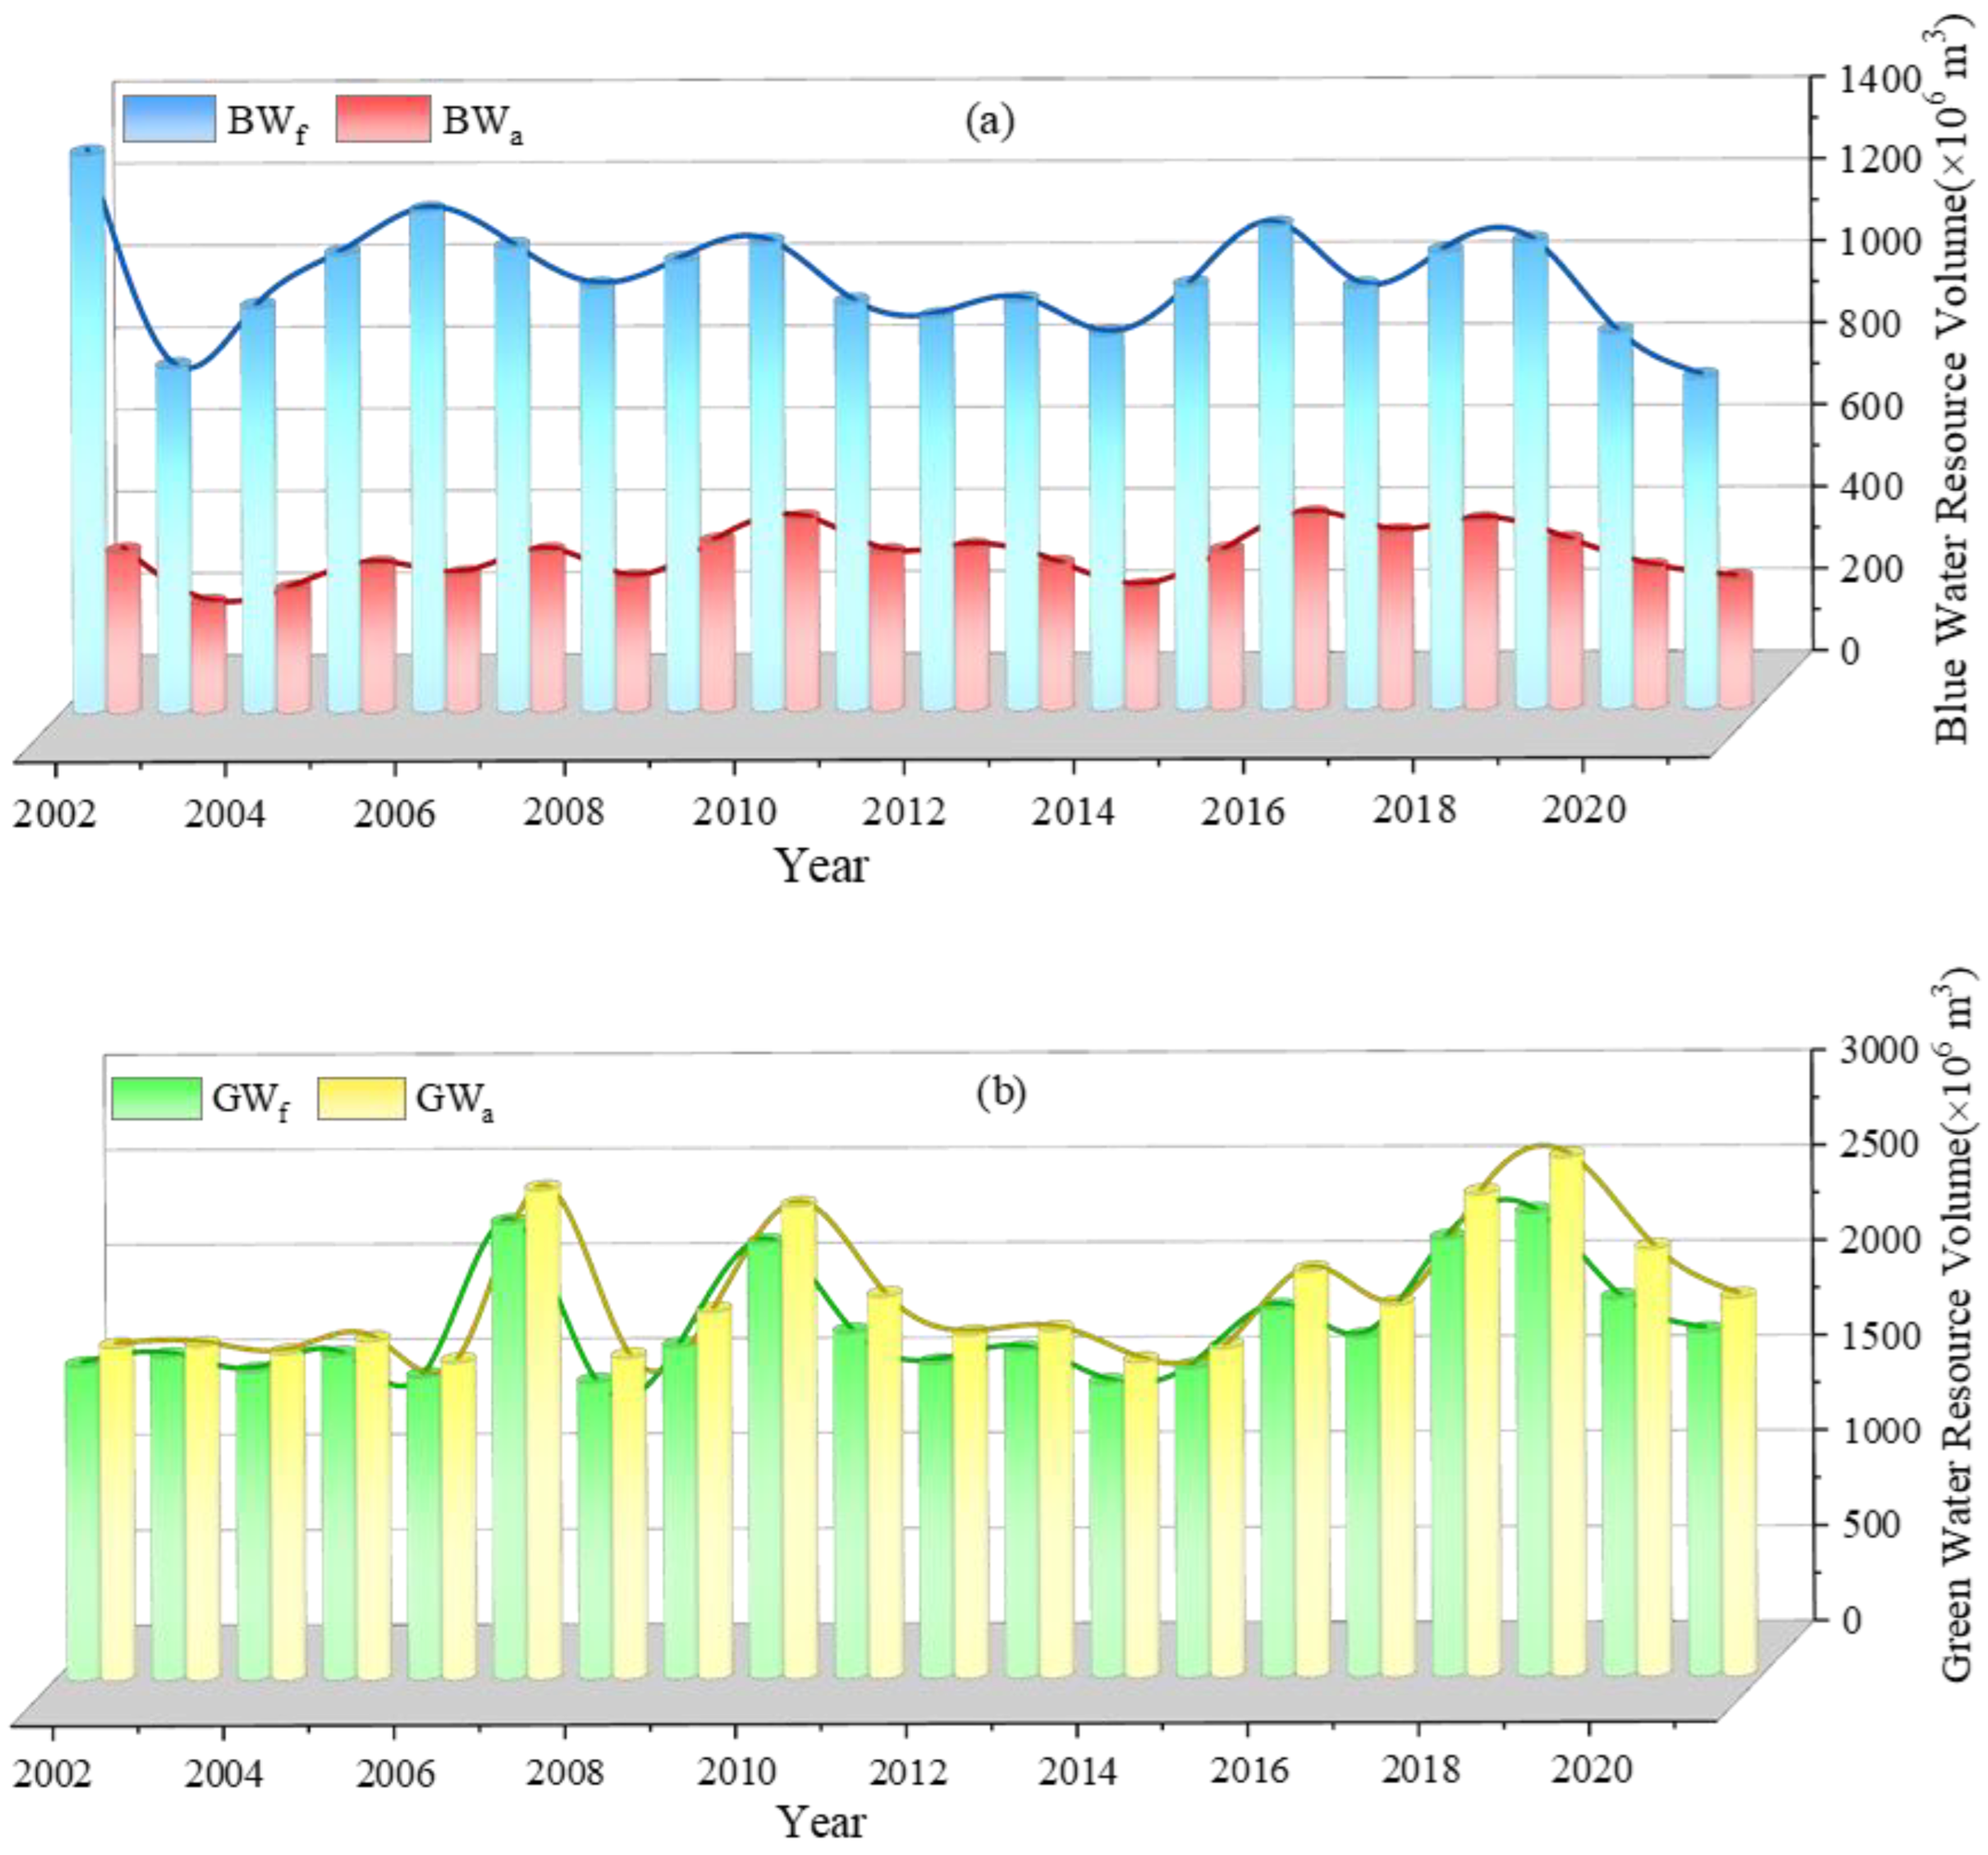
Figure 9.
The spatio-temporal supply and demand security assessment index of blue and green water from 2002 to 2021 (a, b) Blue water assessment index (c, d) Green water assessment index.
Figure 9.
The spatio-temporal supply and demand security assessment index of blue and green water from 2002 to 2021 (a, b) Blue water assessment index (c, d) Green water assessment index.
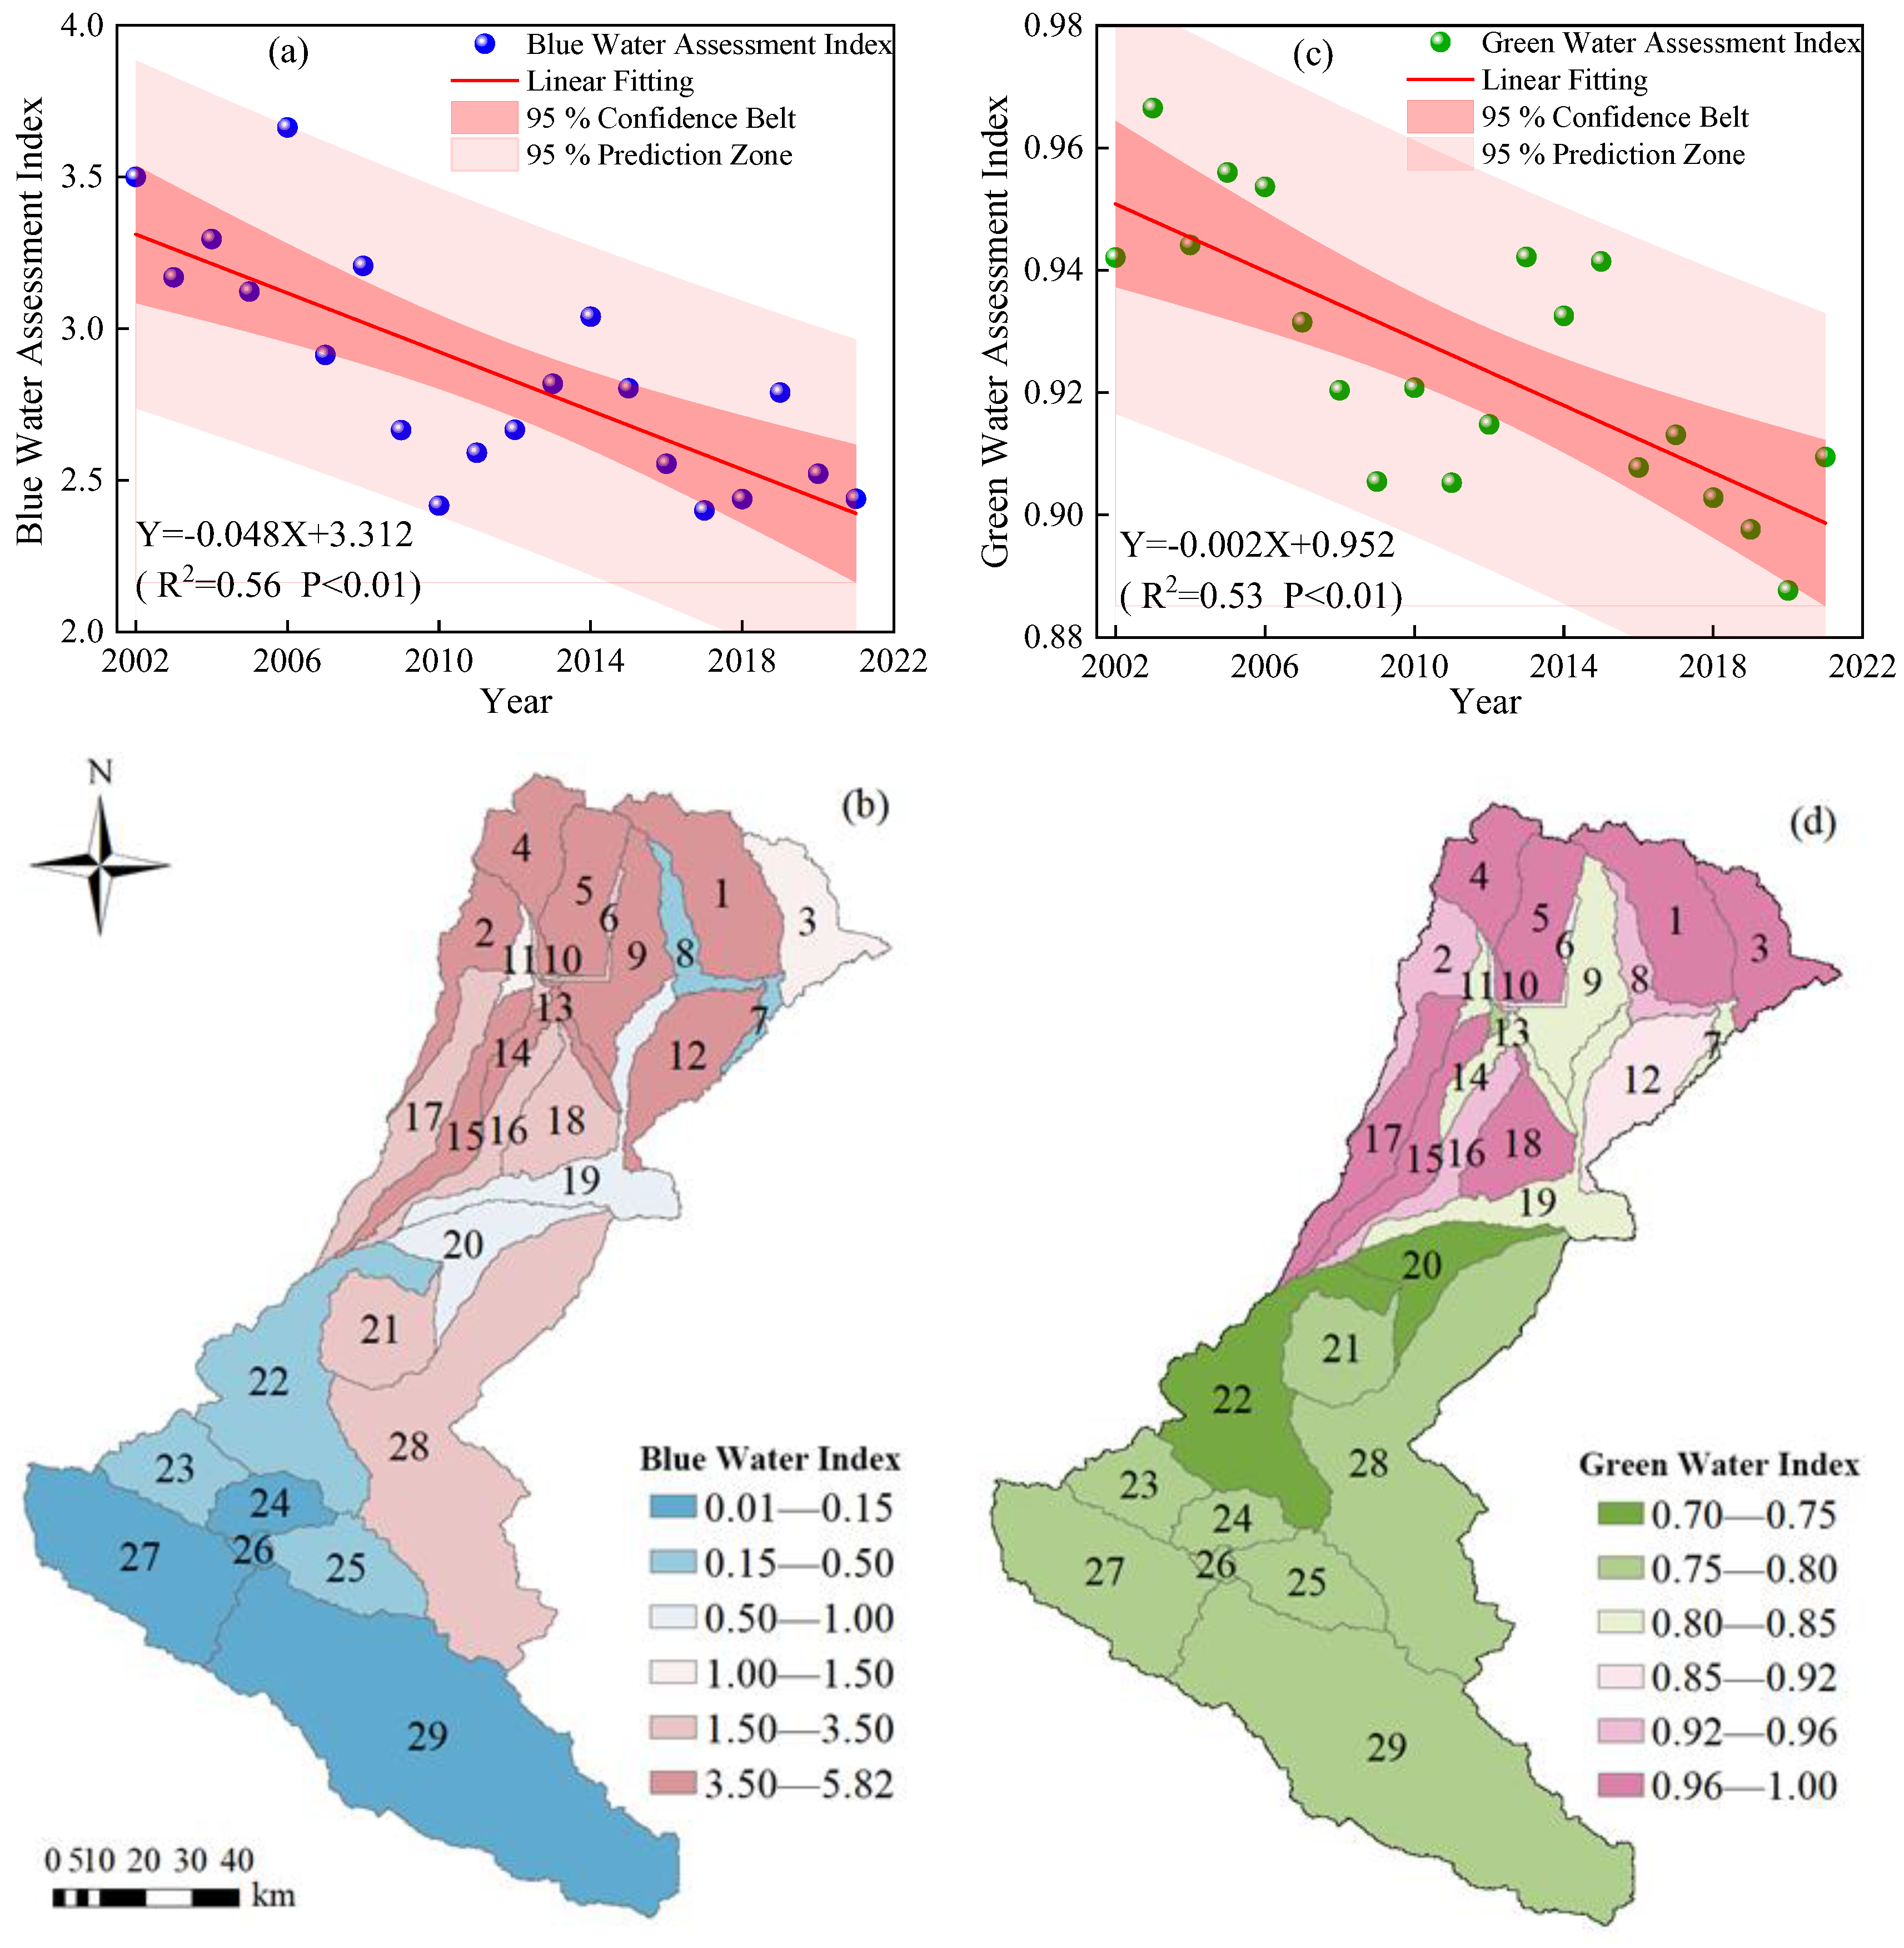
Figure 10.
The spatial distribution of water conveyance volume in the Taolai River Basin from 2002 to 2021 under different supply and demand standards (a) s=0.5 (b) s=1 (c) s=1.5.
Figure 10.
The spatial distribution of water conveyance volume in the Taolai River Basin from 2002 to 2021 under different supply and demand standards (a) s=0.5 (b) s=1 (c) s=1.5.
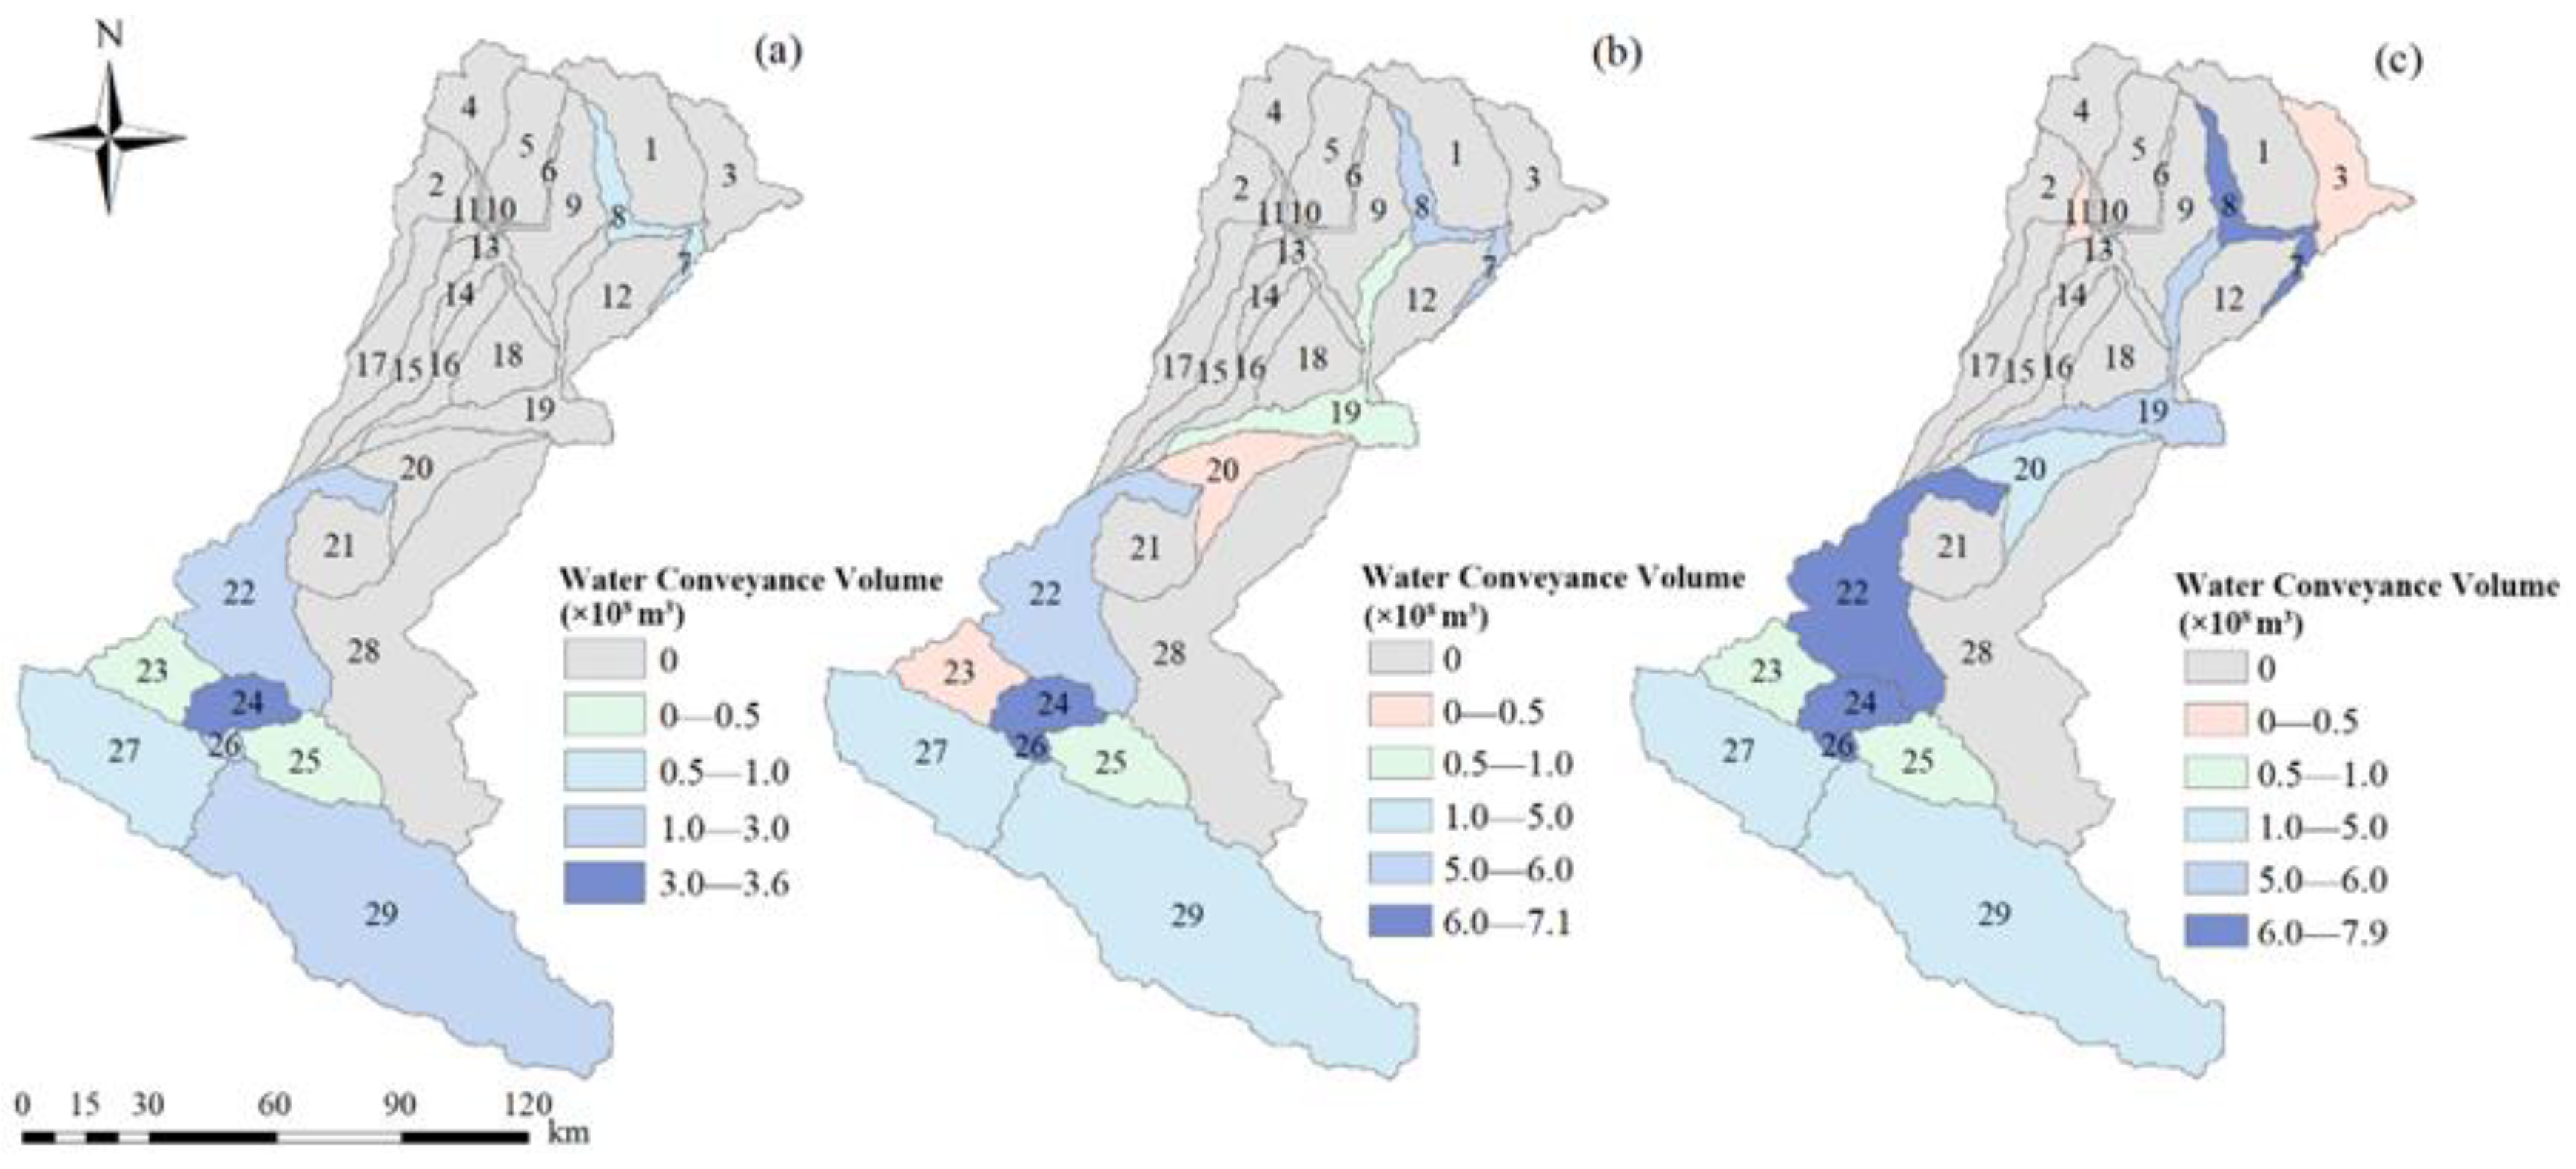

Table 1.
Data Source.
| Data | Explanation | Source |
|---|---|---|
| DEM | 30m spatial resolution | Geospatial Data Cloud (https://www.gscloud.cn/) |
| Land use data | Land cover at 1km resolution in 1980 and 2020 | Center for Resource and Environmental Sciences and Data, Chinese Academy of Sciences(https://www.resdc.cn) |
| Soil data | 1km spatial resolution soil physical and chemical characteristics | HWSD Global Soil Database (v2.0)(http://www.fao.org/nr/land/soils/harmonized-world-soil-database/en/) |
| Meteorological data | Daily precipitation, air temperature, wind speed, relative humidity and solar radiation, 1959-1980 and 2000-2021 | Dataset of daily values of surface climate data in China (V3.0) (http://www.cmads.org./) |
| Hydrological data | Monthly flows at Jiayuguan station and Yuanyangchi (Dam) station, 1959-2021 | Water Resources Bulletin |
| Population data | 1km spatial resolution data, 2002-2021 | Worldp Official Website (https://www.worldpop.org/) |
| Statistical data | Water use (domestic, productive and ecological), production, etc. | Relevant statistical yearbooks and the China Economic and Social Data Platform(https://data.cnki.net/) |
Table 2.
Model Performance Evaluation.
| Indicator Name |
Formula | Performance Evaluation Levels | |||
|---|---|---|---|---|---|
| Very Good | Good | Satisfied | Unsatisfied | ||
| R2 | 0.75 ~ 1.00 | 0.65 ~ 0.75 | 0.50 ~ 0.65 | 0.00 ~ 0.50 | |
| NSE | 0.75 ~ 1.00 | 0.65 ~ 0.75 | 0.50 ~ 0.65 | 0.00 ~ 050 | |
| PBIAS (%) | < ±10 | ±10 ~ ±15 | ±15 ~ ±25 | > ±25 | |
Nvote, is the observed value of the flow, is the simulated value of the flow, is the mean value of the flow observation, is the mean value of the flow simulation, and n is the number of samples.
Table 3.
Evaluation of the supply and demand relationship of blue water.
| Blue Water Assessment Index | Safety | Supply-demand Relationship |
|---|---|---|
| <0.5 | Low | Favorable |
| 0.5~1 | Middle | Balanced |
| 1~1.5 | High | Slight Unbalance |
| >1.5 | Extremely High | Unbalance |
Table 4.
Runoff Trend and Mutation Test Results Yuanyangchi Station in 1959−2021.
| Mutation test | Yuanyangchi Station | Mutation test | Yuanyangchi Station | ||||
|---|---|---|---|---|---|---|---|
| Test Value | Significance | Mutation Year | Test Value | Significance | Mutation Year | ||
| Man-Kendall | 1.64 | Yes | 2011 | Sliding rank sum test | 1.96 | Yes | 2009 |
| Cumulative anomaly | 1.64 | Yes | 2009 | Man-Whitney-Pitt | 1.24 | No | 1983 |
| Ordered clustering | 1.64 | Yes | 2009 | Pettitt | 1.96 | Yes | 2006 |
| Lin Haiharin | 1.64 | Yes | 2009 | Buishand U Test | 1.96 | No | 1986 |
| moving t-test | 1.64 | Yes | 2009 | Standard normal state | 0.47 | Yes | 2010 |
| Sliding F-test | 1.64 | Yes | 2013 | Slide at equal intervals of 5T | 0.08 | No | 1984 |
| Sliding run test | 1.96 | No | 2015 | Bayesian | 1.64 | Yes | 2009 |
| Stationary period | 1959-1982 | ||||||
| Mutation period | 1983-2021 | ||||||
Table 5.
Key Sensitive Parameters and their Fitted Values.
| Sensitivity ranking | Method | Parameter | Initial range | Optimal value r | T-Stat | P-Value |
|---|---|---|---|---|---|---|
| 1 | V | GW_DELAY | 0-500 | 376.286 | 11.76 | <0.01 |
| 2 | V | GWQMN | 0-5000 | 2148.826 | 11.34 | <0.01 |
| 3 | V | GW_REVAP | 0.02-0.2 | 0.108 | 6.39 | <0.01 |
| 4 | V | RCHRG_DP | 0-1 | 0.545 | 3.73 | <0.01 |
| 5 | R | SOL_AWC() | -0.5-0.5 | 0.325 | 3.53 | <0.01 |
| 6 | V | SLSUBBSN | 10-150 | 79.078 | 3.32 | <0.01 |
| 7 | V | HRU_SLP | 0-1 | 0.414 | -2.99 | <0.01 |
| 8 | R | BIOMIX | -0.5-0.5 | -0.058 | -2.34 | 0.02 |
| 9 | R | SOL_Z() | -0.5-0.5 | 0.390 | 2.19 | 0.29 |
| 10 | V | CH_N2 | -0.5-0.5 | 0.123 | -2.06 | 0.04 |
| 11 | V | CANMX | 0-100 | 16.858 | 1.65 | 0.10 |
| 12 | V | REVAPMN | 0-500 | 229.920 | 1.50 | 0.13 |
| 13 | V | SMFMX | 0-20 | 14.399 | 1.27 | 0.21 |
| 14 | V | SMFMN | 0-20 | 4.109 | 1.04 | 0.30 |
| 15 | V | SFTMP | -20-20 | 6.564 | 1.00 | 0.32 |
| 16 | R | SOL_BD() | -0.5-0.5 | -0.440 | -0.97 | 0.33 |
| 17 | V | SMTMP | -20-20 | -17.965 | -0.83 | 0.41 |
| 18 | R | SOL_ALB | -0.5-0.5 | -0.365 | 0.74 | 0.46 |
Note, R in the method indicates that the parameter is adjusted with the best value, and the formula is ,where indicate the adjusted parameter value and the initial parameter, respectively, r is the best value, and V indicates that the initial value is replaced with the best value.
Disclaimer/Publisher’s Note: The statements, opinions and data contained in all publications are solely those of the individual author(s) and contributor(s) and not of MDPI and/or the editor(s). MDPI and/or the editor(s) disclaim responsibility for any injury to people or property resulting from any ideas, methods, instructions or products referred to in the content. |
© 2025 by the authors. Licensee MDPI, Basel, Switzerland. This article is an open access article distributed under the terms and conditions of the Creative Commons Attribution (CC BY) license (http://creativecommons.org/licenses/by/4.0/).
Copyright: This open access article is published under a Creative Commons CC BY 4.0 license, which permit the free download, distribution, and reuse, provided that the author and preprint are cited in any reuse.


