
Submitted:
27 April 2025
Posted:
28 April 2025
You are already at the latest version
Abstract
Amid global climate change and rapid urbanization, the conflict between agricultural development and water scarcity is intensifying. In the Chengdu-Chongqing region, a key grain production and ecological hub, coordinating high-quality agriculture with sustainable water use is critical. This study analyzes the spatiotemporal interplay between Agricultural Development Quality (AQI) and Water Resource Carrying Capacity (WCI) from 2013–2022 across 16 cities, using TOPSIS, barrier degree analysis, standard deviation ellipse, and grey prediction. AQI shows steady growth but significant spatial heterogeneity, with Chongqing and Chengdu as developmental cores, while cities like Guang’an lag due to resource and talent constraints. WCI fluctuates, with climate extremes and urbanization widening disparities, though cross-regional water projects narrow gaps. AQI is projected to reach 2.0 by 2026. Strategies include cross-regional water coordination, core-city-driven industry clusters, and climate-adaptive agriculture to address resource-industry-environment bottlenecks. The multidimensional framework offers insights for Southwest China and global inland regions, advancing sustainable agriculture and water management integration.
Keywords:
agricultural-water nexus
; spatiotemporal evolution
; barrier factor analysis
; regional coordination
; grey prediction model
1. Introduction
In the broader context of global climate change and the accelerating pace of urbanization [1,2], food security [3] and water resource security [4]—cornerstones of national security [5,6]—face formidable challenges to their sustainable development. Globally and within China, the compounded pressures of population growth, economic development, and climate variability [7,8,9] have intensified the contradictions between agricultural development and the scarcity and uneven spatiotemporal distribution of water resources [10,11]. The traditional, extensive model of agricultural development, characterized by excessive water consumption [12], not only precipitates ecological and environmental degradation but also contravenes the national strategic imperative of “high-quality development” [13]. This strategic orientation demands not merely increased agricultural productivity but also emphasizes green, efficient, and sustainable practices [14]. Against this backdrop, achieving high-quality agricultural development under the constraints of limited water resources emerges as a pressing and critical challenge requiring urgent resolution.
To elucidate the pivotal interrelationship between agricultural development quality and water resource carrying capacity [15], this study defines the “Agricultural Quality Index (QAI)” as a multidimensional construct encompassing economic efficiency, social benefits, ecological integrity, technological advancement, and resource utilization efficiency [16,17], fundamentally distinct from mere quantitative growth. Conversely, the “Water Carrying Capacity Index (WCI)” denotes the maximum capacity of a regional water resource system to sustainably support agricultural development while preserving ecosystem health[18,19]. High-quality agricultural development is contingent upon the effective provision of water resources [20,21]; however, prevailing agricultural practices—such as excessive irrigation and the overuse of substandard fertilizers and pesticides—risk exceeding regional water resource thresholds, thereby engendering intrinsic contradictions that undermine agricultural sustainability [22,23]. Consequently, the core scientific inquiry of this study centers on precisely evaluating the levels of regional agricultural development quality and water carrying capacity and elucidating their interactive mechanisms. This article aims to delineate strategies for optimizing regional agricultural development pathways under the constraints of water carrying capacity.
As a linchpin of national economic growth [24], a cornerstone of the Western Development Strategy, and an ecological bulwark in the upper reaches of the Yangtze River, the Chengdu-Chongqing region occupies a position of paramount strategic importance in China’s national development framework [25]. The region’s agricultural prominence is particularly pronounced, serving as a vital national grain production hub and a base for distinctive agricultural products [26]. Nevertheless, the Chengdu-Chongqing region grapples with a constellation of complex water resource challenges [27,28]. Despite a relatively abundant total water resource volume, its spatiotemporal distribution is markedly uneven, compounded by issues of engineered water shortages and water quality degradation. In certain areas, the degree of water resource exploitation is already high; although transboundary water flows are substantial, local water resource utilization remains a point of acute contention. Moreover, rapid urbanization and industrialization have exerted a significant crowding-out effect on agricultural water use [29]. Against the backdrop of China’s vigorous promotion of the Chengdu-Chongqing Economic Circle [30], coupled with an emphasis on ecological prioritization and green development, investigating the synergistic relationship between agricultural development quality and water carrying capacity in this region holds profound practical significance and exemplary value.
Based on a comprehensive review of international research, this study identifies that existing literature on agricultural development quality assessment predominantly focuses on single-dimensional analyses. For instance, Chinese scholars often adopt perspectives akin to the Yangtze River Economic Belt, emphasizing the interplay between agriculture and economic benefits [31] or environmental factors [32]. In contrast, scholars from developed nations, such as those in the United States, tend to examine agricultural development through a singular environmental lens, focusing on ecological impacts [33]. Similarly, German researchers frequently associate agricultural development changes with abrupt drought events, analyzing their implications in isolation [34]. Although studies in China’s Shandong Province have attempted to construct composite indicator systems to evaluate agricultural quality [35], in-depth assessments tailored to specific regions and incorporating water resource constraints remain limited. In the realm of water carrying capacity assessment, prevailing methodologies include composite evaluation approaches [36], system dynamics modeling [37], and analytic hierarchy processes [38]. However, evaluations specific to agricultural water carrying capacity—particularly those addressing water quality, ecological water demands, and dynamic assessments under future scenarios—require further development. Regarding the interrelationship between agricultural development quality and water carrying capacity, some studies have examined the unidirectional influence of water resources on agriculture or conducted rudimentary correlation analyses [39,40]. Nevertheless, comprehensive investigations into the coupled coordination mechanisms and dynamic evolutionary patterns of these two complex systems remain scarce. As for optimization strategies, existing approaches predominantly focus on isolated water resource management adjustments, such as advancements in water-saving technologies in Iran [41] or water pricing reforms in Italy [42]. However, there is a notable absence of systematic and differentiated optimization pathways grounded in the diagnosis of coupled coordination states.
In light of these considerations, research on the comprehensive assessment of the “agricultural development quality” and “water carrying capacity” systems within the specific geographic context of the Chengdu-Chongqing region, coupled with an in-depth exploration of their coordinated interrelationship and the formulation of targeted optimization strategies, remains in its nascent stages. Given the identified research gaps and contextual background, this study employs an integrated application of advanced methodologies, including standard deviational ellipse [43] and spatial disparity coefficient analyses [44], to systematically evaluate the spatiotemporal evolutionary characteristics of agricultural development quality in the Chengdu-Chongqing region [45,46,47]. By leveraging the TOPSIS composite evaluation method, augmented by obstacle degree modeling [48,49], this study precisely measures the levels and trends of water carrying capacity oriented toward agriculture [50,51]. Synthesizing these findings, the study elucidates the coupled coordination dynamics and spatiotemporal divergence patterns between QAI and WCI in the Chengdu-Chongqing region [52]. Furthermore, grey prediction modeling [53] is utilized to forecast future developmental trends, enabling the formulation of optimization strategies for achieving high-quality agricultural development and sustainable water resource utilization in the region. These strategies aim to provide robust theoretical support and practical guidance for regional sustainable development.
2. Materials and Methods
2.1 Data Sources
The data for this study are primarily sourced from authoritative and systematic official statistical yearbooks and bulletins, including the Sichuan Statistical Yearbook (2014–2023), Chongqing Statistical Yearbook (2014–2023), China Water Resources Bulletin, Sichuan Water Resources Bulletin, Chongqing Water Resources Bulletin, and China Urban Statistical Yearbook. Despite the robustness of these sources, the study acknowledges potential limitations stemming from the lagged updating of data, discrepancies in statistical methodologies, constraints on data precision, and incomplete information coverage. To mitigate these challenges, this study employs a suite of analytical strategies, including multivariate system analysis, correlation analysis, and disparity coefficient analysis, to ensure the reliability of the data and enhance the rigor of the research findings.
2.2. Evaluation of the Two-System Index and Determination of Indicator Weights
Agricultural development quality[54] encapsulates the composite quality of rural construction, human living environments, infrastructure, and economic progress. To this end, this study constructs a comprehensive evaluation framework encompassing four subsystems—economic, demographic, spatial, and social—to holistically assess the quality of agricultural and rural development. The evaluation of water carrying capacity[55,56], informed by prior research, is predicated on dimensions including natural water resource endowments, water environmental protection, and water resource utilization. Accordingly, an indicator-based evaluation system was established, comprising three subsystems—socio-hydrological, resource-based, and ecological—as detailed in Table 1.
Based on the above indicators, data standardization processing was mostly carried out using range standardization in this paper:
Among them, based on previous experience, the calculation formulas for the agricultural quality index and water resources carrying capacity index of each city are as follows:
Where AQI represents the Agricultural Quality Index, and WCI denotes the Water Resource Carrying Capacity Index; signifies the weight of the criterion layer subsystem, and represents the standardized value of each indicator datum. For the remaining comprehensive evaluation models in this study, the entropy weight method is employed to calculate indicator weights, ensuring the objectivity of the weighting process.
2.3. TOPSIS Comprehensive Evaluation Assisted by Obstacle Degree Model
2.3.1. TOPSIS Comprehensive Evaluation Model
The TOPSIS (Technique for Order of Preference by Similarity to Ideal Solution) model [57], which evaluates systems based on positive and negative ideal solutions, ranks evaluation objects by calculating their distances and proximity to these ideal solutions, thereby determining their relative performance. Drawing on prior research [58], this study categorizes the derived data into five levels based on threshold values of 0.2, 0.3, 0.5, and 0.7: namely, 0 < ≤ 0.2 (Level V: Extremely Poor), 0.2 < ≤ 0.3 (Level IV: Poor), 0.3 < ≤ 0.5 (Level III: Good), 0.5 < ≤ 0.7 (Level II: High Quality), and 0.7 < < 1 (Level I: Extremely High). The computational steps are as follows:
2.3.2. Obstacle Degree Model
Barrier degree analysis of water resource carrying capacity represents an advanced approach to evaluation, enabling the diagnosis and quantification of limiting factors and their impact through the application of the barrier degree model [59]. This method is critical for enhancing regional water resource carrying capacity. Specifically, a lower barrier degree value for a given indicator signifies a less pronounced constraint on WCI. The barrier degree calculation formula is:
represents the obstacle degree; represents the factor contribution degree; represents the index deviation degree; represents the weight of the index; represents the weight of the subsystem to which the index belongs; represents the normalized index value.
2.4. Analysis of Spatiotemporal Characteristics and Research on Action Mechanism
Given the intricate and complex interplay between water resource carrying capacity and agricultural development quality, as well as the complexity of their evolutionary characteristics and underlying mechanisms, this study conducts a comprehensive analysis of the spatiotemporal evolutionary characteristics, influencing factors, and interaction mechanisms of these two systems. The spatial relationship is modeled as follows.
2.4.1. Standard Deviational Ellipse Model
The standard deviational ellipse [60], a spatial pattern statistical analysis method, focuses on revealing the global characteristics of the spatial distribution of geographic elements:
(,)is the average center of (,); is the agricultural quality index and water resources carrying capacity index; x'、y' are the relative coordinates of each point from the regional center; Based on , data such as the rotation angle of the gravity center distribution pattern can be obtained.
In the formula, δx and δy represent the standard deviations along the X-axis and Y-axis, respectively, serving as numerical bases for a detailed interpretation of the ellipse’s characteristics.
2.4.2. Spatial Disparity Coefficient
The spatial disparity coefficient [61] can accurately reflect the degree of differentiation in the distribution of different spatial data.
where: P and I represent the ellipse areas characterizing water resource carrying capacity and urbanization quality, respectively; anddenote the intersection and union areas of the two ellipses, respectively; A and R represent the similarity coefficient and spatial difference coefficient for water resource carrying capacity and urbanization, respectively, with values ranging from 0 to 1. An increase in the R-value indicates heightened spatial heterogeneity, while a decrease reflects the opposite trend.
2.5. Grey Prediction Model
Grey system theory [62], which focuses on medium- and short-term forecasting and the analysis of uncertain information, has emerged as a vital theoretical tool for trend prediction across diverse domains, including transportation [63], short-term stock market forecasting[64], foreign exchange rates, and the energy sector [65]. Among its models, the GM(1,1) model, renowned for its adaptability and intuitiveness, is one of the most widely applied in grey prediction theory. Its computational procedure is as follows:
Their first-order accumulated generation equation is:
The grey differential equation of the traditional grey model GM(1,N) is:
where the background value is:
The whitened equation is:
And its solution is:
Through , the simulated values and predicted values of the original sequence are calculated. If the time series changes significantly within the time interval , the time response function of the GM(1,1) model constructed based on them can be substituted into Equation (20) to obtain the analytical expression of the time response equation of the GM(1,N) model.
3. Results
3.1. Water Resources Carrying Capacity Analysis
3.1.1. Analysis of Water Resources Carrying Capacity Using TOPSIS Evaluation
Employing the TOPSIS model for comprehensive evaluation, this study quantitatively analyzed the water resource carrying capacity in the Chengdu-Chongqing region over the period from 2013 to 2022. In light of the pronounced regional disparities in both natural and anthropogenic conditions across the various cities, individual evaluations of water resource carrying capacity were undertaken for each of the 16 prefecture-level municipalities. Subsequently, the findings were synthesized and graphically represented in Figure 1.
Upon analyzing Figure 1, it is evident that the water resource carrying capacity in the Chengdu-Chongqing region exhibited a generally upward trajectory from 2013 to 2022. The region's water resource carrying capacity index significantly increased from 0.278 in 2013 to 0.663 in 2021, reaching its peak over the decade. However, a detailed examination of the evolution of water resource management in the Chengdu-Chongqing area reveals instances of fluctuating declines in the carrying capacity index during certain years, with the data variations in 2017 and 2022 being particularly notable. Through comparative analysis, it was ascertained that in 2022, the Chengdu-Chongqing region was significantly impacted by extreme climate variations, experiencing a three-month period of extreme heat. The region's summer temperatures reached 45°C, exceeding the historical maximum of 43.5°C observed over the preceding thirty years. These extreme climatic conditions exerted a profound influence on pivotal indicators such as regional precipitation, the share of surface water resources, and the water yield modulus, all of which are directly correlated with the total water resources. Consequently, this led to a notable decline in the region's water resource carrying capacity. The decline in the water resource index in 2017 can be attributed to rapid population growth, accelerated urbanization, and reduced precipitation resulting from anomalous climatic conditions in particular areas. These factors negatively influenced key indicators such as the water yield modulus and per capita water resources to a certain extent. Nonetheless, on the whole, the water resource carrying capacity index for the region was predominantly within the 0.4 to 0.65 range, indicating that its water resource carrying capacity was generally in a good to excellent state for most of the period. This phenomenon clearly demonstrates the importance attached by the Chengdu-Chongqing region to local water resource management and the utilization of natural conditions in the process of regional agricultural development. In particular, statistical data reveal a marked annual increase in agricultural sewage treatment rates and the gradual optimization of agricultural water use planning. The implementation of these exemplary policies has significantly enhanced the overall water resource environment for regional agricultural development, thereby laying a solid material foundation for agricultural prosperity.
From the perspective of regional disparities across the 16 cities within the Chengdu-Chongqing region, it is striking that only Ya'an City attains an exemplary average water resource carrying capacity of 0.560, whereas over 60% of the municipalities—specifically the ten cities ranging from Ziyang to Mianyang as depicted in the figure—reside at a suboptimal level. This pronounced divergence vividly elucidates the substantial variations in natural endowments and anthropogenic influences across these diverse locales. To illuminate this phenomenon, a comparative analysis is undertaken, focusing on the extreme cases of Ziyang City, registering a capacity of 0.203, and Ya'an City, at 0.560. The investigation commences with an exploration of natural geographical conditions, revealing that Ya'an City is distinguished by its intricate topography and significant altitudinal fluctuations, conditions that foster the accumulation and preservation of water resources, thereby endowing the region with abundant hydrological reserves, further enhanced by a temperate climate exhibiting minimal seasonal variability. In contrast, Ziyang City features a relatively planar terrain, resulting in a sparser distribution of water resources, a scarcity compounded by greater climatic instability. Turning to anthropogenic factors, Ya'an City’s restrained pace of urbanization and modest industrialization mitigate the direct pressures on water resource management and allocation, whereas Ziyang City’s accelerated urban and industrial expansion, coupled with nascent water management frameworks and feeble pollution control capacities, exacerbate such burdens. Consequently, it is imperative for each municipality to meticulously assess its intrinsic natural resource conditions alongside the dynamics of human activities, proactively refining water resource management strategies to fully exploit latent hydrological potential, while optimizing agricultural irrigation techniques, abating regional water contamination, and ensuring the sustainable progression of local agriculture.
3.1.2. In-Depth Analysis of Obstacle Degree
To thoroughly investigate the factors influencing the fluctuations in water resource carrying capacity amidst the agricultural development trajectory of the Chengdu-Chongqing region, this study employed the obstacle degree model to conduct a quantitative analysis of the obstacle factors within three pertinent subsystems. Furthermore, acknowledging the spatio-temporal heterogeneity inherent in the water resource carrying capacity across this region, the analysis was meticulously delineated according to distinct study years and urban locales, thereby generating Figure 2 and Figure 3 to illustrate these findings.
As depicted in Figure 2, across the various years under investigation, the obstacle factor values of the three subsystems within the Chengdu-Chongqing region exhibit a propensity for convergence. Throughout most phases of the study, either the ecological environment system (denoted in purple) or the water society system (denoted in green) was identified as the predominant obstacle factor impeding water resource carrying capacity. However, in the exceptional year of 2022, the water resources system (denoted in blue) manifested a significantly augmented obstructive influence, emerging as the principal impediment.
To elucidate these dynamics, an in-depth analysis was conducted, initially focusing on the representative years of 2014 and 2020, which encapsulate broader trends across the majority of the studied period. In 2014, the hierarchy of obstacle degrees among the subsystems was discerned as follows: ecological environment system surpassing water society system, which in turn exceeded water resources system, reflecting conditions spanning from 2013 to 2018. During this interval, the ecological milieu of the Chengdu-Chongqing region was ensconced in a phase of rapid urbanization, wherein precipitous population growth, relentless urban expansion, and escalating industrialization precipitated a cascade of challenges that undermined ecological stability. This confluence of factors established the ecological environment system as the foremost obstacle in the study’s nascent stages, profoundly constraining the coordinated development of water resources and exerting indirect yet significant pressure on critical indicators such as agricultural water usage, thereby posing a formidable challenge to the region’s aspirations for high-quality agricultural advancement.
Shifting focus to 2020, emblematic of the period from 2019 to 2021, a meticulous analysis revealed a reordered obstacle degree: water society system prevailing over ecological environment system, followed by water resources system. Comparative evaluation with prior years underscores a pivotal transition wherein the water society system eclipsed the ecological environment system as the primary obstacle, a shift attributable to the local administration’s assiduous implementation of sustainable development policies—encompassing elevated agricultural sewage treatment rates, reduced fertilizer application, and judicious regional water allocation to curtail wastage—which collectively attenuated the ecological environment system’s obstructive potency, yielding a discernible downward trend in its influence. Yet, this amelioration was counterbalanced by an inexorable surge in population, intensifying social resource pressures that proved recalcitrant to effective mitigation, thereby amplifying the water society system’s obstructive role and rendering it the paramount concern warranting resolution during this epoch.
Lastly, 2022 was designated as a singular year for scrutiny, its causative factors subjected to profound analysis. The region endured severe repercussions from extreme heatwaves, resulting in a substantial reduction in utilizable water resources and precipitating a pronounced supply deficit that disrupted critical infrastructural operations, notably hydropower generation, with far-reaching implications for livelihoods. Consequently, the water resources system’s impediment intensified dramatically, its obstacle factor surging to a decadal pinnacle of 0.625. In summation, amidst the exigencies posed by such exceptional climatic vicissitudes, the Chengdu-Chongqing region must expeditiously recalibrate its policy framework to fortify its capacity to address the multifaceted water resource management challenges engendered by extreme temperature fluctuations, ensuring resilience and sustainability in its agricultural endeavors.
Figure 3 unveils the hierarchical arrangement of obstacle factors across the three water resource subsystems among 16 cities in the Chengdu-Chongqing region. Through direct observation, it is unmistakably apparent that, within the overall mean obstacle factor for the region, the water society system (green) occupies a predominant position. Furthermore, an overwhelming proportion—exceeding 85%—of these municipalities demonstrates a uniform ranking pattern: the water society system (green) surpasses the water resources system (blue), which in turn exceeds the ecological environment system (purple). Consequently, this investigation judiciously selects several representative cities for meticulous exploration. Initially, to probe the commonalities evident in this consistent ranking across the majority of cities, particular emphasis is placed on Chengdu and Chongqing, the pivotal core cities of the region. The analysis reveals that the most formidable obstacle challenge confronting this area resides within the water society system (green). As the pace of urbanization accelerates, the locus of industrial transformation progressively shifts toward tertiary industries and high-technology domains, precipitating a substantial migration of young and middle-aged labor from rural expanses to urban centers, thereby catalyzing rapid urban population growth. This demographic upheaval engenders a shortage of talent in critical roles, such as the management of urban and rural water resources, whilst simultaneously intensifying the pressures on population resource allocation. Given that water constitutes an indispensable resource for human survival, the attendant developmental pressures are correspondingly amplified. Synthesizing the foregoing analysis, it can be concluded that in the modernization trajectories of most municipalities within the Chengdu-Chongqing region, analogous strategic choices have precipitated a marked escalation in resistance to water social allocation, thereby establishing the water society system as a pivotal conundrum necessitating expeditious resolution within their developmental paradigms. Furthermore, the water resources system (blue) typically occupies the second tier in the hierarchical arrangement, a phenomenon attributable to the expansive geographical ambit of urban territories, which renders them susceptible to multifarious climatic vicissitudes, imposing pronounced constraints on total water resource availability owing to natural climatic exigencies. Nevertheless, through the implementation of measures such as the construction of hydraulic engineering projects, the managerial and reservatory capacities of water resources can be substantially enhanced.
To delve deeper into the influence of regional disparities on the obstacle effects across the three water resource subsystems, this investigation focuses on Ya’an City—a municipality distinguished by its pronounced regional characteristics—for meticulous scrutiny. The findings reveal that Ya’an’s ecological environment system (purple) exerts a more substantial obstacle effect compared to its water resources system (blue), a disparity plausibly linked to the nascent state of its urban operational infrastructure. Given that Ya’an’s economic developmental indices and urbanization infrastructure conspicuously lag behind those of its counterparts, its capacity to ameliorate industrial effluents and waste remains suboptimal. Concurrently, Ya’an’s abundant water resource endowments confer a distinctive advantage for the advancement of its water resource carrying capacity, positioning it as the municipality with the least obstructive factor (0.008) within the water resources system among the 16 cities, thereby engendering a divergent ranking. For such exceptional municipalities, there exists an urgent imperative to intensify the development and stewardship of local water resources, harnessing their unique natural advantages whilst collaborating with governmental authorities to vigorously implement a suite of water resource management strategies. Such efforts aim to mitigate the obstructive potency of the water society system, thereby fostering the exalted progression of water resource carrying capacity toward sustainable, high-quality development.
Synthesis of the analysis reveals that, to attain the sustainable stewardship and exalted advancement of water resources, it is incumbent upon each municipality within the Chengdu-Chongqing region to meticulously evaluate the developmental trajectories of the three subsystems: water society, water resources, and ecological environment. In response to the predominant impediment posed by the water society system, which occupies the foremost rank among these challenges, the region ought to proactively harness the macro-regulatory prowess of local administrations. This endeavor necessitates fortifying the establishment and refinement of the water resource governance framework, coupled with the judicious exploitation of natural endowments. Such initiatives are poised to underpin the enduring viability of water resources, whilst concurrently safeguarding the natural apportionment and resilience requisite for the exalted progression of regional agriculture, thereby laying a robust foundation for its sustainable, high-quality development.
3.2. Comprehensive Evaluation Index of Dual Systems
Leveraging an Evaluation Index Model for comprehensive assessment, this investigation meticulously quantified the agricultural quality index alongside the water resource carrying capacity index for the Chengdu-Chongqing region over the temporal expanse from 2013 to 2022, duly incorporating the spatio-temporal dynamics of regional agricultural development. The resultant indices were subsequently graphically depicted in Figure 4 and Figure 5, respectively, thereby facilitating a lucid and intuitive visual elucidation of the pertinent outcomes.
3.2.1. Analysis of Water Resources Carrying Capacity Index (WCI)
Upon scrutinizing the data illustrated in Figure 4, the Water Carrying Capacity Index (WCI) manifests a general trajectory of fluctuating augmentation across the preceding decade within the Chengdu-Chongqing region, thereby reflecting a commendable trend of progressively fortified water carrying capacity throughout this temporal span. Nevertheless, there persists a pronounced heterogeneity across diverse municipalities and distinct study intervals. Temporal analysis elucidates that in the years 2015, 2017, 2019, 2021, and 2022, the WCI experienced conspicuous diminutions, signaling episodic setbacks within an otherwise upward trend. Spatial scrutiny further reveals that regions such as Ya’an City, Leshan City, and Yibin City exhibit a WCI that is markedly superior to that of their counterparts, underscoring their hydrological preeminence. In contrast, municipalities including Zigong City, Ziyang City, and Suining City consistently languish at inferior ranks in WCI across the majority of the investigated periods. These disparities in indices vividly illuminate the salient spatio-temporal divergences inherent in water carrying capacity within the Chengdu-Chongqing region, thereby underscoring the imperative for a meticulous investigation across varied geographical domains and temporal frameworks. Such an endeavor is essential to comprehensively apprehend the differential ramifications of water carrying capacity indicators upon disparate cities, ultimately facilitating the formulation of bespoke policy prescriptions tailored to mitigate these inequities and foster sustainable water resource management.
This investigation focuses on Zigong City and Ziyang City, municipalities within the Chengdu-Chongqing region where the Water Resource Carrying Capacity Index (WCI) has exhibited a persistent state of underperformance, rendering them paradigmatic subjects for scrutiny. An analysis of the data reveals that over the past decade, the WCI values for these cities have predominantly resided within the 0.6 to 0.9 interval, with only occasional ascensions into the 0.9 to 1.2 range, indicative of sporadic amelioration amidst a broader trend of stagnation. Rigorous examination ascribes this phenomenon to the paucity of indigenous natural endowments and suboptimal water resource stewardship. Foremost among these impediments is water scarcity, which emerges as the principal catalyst for the diminished WCI in these urban locales. Situated within the Sichuan Basin—where precipitation is comparatively abundant—Zigong and Ziyang nonetheless contend with an uneven dispensation of surface water resources, a consequence of topographical and geological constraints. This hydrological disparity, compounded by the escalating exigencies of rapid urbanization, has precipitated a pronounced dissonance between supply and demand. Furthermore, in the realm of water resource governance and utilization, both cities grapple with acute contamination challenges. Their developmental trajectories are heavily tethered to agriculture and industry, engendering the prolific generation of pollutants from these sectors. This deluge of contaminants inflicts considerable detriment upon the ecological milieu, thereby attenuating the carrying capacity of water resources. Concomitantly, the ascendant developmental paradigm of the Chengdu-Chongqing Economic Circle has spurred a migration of erudite professionals from these municipalities to metropolitan hubs such as Chengdu and Chongqing, resulting in a dearth of indigenous expertise in water resource management. The interplay of these multifarious factors culminates in the suboptimal performance of water resource carrying capacity within a select cohort of cities, epitomized by Zigong and Ziyang, underscoring the necessity for tailored strategies to redress these intertwined natural and anthropogenic challenges.
To delve deeper into the explication of the multifaceted fluctuations and undulations of the Water Carrying Capacity Index (WCI) over the past decade within the Chengdu-Chongqing region, particularly within its temporal continuum, this study undertakes a scrupulous dissection from three distinct yet interwoven dimensions. Firstly, from the vantage point of local policy vicissitudes, their recalibrations and enactments emerge as pivotal determinants shaping the augmentation of WCI. For instance, in 2015, the region, in a proactive response to China’s modernization imperatives, expedited the transformation and industrialization of local enterprises, thereby exerting substantial demand pressures on water resources across diverse municipalities. Concurrently, policy adjustments concerning resource allocation in certain locales were circumscribed by prevailing urbanization thresholds and economic exigencies, rendering their prompt implementation and execution arduous, with the efficacy of select measures necessitating further refinement to bolster their impact. Secondly, the paucity of optimization in water resource stewardship constitutes another cardinal factor impeding the sustained enhancement of water carrying capacity. Exemplifying this, the extreme climatic episode of 2022 saw a majority of cities falter in effecting timely and efficacious adjustments, thereby permitting climate change to inflict a profound perturbation upon water resource management and utilization. Similarly, in 2017 and 2019, recurrent deluges imposed immense drainage burdens on regions with suboptimal regulatory capacities, culminating in considerable detriment to their water resource governance frameworks. Thirdly, the Water Carrying Capacity Index (WCI) is inextricably intertwined with the aggregate water resources, its oscillatory patterns frequently consonant with the incidence of extreme climatic phenomena, thereby profoundly influencing the stability of the total water resource reservoir. A retrospective scrutiny of historical data unveils that in years marked by pronounced volatility, climatic variability played a decisive role, a phenomenon that unequivocally affirms the paramount significance of climate change in the custodianship of natural resources. Collectively, these dimensions illuminate the intricate interplay of policy, management, and environmental forces shaping WCI, underscoring the imperative for nuanced strategies to fortify water resource resilience in this dynamic region.
Comprehensive analysis reveals that the water resource carrying capacity within the Chengdu-Chongqing region exhibits an overall trajectory of enhancement. Nevertheless, attention must still be paid to the potential impacts of regional disparities, climate change, and policy implementation on water resource carrying capacity.
3.2.2. Analysis of Agricultural Quality Index (AQI)
As depicted in Figure 5, in contrast to the fluctuations observed in the Water Carrying Capacity Index (WCI) delineated earlier, the Agricultural Quality Index (AQI) within the Chengdu-Chongqing region exhibits a markedly consistent upward trajectory over the past decade, underscoring a pronounced enhancement in agricultural development. This trend is accompanied by salient spatial heterogeneity and modest temporal oscillations across its municipalities. Throughout the evolution of the Chengdu-Chongqing Economic Circle, Chongqing and Chengdu have steadfastly served as linchpin cities, exerting a radiating influence upon their peripheral counterparts, with their AQI values by 2019 having significantly outpaced those of other urban centers, attaining an exemplary development index of 1.5. Notably, over 55% of the region’s cities have, by 2022, achieved AQI growth exceeding 100% relative to 2013, a testament to the substantial strides made in regional agricultural advancement. Even municipalities such as Guang’an and Neijiang, which have historically languished at comparatively inferior levels, have demonstrated commendable progress, with their index values rising by an average of 0.5 and ascending to a commendable 1.2 by the close of 2022.
In light of these findings, to elucidate the intrinsic mechanisms underpinning the rapid elevation of agricultural development quality in the Chengdu-Chongqing region and to furnish meticulously tailored policy recommendations for other municipalities aspiring to achieve exalted agricultural development, this study shall undertake a rigorous spatiotemporal analysis of the region’s agricultural indicators and their contextual backdrop, thereby fully manifesting its profound academic significance.
From a temporal perspective, the Agricultural Quality Index (AQI) in the Chengdu-Chongqing region exhibits a notable overall upward trajectory, signifying a robust trend of progressive enhancement in agricultural quality since 2013. Empirical observations reveal that over 85% of the region’s municipalities have demonstrated a consistent annual increment in AQI across this temporal continuum, with the period spanning 2018 to 2020 witnessing particularly pronounced growth, averaging an impressive 24% increase. Although minor diminutions in AQI were discerned in certain intervals prior to 2016, this downward tendency has been entirely obviated thereafter, thereby ensuring the sustained elevation and regional synergy in the quality of agricultural development. The remarkable ascent in the region’s agricultural domain can be attributed to its steadfast prioritization of agrarian advancement, manifested through a suite of strategic interventions. These encompass the formulation of agriculture-centric policies, the incentivization of regional agricultural innovation, augmented resource allocations, and the adoption of internationally advanced management techniques. Quantitative indicators substantiate that the judicious execution of these policies has stabilized the agricultural output value index within a commendable range of 1.03 to 1.05. Furthermore, cities where agriculture constitutes the principal industry have realized incremental gains in grain production, paralleled by a marked enhancement in the employment enthusiasm of agricultural practitioners and the continuous optimization of their social security frameworks. These measures collectively serve as the bedrock of agricultural progress and the impetus for the region’s comprehensive high-quality AQI advancement. Concurrently, the pervasive urbanization has precipitated a significant amelioration in rural living standards, evidenced by a substantial augmentation of disposable income among rural denizens and a transformative elevation in agricultural mechanization—from antiquated implements to large-scale, modern apparatus. Moreover, judicious management strategies and equitable resource apportionment have emerged as sustained catalysts for high-quality agricultural development. For instance, adequate water resource allocation ensures the stable fulfillment of agrarian water demands, while efficient automated management markedly enhances operational productivity. The synergistic interplay of these multifaceted factors has positioned the Chengdu-Chongqing region—a vast inland economic nexus harboring a population exceeding 100 million—to exhibit immense potential and promising prospects for agricultural ascendancy.
Indubitably, the nascent phases of agricultural advancement within the Chengdu-Chongqing region were beset by a multitude of challenges. To illustrate, in the year 2014, certain municipalities within the region grappled with developmental discord between Leshan and Dazhou, precipitated by antiquated agricultural implements and vacillations in arable land extent, culminating in a decrement of approximately 0.03 in the Agricultural Quality Index (AQI). Nonetheless, throughout the ensuing developmental trajectory, these impediments were efficaciously addressed and mitigated, thereby facilitating a progressive enhancement in the caliber of agricultural development. The findings of this investigation unequivocally elucidate that the Chengdu-Chongqing region, characterized by its substantial populace and intricate topographical features as an inland economic nexus, has attained remarkable triumphs in regional agricultural advancement, principally attributable to the macro-regulatory frameworks of indigenous policies, judicious resource apportionment, and the pervasive dissemination of agricultural technologies. These experiential insights furnish a developmental paradigm of considerable referential import for other municipalities wherein agriculture constitutes a pivotal industrial sector, offering a model worthy of emulation to bolster their agrarian aspirations.
From the perspective of spatial heterogeneity, the cities within the Chengdu-Chongqing region exhibit pronounced variations in urban scale, population size, levels of modernization, policy implementation, and industrial focus. This phenomenon underscores significant research value for exploring the commonalities and disparities in agricultural development across the 16 cities in the region, offering a robust foundation for optimizing and reforming agricultural practices. In this study, Chongqing City and Chengdu City are selected as exemplary cases for in-depth analysis of agricultural development. The findings reveal that both cities share salient characteristics: they are endowed with superior natural resource bases and robust foundations for modernized agriculture. Notably, their substantial population scales and well-developed transportation networks effectively mitigate the inherent challenges faced by inland cities in agricultural trade, thereby fostering abundant opportunities for agricultural advancement within the Chengdu-Chongqing economic circle and catalyzing collective prosperity for both themselves and their neighboring cities. In particular, Chongqing, with its highly developed water transport infrastructure, emerges as a preeminent leader among the 16 cities, a conclusion substantiated by quantitative indicators such as per capita road area. As core hubs of economic development, these two cities exemplify their potential as trailblazers. They not only extensively translate cutting-edge technological innovations into agricultural applications but also pioneer the development of advanced agricultural machinery and establish comprehensive irrigation systems. Furthermore, the implementation of wide-ranging adjustable temperature-control technologies and other progressive measures has significantly propelled the flourishing of urban agriculture in these cities.
In response to the relatively lagging Quantitative Agricultural Index (QAI) scores observed in Guang’an City and Neijiang City, this study proposes targeted recommendations for improvement. Given that these cities lack the pronounced natural resource endowments found in regions such as Ya’an City and face considerable constraints in transportation infrastructure and modernized equipment, enhancements should focus on optimizing resource allocation and refining policy frameworks. Specifically, in light of Guang’an City’s limited water resource availability, the adoption of advanced water management technologies and high-efficiency irrigation systems is recommended to enhance water use efficiency. Conversely, to address the shortage of skilled agricultural talent in Neijiang City, policy adjustments are advised to incentivize younger generations to engage in agriculture. This could be achieved by improving welfare benefits and salary structures to create additional agricultural employment opportunities, thereby encouraging the return of young and able-bodied labor to rural areas. By drawing on the experiences of cities with exemplary agricultural development, these measures can accelerate agricultural progress in select regions, ultimately fostering sustainable and high-quality agricultural development across the Chengdu-Chongqing region and other inland cities.
3.3. Spatial Trend Analysis of Water Resources Carrying Capacity and Agricultural Quality Index
To precisely elucidate the spatial evolutionary trends of agricultural development quality and water carrying capacity in the Chengdu-Chongqing region, this study integrates Geographic Information System (GIS) technology with the standard deviational ellipse model. This approach facilitated the creation of four elliptical distribution maps depicting the Agricultural Quality Index (QAI) and Water Carrying Capacity Index (WCI) for odd and even years, alongside maps illustrating their centroid migration trajectories. The results are presented in Table 2 and Figure 6, Figure 7, Figure 8 and Figure 9.
Based on the comprehensive analysis of data provided in Table 2, Figure 6 and Figure 7, the study results indicate that from 2013 to 2022, the centroid of the Water Carrying Capacity Index (WCI) consistently remained within the territory of Ziyang City, located in the central-western part of the Chengdu-Chongqing region. The high similarity in the positions of the elliptical centroids underscores the pronounced overall developmental coherence of the Chengdu-Chongqing region. Although certain positional differences in the centroid were observed across the time series, these variations had a relatively minor impact on overall development. The azimuth angle fluctuated within a narrow range of 67.03° to 71.23°, exhibiting minimal variation, which reflects the stability of the region's water resource development trajectory, accompanied by a slight northeastward shift. During this period, the area of the ellipse increased fluctuantly from 87902.18 km² to 93051.38 km², indicating an expanding trend in the spatial influence range of the WCI in the Chengdu-Chongqing region. This expansion signifies a broader spatial impact of the index, reflecting a coordinated development orientation for water resources. Observations of the ellipse's major and minor axes reveal that the major axis length rose from 207.61 km in 2013 to 217.90 km in 2022, while the minor axis length increased from 70.33 km in 2013 to 70.65 km in 2022, though both exhibited notable fluctuations throughout the development process. According to the directional indications of the illustrated ellipses, the WCI in the Chengdu-Chongqing region demonstrates more pronounced spatial heterogeneity in the northeast-southwest direction, followed by spatial variation characteristics in the northwest-southeast direction. Furthermore, the overall spatial distribution clustering of the index shows a weakening trend.
From the perspective of the Chengdu-Chongqing region’s holistic development, the observed trend of diminishing spatial clustering is conducive to mitigating excessive regional disparities among cities, thereby fostering enhanced regional coordination and synergy. Concurrently, this trend promotes a more rational flow and allocation of natural resources. Given the region’s expansive geographic conditions, this trajectory is poised to further ameliorate localized developmental imbalances, particularly in economically lagging cities such as Ya’an and Guang’an, by addressing their developmental deficits. A nuanced analysis of the developmental dynamics of Chengdu and Chongqing—the core cities of the economic circle—reveals that these metropolises, while advancing their own growth, steadfastly adhere to the principles of sustainable development. By resolutely implementing policies that enable “the affluent to uplift the less prosperous,” they facilitate resource augmentation in other cities, consistently generating employment opportunities and developmental prospects for surrounding areas. Moreover, as exemplars of a dual-city economic circle, Chengdu and Chongqing have effectively steered the transition from inefficient traditional industries to emerging sectors throughout their historical development, thereby reducing excessive reliance on local natural resources and alleviating water resource demand pressures amid rapid urbanization. These measures ensure that, in the course of modernization, pronounced regional disparities do not exacerbate inequitable resource allocation or widen developmental gaps. Notably, following the implementation of water resource protection policies, local residents have consciously integrated resource conservation into their daily practices, enhancing the region’s adaptive capacity to natural changes. Collectively, these factors have significantly contributed to diminishing disparities in regional water resource development, thereby fostering the establishment of an integrated economic development model for the Chengdu-Chongqing region.
Analysis of the data from Table 2, Figure 8 and Figure 9 reveals that from 2013 to 2022, the centroid of the standard deviational ellipse for the Agricultural Development Quality Index (AQI) in the Chengdu-Chongqing region was situated in the northern part of Ziyang City, exhibiting a southward migration trend. This phenomenon underscores a subtle shift in the core of agricultural development quality, driven notably by the progressive enhancement of agricultural development quality in regions such as Zigong and Luzhou. Examination of the ellipse’s directional changes indicates that the major axis length fluctuated downward from 214.04 km in 2013 to 208.72 km in 2022, while the minor axis length exhibited a fluctuating increase from 134.68 km to 139.86 km, reflecting pronounced differential trends. The study finds that the dispersion of AQI in the northeast-southwest direction generally declined, whereas dispersion in the northwest-southeast direction increased significantly. Concurrently, the elliptical area rose marginally from 90556.09 km² in 2013 to 91702.63 km² in 2022, suggesting a slight improvement in the balanced development of agricultural development in the Chengdu-Chongqing region, albeit constrained by developmental disparities among cities in the northeast-southwest axis. These findings elucidate that, despite significant progress in agricultural development quality over the past decade, regional disparities persist as limiting factors. Notably, the suboptimal industrial structures in certain cities hinder the effective market circulation of high-quality agricultural products, precipitating deleterious competition that adversely impacts the region’s overall balanced development. Furthermore, variations in the enforcement intensity of the “Grain for Green” policy among local governments have led to reductions in effective arable land, exacerbating inter-city agricultural development imbalances. Targeted optimization addressing these deficiencies and latent challenges could significantly elevate the balanced coordination and quality of agricultural development in the Chengdu-Chongqing region.
During the research process, it was observed that the azimuth angle remained within a stable range of 70.88° to 72.25°. In contrast to the aforementioned fluctuations in the WCI, the evolution of the AQI demonstrated greater stability and a lower tendency toward deviation. This phenomenon can be attributed to the favorable agroecological conditions and pronounced agricultural complementarity between the Chengdu-Chongqing region.
From a resource-based perspective, although the region has experienced rapid urbanization, it still retains approximately 7.27 million hectares of high-quality arable land—accounting for 5.7% of the nation’s total cultivated area. Within Southwest China, this area possesses the most advantageous agricultural production conditions and is characterized by large-scale contiguous farmland, providing an exceptional foundation for agricultural development. Furthermore, to maximize the potential of its agricultural resources, the region has implemented a high multiple cropping index, adopting a tri-seasonal farming system that includes summer, autumn, and late-autumn harvests. This system ensures that annual grain output consistently exceeds 80 million tons. The stability of this cultivation model, underpinned by rich natural endowments, guarantees the continuity and resilience of agricultural production, effectively mitigating the impacts of seasonal or interannual fluctuations.
From the perspective of agricultural complementarity, the Chengdu-Chongqing region adheres to a principle of cooperation over competition. While some degree of competitive dynamics exists, the similarity in climatic conditions and close geographical proximity between the two areas have facilitated collaborative development. Notable examples include the co-construction of industrial zones such as the upper Yangtze citrus belt and the Longchang pig farming base. These initiatives have enabled the integration and optimal allocation of regional resources, thereby enhancing sectoral strengths while compensating for developmental shortcomings. Such strategic coordination reduces potential instabilities that could arise from internal competition.
Moreover, the region has established a robust agricultural market framework for the integration of resources across Southwest China, providing a strong platform for the distribution of agricultural products. These collective advantages have significantly contributed to the spatial stability of AQI development within the Chengdu-Chongqing region and offer a replicable model for other regions aiming to foster stable agricultural growth.
3.4. Analysis of Spatial Disparity Coefficients
To further explore the spatial differences between the quality of regional agricultural development and water resources carrying capacity, and accurately propose better governance solutions for their spatial coordinated development, Figure 10 was drawn and deeply investigated based on the AQI ellipse and WCI ellipse in the Chengdu-Chongqing region from 2013 to 2022 and their spatial disparity coefficients (sCoV).
Based on the graphical data analysis, the spatial coefficient of variation (sCoV) of agricultural development quality and water resource carrying capacity in the Chengdu-Chongqing region exhibited fluctuating characteristics from 2013 to 2022. During the initial phase of the study period (2013–2016), the sCoV displayed an overall upward trend, indicating increasing spatial disparities in the distribution of agricultural development quality and water resource carrying capacity. However, beginning in 2016, this trend reversed and shifted toward a general decline—excluding the year 2018—suggesting a gradual reduction in spatial heterogeneity and an improvement in the spatial-temporal coordination between the two variables. This trend reveals that the spatial distribution disparities between agricultural development quality and water resource carrying capacity in the Chengdu-Chongqing region are undergoing a dynamic adjustment process. Despite notable fluctuations, the overall trajectory reflects a favorable trend toward coordinated development, with the capacity for responsive adaptation over time.
From a temporal perspective, the divergence in developmental patterns between the early and later phases of the study can be primarily attributed to two key factors: variations in industrial development models and spatial planning, and the differential impacts of region-specific policies affecting coordination and management efficiency. In the early stages of the study period, imbalances in economic development and industrial spatial layout led to uneven resource allocation across cities. The progression of industrialization and urbanization in some areas exerted pressure on agricultural resource availability, thereby amplifying regional disparities. Furthermore, shortcomings in the planning and utilization of agricultural resources exacerbated these issues. Policy implementation also demonstrated marked regional variation; for example, the spatial disparity in agricultural water usage across different areas could reach as much as 2.5 billion cubic meters, while differences in the proportion of primary industry output could vary by up to 15%. These compounded factors contributed to an accumulation of spatial-temporal disparities, ultimately driving the observed upward trend in sCoV during the early stages of the period analyzed.
Since 2016, the Chinese central government has promulgated a series of policies aimed at fostering the coordinated development of regional agricultural quality and water resource management. These policies have significantly advanced the implementation of regional collaborative development strategies, facilitating the rational allocation of resources and production factors. Specifically, the transformation of regional agricultural development models, enhanced industrial synergies, and strengthened water resource management and allocation have been prominently manifested. Firstly, the construction of cross-regional water conservancy projects has optimized water resource distribution, effectively alleviating prior issues of uneven allocation. Subsequently, regions have actively leveraged their comparative advantages in modern agriculture by conducting in-depth analyses of their agricultural development status and resource endowments, while intensifying cross-regional resource cooperation. For instance, the promotion of innovative development models—such as the Chengdu-Chongqing water resource management network and the mutual agricultural product market—has further narrowed inter-regional disparities in agricultural quality. These initiatives have also promoted efficient and balanced water resource utilization, ultimately contributing to the reduction of the spatial coefficient of variation (sCoV). The causes of developmental imbalances observed in 2018 can primarily be attributed to the large-scale phasing out of inefficient agricultural machinery, coupled with policy-driven adjustments affecting the extent and proportion of effective arable land. These factors exerted a notable influence on the spatial disparities in regional agricultural development. However, from a long-term perspective, these measures have proven instrumental in enabling the Chengdu-Chongqing region to establish a novel automated agricultural framework. Moreover, they have contributed to mitigating land-use conflicts between industrialization and agricultural development, laying a robust foundation for the coordinated progress observed post-2018.
A detailed analysis of the elliptical area of the study subjects reveals that the standard deviation elliptical area of the Agricultural Quality Index (AQI) remained relatively stable between 2013 and 2022, consistently hovering around 90,000 units with minimal fluctuations. This finding indicates a high degree of stability in the spatial dispersion of the AQI across the study period, with no significant shifts in the spatial distribution pattern of regional agricultural quality, nor any pronounced trends toward concentration or dispersion. In contrast, the standard deviation elliptical area of the Water Resource Carrying Capacity Index (WCI) exhibited a degree of variability over the same period. Overall, a slight upward trend was observed, suggesting an increase in the spatial dispersion of the WCI. This indicates that the spatial distribution of water resource carrying capacity underwent dynamic adjustments, with relatively active changes in its dispersion pattern. Consequently, targeted policy interventions could address these disparities, such as reallocating surplus water resources to water-deficient areas to meet their demands. Proactively addressing the dynamic variability of water resources not only enhances the overall water resource supply framework in the Chengdu-Chongqing region but also strengthens the adaptability of regional agricultural development to climate change.
3.5. Grey Prediction Analysis
Building upon the foregoing research, this study aims to conduct a predictive analysis of future developmental trends in the Chengdu-Chongqing region and its core cities within the Twin-City Economic Circle (Chengdu and Chongqing). The objective is to comprehensively elucidate the trajectory of agricultural development in this region, thereby providing risk assessments and evidence-based recommendations for medium- and short-term governance strategies. Given the rigor required in this study, it is noted that water resource carrying capacity is highly susceptible to the influences of climate change. In the absence of precise future climate data, the accuracy of predictive models for water resource carrying capacity is limited. Consequently, this study focuses exclusively on forecasting the Agricultural Quality Index (AQI). A grey prediction model was employed for the calculations, with the results visually presented in Figure 11 for intuitive interpretation.
Analysis of Figure 11 reveals that the Quality of Agricultural Development Index (QAI) across all three sub-regions exhibits a robust upward trend, reflecting a progressive enhancement in agricultural quality. This trend underscores the role of regional collaborative development in facilitating the integration and optimal allocation of agricultural resources, thereby fostering improvements in agricultural quality. The upward trajectory observed during the forecast period further indicates that the current developmental dynamics in the Chengdu-Chongqing region are conducive to elevating regional agricultural development levels, offering substantial reference value. In conjunction with the findings from prior sections, other inland cities may draw upon the following three strategies to effect meaningful improvements in agricultural development: (1) leveraging local policies as a catalyst to optimize and refine modern agricultural systems, (2) actively promoting the development of agricultural resource networks, and (3) enhancing resource circulation and connectivity.
Firstly, from a policy perspective, the Chengdu-Chongqing region has capitalized on lessons learned from earlier developmental shortcomings, gaining a comprehensive understanding of local resource endowments and modernization requirements. By adopting tailored, multifaceted policy measures, the region has effectively advanced agricultural development. For instance, Chengdu’s “Three Supports and One Assistance” initiative has incentivized young professionals to return to rural areas for employment, while Chongqing’s measures to curb industrial land expansion to protect high-quality arable land have yielded significant results. These policies have markedly invigorated local communities’ enthusiasm for engaging in agricultural activities. Secondly, amidst the backdrop of economic globalization, advanced technologies have become widely disseminated, including a range of sophisticated agricultural management and cultivation systems. The Chengdu-Chongqing region has proactively embraced these advancements by extensively adopting and independently developing modern agricultural machinery. This has facilitated the phased replacement of outdated equipment, leading to year-on-year improvements in mechanization levels. Concurrently, enhanced management of agricultural resources—particularly in the domains of water resource management and development—has been achieved, further bolstering agricultural productivity. Lastly, to ensure the sustainability of regional agriculture, transportation infrastructure and resource sharing constitute critical governance priorities for the Chengdu-Chongqing region. Since 2013, per capita road infrastructure in most cities within the region has exhibited a consistent upward trend, with the highest growth rate reaching a remarkable 17%. This development has significantly enhanced the inter-regional circulation of agricultural resources and enabled more efficient transportation networks for high-quality agricultural products.
The synergistic impact of these factors underpins the ability of the Chengdu-Chongqing region and its core cities to achieve high-quality regional agricultural development. Moreover, these experiences offer valuable insights for other inland cities worldwide seeking to enhance their regional agricultural governance frameworks.
Forecasts based on comparative analysis of the Quality of Agricultural Development Index (QAI) indicate that by 2026, the overall QAI for the Chengdu-Chongqing region is projected to reach 2.0, with Chongqing City expected to attain a QAI of 3.0. These projections underscore the pivotal role of the region’s core cities—Chengdu and Chongqing—in driving agricultural advancement, with Chongqing emerging as the predominant leader. Notably, Chongqing’s QAI consistently surpasses the regional average, reflecting its superior agricultural development trajectory.
From an environmental perspective, Chongqing’s geographical and climatic advantages significantly bolster its agricultural prowess. Situated in a subtropical monsoon humid climate zone, the city benefits from abundant water and thermal resources, complemented by diverse topography. These conditions create an optimal milieu for cultivating a wide array of crops and fostering specialized agricultural sectors. Furthermore, Chongqing’s abundant water resources provide a robust foundation for irrigation and fishery industries, underpinning the material basis for agricultural productivity. At the policy level, the municipal government has proactively implemented a suite of supportive measures, including subsidies and tax incentives, to invigorate agricultural stakeholders. Sustained investments in agricultural infrastructure and technological research and dissemination further amplify these efforts. In terms of industrial development, Chongqing’s signature agricultural sectors—such as mustard tuber, citrus, and pig farming—demonstrate pronounced advantages in scale and brand recognition. Concurrently, the city has actively pursued deep integration of agriculture with secondary and tertiary industries, significantly enhancing the multifunctionality and value-added potential of its agricultural sector. In the realms of technology and human capital, Chongqing has prioritized the adoption of advanced agricultural technologies, markedly improving the precision and efficiency of production processes. Additionally, the city has invested heavily in cultivating and attracting agricultural talent through strategic partnerships with higher education institutions and research organizations, infusing the sector with substantial intellectual capital. The synergistic interplay of these factors has positioned Chongqing as a frontrunner in agricultural development within the Chengdu-Chongqing region.
In contrast, Chengdu’s industrial structure is more heavily weighted toward the tertiary sector, with a significantly higher proportion of economic activity in services compared to Chongqing. Moreover, Chengdu’s less developed water transport infrastructure imposes constraints on its agricultural growth, resulting in a slower pace of agricultural development relative to Chongqing. Nevertheless, when viewed holistically, the Chengdu-Chongqing region functions as a cohesive economic circle, wherein the complementary dynamics between these two core cities foster agricultural progress in surrounding areas. This mutual reinforcement facilitates resource allocation and optimization in less developed regions, constituting a critical driver of the region’s promising growth trajectory in the coming years.
4. Discussion
4.1. Model Development and Application Effects
This study examines the spatiotemporal characteristics and interactive mechanisms of agricultural development quality and water resource carrying capacity in the Chengdu-Chongqing region. By constructing a multidimensional evaluation framework and quantitative analytical models, it elucidates the dynamic interplay and heterogeneous patterns of these factors in regional development, offering novel insights into the coordinated advancement of agriculture and water resources within inland economic circles.
The analysis reveals that, from 2013 to 2022, the Water Resource Carrying Capacity (WCI) in the Chengdu-Chongqing region exhibited a fluctuating upward trend, driven primarily by natural endowments, policy interventions, and climate change. Spatial disparities were particularly pronounced: the Ya’an region, benefiting from abundant water resources and lower industrial pressures, consistently maintained a WCI level of 0.56. In contrast, Zigong and Ziyang faced constraints due to topographic limitations, supply-demand imbalances, and lagging management practices, resulting in deficient water resource carrying capacities. Barrier degree analysis indicates that, between 2013 and 2016, the ecological environment system was the primary limiting factor, exacerbated by pressures from urbanization. Post-2019, the water-society system emerged as the dominant constraint, driven by population growth and resource allocation challenges. By 2022, extreme heat events significantly escalated the barrier degree of the water resource system, underscoring the growing threat of climate change to water resource security. These findings highlight the urgent need to strengthen regional water resource management and enhance coordinated strategies within the economic circle to bolster systemic resilience to climate variability.
The Agricultural Quality Index (AQI) in the Chengdu-Chongqing region demonstrated a steady overall increase, though spatial heterogeneity remained significant. Chongqing and Chengdu, leveraging their abundant hydrothermal resources, robust policy support, and advantages in industrial integration (e.g., mustard tuber and citrus industry chains), consistently maintained leading AQI positions, exerting a radiating effect on surrounding areas. In contrast, Guang’an and Neijiang lagged behind due to resource scarcity, inadequate infrastructure, and talent drain. The implementation of the Chengdu-Chongqing Twin-City Economic Circle strategy in 2016 facilitated resource integration and technology sharing, reducing the dispersion of AQI and amplifying the efficacy of the “core-periphery” model. However, localized fluctuations in 2018, triggered by the phase-out of traditional agricultural machinery and adjustments in arable land policies, underscore the importance of policy coherence during industrial transitions.
Through the analysis of the spatial coefficient of variation (sCoV) and standard deviation ellipse, this study elucidates that, from 2013 to 2016, the uneven allocation of resources during the early stages of industrialization amplified disparities between the water resource carrying capacity (WCI) and agricultural quality index (AQI) systems. However, commencing in 2016, the construction of cross-regional water conservancy projects and the development of industrial belts—such as the Upper Yangtze Citrus Industrial Belt—facilitated a reduction in these disparities. A transient increase in sCoV in 2018 reflects the compounded influence of climatic factors and industrial adjustments. The spatial patterns of both systems exhibit a distinctive configuration characterized by "westward concentration and extension from northeast to southwest," aligning closely with the "dual-core driven" regional planning framework. Nevertheless, the spatial dispersion of WCI surpasses that of AQI, underscoring the need for enhanced cross-regional coordination in water resource management to address this heterogeneity.
In conclusion, achieving coordinated development between the environmental quality composite index (WCI) and the agricultural quality index (AQI) in the Chengdu-Chongqing region necessitates tailored strategies to address stage-specific barriers. Leveraging the radiating effects of core cities—Chengdu and Chongqing—can optimize resource allocation efficiency. Concurrently, the synergistic implementation of cross-regional policies is imperative to mitigate challenges posed by climate change and industrial transitions. The experiences of the Chengdu-Chongqing region in harmonizing environmental and economic development offer valuable insights for the sustainable advancement of other inland economic circles.
4.2. Comparative Analysis
In the realm of regional agricultural development and water resource management, existing studies predominantly focus on single-factor assessments or simplistic correlation analyses, with notable deficiencies in dynamically tracking the coupling mechanisms of complex systems and parsing spatial heterogeneity. This study achieves significant progress by constructing a more comprehensive evaluation framework and conducting multifaceted, in-depth analyses, yielding advancements in the following areas.
Addressing the limitations of current research, which often overlooks the intricate interplay within complex systems, this study diverges from the prevalent focus among Chinese scholars on the interaction between economic benefits [31] and environmental factors [32]. Such studies typically analyze agricultural development through isolated lenses—such as environmental planning, climate change, or socioeconomic development—while neglecting the complex interaction mechanisms within the "farm-water" system. By employing an integrated suite of multidimensional models, this research systematically examines the influences of geographical disparities, human activities, policy dynamics, natural environmental conditions, and societal developmental demands on the agricultural quality in the Chengdu-Chongqing region. This approach markedly transcends the constraints of traditional single-dimensional analyses. Furthermore, in comparison to international scholarship, this study distinguishes itself from the tendencies of American researchers, who primarily explore ecological degradation resulting from singular environmental dimensions [33], and German scholars, who focus narrowly on water scarcity constraints arising from low-end drought events [34]. These studies often lack in-depth exploration of the specific impacts of such events on agriculture. In contrast, this research develops a comprehensive Agricultural Quality Index (AQI) framework encompassing four dimensions—economic, demographic, spatial, and social. This multidimensional system enables a thorough examination of the specific constraints imposed by water scarcity on agriculture, as well as the detrimental effects of declining ecological conditions on sustainable development, thereby offering a more holistic perspective.
Contemporary academic research on the spatial relationships between agricultural development and water resources predominantly focuses on static descriptions [66], with insufficient exploration of the dynamic evolutionary processes underlying the "core-periphery" structure. By employing the standard deviation ellipse centroid migration analysis, this study reveals that the spatial distribution patterns of the Agricultural Quality Index (AQI) and Water Resource Carrying Capacity (WCI) exhibit a trend of "westward concentration and extension from northeast to southwest." This pattern aligns closely with the "dual-core driven" spatial planning strategy of the Chengdu-Chongqing Twin-City Economic Circle. These findings transcend the limitations of traditional studies in evaluating policy effects, providing robust empirical support for regional coordinated governance.
Current optimization strategies primarily emphasize water-saving technologies [41] or water pricing reforms [42]. However, differentiated solution pathways grounded in systemic diagnostics remain underdeveloped. Building on barrier degree analysis and spatial heterogeneity studies, this research proposes three targeted strategies to address these gaps. First, to mitigate the sharp increase in the barrier degree of the water resource system under extreme climatic conditions, the development of intelligent irrigation networks and basin-wide coordinated allocation mechanisms is recommended. These should draw on advanced water conservancy engineering practices to optimize the spatial distribution of water resources. Second, leveraging the technological and industrial advantages of developed cities such as Chongqing and Chengdu, the establishment of cross-regional specialty industry clusters—such as agricultural product industrial belts and livestock breeding bases—is proposed to narrow disparities in lagging regions. Third, to address the elevated barrier degrees in the ecological environment system observed in certain areas during earlier periods, the promotion of drought-resistant crop varieties and ecological protection policies is advocated to enhance agriculture’s resilience to climate change.
These strategies depart from the conventional approach of addressing agricultural challenges solely from a water resource perspective. Instead, they construct a comprehensive logical framework encompassing problem identification, mechanism analysis, and solution pathway development, thereby fostering a holistic approach to regional agricultural and water resource governance.
4.3. Research Limitations
Despite employing advanced quantitative techniques—such as the TOPSIS model, standard deviation ellipse analysis, spatial coefficient of variation (sCoV), and grey prediction modeling—to investigate the interactive mechanisms between agricultural development quality and water resource carrying capacity in the Chengdu-Chongqing region, and partially addressing the shortcomings of traditional studies in exploring spatiotemporal characteristics and underlying mechanisms, this research is not without limitations.
Firstly, the study primarily relies on statistical data from the past decade for its calculations and predictive analyses, without deeply exploring variables such as climatic factors. Prior findings indicate that climate change exerts a significant influence on the water resource carrying capacity (WCI) in the Chengdu-Chongqing region. Consequently, future research that incorporates and refines the analysis of climate-related impacts on water resources would enhance the accuracy of developmental risk forecasts, thereby fostering more coordinated agricultural advancement.
Secondly, although this study thoroughly examines the spatiotemporal characteristics of the study area, the region’s large population and vast geographical expanse pose challenges in conducting exhaustive analyses of the influencing factors and mechanisms behind every outlier. Therefore, subsequent studies should expand the scope of investigation, integrating a broader array of indicator data to probe deeper into the disparities driven by policy, natural, and societal factors.
Lastly, while this study leverages a suite of multivariate models for comprehensive analysis, there may exist more advanced or suitable data models that were not employed. As research continues to evolve, it is imperative to explore and adopt additional high-quality models to enhance the comprehensiveness and precision of the findings.
5. Conclusions
This study systematically analyzes the spatiotemporal characteristics and interactive mechanisms of agricultural development quality and water resource carrying capacity in the Chengdu-Chongqing region from 2013 to 2022, aiming to elucidate the core contradictions and optimization pathways for regional coordinated development. The findings reveal that the Agricultural Quality Index (AQI) exhibits a consistent upward trajectory, with regional synergistic effects becoming increasingly evident. However, pronounced spatial heterogeneity persists. Leveraging their natural endowments, policy support, and advantages in industrial integration, Chongqing and Chengdu have emerged as developmental poles, while other cities face bottlenecks due to water resource shortages, talent drain, and related challenges. Although the Water Resource Carrying Capacity (WCI) demonstrates an overall fluctuating upward trend, extreme climatic events and accelerating urbanization have exacerbated spatiotemporal disparities, highlighting a critical mismatch between agricultural development and water resource availability.
To address these challenges, this study proposes a suite of multidimensional strategies, including: (1) enhancing cross-regional water resource coordination and allocation (e.g., developing intelligent irrigation networks and promoting water-saving technologies); (2) leveraging the radiating effects of core cities to foster specialty industry clusters (e.g., co-establishing citrus industrial belts and pig farming bases); and (3) establishing climate-adaptive agricultural development mechanisms (e.g., promoting drought-resistant crop varieties and strengthening ecological protection). These strategies aim to resolve the interconnected bottlenecks of uneven resource allocation, disparate industrial efficiencies, and intensifying environmental pressures. The practices in the Chengdu-Chongqing region demonstrate that the coordinated enhancement of agricultural development quality and water resource carrying capacity necessitates an organic integration of natural endowment utilization, precise regional policy synergies, and deep empowerment through agricultural technology. Only through such integration can the sustainable development objectives of "promoting agriculture with water, conserving water through agriculture, and fostering urban-rural prosperity" be achieved.
Beyond providing targeted solutions for the Chengdu-Chongqing region to address the complexities of coordinated agricultural and water resource development, this study establishes a comprehensive research framework encompassing "problem identification, mechanism analysis, and pathway construction." This framework offers replicable governance experiences for the "human-water-industry" nexus, applicable to Southwest China’s hilly regions and similar inland economic circles globally. Its value lies in transcending the limitations of traditional single-factor assessments by constructing a multidimensional, coupled evaluation system for regional agricultural development quality. This system provides a scientific basis for policy formulation in the modernization of agriculture and rural areas, promoting efficient resource utilization and high-quality development. Furthermore, it contributes to the deep integration of sustainable agricultural water resource management and rural revitalization strategies under the "dual carbon" goals.
Author Contributions
B.L.: Conceptualization, Data curation, Methodology, Writing—original draft, Software. X.L.: Conceptualization, Methodology, Writing—review and editing. C.B.: Data curation, Software, Formal analysis. F.S.: Data curation, Software Z.X.: Data curation, Software. All authors have read and agreed to the published version of the manuscript.
Funding
This study was supported by the National Undergraduate Training Program for Innovation and Entrepreneurship of China (No. 202410626001, S202310626012).
Data Availability Statement
These data were derived from the following resources available in the public domain: Sichuan Water Resources Bulletin: https://slt.sc.gov.cn/scsslt/szy/szy.shtml, accessed on 18 January 2025; Chongqing Water Resources Bulletin:
https://slj.cq.gov.cn/zwgk_250/fdzdgknr/tjgb/szygb/list.html, accessed on April 24, 2025; Sichuan Provincial Statistical Yearbook: https://tjj.sc.gov.cn/scstjj/c105855/nj.shtml, accessed on April 24, 2025; Chongqing Statistical Yearbook: https://tjj.cq.gov.cn/zwgk_233/tjnj/, accessed on April 24, 2025; China City Statistical Yearbook: https://www.stats.gov.cn/sj/, accessed on April 24, 2025.
Conflicts of Interest
The authors declare no conflicts of interest.
References
- Zhang, X.; Han, L.; Wei, H.; Tan, X.; Zhou, W.; Li, W.; Qian, Y. Linking Urbanization and Air Quality Together: A Review and a Perspective on the Future Sustainable Urban Development. Journal of Cleaner Production 2022, 346, 130988. [Google Scholar] [CrossRef]
- Hoegh-Guldberg, O.; Jacob, D.; Taylor, M.; Guillén Bolaños, T.; Bindi, M.; Brown, S.; Camilloni, I.A.; Diedhiou, A.; Djalante, R.; Ebi, K.; et al. The Human Imperative of Stabilizing Global Climate Change at 1.5°C. Science 2019, 365, eaaw6974. [Google Scholar] [CrossRef]
- Lin, F.; Li, X.; Jia, N.; Feng, F.; Huang, H.; Huang, J.; Fan, S.; Ciais, P.; Song, X.-P. The Impact of Russia-Ukraine Conflict on Global Food Security. Global Food Security 2023, 36, 100661. [Google Scholar] [CrossRef]
- Cook, C.; Bakker, K. Water Security: Debating an Emerging Paradigm. Global Environmental Change 2012, 22, 94–102. [Google Scholar] [CrossRef]
- Falkenmark, M. The Greatest Water Problem: The Inability to Link Environmental Security, Water Security and Food Security. International Journal of Water Resources Development 2001, 17, 539–554. [Google Scholar] [CrossRef]
- Bakker, K. Water Security: Research Challenges and Opportunities. Science 2012, 337, 914–915. [Google Scholar] [CrossRef]
- Lang, W.; Chen, T.; Li, X. A New Style of Urbanization in China: Transformation of Urban Rural Communities. Habitat International 2016, 55, 1–9. [Google Scholar] [CrossRef]
- Chen, M.; Liu, W.; Lu, D. Challenges and the Way Forward in China’s New-Type Urbanization. Land Use Policy 2016, 55, 334–339. [Google Scholar] [CrossRef]
- Chu, Y. China’s New Urbanization Plan: Progress and Structural Constraints. Cities 2020, 103, 102736. [Google Scholar] [CrossRef]
- He, G.; Zhao, Y.; Wang, L.; Jiang, S.; Zhu, Y. China’s Food Security Challenge: Effects of Food Habit Changes on Requirements for Arable Land and Water. Journal of Cleaner Production 2019, 229, 739–750. [Google Scholar] [CrossRef]
- Wang, J.; Li, Y.; Huang, J.; Yan, T.; Sun, T. Growing Water Scarcity, Food Security and Government Responses in China. Global Food Security 2017, 14, 9–17. [Google Scholar] [CrossRef]
- Winter, J.M.; Lopez, J.R.; Ruane, A.C.; Young, C.A.; Scanlon, B.R.; Rosenzweig, C. Representing Water Scarcity in Future Agricultural Assessments. Anthropocene 2017, 18, 15–26. [Google Scholar] [CrossRef]
- Lin, L.; Gu, T.; Shi, Y. The Influence of New Quality Productive Forces on High-Quality Agricultural Development in China: Mechanisms and Empirical Testing. Agriculture 2024, 14, 1022. [Google Scholar] [CrossRef]
- Zhang, J.; Zhang, N.; Bai, S. Assessing the Carbon Emission Changing for Sustainability and High-Quality Economic Development. Environmental Technology & Innovation 2021, 22, 101464. [Google Scholar] [CrossRef]
- He, L.; Du, Y.; Wu, S.; Zhang, Z. Evaluation of the Agricultural Water Resource Carrying Capacity and Optimization of a Planting-Raising Structure. Agricultural Water Management 2021, 243, 106456. [Google Scholar] [CrossRef]
- Cheng, J.; Shi, Z.; Zhu, Y. Assessment and Mapping of Environmental Quality in Agricultural Soils of Zhejiang Province, China. Journal of Environmental Sciences 2007, 19, 50–54. [Google Scholar] [CrossRef]
- Sustainable Agriculture Reviews 27; Lichtfouse, E. , Ed.; Sustainable Agriculture Reviews; Springer International Publishing: Cham, 2018; ISBN 978-3-319-75189-4. [Google Scholar]
- Wang, X.; Liu, L.; Zhang, S.; Gao, C. Dynamic Simulation and Comprehensive Evaluation of the Water Resources Carrying Capacity in Guangzhou City, China. Ecological Indicators 2022, 135, 108528. [Google Scholar] [CrossRef]
- Gong, L.; Jin, C. Fuzzy Comprehensive Evaluation for Carrying Capacity of Regional Water Resources. Water Resour Manage 2009, 23, 2505–2513. [Google Scholar] [CrossRef]
- Zhang, C.-Y.; Oki, T. Water Pricing Reform for Sustainable Water Resources Management in China’s Agricultural Sector. Agricultural Water Management 2023, 275, 108045. [Google Scholar] [CrossRef]
- Kundzewicz, Z.W. Water Resources for Sustainable Development. Hydrological Sciences Journal 1997, 42, 467–480. [Google Scholar] [CrossRef]
- Jiao, X.; Mongol, N.; Zhang, F. The Transformation of Agriculture in China: Looking Back and Looking Forward. Journal of Integrative Agriculture 2018, 17, 755–764. [Google Scholar] [CrossRef]
- Zhao, J.; Tang, J. Understanding Agricultural Growth in China: An International Perspective. Structural Change and Economic Dynamics 2018, 46, 43–51. [Google Scholar] [CrossRef]
- Lu, H.; Zhang, C.; Jiao, L.; Wei, Y.; Zhang, Y. Analysis on the Spatial-Temporal Evolution of Urban Agglomeration Resilience: A Case Study in Chengdu-Chongqing Urban Agglomeration, China. International Journal of Disaster Risk Reduction 2022, 79, 103167. [Google Scholar] [CrossRef]
- Liu, H.; Lu, G.; Luo, K.; Zong, H. Measurement and Spatio–Temporal Pattern Evolution of Urban–Rural Integration Development in the Chengdu-Chongqing Economic Circle. Land 2024, 13, 942. [Google Scholar] [CrossRef]
- Shen, Y.; Sargani, G.R.; Wang, R.; Jing, Y. Unveiling the Spatio-Temporal Dynamics and Driving Mechanism of Rural Industrial Integration Development: A Case of Chengdu–Chongqing Economic Circle, China. Agriculture 2024, 14, 884. [Google Scholar] [CrossRef]
- Wu, D.; Zheng, L.; Wang, Y.; Gong, J.; Li, J.; Chen, Q. Dynamics in Construction Land Patterns and Its Impact on Water-Related Ecosystem Services in Chengdu-Chongqing Urban Agglomeration, China: A Multi-Scale Study. Journal of Cleaner Production 2024, 469, 143022. [Google Scholar] [CrossRef]
- Piao, S.; Ciais, P.; Huang, Y.; Shen, Z.; Peng, S.; Li, J.; Zhou, L.; Liu, H.; Ma, Y.; Ding, Y.; et al. The Impacts of Climate Change on Water Resources and Agriculture in China. Nature 2010, 467, 43–51. [Google Scholar] [CrossRef]
- Wang, S.Y.; Chen, W.M.; Wang, R.; Zhao, T. Study on the Coordinated Development of Urbanization and Water Resources Utilization Efficiency in China. Water Supply 2022, 22, 749–765. [Google Scholar] [CrossRef]
- Chen, L.; Li, X.; Kang, X.; Liu, W.; Wang, M. Analysis of the Cooperative Development of Multiple Systems for Urban Economy-Energy-Carbon: A Case Study of Chengdu-Chongqing Economic Circle. Sustainable Cities and Society 2024, 108, 105395. [Google Scholar] [CrossRef]
- Cui, X.; Cai, T.; Deng, W.; Zheng, R.; Jiang, Y.; Bao, H. Indicators for Evaluating High-Quality Agricultural Development: Empirical Study from Yangtze River Economic Belt, China. Soc Indic Res 2022, 164, 1101–1127. [Google Scholar] [CrossRef]
- Yu, J.; Wu, J. The Sustainability of Agricultural Development in China: The Agriculture–Environment Nexus. Sustainability 2018, 10, 1776. [Google Scholar] [CrossRef]
- Buttel, F.H.; Gertler, M.E. Agricultural Structure, Agricultural Policy, and Environmental Quality: Some Observations on the Context of Agricultural Research in North America. Agriculture and Environment 1982, 7, 101–119. [Google Scholar] [CrossRef]
- Klages, S.; Heidecke, C.; Osterburg, B. The Impact of Agricultural Production and Policy on Water Quality during the Dry Year 2018, a Case Study from Germany. Water 2020, 12, 1519. [Google Scholar] [CrossRef]
- Zhang, Z.; Li, Y.; Elahi, E.; Wang, Y. Comprehensive Evaluation of Agricultural Modernization Levels. Sustainability 2022, 14, 5069. [Google Scholar] [CrossRef]
- Wu, L.; Su, X.; Ma, X.; Kang, Y.; Jiang, Y. Integrated Modeling Framework for Evaluating and Predicting the Water Resources Carrying Capacity in a Continental River Basin of Northwest China. Journal of Cleaner Production 2018, 204, 366–379. [Google Scholar] [CrossRef]
- Hu, G.; Zeng, W.; Yao, R.; Xie, Y.; Liang, S. An Integrated Assessment System for the Carrying Capacity of the Water Environment Based on System Dynamics. Journal of Environmental Management 2021, 295, 113045. [Google Scholar] [CrossRef]
- Lu, Y.; Xu, H.; Wang, Y.; Yang, Y. Evaluation of Water Environmental Carrying Capacity of City in Huaihe River Basin Based on the AHP Method: A Case in Huai’an City. Water Resources and Industry 2017, 18, 71–77. [Google Scholar] [CrossRef]
- Namara, R.E.; Hanjra, M.A.; Castillo, G.E.; Ravnborg, H.M.; Smith, L.; Van Koppen, B. Agricultural Water Management and Poverty Linkages. Agricultural Water Management 2010, 97, 520–527. [Google Scholar] [CrossRef]
- Gordon, L.J.; Finlayson, C.M.; Falkenmark, M. Managing Water in Agriculture for Food Production and Other Ecosystem Services. Agricultural Water Management 2010, 97, 512–519. [Google Scholar] [CrossRef]
- Yazdandoost, F.; Razavi, H.; Izadi, A. Optimization of Agricultural Patterns Based on Virtual Water Considerations through Integrated Water Resources Management Modeling. International Journal of River Basin Management 2022, 20, 255–263. [Google Scholar] [CrossRef]
- Galioto, F.; Raggi, M.; Viaggi, D. Pricing Policies in Managing Water Resources in Agriculture: An Application of Contract Theory to Unmetered Water. Water 2013, 5, 1502–1516. [Google Scholar] [CrossRef]
- Wang, B.; Shi, W.; Miao, Z. Confidence Analysis of Standard Deviational Ellipse and Its Extension into Higher Dimensional Euclidean Space. PLoS ONE 2015, 10, e0118537. [Google Scholar] [CrossRef] [PubMed]
- Zhang, Z.; Wang, C.; Lv, B. Comparative Analysis of Ecological Sensitivity Assessment Using the Coefficient of Variation Method and Machine Learning. Environ Monit Assess 2024, 196, 1000. [Google Scholar] [CrossRef]
- Zhu, Y.; Yang, S.; Lin, J.; Yin, S. Spatial and Temporal Evolutionary Characteristics and Its Influencing Factors of Economic Spatial Polarization in the Yangtze River Delta Region. IJERPH 2022, 19, 6997. [Google Scholar] [CrossRef] [PubMed]
- Zhang, P.; Pan, J.; Xie, L.; Zhou, T.; Bai, H.; Zhu, Y. Spatial–Temporal Evolution and Regional Differentiation Features of Urbanization in China from 2003 to 2013. IJGI 2019, 8, 31. [Google Scholar] [CrossRef]
- Zhang, X.; Zhang, J.; Yang, C. Spatio-Temporal Evolution of Agricultural Carbon Emissions in China, 2000–2020. Sustainability 2023, 15, 3347. [Google Scholar] [CrossRef]
- Zhao, M.; Wei, J.; Han, Y.; Shi, J.; Wang, S. Water Resource Security Evaluation and Barrier Analysis in Henan Province Utilizing the DPSIR Framework. Front. Environ. Sci. 2024, 12, 1354175. [Google Scholar] [CrossRef]
- Chaube, S.; Pant, S.; Kumar, A.; Uniyal, S.; Singh, M.K.; Kotecha, K.; Kumar, A. An Overview of Multi-Criteria Decision Analysis and the Applications of AHP and TOPSIS Methods. Int. j. math. eng. manag. sci. 2024, 9, 581–615. [Google Scholar] [CrossRef]
- Wang, C.; Li, Z.; Chen, H.; Wang, M. Comprehensive Evaluation of Agricultural Water Resources’ Carrying Capacity in Anhui Province Based on an Improved TOPSIS Model. Sustainability 2023, 15, 13297. [Google Scholar] [CrossRef]
- Kang, J.; Zi, X.; Wang, S.; He, L. Evaluation and Optimization of Agricultural Water Resources Carrying Capacity in Haihe River Basin, China. Water 2019, 11, 999. [Google Scholar] [CrossRef]
- Liu, P.; Wang, C.; Xie, X.; Lu, T. Study on the Coupling and Harmonization of Agricultural Economy, Population Development, and Ecological Environment in the Yangtze River Basin. Sustainability 2025, 17, 2209. [Google Scholar] [CrossRef]
- Zhao, M.; Zhao, D.; Jiang, Z.; Cui, D.; Li, J.; Shi, X. The GRAY PREDICTION GM (1, 1) MODEL IN TRAFFIC FORECAST APPLICATION. MMEP 2015, 2, 17–22. [Google Scholar] [CrossRef]
- Leng, Y.; Liu, X.; Wang, X. Environmental Regulation and High-Quality Agricultural Development. PLoS ONE 2023, 18, e0285687. [Google Scholar] [CrossRef]
- Mei, H. ; Liuyuan; Duhuan; Yangxiaoyan Advances in Study on Water Resources Carrying Capacity in China. Procedia Environmental Sciences 2010, 2, 1894–1903. [Google Scholar] [CrossRef]
- Dou, M.; Ma, J.; Li, G.; Zuo, Q. Measurement and Assessment of Water Resources Carrying Capacity in Henan Province, China. Water Science and Engineering 2015, 8, 102–113. [Google Scholar] [CrossRef]
- Yang, M.; Qu, D.; Shen, Y.; Yang, S.; Liu, B.; Lu, W. Evaluation of Water Resources Carrying Capacity of Zhangye City Based on Combined Weights and TOPSIS Modeling. Water 2023, 15, 4229. [Google Scholar] [CrossRef]
- Lv, B.; Liu, C.; Li, T.; Meng, F.; Fu, Q.; Ji, Y.; Hou, R. Evaluation of the Water Resource Carrying Capacity in Heilongjiang, Eastern China, Based on the Improved TOPSIS Model. Ecological Indicators 2023, 150, 110208. [Google Scholar] [CrossRef]
- Zhao, M.; Wei, J.; Han, Y.; Shi, J.; Wang, S. Water Resource Security Evaluation and Barrier Analysis in Henan Province Utilizing the DPSIR Framework. Front. Environ. Sci. 2024, 12, 1354175. [Google Scholar] [CrossRef]
- Zhang, Y.; Jiang, P.; Cui, L.; Yang, Y.; Ma, Z.; Wang, Y.; Miao, D. Study on the Spatial Variation of China’s Territorial Ecological Space Based on the Standard Deviation Ellipse. Front. Environ. Sci. 2022, 10, 982734. [Google Scholar] [CrossRef]
- Colin Koeniguer, E.; Nicolas, J.-M. Change Detection Based on the Coefficient of Variation in SAR Time-Series of Urban Areas. Remote Sensing 2020, 12, 2089. [Google Scholar] [CrossRef]
- Cheng, M.; Liu, Y.; Li, J. A New Modeling Method of Gray GM (1, N) Model and Its Application to Predicting China’s Clean Energy Consumption. Communications in Statistics - Simulation and Computation 2023, 52, 3712–3723. [Google Scholar] [CrossRef]
- Zhao, M.; Zhao, D.; Jiang, Z.; Cui, D.; Li, J.; Shi, X. The GRAY PREDICTION GM (1, 1) MODEL IN TRAFFIC FORECAST APPLICATION. MMEP 2015, 2, 17–22. [Google Scholar] [CrossRef]
- Hu, Y.-C.; Jiang, P.; Jiang, H.; Tsai, J.-F. Bankruptcy Prediction Using Multivariate Grey Prediction Models. Grey Systems: Theory and Application 2021, 11, 46–62. [Google Scholar] [CrossRef]
- Zhou, D.; Xue, L.; Song, Y.; Chen, J. On-Line Remaining Useful Life Prediction of Lithium-Ion Batteries Based on the Optimized Gray Model GM(1,1). Batteries 2017, 3, 21. [Google Scholar] [CrossRef]
- Peng, S. Water Resources Strategy and Agricultural Development in China. Journal of Experimental Botany 2011, 62, 1709–1713. [Google Scholar] [CrossRef]
Figure 1.
Water Resources Carrying Capacity of 16 Cities and the Chengdu-Chongqing Region over 10 Years.
Figure 1.
Water Resources Carrying Capacity of 16 Cities and the Chengdu-Chongqing Region over 10 Years.
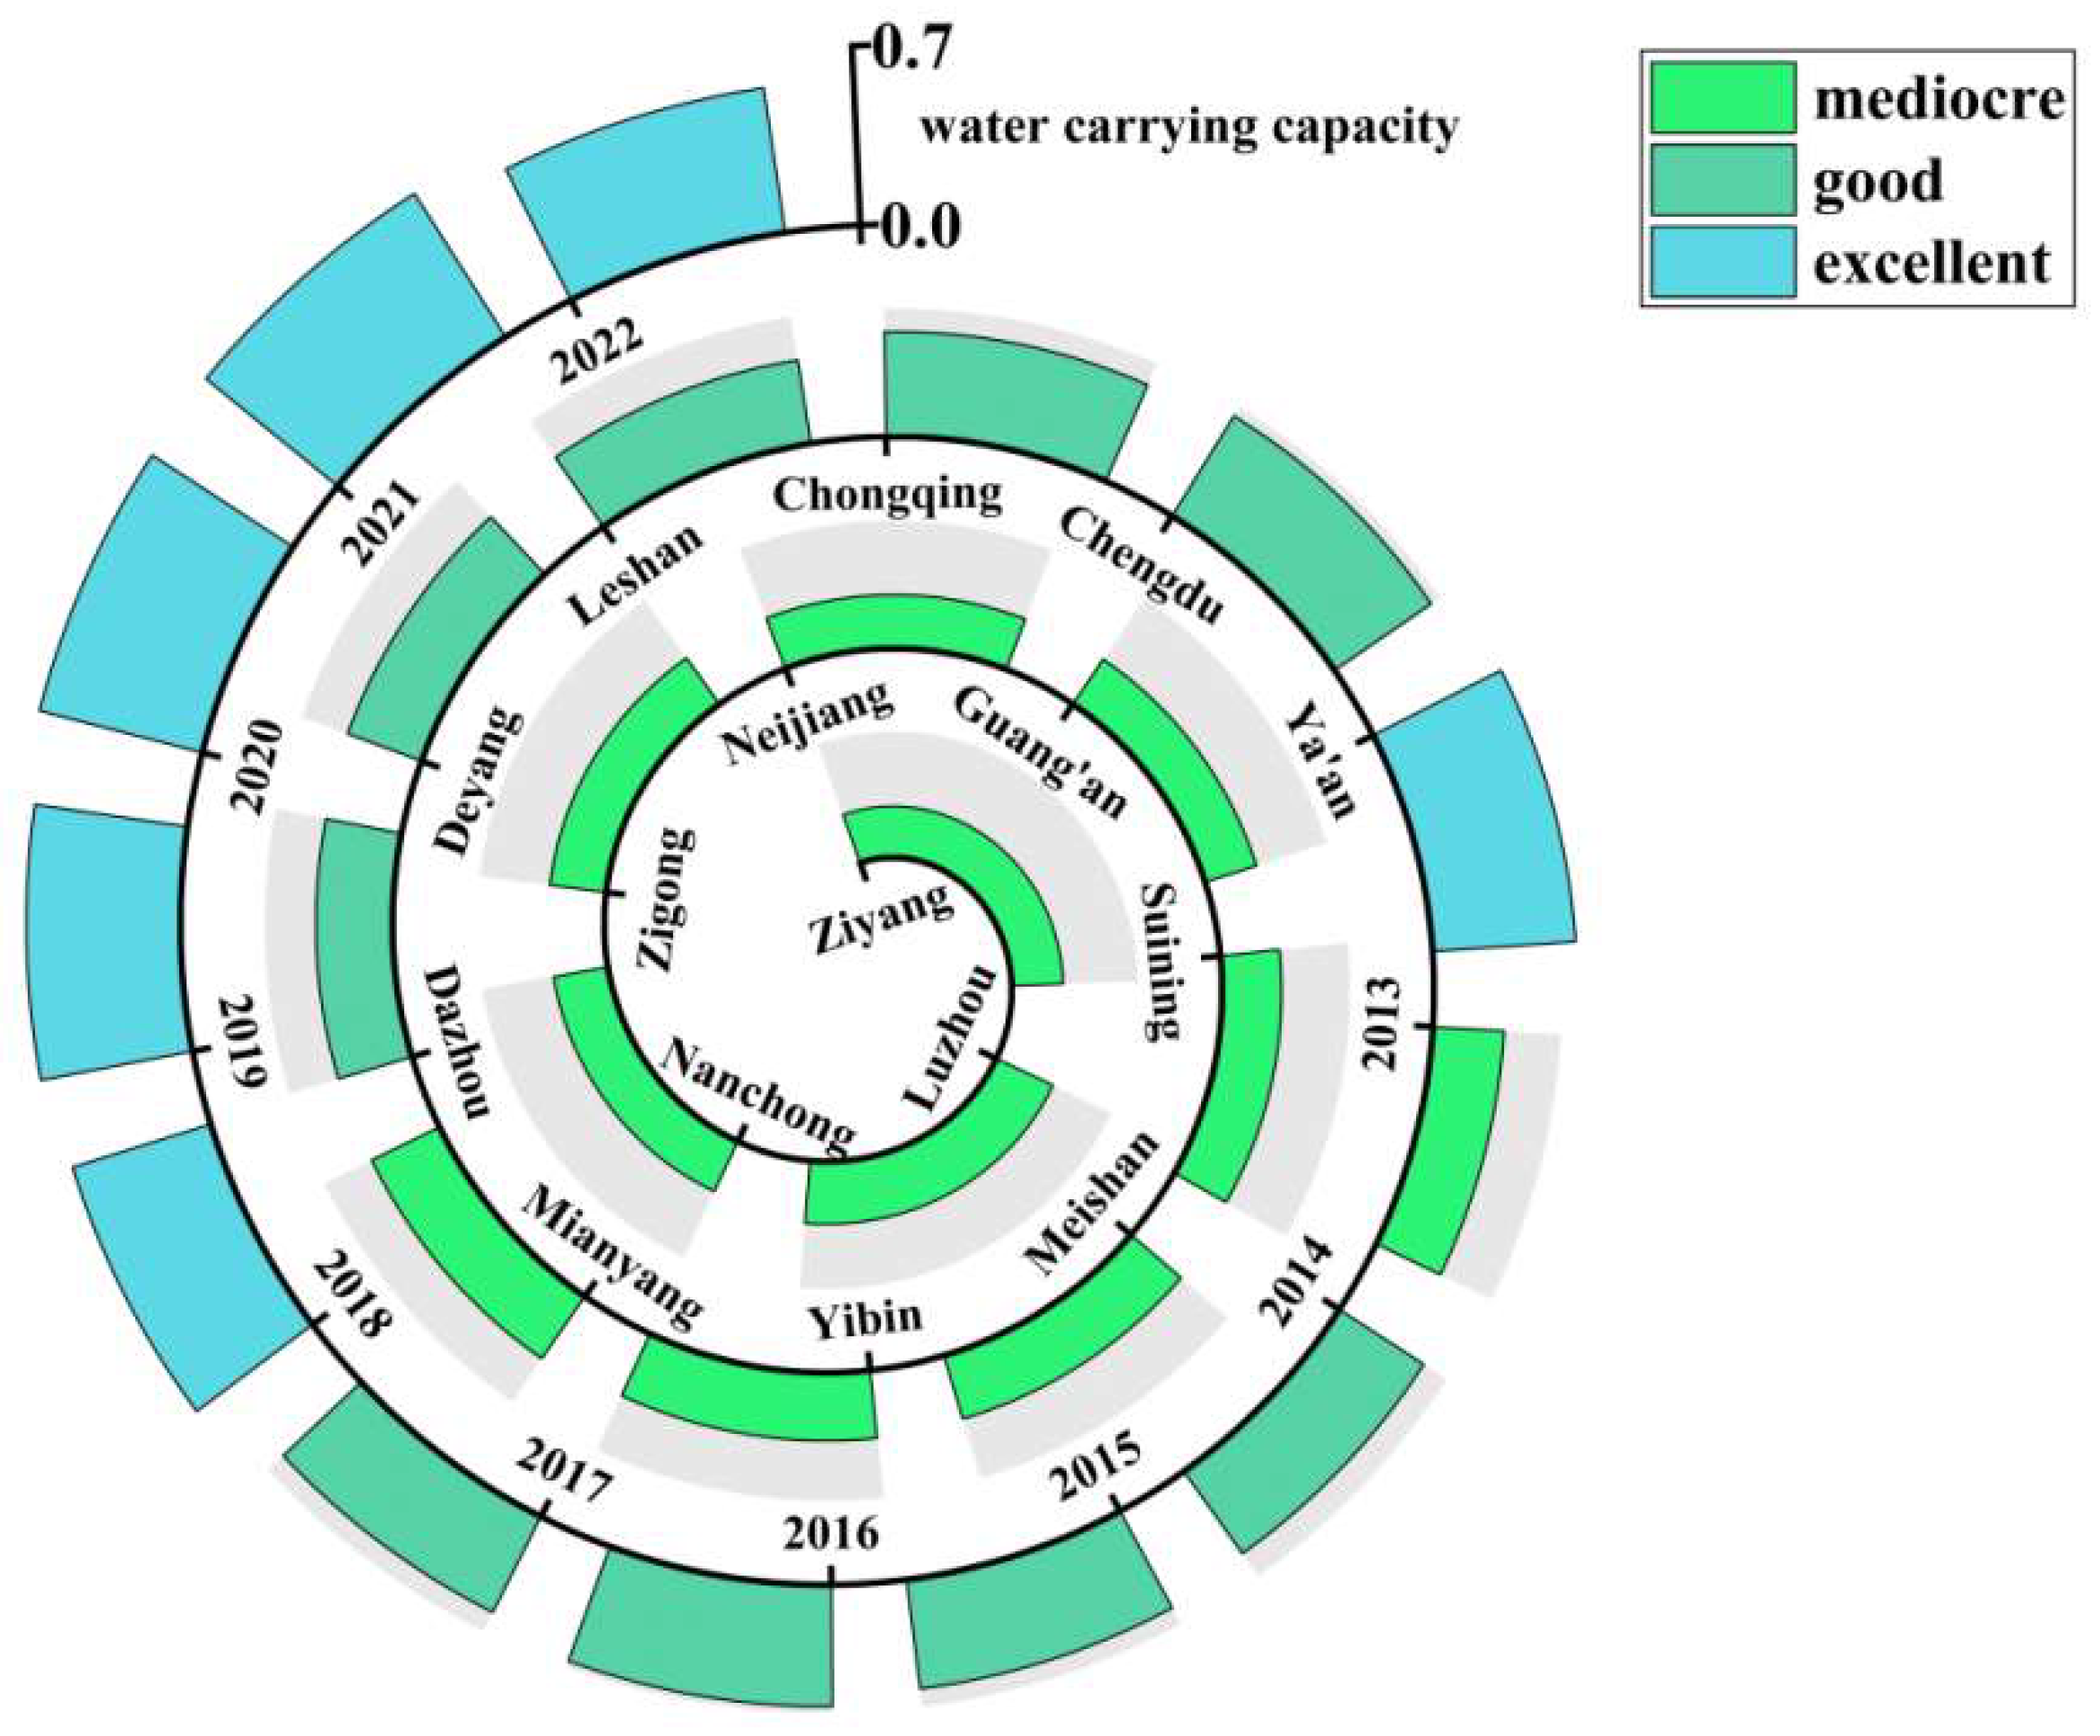
Figure 2.
Obstacle Factors of Water Resources Carrying Capacity from 2013 to 2022.
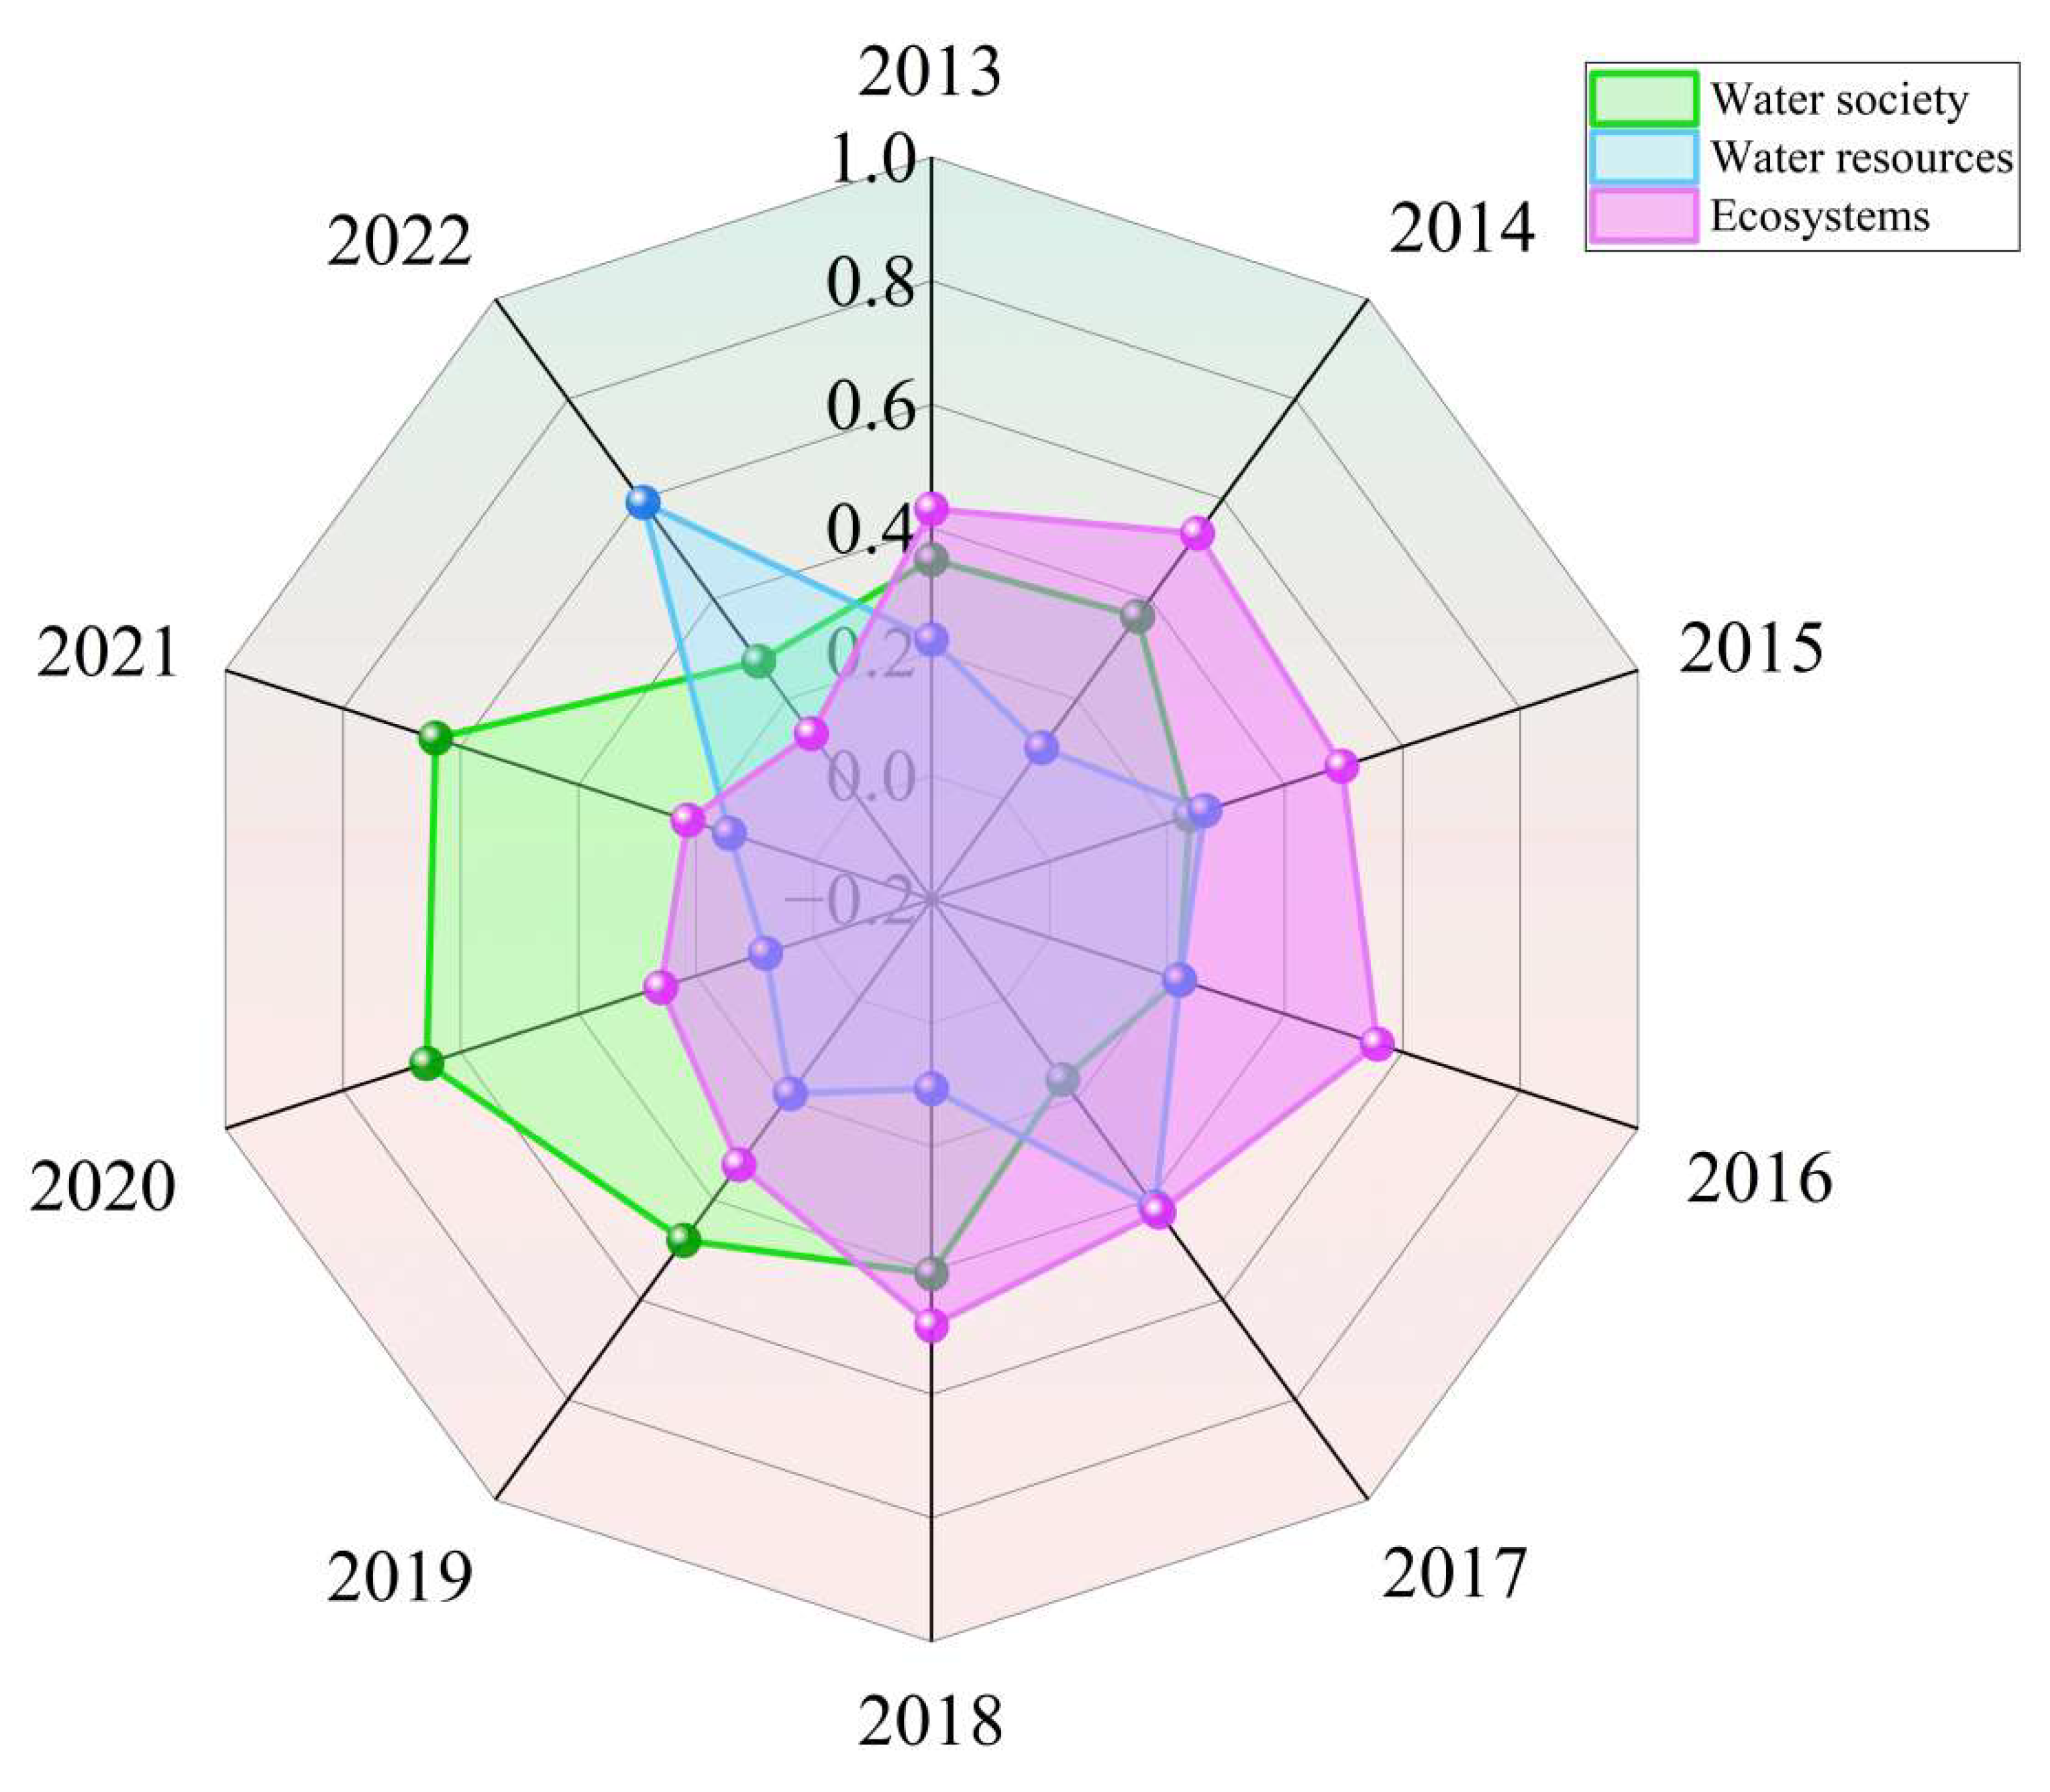
Figure 3.
Obstacle Factors of Water Resources Carrying Capacity in 16 Cities.
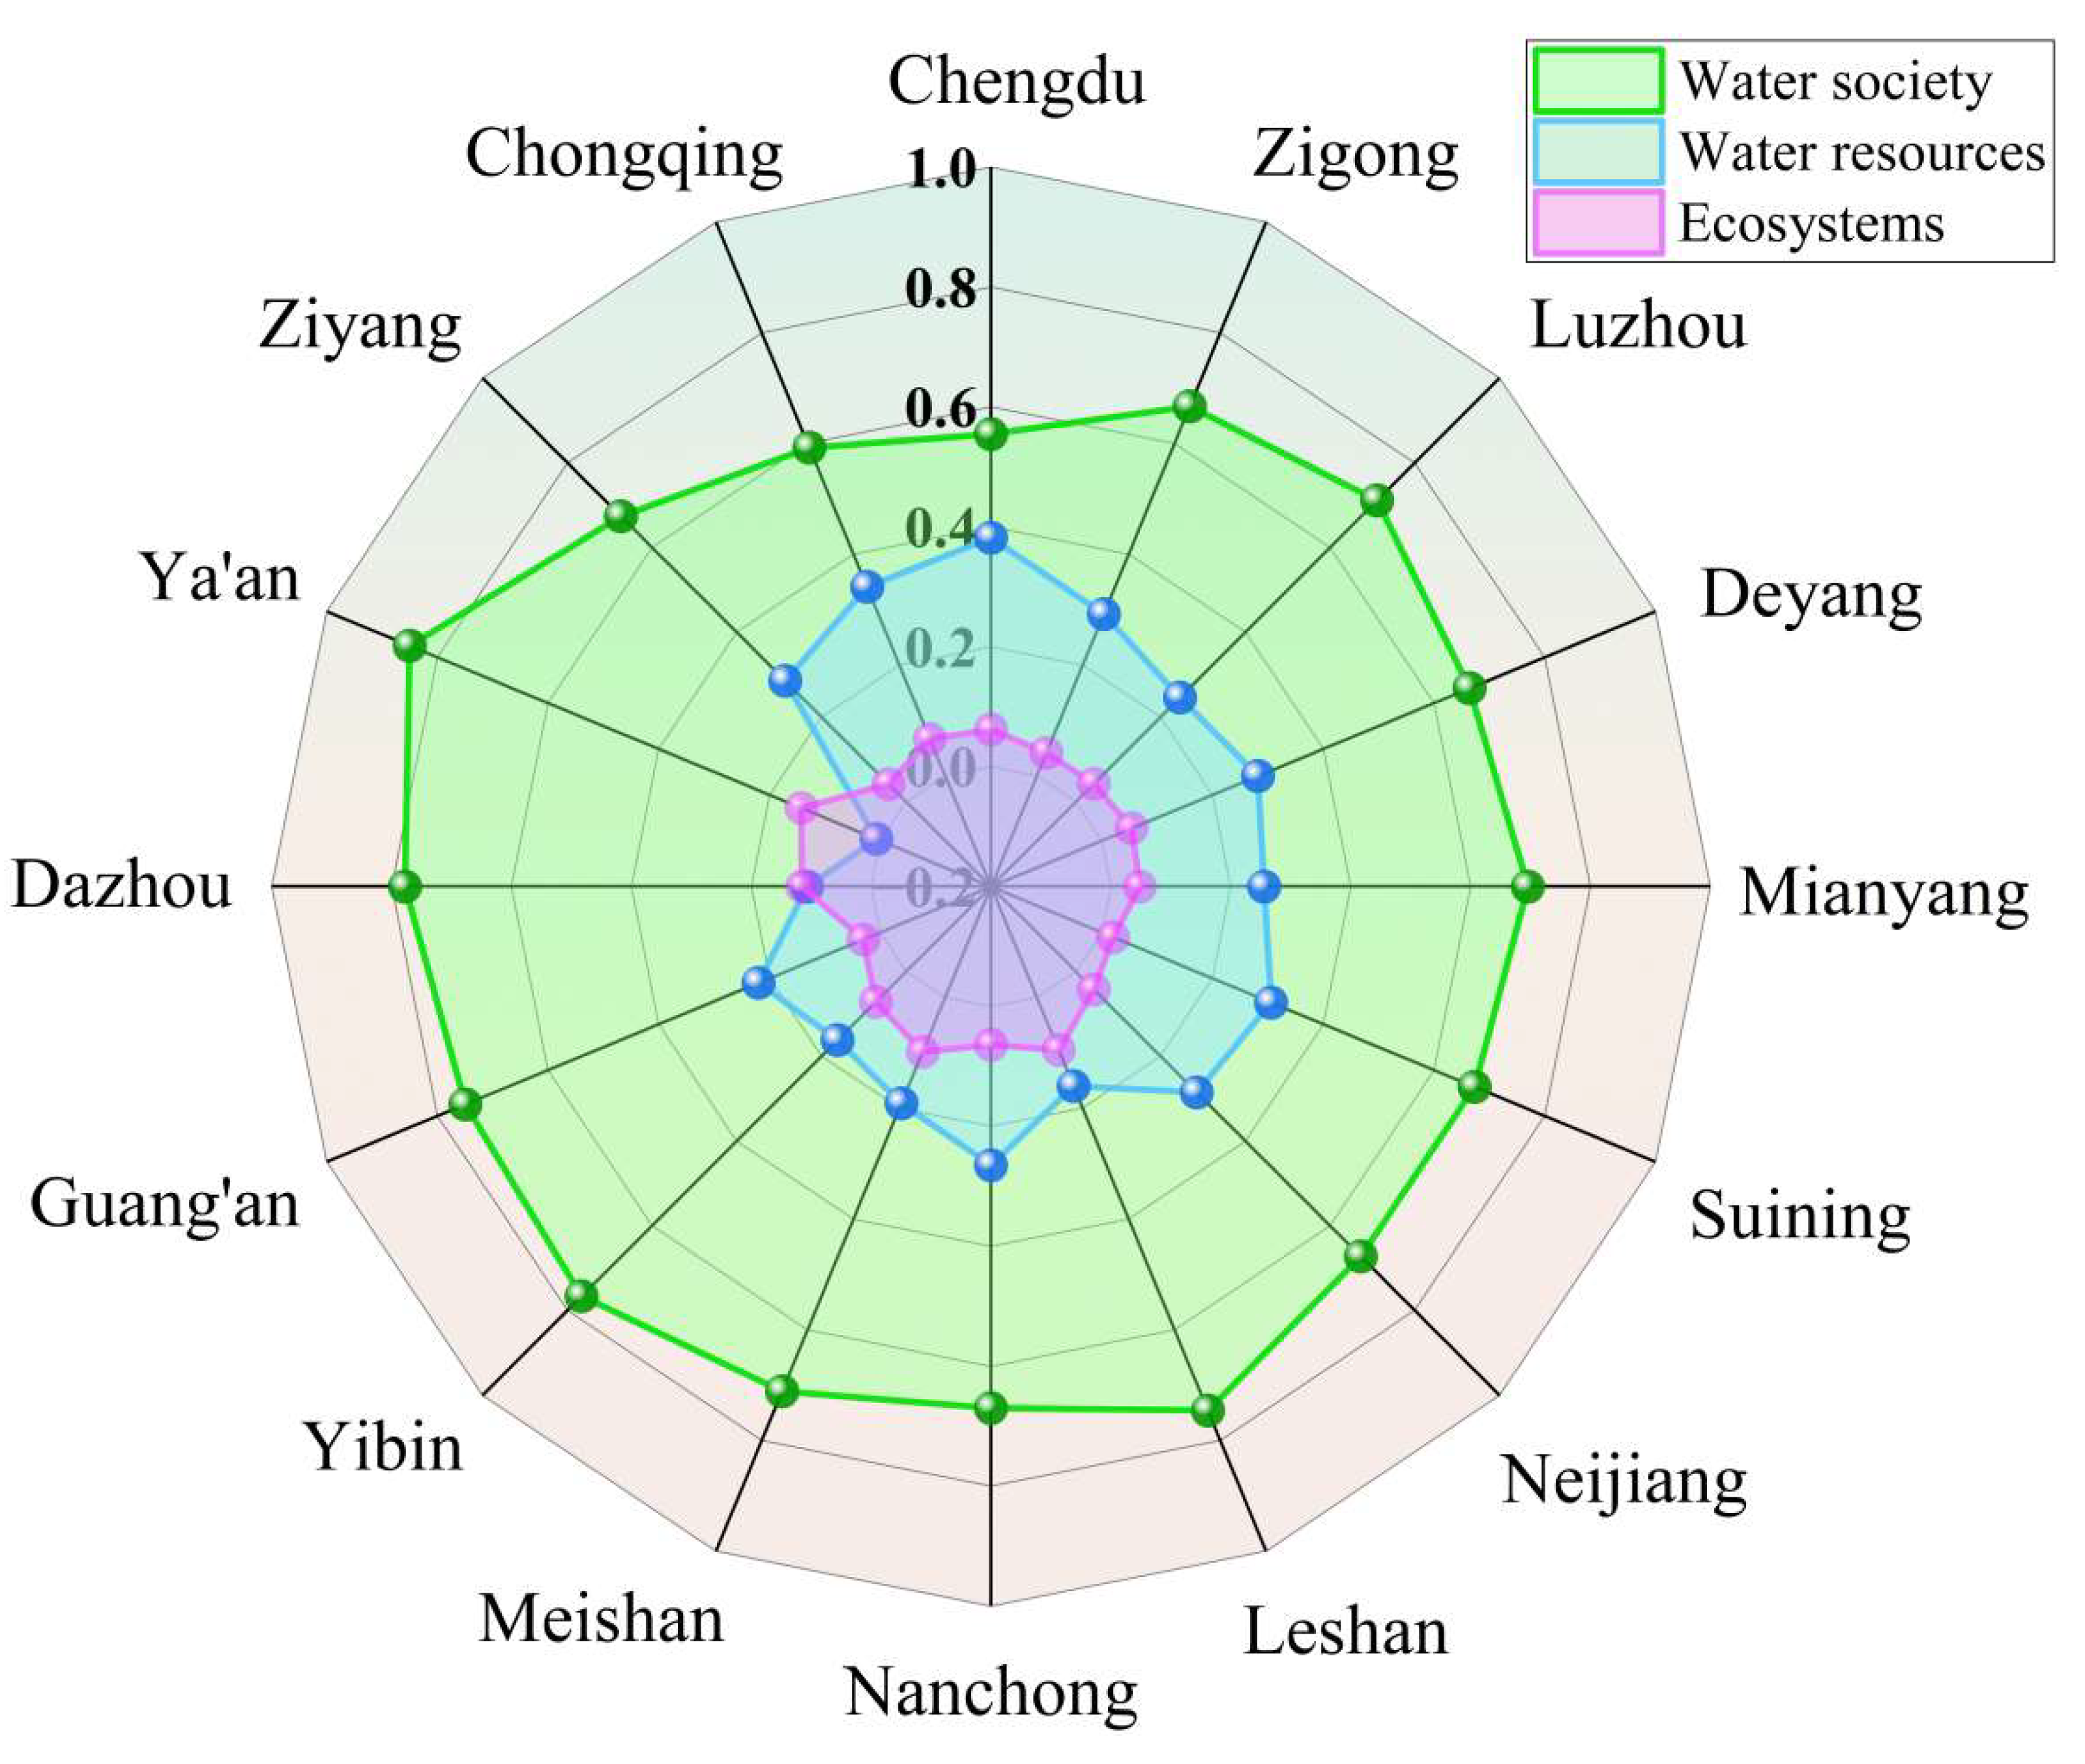
Figure 4.
Changes in Water Resources Carrying Capacity Index (WCI) of Different Cities over a Decade.
Figure 4.
Changes in Water Resources Carrying Capacity Index (WCI) of Different Cities over a Decade.
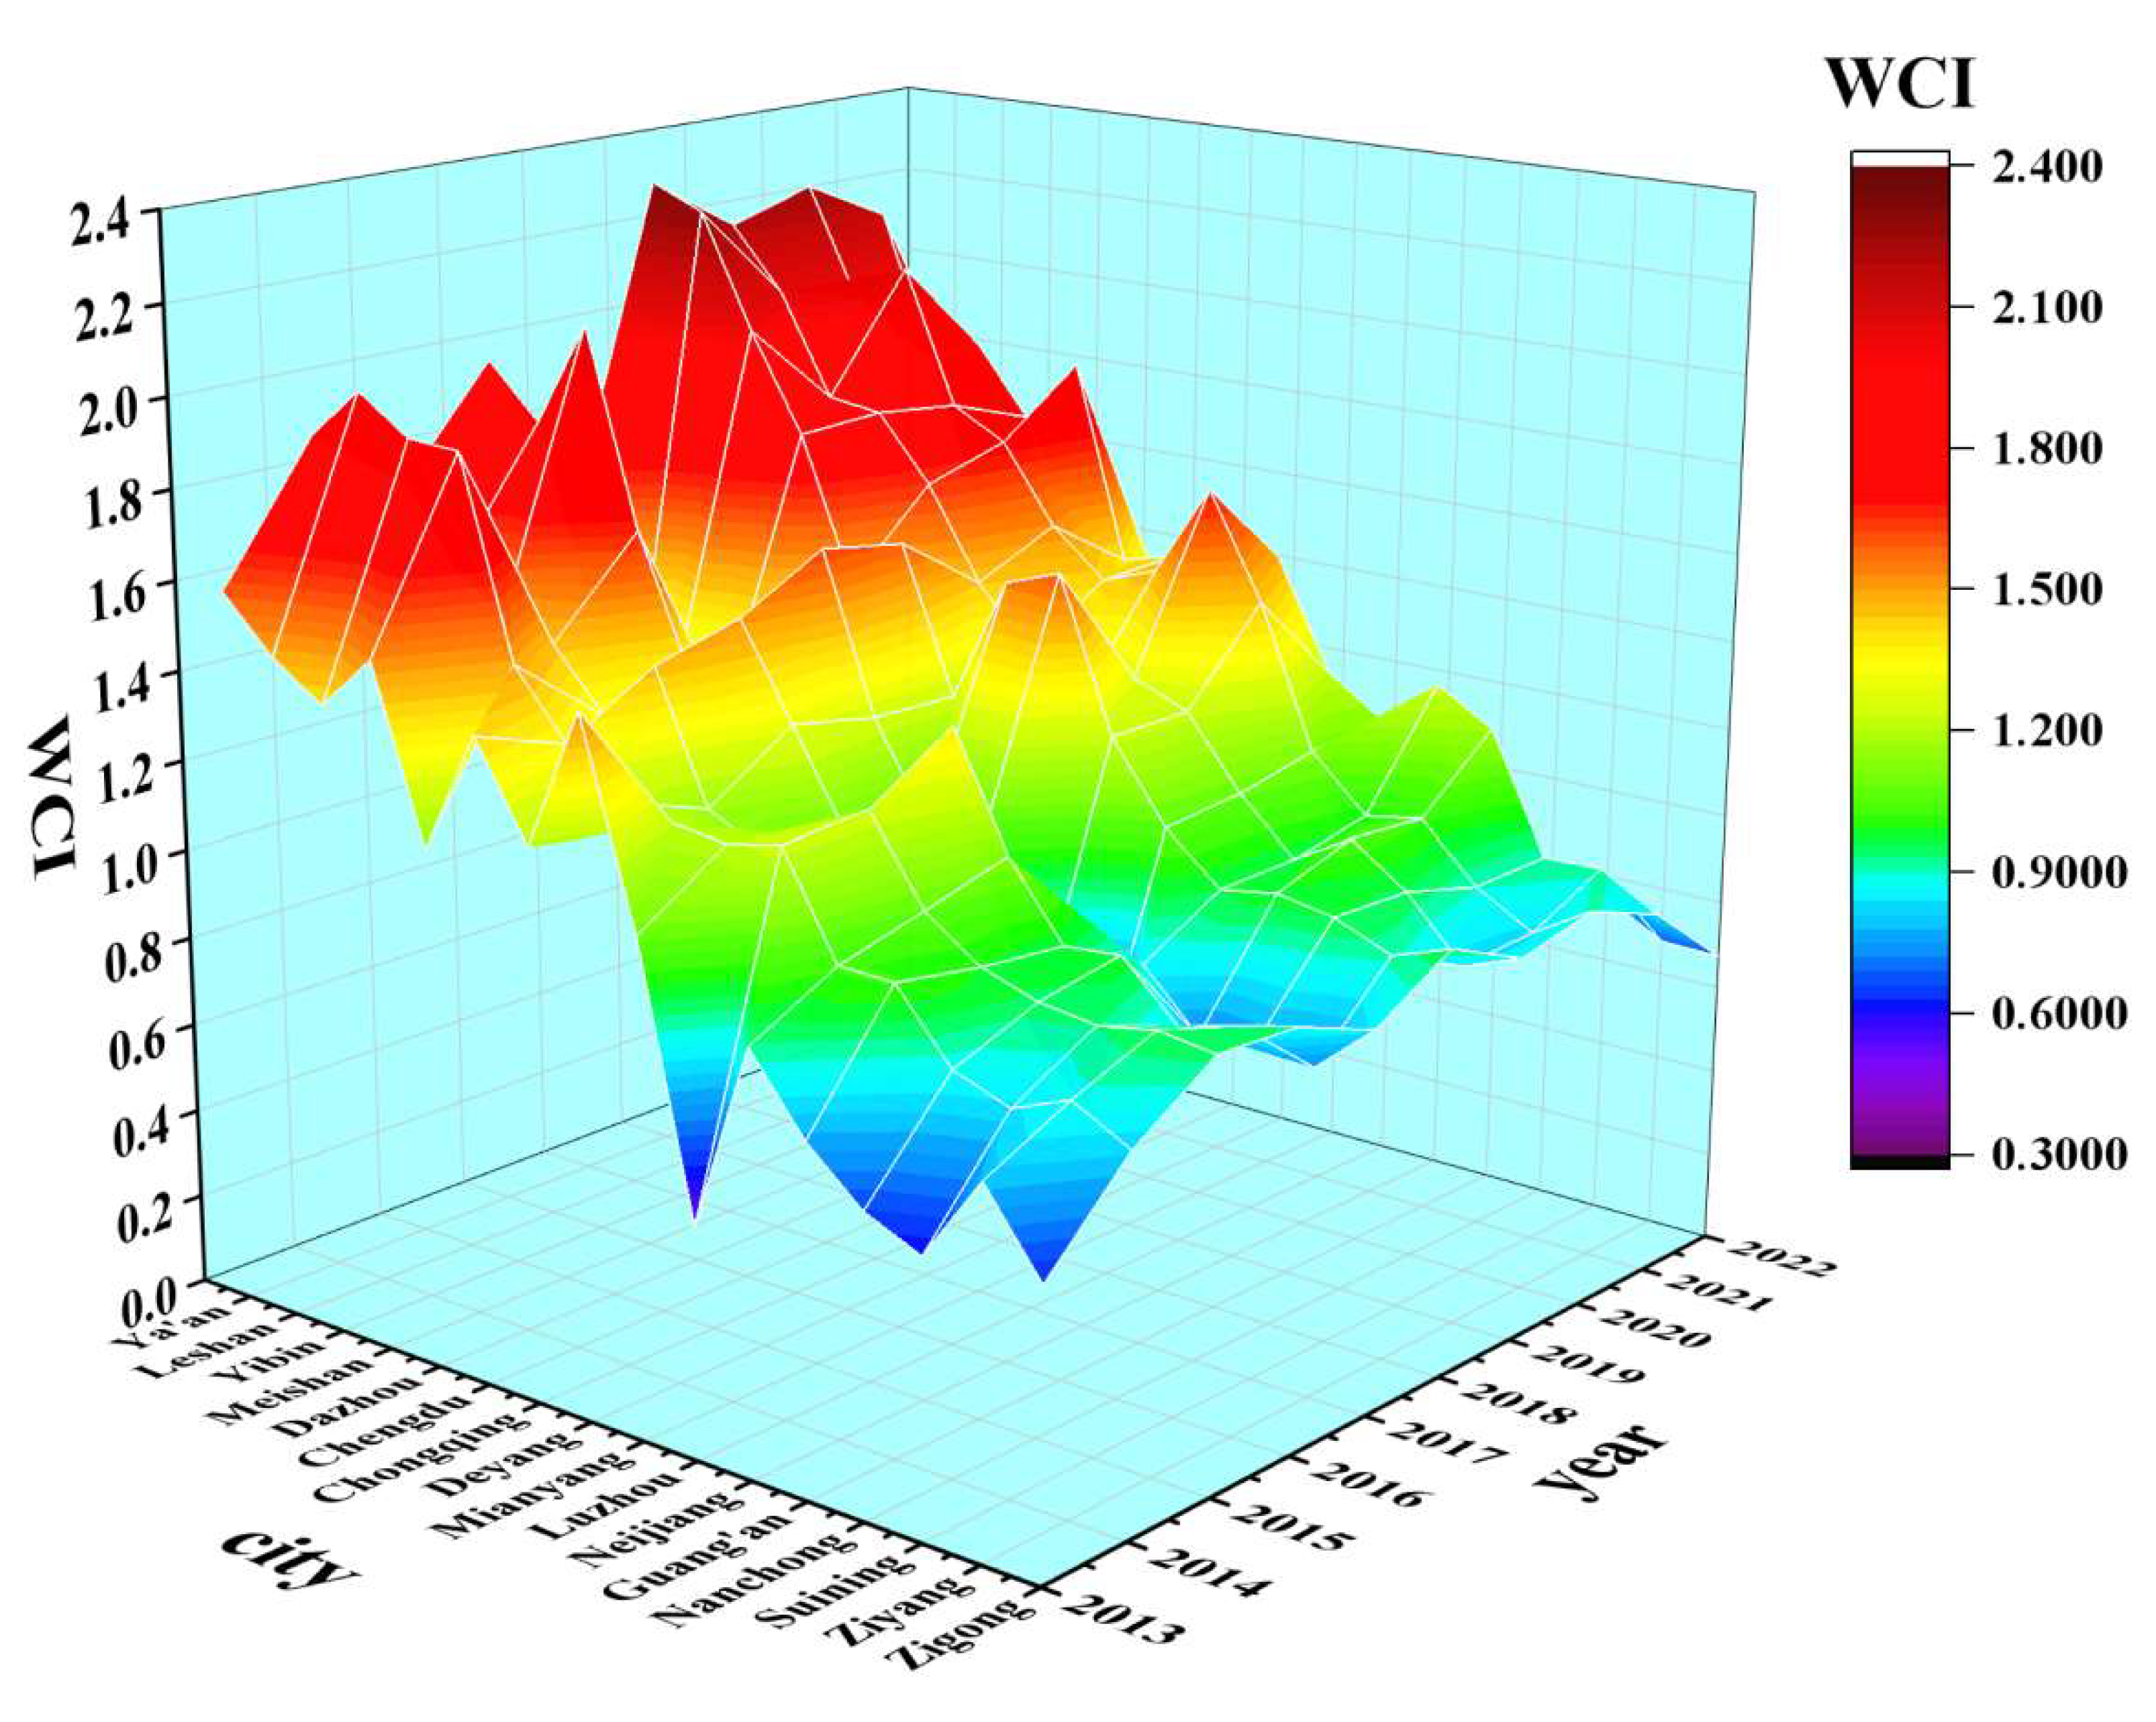
Figure 5.
Changes in Agricultural Quality Index (AQI) of Different Cities over a Decade.
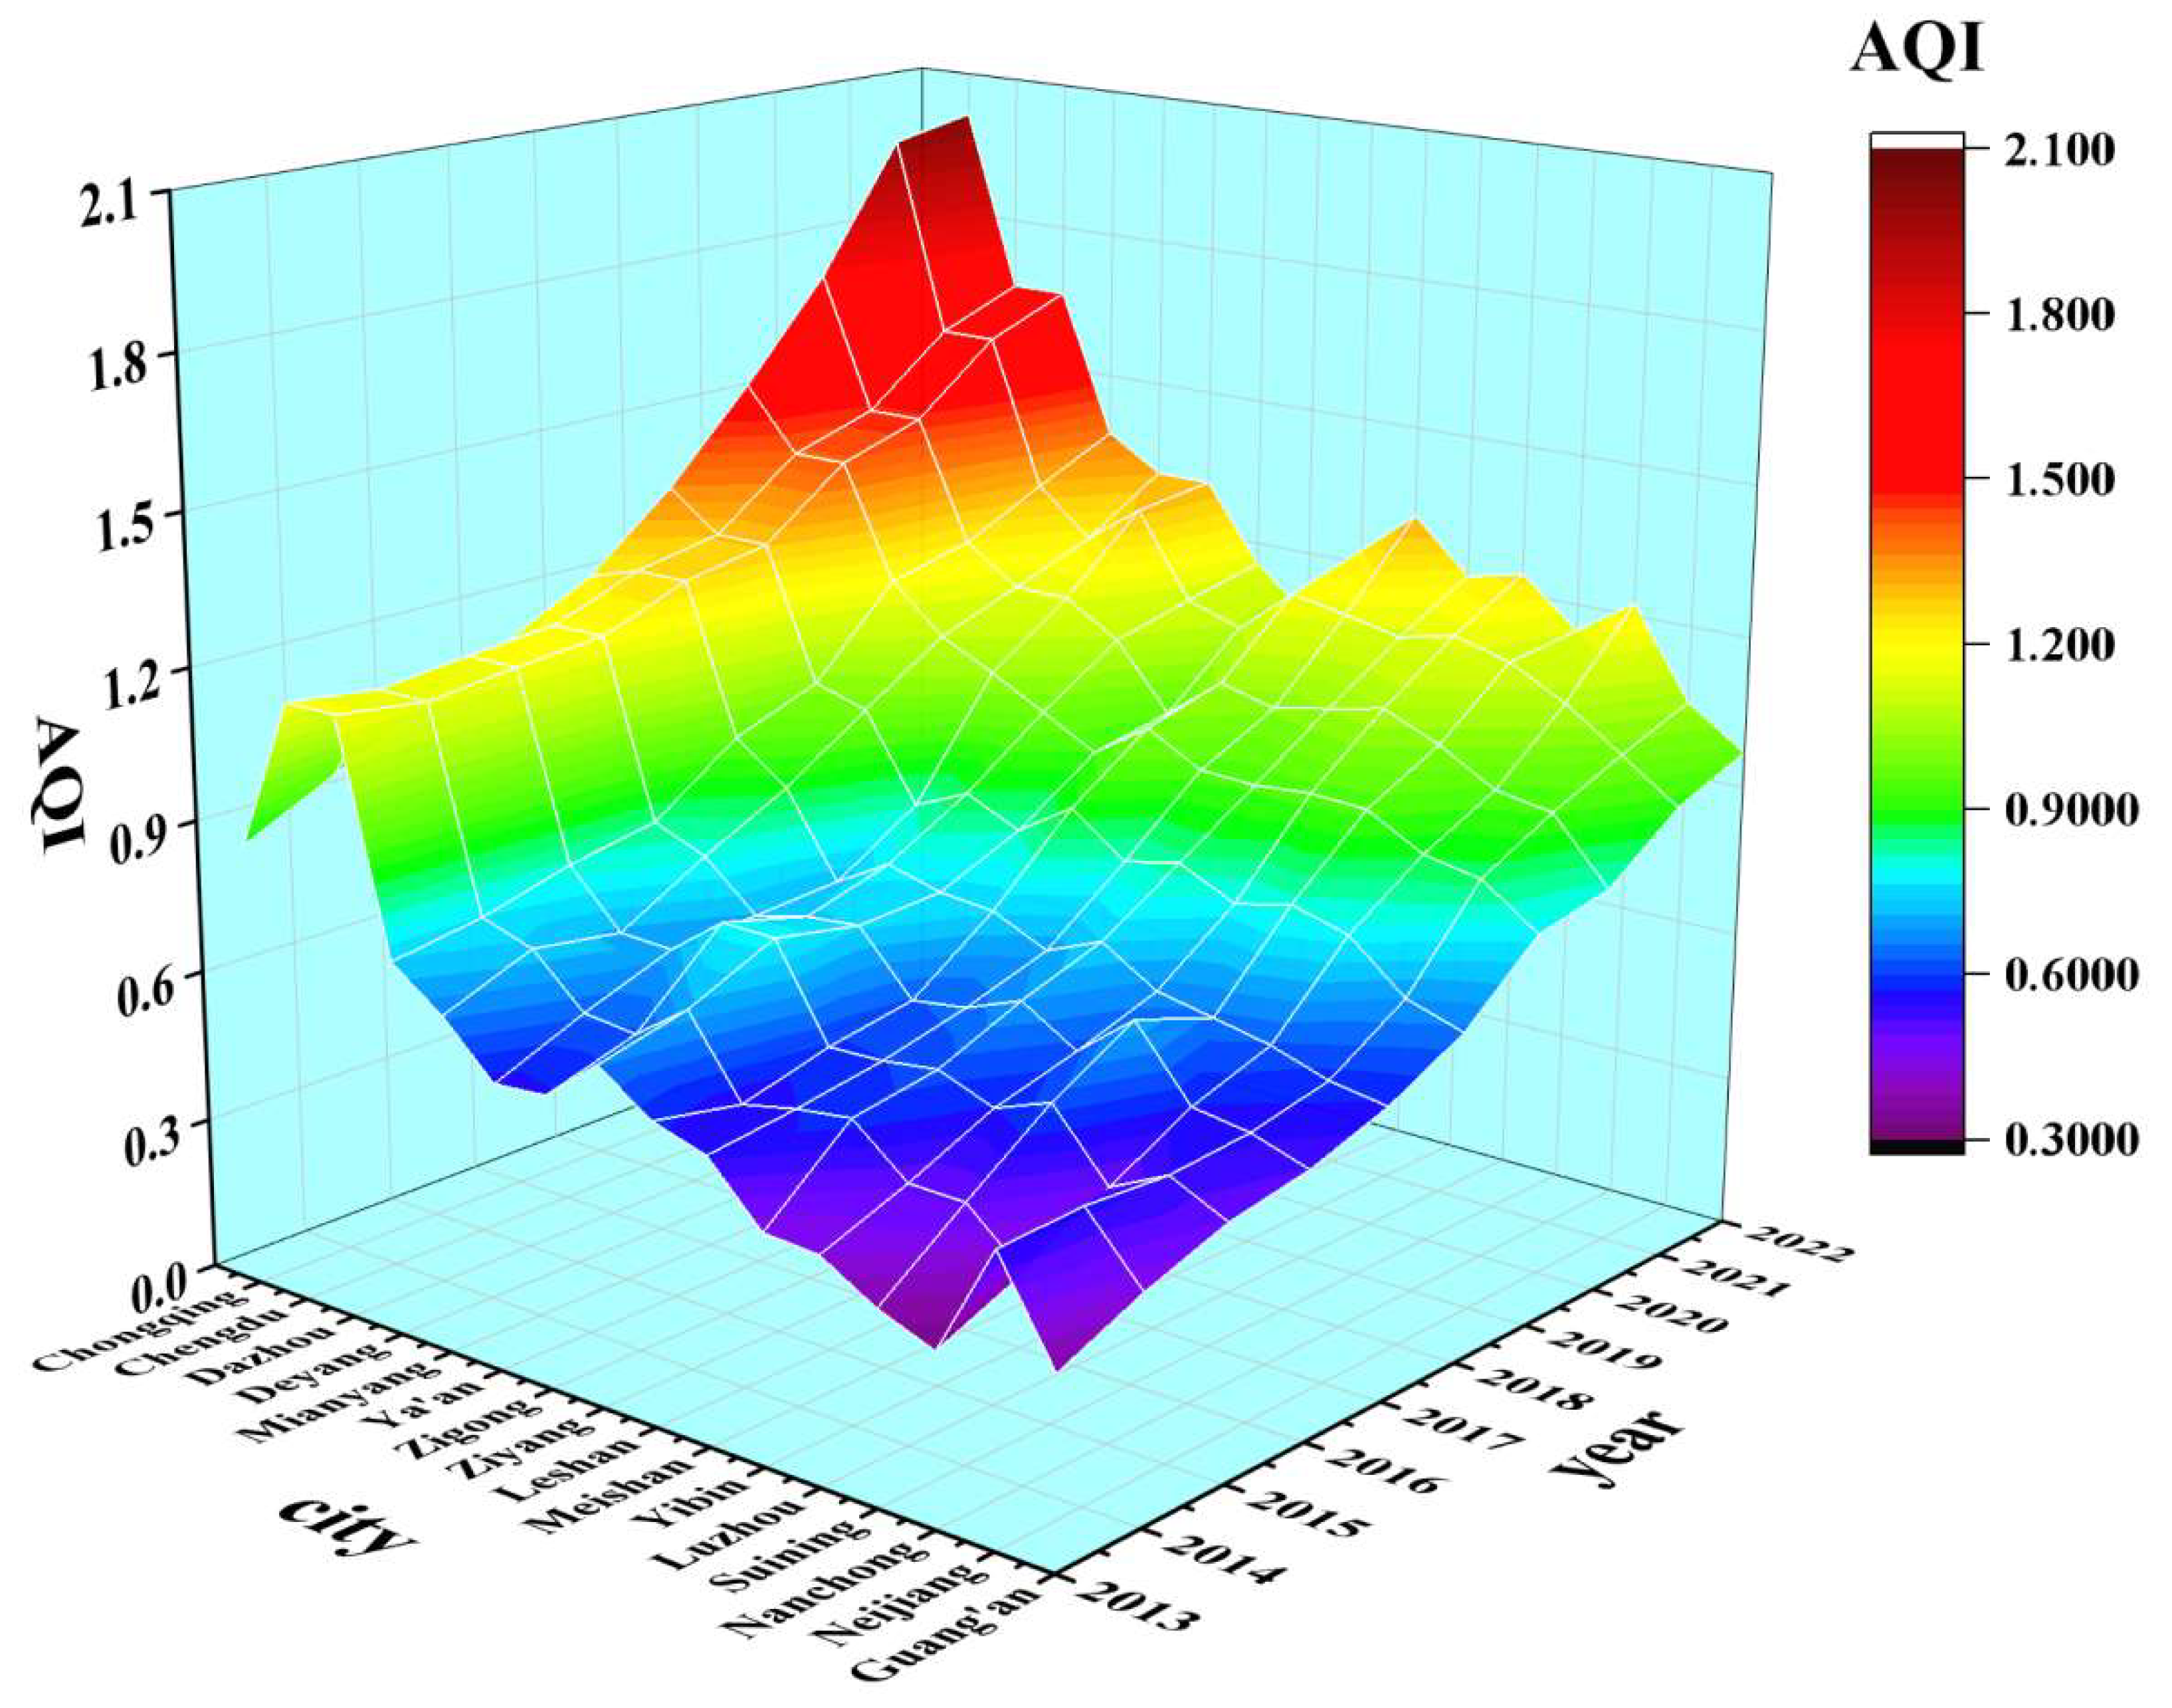
Figure 6.
WCI Odd - year Standard Deviation Ellipse
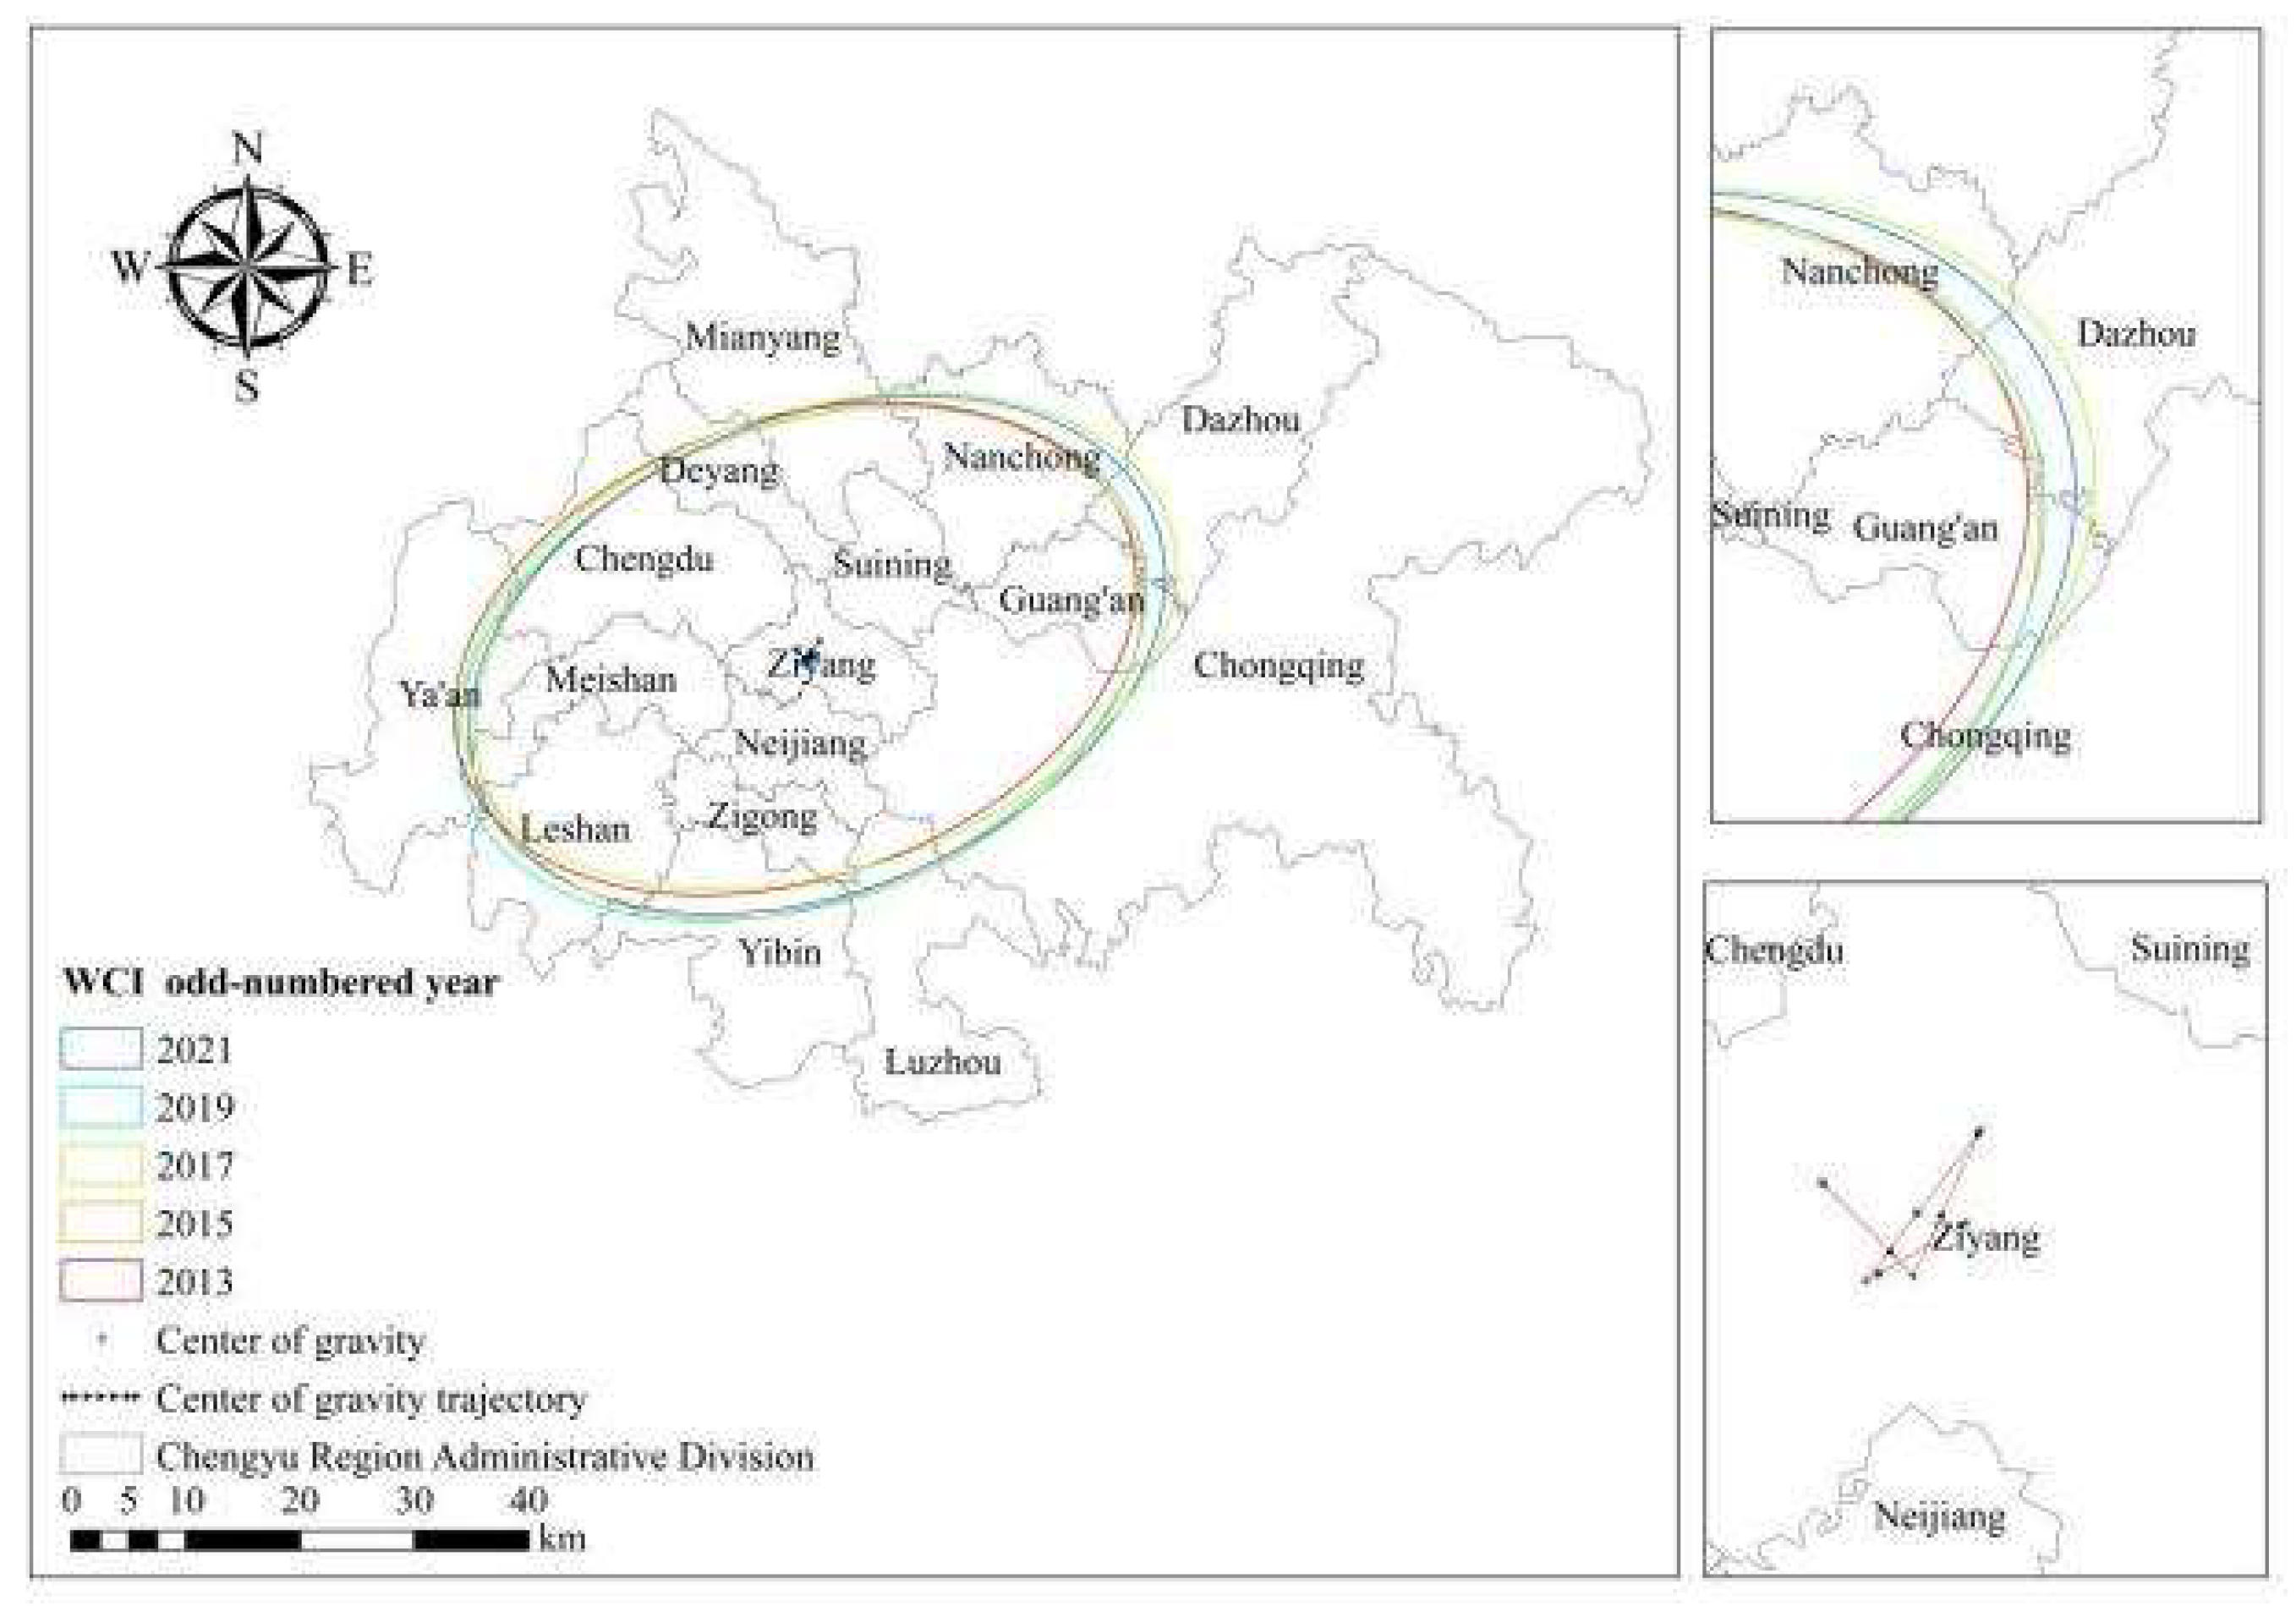
Figure 7.
WCI Even - year Standard Deviation Ellipse.
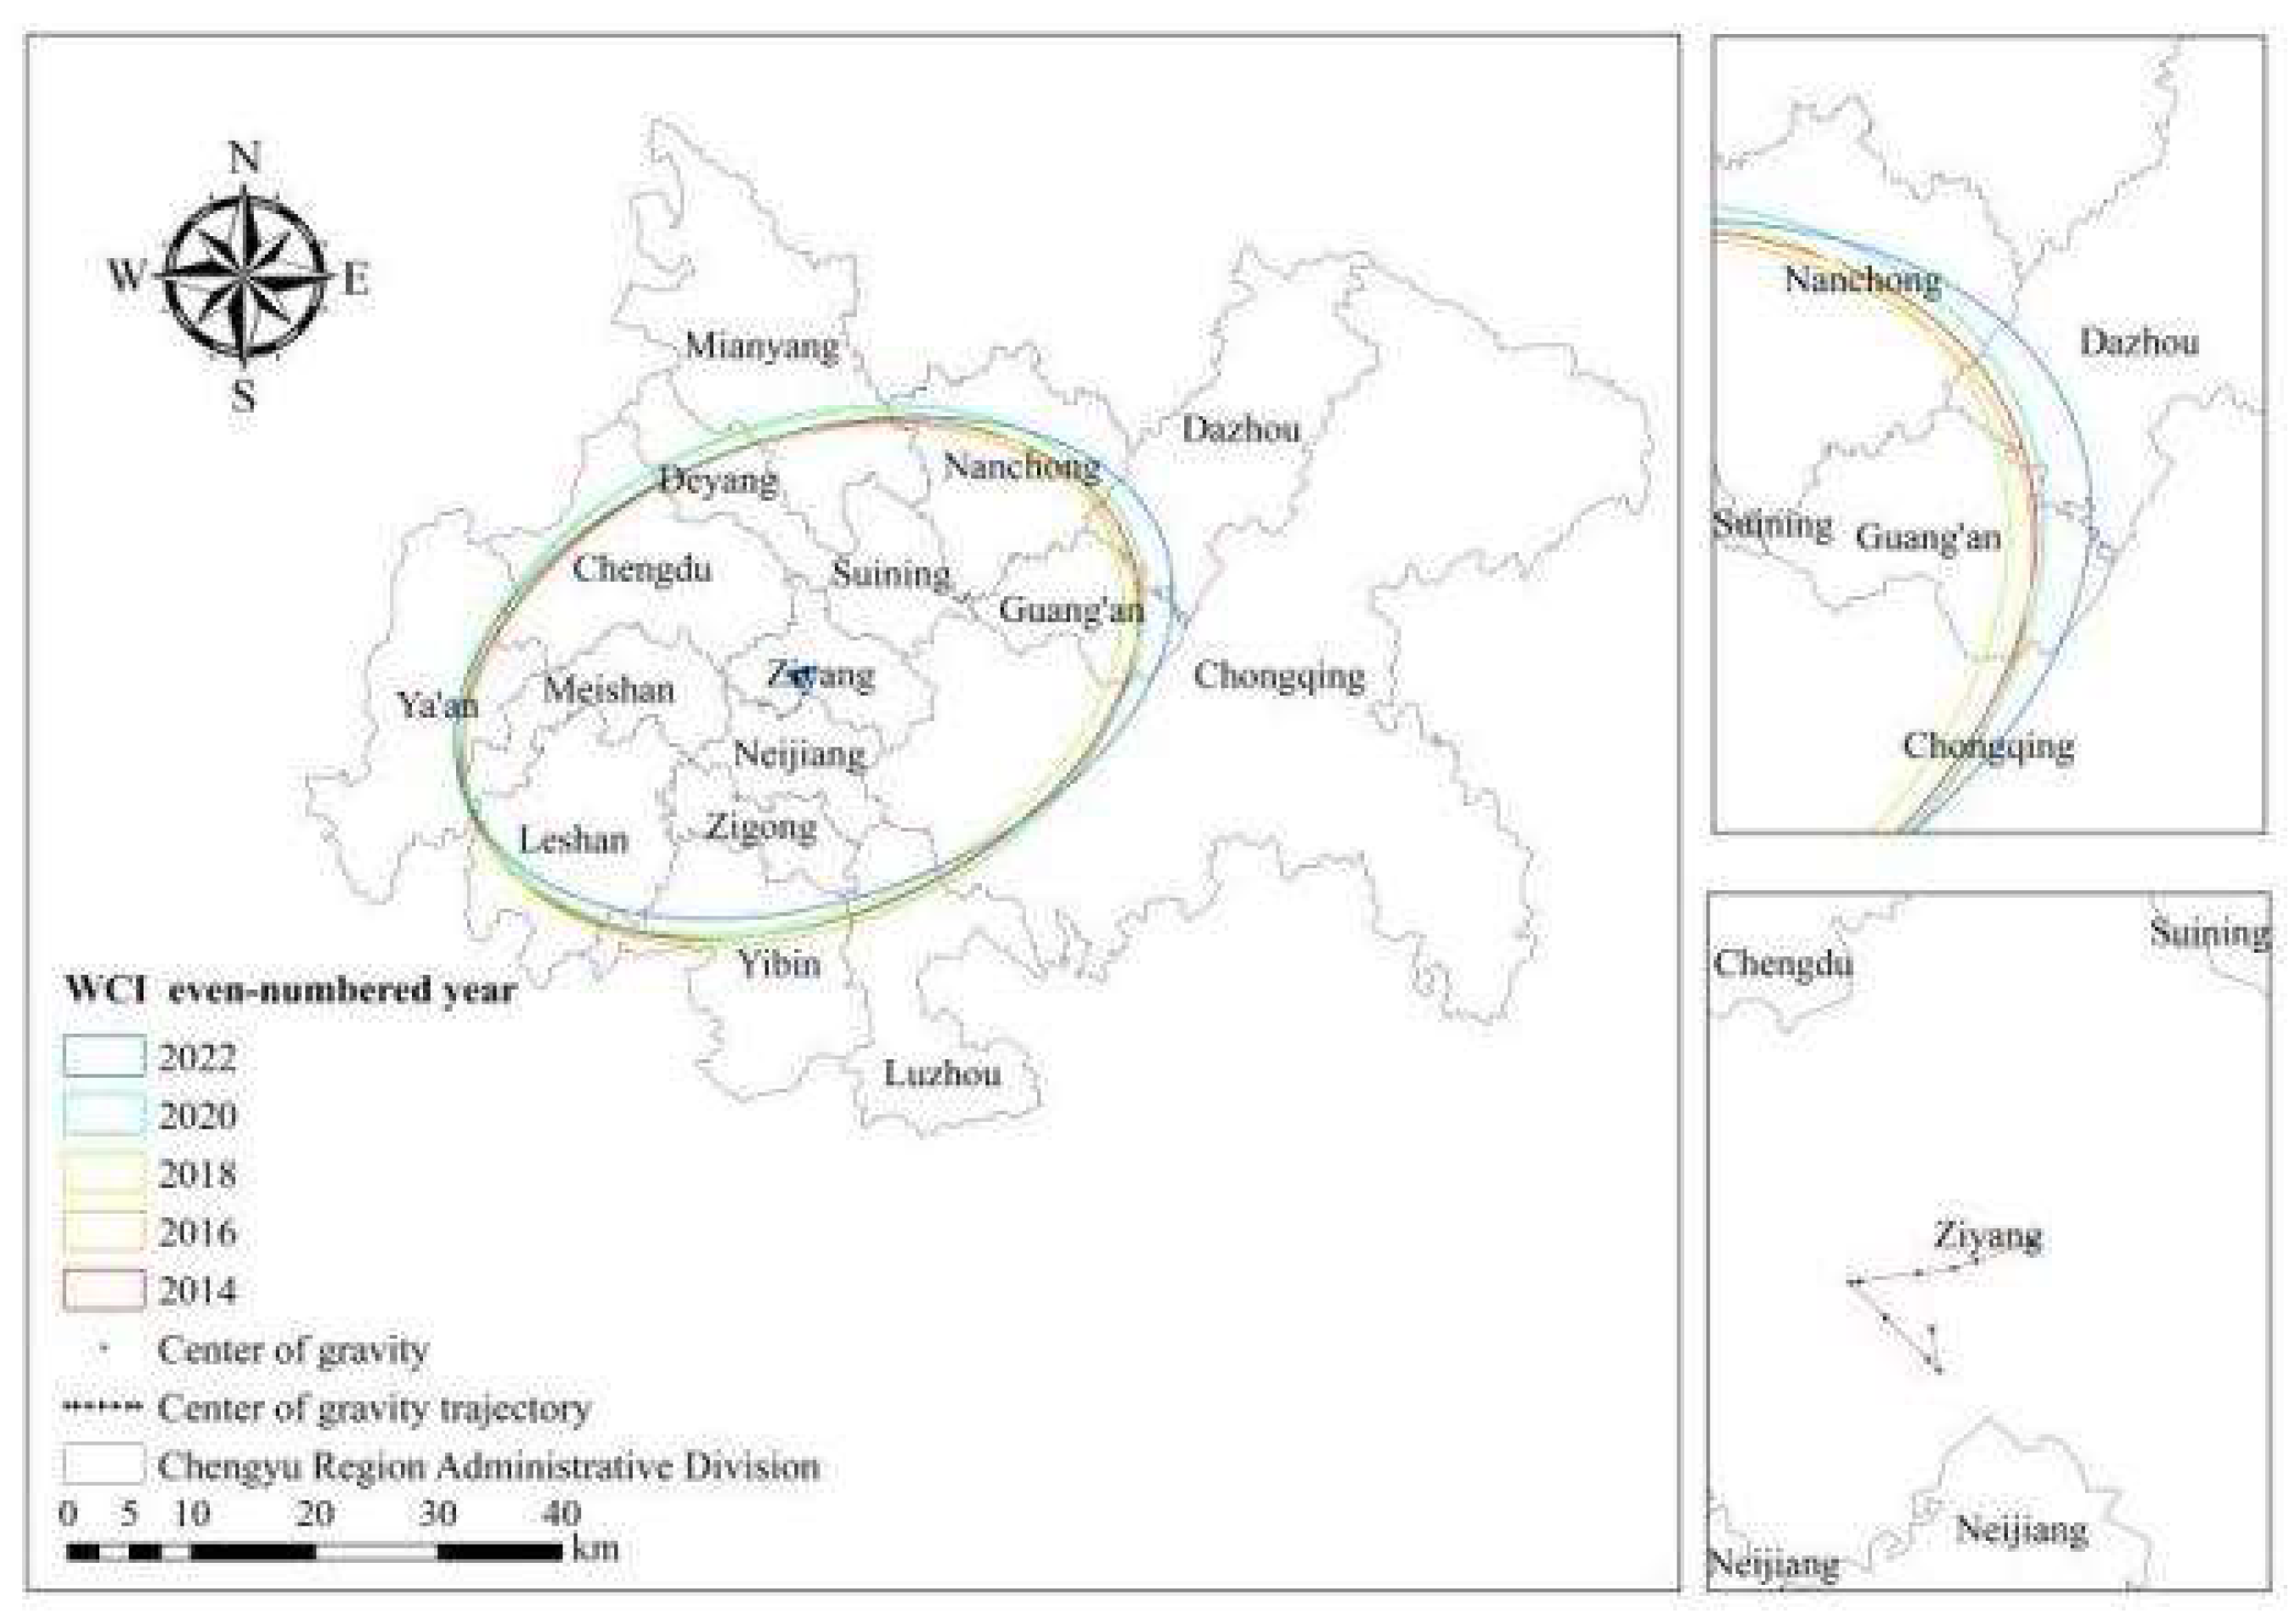
Figure 8.
AQI Odd - year Standard Deviation Ellipse.
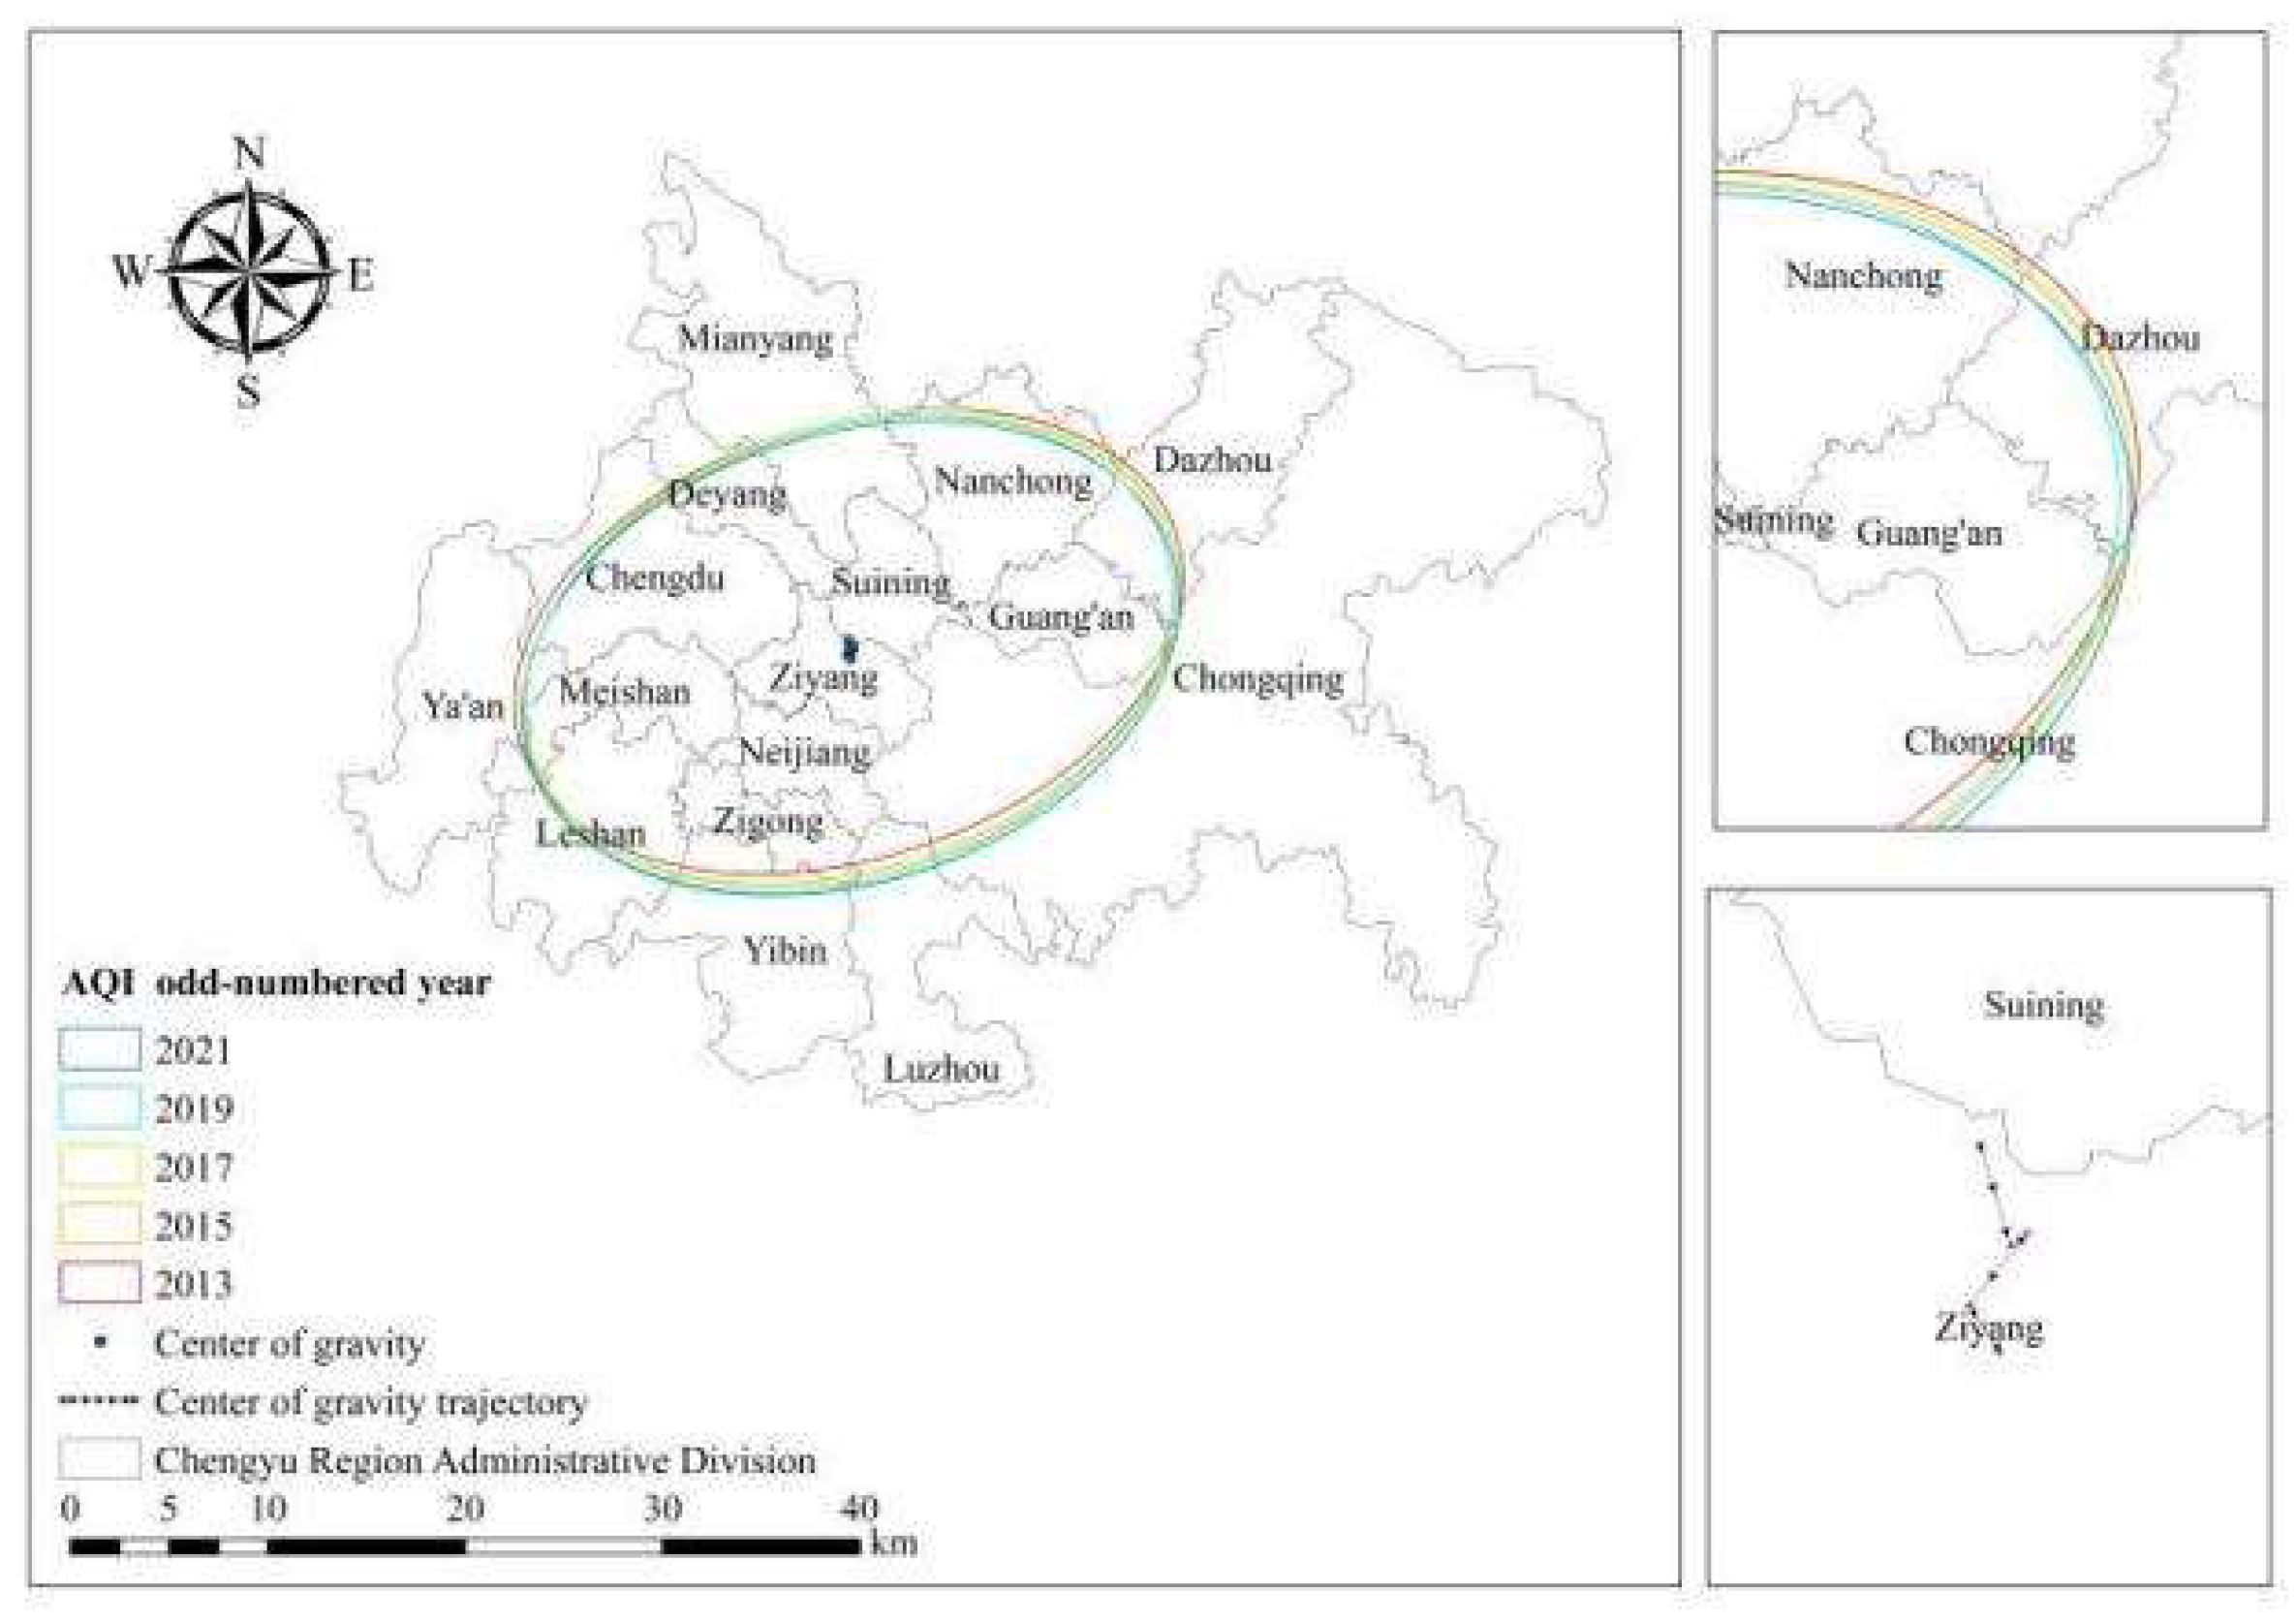
Figure 9.
AQI Even - year Standard Deviation Ellipse.
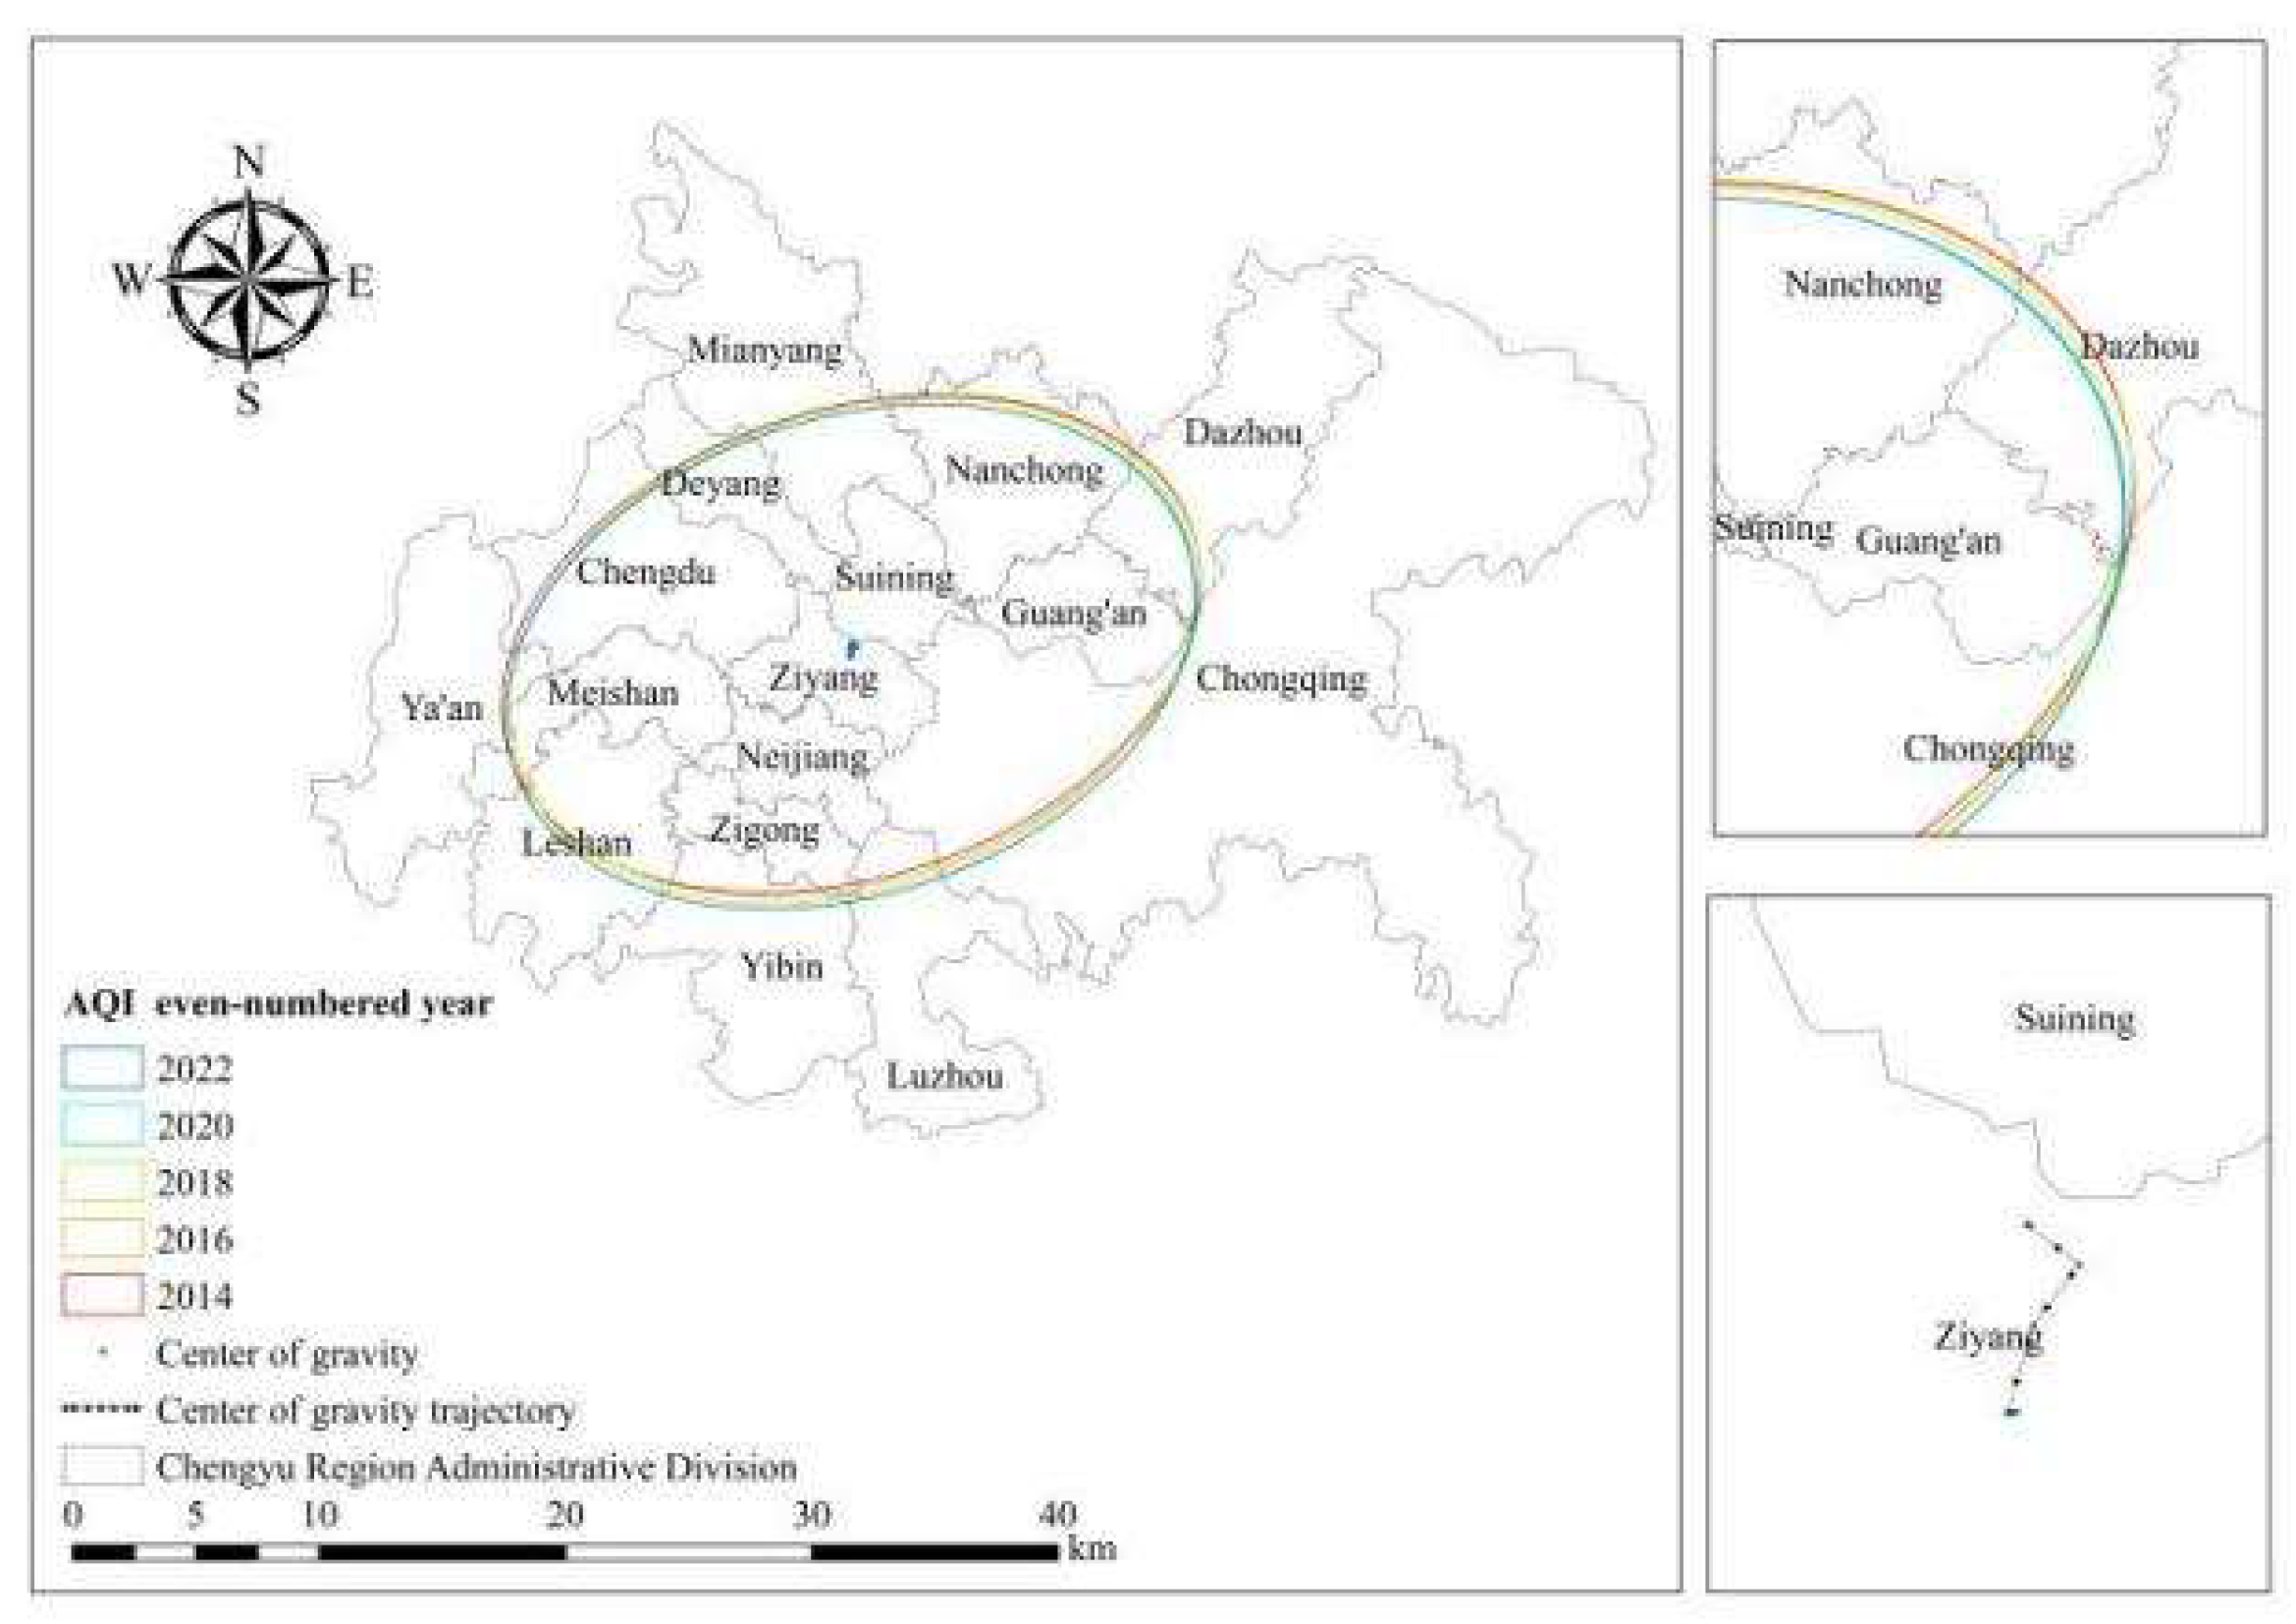
Figure 10.
Ellipse Areas of QAI and WCI and Spatial Disparity Coefficient.
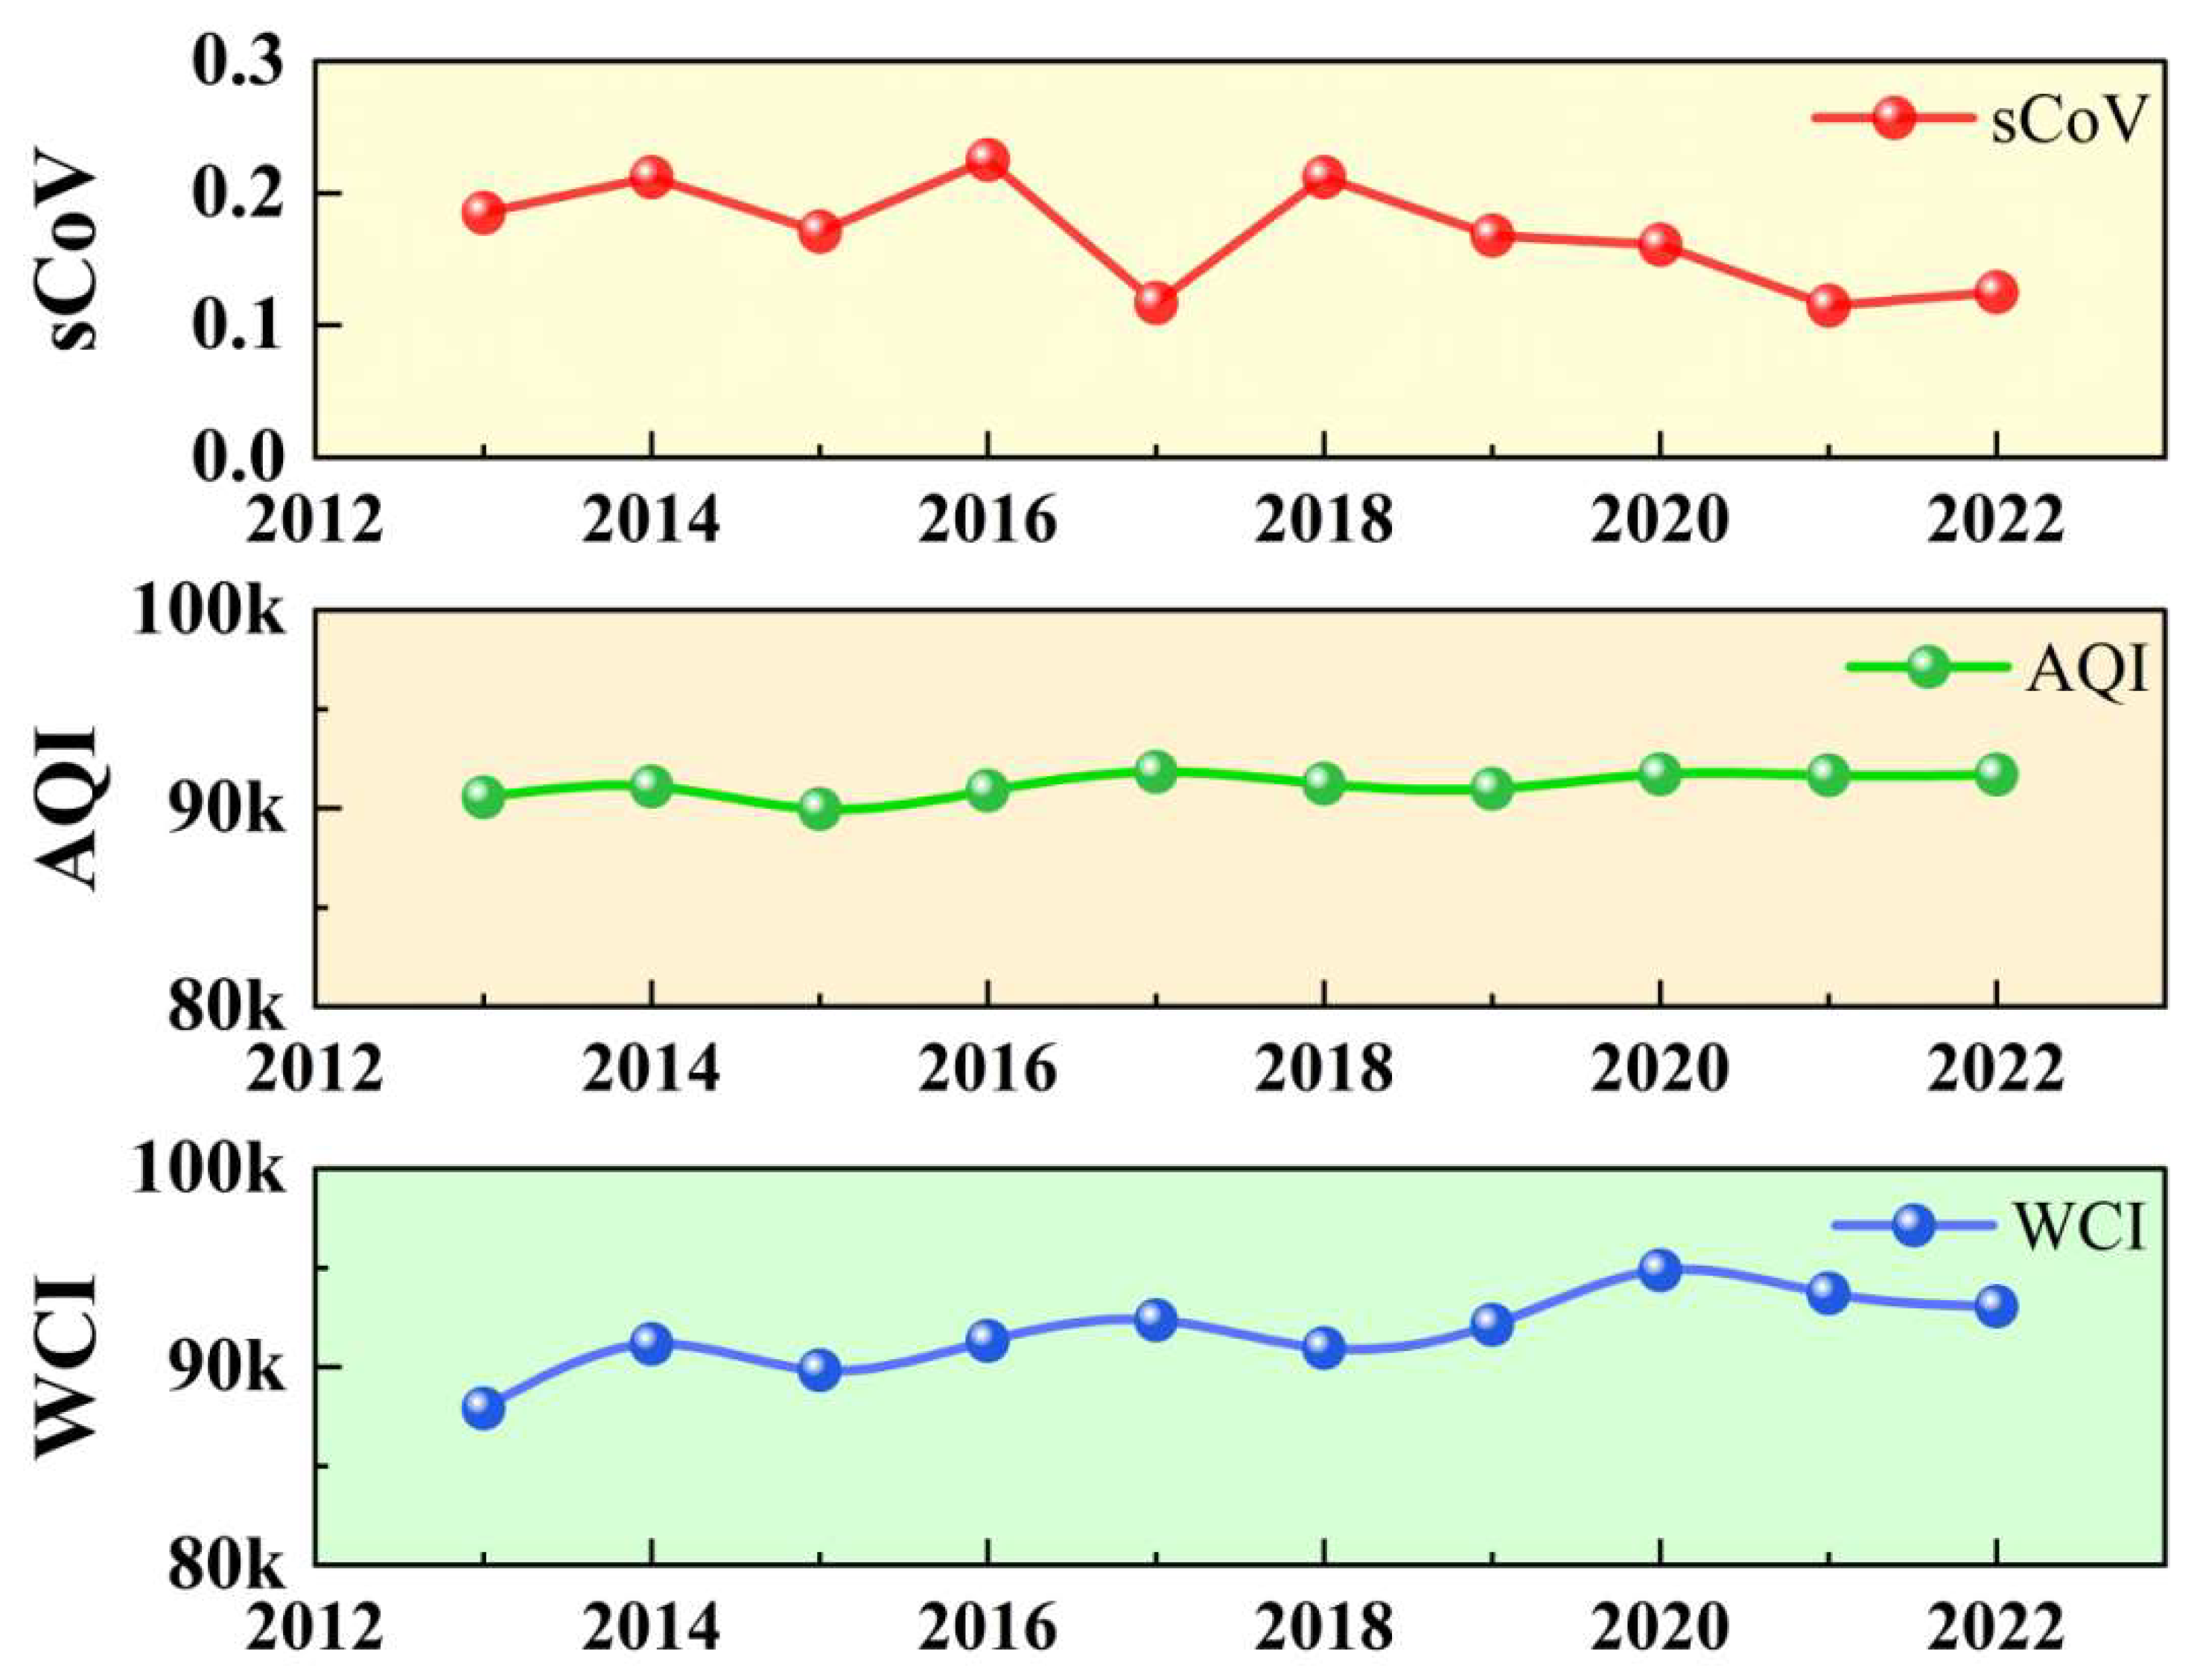
Figure 11.
Forecast Map of Regional Agricultural Quality Index
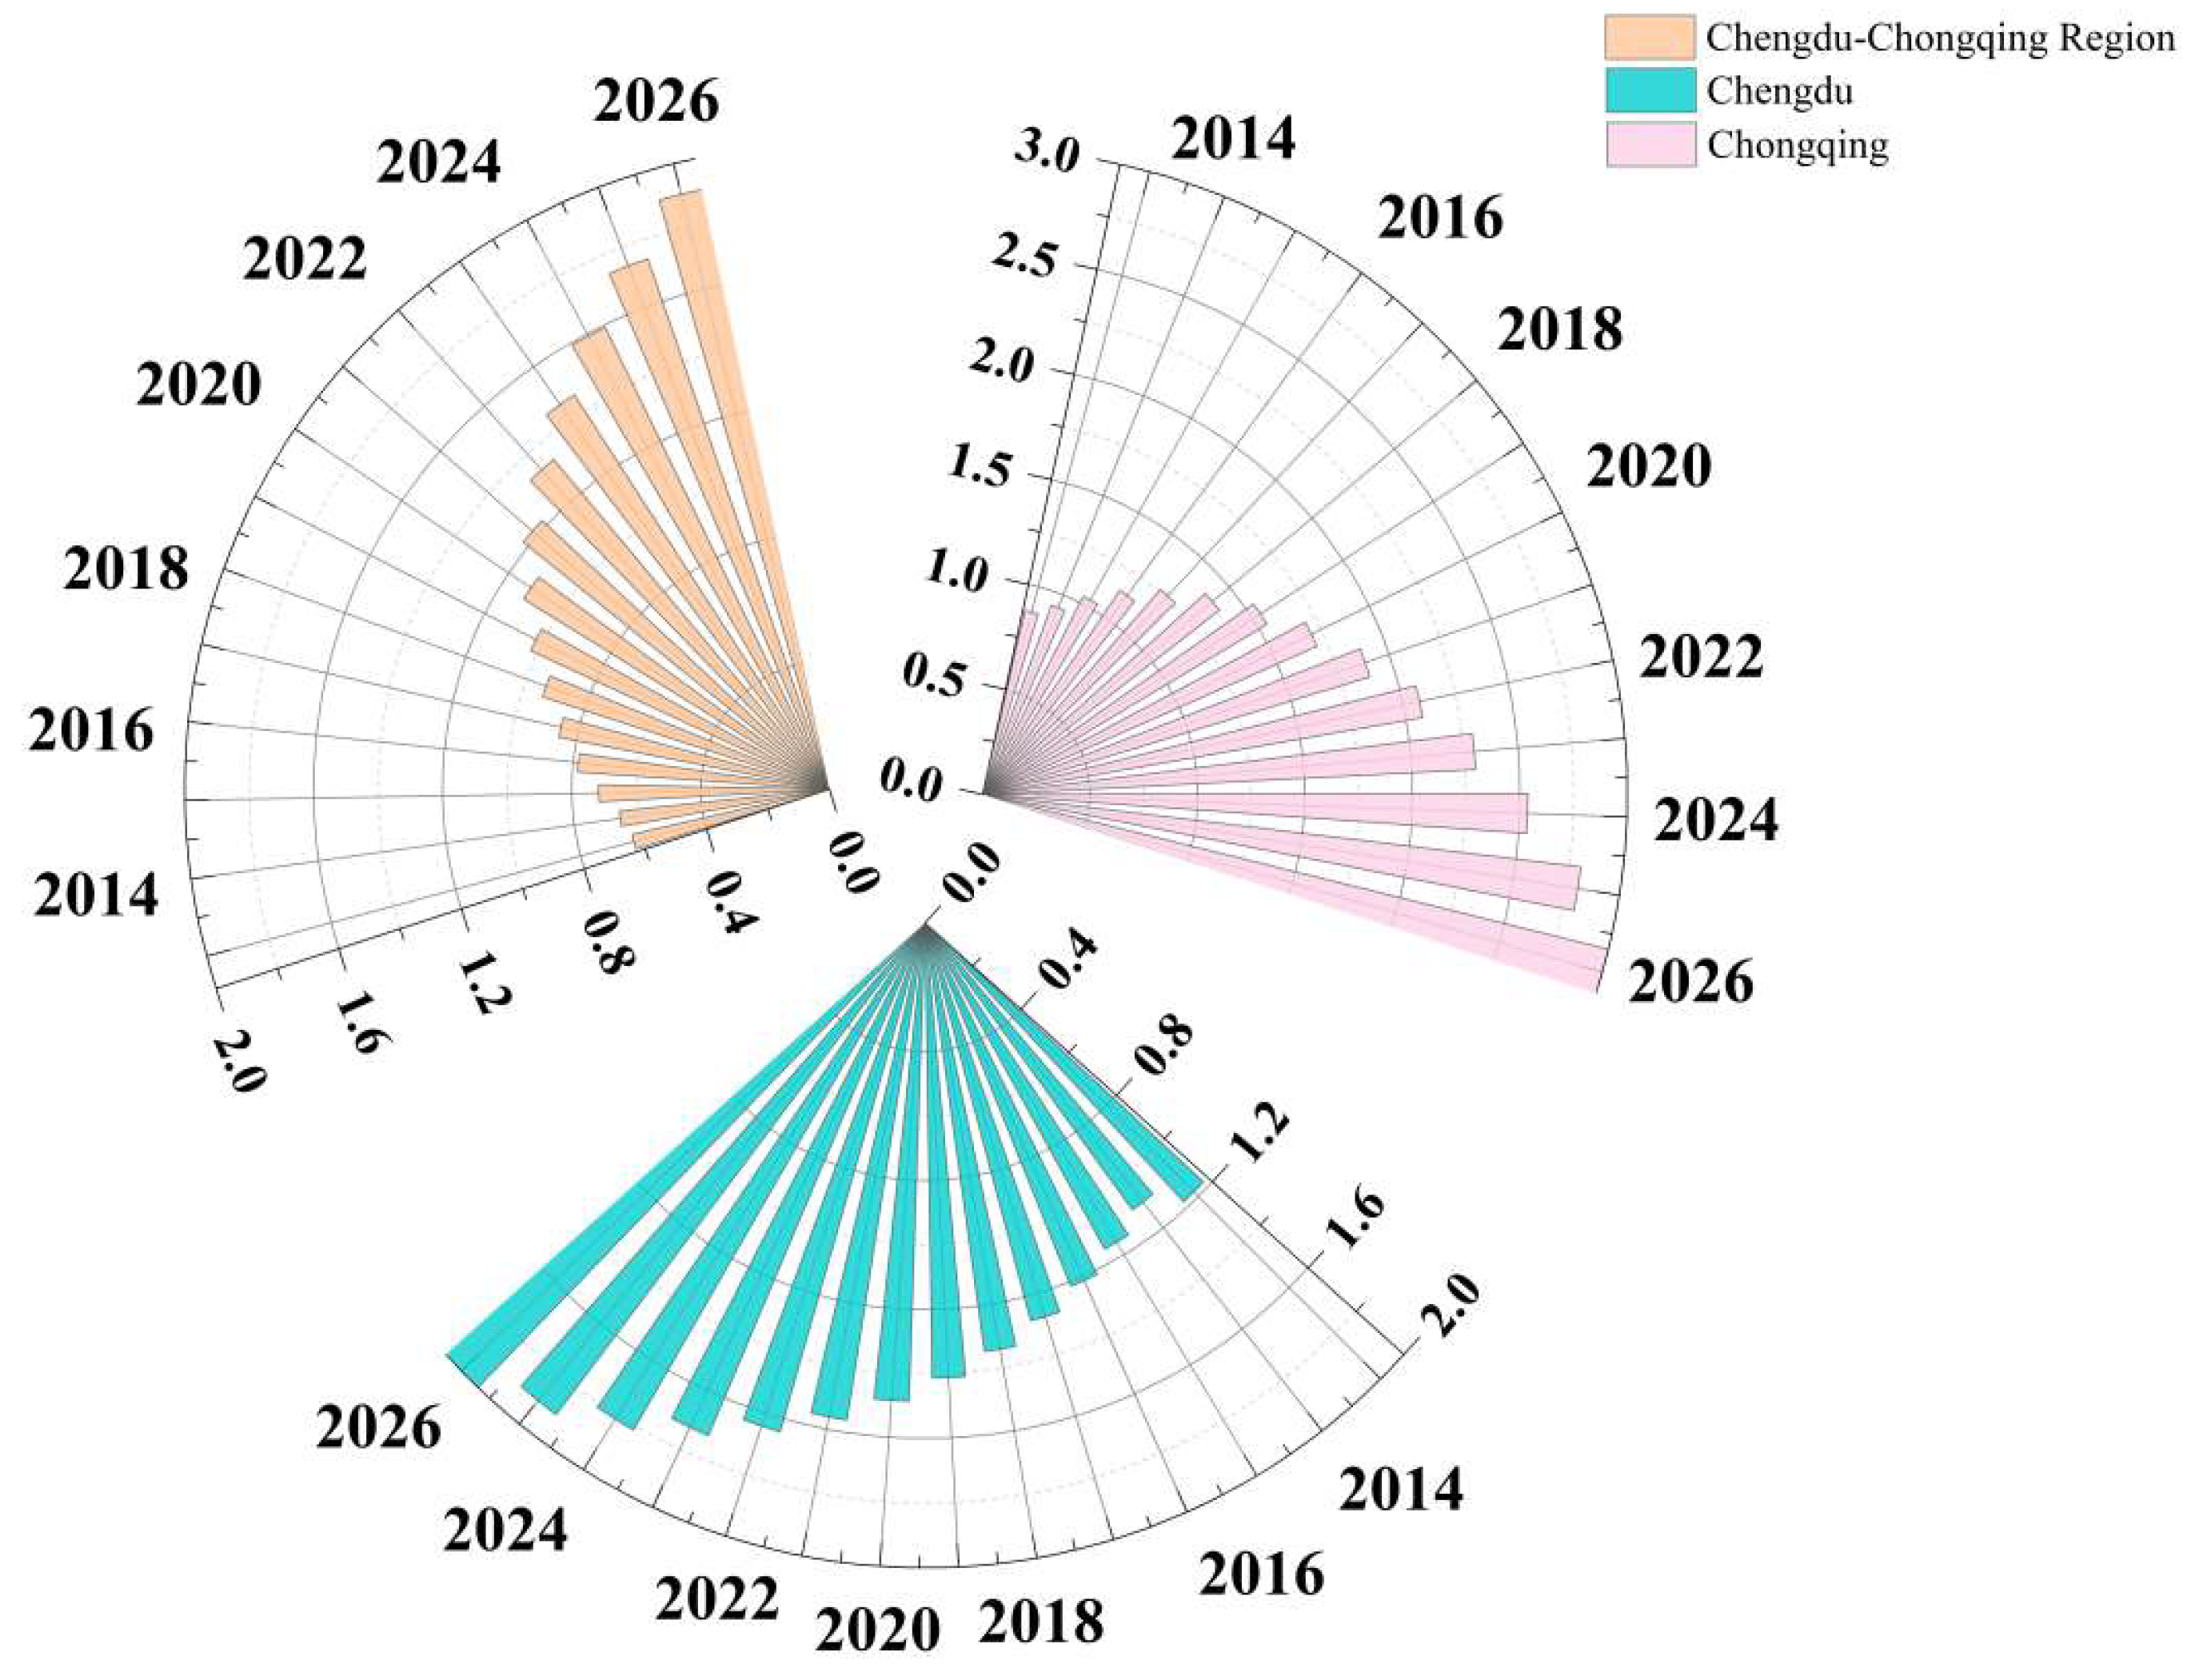

Table 1.
Indicator System for Water Resources Carrying Capacity and Agricultural Development Quality.
Table 1.
Indicator System for Water Resources Carrying Capacity and Agricultural Development Quality.
| Target Layer | Criteria Layer | Indicator Layer |
| Agricultural Development Quality | Economic Development | A11 Agricultural Gross Output Value (+) |
| A12 Grain Yield (+) | ||
| A13 Agricultural Mechanization Level (+) | ||
| Population Development | A21 Number of Agricultural Workers (+) | |
| A22 Urbanization Rate (+) | ||
| A23 Proportion of Primary Industry Workers (+) | ||
| Social Development | A31 Rural Social Security Level (+) | |
| A32 Disposable Income (+) | ||
| A33 Number of Medical Equipment per 100 Rural Residents (+) | ||
| Spatial Construction | A41 Effective Irrigation Area (+) | |
| A42 Rural Per Capita Road Area (+) | ||
| A43 Green Space Coverage Area (+) | ||
| Water Resource Carrying Capacity | Water-Society System | B11 Per Capita Water Resources (+) |
| B12 Water Resource Development and Utilization Rate (+) | ||
| B13 Agricultural Irrigation Water Consumption (+) | ||
| Water Resource System | B21 Water Yield Modulus (+) | |
| B22 Proportion of Surface Water Resources (+) | ||
| B23 Annual Precipitation (+) | ||
| Ecological Environment System | B31 Ecological and Environmental Water Use Rate (-) | |
| B32 Agricultural Pollutant Treatment Rate (+) | ||
| B33 Agricultural Fertilizer Application Amount (-) |
Table 2.
Standard Deviation Ellipse Parameters of WCI and AQI in the Chengdu-Chongqing Region.
| Index | Year | Central Point Coordinates | Area(km²) | Long Axis(km) | Short Axis(km) | Azimuth(°) | |
| Longitude( ° ) | Latitude( ° ) | ||||||
| WCI | 2013 | 104°53′15.73″ | 30°10′43.26″ | 87902.18 | 207.61 | 134.78 | 70.33 |
| 2014 | 104°55′21.14″ | 30°04′08.55″ | 91164.06 | 207.89 | 139.59 | 67.20 | |
| 2015 | 104°58′17.06″ | 30°06′19.73″ | 89824.92 | 204.23 | 140.01 | 68.11 | |
| 2016 | 104°55′41.66″ | 30°02′19.99″ | 91313.36 | 205.40 | 141.52 | 67.59 | |
| 2017 | 105°02′00.40″ | 30°13′10.38″ | 92355.90 | 217.37 | 135.25 | 71.23 | |
| 2018 | 104°51′12.88″ | 30°06′11.52″ | 90938.23 | 204.59 | 141.49 | 66.73 | |
| 2019 | 104°55′44.87″ | 30°06′04.02″ | 92137.18 | 211.48 | 138.69 | 67.64 | |
| 2020 | 104°56′25.43″ | 30°06′48.95″ | 94883.52 | 208.79 | 144.67 | 67.03 | |
| 2021 | 105°01′14.12″ | 30°08′49.87″ | 93704.83 | 213.86 | 139.48 | 67.64 | |
| 2022 | 105°00′30.90″ | 30°07′53.02″ | 93051.38 | 217.90 | 135.94 | 70.65 | |
| AQI | 2013 | 105°12′29.34″ | 30°17′53.03″ | 90556.09 | 214.04 | 134.68 | 71.97 |
| 2014 | 105°13′01.45″ | 30°16′34.94″ | 91099.64 | 211.31 | 137.24 | 71.76 | |
| 2015 | 105°13′25.87″ | 30°15′08.53″ | 89952.52 | 210.12 | 136.28 | 71.68 | |
| 2016 | 105°14′20.07″ | 30°15′42.14″ | 90896.09 | 209.43 | 138.16 | 71.63 | |
| 2017 | 105°13′57.41″ | 30°15′31.14″ | 91836.53 | 209.51 | 139.54 | 71.33 | |
| 2018 | 105°13′09.52″ | 30°14′23.18″ | 91239.08 | 207.97 | 139.65 | 70.88 | |
| 2019 | 105°12′05.48″ | 30°13′31.41″ | 90993.56 | 207.74 | 139.44 | 71.34 | |
| 2020huiche2021huiche2022 | 105°12′28.96″ | 30°12′27.59″ | 91719.27 | 208.27 | 140.19 | 71.72 | |
| 105°13′03.87″ | 30°12′13.38″ | 91657.47 | 209.78 | 139.09 | 72.25 | ||
| 2022 | 105°12′44.44″ | 30°12′28.38″ | 91702.63 | 208.72 | 139.86 | 71.62 | |
Disclaimer/Publisher’s Note: The statements, opinions and data contained in all publications are solely those of the individual author(s) and contributor(s) and not of MDPI and/or the editor(s). MDPI and/or the editor(s) disclaim responsibility for any injury to people or property resulting from any ideas, methods, instructions or products referred to in the content. |
© 2025 by the authors. Licensee MDPI, Basel, Switzerland. This article is an open access article distributed under the terms and conditions of the Creative Commons Attribution (CC BY) license (http://creativecommons.org/licenses/by/4.0/).
Copyright: This open access article is published under a Creative Commons CC BY 4.0 license, which permit the free download, distribution, and reuse, provided that the author and preprint are cited in any reuse.


