

Submitted:
30 October 2025
Posted:
30 October 2025
You are already at the latest version
Abstract
In recent decades, the suspended sediment load (SSL) of many rivers around the world has shown a significant decreasing trend, which is particularly prominent in large river basins such as the Yangtze River and the Yellow River. One of the key challenges currently faced is how to quantitatively determine the relative influence of the dominant factors on the basis of systematically assessing the changing trend of SSL. This study takes the upper reaches of the Yangtze River as the research object. Based on the observation data from representative hydrological stations during 1966–2024, it systematically analyzes the interannual variation trend of SSL in different sections of the study river reach, identifies several mutation points, and divides the SSL change process into a baseline period, change period I, and change period II. Using the SCRCQ (slope change ratio of cumulative quantity) method, the study finds that the contribution ratio of human activities to the reduction of SSL in different sections of the study river reach ranges from 87.5% to 111.9%, the contribution ratio of precipitation change ranges from −14.3% to 12.4%, and the contribution ratio of evapotranspiration change ranges from −0.1% to 0.6%. For the entire upper Yangtze River basin, the contribution ratios of human activities to the reduction of SSL during change period I and change period II are 87.5% and 95.1%, respectively, while those of climate change are 12.4% and 4.9%, respectively. Human activities play an absolutely dominant role in the reduction of SSL in the upper Yangtze River. The results of this study can provide guidance for the scientific management of river reaches with concentrated large-scale reservoirs in the upper Yangtze River, and also offer references for the formulation of management measures for similar rivers worldwide.
Keywords:
suspended sediment load
; changing trend
; influencing factor
; contribution ratio
; precipitation
; evapotranspiration
; human activities
; upper Yangtze River
1. Introduction
As a core parameter characterizing surface processes and material cycles in a river basin, river sediment load serves as a crucial link for maintaining the stability of river channel morphology, the development of estuarine deltas, and the functionality of basin ecosystems. From a geomorphic time scale, changes in river sediment load are purely the result of natural factors, particularly the impacts of climate change [1,2]. However, on a hydrological time scale, due to the development of industry and agriculture as well as the application of new technologies, human intervention in rivers has been continuously intensifying, thereby exerting a non-negligible influence on the river sediment load process. This is especially true in river basins with high population density, where the water-sediment process and river channel evolution have become strongly controlled processes [3,4,5,6,7,8,9,10].
The annual average sediment discharge of the upper reaches of the Yangtze River accounts for the vast majority of the total sediment discharge of the Yangtze River. The sediment transport process in this region not only directly affects the operational lifespan and flood control safety of major water conservancy projects such as the Three Gorges Reservoir (TGR) but also profoundly influences the erosion-siltation balance of the middle and lower reaches of the river channel and the material supply to the ecosystem at the Yangtze River Estuary [11]. From a global scale, abnormal changes in sediment load in river basins have become an important indicator reflecting the response of the Earth’s surface system to climate change and human activities. Conducting research on this topic is not only a scientific endeavor to reveal the mechanisms of erosion and sediment production in mountainous basins but also a practical need to support ecological protection and water resource management in the Yangtze River Economic Belt [12].
Recent research findings indicate that the significant reduction in river sediment load is the result of the coupling effect of natural driving forces and human activities, with the impact of human activities being particularly prominent [13,14,15]. The contribution mechanisms of these two factors exhibit significant differences across temporal and spatial scales. Among natural factors, precipitation indirectly alters sediment transport capacity by regulating runoff, making it the dominant factor for short-term fluctuations in sediment load. The characteristics of "low water volume but high sediment content" in the Jinsha River Basin during the 1980s were directly related to spatial variations in precipitation [11].
Human activities, on the other hand, have become the core driver of dramatic changes in sediment load over the past half-century. Among these activities, the sediment trapping effect of cascade reservoir construction is the most prominent, for instance, cascade reservoirs in the Jinsha River Basin contribute as much as 67.03% to the reduction in sediment load [16]. Soil and water conservation projects and vegetation restoration also reduce sediment by improving the properties of the underlying surface, with their contribution reaching 22.95% [16]. For instance, the Jialing River Basin has achieved a significant reduction in slope erosion and sediment yield due to effective vegetation restoration [11]. In addition, engineering construction may lead to local sediment increase: 74.7% of the increase in sediment load in the Jinsha River Basin from 1983 to 2000 was attributed to the impact of engineering activities [17]. Meanwhile, activities such as river sand mining further exacerbate the complexity of the sediment transport process by altering the path of sediment movement [18].
Although extensive research has been conducted on changes in sediment load in the upper reaches of the Yangtze River, gaps remain in understanding its temporal and spatial differentiation and driving mechanisms. Observational data show that the sediment load in the upper Yangtze River exhibits significant phased and regional differences. From 1954 to 1996, the sediment load at the Yichang Station (a key station on the main stream) fluctuated normally, but after the 1980s, the sediment load at the Beibei Station (on the Jialing River) decreased significantly, the sediment load at the Pingshan Station (on the Jinsha River) showed an increasing trend [11]. After 2003, influenced by the completion and operation of the TGR, the reduction range of sediment load in the upper Yangtze River further expanded, with an average annual sediment reduction of 450 million tons from 2003 to 2007 [17]. Attribution studies have confirmed the dominant role of human activities: 91.2% of the sediment reduction in the upper Yangtze River from 1994 to 2002 was caused by anthropogenic factors [17], while climate change contributed only 14% to the sediment reduction [12].
Nevertheless, research on sediment transport in the upper Yangtze River remains insufficient. For example, the dynamic transition law of driving factors for sediment load changes over long-term data sequences is unclear; The quantification of the coupling effect of climate change and human activities on sediment load changes is inadequate [18]; Research on the ecological response to sediment load changes lags behind.
To address some of the aforementioned research gaps, this study takes different river sections of the upper Yangtze River as comparative regions and integrates hydrological observation data (from 1966 onwards) from key hydrological stations in each section and meteorological observation data from the upper river basin. The objectives are as follows: 1. Systematically analyze the long-term variation trend and spatial differentiation law of suspended sediment load (SSL) in the upper Yangtze River; 2. Identify key abrupt change points of SSL changes in different sections and their regional differences, clarify the baseline period and change period of SSL evolution; 3. Quantitatively decouple the contribution ratios of natural factors, such as precipitation and evapotranspiration (ET), and human activities to SSL changes in different periods, and reveal the temporal and spatial variability of driving mechanisms. The results of this study can provide a scientific basis for formulating management measures for the long-term sustainable utilization of large-scale reservoir groups in the upper reaches of the Yangtze River, and also offer theoretical guidance for formulating river management measures in similar river basins around the world and for the coordinated regulation of water conservancy projects.
2. Study Area, Dataset and Methods
2.1. Study Area
As the longest river in China and the third-longest in the world, the Yangtze River has a total length of 6,397 km and a total basin area of 1.8085×10⁶ km² [19]. It flows through 11 provincial-level administrative regions in China, with approximately 480 million residents living within its basin. Therefore, it holds extremely significant importance for China's socioeconomic development and environmental health maintenance [20]. Due to its extensive distribution area and distinct topographic features, the Yangtze River is generally divided into three typical reaches: the upper, middle, and lower reaches.
The research object of this study is the upper reach of the Yangtze River, which is located above the Yichang Hydrological Station (Figure 1). Its basin ranges from 24°27′40″N to 35°45′10″N in latitude and from 90°32′4″E to 110°45′10″E in longitude. The length of the main stream is approximately 4,504 km, accounting for 71.4% of the total length of the Yangtze River channel, as well as the basin area is 1.0055×10⁶ km² [21], representing 55.6% of the total basin area of the Yangtze River. The terrain gradually decreases from west to east, with an elevation difference of 6,421 meters, and the average slope of the main channel is 1.1‰. This reach consists of the Jinsha River and the Chuan River: the section above Yibin City is the Jinsha River, while the section between Yibin City and Yichang City is the Chuan River.
The Jinsha River has a basin area of 0.4588×10⁶ km², accounting for approximately 45.63% of the upper Yangtze River basin and 25.49% of the entire Yangtze River basin [22]. Its channel length is 3,496 km. Among this, the section above the Batang River Estuary in Yushu Tibetan Autonomous Prefecture, Qinghai Province, has a length of 1,206 km and a basin area of 0.1027×10⁶ km², with an average surface elevation of up to 4,500 meters. The section from the Batang River Estuary to Yibin City is 2,290 km long, with an average slope of 1.45‰. The inter-basin area of the Chuan River section is approximately 0.5322×10⁶ km² (accounting for 29.43% of the total Yangtze River basin area), and its channel length is 1,040 km [23].
The main tributaries of the upper Yangtze River are the Yalong River (with an basin area of 12.84 km²), the Minjiang River, the Jialing River, and the Wujiang River. Their total area (0.5035×10⁶ km²) accounts for approximately half (50.07%) of the total basin area of the upper Yangtze River. The tributaries flowing into both sides of the Three Gorges Reservoir area are relatively small, with a total basin area of approximately 0.1715×10⁶ km², accounting for only 17.06% of the total basin area of the upper Yangtze River. The main and tributary channels in this region flow through a series of steep canyon sections, boasting abundant hydropower resources. A series of dams and hydropower stations have been built here, including six large-scale hydropower stations (Table 1).
The western plateau and mountainous areas in the upper Yangtze River basin have a cold climate, while other regions feature a subtropical humid monsoon climate. The annual average temperature ranges from −4℃ to 18℃, the annual average precipitation and evaporation are 400–1,200 mm and 400–700 mm respectively [24], and the annual average runoff is approximately 4.51×10¹¹ m³. Affected by the monsoon, the precipitation in the upper Yangtze River exhibits significant seasonal variation: approximately 75% of the annual runoff and 85% of the annual sediment load are concentrated in the rainy season (May–October). Due to regional differences in topographic, climatic, and other conditions, the phenomenon of "different sources of water and sediment" in the upper Yangtze River is prominent [25].
2.2. Dataset
The data involved in this study include hydrological data from major hydrological stations on the main stream and tributaries of the upper Yangtze River, as well as meteorological data within the basin. Considering the completeness and comparability of the data, the time series is uniformly selected as 1966–2024. The hydrological stations include Xiangjiaba (XJB) Station (Pingshan Station), Zhutuo (ZT) Station, and Yichang (YC) Station (Table 2) on the main stream of the upper Yangtze River, as well as Beibei Station at the estuary of the Jialing River (a tributary) and Wulong Station at the estuary of the Wujiang River (a tributary). The hydrological data of the aforementioned hydrological stations are measured data from the professional team of the Changjiang Water Resources Commission, which are recorded in the annual Hydrological Data of the Yangtze River Basin [26] and China River Sediment Bulletin [27].
For the runoff or sediment data input to the Three Gorges Reservoir area, the sum of the runoff or sediment data of the corresponding years from the following hydrological stations is adopted: the Zhutuo Station on the main stream, the Beibei Station at the outlet of the Jialing River (a tributary), and the Wulong Station at the outlet of the Wujiang River (another tributary). For the runoff or sediment data output from the Three Gorges Reservoir area, the observed values from the Yichang Hydrological Station at the outlet of the upper reaches of the Yangtze River are used.
This study encompasses approximately 50 meteorological stations, which are relatively evenly distributed across the upper reaches of the Yangtze River Basin. The types of meteorological data include precipitation, average temperature, maximum temperature, minimum temperature, relative humidity, average wind speed, sunshine duration, etc. These basic data are all daily average values, downloaded from the Meteorological Data Network of the National Meteorological Information Center of China (http://data.cma.cn).
Other types of data used in this study, such as annual precipitation and annual potential ET, are calculated based on the aforementioned basic data respectively.
2.3. Methods
2.3.1. Methods for Identifying Inflection Points in Data Time Series
The combination of methods such as anomaly, cumulative anomaly, and double mass curve can intuitively identify inflection points in a data series. Among these, the calculation method for anomaly involves subtracting the average value from each data point in the original data series (xᵢ) to obtain a new data series (Xᵢ). From the curve of this new data series, one can intuitively identify data points or intervals in the original data series that are higher or lower than the average value.
The cumulative anomaly method is a commonly used data analysis approach in fields such as meteorology and hydrology, and it has been widely applied with significant effectiveness [28,29]. Its principle is to sum each value in the anomaly series with all previous anomaly values to form a cumulative anomaly series (Xₜ). The cumulative anomaly curve allows for convenient identification of major mutation points (peaks or valleys of the curve) in the original data series. Its calculation formula is shown in Equation (1):
In Equation (1), Xₜ denotes the cumulative anomaly series; xᵢ represents the original data series; and is the average value of the original data series.
The rescaled adjusted partial sums (RAPS) developed by Garbrecht and Fernandez (1994), is a mathematical transformation method used in time series analysis to handle data variability and highlight underlying trends. It is commonly applied in data analysis within fields such as climatology and hydrology. Its mathematical expression is as follows:
Where, k and are the all number and the individual value of the time series respectively, and t = 1, 2, ..., k is the counter during the summation process; the average value and the standard deviation of all members in the time series, respectively [30]. This method is easy to apply because it only requires the mean and standard deviation of the sequence to be detected and involves simple calculations.
The double mass curve method, proposed by [31], is suitable for analyzing long-term scale variation trends between a pair of interrelated factors in disciplines such as hydrometeorology. Its principle is as follows: for the corresponding cumulative series of two interrelated factor series, a change in the slope of the scatter trend line formed in a Cartesian coordinate system indicates the occurrence of a mutation. The time corresponding to the slope mutation point is the time when a mutation occurs in the cumulative relationship between the two variables; if the slope remains unchanged, no mutation has occurred in the original data.
2.3.2. Methods for Calculating Potential ET
The FAO56-PM method, recommended by the Food and Agriculture Organization (FAO) of the United Nations, takes into account the impacts of various environmental factors (such as temperature, sunshine duration, wind speed, and humidity) on ET. It has a solid theoretical foundation and clear physical meaning, and has been widely applied in practices like climatic regionalization [32]. The calculation formula of this method is shown in Equation (3):
In Equation (3):
- E₀ refers to the daily potential ET (unit: mm);
- G denotes the soil heat flux density (unit: MJ·m⁻²·d⁻¹);
- T represents the daily average air temperature at a height of 2 m (unit: °C);
- u₂ is the wind speed at a height of 2 m (unit: m·s⁻¹);
- eₛ stands for the mean saturation vapor pressure (unit: kPa);
- eₐ is the actual vapor pressure (unit: kPa);
- ∆ indicates the slope of the saturation vapor pressure curve (unit: kPa·°C−1);
- γ denotes the psychrometric constant (unit: kPa·°C−1);
- Rₙ represents the net radiation at the land surface (unit: MJ·m⁻²·d⁻¹).
The net radiation at the land surface (Rₙ) is calculated from the net shortwave radiation at the land surface (Rₙₛ) and the net longwave radiation at the land surface (Rₙₗ).
2.3.3. Calculation Method for Contribution Ratio of Dominant Factors
The SCRCQ method, proposed by [4], can decouple the relative contribution rates of precipitation, potential ET, and human activities to changes in watershed runoff. Changes in precipitation within a watershed directly affect runoff variations, which in turn influence changes in sediment load; meanwhile, changes in potential ET also impact runoff variations, thereby affecting sediment load changes as well. Due to the inherent close relationship between runoff and sediment load in a watershed, the SCRCQ method can be extended to the analysis of the relative contribution rates of relevant dominant factors to changes in watershed sediment load. Compared with the baseline period, the calculation formulas for the relative contribution rates of precipitation, potential ET, and human activities to sediment load changes are shown in Equations (3), (4), and (5), respectively:
In the above equations, and respectively represent the relative contribution rates of precipitation, potential ET, human activities, and groundwater to changes in sediment load. Since the annual-scale changes in groundwater over large areas within the basin are not significant, in Equation (6) can be neglected. , , and respectively denote the slope values of the linear fitting relationships for the time-sequential cumulative precipitation, cumulative potential ET, and cumulative SSL after the inflection point (mutation) (i.e., during the change period); respectively represent the slope values of the linear fitting relationships for the corresponding cumulative sequences before the inflection point (mutation) (i.e., during the baseline period).
3. Results
3.1. The change Trend of Suspended Sediment Load
Figure 2 shows that the SSL at representative hydrological stations and the net SSL in the typical intervals involved in the upper reaches of the Yangtze River have collectively exhibited a significant decreasing trend over the long-term time series of nearly 60 years. The differences lie in the fact that the inflection points (where sediment discharge decreases significantly or undergoes abrupt changes) occur in different years, and the gradients of the decrease also vary.
3.1.1. Changes in SSL at the Hydrological Stations
The SSL at XJB hydrological station exhibited drastic fluctuations with an ambiguous changing trend during 1966–1974, while showed a fluctuating upward trend during 1975–1997. It began a significant downward trend starting from 1998, as well as decreased to the minimum value in 2013, after which it remained steadily at this minimum level (Figure 2a).
For Zhutuo Hydrological Station, except that it still maintained relatively obvious fluctuating changes in SSL after 2013, its variation trends in other periods were similar to those of XJB Station. Except for a few individual years (e.g., 1974), the SSL at Zhutuo Station was higher than that at XJB Station. Notably, during 1975–1989 and after 2013, the SSL at Zhutuo Station was significantly greater than that at XJB Station.
As indicated by the anomaly variation curve (Figure 2b), before 2013, the anomaly values of sediment discharge at the above two hydrological stations were basically greater than 0, while they became less than 0 thereafter. This implies that 2013 was a differentiation point in the process of sediment discharge changes at these two hydrological stations.
Before 1999, the inflow and outflow volumes of suspended sediment in the river section of the TGR area fluctuated significantly. The two quantities showed a good synchronous variation characteristic, but neither had an obvious changing trend (Figure 2c). Starting from 1999, both began to show an obvious downward trend. Moreover, since 2003, the sediment outflow volume of this river section has been much smaller than the sediment inflow volume. According to the anomaly curves (Figure 2d), the anomaly values of the two quantities were greater than 0 before 2001 and less than 0 after 2001. However, their obvious differentiation started in 2003.
3.1.2. Changes in net SSL in Typical River Sections
The variation characteristics of net SSL in the river sections between XJB and Zhutuo Stations, as well as between Zhutuo and Yichang Stations (located downstream of the Three Gorges Dam), are shown in Figure 2e.
The common features of sediment discharge changes in these two river sections are as follows: Before 1985, both were basically characterized by high fluctuations and no obvious changing trend; after that, they showed a significant decreasing trend, and maintained relatively low values and low volatility after 2000.
The differences in sediment discharge changes between the two river sections lie in: Before 2003, the net SSL in the section from Zhutuo to Yichang Stations was almost always greater than that in the section from XJB to Zhutuo Stations, and this difference was most significant especially before 1985. After 2003, the difference between the two significantly decreased, and their sediment discharge was very close in many years.
As indicated by the variation characteristics of the anomaly curves (Figure 2f), 1985 was a reversal point for the relative magnitude of net SSL anomaly changes in the above two sections. Before 1985, the net SSL anomaly value in the section between Zhutuo and Yichang Stations was much larger than that between XJB and Zhutuo Stations; after that, the former anomaly value was much smaller than the latter, and this gap gradually widened.
3.2. Identification of Inflection Years and Division Of Stages
3.2.1. Inflection Years based on Change in a Single Series of SSL
When only considering the variation trend of a single sediment transport load (SSL) series and identifying potential major inflection points, the cumulative anomaly method and the RAPS method are suitable for such abrupt change detection.
The cumulative anomaly, RAPS, and the double mass curve methods can identify the abrupt change in data sequences from different perspectives. Specifically, the former two are easy to be used to identify the main inflection point, while the latter can be used to identify multiple potential inflection points but is difficult to directly distinguish between primary and secondary ones. The combination of these methods can reasonably reveal the potential primary and secondary inflection points of a given data sequence.
It can be seen from the cumulative anomaly curve (Figure 3) that the main inflection year of the annual SSL at XJB and Zhutuo Stations in the study area is 2001, whereas the main inflection year of the interannual variation in the incoming and outgoing SSL in the river section of the TGR area is 2000. These two main inflection years are very close. The main inflection year of the interannual variation in the net SSL in the river section from XJB Station to Zhutuo Station is 1989, and that from Zhutuo Station to Yichang Station is 1984. Although the main inflection years of the two river sections are relatively close, they are significantly different from the main inflection years of SSL at the aforementioned hydrological stations.
The variation trends and variability characteristics of the annual (net) sediment transport volume in the aforementioned locations (or regions) plotted using the RAPS method (Figure 4), as well as the trend deflection years identified based on these results, are completely consistent with those obtained via the cumulative anomaly method. This not only demonstrates the accuracy and homogeneity of such abrupt change diagnosis but also indicates that these two types of methods essentially follow the same basic principles, among which, calculating anomalies and cumulative anomalies constitutes the core of both methods.
3.2.2. Inflection Years based on Change in Double Series of Runoff and SSL
The double mass curve (Figure 5) shows that the inflection years of interannual variations in SSL at XJB Station are 2001 and 2013, while those at Zhutuo Station are 2000 and 2013. The first inflection year corresponding to the two hydrological stations are very close, and each is consistent with the main inflection year identified by the cumulative anomaly method. Their corresponding second inflection years are identical. Although the deflection angle of the cumulative data fitting line after the second inflection point is larger than that after the first inflection point, this inflection point is not the main abrupt change point.
For the TGR area, the abrupt change points of interannual variations in incoming SSL are 1997 (close to the aforementioned main inflection year of 2000) and 2013; the inflection points of outgoing SSL are 1989 and 2003 (the latter is close to the aforementioned main inflection year of 2000). For the interannual variations in net SSL in the river sections, the inflection years between XJB and Zhutuo Stations are 1992 (close to the aforementioned main abrupt change point of 1989) and 2000, while those between Zhutuo and Yichang Stations are 1987 (close to the aforementioned main inflection year of 1984) and 2003.
The main inflection years identified by the two methods are either identical or differ by no more than 3 years, showing good consistency. To reveal more detailed phased variation characteristics of SSL, the two inflection points of each hydrological station or river section obtained by the double mass curve method were used as boundaries to divide the time series of their (net) sediment transport variations. These identified inflection years and the stages divided on this basis are listed in Table 3.
3.3. Slope change ratio of cumulative SSL in variation stages
3.3.1. Relationships Between the Year and Cumulative SSL
The variation trends of cumulative SSL in different periods are shown in Figure 6. Taking the previously identified inflection years as the boundaries, the scatter points of the cumulative (net) SSL of each hydrological station or river sections in the entire time series can be divided into three stages: the baseline period (Pbas), the first change period (Pfch), and the second change period (Psch).
In each stage, an excellent linear relationship can be fitted between the year and cumulative SSL. The coefficient of determination (R2) is, for the vast majority, over 0.98, and even the smallest one exceeds 0.91. Compared with the baseline period, the fitted lines of the change periods all show a clockwise deflection characteristic, which indicates that the sediment transport has undergone two phased decreasing trends.
Meanwhile, it can be observed that except for the river section between XJB and Zhutuo Stations, where the degree of reduction in cumulative SSL during the first change period is greater than that during the second change period, the degree of reduction in cumulative SSL at other hydrological stations or river sections gradually intensifies from the first change period to the second change period.
3.3.2. Change Ratio of Cumulative SSL
The change ratio of cumulative SSL is defined as follows: In a complete data series, the slope value of the linear relationship between the year and cumulative SSL in each change period is subtracted by the slope value of the linear relationship in the baseline period, and the result is then divided by the slope of the baseline period. The absolute value of the change ratio obtained through such calculation is usually between 0 and 1, but there are exceptions: when the slope of the linear relationship in the change period is negative, the absolute value of the resulting change ratio will exceed 1. A negative change ratio obtained indicates that the cumulative SSL is decreasing relative to the baseline period; a positive change ratio indicates that the cumulative SSL is increasing relative to the baseline period. Therefore, the slope of the aforementioned linear fitting relationship becomes a key parameter for measuring the variation trend and magnitude of cumulative SSL.
The slopes of the linear fitting relationships for different hydrological stations or river sections in different change stages (as shown in Figure 6), as well as the change ratio of cumulative SSL calculated based on these slopes, are comprehensively listed in Table 4. Relative to the baseline period, the change ratio of the slopes of the linear relationships between the year and cumulative SSL in the first and second change periods are as follows: It is −0.431 and −0.995 at XJB Station, −0.422 and −0.867 at Zhutuo Station, −0.487 and −0.834 at the TGR inlet, −0.225 and −0.955 at the TGR outlet, respectively. During the above two change periods, the change ratio of the slopes of the linear relationships between the year and cumulative net SSL is −1.018 and −0.490 in the river section between XJB and Zhutuo Stations, and −0.663 and −0.820 in the river section between Zhutuo Station and the TGR inlet, respectively.
Among these, in the first change period, the maximum absolute value of the change ratio occurs in the river section between XJB and Zhutuo Stations, while in the second change period, it occurs at XJB Station.
3.4. Contributions of climate and human activities
3.4.1. Change ratio of cumulative precipitation
The temporal variation of cumulative annual average precipitation in different reaches of the upper Yangtze River is shown in Figure 7. From the scatter distribution trend in each subgraph of this figure, it can be seen that the variation of cumulative precipitation in each reach is extremely insignificant. According to the stage division of SSL variation, the same stage division was applied to cumulative precipitation, with the same division points for the baseline period, the first change period, and the second change period. Linear fitting was performed on the scatter points of cumulative precipitation in each stage of the six sections, and the corresponding linear equations obtained are listed in Figure 7a–f, respectively. The slopes extracted from these equations are the key measurement parameters for calculating the variation degree of cumulative precipitation. These slopes and their rates of change are extracted in Table 4.
Relative to the baseline period, the change ratios of the slopes of the linear equations between year and cumulative precipitation in the first and second change periods are as follows: 0.027 and 0.119 in the basin above XJB Station, −0.002 and 0.124 in the basin above Zhutuo Station, 0.013 and 0.101 in the basin above the TTGR, and −0.028 and −0.046 in the basin above Yichang Station, respectively.
In the two change periods, the change ratios of the slopes are respectively −0.020 and 0.022 in the river section between XJB and Zhutuo Stations, and −0.061 and −0.009 in the river section between Zhutuo Station and TGR inlet. These slope change values are both positive and negative, indicating that the cumulative precipitation has both increasing and decreasing changes relative to the baseline period.
3.4.2. Change ratio of cumulative potential ET
The cumulative annual average ET in different river sections of the study area is shown in Figure 8. From the scatter distribution trend in each subgraph of this figure, it can be observed that the variation trend of cumulative ET in each reach is slightly more significant than that of cumulative precipitation. Based on the inflection years of SSL variation, the cumulative ET is divided into same three corresponding stages: the baseline period, the first change period, and the second change period.
Linear fitting was performed on the scatter points of cumulative ET for each stage in the river sections. The corresponding linear equations obtained are listed in Figure 8a–f respectively, and the slopes extracted from these equations are the key parameters for calculating the variation degree of cumulative potential ET. The slopes of the corresponding linear equations and their change ratios are extracted in Table 4.
Relative to the baseline period, the change ratios of the slopes of the linear equations between year and cumulative potential ET in the first and second change periods are as follows: they are 0.129 and 0.210 above XJB Station, 0.271 and 0.281 above Zhutuo Station, 0.142 and 0.137 above the TGR, 0.007 and 0.098 above Yichang Station, respectively. In the section between XJB and Zhutuo Stations, the change ratios are -0.097 and 0.043, while in the section between Zhutuo Station and TGR inlet, they are -0.027 and -0.078, respectively. Most of these slope change values are positive, indicating that the regions or stages where the increase in potential ET leads to a decrease in SSL are dominant. At the same time, it shows that the regions with decreased potential ET are mainly located in the upper section adjacent to the TGR of the Yangtze River.

Table 4.
The slope values of cumulative SSL (CS), cumulative precipitation (CP), and cumulative potential ET (CET) as well as slope change ratios related to that in the base period for different hydrological stations or river sections in the upper reaches of the Yangtze River during the period from 1966 to 2024
Table 4.
The slope values of cumulative SSL (CS), cumulative precipitation (CP), and cumulative potential ET (CET) as well as slope change ratios related to that in the base period for different hydrological stations or river sections in the upper reaches of the Yangtze River during the period from 1966 to 2024
| Location | Period | CS | CP | CET | |||
|---|---|---|---|---|---|---|---|
| SSV (108t) | SSC | SPV (mm) | SPC | SETV (mm) | SETC | ||
| Above XJB St. | 1966–2000 | 2.513 | / | 579.78 | / | 481.74 | / |
| 2001–2012 | 1.431 | −0.431 | 595.40 | 0.027 | 573.74 | 0.191 | |
| 2013–2024 | 0.012 | −0.995 | 648.90 | 0.119 | 582.94 | 0.210 | |
| Above ZT St. | 1966–1999 | 3.057 | / | 681.73 | / | 449.77 | / |
| 2000–2012 | 1.766 | −0.422 | 680.58 | −0.002 | 571.62 | 0.271 | |
| 2013–2024 | 0.406 | −0.867 | 766.60 | 0.124 | 576.30 | 0.281 | |
| Above TGR inlet | 1966–1996 | 4.657 | / | 760.69 | / | 578.55 | / |
| 1997–2012 | 2.390 | −0.487 | 770.81 | 0.013 | 660.46 | 0.142 | |
| 2013–2024 | 0.771 | −0.834 | 837.49 | 0.101 | 657.70 | 0.137 | |
| Above YC St. | 1966–1988 | 5.196 | / | 996.51 | / | 773.50 | / |
| 1989–2002 | 4.028 | −0.225 | 968.83 | −0.028 | 778.90 | 0.007 | |
| 2003–2024 | 0.235 | −0.955 | 950.69 | −0.046 | 849.53 | 0.098 | |
| Section XJB–ZT St. | 1966–1991 | 0.658 | / | 1032.30 | / | 538.95 | / |
| 1992–1999 | −0.012 | −1.018 | 1011.92 | −0.020 | 486.61 | −0.097 | |
| 2000–2024 | 0.335 | −0.490 | 1055.16 | 0.022 | 561.93 | 0.043 | |
| Section ZTS-TGR | 1966–1986 | 1.926 | / | 1016.38 | / | 960.26 | / |
| 1987–2002 | 0.648 | −0.663 | 954.40 | −0.061 | 934.25 | −0.027 | |
| 2003–2024 | 0.347 | −0.820 | 1007.50 | −0.009 | 885.46 | −0.078 | |
Note: In the table, the first period of each region is the base period, and the second and third periods are different change periods; SSV and SSC represent the slope value and the slope change ratio of cumulative of SSL, SPV and SPC represent the slope value and the slope change ratio of cumulative precipitation, SETV and SETC represent the slope value and the slope change ratio of cumulative of potential ET, respectively.
3.4.3. Relative Contribution Ratios of Climate and Human Activities
The previous text has separately calculated the change rate of cumulative SSL, the change rate of cumulative precipitation, and the change rate of cumulative potential ET. Based on formulas (4) and (5) in the SCRCQ method, the relative contribution ratios of changes in precipitation and potential ET to the changes in SSL in the different sections of the study area can be conveniently calculated. Then, based on formula (6) of this method, the relative contribution ratios of human activities to the changes in SSL in the corresponding sections and during the corresponding change periods can be further calculated. Additionally, the relative contribution ratios of precipitation and potential ET in the same reach can be summed to obtain the relative contribution ratios of climate change. All the above calculation results are listed in Table 5.
Since SSL in the study area shows a decreasing trend, positive values of the contribution ratios of changes in precipitation and potential ET (or climate) indicate that these factors have promoted the reduction in SSL, while negative values indicate that they have inhibited the reduction in SSL. It can be seen from Table 5 that in the total 12 change periods of all 6 sections, the positive and negative impacts of precipitation changes on the reduction in SSL each account for half. Among them, the maximum relative contribution ratio of the negative impacts can reach −14.3% (occurring in the second change period of the river section above Zhutuo Station), while that of positive impacts is 12.4% (occurring in the first change period of the river basin above Yichang Station, i.e., the entire upper Yangtze River Basin).
Changes in potential ET have had a positive impact on the reduction in SSL in most sections and change periods, with the maximum relative contribution ratio being 0.6% (occurring in the first change period of the river section above Zhutuo Station). Negative impacts only occurred in two change periods (occurring in the first change period of the river section between XJB and Zhutuo Stations and in the second change period of the river section between Zhutuo Station and TGR inlet), with the relative contribution ratios being only −0.1% in both cases. The impact of changes in precipitation on the reduction in SSL in the study area is much greater than that of changes in potential ET.
The relative contribution ratios of human activities to changes in SSL in the different sections of the upper Yangtze River range from 87.5% to 111.9%, making them the most important controlling factor for changes in SSL in each river section of the study area.
4. Discussion
4.1. The Universality of the Sharp Reduction in SSL in the Study Area
During the evolutionary process of sediment transport in different regions of the study area over the past nearly 60 years, all have shown a similar trend of sharp reduction, and this sharp reduction has exhibited universality across different hydrological stations in the study area. Many recent research results have also pointed out this universal changing trend [e.g., 18,33–38]. A particularly prominent sharp reduction occurred at the XJB Station: since 2013, the annual SSL of this station has decreased significantly compared with the previous period, with a reduction rate of more than 99% [38,39,40]. Meanwhile, the sharp reduction in SSL at XJB Station implies a significant decrease in the sediment concentration of the outflow water, while the coefficient of variation of sediment concentration has increased significantly, with the maximum value approaching 1.0 [41]. As a key hydrological station in the upper reaches of the Yangtze River, XJB Station controls an area accounting for 45.6% of the total area of the upper Yangtze River. Therefore, the changes in SSL at this station basically reflect the overall variation trend of sediment transport in the upper section of the upper Yangtze River, which covers nearly half of the total area of the upper Yangtze River.
For the Yichang Station, its average annual SSL was 3.92×10⁸ tons during the period 1992–2001, representing a 23.6% reduction compared with 5.13×10⁸ tons in 1954–1991 [42]. During 2002–2013, however, the average annual SSL was 0.62×10⁸ tons, a sharp reduction of up to 87.9% compared with that in 1954–1991. As a key hydrological station for the entire upper Yangtze River, the changes in SSL at Yichang Station reflect the overall variation trend of sediment transport in the entire upper Yangtze River basin.
The decreasing trend and abrupt changes of SSL in different regions of the upper Yangtze River are universal. This necessitates the estimation of the relative influence degree of the main controlling factors, so as to decouple the relative contribution rates of climate change and human activities to the reduction of sediment transport in this region.
4.2. The Necessity of Stage Division for SSL Changes
In this study, necessary trend detection was conducted on the changes of SSL at each typical hydrological station and the net SSL in river sections within the study area, resulting in the identification of a series of inflection years when mutations occurred. The mutation years obtained by several mutation detection methods were generally highly consistent. However, the detection of univariate data sequences, including methods such as the cumulative anomaly method and the RAPS method, can usually only identify major mutation points. If it is necessary to detect the presence of minor mutation points, it is required to re-conduct cumulative anomaly analysis separately on the sub-sequences on both sides of the major mutation point [43]. In contrast, the double mass curve, which uses cumulative runoff and cumulative SSL as two variables, can identify multiple potential mutation points in a single analysis. Meanwhile, it allows for the calculation of the slopes of the linear fitting relationships of the aforementioned scatter points and their change ratios of across different stages, which facilitates subsequent quantitative attribution analysis. This is also the main reason why the mutation years obtained by the double mass curve method were selected in this study.
The first mutation years for the reduction in SSL revealed by this study were around 2000 (including 1997, 2000, and 2001) in some regions, and around 1990 (including 1987, 1989, and 1992) in other regions. These results are largely consistent with previously reported findings on sediment transport mutations in the corresponding river reaches [38,39,40,42]. The second mutation year was 2013 for all areas in the upper section of the upper Yangtze River (the region above XJB Station), while for the lower section of the upper Yangtze River, the second mutation years were mainly 2003 and 2000. These results are also consistent with the aforementioned studies.
The mutation identification of changes in SSL at typical hydrological stations and in net SSL in typical river reaches of the upper Yangtze River in this study is valid and reasonable, which serves as the premise and foundation for calculating the relative contribution ratios of the main influencing factors to SSL changes in different change stages. Furthermore, using the mutation points obtained by the double mass curve method in this study as mutation years to divide the long-term time series of SSL and net SSL processes at different hydrological stations or river reaches in the study area into a baseline period, Change Period I, and Change Period II (for comparison purposes) is not only highly necessary but also appropriate.
4.3. The Reliability of Calculated Relative Contribution Ratios
Based on the fundamental principles of the terrestrial water cycle, this study logically selects changes in precipitation and potential ET, as well as their ratios of change across the aforementioned different periods, to measure the impact of natural factors on sediment transport processes. This is justified because the natural factors affecting variations in river sediment transport differ depending on the time scale. At the hydrological time scale addressed in this study, changes in basin precipitation and air temperature first influence the basin’s runoff generation and concentration processes, as well as the intensity of ET, thereby affecting river runoff variations. On the other hand, these changes constrain the basin’s vegetation types and coverage, which in turn lead to variations in basin sediment yield and transport. Therefore, for the interannual variation process of SSL at the hydrological time scale, the core natural influencing factors can be simplified to two categories: changes in precipitation and changes in ET. These are also the core elements through which climate affects basin SSL changes. Hence, it is appropriate for this study to select these two climatic factors to assess the quantitative impact of climate on SSL.
There are multiple methods for evaluating the contribution rates of influencing factors to changes in runoff and sediment transport. Among them, the slope change ratio of cumulative quantity (SCRCQ) Method proposed by [4], has been widely validated in research applications across numerous river basins and has yielded results comparable to those of other methods [e.g., 44–48]. Research by Duang et al. [49] indicates that dam construction and operation are key factors contributing to the sharp reduction in sediment transport in the upper Yangtze River, their contribution ratio to the decrease in SSL at XJB Station is 72%, and 74% for the entire upper Yangtze River (the basin above Yichang Station). The contribution ratio of soil and water conservation measures ranges from 7% to 20% [49]. This implies that the contribution ratio of human activities to the reduction in SSL across different regions of the upper Yangtze River ranges from 81% to 94%, with 92% for the basin above XJB Station and 94% for the basin above Yichang Station. The contribution ratio of climate change ranges from 6% to 19%, with 8% for the basin above XJB Station and 6% for the basin above Yichang Station. Research by Jiang et al. [48] shows that compared to the period 1960–1994, suspended sediment transport in the Yangtze River Basin decreased significantly during 2002–2020, with climate contributing only 3.91%, indicating that the contribution ratio of human activities is as high as 96.09%.
This study systematically evaluates the contribution ratios of the dominant factors causing the reduction in SSL at different hydrological stations and river reaches in the upper Yangtze River. Notably, changes in SSL at Yichang Station effectively reflect the comprehensive variation trend of sediment transport across the entire upper Yangtze River. Compared to the baseline period, the relative contribution ratios of precipitation, ET (climate), and human activities during Change Period I (1989–2002) are 12.4%, 0 (totaling 12.4%), and 87.5%, respectively; during Change Period II (2003–2024), the ratios are 4.8%, 0.1% (totaling 4.9%), and 95.1%, respectively. Evidently, the relative impact of human activities shows a trend of gradual enhancement. In general, the results of this study are highly consistent with the findings reported in the aforementioned literature for the corresponding river reaches, which indicates that the calculation results of the relative contribution ratios of the dominant factors causing suspended sediment transport reduction in this study are basically reliable. Naturally, minor differences exist between different research results. These differences primarily stem from variations in the length of time series of data selected in different studies, which in turn lead to discrepancies in the identified inflection years. These two factors are the main causes of such slight differences.
5. Conclusions
Based on the trend analysis of sediment transport sequence variations, mutation point identification, and variation stage division in different reaches of the upper Yangtze River from 1966 to 2024, as well as the calculation and analysis of the variation rates of sediment transport, precipitation, and evapotranspiration in different stages relative to the baseline period, the following main conclusions are obtained:
(1) The sediment quantity variation trends in the basin above XJB Station, the basin above Zhutuo Station, and the inflow and outflow of the Three Gorges Reservoir are similar, with their mutation years being 2001, 2000, 1997, and 1989 respectively. The mutation years of sediment transport in the two intervals (XJB to Zhutuo Station, and Zhutuo to Yichang Station) are 1992 and 1984 respectively. The period before the first mutation year is designated as the baseline period, and the period after is defined as the variation period; the variation period is further divided into Variation Period I and Variation Period II using mutation years such as 2013, 2003, and 2000 as boundaries.
(2) Compared with the baseline period, the slopes of cumulative sediment transport in the 6 river reaches/basins of the study area have all decreased significantly. Their variation rates range from −0.225 to −1.018 in Variation Period I and from −0.490 to −0.995 in Variation Period II. This indicates that sediment transport has experienced two sudden reductions; meanwhile, the reduction rate of cumulative sediment transport in each river reach has increased sequentially in the two variation periods.
(3) The contribution rate of human activities to the reduction in sediment transport in different reaches of the upper Yangtze River ranges from 87.5% to 111.9%, the contribution rate of precipitation variation ranges from −14.3% to 12.4%, and the contribution rate of evapotranspiration variation ranges from −0.1% to 0.6%. For the entire upper Yangtze River basin, the contribution rates of human activities to the reduction in sediment transport are 87.5% in Variation Period I and 95.1% in Variation Period II, while the contribution rates of climate change are 12.4% and 4.9% respectively. Human activities play an absolutely dominant role in the reduction of sediment transport in the study area.
Funding
This work was supported by the National Key Research and Development Program of China (Grant No. 2022YFC3203903) and National Natural Science Foundation of China (Grant No. 42371010).
Data Availability Statement
Data can be accessed through personal contact.
Acknowledgments
The author greatly appreciate the valuable comments and constructive suggestions from the anonymous reviewers.
Conflicts of Interest
The author declares no conflicts of interest.
References
- Qian, N.; Zhang, R.; Zhou, Z. Channel Processes. Science Press: Beijing, China, 1987. (In Chinese).
- Wang, S.; Wang, X. Impact of large reservoirs on runoff and sediment load in the Jinsha River Basin. Water 2023, 15, 3266. [Google Scholar] [CrossRef]
- Miao, C.; Ni, J.; Borthwick, A.G.L.; Yang, L. A preliminary estimate of human and natural contributions to the changes in water discharge and sediment load in the Yellow River. Glob. Planet. Chang. 2011, 76, 196–205. [Google Scholar] [CrossRef]
- Wang, S.; Yan, M.; Yan, Y.X.; Shi, C.; He, L. Contributions of climate change and human activities to the changes in runoff increment in different sections of the Yellow River. Quaternary International 2012, 282, 66–77. [Google Scholar] [CrossRef]
- Yang, S.L.; Zhao, Q.Y.; Belkin, I.M. Temporal variation in the sediment load of the Yangtze River and the influences of the human activities. J. Hydrol. 2002, 263, 56–71. [Google Scholar] [CrossRef]
- Nilsson, C.; Reidy, C.A.; Dynesius, M.; Revenga, C. Fragmentation and flow regulation of the world’s large river systems. Sci. 2005, 308, 405–408. [Google Scholar] [CrossRef]
- Syvitski, J.P.M.; Voromarty, C.J.; Kettner, A.J.; Green, P. Impact of humans on the flux of terrestrial sediment to the global coastal ocean. Science 2005, 308, 376–380. [Google Scholar] [CrossRef] [PubMed]
- Graf, W.L. Downstream hydrologic and geomorphic effects of large dams on American rivers. Geomorphology 2006, 79, 336–360. [Google Scholar] [CrossRef]
- Wang, S.; Wang, Y.; Ran, L.; Su, T. Climatic and anthropogenic impacts on runoff changes in the Songhua River basin over the last 56 years (1955-2010), Northeastern China. Catena 2015, 127, 258–269. [Google Scholar] [CrossRef]
- Wang, Y.K.; Rhoads, B.L.; Wang, D.; Wu, J.C.; Zhang, X. Impacts of large dams on the complexity of suspended sediment dynamics in the Yangtze River. J. Hydrol. 2018, 558, 184–195. [Google Scholar] [CrossRef]
- Zhang, X.B.; Wen, A.B. Variations of sediment in upper stream of Yangtze River and its tributary. Shuilixuebao 2002, 33, 56–59. (In Chinese) [Google Scholar]
- Zhao, Y.; Zou, X.; Liu, Q.; Yao, Y.; Li, Y.; Wu, X.; Wang, C.; Yu, W.; Wang, T. Assessing natural and anthropogenic influences on water discharge and sediment load in the Yangtze River, China. Science of the Total Environment 2017, 607–608, 920–932. [Google Scholar] [CrossRef]
- Li, Q.; Yu, M.; Lu, G.; Cai, T.; Xia, Z.; Ren, L. Impacts of the Gezhouba and Three Gorges reservoirs on the sediment regime in the Yangtze River. China. J. Hydrol. 2011, 403, 224–233. [Google Scholar] [CrossRef]
- Walling, D.E. Human impact on land–ocean sediment transfer by the world’s rivers. Geomorphology 2006, 2006. 79, 192–216. [Google Scholar] [CrossRef]
- Dai, S.B.; Lu, X.X. Sediment load change in the Yangtze River (Changjiang): a review. Geomorphology 2014, 215, 60–73. [Google Scholar] [CrossRef]
- Sun, J.Y.; Wang, G.X.; Sun, S.Q.; Chen, S.J.; Sun, X.Y.; Wang, Y.M.; et al. Asynchronous changes and driving mechanisms of water-sediment transport in the Jinsha River Basin: Response to climate change and human activities. Catena 2025, 259, 109325. [Google Scholar] [CrossRef]
- Du, J.; Shi, C.X.; Zhang, S.H.; Zhang, L. Impact of human activities on recent changes in sediment discharge of the upper Yangtze River. Progress in Geography 2010, 29, 15–22. (in Chinese). [Google Scholar]
- Yang, S.L.; Xu, K.H.; Milliman, J.D.; Yang, H.F.; Wu, C.S. Decline of Yangtze River water and sediment discharge: Impact from natural and anthropogenic changes. Sci. Rep. 2015, 5, 12581. [Google Scholar] [CrossRef]
- Liu, H.Q.; Wang, T.T.; Feng, Y.; Wang, H.; Sun, F.B.; Liu, W.B. Projection of the impact of climate change and reservoir on the flow regime in the Yangtze River basin. Acta Geogr. Sin. 2025, 80, 41–60. (In Chinese) [Google Scholar]
- Peng, T.; Tian, H.; Singh, V.P.; Chen, M.; Liu, J.; Ma, H.; Wang, J. Quantitative assessment of drivers of sediment load reduction in the Yangtze River basin, China. Journal of Hydrology 2020, 580, 124242. [Google Scholar] [CrossRef]
- Xiao, Y.H.; Jin, Z.W.; Zhang, G.S.; Jin, G.Q.; Li, Z.J. Analysis of cumulative mutations of the relationship between annual runoff and sediment load in the upper Yangtze River Basin based on improved double mass curve method. J. Soil Water Conserv. 2025, 39, 97–104. (In Chinese) [Google Scholar]
- Wang, S. Variations in sedimentation rate and corresponding adjustments of longitudinal gradient in the cascade reservoirs of the lower Jinsha River. Water 2025, 17, 262. [Google Scholar] [CrossRef]
- Hydrological Bureau of Changjiang Water Resources Commission (Ed. ). Annals of the Yangtze River; Encyclopedia of China Publishing House: Beijing, China, 2003. (In Chinese) [Google Scholar]
- Zhang, H.; Bao, Y.; Tang, Q.; He, X.; Wei, J.; Collins, A.L. Spatiotemporal dynamics of non-floodplain ponded waterbodies in the upper Yangtze River Basin, China: A hydrological connectivity perspective. Applied Geography 2025, 185, 103796. [Google Scholar] [CrossRef]
- Li, S.X.; Yang, C.G.; Dong, B.J.; Zhang, O.Y. Sediment transport characteristics during high floods in the upper reaches of the Yangtze River. J. Yangtze River Sci. Res. Inst. 2021, 38, 6–11. (In Chinese) [Google Scholar]
- Hydrology Bureau of the Ministry of Water Resources of the people’s Republic of China. Annual hydrological report of the People’s Republic of China 1966–2020. Beijing. (Internal Data in Chinese).
- Ministry of Water Resources of the People's Republic of China. China River Sediment Bulletin. Beijing: China Water & Power Press, 2002–2024. (In Chinese).
- Mu, X.M.; Zhang, X.Q.; Gao, P.; Wang, F. Theory of double mass curves and its applications in hydrology and meteorology. J. China Hydrol. 2010, 30, 47–51. 33. (In Chinese) [Google Scholar]
- Ran, L.; Wang, S.; Fan, X. Channel change at Toudaoguai Station and its responses to the operation of upstream reservoirs in the upper Yellow River. J. Geogr. Sci. 2010, 20, 231–247. [Google Scholar] [CrossRef]
- Garbrecht, J.; Fernandez, G.P. Visualization of trends and fluctuations in climatic records. Water Resources Bulletin, 1994, 30, 297–306. [Google Scholar] [CrossRef]
- Merriam, C. F.A comprehensive study of the rainfall on the Susquehanna Valley.Eos Trans. Amer. Geophys. Union 1937, 18, 471–476. [Google Scholar] [CrossRef]
- Zhang, C.J.; Ren, Y.Y.; Cao, L.J.; Zhang, S.Q.; Hu, C.Y.; Wu, X.L. Characteristics of dry-wet climate change in China during the past 60 years and its trends projection. Climate Change Research Letters 2021, 10, 728–741. [Google Scholar] [CrossRef]
- Dai, Z.J.; Du, J.Z.; Zhang, X.L.; Su, N.; Li, J.F. Variation of riverine material loads and environmental consequences on the Changjiang (Yangtze) estuary in recent decades (1955−2008). Environ. Sci. Technol 2011, 45, 223–227. [Google Scholar] [CrossRef] [PubMed]
- Wang, Y.G.; Hu, C.H.; Liu, X.; Shi, H.L. Study on variations of runoff and sediment load in the Upper Yangtze River and main influence factors. J. Sediment. Res. 2016, 41, 1–8. [Google Scholar]
- Zhu, L.L.; Dong, X.Y.; Chen, Z.F. Sediment deposition of cascade reservoirs in the Lower Jinsha River and its impact on Three Gorges Reservoir. J. Yangtze River Sci. Res. Inst. 2016, 34, 1–7. (In Chinese) [Google Scholar]
- Yuan, J.; Xu, Q.X. Sediment trapping effect by reservoirs in the Jinsha River basin. Adv. Water Sci. 2018, 29, 482–491. (In Chinese) [Google Scholar]
- Liu, H.C.; Zhang, H.L.; Xia, S.Q.; Pang, J.Z. Runoff and sediment discharge variations and corresponding driving mechanism in Jinsha River Basin. Res. Soil Water Conserv. 2023, 30, 107–115. (in Chinese). [Google Scholar]
- Wang, S.; Wang, X. Impact of large reservoirs on runoff and sediment load in the Jinsha River Basin. Water, 2023, 15, 3266. [Google Scholar] [CrossRef]
- Qin, L.; Dong, X.; Du, Z.; Chen, X. Processes of water–sediment and deposition in cascade reservoirs in the lower reach of Jinsha River. J. Sediment Res. 2019, 44, 24–30. (In Chinese) [Google Scholar]
- Liu, S.W.; Zhang, X.F.; Xu, Q.X.; Yue, Y. Transport characteristics and contributing factors of suspended sediment in Jinsha River in recent 50 years. J. Sediment Res. 2020, 45, 30–37. (In Chinese) [Google Scholar]
- Shan, M.; Guo, C.; Zhou, Y.; Li, Z. A review of changes in hydro-sediment dynamic processes after the operation of cascade hydropower stations in the lower reaches of the Jinsha River. In Proceedings of the Conference on Theories and Innovative Applications of Water Conservancy and Hydropower Risk Management, Wuhan, China, 14 December 2021. (In Chinese). [Google Scholar]
- Wu, X.; Wang, L.; Li, N. Analysis on the change of sediment discharge of the Yangtze River in recent 60 years. Resour. Environ. Yangtze Bas. 2018, 21, 116–123. (In Chinese) [Google Scholar]
- Wang, S. Differential changes in water and sediment transport under the influence of large-scale reservoirs connected end to end in the upper Yangtze River. Hydrology 2025. [Google Scholar] [CrossRef]
- Xie, Y.Q.; Deng, A.; Dong, X.; Qin, L.; Zhang, B. Study on the spatial-temporal variations of runoff and sediment in the lower reach of Jinsha River. J. Hydraul. Eng. 2023, 54, 1309–1322. (In Chinese) [Google Scholar]
- Gu, C.J.; Mu, X.M.; Gao, P.; Zhao, G.J.; Sun, W.Y. Changes in run-off and sediment load in the three parts of the Yellow River basin, in response to climate change and human activities. Hydrol. Process. 2019, 33, 585–601. [Google Scholar] [CrossRef]
- Zhang, D.; Wang, W.S.; Yu, S.Y.; Liang, S.Q.; Hu, Q.F. Assessment of the contributions of climate change and human activities to runoff variation: Case study in four subregions of the Jinsha River Basin, China. J. Hydrol. Eng. 2021, 26, 05021024. [Google Scholar] [CrossRef]
- Wang, H.; Cheng, S.; He, N.; Huang, L.; Yang, H.; Hong, F.; et al. Multi-scale flow regimes and driving forces analysis based on different models: a case study of the Wu River basin. Water Supply 2023, 23, 3978–3996. [Google Scholar] [CrossRef]
- Jiang, W.J.; Liu, H.H.; Yao, C.Y. Suitability of methods on the judgement of reference period and causes of sediment load variation in the Yangtze River basin, China. J. Hydrol. 2025, 662, 133855. [Google Scholar] [CrossRef]
- Duan, L.; Tian, Y.; Zhang, S.; Wang, X.; Li, C.; Chen, M. Statistical studies of the characteristics and key influencing factors of sediment changes in the upper Yangtze River over the past 60 years. Geomorphology 2024, 466, 109414. [Google Scholar] [CrossRef]
Figure 1.
Locations of the typical hydrological stations, cascade reservoirs, and main tributary in the upper reaches of the Yangtze River (Note: WDDR, BHTR, XLDR, XJBR, TGR, and GZR stand for Wudongde Reservoir, Baihetan Reservoir, Xiluodu Reservoir, XJB Reservoir, Three Gorges Reservoir, and Gezhouba Reservoir, respectively. SDZS, XJBS, ZTS, YCS, GCS, BBS, and WLS refer to Sanduizi Station, XJB Station, Zhutuo Station, Yichang Station, Gaochang Station, Beibei Station, and Wulong Station, respectively).
Figure 1.
Locations of the typical hydrological stations, cascade reservoirs, and main tributary in the upper reaches of the Yangtze River (Note: WDDR, BHTR, XLDR, XJBR, TGR, and GZR stand for Wudongde Reservoir, Baihetan Reservoir, Xiluodu Reservoir, XJB Reservoir, Three Gorges Reservoir, and Gezhouba Reservoir, respectively. SDZS, XJBS, ZTS, YCS, GCS, BBS, and WLS refer to Sanduizi Station, XJB Station, Zhutuo Station, Yichang Station, Gaochang Station, Beibei Station, and Wulong Station, respectively).
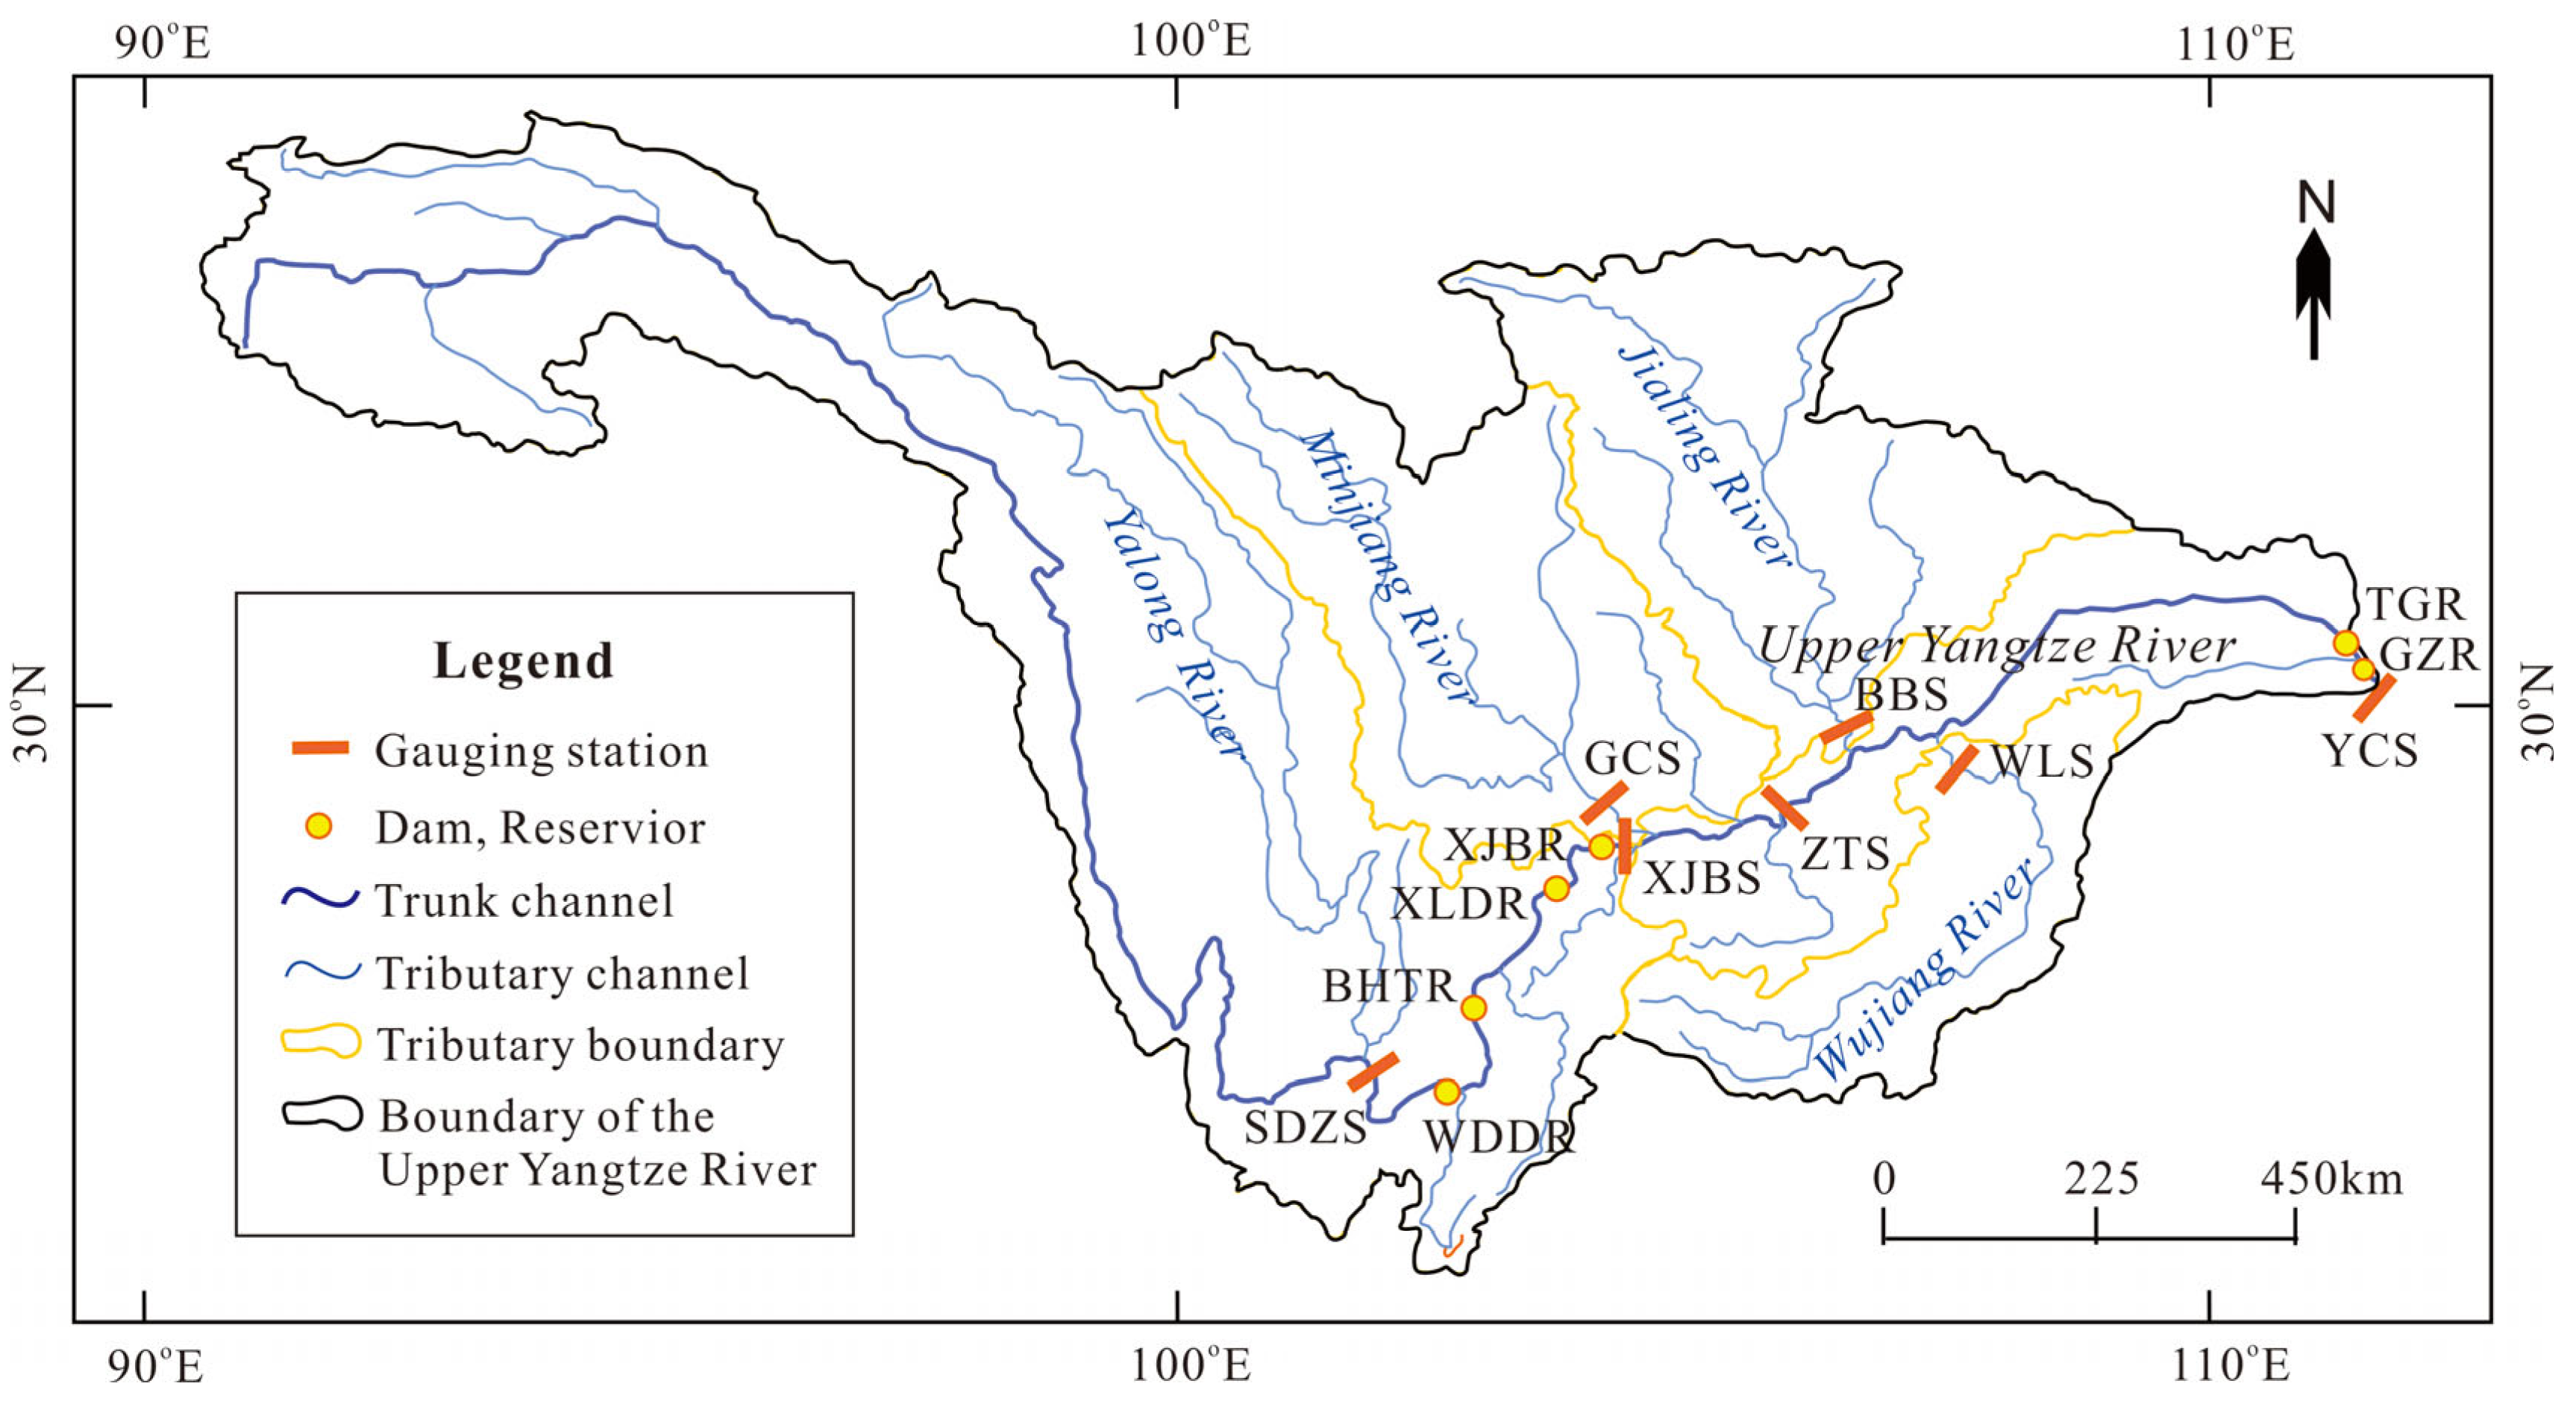
Figure 2.
Interannual variations in SSL and its anomaly at representative hydrological stations, as well as at the discharged into and released from certain sections in the upper reaches of the Yangtze River.
Figure 2.
Interannual variations in SSL and its anomaly at representative hydrological stations, as well as at the discharged into and released from certain sections in the upper reaches of the Yangtze River.
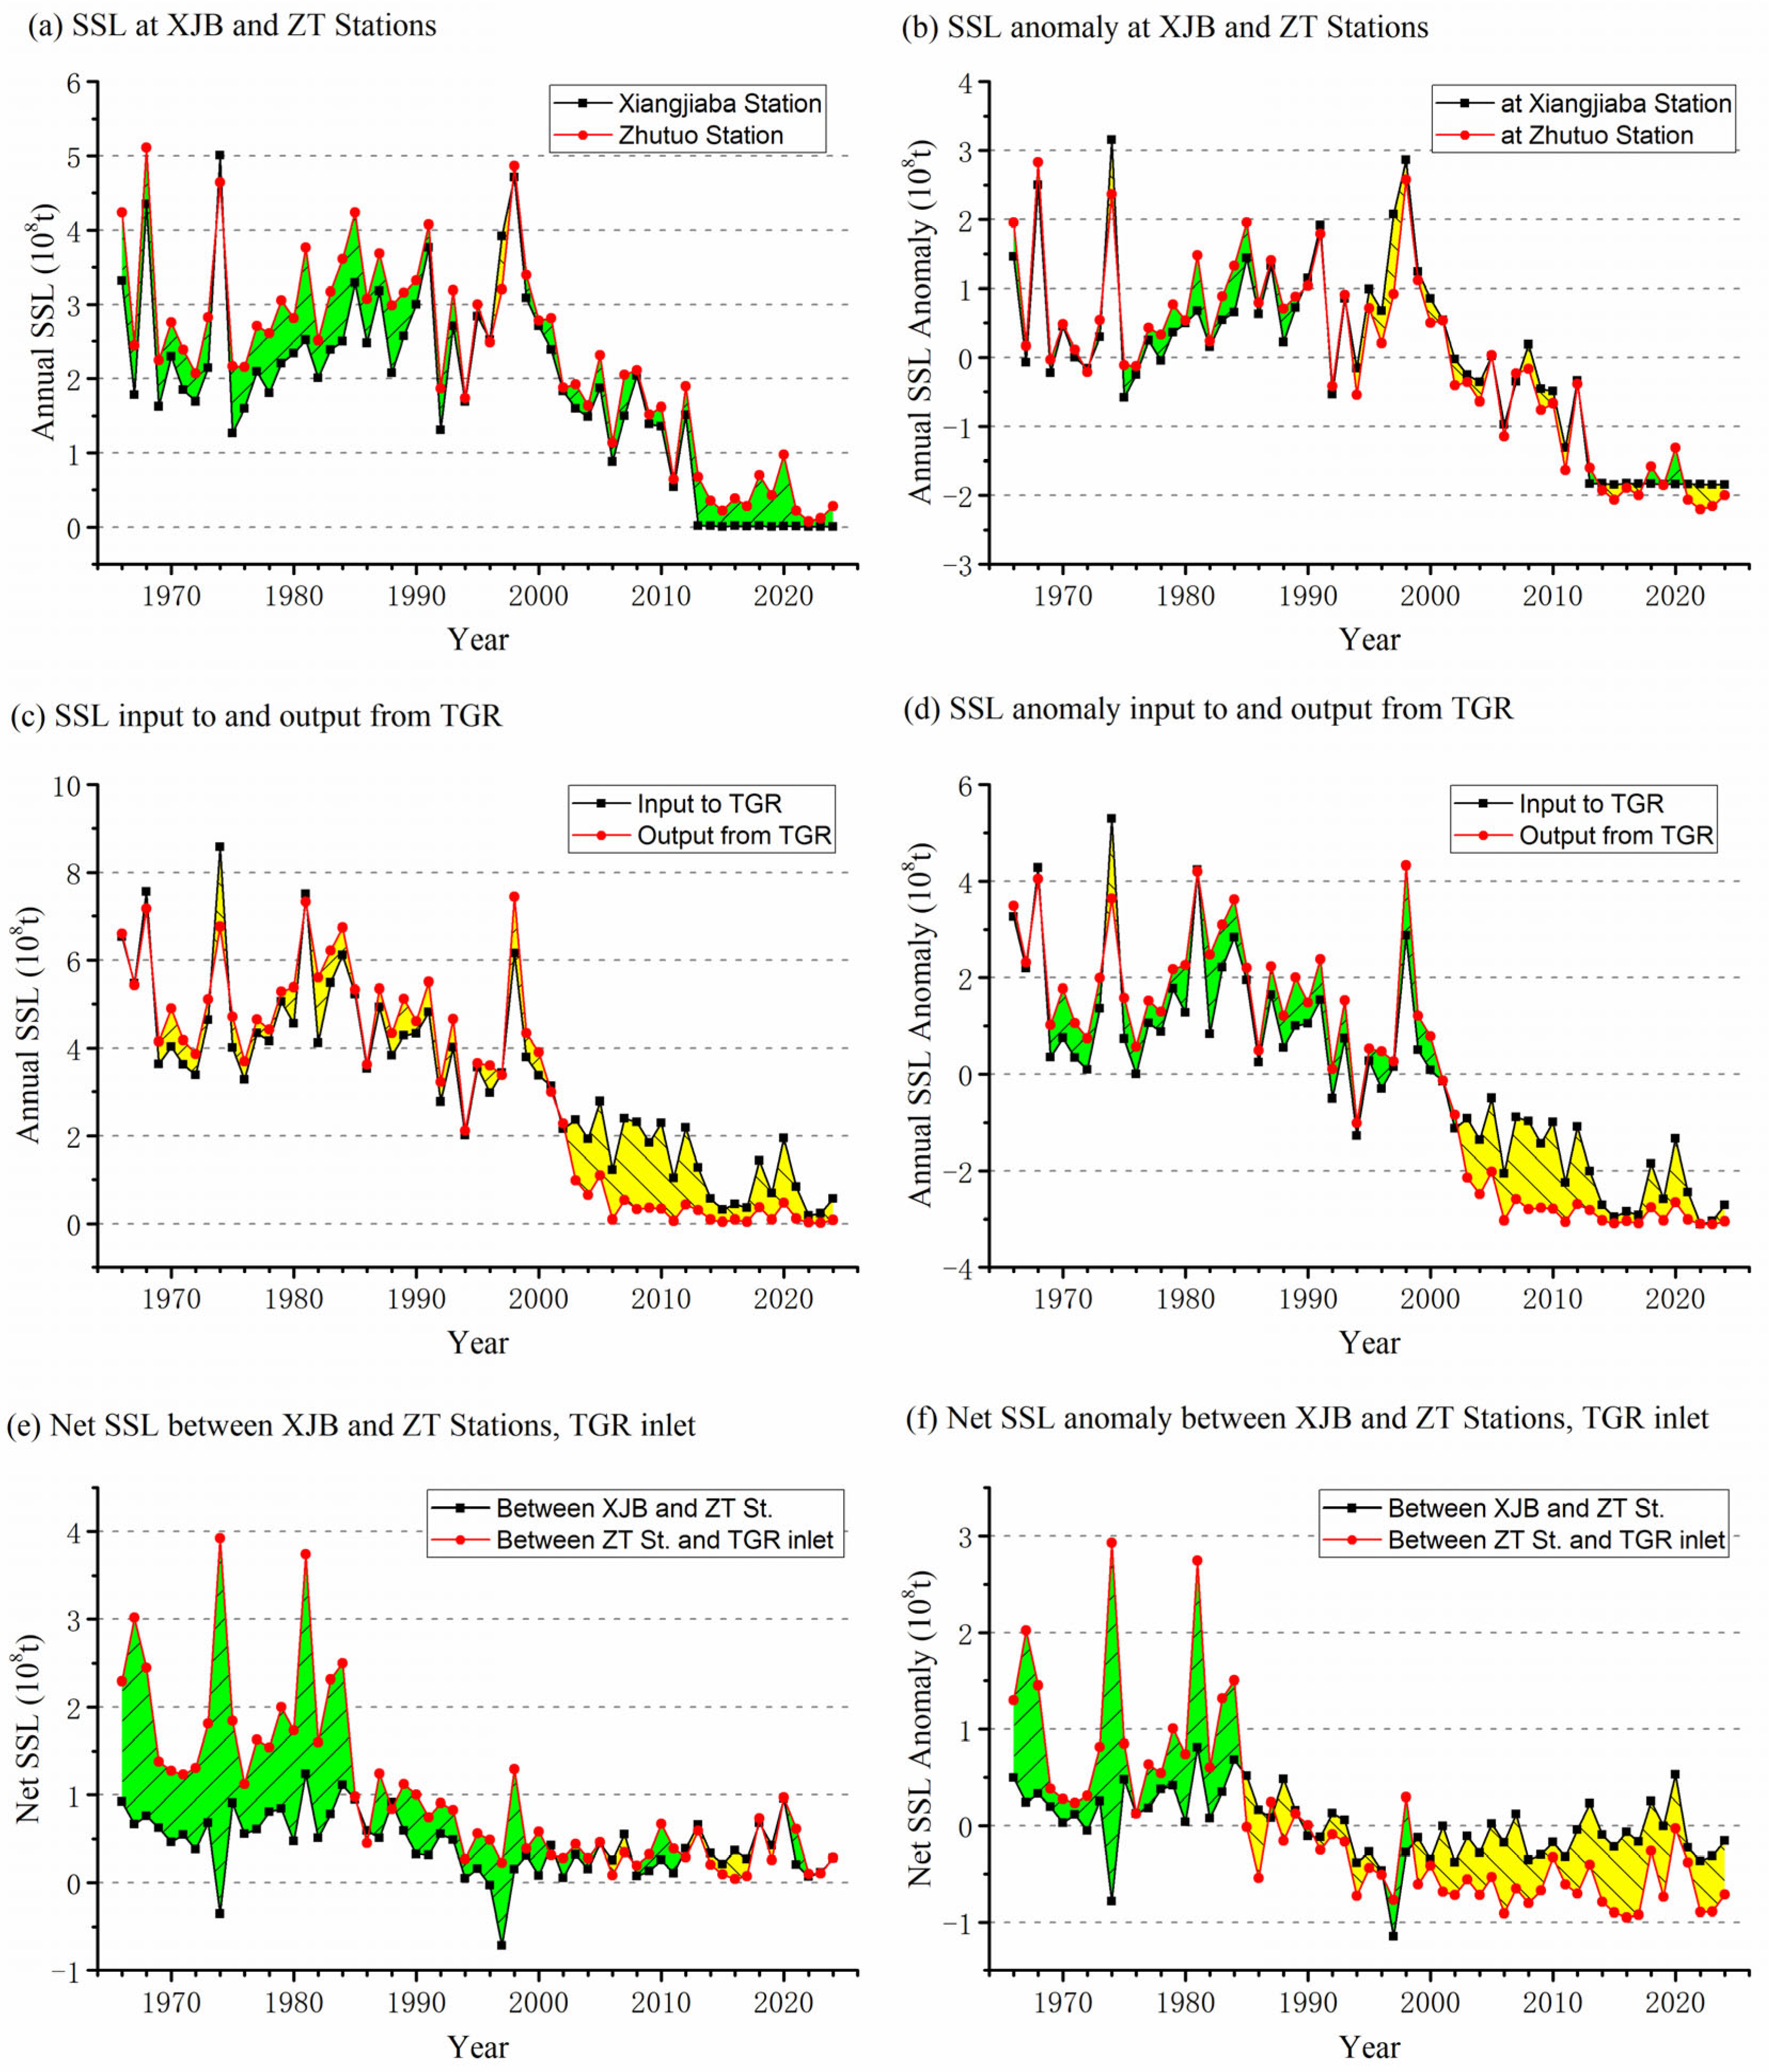
Figure 3.
The key inflection points of annual SSL at typical hydrological stations and of annual net SSL in certain sections in the upper reaches of the Yangtze River revealed by the cumulative anomaly method (Inflection points such as peaks or troughs on a cumulative anomaly curve indicate that a mutation has occurred in the data sequence; however, the true mutation point is the point immediately following this inflection point.)
Figure 3.
The key inflection points of annual SSL at typical hydrological stations and of annual net SSL in certain sections in the upper reaches of the Yangtze River revealed by the cumulative anomaly method (Inflection points such as peaks or troughs on a cumulative anomaly curve indicate that a mutation has occurred in the data sequence; however, the true mutation point is the point immediately following this inflection point.)
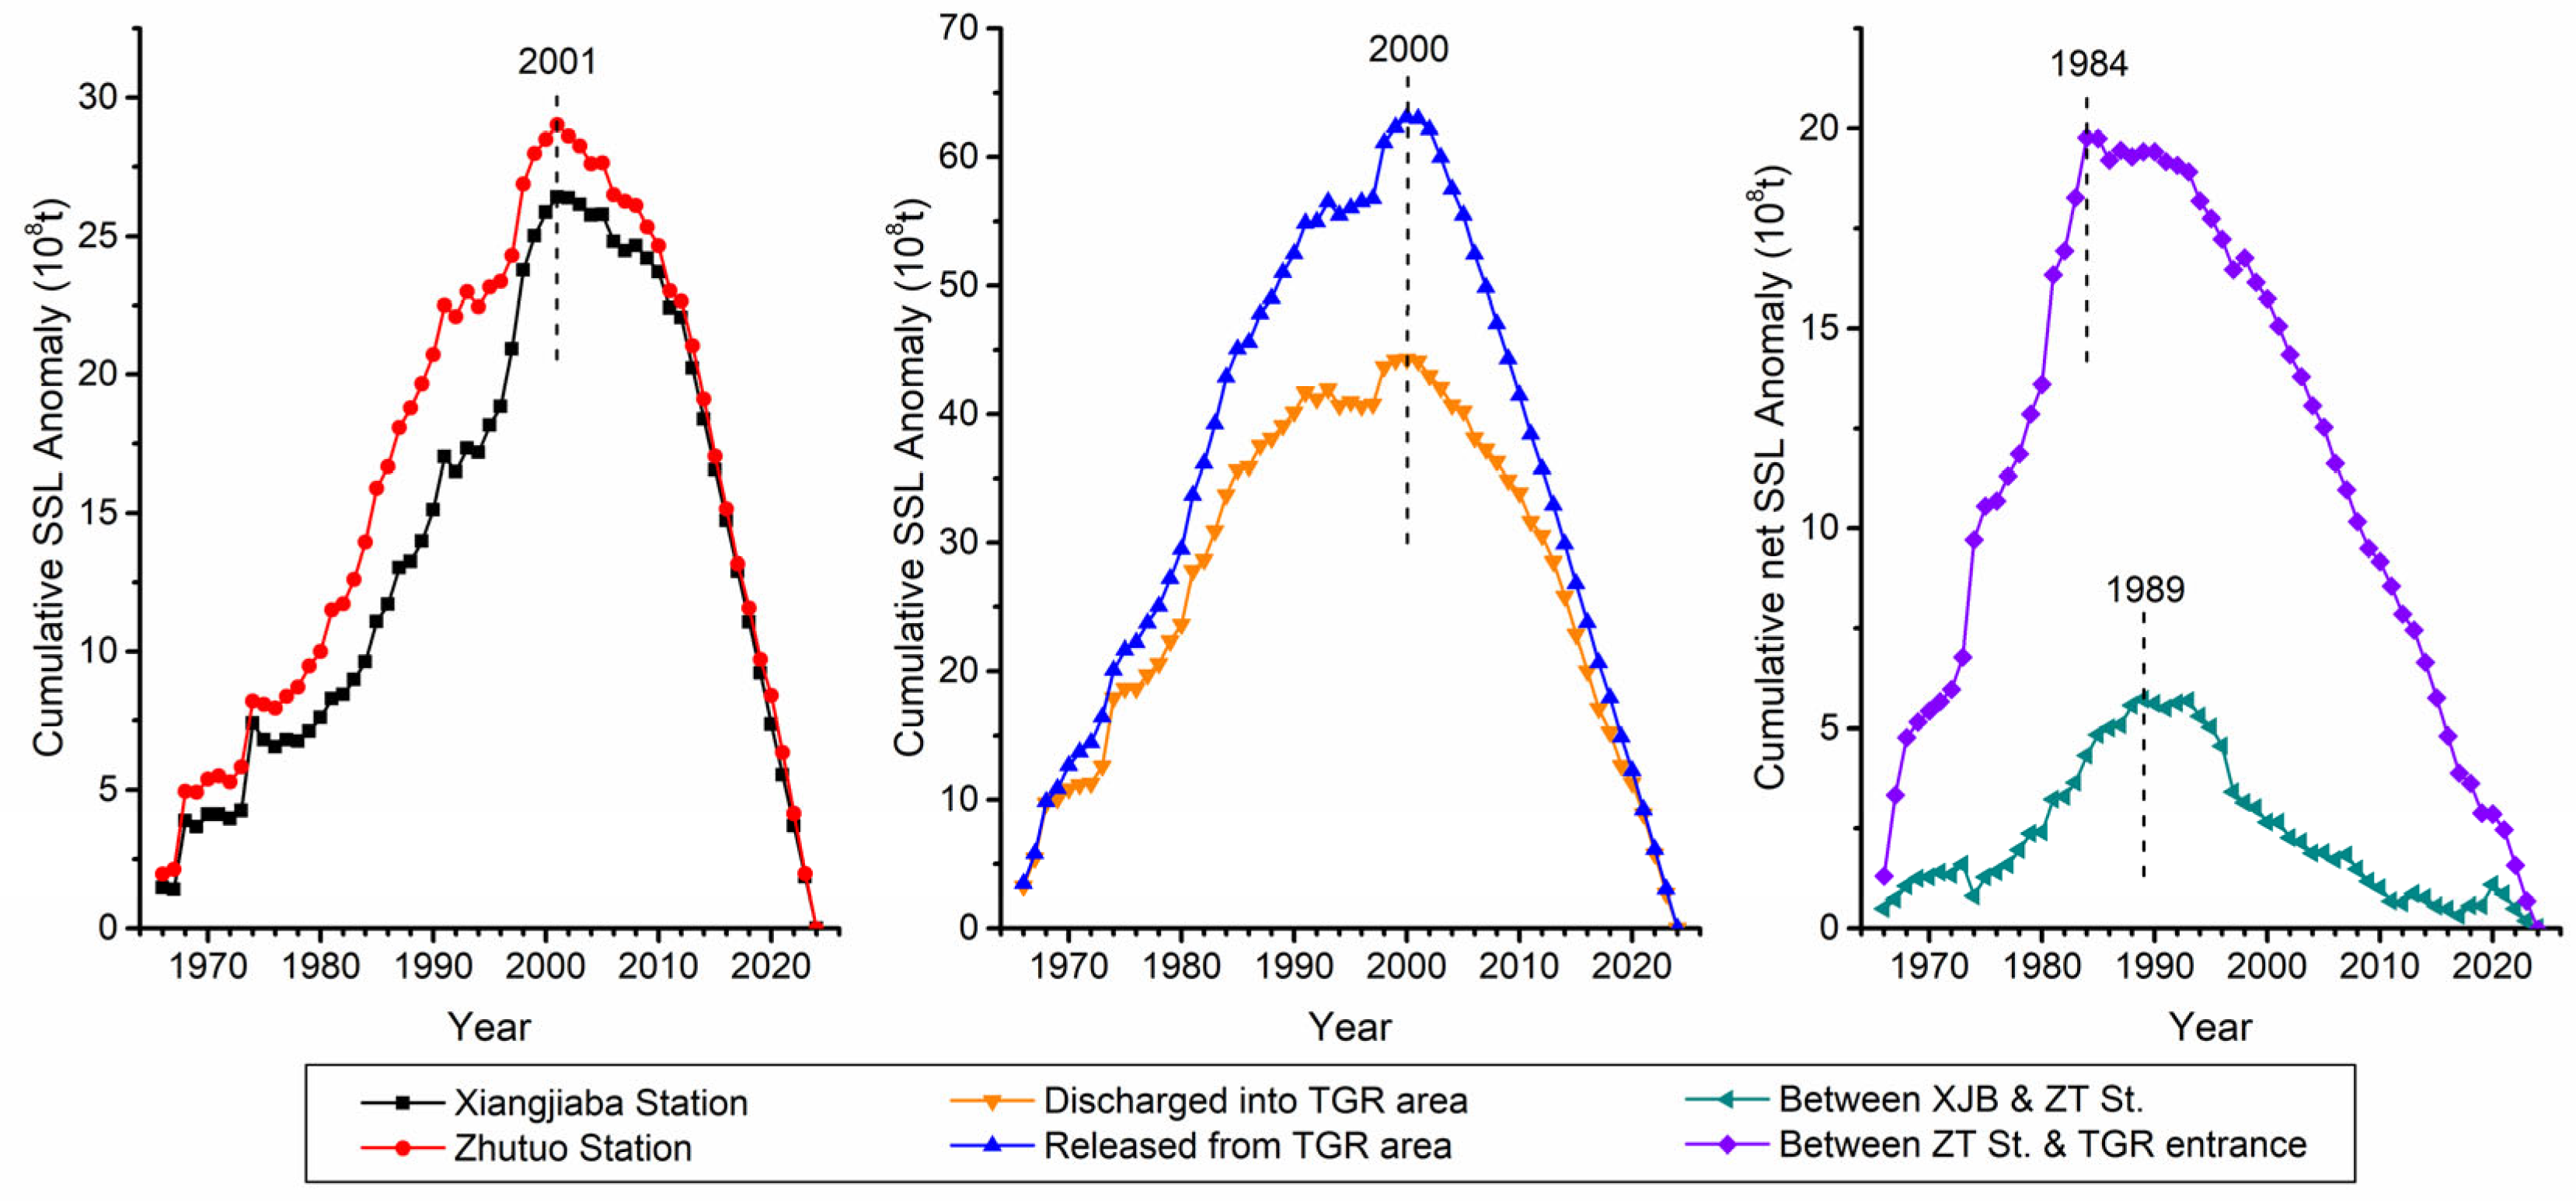
Figure 4.
The key inflection points of annual SSL at typical hydrological stations and of net SSL in certain sections in the upper reaches of the Yangtze River revealed by the RAPS method
Figure 4.
The key inflection points of annual SSL at typical hydrological stations and of net SSL in certain sections in the upper reaches of the Yangtze River revealed by the RAPS method
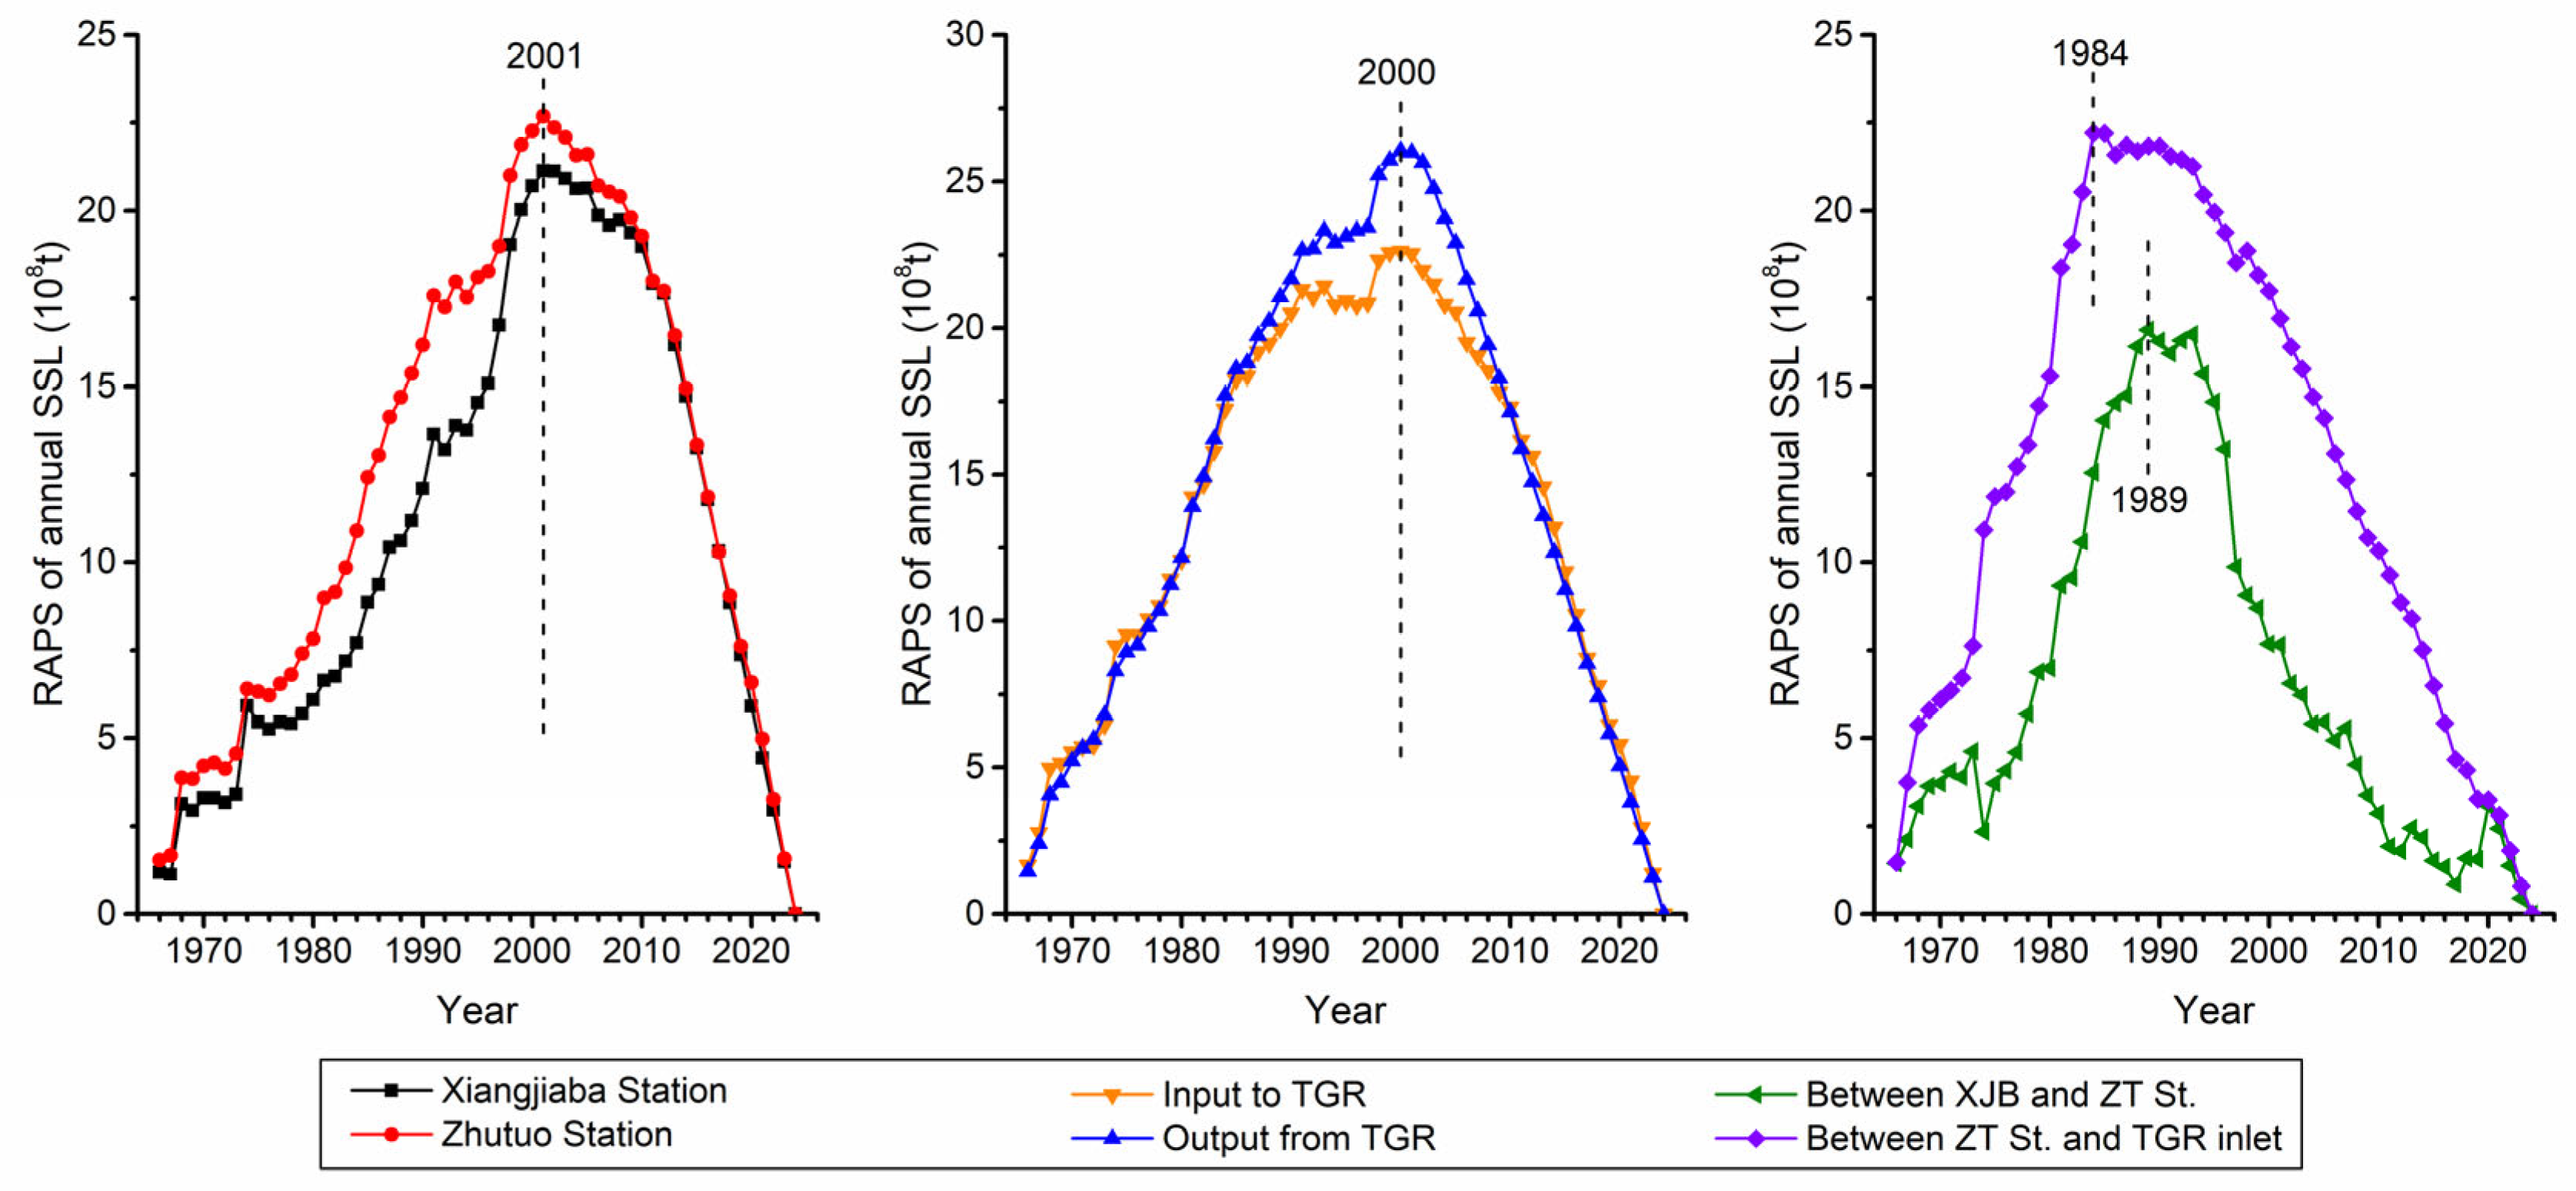
Figure 5.
The multiple inflection points of annual SSL at typical hydrological stations and of annual net SSL in certain sections in the upper reaches of the Yangtze River revealed by double mass curves (note: The data on the SSL into the Three Gorges Reservoir is the sum of the corresponding SSL measured at the following hydrological stations: the Zhutuo Station on the main stem of the Yangtze River upstream of the reservoir, the Beibei Station at the outlet of the Jialing River (a tributary), and the Wulong Station at the outlet of the Wujiang River (another tributary).
Figure 5.
The multiple inflection points of annual SSL at typical hydrological stations and of annual net SSL in certain sections in the upper reaches of the Yangtze River revealed by double mass curves (note: The data on the SSL into the Three Gorges Reservoir is the sum of the corresponding SSL measured at the following hydrological stations: the Zhutuo Station on the main stem of the Yangtze River upstream of the reservoir, the Beibei Station at the outlet of the Jialing River (a tributary), and the Wulong Station at the outlet of the Wujiang River (another tributary).
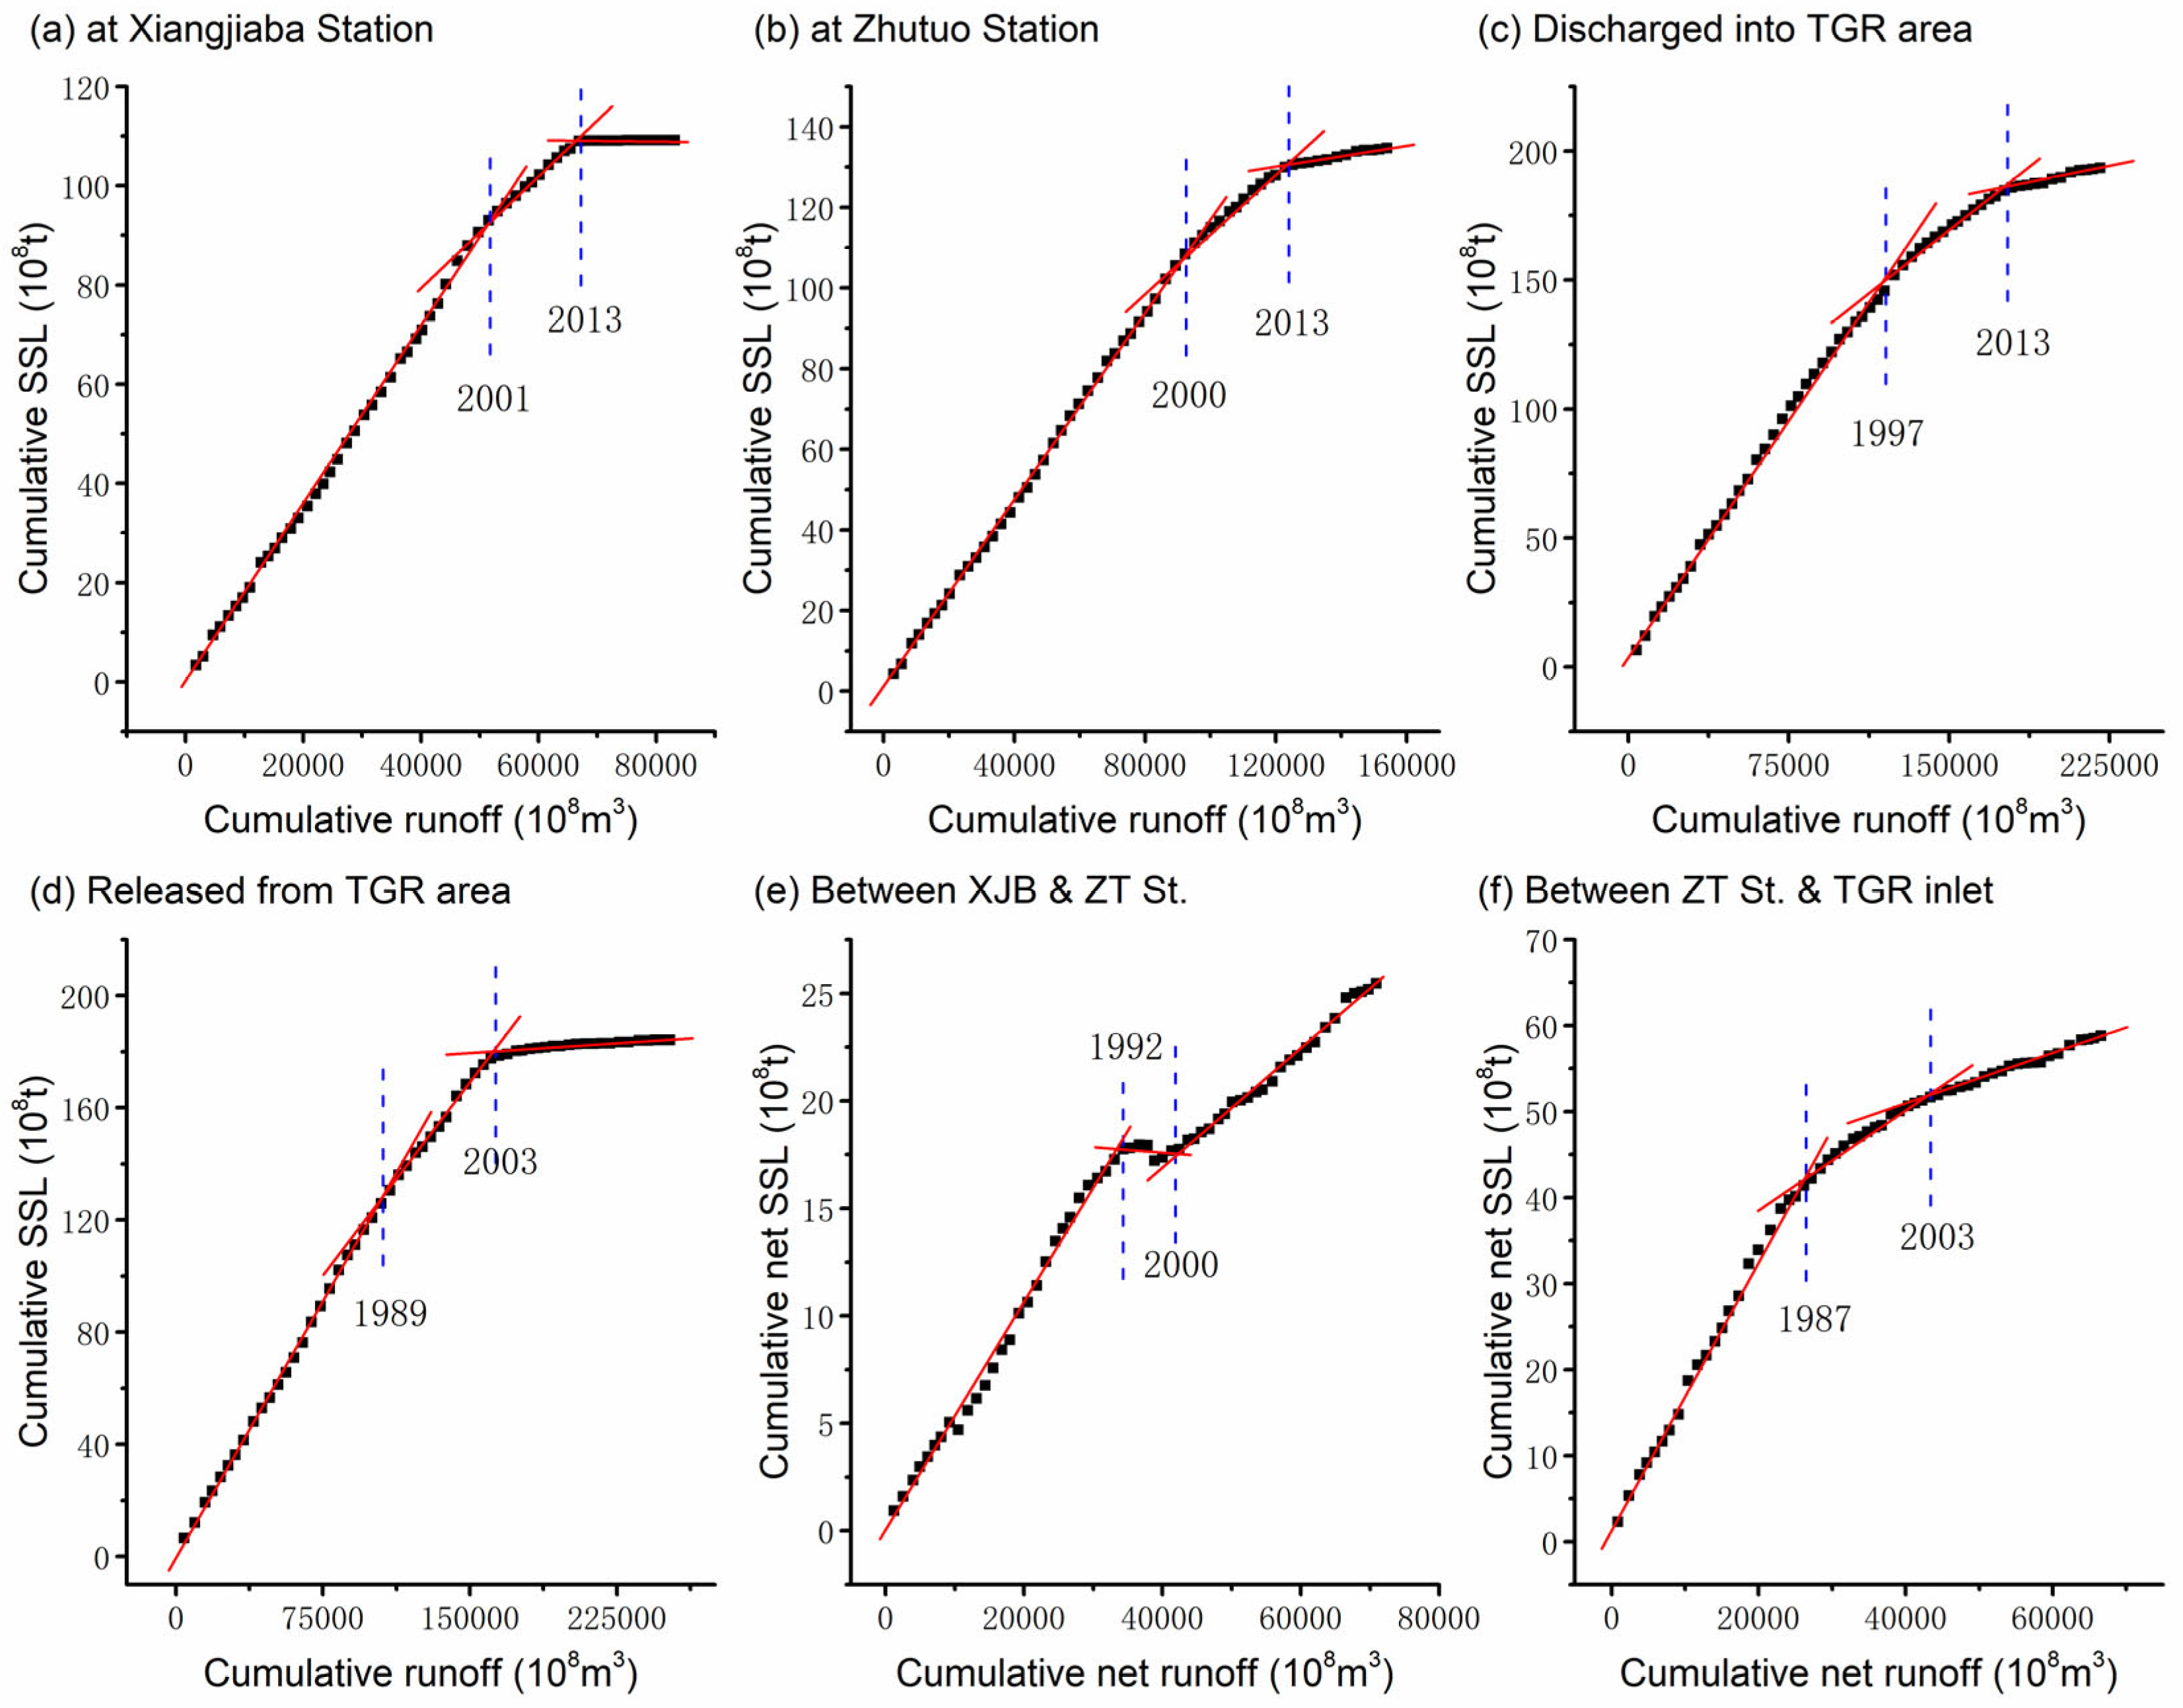
Figure 6.
Relationships between year and cumulative SSL in each stage divided by inflection years for different regions in the upper Yangtze River (The early, middle, and late stages in each sub-figure respectively represent the baseline period, the first change period, and the second change period)
Figure 6.
Relationships between year and cumulative SSL in each stage divided by inflection years for different regions in the upper Yangtze River (The early, middle, and late stages in each sub-figure respectively represent the baseline period, the first change period, and the second change period)
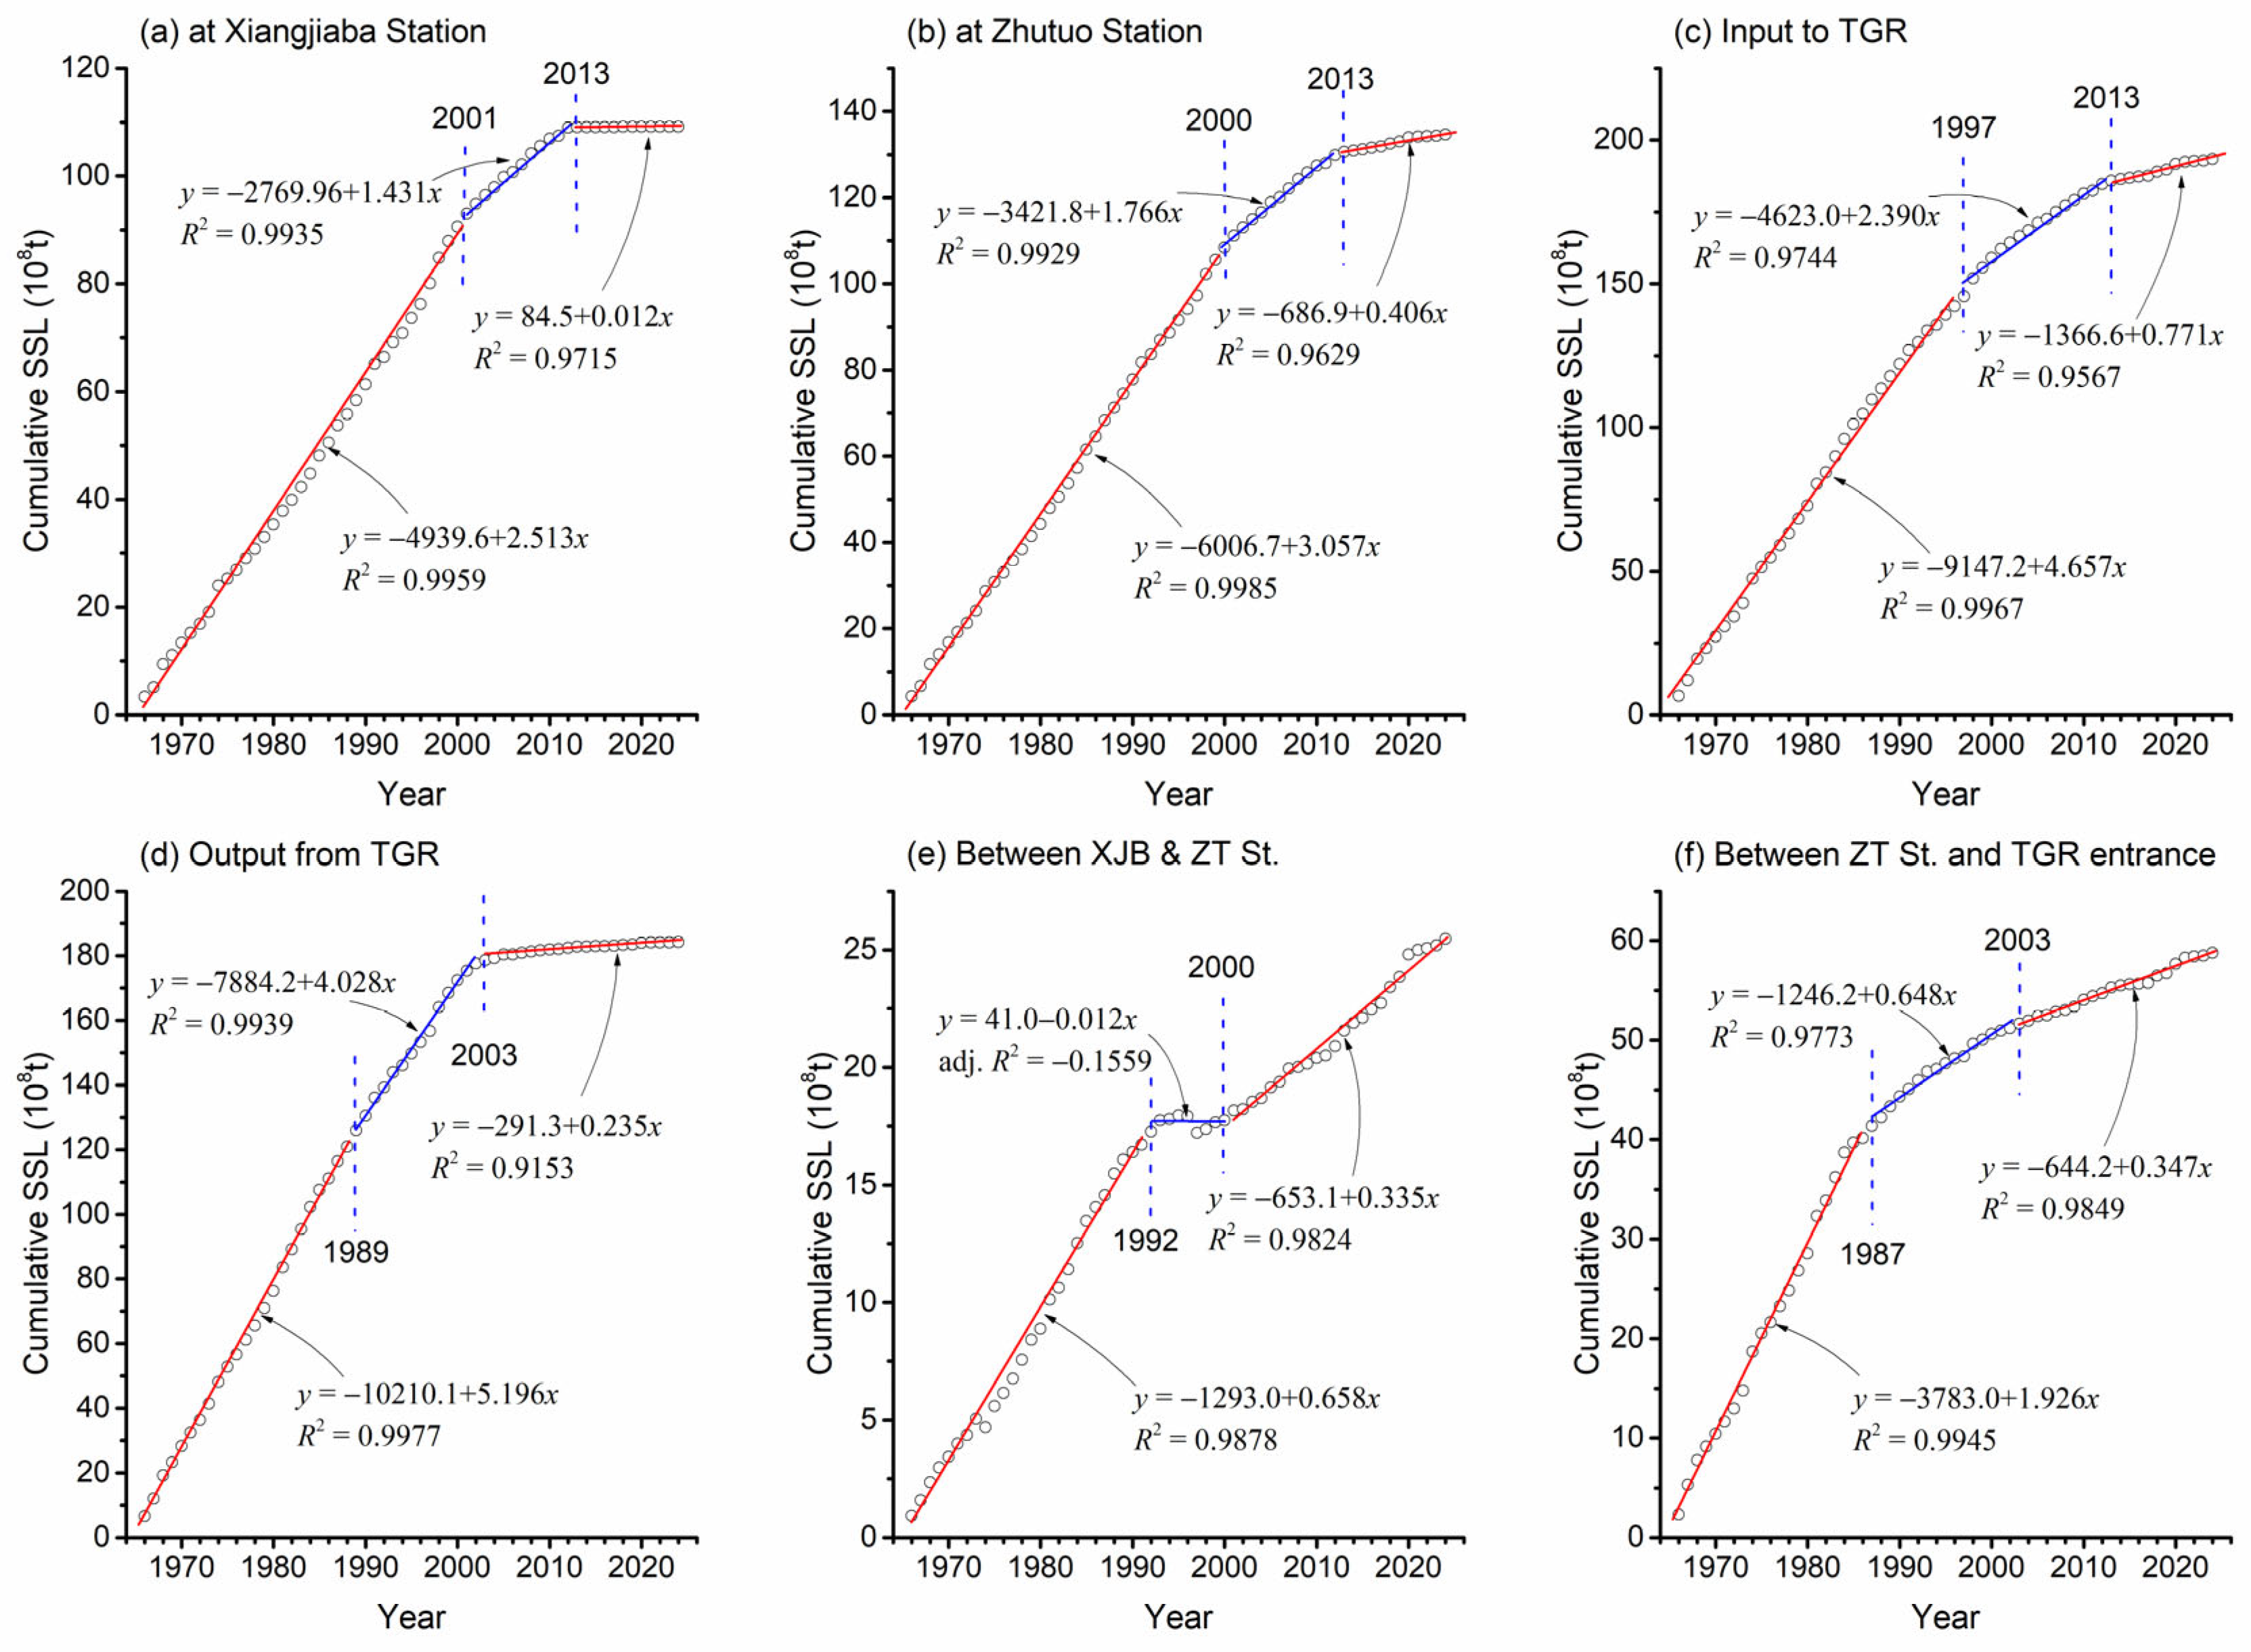
Figure 7.
Relationships between year and cumulative precipitation in the variation periods divided by the inflection years of SSL for different regions in the upper Yangtze River.
Figure 7.
Relationships between year and cumulative precipitation in the variation periods divided by the inflection years of SSL for different regions in the upper Yangtze River.
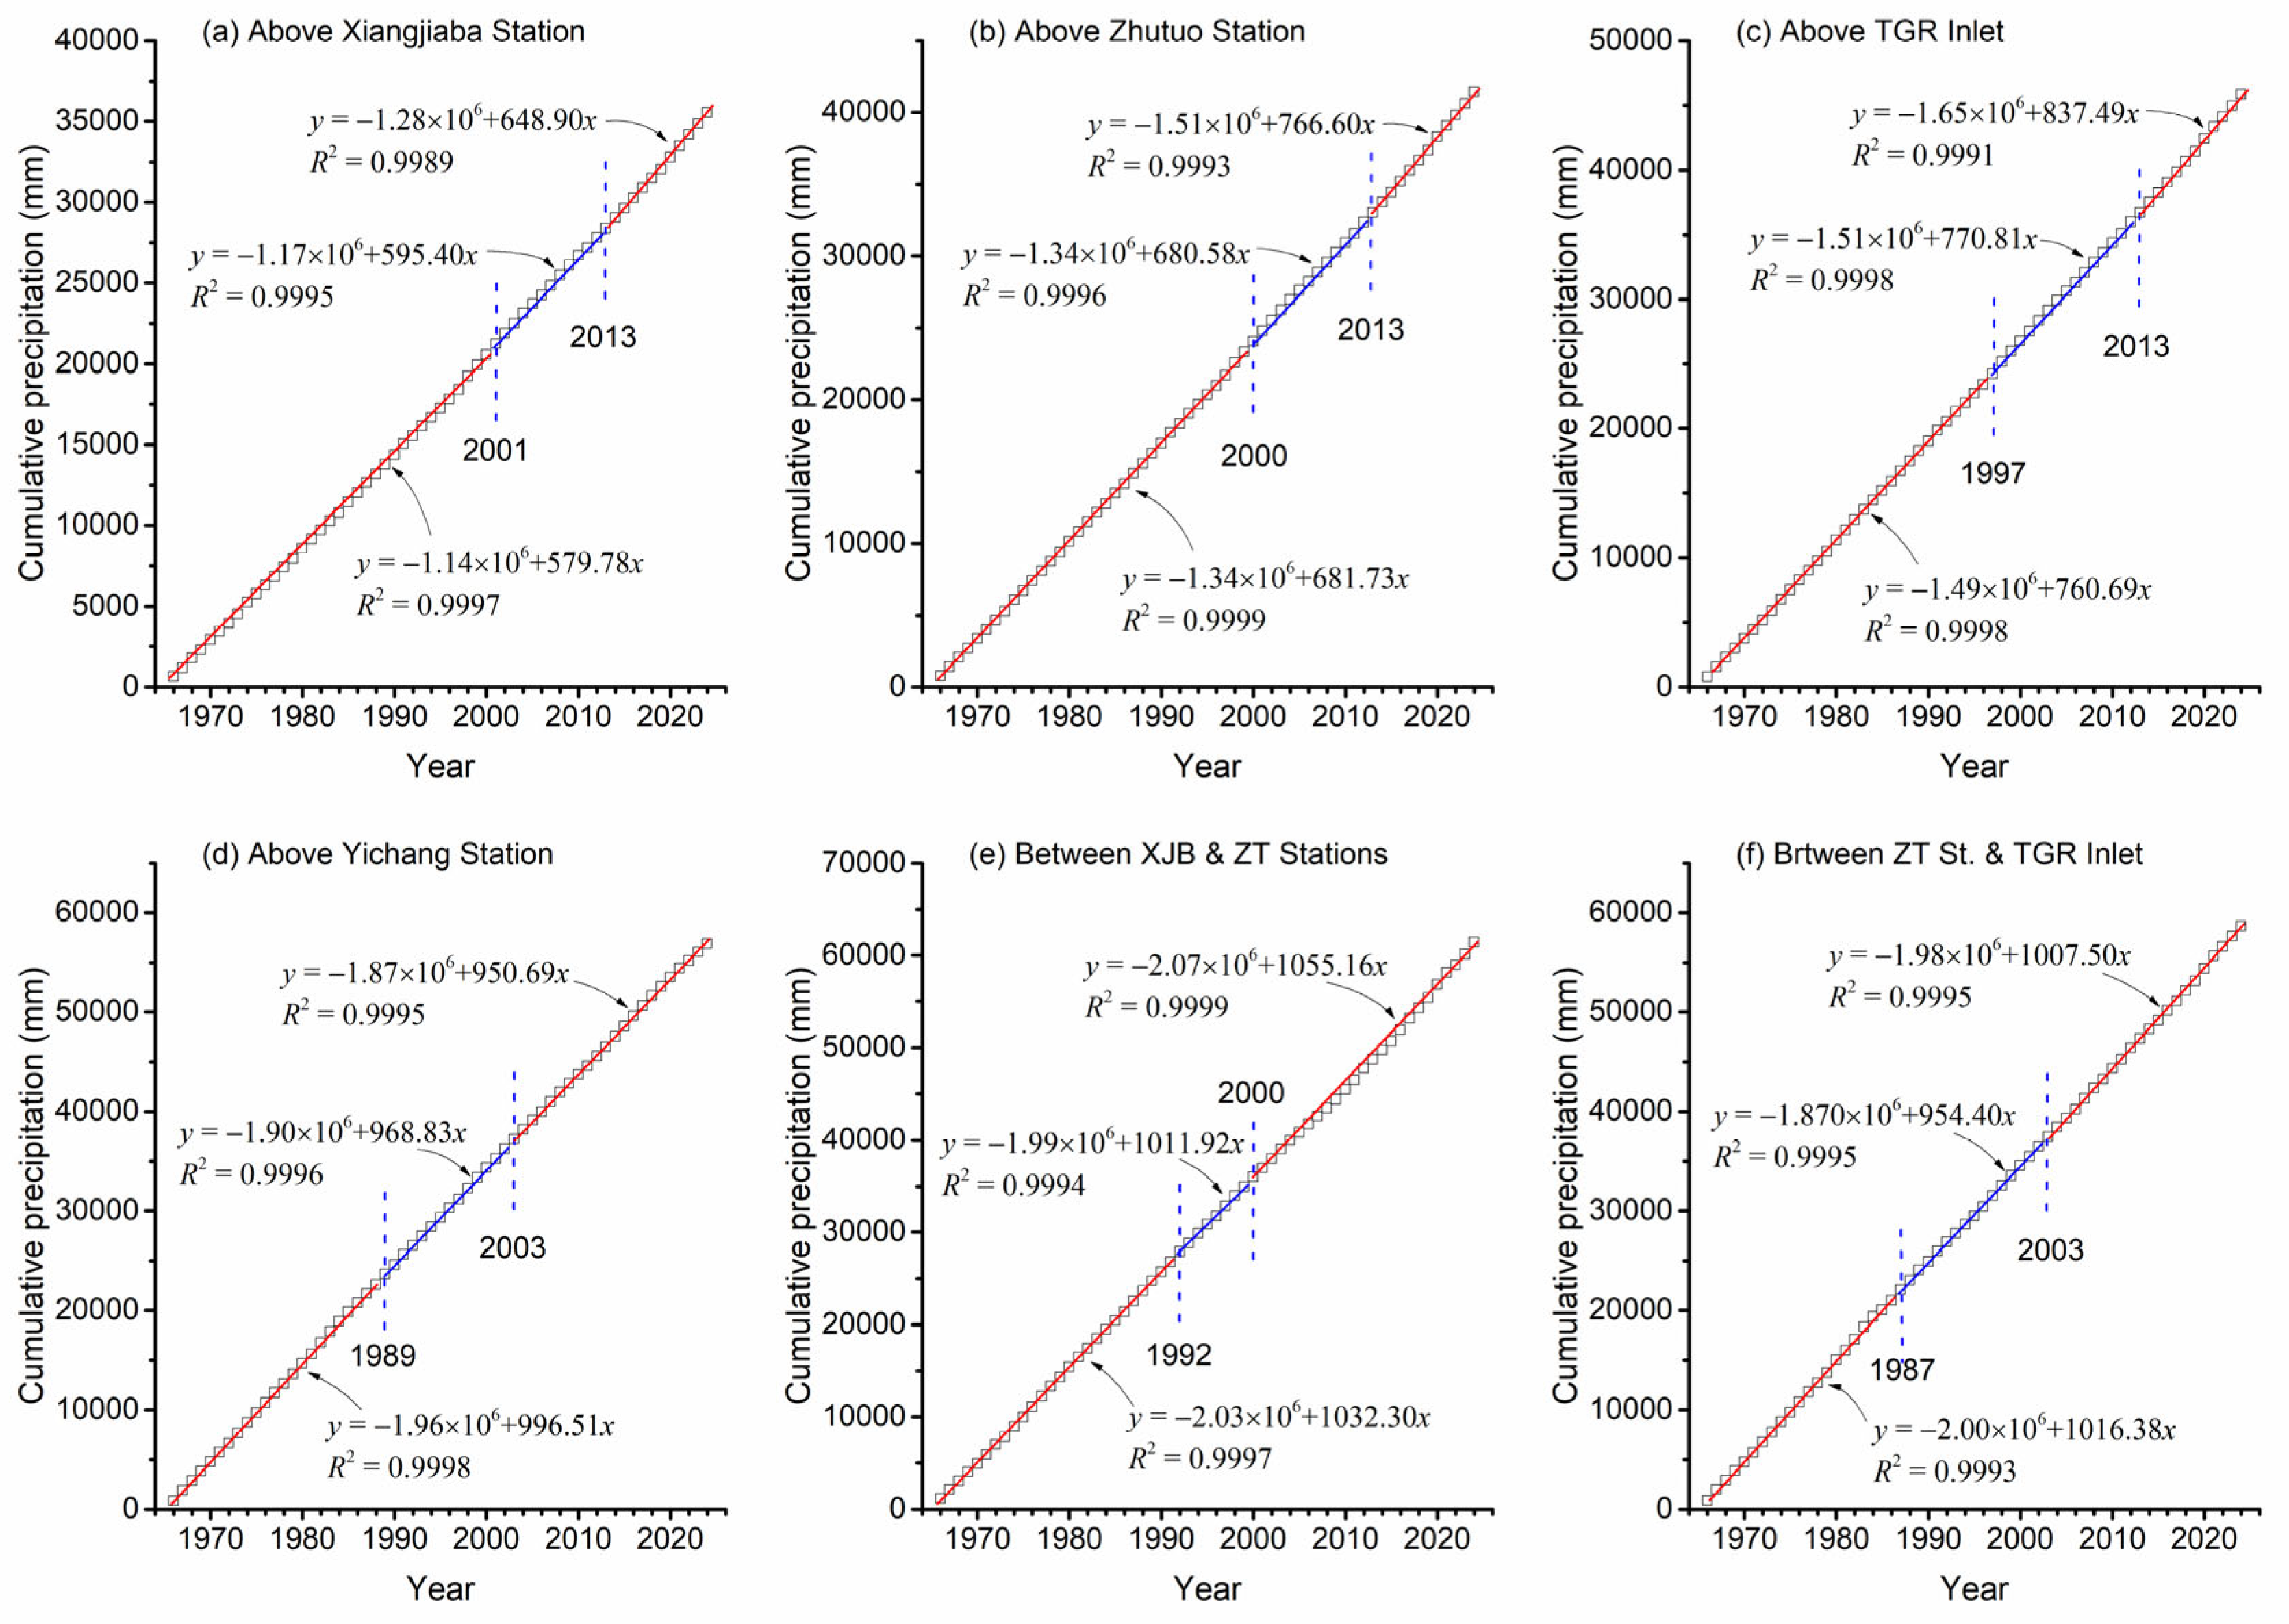
Figure 8.
Relationships between year and cumulative potential ET in the variation periods divided by the inflection years of SSL for different regions in the upper Yangtze River.
Figure 8.
Relationships between year and cumulative potential ET in the variation periods divided by the inflection years of SSL for different regions in the upper Yangtze River.
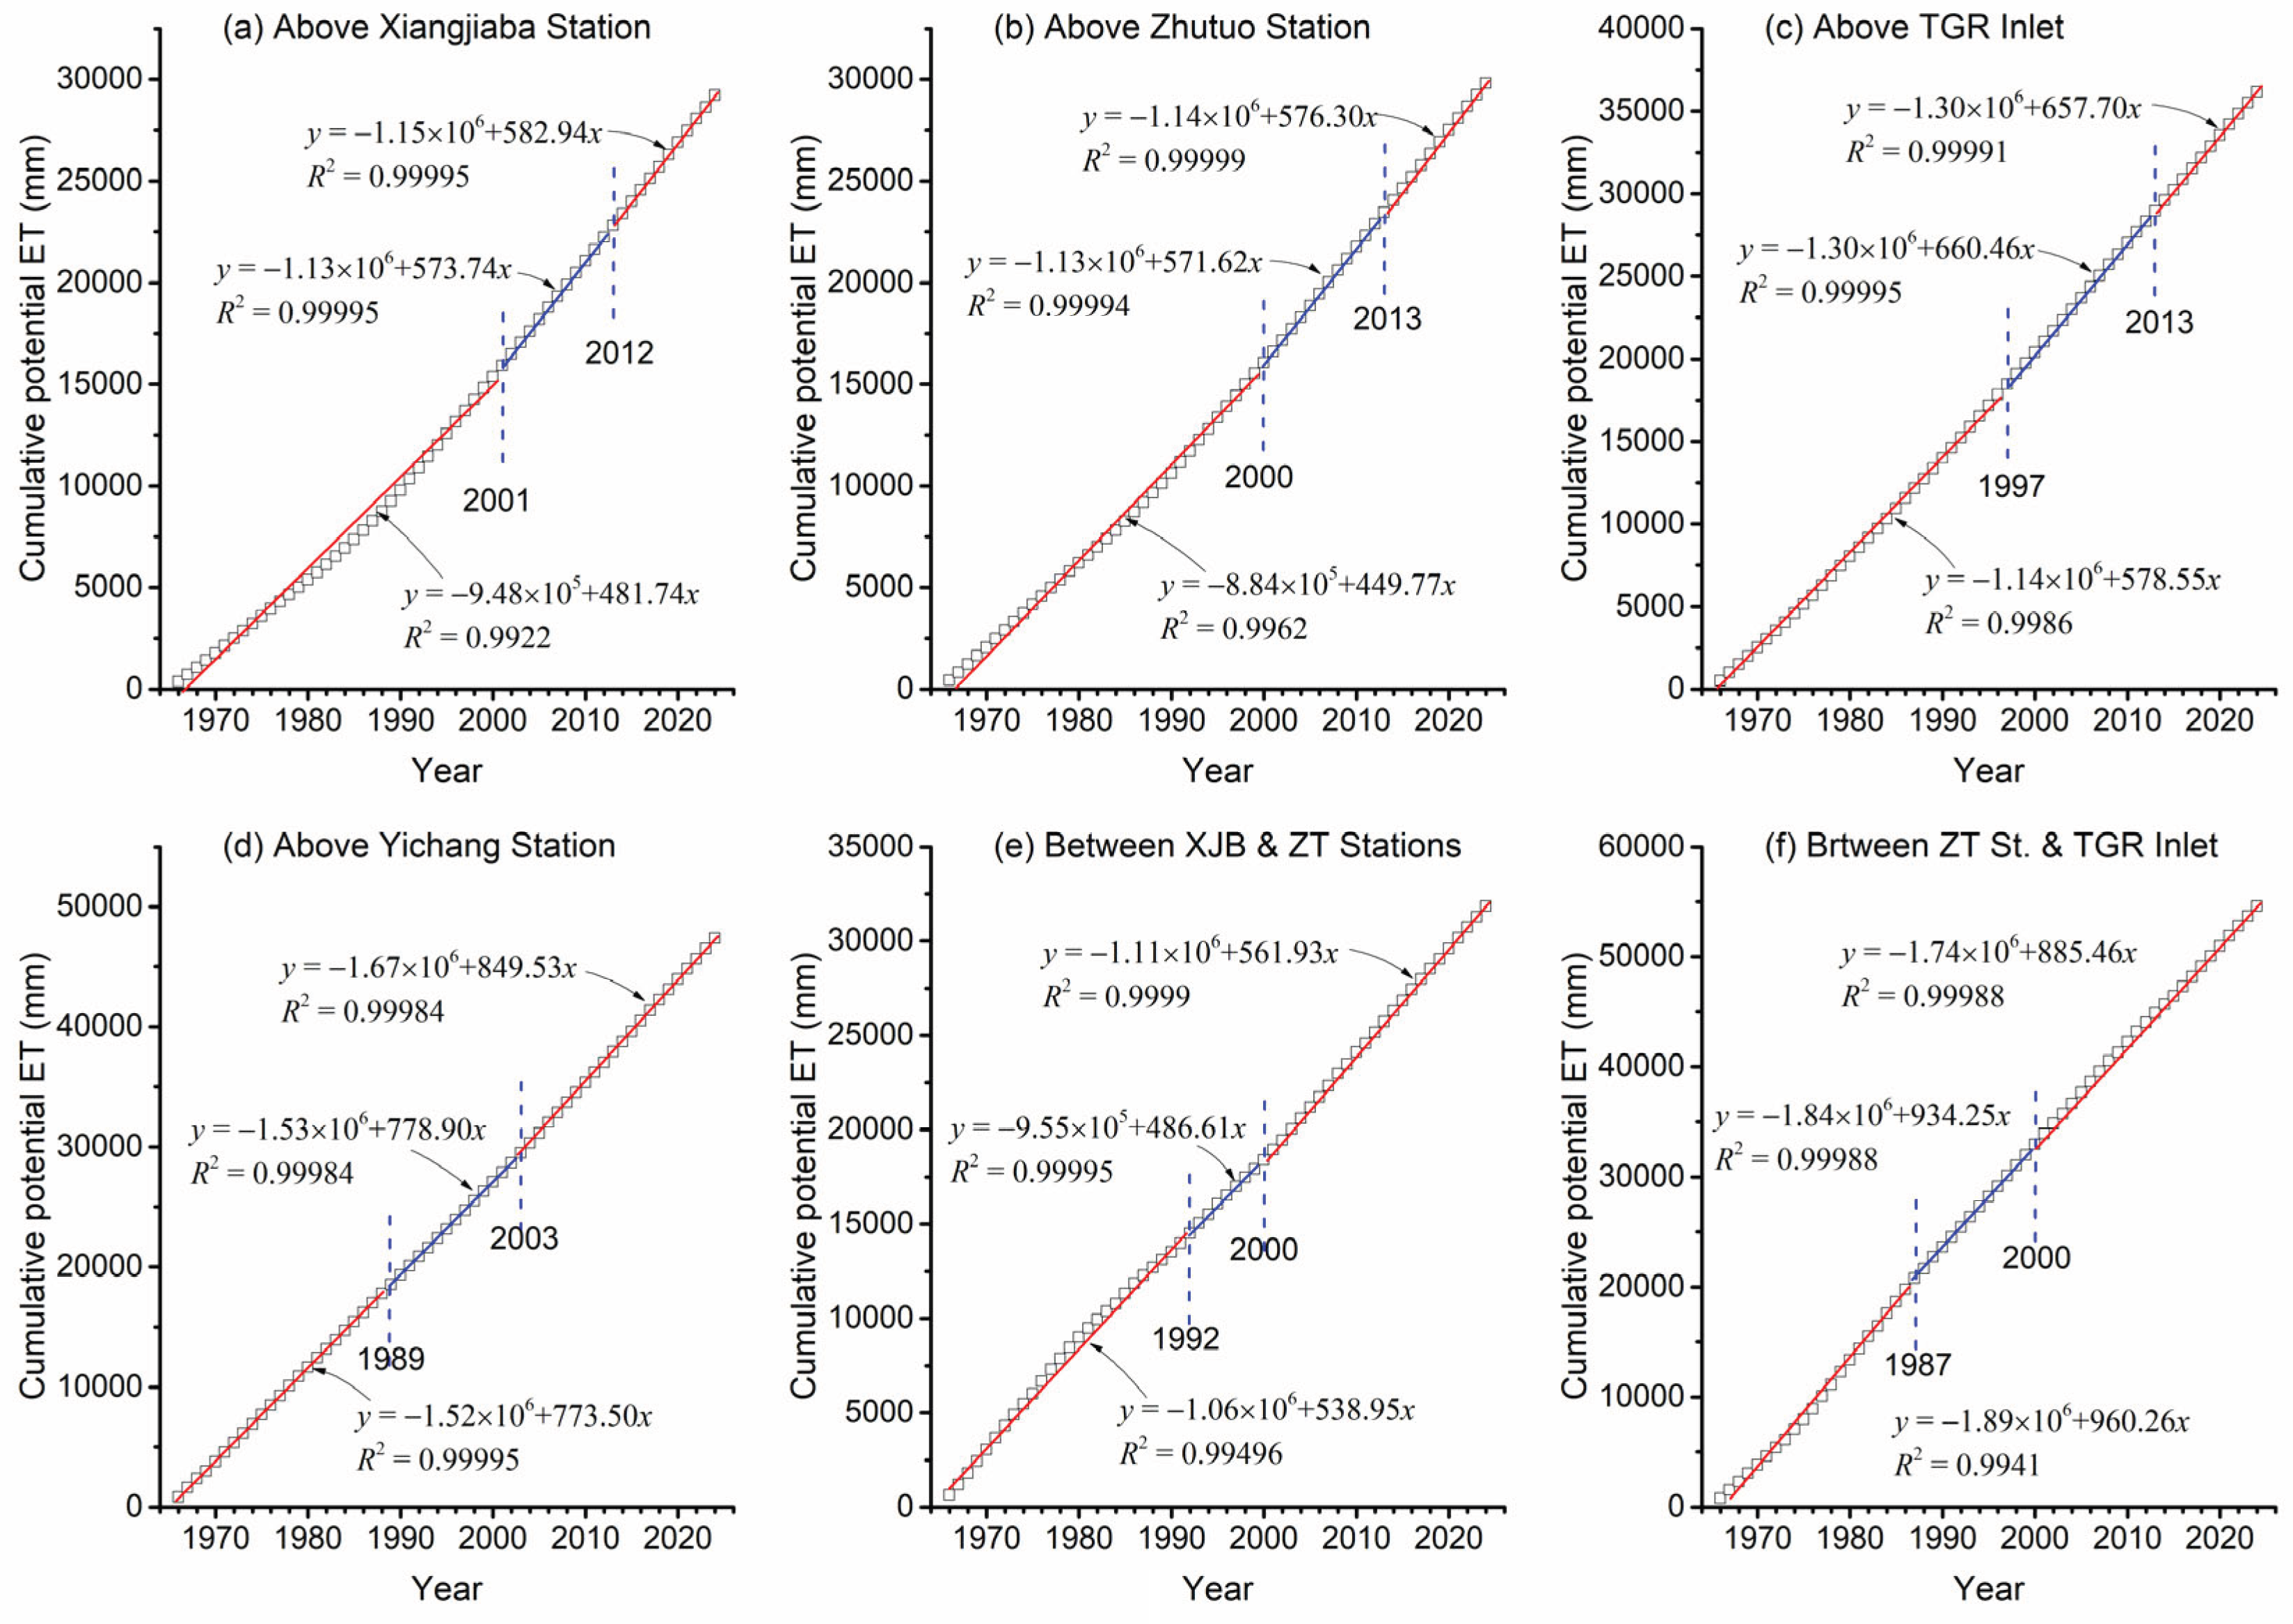
Table 1.
Main parameters of completed reservoirs in the upper Yangtze River.
| Reservoirs | Initial storage |
Controlled basin area (105 km2) |
Storage Capacity (109 m3) |
Regulating capacity (109 m3) |
Installed capacity (GW) |
Global ranking |
|---|---|---|---|---|---|---|
| Gezhouba | Dec. 1988 | 10.803 | 1.58 | 0.085 | 2.7 | |
| Three Gorges | Jun. 2003 | 10.800 | 39.30 | 22.15 | 22.5 | 1 |
| Xiangjiaba | Oct. 2012 | 4.588 | 5.163 | 0.903 | 6.4 | 11 |
| Xiluodu | May 2013 | 4.544 | 12.670 | 6.46 | 13.9 | 4 |
| Wudongde | Jan. 2020 | 4.068 | 7.408 | 3.0 | 10.2 | 7 |
| Baihetan | Apr. 2021 | 4.303 | 20.627 | 10.4 | 16.0 | 2 |
| Sum | 39.106 | 86.748 | 42.998 | 71.7 |
Table 2.
The hydrological and meteorological data series of representative hydrological stations used in this study.
Table 2.
The hydrological and meteorological data series of representative hydrological stations used in this study.
| Hydrological Station (St.) |
Location | Year of Establishment |
Controlled Area (km2) |
Adopted Data Series |
|---|---|---|---|---|
| Pingshan St. | Near the outlet of JSR | 1954 | 458592 | 1966−2008 |
| Xiangjiaba St. | Outlet of JSR | 2008 | 458800 | 2009−2024 |
| Zhutuo St. | Main stream of UYR | 1954 | 694725 | 1966−2024 |
| Beibei St. | Outlet of JLR (tributary) | 1939 | 156736 | 1966−2024 |
| Wulong St. | Outlet of WJR (tributary) | 1995 | 83035 | 1966−2024 |
| Yichang St. | Outlet of UYR | 1946 | 1005501 | 1966−2024 |
Note: JSR refers to the Jinsha River; UYR refers to the Upper Yangtze River; JLR refers to the Jialing River; WJR refers to the Wujiang River.
Table 3.
Main inflection years of SSL processes at representative hydrological stations and typical river sections in the upper reaches of the Yangtze River during the period from 1966 to 2024.
Table 3.
Main inflection years of SSL processes at representative hydrological stations and typical river sections in the upper reaches of the Yangtze River during the period from 1966 to 2024.
| Location | Inflection year | PBAS | PFCH | PSCH | |
|---|---|---|---|---|---|
| At XJB Station | 2001 | 2013 | 1966–2000 | 2001–2012 | 2013–2024 |
| At Zhutuo Station (ZTS) | 2000 | 2013 | 1966–1999 | 2000–2012 | 2013–2024 |
| Discharged into TGR | 1997 | 2013 | 1966–1996 | 1997–2012 | 2013–2024 |
| Released from TGR | 1989 | 2003 | 1966–1988 | 1989–2002 | 2003–2024 |
| Between XJB and ZT Stations | 1992 | 2000 | 1966–1991 | 1992–1999 | 2000–2024 |
| Between ZTS and TGR inlet | 1987 | 2003 | 1966–1986 | 1987–2002 | 2003–2024 |
Note: PBAS, PFCH, and PSCH respectively denotes the baseline period, first change period, and second change period.
Table 5.
Relative contribution rates of precipitation (CP), potential ET (CET), climate (CCL), and human activities (CHA) to reduction in SSL in different sections of the upper Yangtze River
Table 5.
Relative contribution rates of precipitation (CP), potential ET (CET), climate (CCL), and human activities (CHA) to reduction in SSL in different sections of the upper Yangtze River
| Location | Periods and Their Codes | CP (%) | CET (%) | CCL (%) | CHA (%) | |
|---|---|---|---|---|---|---|
| Above XJB St. | 1966–2000 | Base Period | / | / | / | / |
| 2001–2012 | Change−Ⅰ | −6.3 | 0.4 | −5.8 | 105.8 | |
| 2013–2024 | Change−Ⅱ | −12.0 | 0.2 | −11.7 | 111.7 | |
| Above ZT St. | 1966–1999 | Base Period | / | / | / | / |
| 2000–2012 | Change−Ⅰ | 0.5 | 0.6 | 1.1 | 98.9 | |
| 2013–2024 | Change−Ⅱ | −14.3 | 0.3 | −14.0 | 114.0 | |
| Above TGR inlet | 1966–1996 | Base Period | / | / | / | / |
| 1997–2012 | Change−Ⅰ | −2.7 | 0.3 | −2.4 | 102.4 | |
| 2013–2024 | Change−Ⅱ | −12.1 | 0.2 | −11.9 | 111.9 | |
| Above YC St. | 1966–1988 | Base Period | / | / | / | / |
| 1989–2002 | Change−Ⅰ | 12.4 | 0.0 | 12.5 | 87.5 | |
| 2003–2024 | Change−Ⅱ | 4.8 | 0.1 | 4.9 | 95.1 | |
| Section XJB–ZT St. | 1966–1991 | Base Period | / | / | / | / |
| 1992–1999 | Change−Ⅰ | 2.0 | −0.1 | 1.9 | 98.1 | |
| 2000–2024 | Change−Ⅱ | −4.5 | 0.1 | −4.4 | 104.4 | |
| Section ZTS-TGR | 1966–1986 | Base Period | / | / | / | / |
| 1987–2002 | Change−Ⅰ | 9.2 | 0.0 | 9.2 | 90.8 | |
| 2003–2024 | Change−Ⅱ | 1.1 | −0.1 | 1.0 | 99.0 | |
| Arithmetic Mean | Change−Ⅰ | 2.5 | 0.2 | 2.8 | 97.3 | |
| Change−Ⅱ | −6.2 | 0.1 | −6.0 | 106.0 | ||
Disclaimer/Publisher’s Note: The statements, opinions and data contained in all publications are solely those of the individual author(s) and contributor(s) and not of MDPI and/or the editor(s). MDPI and/or the editor(s) disclaim responsibility for any injury to people or property resulting from any ideas, methods, instructions or products referred to in the content. |
© 2025 by the authors. Licensee MDPI, Basel, Switzerland. This article is an open access article distributed under the terms and conditions of the Creative Commons Attribution (CC BY) license (http://creativecommons.org/licenses/by/4.0/).
Copyright: This open access article is published under a Creative Commons CC BY 4.0 license, which permit the free download, distribution, and reuse, provided that the author and preprint are cited in any reuse.


