
Submitted:
18 December 2024
Posted:
20 December 2024
You are already at the latest version
Abstract
This study was carried out to appraise the groundwater fluoride removal effectiveness of Al-Fe oxide-infused diatomaceous earth (DE) in a continuous flow fixed-bed column. The adsorbent was optimally synthesized and then characterized. A glass column designed for the experiment was packed with the test adsorbent at specific doses. The effects of flow rate, influent fluoride concentration and bed height (adsorbent dose) on fluoride removal were evaluated by fixing the value of a parameter while varying the other. The breakthrough volume was the volume of treated water obtained until the concentration of fluoride in treated was 1.5 mg/L, being the World Health Organization (WHO, 2017) maximum limit of fluoride in drinking water. The maximum breakthrough volume obtained in the study was 118.2 mL at the optimum conditions of influent F- concentration = 5 mg/L, 1–g adsorbent giving an initial bed height = 7.5 cm, and flow rate = 1.97 mL/min. Channeling and co-existing anions were limiting factors for the attainment of breakthrough volume for groundwater defluoridation. Further work using granulated adsorbent may probably improve the rigidity of adsorbent and reduce channeling effect.
Keywords:
defluoridation
; performance
; diatomaceous earth
; fixed-bed
; continuous flow
1. Introduction
Fluoride is needed in drinking water at a low concentration (< 1 mg/L) to prevent dental caries (Hammer, 1986). However, at concentrations above 1 mg/L in drinking water fluoride causes health hazard in humans with effects like mottling of teeth, and for prolonged consumption, dental or skeletal fluorosis and other health challenges including arthritis (Bhatnagar, et al., 2011; Wambu, et al., 2013). The guideline for fluoride in drinking water set by World Health Organization (WHO) is 1.5 mg/L (WHO, 2017). Several methods have been employed to remove excess fluoride from water. The methods include adsorption (Liu, et al., 2011; Getachew, et al., 2015), Donnan dialysis (Ruiz, et al., 2003), electrodialysis (Ergun, et al., 2008), ion exchange (Samadi, et al., 2014), precipitation/electrocoagulation (Un, et al., 2013; Nasr, et al., 2014; ) and reverse osmosis (Pontie, et al., 2013).
The challenge of high fluoride in drinking water is more pronounced in the rural communities of some less developed nations like South Africa, Malawi and Kenya (Ncube & Schutte, 2005; Sadiju et al., 2008; Mwiathi et al., 2022), which depend on groundwater as the major source of drinking water. The major source of the fluoride in the groundwater is traced to the dissolution of fluoride from the weathering of rocks rich in minerals such as fluorspar, fluorapatite, apatite and cryolite (Battaleb-Looie & Moore, 2010). Employing a less expensive technology such as adsorption, requiring little or no skill or electric power for fluoride removal is most desirable for low income rural communities (Nasr, et al., 2011; Sakhare, et al., 2012).
Batch method is used to evaluate the potential of an adsorbent, whether natural or synthesized, to remove fluoride from water at optimized adsorption parameters such as contact time, adsorbent dose, adsorbate concentration, solution pH and temperature as reported in literature (Karthikeyan, et al., 2005; Jagtap, et al., 2011; Izuagie, et al., 2016a, 2016b; Tang & Zhang, 2016). A fixed-bed continuous flow mode may thereafter be used to evaluate the adsorbent’s performance in a manner mimicking a point-of-use system (Ghorai & Pant, 2004; Ma, et al., 2011; Davita-Rodriguez, et al., 2012; Ghosh, et al., 2015). An adsorbent with low fluoride removal tendency, even at optimised conditions in batch experiments may most likely not have fluoride uptake capacity in a fixed-bed column.
Al-Fe bimetal oxide-infused DE demonstrated a high fluoride removal potential in batch method where a dose of 0.6 g/100 mL reduced the fluoride in artificial water containing 10 mg/L fluoride by 93.1% (Izuagie, et al., 2016b). This huge defluoridation success necessitated evaluation of the defluoridation performance of the adsorbent in a fixed-bed continuous flow mode where the design would mimic a real-life point-of-use device.
2. Material and Methods
2.1. Solution Preparation
The analytical grade chemicals used included hydrochloric acid (HCl), sodium hydroxide (NaOH), sodium fluoride (NaF), iron (III) tetraoxosulphate (VI) hydrate (Fe2(SO4)3.xH2O) and aluminium tetraoxosulphate (VI) octadecahydrate (Al2(SO4)3.18H2O) for preparing necessary solutions. Chemicals were produced by Sigma-Aldrich, Germany and procured from Rochelle Chemicals, South Africa. The fluoride solutions used were prepared from analytical grade sodium fluoride (NaF). Fluoride concentrations (3, 5 and 7 mg/L) were prepared from 100 mg/L fluoride solution through serial dilution. The 100 mg/L fluoride solution was prepared by dissolving 0.2210 g of NaF in 1 L of solution in a liter volumetric flask.
2.2. Adsorbent Preparation
Five 2 g portions of clean diatomaceous earth in 250-mL plastic bottles were treated in sequence with a total volume of 20 mL of 0.5 M Al3+ and 0.5 M Fe2+ in which the respective volume ratios were 2.5:17.5, 5:15, 10:10, 15:5 and 17.5:2.5. Precipitation of hydroxides of Al3+ and Fe2+ was done by adjusting the pH of mixtures to 8.2 with stirring using 2 M NaOH. The mixtures were then placed on reciprocating shaker for 50 minutes to complete the modification process. The modified mass was recovered from mixture by centrifuging, washed with extra pure water and dried in the oven at 110 0C for 8 hours. Dry samples were crushed to powder, sieved with 250-mm pore mesh and kept in sealed containers until further use. Defluoridation with 0.4 g of each sample gave results showing that the DE sample modified with equal volumes of 0.5 M Al3+ and Fe2+ was the optimally modified sample (Izuagie, et al., 2016b), subsequently prepared in larger quantity for the fixed-bed column continuous flow experiments.
2.3. Physicochemical Characterization of Adsorbent
The morphological structures of the natural and Al-Fe modified DE were analyzed at the Electron Microscope Unit, University of Cape Town, South Africa, using Hitachi X-650 Scanning Electron Micro Analyzer furnished with CDU lead detector, at 25 kV. The images of the scans are presented in Figure 2. Transmission electron microscopy (TEM) of the modified adsorbent was done to probe the extent of deposit of the bimetal oxide on the pores of DE. The analysis was carried out at the National Centre for Nano-Structured Materials, CSIR, South Africa, using JEM-2100 Electron Microscope. The TEM images of the analysis, which also included the modifying bimetallic oxide, are presented in Figure 3.
The Fourier Transform Infra-Red (FTIR) spectroscopy of the natural DE, Al-Fe oxide modified DE and the fluoride-loaded modified DE was carried out at the Laboratory Services, Necsa, South Africa. A portion of each sample was mixed with dry potassium bromide (KBr) and pressed into a disc form using a hydraulic press. The disc was scanned using a Bruker Tensor 27 FTIR. The spectra of the three samples were overlaid for comparison and to identify peculiar changes in the samples’ spectra. The spectra are shown in Figure 4.
Determination of adsorbent’s surface area and pore area/volume was by Brunauer–Emmett–Teller (BET) method. The analysis was carried out at the National Centre for Nano-structured materials, Council for Scientific and Industrial Research (CSIR), South Africa, using Micromeritics TriStar II Surface Area and porosity (Izuagie, et al., 2016b). The results are shown in Table 1.
The mineralogical composition study by X-ray diffraction (XRD) analysis of the natural DE was done at the XRD & XRF Facility, University of Natural Agricultural Sciences, Department of Geology, University of Pretoria, South Africa by means of PANalytical X’Pert powder diffractometer equipped with X’Celerator detector and variable divergence- and fixed receiving slits with Fe filtered Co-Kα radiation. X’Pert Highscore plus software was used to identify the phases. The result of analysis is represented by Figure 5.
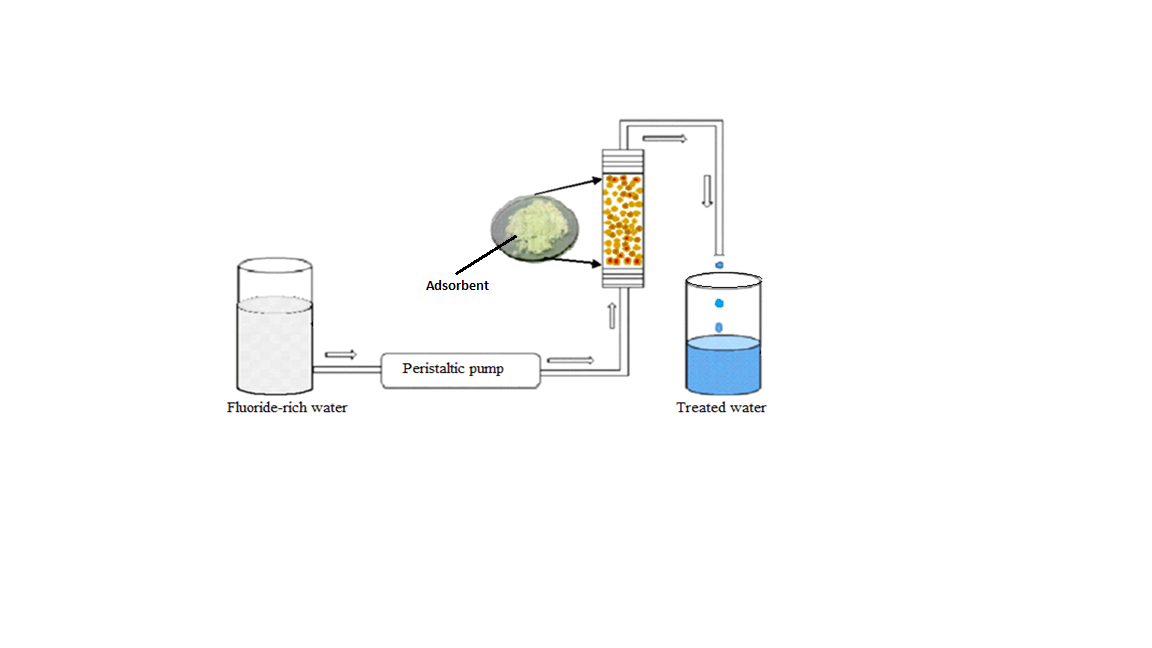
2.4. Apparatus Set Up
The apparatus (Figure 1) for the fixed-bed continuous flow experiments comprised a fixed-bed column adsorption filter, connected to a peristaltic pump through Teflon tubing, a glass beaker containing the influent fluoride solution, and an effluent tubing to convey the effluent fluoride solution into a measuring cylinder to collect the treated water. The column was made from a 10-mL polypropylene pipette with an internal diameter of 8 mm. The terminals of the column were sealed with trimmed small rubber bungs with central opening for inlet and outlet water tubes. The inner lower base of the column consisted of inert glass beads on which lay a glass wool, which was to ensure consistent packing as well as condition the flow stream of influent solution (Kelly, 1992). On the glass wool sat two rubber rings holding two wire gauzes in a fixed position with an 11 µ pore size Whatman filter paper in-between the wire gauzes to prevent escape of adsorbent. Specific masses of adsorbent were measured into the column through a narrow-tail funnel. A similar arrangement of wire gauzes with filter paper, glass wool and glass beads was done consecutively up the packed column.
2.5. Defluoridation in a Column Fixed-Bed of Adsorbent
The influent whose fluoride concentration ranged between 3 mg/L to 7 mg/L was stored in a litre plastic bottle. The solution was poured regularly from the plastic bottle into a 100-mL Erlenmeyer beaker in which the Teflon inlet tube was inserted to aspirate the influent into the column for fluoride removal with the aid of a peristaltic pump. The effluent (treated water) was collected with measuring cylinders at 10 min intervals for fluoride analysis using ion-selective electrode (ORION VERSASTAR Advanced Electrochemistry meter fluoride ion-selective electrode) calibrated with standard fluoride solutions containing Total Ionic Strength Adjustment Buffer III (TISAB III).
2.6. Optimization of Sorption Parameters
2.6.1. Effect of Flow Rate
The effect of flow rate on fluoride sorption was evaluated using a column packed with 1 g of adsorbent and influent fluoride concentration of 5 mg/L. The flow rates evaluated were 2.26, 1.97, 1.40 and 1.48 mL/min. In each experiment, the effluents collected at 10 minutes intervals were analyzed for residual fluoride using the technique described in subsection 2.4.
2.6.2. Effect of Adsorbent Dose
The effect of adsorbent was evaluated by packing the column respectively with 0.5, 0.8 and 1, 1.2 and 1.5 g of adsorbent. The concentration of fluoride in the influent was 5 mg/L while the flow rate was 1.97 mL/L. The effluent was collected with a measuring cylinder at an interval of 10 minutes. Each effluent collected was analyzed for residual fluoride.
2.6.3. Effect of Initial Fluoride Concentration
The effect of the initial fluoride concentration on the breakthrough volume was evaluated using solutions with initial fluoride concentrations of 3, 5 and 7 mg/L. The fluoride solutions were fed into the fixed-bed column containing 1 g of adsorbent at a flow rate of 1.97 mL/min. Treated water was collected at 10 min intervals and analyzed for fluoride. The ratio Ct/C0 (effluent concentration per influent concentration) was plotted against time and against throughput volume separately to obtain the breakthrough curves.
Batch defluoridation was carried out using initial fluoride concentrations of 3, 5 and 7 mg/L and adsorbent doses of 1 g/100 mL. The mixtures in corked 250 mL plastic bottles were agitated at 25 0C in a reciprocating thermostatic water bath (Daihan LabTech Model LSB-015S) at a speed of 200 rpm for 50 min. The purpose of experiment was to compare the adsorption capacities at throughput volumes of 100 mL at those initial fluoride concentrations in fixed-bed continuous flow method with those obtained for 100 mL solutions under batch method.
2.7. Defluoridation of Groundwater by Fixed-Bed Column
The effectiveness of the fixed-bed column in the removing groundwater was tested with the groundwater obtained from the Siloam Village in Vhembe District, Limpopo Province, South Africa. The water which contained 5.52 mg/L fluoride was run through 1 g of adsorbent-packed column at a flow rate of 1.97 mL/min. The effluent collected at intervals of 10 min was then analyzed for residual fluoride as done in the previous determinations.
2.8. Anions in Groundwater
Anions in groundwater were analyzed using Ion Chromatography on a Waters 432 Conductivity detector, coupled to a Waters 717plus Auto sampler and an Agilent 1100 series binary pump. Anions evaluated included Cl-, Br-, SO42-, PO43-, and NO3-.
3. Results and Discussion
3.1. Physicochemical Characterisation of Adsorbent
The SEM pictures in Figure 2 show the surface structures of the natural and the modified DE. Picture (a) of natural DE reveals clear hollows and distinct pores with thin outer boundaries. Picture (b) shows that some parts of the modified DE contained partly and completely sealed up pores with the adsorbent appearing thicker than the natural DE from which it was prepared. The surface appearance of the modified adsorbent is evidence of the deposit of Al-Fe oxide on the pores of the natural DE during modification process.
In Figure 3, the TEM picture (a) shows the appearance of Al-Fe oxide – the modification agent. This then helps to identify its location in the modified material. Pictures 3 (b) to 3 (d) show the variation in the extent of deposit of Al-Fe oxide at the surface and pores of DE during modification. From the pictures, while the deposit was sparse at some locations, it was intense at some others, even with pores no longer observable at some portions.
The FTIR spectra in Figure 4 show absorption around 3400 cm-1 in the region 3400 – 3700 cm-1. This is an indication of the stretching vibration of hydroxyl, O – H functional group present in the samples (Coates, 2000; Kumar, et al., 2018). That Al-Fe oxide sample also recorded a transmittance band for O – H stretching vibration shows that OH bonds were contained in Al-Fe oxide sample, the origin of which should be Al(OH)3 and Fe(OH)3 present along with the oxides of the metals to an extent. The sample’s O – H group transmittance band was more pronounced than those of the other two DE samples as the former possessed the highest concentration of OH bonds leading to the lowest value of transmission of infrared radiation recorded for O – H stretching vibration. The increase in transmittance of infrared radiation by F- - loaded Al-Fe oxide-infused DE over the non-fluoride containing modified species should be as a result of the decrease in the concentration of the surface O – H bonds with the exchange of some of the hydroxyl ions with fluoride ions during contact of adsorbent with fluoride solution. The transmittance band observed around 1096 cm-1 indicated the Si – O – Si structure of silica bonds in DE. Hence, the modified DE and the F- - loaded modified DE contained Si – O – Si bonds with stretching vibration at the listed wavenumber (Kumar, et al., 2018).
The increase in BET surface area of Al-Fe oxide-infused DE over the natural DE by more than two-fold is an indication of deposit of Al-Fe oxide on the natural DE during modification. With increase adsorbent’s surface area, there should be more active sites for ion exchange or adsorption leading to fluoride removal from water (Khraisheh et al., 2004).
Figure 5 shows the XRD pattern of the natural DE. The amorphous silica component is identifiable as a band at 2θ range of 22 – 330. Since the diffractogram shows no peaks. Therefore, the natural material lacked minerals and so completely amorphous unlike a DE sample reported to contain minerals like muscovite, kaolinite and even quartz (Reka et al., 2021), depending on where the DE is deposited.
3.2. Evaluation of Adsorption Parameters
3.2.1. Effect of Flow Rate
The plots of ratio Ct/C0 against the throughput volume at various flow rates are as shown in Figure 6. The ratio Ct/C0 corresponding to 1.5 mg/L fluoride concentration (the breakthrough concentration) from calculation was 0.30. The breakthrough volumes at flow rates of 2.26, 1.97, 1.40 and 1.48 mL/min were 44.6, 117.9, 110.7 and 39.3 mL respectively. The highest breakthrough volume was at the flow rate of 1.97 mL/min.
3.2.2. Effect of Adsorbent Dose/Bed Height
Bed height or depth was found to be directly related to the mass of adsorbent in the column. The bed heights at 0.5, 0.8 and 1 g doses were 3.3, 6.8 and 7.5 cm respectively. As shown in Figure 7, the smaller the bed height, the steeper the breakthrough curve. This observation agrees with the findings by Chen, et al. (2011a). The breakthrough volumes at adsorbent doses of 0.8 and 1 g were 66.7 and 118.2 mL respectively. From the result, the optimum adsorbent dose for the highest breakthrough volume was 1 g as the highest volume of treated water was obtained at an adsorbent dose of 1 g. The higher the bed height, the greater is the number of active sites for exchange of fluoride ions with hydroxyl ions on the surface of adsorbent. Consequently, the volume of water treated at breakthrough was greater for the adsorbent dose of 1 g than for 0.8 g, as Figure 7 reveals.
There was no breakthrough volume with the use of adsorbent dose of 0.5 g as the bed height was too small to allow a sufficient residence time that permits appreciable fluoride removal.
3.2.3. Effect of Influent Fluoride Concentration
The breakthrough points at the initial fluoride concentrations of 3, 5 and 7 mg/L were 0.50, 0.30 and 0.21 respectively. The breakthrough curves for the plots of Ct/C0 against time and throughput volume for the evaluated influent concentrations are presented in Figure 8 and Figure 9 respectively. Figure 8 shows that the breakthrough was attained with influent fluoride concentration of 5 mg/L at a much longer time than at 3 and 7 mg/L fluoride concentrations. The breakthrough volumes at initial fluoride concentrations 3, 5 and 7 mg/L were 91.3, 94.3 and 72.5 mL respectively with the influent fluoride concentration of 5 mg/L being the optimum influent concentration (Figure 9).
3.3. Channeling Effect
Channeling was observed to be a factor with a negative effect on the breakthrough volume. It caused less contact of some fluoride ions with the adsorbent for removal from solution. In effect, the throughput volume was reduced on some occasions. A breakthrough volume of 118.2 mL for influent fluoride concentration of 5 mg/L and adsorbent dose of 1 g reported in one experiment reduced to 94.3 mL because of channeling in the column in another experiment. Channeling must have been possible because of the light and amorphous nature of the adsorbent.
3.4. Breakthrough Bed Capacity
The adsorption capacity of a fixed-bed at breakthrough point is determined from the expression:
where (mg/g) is the bed capacity at breakthrough point, m (g) is the bed mass (mass of adsorbent) (g), C0 (mg/L) is the initial concentration of fluoride, Ct (mg/L) is the effluent concentration while VB (L) is the volume of solution processed at breakthrough point.
In practice, is evaluated by summing up the various adsorption capacities calculated from each volume of effluent collected from the column before the breakthrough point and the balance of the effluent volume (estimated from the curve) necessary to attain the breakthrough point as reported in Table 3. The data in Table 2 are based on the breakthrough column experiment at optimum fluoride solution concentration of 5 mg/L, 1 g of adsorbent-packed column and influent flow rate of 1.97 mL/min. The bed capacity at the breakthrough point was computed to be 0.5150 mg/g.
3.5. Evaluation of Adsorption Capacity by Batch Method
Table 3 presents the concentrations of fluoride in portions of 100 mL of treated water and their corresponding adsorption capacities for the two defluoridation methods, which were the fixed-bed column continuous mode and the batch method, at the initial fluoride concentrations of 3, 5 and 7 mg/L. Comparing the values, it could be observed that more fluoride was removed with the batch method than the fixed-bed continuous mode. For example, considering the solution with initial fluoride concentration of 5 mg/L, the adsorption capacity for the batch defluoridation was about 4.62% higher than that obtained for the fixed-bed continuous flow method. Hence, more fluoride was adsorbed per gram in batch method than in the fixed-bed column continuous flow method. The increase in adsorption capacity might be due to the agitation which brought more biding sites of the adsorbent into contact with the fluoride in solution.
3.6. Kinetic Modelling of Breakthrough Curves
A less complicated theoretical model was proposed by Yoon and Nelson (1984) to report the adsorption and breakthrough of gases with respect to solid adsorbents. The linear form of Yoon-Nelson model is represented by eqn. 3:
where k (min-1) is the rate constant and is determined from the slope of breakthrough curves. The parameter, τ (min), represents the time at which the exit concentration equals 50% of the initial concentration of feed solution. A plot of versus t gives a straight line with a slope of k.
For the plot of versus t using the data obtained for the fixed-bed continuous flow experiment at the conditions of concentration of feed solution: 5 mg/L, adsorbent dose: 1 g and flow rate: 1.97 mL/min, there were two portions of the plot that gave straight lines with positive slopes as shown in Figure 10. The two portions included defluoridation from 30 min to 70 min and from 70 min to 110 min. Thus, the breakthrough curve obeyed the Yoon-Nelson model as from 30 min contact time.
3.7. Mechanism of Fluoride Adsorption
The pH at point-of-zero charge, pHpzc of Al-Fe oxide-infused DE was already reported to be 6.0 0.2 (Izuagie, et al., 2016b). The pH of treated water was higher than the pHpzc. Therefore, fluoride removal at this pH > pHpzc would be by exchange of hydroxyl ions on the adsorbent surface with the fluoride ions in solution. Hence, the applicable ion – exchange reaction equation would be
(Adsorbent)
where M is Al3+ or Fe3+.
3.8. Fixed-Bed Column Defluoridation of Groundwater
The breakthrough curve for the fixed-bed column defluoridation of groundwater is presented in Figure 11. The concentration of fluoride in the 24.8 mL effluent collected at 10 minutes sampling time was 1.58 mg/L. With the breakthrough concentration of 1.5 mg/L fluoride, it follows that the expected volume of processed water would be a little less than 24.8 mL.
The fluoride concentration in treated water had fast exceeded the breakthrough concentration before 20 minutes defluoridation time as seen in Figure 12. The difference in the trend of the breakthrough curve of the fixed-bed defluoridation of groundwater water compared to that of the artificial water establishes the effect of competing anions on fluoride removal as reported in literature (Mandal & Mayadevi, 2009; Chen, et al., 2011b). In this case, PO43- being a trivalent negative ion would be a highly competing ion as its concentration in the groundwater was fairly high as reported in Table 5.
3.9. Groundwater Anion Analysis
Table 4 presents the concentrations of the anions in the groundwater obtained from Siloam Village analyzed by Ion Chromatography. Apart from PO43-, the concentrations of other evaluated ions could not be detected because they were below the detection limit of 1 mg/L of the analytical instrument.
4. Conclusion
In the appraisal of the performance of Al-Fe bimetal oxide-infused DE in fixed-bed column continuous flow mode, flow rate was observed to determine the breakthrough volume of the treated water. The flow rate of 1.97 mL/min yielded the highest throughput volume of 118.2 mL at influent fluoride concentration of 5 mg/L and 1 g of adsorbent or column bed height of 7.5 cm. The calculated column bed adsorption capacities at throughput volume of 100 mL were found to be a little less than those calculated for the same volume of treated water, adsorbent dose of 1 g and corresponding initial fluoride concentrations in batch method. Channeling was observed to cause a little variation in the breakthrough volume. The presence of PO43- in groundwater was also observed to competitively affect fluoride removal and consequently reduce the breakthrough volume.
Supplementary Materials
The following supporting information can be downloaded at the website of this paper posted on Preprints.org.
Acknowledgements
The authors acknowledge the financial assistance received to make this research through the funds from WRC Project No. K5/2363/3, NRF Project No. CSUR13092849176, Grant No. 90288 and THRIP Project No. TP12082610644, the Directorate of Research & Innovation, University of Venda and TETFund, Nigeria.
Conflicts of Interest
There are no conflicts of interests between the authors and the funders of the research.
References
- Battaleb-Looie, S. Battaleb-Looie, S. & Moore, F., 2010. A study of fluoride occurrence in Posht-e-Kooh-e-Dashtestan, South of Iran. World Applied Sciences Journal, 8(11), 1317–1321. [Google Scholar]
- Bhatnagar, A.; umar; Sillanpää, M. 2011. Fluoride removal from water by adsorption—a review. Chemical Engineering Journal, 171, 811–840.
- Chen, N. Chen, N., Zhang, Z., Feng, C., Li, M., Chen, R. & Sugiura, N., 2011a. Investigations on the batch and fixed-bed column performance of fluoride adsorption by Kanuma mud. Desalination, 268.
- Chen, N. Chen, N., Zhang, Z., Feng, C., Zhu, D., Yang, Y. & Sugiura, N., 2011b. Preparation and characterization of porous granular ceramic containing dispersed aluminium and iron oxides as adsorbents for fluoride removal from aqueous solution. Journal of Hazardous. Materials, 186, 863 – 868.
- Coates, J., 2000. Coates, J., 2000. Interpretation of infrared spectra, a practical approach. Encyclopedia of analytical chemistry, , 12, 10815 – 10837. [Google Scholar]
- Davita-Rodriguenz, J.L. Davita-Rodriguenz, J.L., Escobar-Barrios, V.A. & Rangel-Mendez, J.R., 2012. Removal of fluoride from drinking water by a chitin-based biocomposite in fixed-bed columns. Journal of Fluorine Chemistry, 140, 99 – 103.
- Ergun, E; Effects of process parameters and accompanying anions: , Tor, A., Cengeloglu, Y. & Kocak, I., 2008. Electrodialytic removal of fluoride from water: Effects of process parameters and accompanying anions, Separation and Purification Technology, 64, 147–153.
- Getachew, T. Getachew, T., Hussen, A. & Rao, V. M., 2015. Defluoridation of water by activated carbon prepared from banana (Musa paradisiaca) peel and coffee (Coffea arabica) husk. International Journal of Environmental Science and Technology, 12, 1857–1866. [CrossRef]
- Ghorai, S. Ghorai, S. & Pant, K.K., 2004. Investigations on the column performance of fluoride adsorption by activated alumina in a fixed-bed. Chemical Engineering Journal, 98, 165 – 173.
- Ghosh, A. Ghosh, A., Chakrabarti, S., Biswas, K. & Ghosh, U.C., 2015. Column performances on fluoride removal by agglomerated Ce(IV)–Zr(IV) mixed oxide nanoparticles packed fixed-beds. Journal of Environmental Chemical Engineering, 3, 653 – 661.
- Hammer, M. J., 1986. Hammer, M. J., 1986. Need for fluoridation of desalinated water supplies. Aqua, 4, 179–182.
- Izuagie, A; optimization of adsorption conditions: A., Gitari, W.M. & Gumbo J.R., 2016a. Defluoridation of groundwater using diatomaceous earth: optimization of adsorption conditions, kinetics and leached metals risk assessment. Desalination and Water Treatment, 1 – 13. [CrossRef]
- Izuagie, A; towards fluorosis mitigation: A., Gitari, W.M. & Gumbo, J.R., 2016b. Synthesis and performance evaluation of Al/Fe oxide coated diatomaceous earth in groundwater defluoridation: towards fluorosis mitigation. Journal of Environmental Sciences and Health, Part A, 51 (10), 810 – 824.
- Jagtap, S. Jagtap, S., Yenkie, M.K.N., Labhsetwar, N. & Rayalu, S., 2011. Defluoridation of drinking water using chitosan based mesoporous alumina. Microporous and Mesoporous Materials, 142, 454 – 463.
- Karthikeyan, G. Karthikeyan, G., Pius, A. & Alagumuthu, G., 2005. Fluoride adsorption studies of montmorillonite clay. Indian Journal of Chemical Technology, 12, 263 – 272.
- Kelly, T.W., 1992. Determination of adsorption capacities using packed-bed breakthrough tests. Unpublished. Master of Science Thesis, B. S. Illinois State University, Urbana-Champaign.
- Khraisheh, M.A.M., Al-Ghouti, M.A., Allen, S.J. & Ahmad, M.N.M., 2004. The effect of pH, temperature and molecular size on the removal of dyes from textile effluent using manganese oxides modified diatomite. Water Environmental Research, 76 (7), 2655–2663.
- Kumar, V. Kumar, V., Kashyap, M., Gautam, S., Shukla, P., Joshi, K.B. & Vinayak, V., 2018. Fast Fourier infrared spectroscopy to characterize the biochemical composition in diatoms. Bioscience, 43 (4), 717–729.
- Liu, R. Liu, R., Gong, W., Lan, H., Gao, Y., Liu, H. & Qu, J., 2011. Defluoridation by freshly prepared aluminum hydroxides. Chemical Engineering Journal, 175, 144 – 149.
- Ma, Y; batch and column studies: , Shi, F., Zheng, X., Ma, J. & Gao, C., 2011. Removal of fluoride from aqueous solution using granular acid-treated bentonite (GHB): batch and column studies. Journal of Hazardous Materials, 185, 1073 – 1080.
- Mandal, S; equilibrium and regeneration studies: & Mayadevi, S., 2009. Defluoridation of water using as-synthesized Zn/Al/Cl anionic clay adsorbent: equilibrium and regeneration studies. Journal of Hazardous Materials, 167, 873 – 878.
- Mwiathi, N.F., Gao, X., Li, C. & Rashid, A., 2022. The occurrence of geogenic fluoride in shallow aquifers of Kenya Rift Valley and its implications in groundwater management. Ecotoxicology and Environmental Safety, 229, 1 – 9.
- Nasr, A.B. Nasr, A.B., Walha, K., Charcosset, C. & Amar, R.B., 2011. Removal of fluoride ions using cuttlefish bones. Journal of Fluorine Chemistry, 132, 57–62.
- Nasr, A.B., Walha, K., Puel, F., Mangin, D., Amar, R.B. & Charcosset, C., 2014. Precipitation and adsorption during during fluoride removal from water by calcite in the presence of acetic acid. Desalination and Water Treatment, 52, 2231 – 2240.
- Ncube, E; A water quality and health problem: J. & Schutte, C.F., 2005. The occurrence of fluoride in South African groundwater: A water quality and health problem. Water SA, 31, 35–40.
- Pontie, M; the first world unit: , Dach, H., Lhassani, A. & Diawara, C.K., 2013. Water defluoridation using nanofiltration vs. reverse osmosis: the first world unit, Thiadiaye (Senegal). Desalination and Water Treatment, 51 (1-3), 164 – 168.
- Pavlovski, B., Fazlija, E., Berisha, A., Pacarizi, M., Daghmehchi, M., Sacalis, C., Jovanovski, G., Makreski, P. & Oral, A., 2021. Diatomaceous earth: characterization, thermal modification, and application. Open Chemistry, 19, 451 – 461.
- Ruiz, T., Persin, F., Hichour, M., & Sandeaux, J., 2003. Modelisation of fluoride removal in.
- Donnan dialysis. Journal of Membrane Science, 212, 113–121.
- Sadiju, S.M.I. Sadiju, S.M.I., Masamba, W.R.L., Thole, B. & Mwatseteza, J.F., 2008. Groundwater fluoride levels in villages of Southern Malawi and removal studies using bauxite. International Journal of Physical Sciences, 3(1), 1 – 11.
- Sakhare, N. Sakhare, N., Lunge, S., Rayalu, S., Bakardjiva, S., Subrt, J., Devotta, S. & Labhsetwar, N., 2012. Defluoridation of water using calcium aluminate material. Chemical Engineering Journal, 203, 406–414.
- T., Zarrabi, M., Sepehr, M.N., Ramhormozi, S.M., Azizianm S. & Amrane, A., 2014. Removal of fluoride ions by ion exchange resin: kinetic and equilibrium studies. Environmental Engineering and Management Journal, 13 (1), 205-214.
- & Zhang, G., 2016. Efficient removal of fluoride by hierarchical Ce-Fe bimetal oxides adsorbent: thermodynamics, kinetics and mechanism. Chemical Engineering Journal, 283, 721 – 729.
- Un, U.T., Koparal, A.S., & Ogutveren, U.B., 2003. Fluoride removal from water and wastewater with a bach cylindrical electrode using electrocoagulation. Chemical Engineering Journal 223, 110–115.
- Wambu, E.W., Onindo, C.O., Ambusso,W., & Muthakia, G.K., 2013. Removal of fluoride from aqueous solutions by adsorption using a siliceous mineral of a Kenyan origin. Clean Soil Air Water, 41, 340–348. [CrossRef]
- World Health Organization (WHO), 2017. Guidelines for Drinking-water Quality, 4th ed. Geneva, Switzerland.
- Yoon, Y.H. Yoon, Y.H. & Nelson, J.H., 1984. Application of gas adsorption kinetics I. A theoretical model for respirator cartridge service life. American Industrial Hygiene Association Journal, 45 (8), 509 – 516.
Figure 1.
Schematic diagram of a fixed-bed column continuous flow set up.
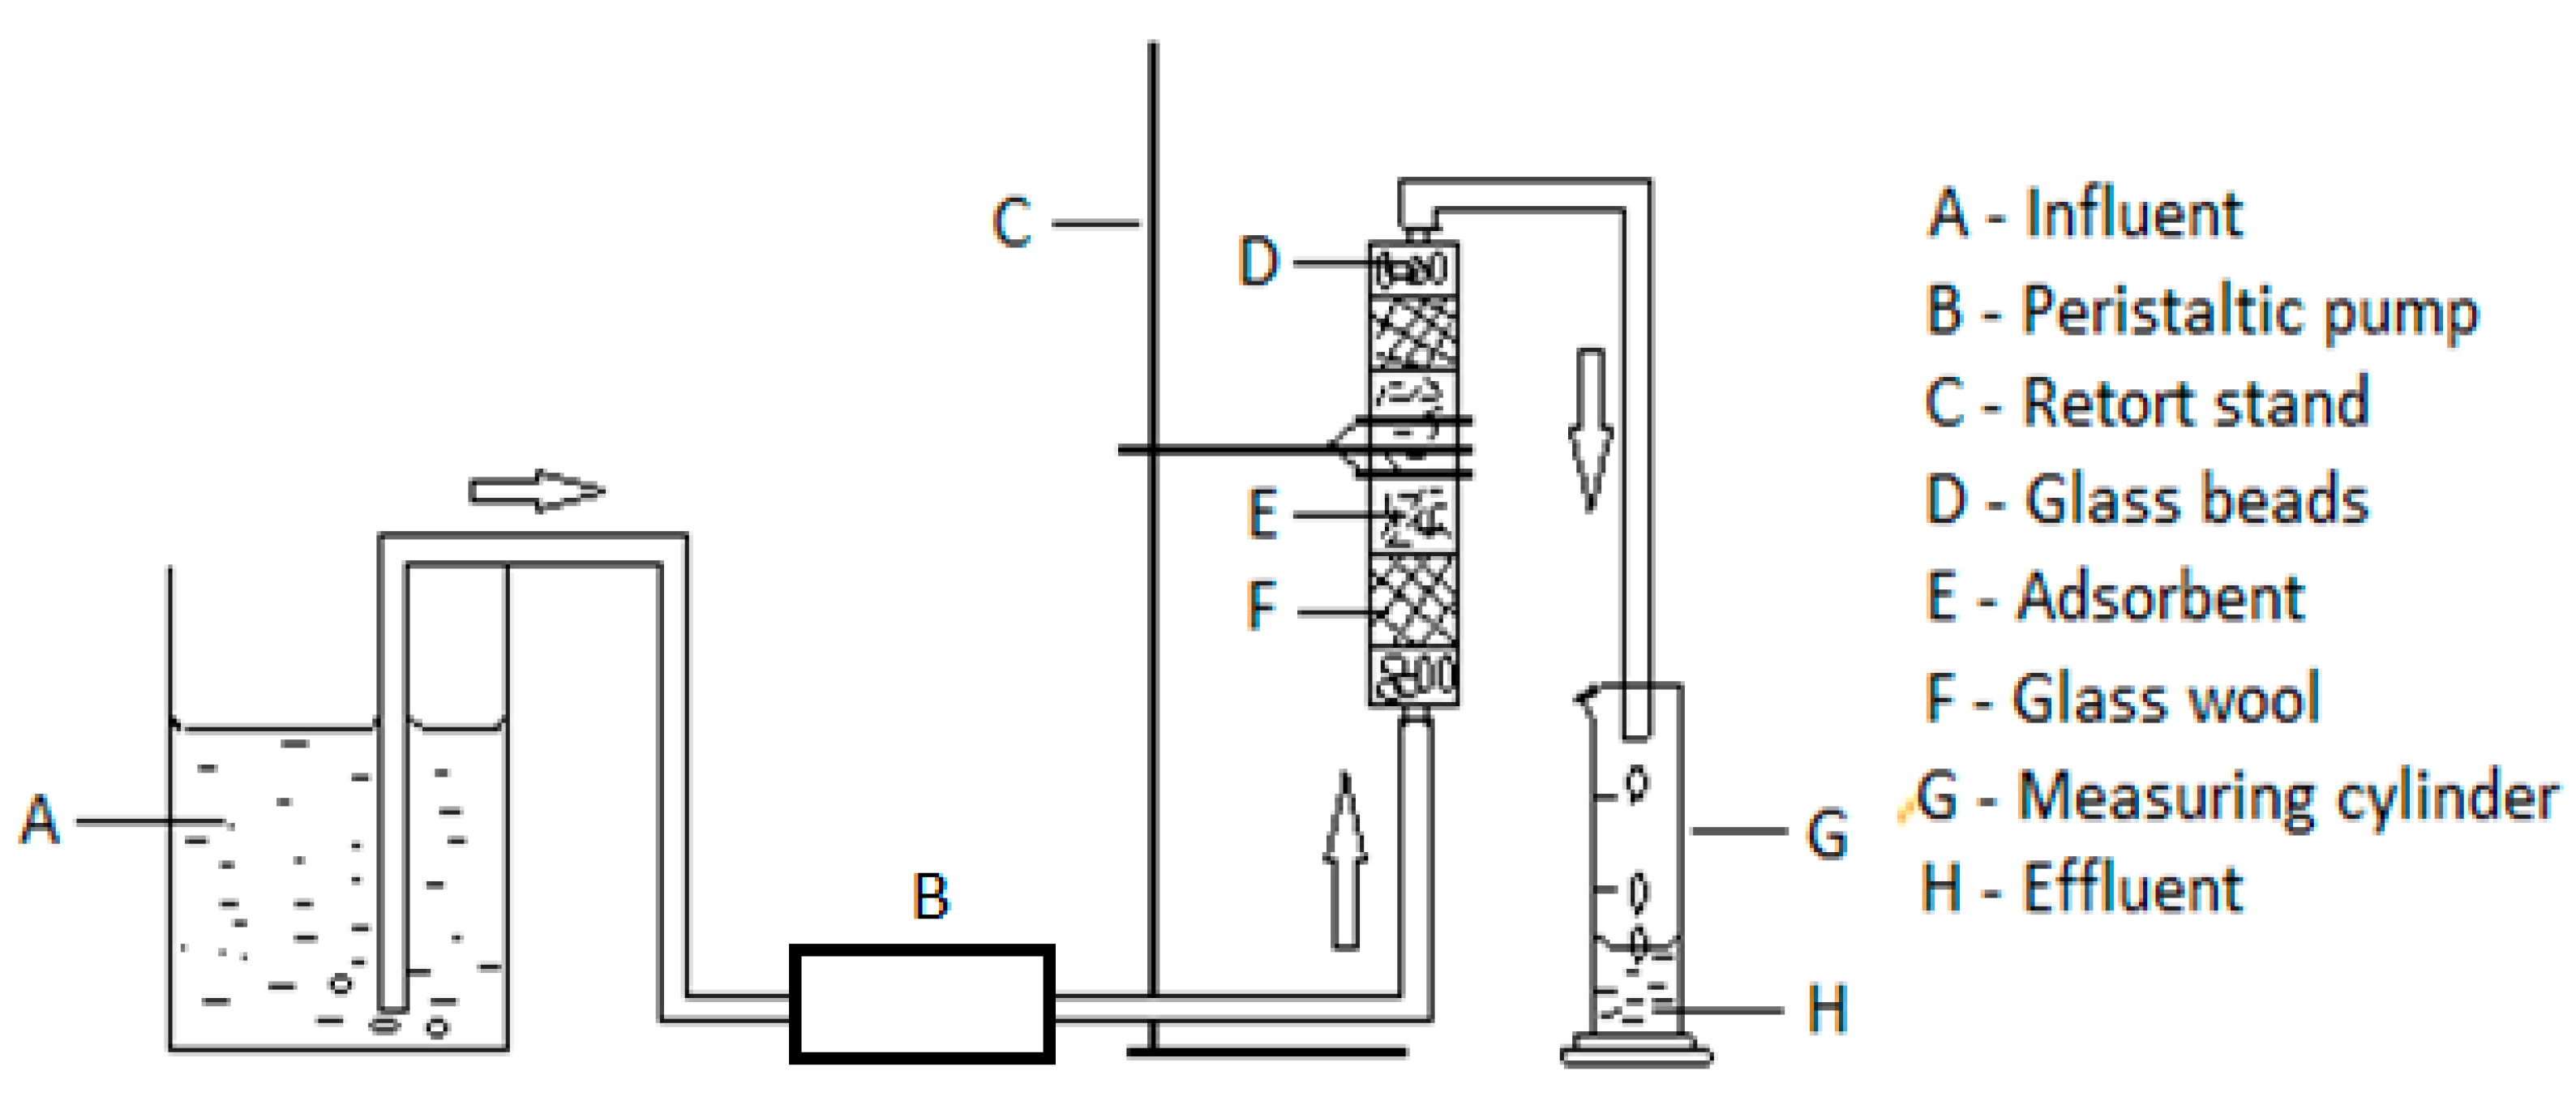
Figure 2.
SEM pictures of (a) natural DE and (b) Al-Fe oxide-infused DE.
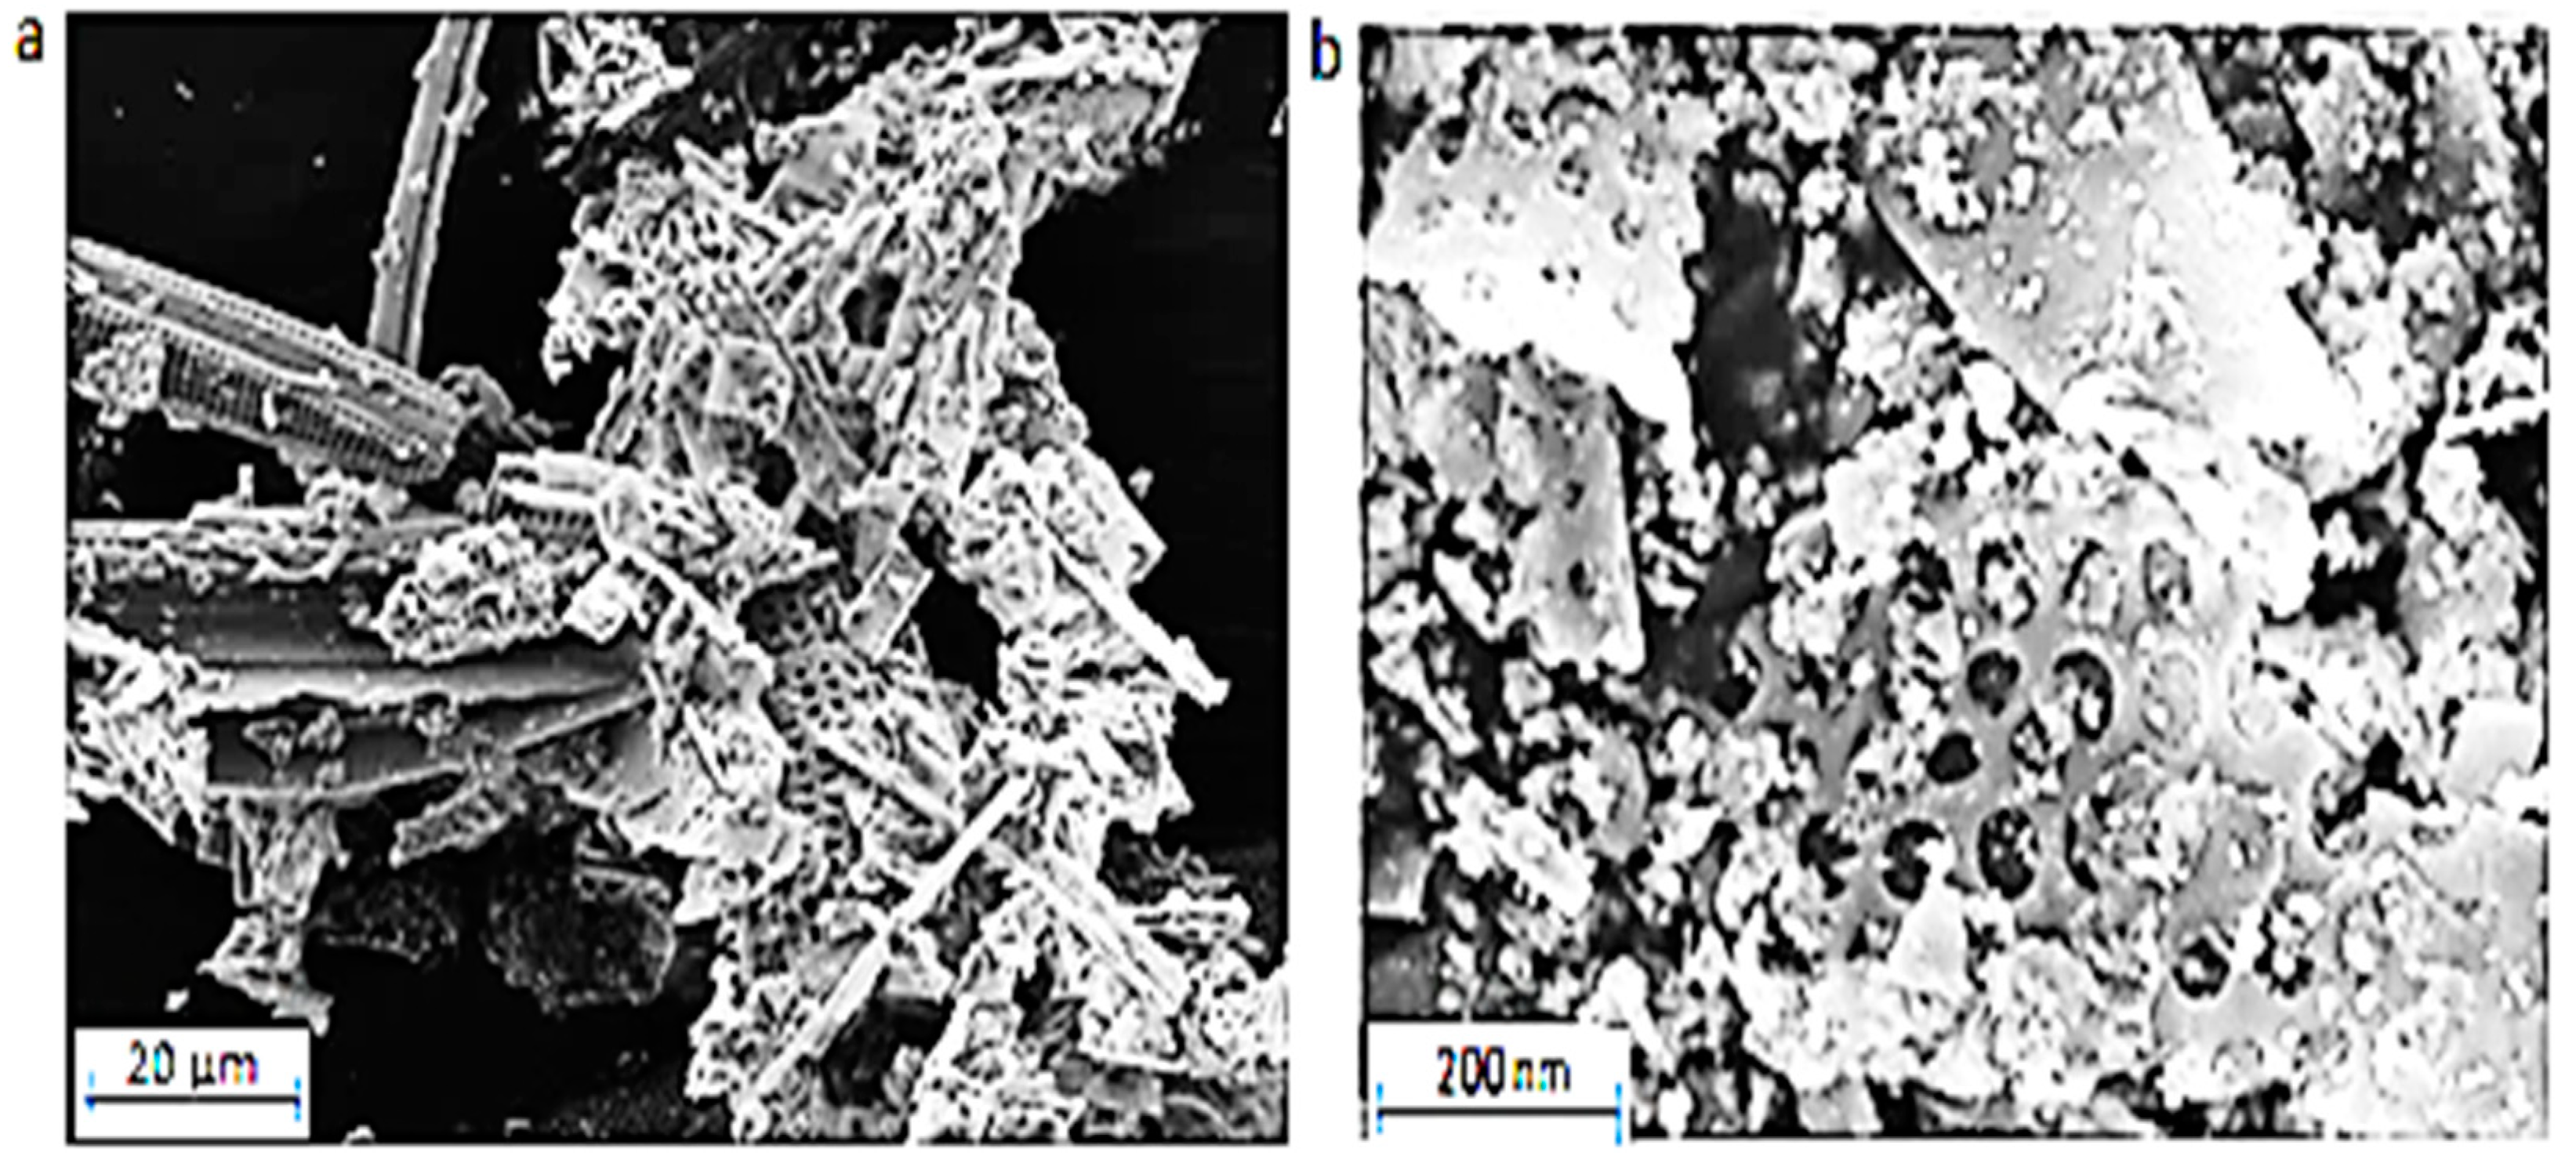
Figure 3.
TEM pictures of (a) Al-Fe oxide and (b) to (d) Al-Fe oxide-infused DE.
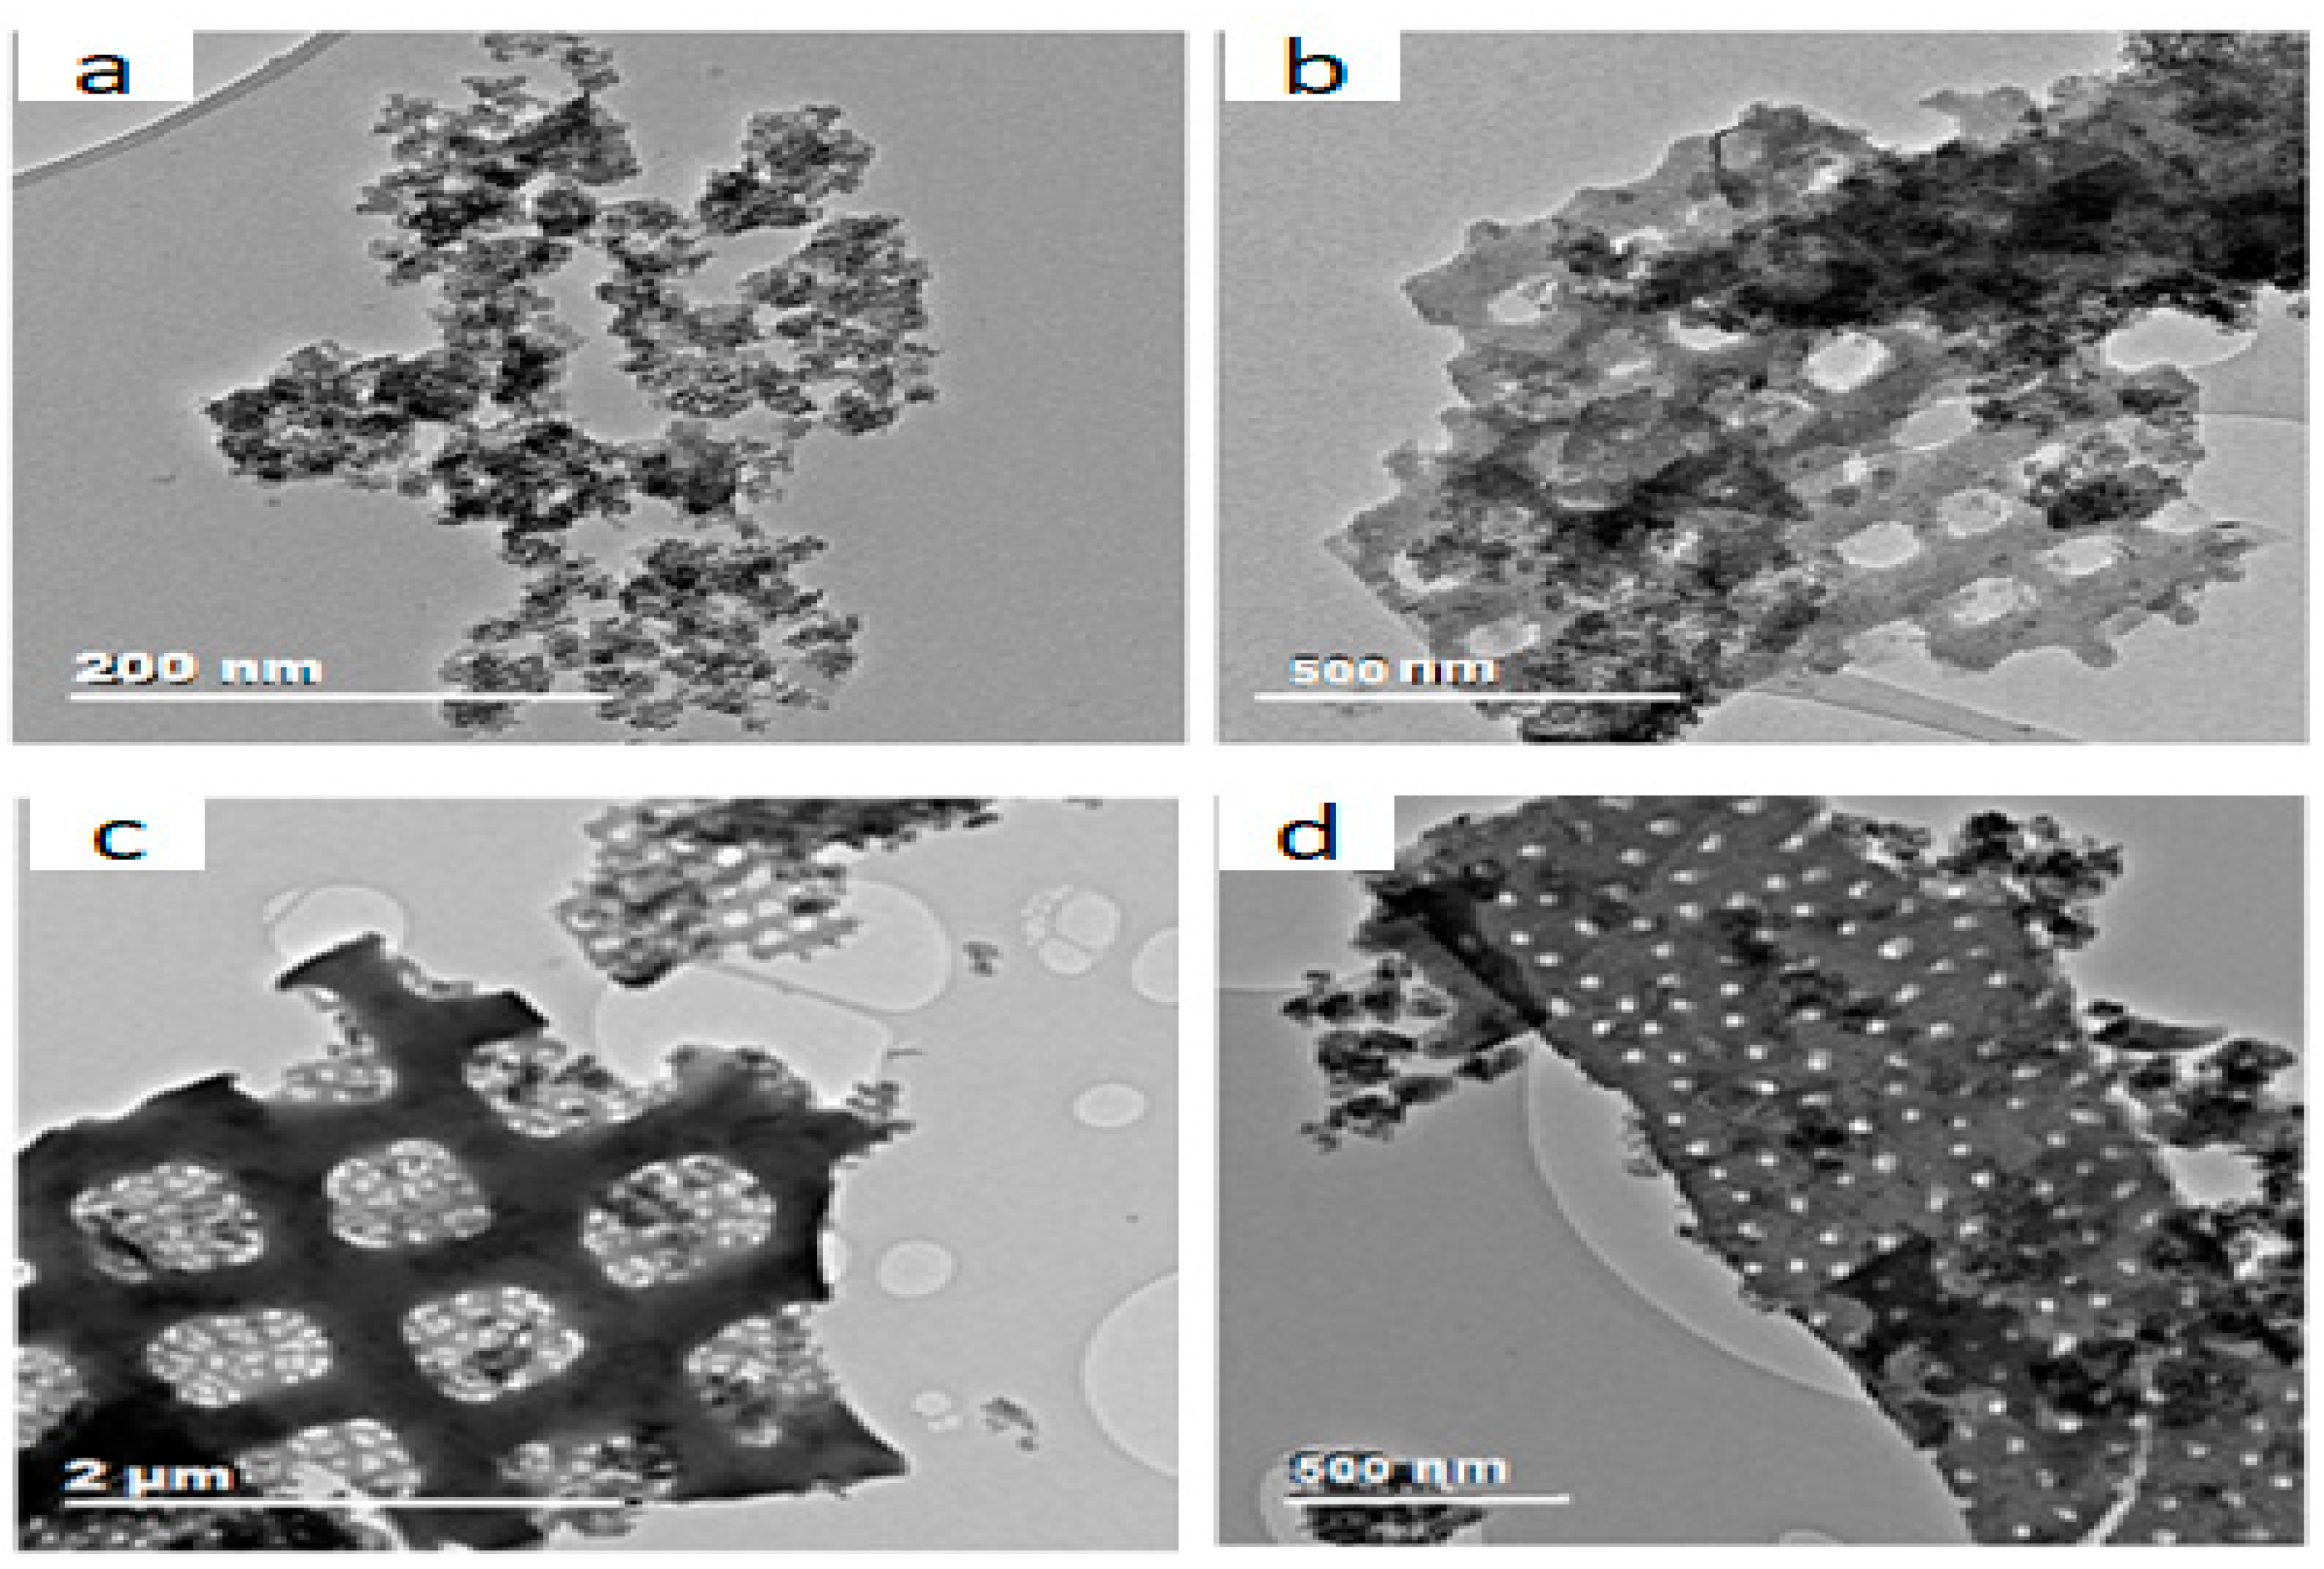
Figure 4.
FTIR spectra of Al-Fe oxide, Al-Fe oxide-infused DE, and F- - loaded Al-Fe oxide-infused DE.
Figure 4.
FTIR spectra of Al-Fe oxide, Al-Fe oxide-infused DE, and F- - loaded Al-Fe oxide-infused DE.
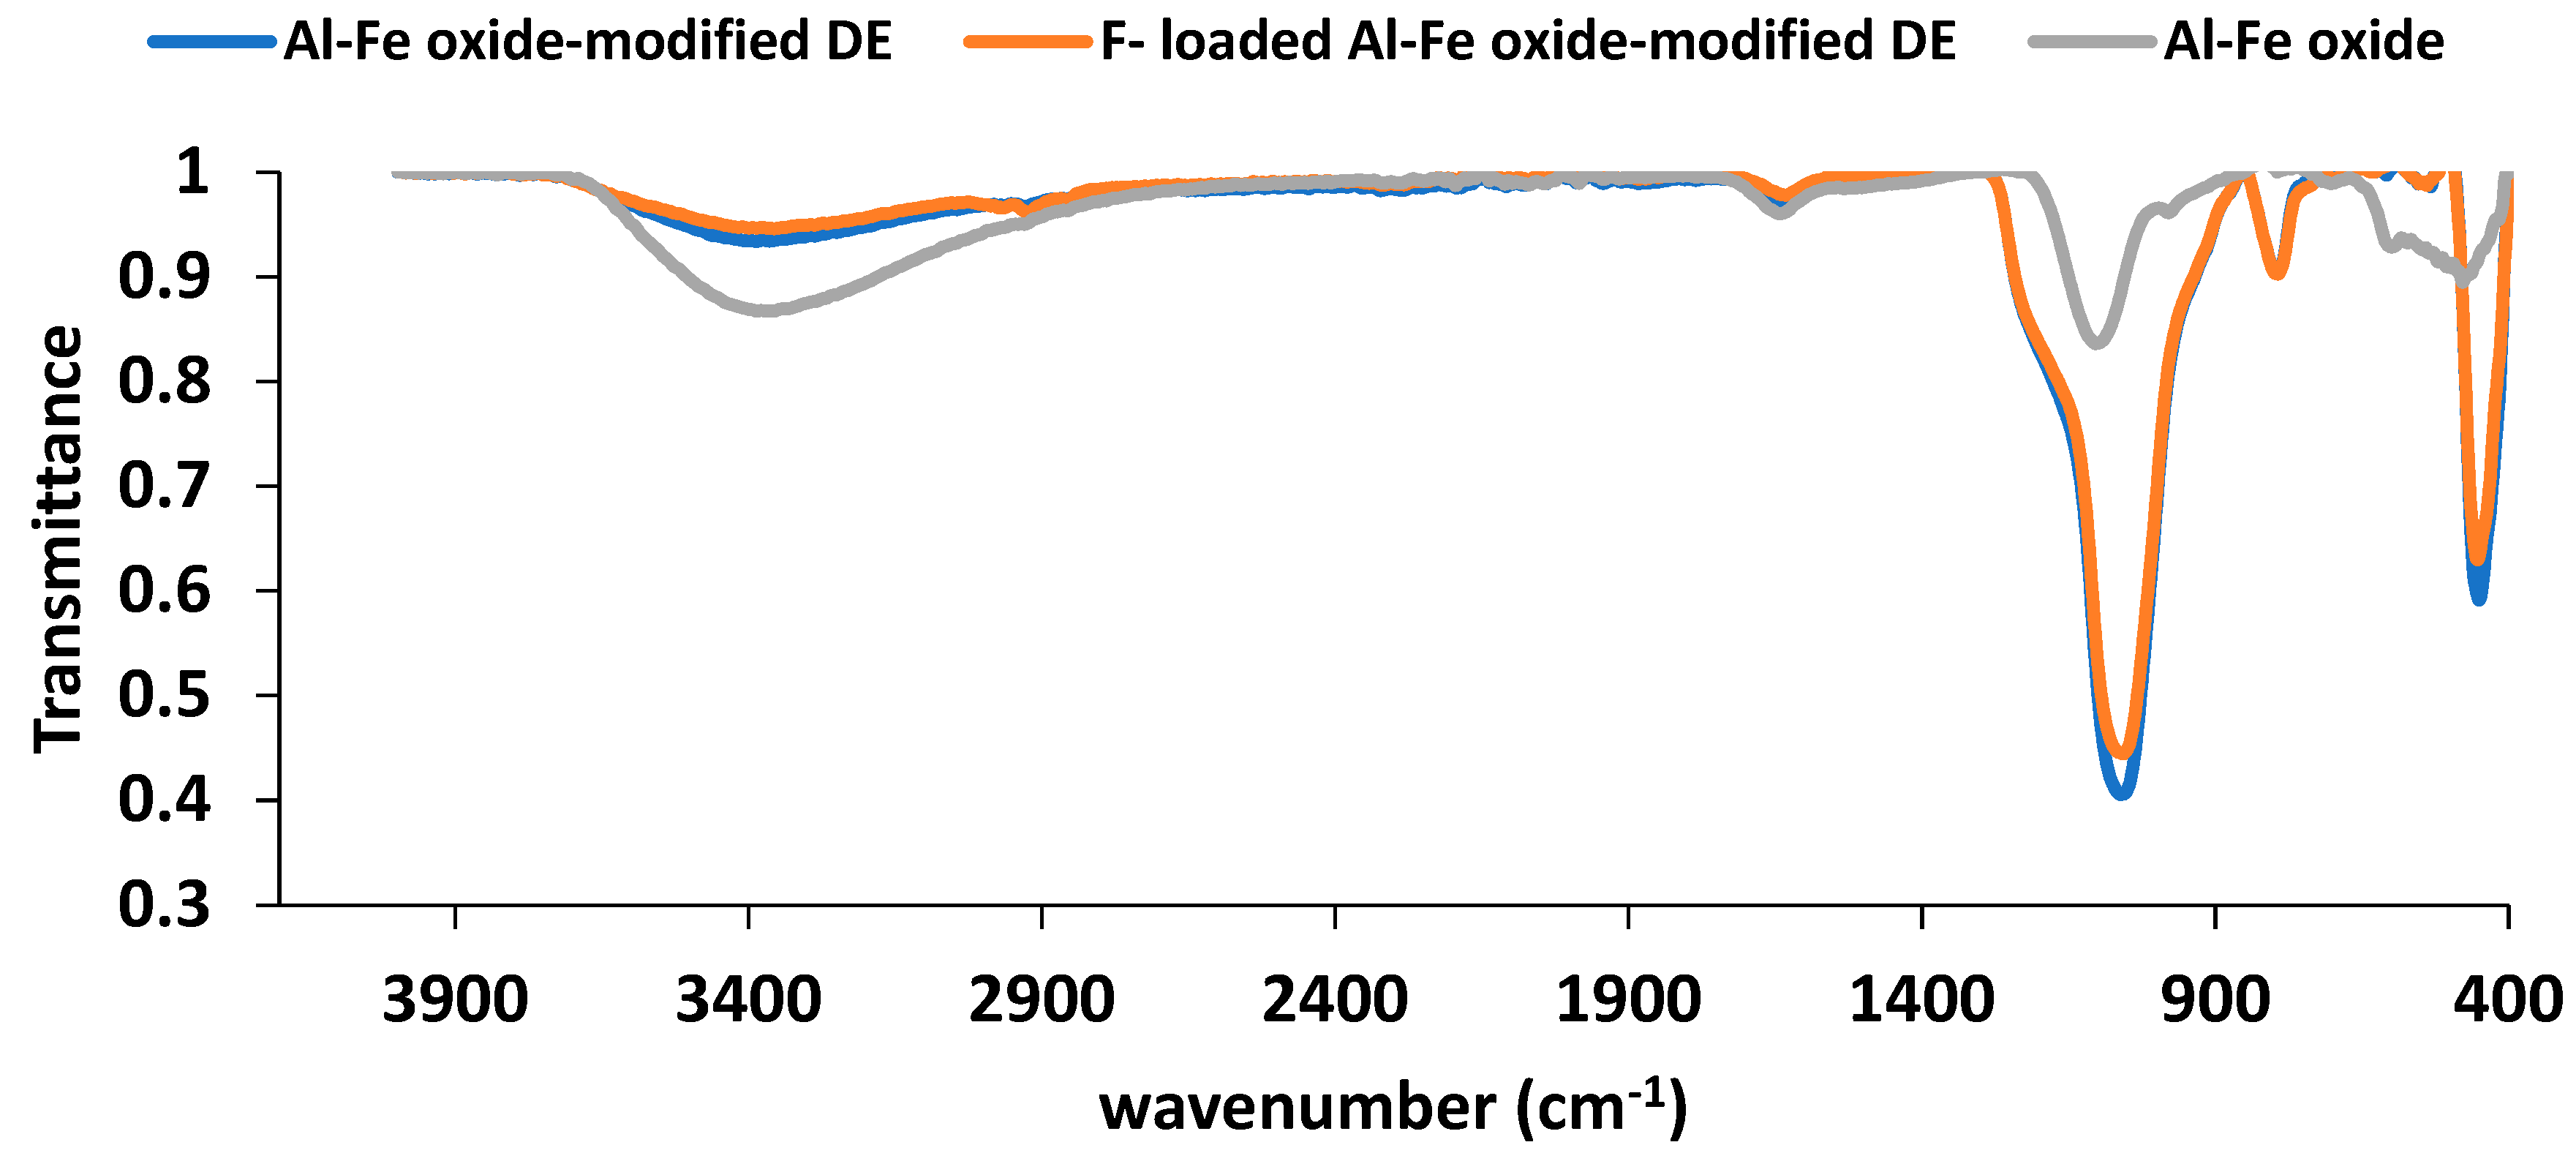
Figure 5.
XRD pattern of natural DE.
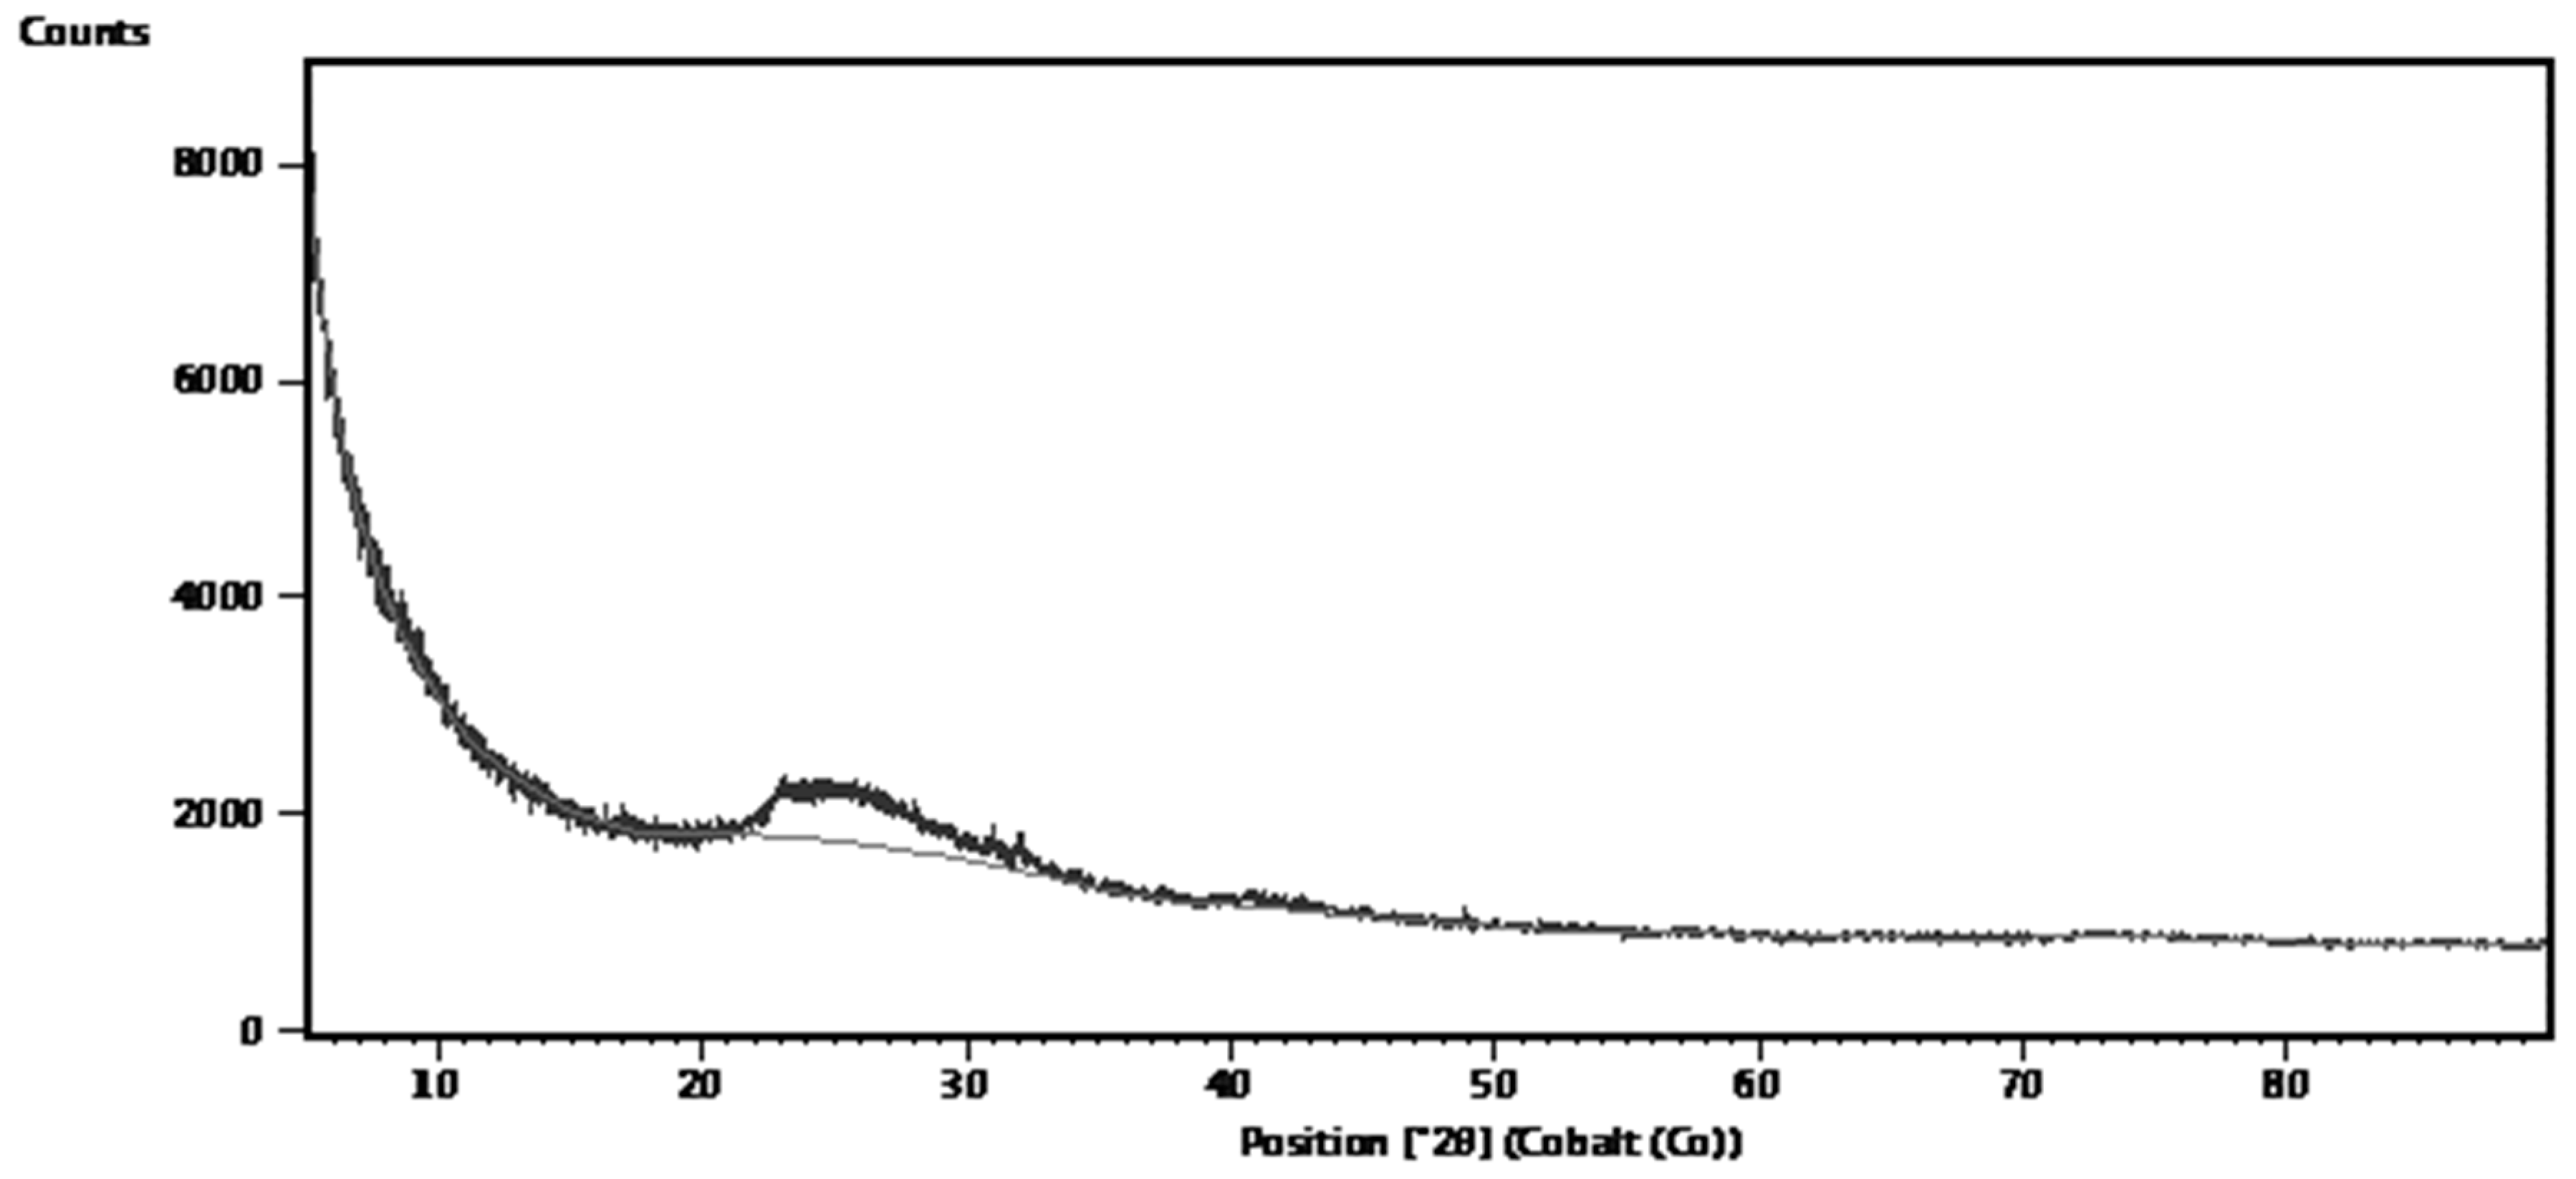
Figure 6.
Breakthrough curves at different influent flow rates (influent F- concentration: 5 mg/L, adsorbent dose: 1 g and breakthrough point: 0.30).
Figure 6.
Breakthrough curves at different influent flow rates (influent F- concentration: 5 mg/L, adsorbent dose: 1 g and breakthrough point: 0.30).
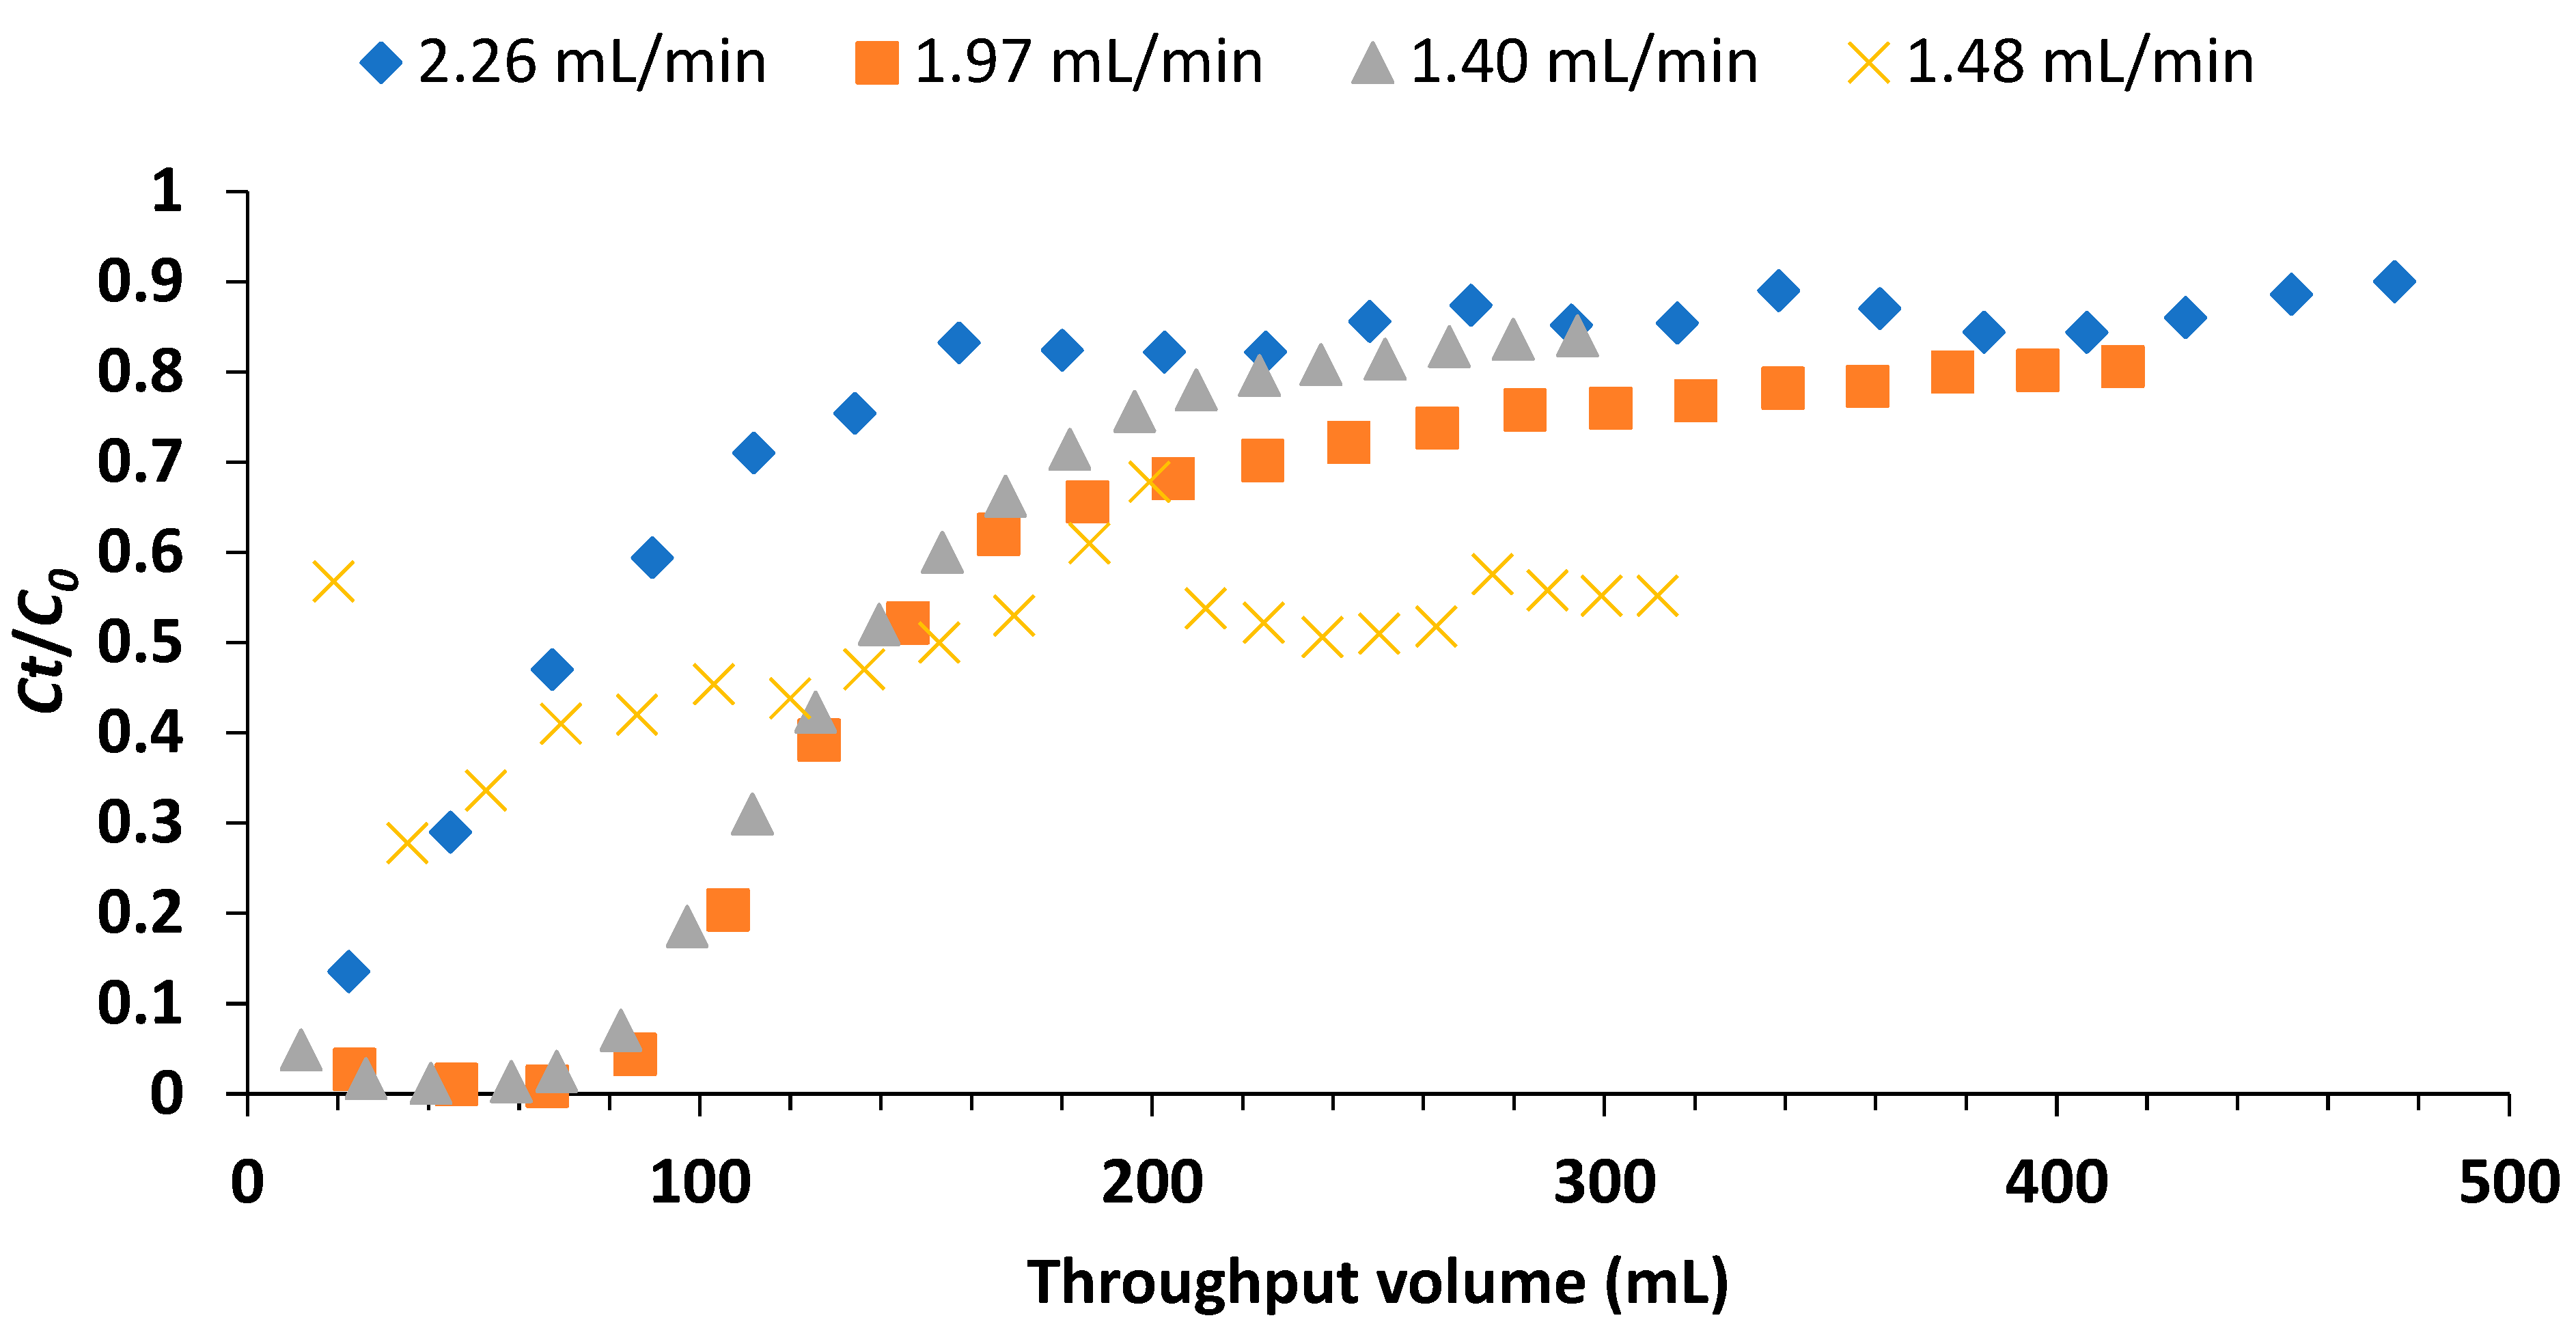
Figure 7.
Breakthrough curves at different adsorbent doses (influent F- concentration: 5 mg/L, flow rate: 1.97 ml/min and breakthrough point: 0.30).
Figure 7.
Breakthrough curves at different adsorbent doses (influent F- concentration: 5 mg/L, flow rate: 1.97 ml/min and breakthrough point: 0.30).
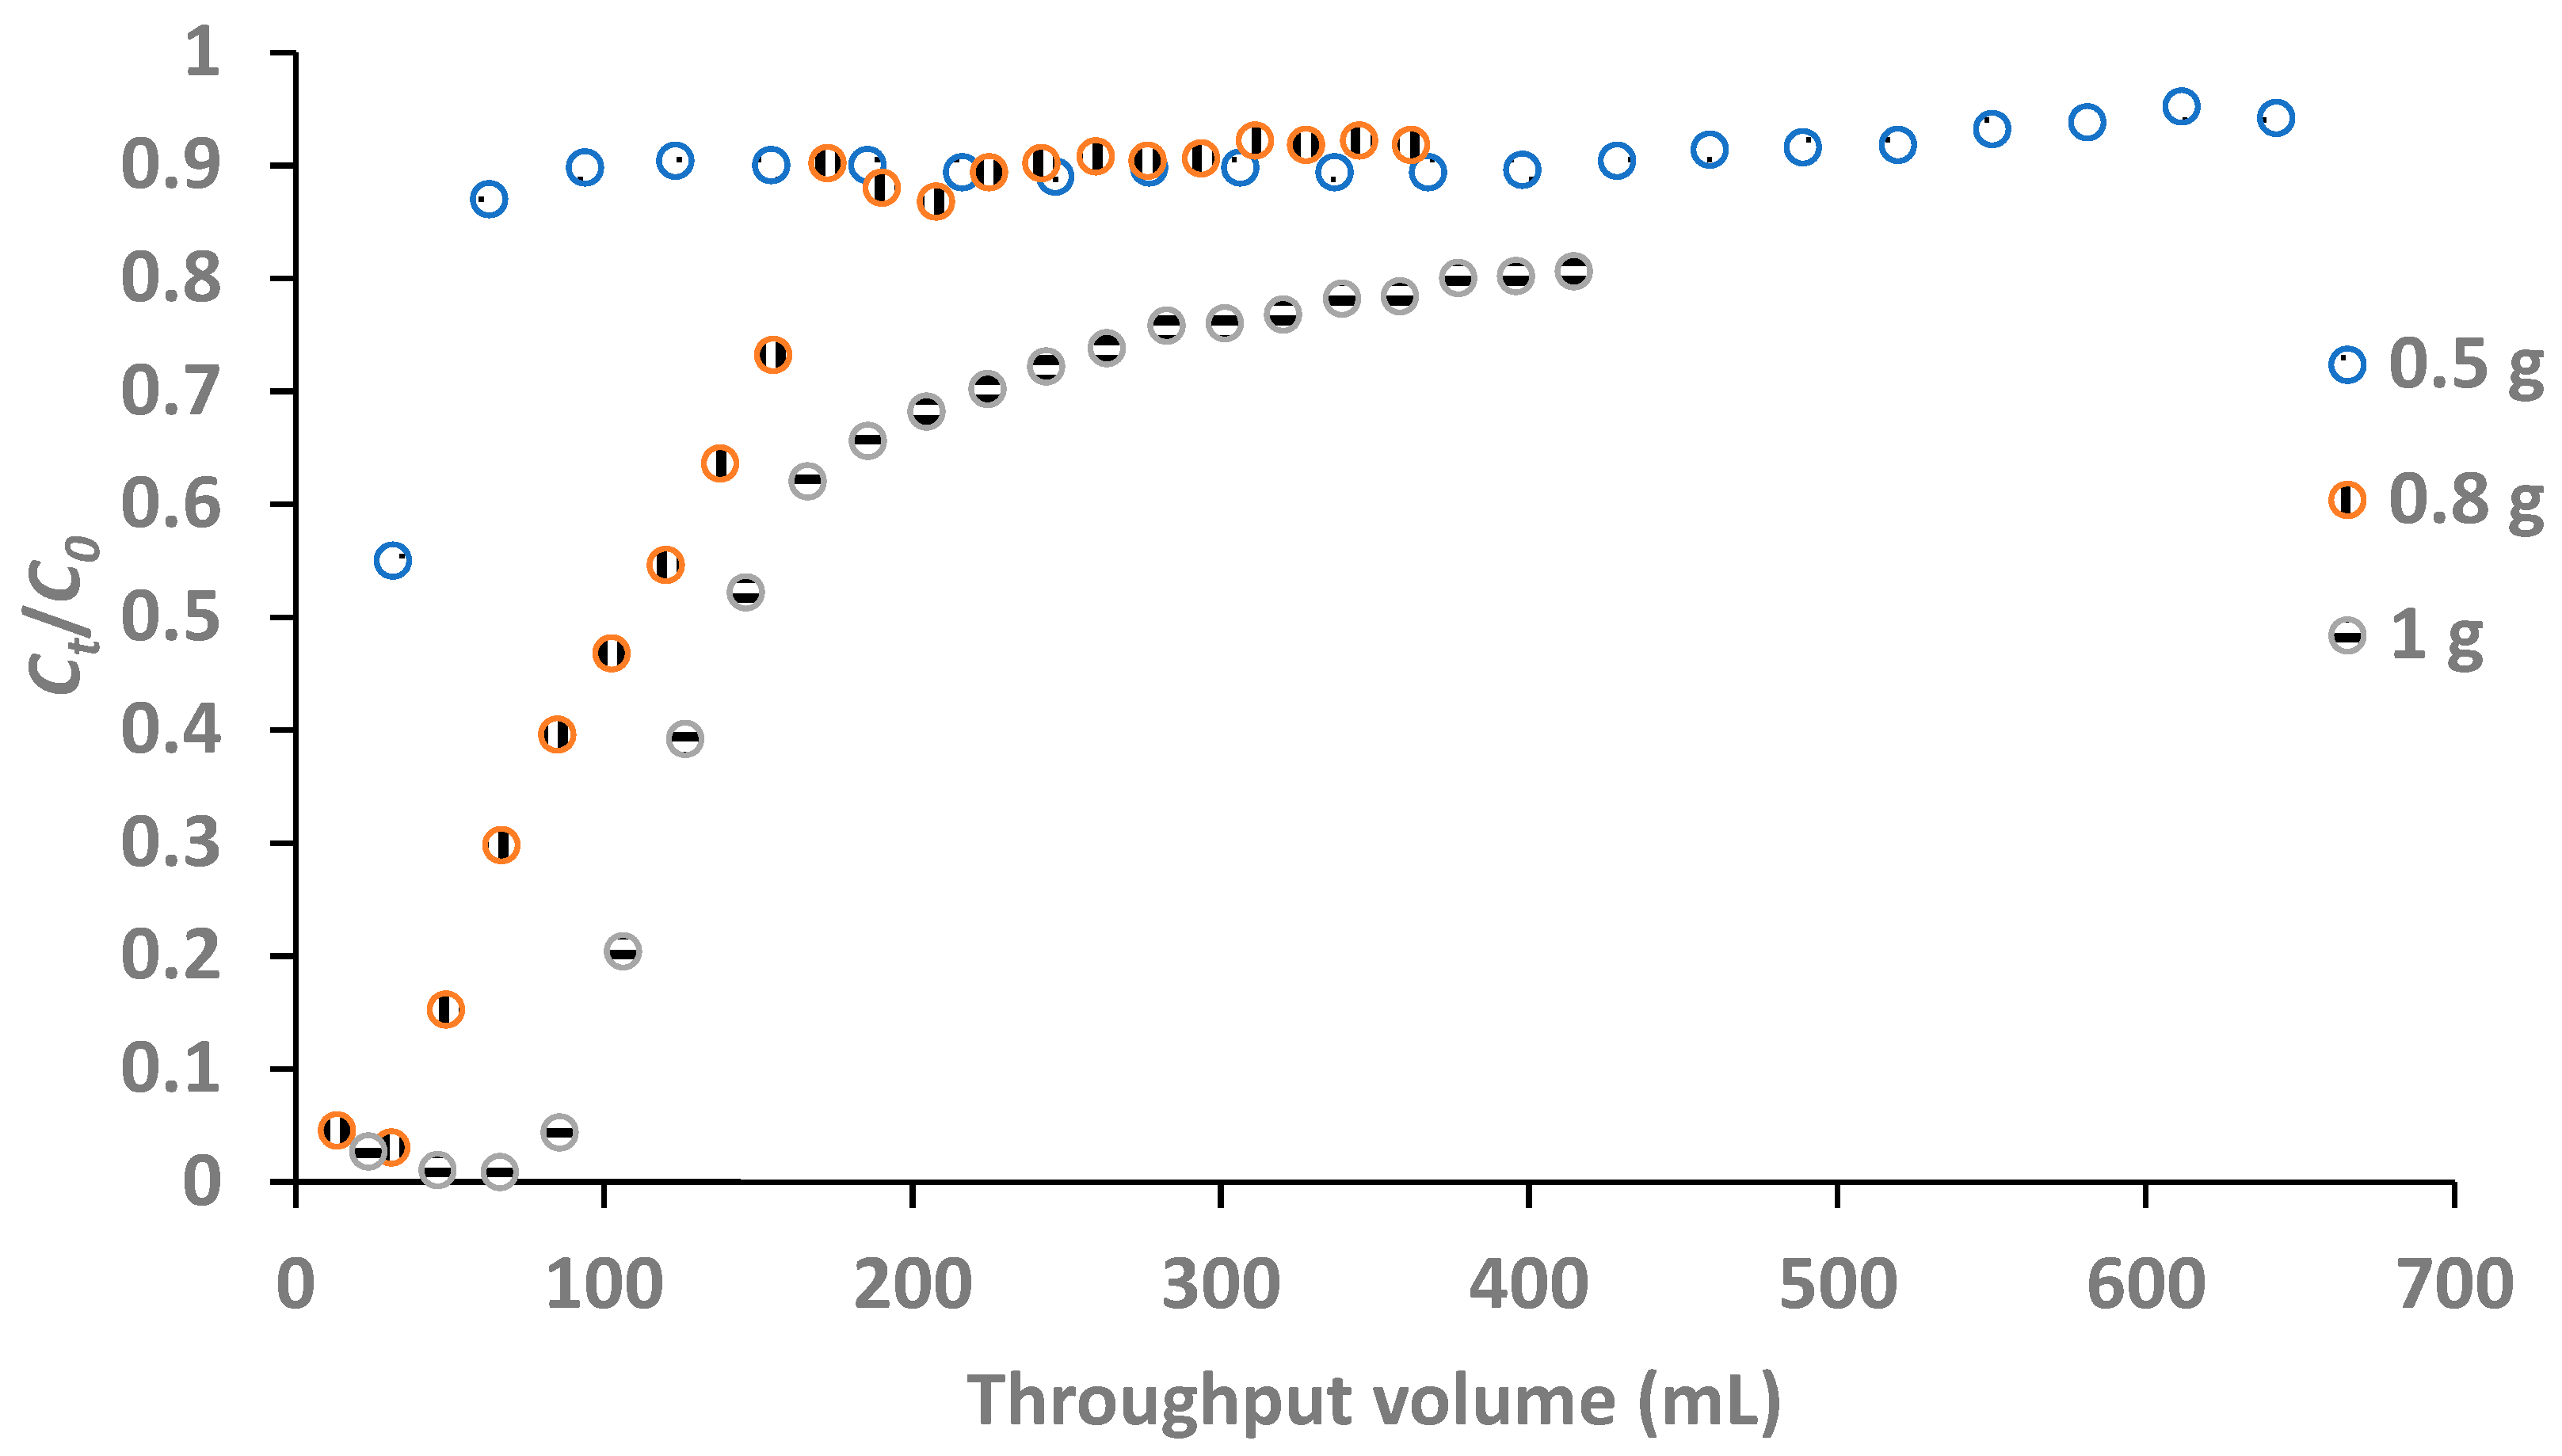
Figure 8.
Breakthrough curves at different influent fluoride concentrations as functions of time (adsorbent dose: 1 g and flow rate: 1.97 mL/min).
Figure 8.
Breakthrough curves at different influent fluoride concentrations as functions of time (adsorbent dose: 1 g and flow rate: 1.97 mL/min).
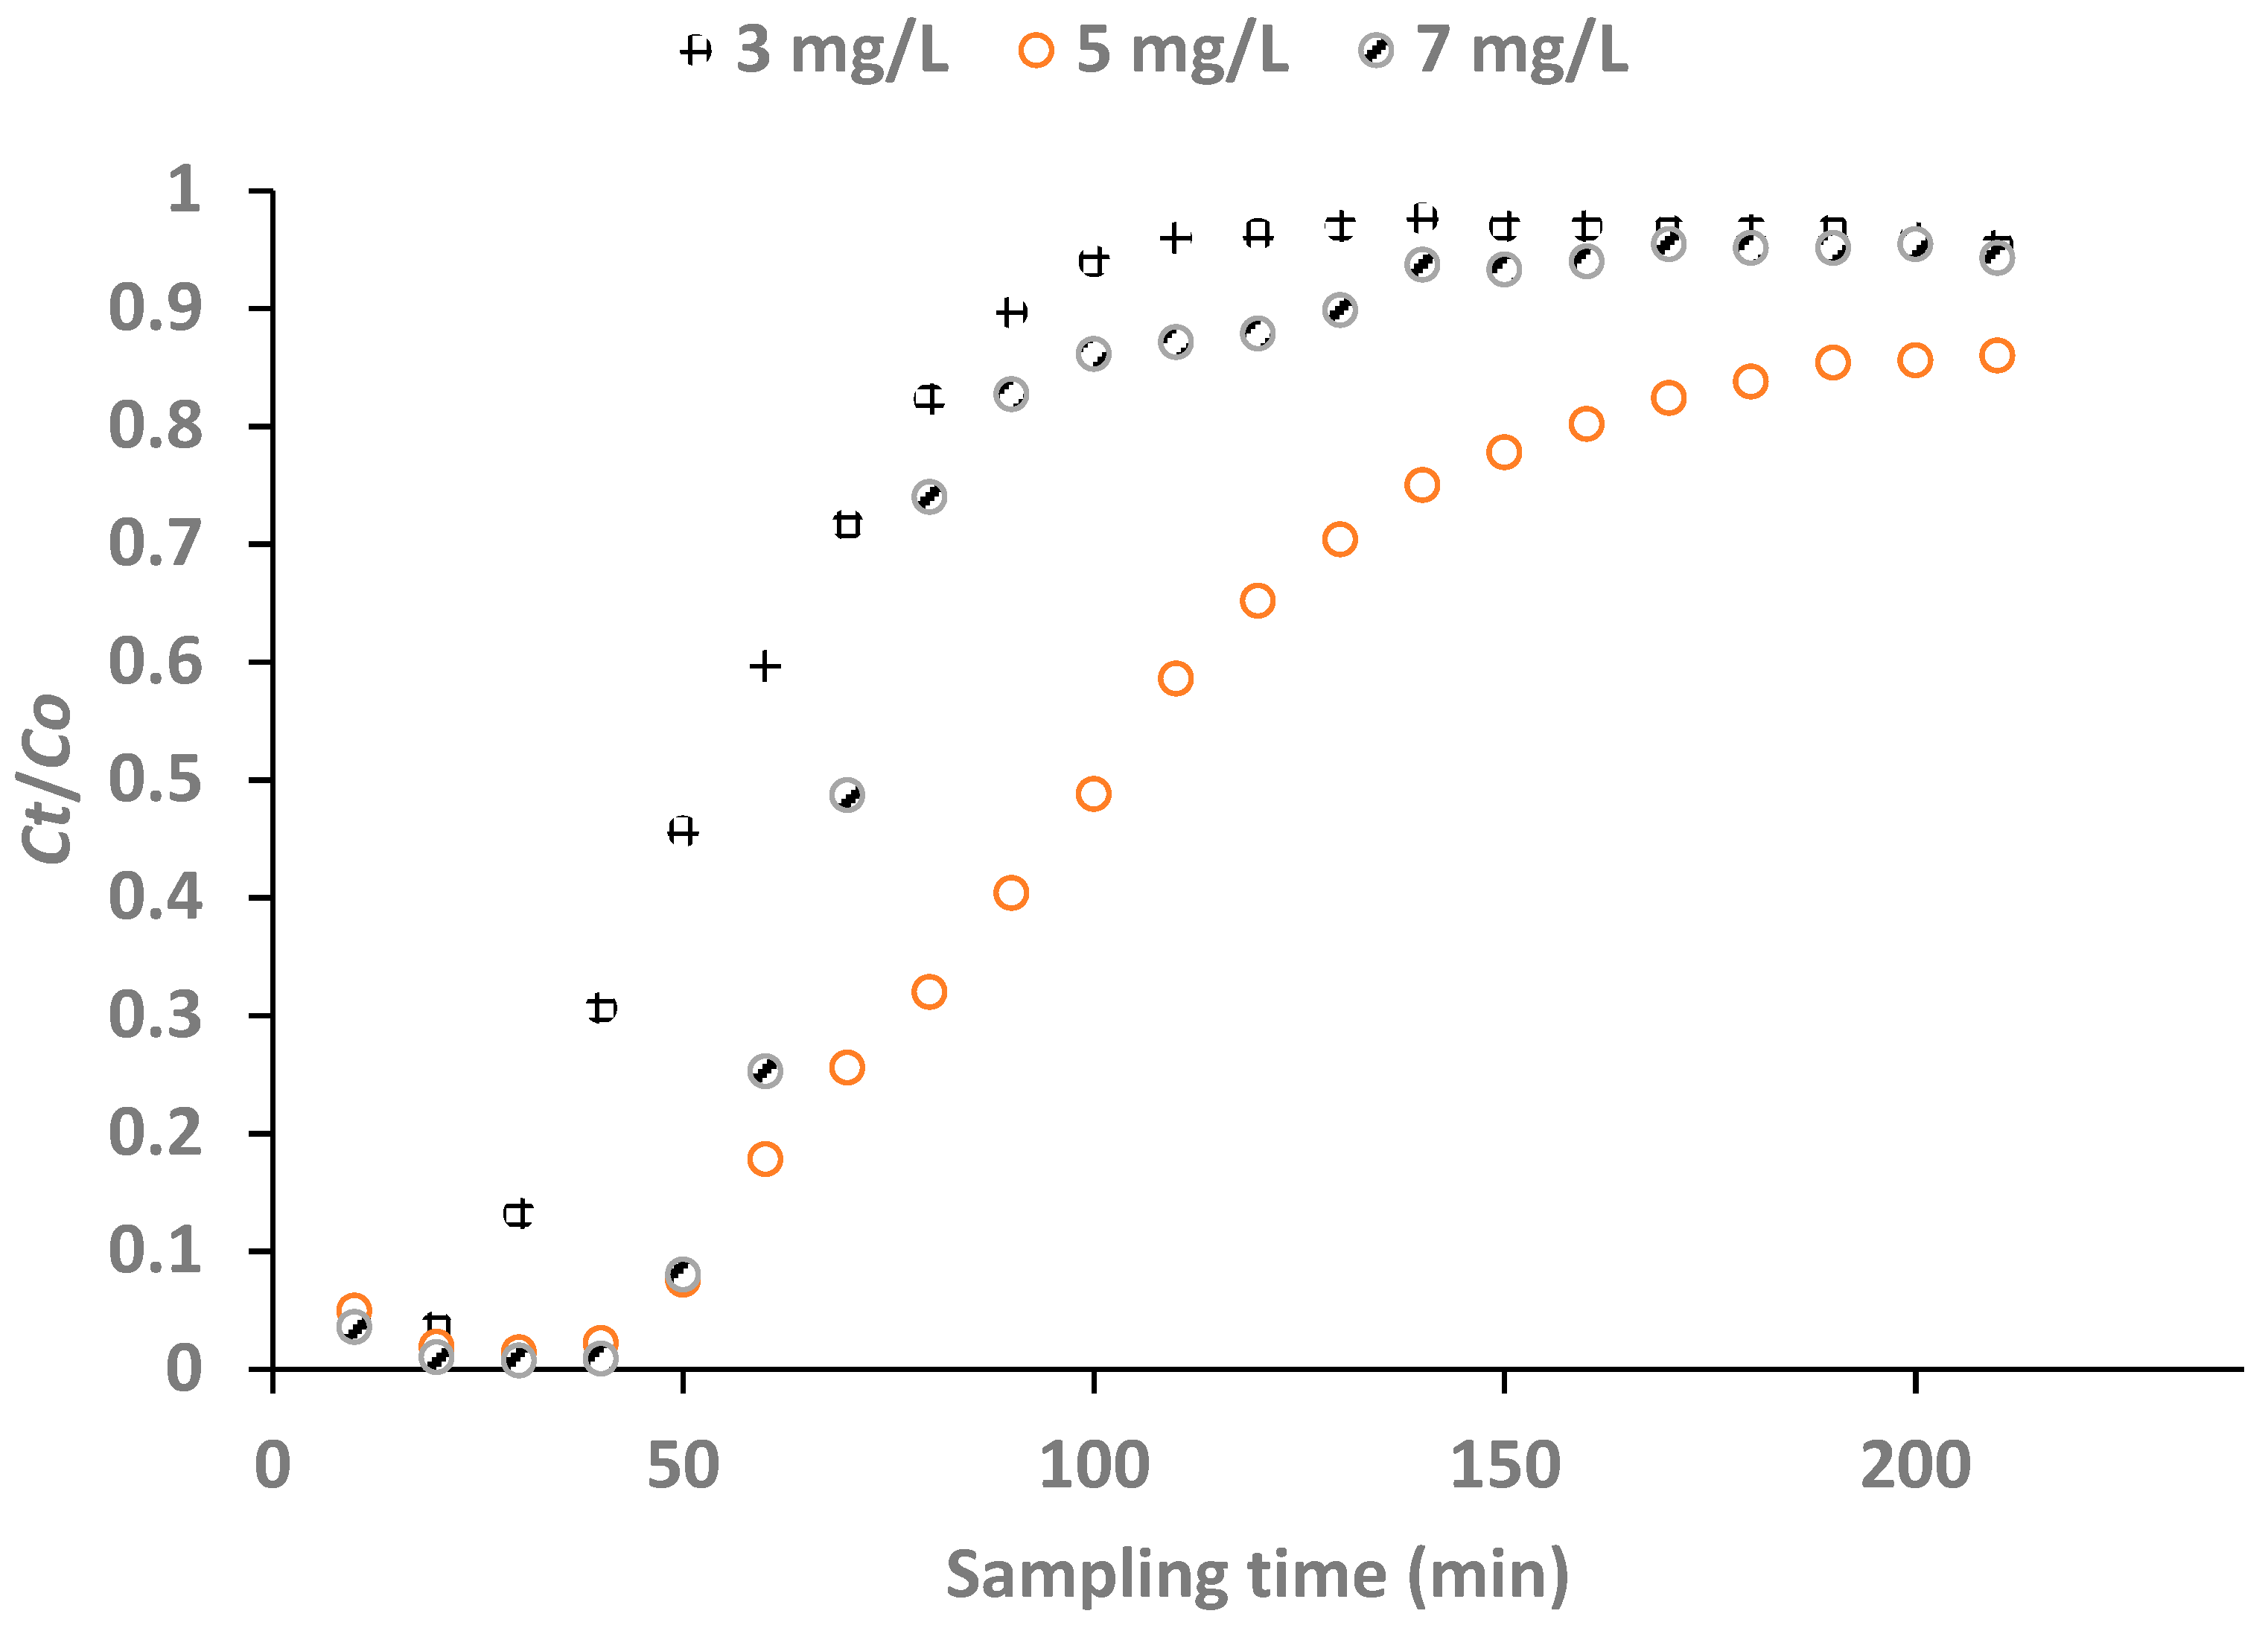
Figure 9.
Breakthrough curves at different influent fluoride concentrations as functions of throughput volume (adsorbent dose: 1 g and flow rate: 1.97 mL/min).
Figure 9.
Breakthrough curves at different influent fluoride concentrations as functions of throughput volume (adsorbent dose: 1 g and flow rate: 1.97 mL/min).
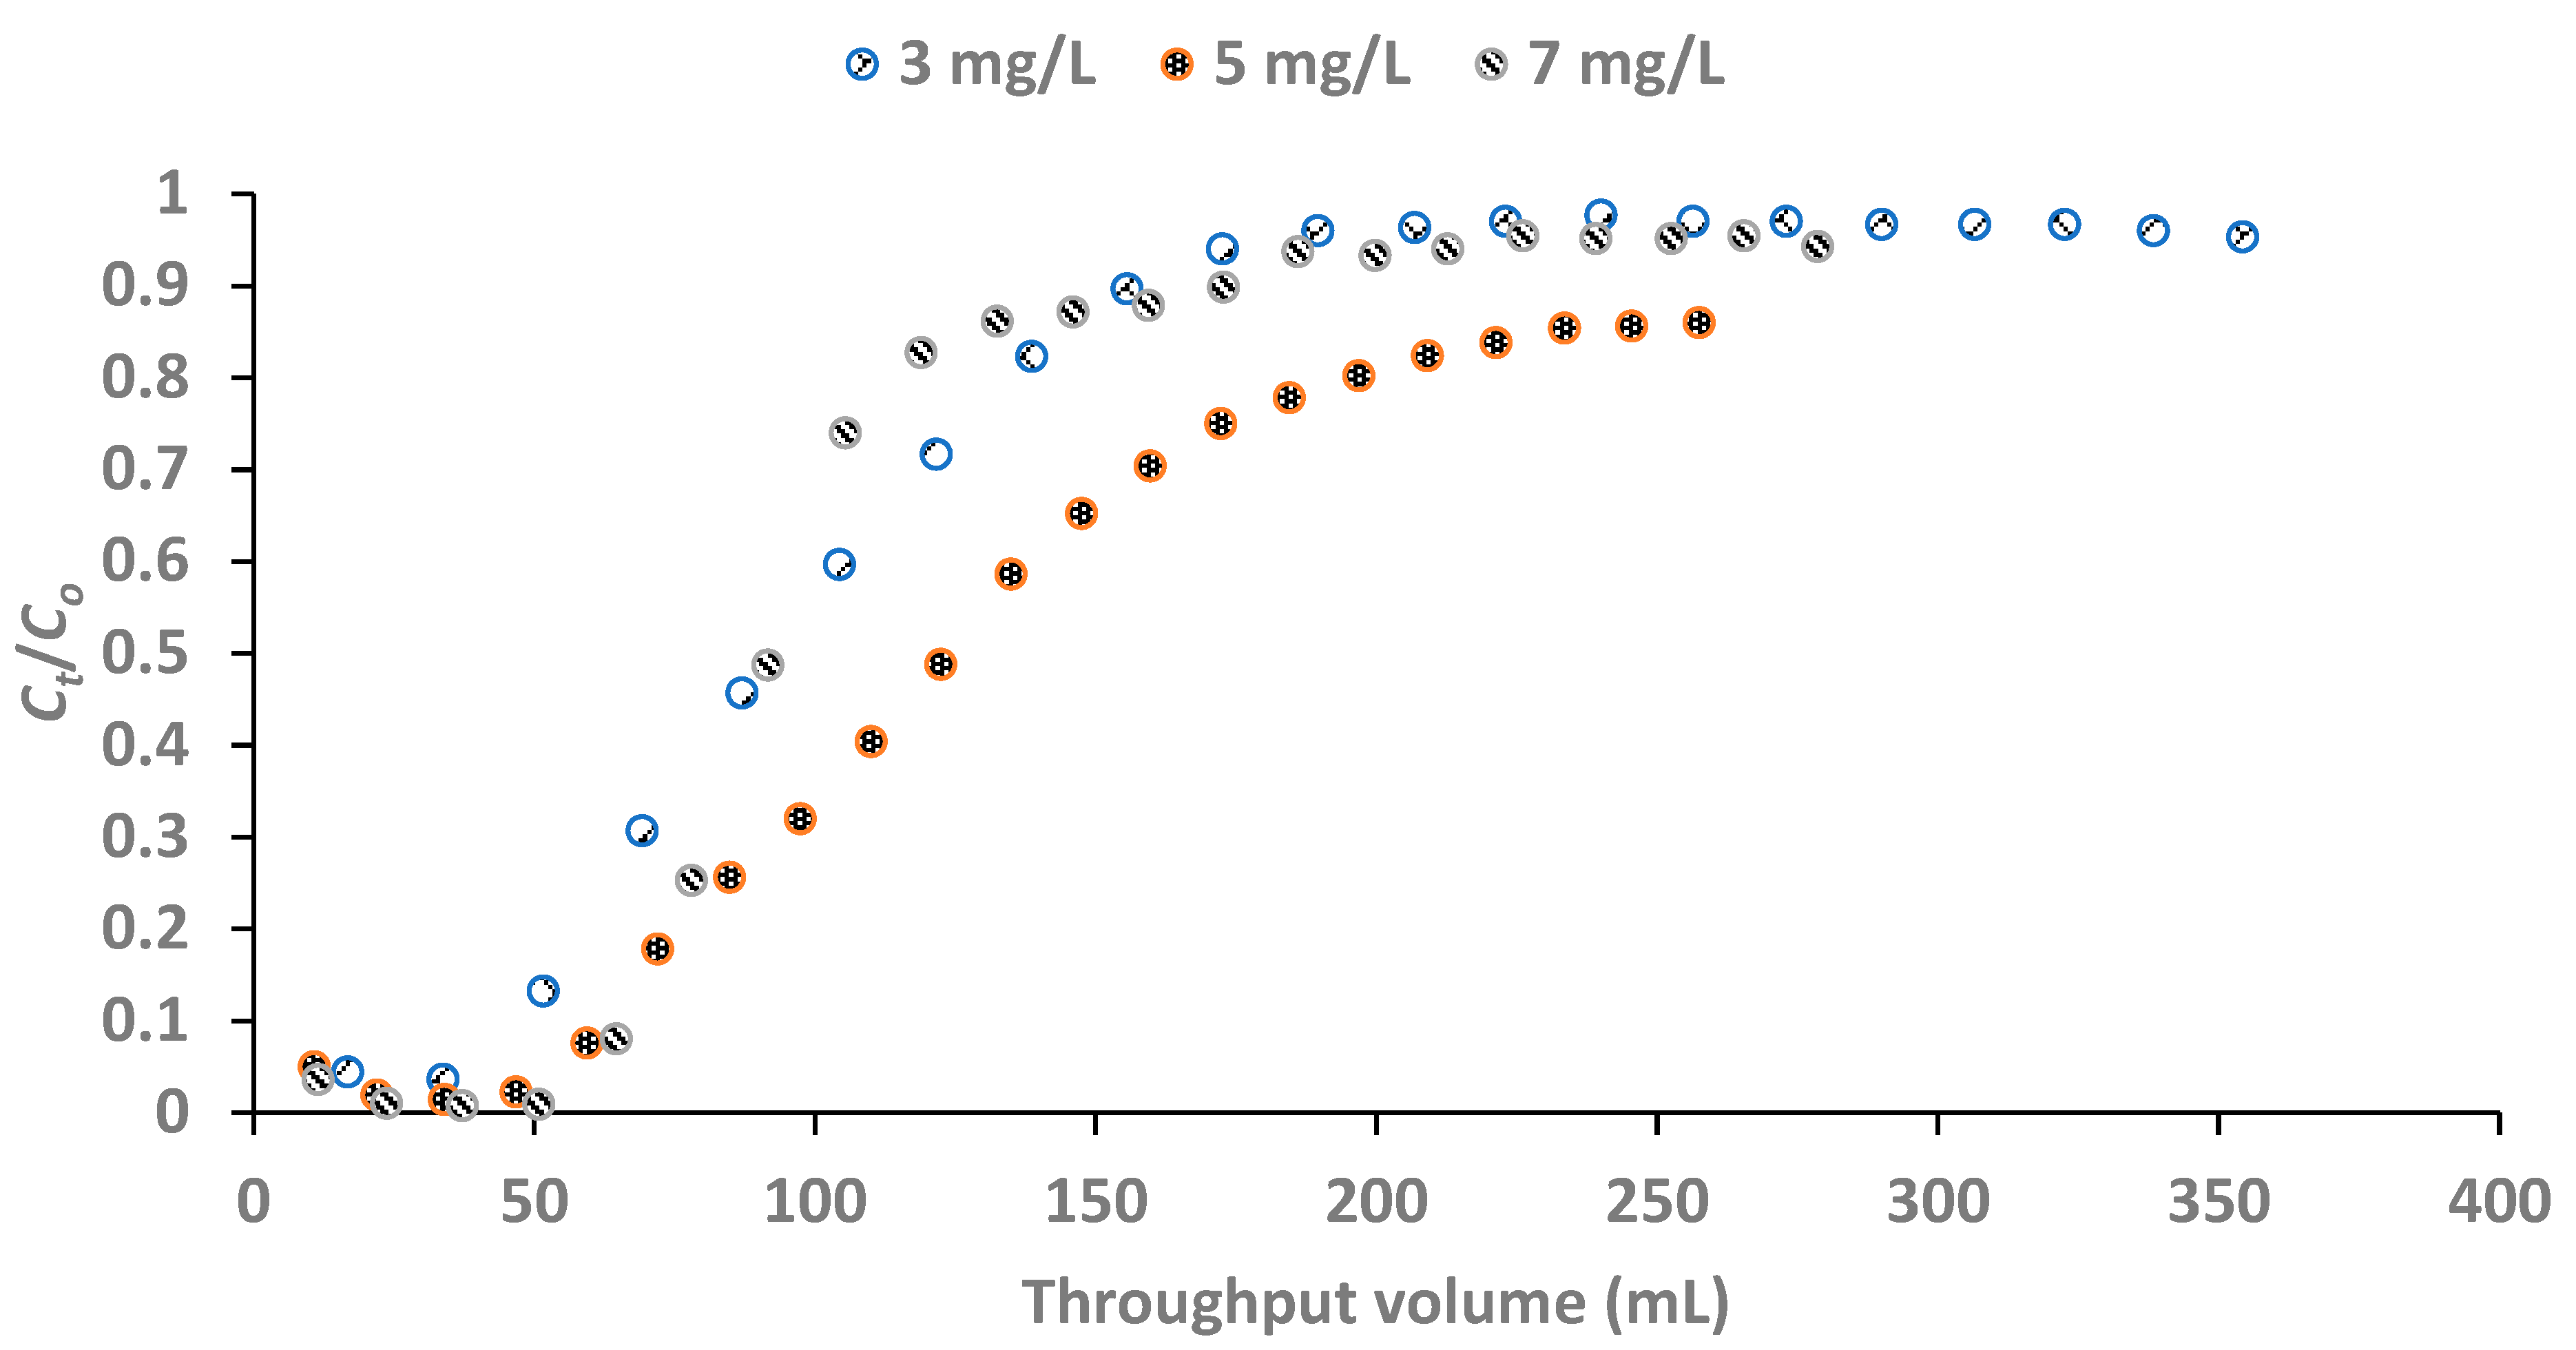
Figure 10.
Yoon-Nelson kinetic model plots (concentration of feed solution: 5 mg/L, adsorbent dose: 1 g and flow rate: 1.97 mL/min).
Figure 10.
Yoon-Nelson kinetic model plots (concentration of feed solution: 5 mg/L, adsorbent dose: 1 g and flow rate: 1.97 mL/min).
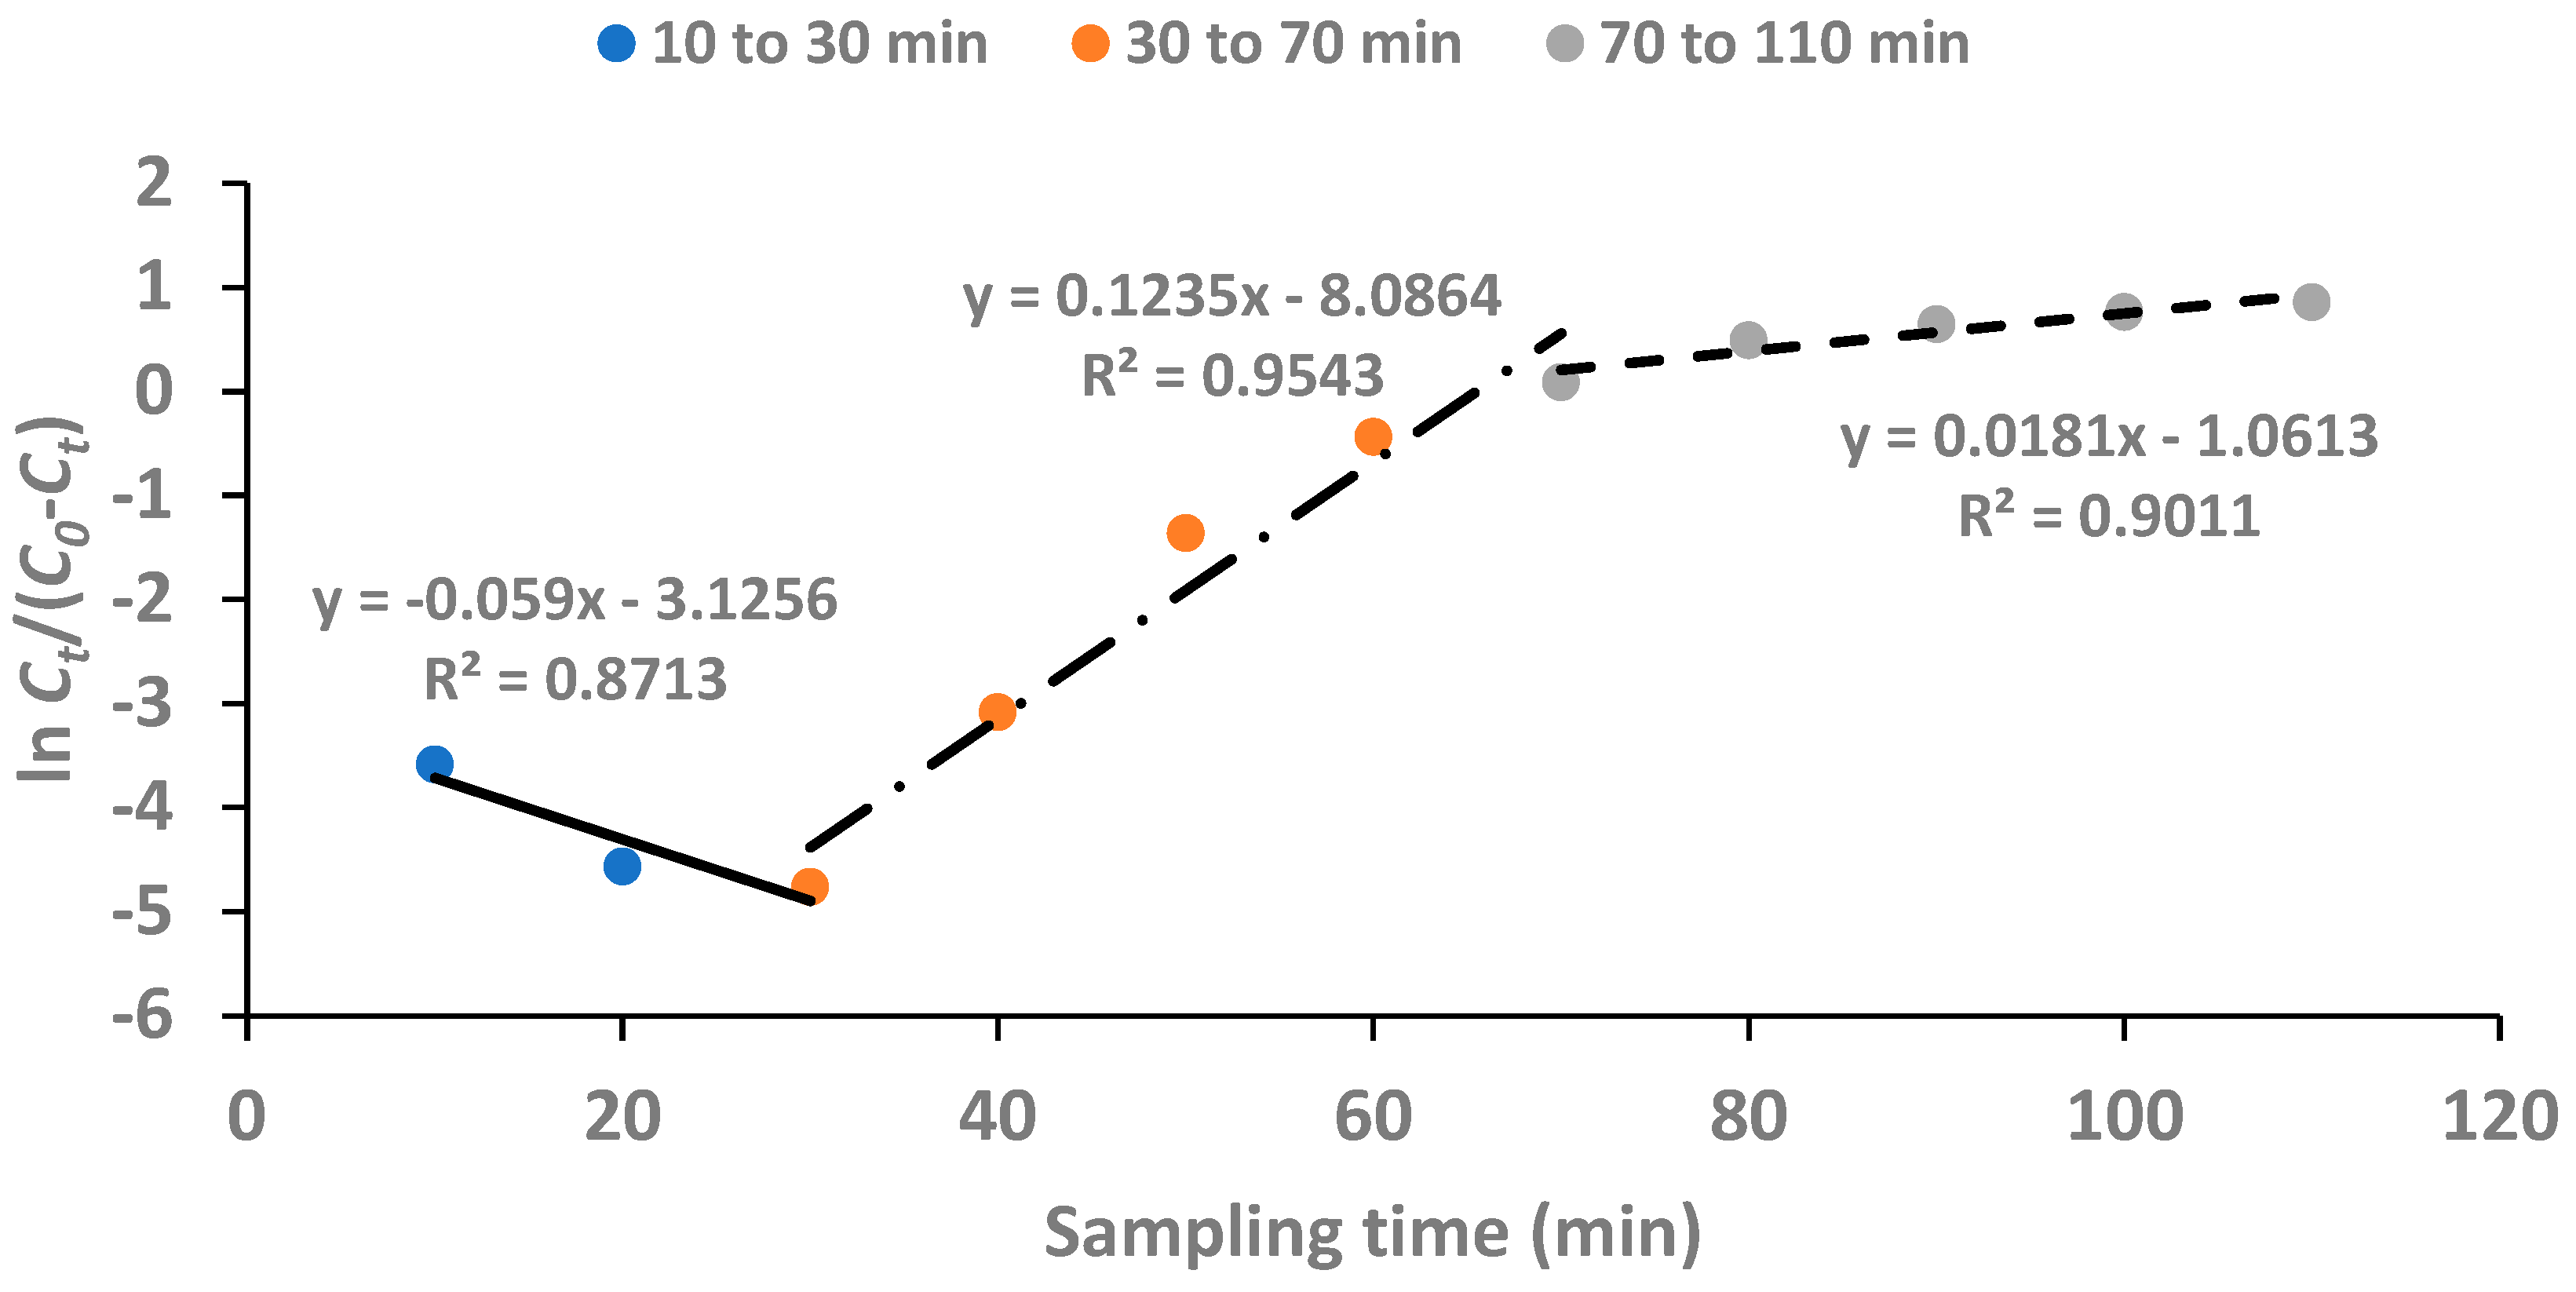
Figure 11.
Breakthrough curve for fixed-bed defluoridation of field water (initial fluoride concentration: 5.52 mg/L, adsorbent dose: 1 g, flow rate: 1.97 mL/min and breakthrough point: 0.27).
Figure 11.
Breakthrough curve for fixed-bed defluoridation of field water (initial fluoride concentration: 5.52 mg/L, adsorbent dose: 1 g, flow rate: 1.97 mL/min and breakthrough point: 0.27).
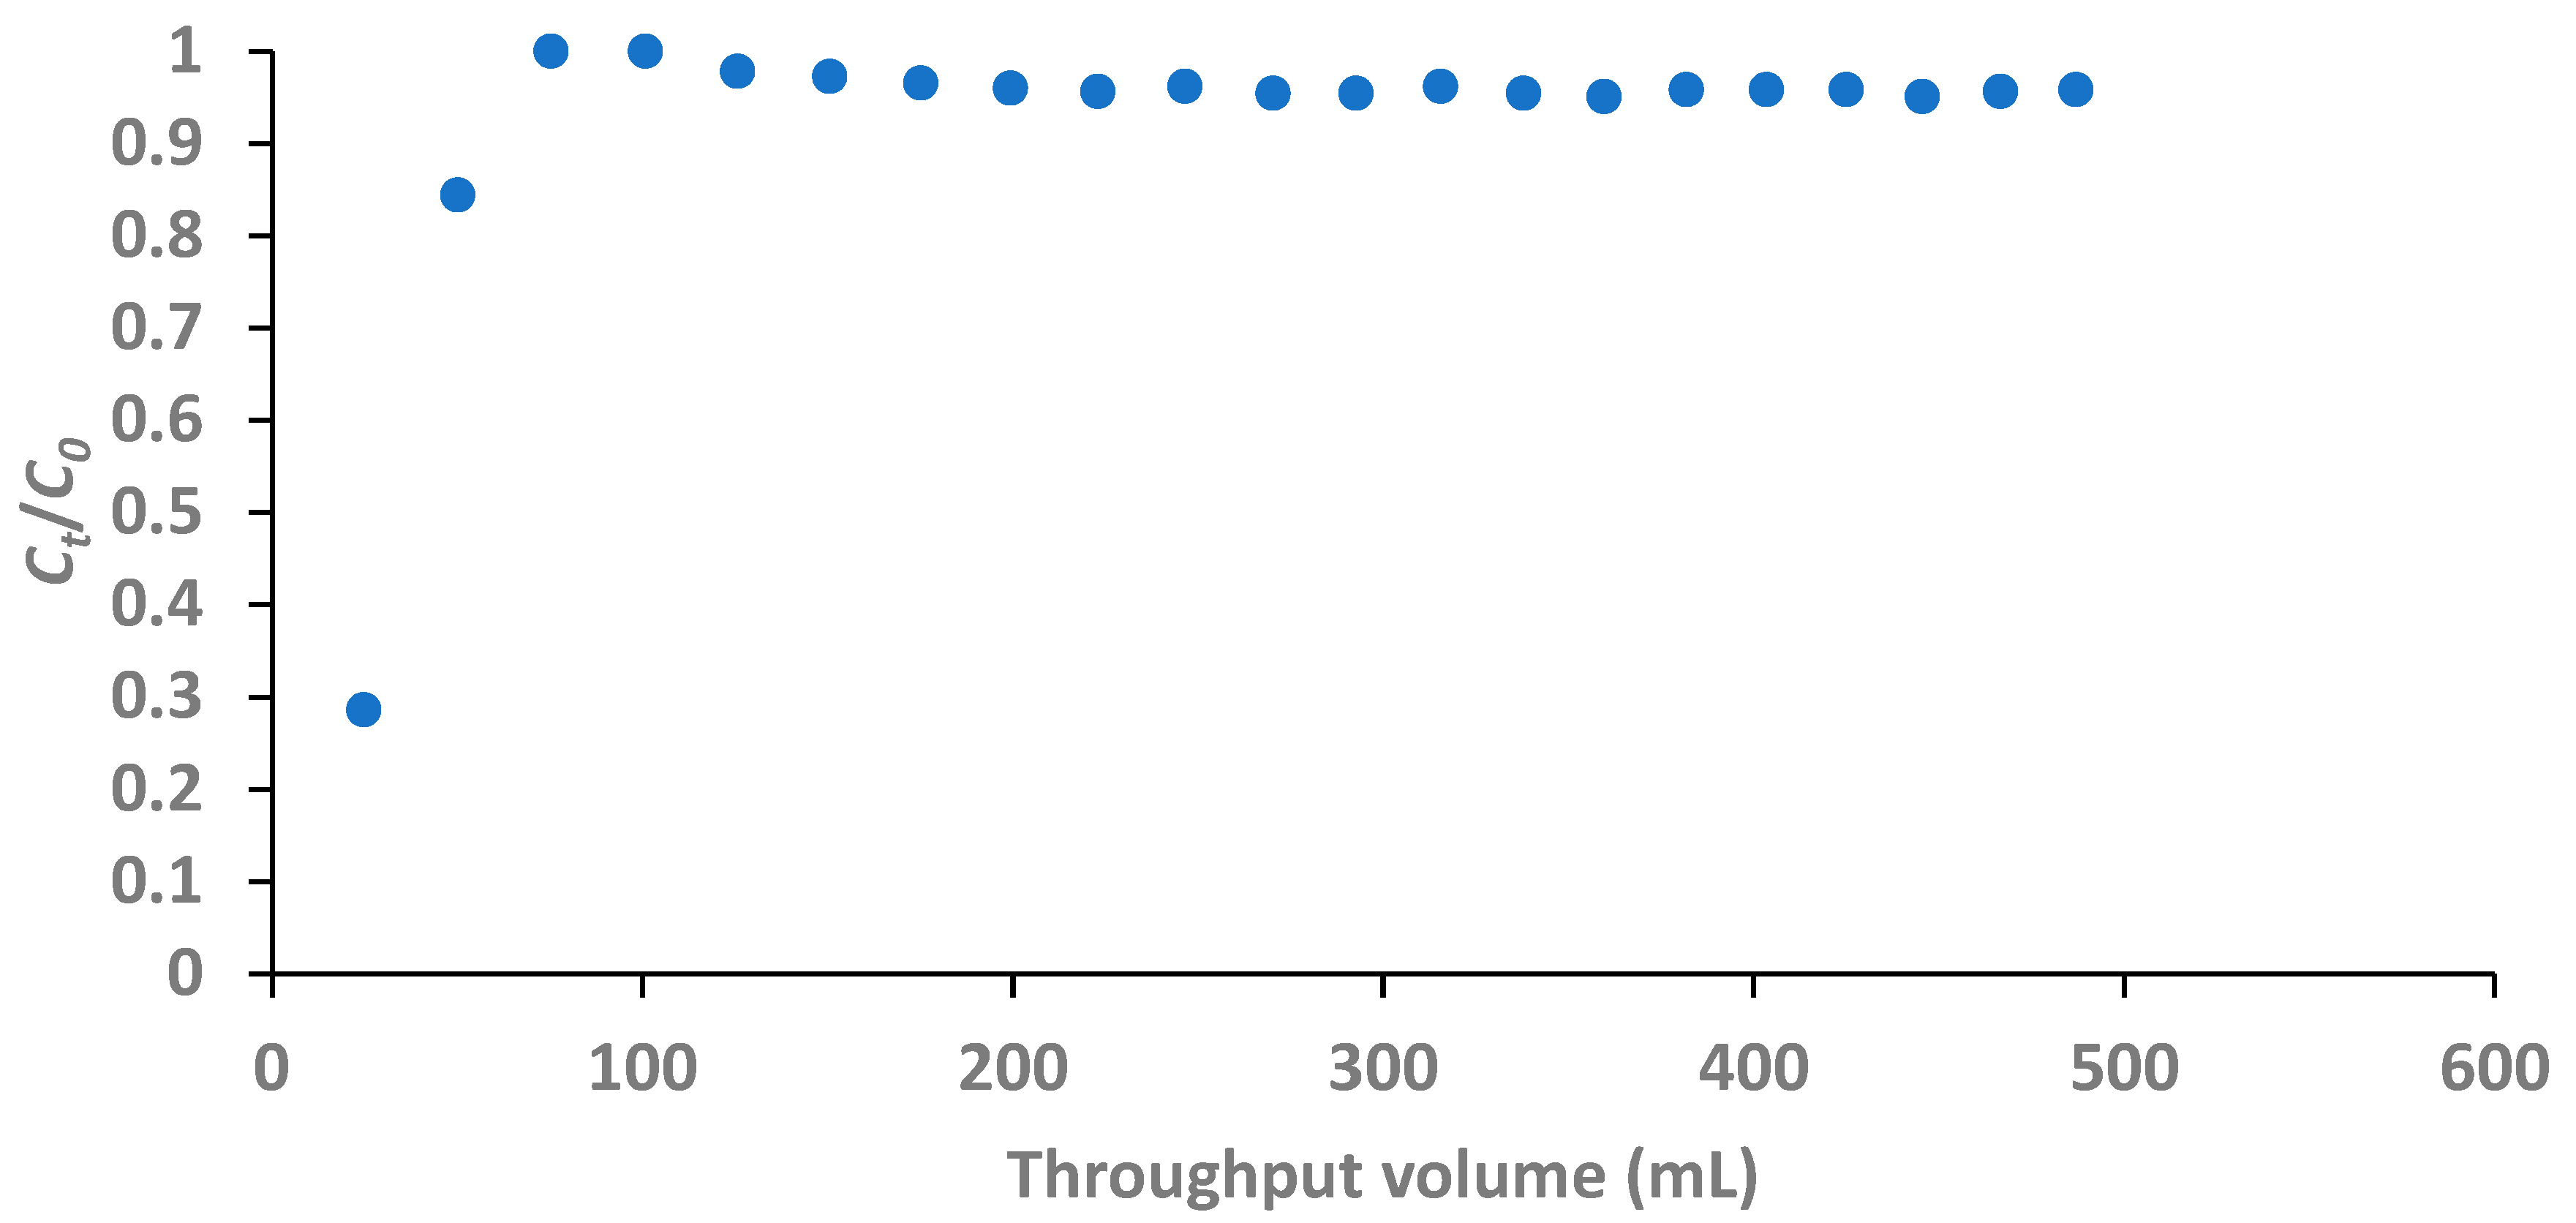
Figure 12.
Breakthrough curve for fixed-bed defluoridation of field water with respect to sampling time (initial fluoride concentration: 5.52 mg/L, adsorbent dose: 1 g and flow rate: 1.97 mL/min).
Figure 12.
Breakthrough curve for fixed-bed defluoridation of field water with respect to sampling time (initial fluoride concentration: 5.52 mg/L, adsorbent dose: 1 g and flow rate: 1.97 mL/min).
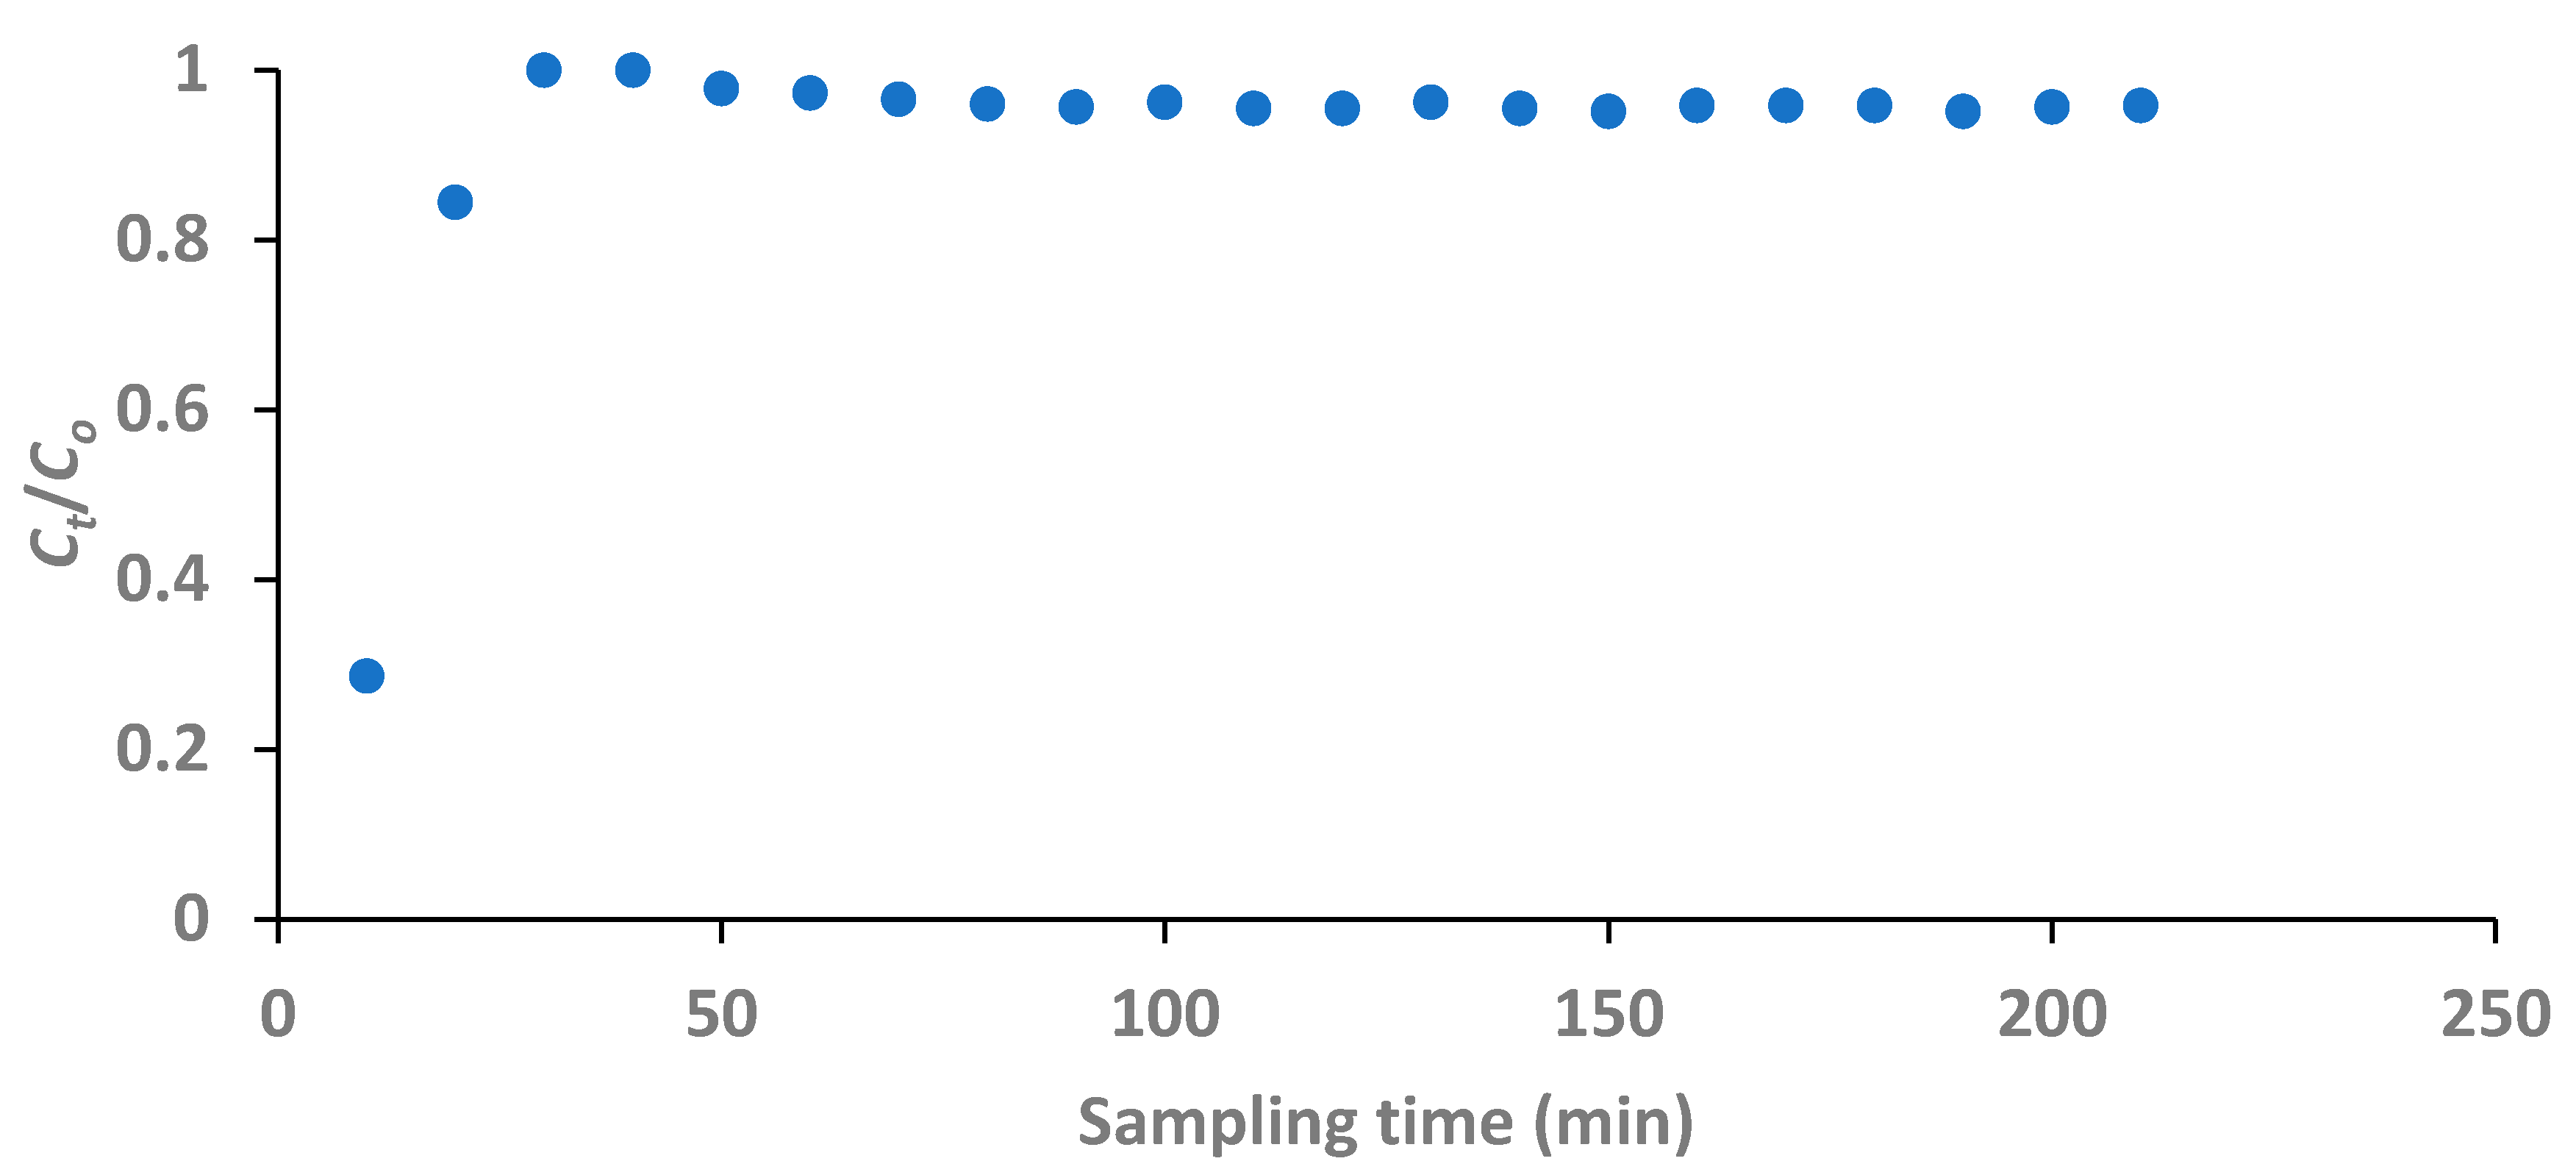

Table 1.
Evaluation of adsorbent’s surface area by BET method.
| Sample | Surface area (m2/g) |
Adsorption cum. surf. area of pores (m2/g) |
|---|---|---|
| Natural DE | 31.89 | 21.41 |
| Al-Fe oxide-infused DE | 70.73 | 61.31 |
Table 2.
Calculated bed capacities until breakthrough point using optimum fluoride concentration of 5 mg/L.
Table 2.
Calculated bed capacities until breakthrough point using optimum fluoride concentration of 5 mg/L.
| V (mL) |
Cum V (mL) |
V (L) |
Ct (mg/L) |
(C0-Ct) | qt (mg/g) |
|---|---|---|---|---|---|
| 23.6 | 23.6 | 0.0236 | 0.1350 | 4.8650 | 0.1148 |
| 22.5 | 46.1 | 0.0225 | 0.0514 | 4.9490 | 0.1114 |
| 20.1 | 66.2 | 0.0201 | 0.0423 | 4.9577 | 0.0996 |
| 19.4 | 85.6 | 0.0194 | 0.2190 | 4.7810 | 0.0928 |
| 20.6 | 106.2 | 0.0206 | 1.0200 | 3.9800 | 0.0820 |
| 4.1 | 110.3 | 0.0041 | 1.5000 | 3.5000 | 0.0144 |
| 0.5150 |
Table 3.
Comparison of fluoride adsorption capacities of batch method and fixed-bed column for 100 mL treated water.
Table 3.
Comparison of fluoride adsorption capacities of batch method and fixed-bed column for 100 mL treated water.
|
Co (mg/L) |
Ce (mg/L) |
Ct (mg/L) |
Batch method adsorption capacity, qe (mg/g) |
Fixed-bed column adsorption capacity, qt (mg/g) |
% difference in adsorption capacity |
|---|---|---|---|---|---|
| 3 | 0.111 | 1.761 | 0.2889 | 0.2256 | 6.33 |
| 5 | 0.168 | 1.614 | 0.4832 | 0.4370 | 4.62 |
| 7 | 0.274 | 4.760 | 0.6726 | 0.5789 | 9.37 |
Table 4.
Concentrations of anions in natural and treated field water.
| Anion | Groundwater anionconcentration (mg/L) |
|---|---|
| Br | ND |
| Cl- | ND |
| NO3- | ND |
| PO43- | 2.4 |
| SO42- | ND |
ND = Not detected.
Disclaimer/Publisher’s Note: The statements, opinions and data contained in all publications are solely those of the individual author(s) and contributor(s) and not of MDPI and/or the editor(s). MDPI and/or the editor(s) disclaim responsibility for any injury to people or property resulting from any ideas, methods, instructions or products referred to in the content. |
© 2024 by the authors. Licensee MDPI, Basel, Switzerland. This article is an open access article distributed under the terms and conditions of the Creative Commons Attribution (CC BY) license (http://creativecommons.org/licenses/by/4.0/).
Copyright: This open access article is published under a Creative Commons CC BY 4.0 license, which permit the free download, distribution, and reuse, provided that the author and preprint are cited in any reuse.


