1. Introduction
Sorghum, a critical crop with major production centers in the United States, Canada, Australia, and China, holds significant economic and nutritional value (Ganapathy et al., 2015; Mundia et al., 2019; Tamhane et al., 2021). It serves as a staple food and a vital source of livestock feed, particularly in arid and semi-arid regions. In addition, sorghum is an important raw material for brewing (Dabija et al., 2021; Xing-Lin et al., 2017), with cultivation in China predominantly concentrated in the north and southwest regions. Despite its resilience, sorghum cultivation faces considerable challenges from pests, especially lepidopteran insects like the Ostrinia furnacalis (Asian corn borer), Synanthedon exitiosa (peach borer), and Spodoptera frugiperda (armyworm) (Guo et al., 2011; Tamhane et al., 2021; Xing-Lin et al., 2017). These pests threaten crop yields by feeding on leaves and boring into stalks and panicles.
The impact of these pests highlights the urgent need for effective pest management strategies (Hendrichs et al., 2021). Traditional pest control methods often rely on chemical pesticides, which can harm the environment and impact on non-target species (Poudel et al., 2020), including beneficial arthropods. Sorghum’s sensitivity to various pesticides, such as pyrethroids, organophosphates, carbamates and bordeaux mixture, including lime sulfur, compounds are significant issue (Tamhane et al., 2021). Furthermore, modern pesticide formulations, often containing multiple active ingredients, similarly cause phytotoxicity if used improperly. Also, the common practice of applying pesticides through stem and leaf spraying is often ineffective for sorghum varieties with compact panicles that conceal pests, meaning that only a small portion of the pesticide reaches the hidden pests within the panicles. This leads to inefficient pesticide utilization, increased frequency of applications, and the potential for pest resistance development (Dabija et al., 2021; Harris-Shultz et al., 2020). This results in non-point source pollution, excessive pesticide residues, and higher production costs, ultimately reducing sorghum farming profitability.
To address these challenges, green pest control methods have gained attention. These sustainable approaches emphasize the use of biological control agents and environmentally friendly practices to manage pest populations while preserving ecological balance (Alyokhin et al., 2020; Baker et al., 2020; Stenberg, 2017). Changes in arthropod biodiversity are increasingly recognized as key indicators of agricultural sustainability, offering valuable insights into the health and stability of agroecosystems. DNA metabarcoding has emerged as a powerful tool for evaluating insect diversity, providing a comprehensive and efficient method for identifying and quantifying a wide range of arthropod species (Bik, 2021; Eitzinger et al., 2019; Hebert et al., 2003; Suchan et al., 2019). It works by designing target primers and focusing on specific regions of the insect genome, capturing and decoding key genetic information (Xia et al., 2023). This allows precise identification of species within complex biological samples, offering a detailed view of the arthropod communities present in various environments. This technology enhances our ability to monitor biodiversity and assess the impacts of agricultural practices on arthropod communities, thereby supporting the development of more sustainable pest management strategies.
Here, we employed Malaise trapping (Skvarla et al., 2021) and DNA metabarcoding (Hebert et al., 2003; Suchan et al., 2019) techniques to analyze arthropod communities in sorghum fields over two years. We determined the composition of arthropods in these fields and assessed the impact of green pest control methods on the diversity of insect orders such as Lepidoptera and Hymenoptera. We also evaluated the effects of green pest control on sorghum yields, underscoring the importance of integrating sustainable pest management practices to enhance crop health and farming efficiency.
2. Materials and Methods
2.1. Basic Information of Sampling Places
Samples for this study were collected from the liquor-making manufacturing base at Yanghe Agricultural High-tech Zone (18m above sea level, 118.432°E, 33.783°N) and Siyang County in Suqian City, Jiangsu Province (17m above sea level, 118.32°E, 33.97°N). These sites are located in the Huaihe Plain, characterized by a warm temperate monsoon climate with an average annual temperature of 14.2°C, average annual precipitation of 910 mm, total annual sunshine hours of 2291 hours, and a crop growth period of 310.5 days per year. Sorghum, a local specialty crop, is mainly used for making Baijiu (Chinese liquor). Two green pest control areas (LX, PW) and non-green pest control areas, also called chemical control group (YH, LP, SZ) were set up in both bases (
Table S1).
2.2. Green and Non-Green Pest Control
2.2.1. Green Pest Control Methods
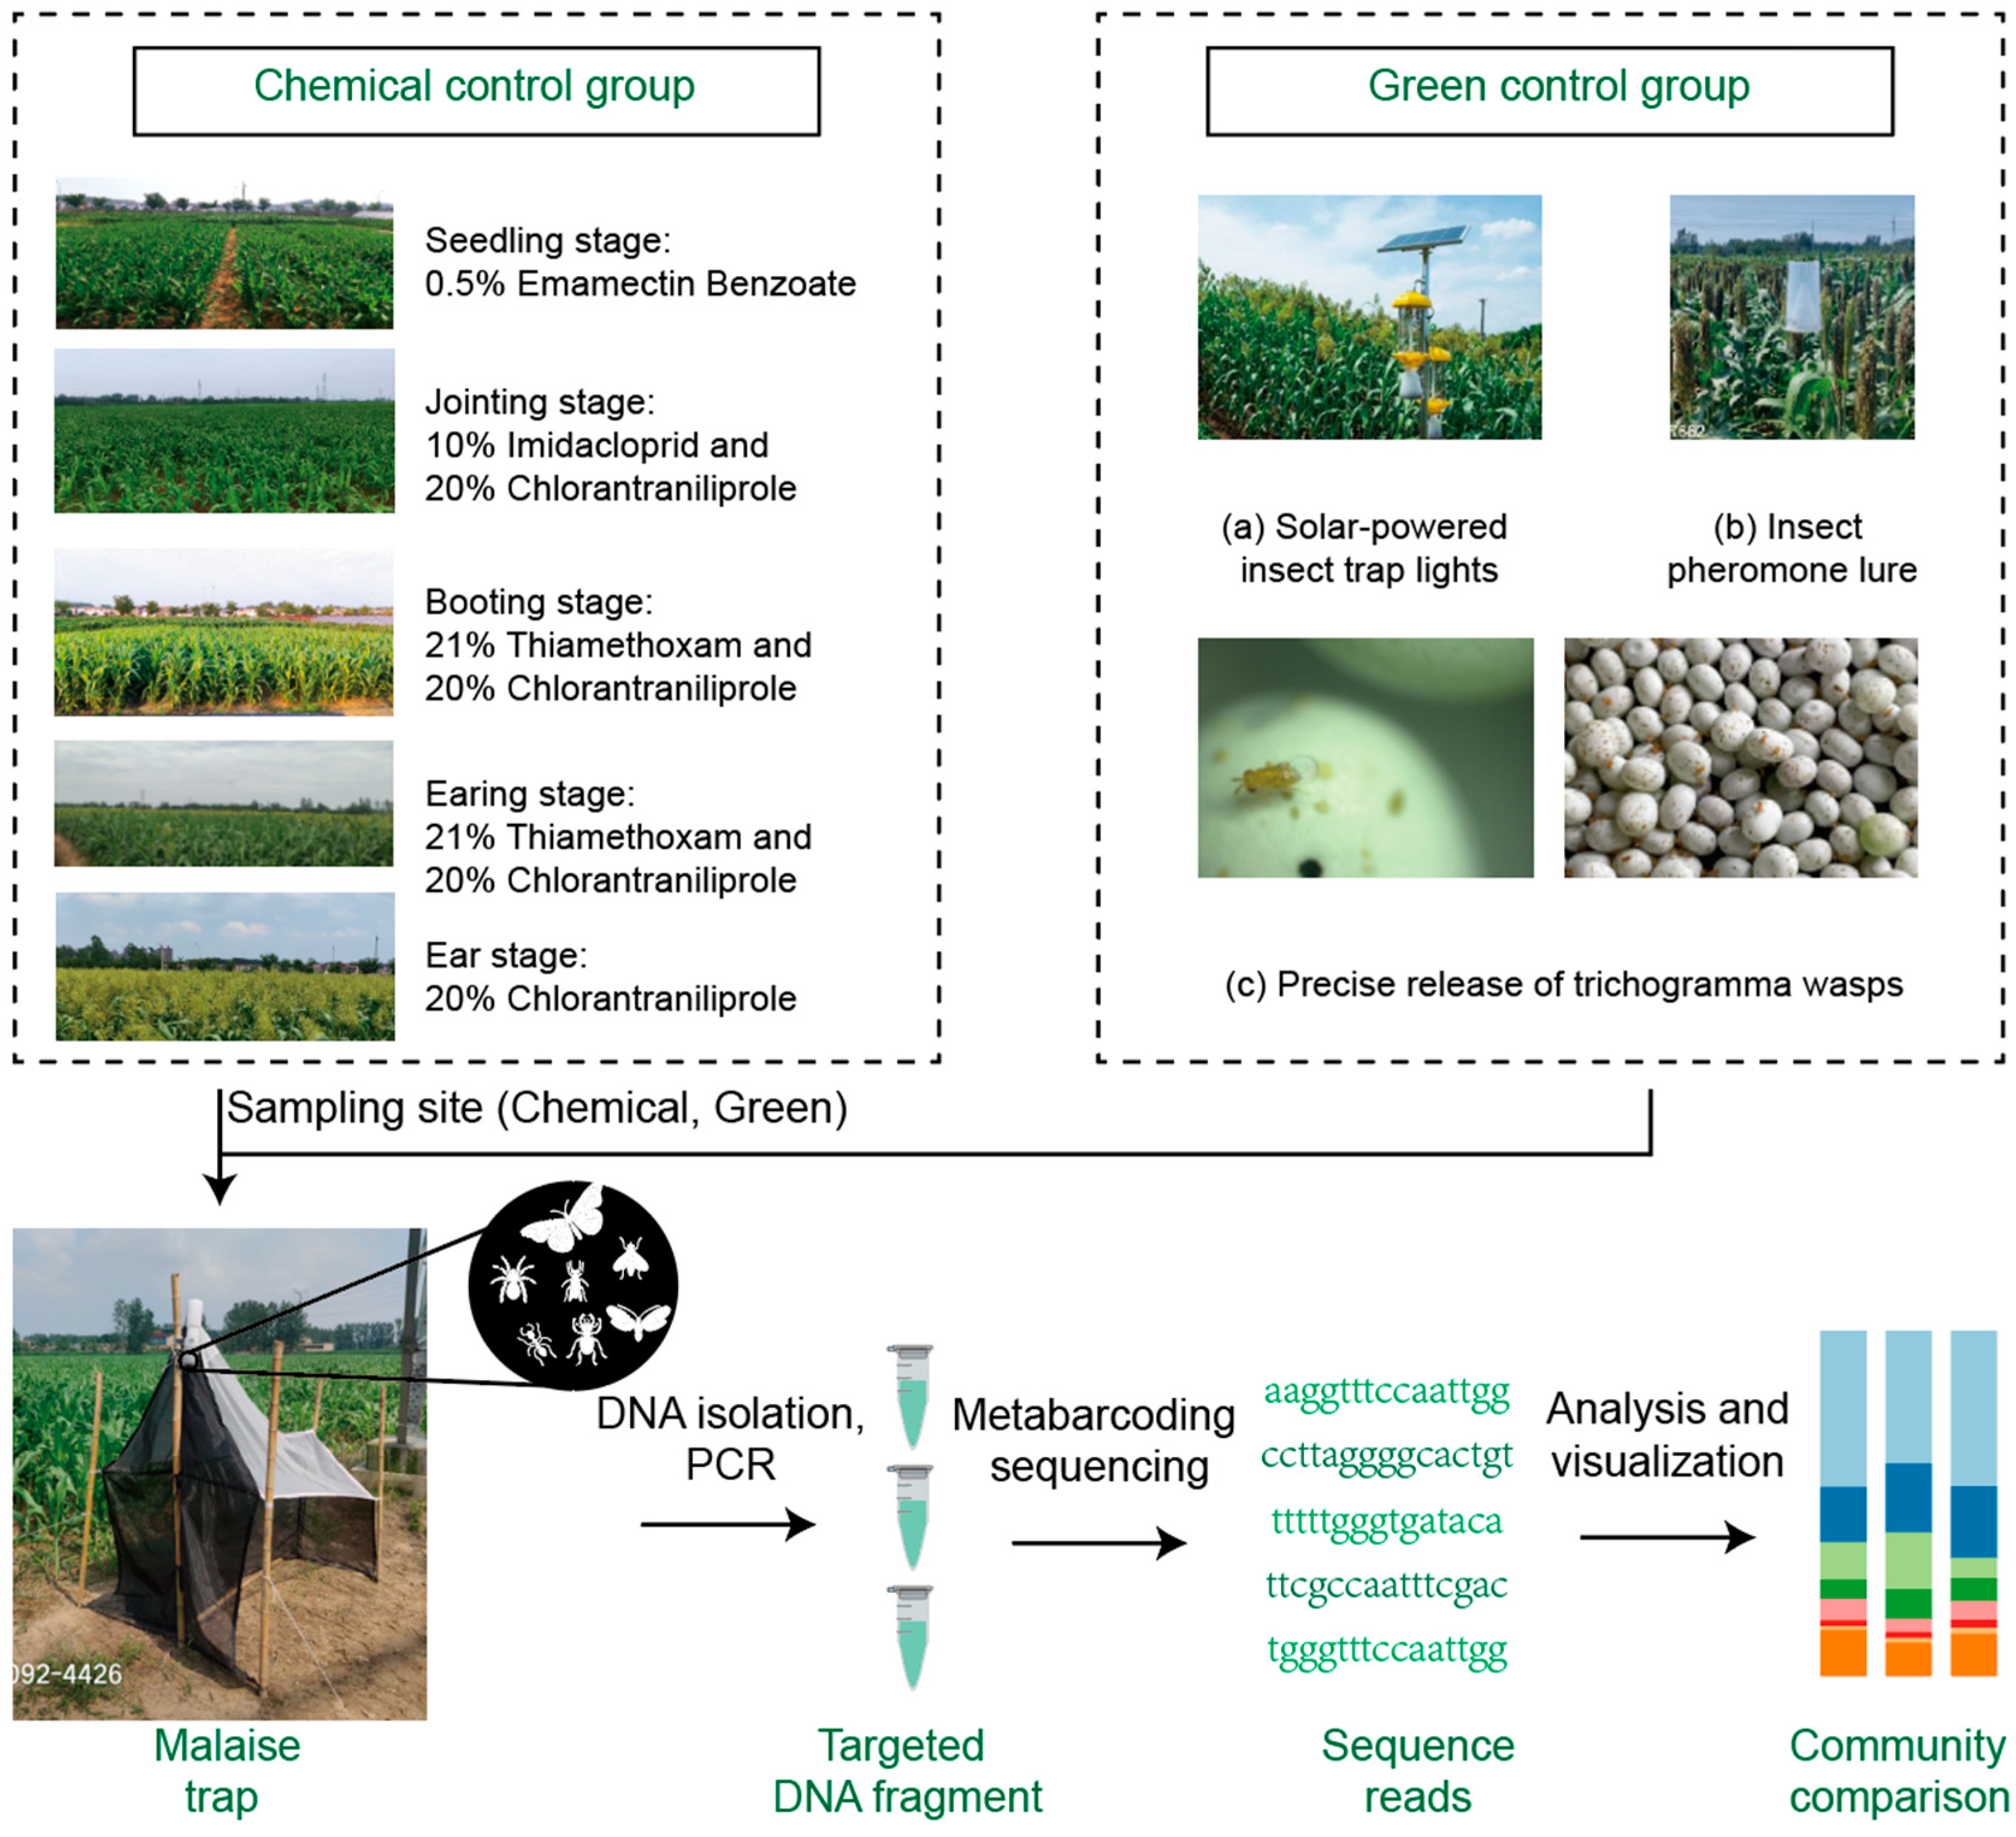
In green-controlled fields, no chemical control methods are used. Instead, the following green pest control techniques are employed. Green pest management refers to pest control practices that minimize the use of chemical pesticides and prioritize environmentally sustainable methods. This approach focuses on ecological balance, using non-toxic strategies to reduce pest populations and promote long-term sustainability. It integrates methods like biological control, physical barriers, and the use of natural pest deterrents. (a) Solar-powered insect trap lights. In this method, it took advantage of the tendency of Lepidopteran pests to be attracted to light. One solar-powered insect trap light, integrating wind and solar power, was installed for every 50 acres of land. These lights are purchased from Nanjing Liye Pest Control Co., Ltd. (b) Insect pheromone lure technology. For each pest species being controlled (specifically corn borers (
Ostrinia furnacalis) and peach borers (
Conogethes punctiferalis)), 2-3 traps are installed per acre. Each trap is equipped with a species-specific pheromone lure to attract the targeted pest. The lure cartridges are replaced every 3-5 weeks. Both the traps and the pheromone lures are sourced from Nanjing Liye Pest Control Co., Ltd. (c) Precise release of trichogramma wasps. Trichogramma wasps (specifically
Trichogramma chilonis and
Trichogramma dendrolimi,
Trichogramma dendrolimi carrying
Beauveria bassiana ) were released four times in the green-controlled sorghum fields between July and October of 2021 and 2022. The release dates were June 25, July 1, July 8, and August 16. Each hectare received approximately 225000 wasps (equivalent to 15,000 wasps per acre) each time. Five release points were set up per acre (
Figure 1).
2.2.2. Non-Green Pest Control Methods
In fields without green control, chemical pesticides were applied throughout the growing season with five sprayings targeting key growth stages: at the seedling stage, 0.5% Emamectin Benzoate was used; at the jointing stage, 10% Imidacloprid and 20% Chlorantraniliprole were applied; at the booting stage, 21% Thiamethoxam and 20% Chlorantraniliprole were used; at the earing stage, 21% Thiamethoxam and 20% Chlorantraniliprole were applied; and at the ear stage, 20% Chlorantraniliprole was used. The dosages ranged from 120 to 450 mL/ha depending on the growth stage, ensuring targeted pest management (
Figure 1,
Table 1). This group was therefore referred to as the chemical control group.
2.3. Collection of Arthropods
2.3.1. Sampling
Arthropod samples were collected using Malaise traps. Three traps were randomly set up at each sampling site, positioned 10 meters from the field edge to minimize edge effects. Each Malaise trap was 0.9-1.8 meters in height and 1-1.5 meter in width, with a bottle at the top of trap, containing ethanol to preserve the captured arthropods. The samples were collected every two weeks, resulting in a total of 104 Malaise trap bottles (
Table S1). Specifically, 83 bottles were collected from four sites sampled in 2021 (LP, LiuLiPeng; SZ, SanZhuang; LX, LiuLiPeng Xi; PW, PeiWei) between July 1 and October 28. Additionally, 21 bottles were collected from one site (YH, YangHe) sampled in 2022 between July 15 and October 25. The site sampled alone in 2022 was chosen, for comparing pest species composition across different years or evaluating a treatment effect at a particular location.
2.3.2. DNA Extraction, PCR Amplification, High-Throughput Sequencing
Each sample collected from the Malaise traps was soaked in 500 ml of sterile water at 4°C for 24 hours to remove ethanol. This was repeated three times, such that residual ethanol was removed. The total DNA in the lysate, obtained by lysing the insect bodies with 10 ml of lysis buffer GA (50 mM Tris-HCl (pH 8.0), 100 mM NaCl, 10 mM EDTA, 1% SDS, 5% Polyvinylpyrrolidone (PVP)), was extracted using the membrane adsorption method. PCR amplification was performed using the primers LCO1490 (GGTCA ACAAA TCATAA AGATA TTGG) and HCO2198 (TAAAC TTCAG GGTGA CCAAA AAATCA) (Flomer, 1994). The PCR reaction system was prepared in a total volume of 50 μl, which included 2 μl of DNA template, 25 μl of 2 × EX Taq PCR MasterMix, and 1 μl each of forward and reverse primers (10 μmol/L). The volume was then adjusted with double-distilled water to reach the final 50 μl. The PCR amplification conditions were as follows: an initial denaturation at 95°C for 5 min, followed by 40 cycles of denaturation at 95°C for 30 s, annealing at 50°C for 30 s, and extension at 72°C for 1 min. After the 40 cycles, a final extension step was performed at 72°C for 10 min. The PCR products were then purified, and the purified amplicons were sequenced using the Illumina MiSeq PE300 platform for high-throughput sequencing.
2.3.3. Metagenomic Data Processing
Raw sequencing data were processed using several bioinformatics tools to ensure high-quality results. First, raw sequences were quality-controlled using Trimmomatic v0.39 software (Bolger et al., 2014), where reads were trimmed based on base quality scores and adapter sequences were removed. Data quality before and after trimming was assessed using FastQC v0.11.5 (de Sena and Smith, 2019), which provides a detailed report on the overall quality of the sequence data, including read length distribution, GC content, and sequence duplication levels. To further refine the data, the FASTX-Toolkit v1.4.1 was used for adapter removal, which eliminates residual adapter sequences that may interfere with downstream analysis. For paired-end sequence splicing, we employed FLASH v2.2.0 (Magoč and Salzberg, 2011), achieving a splicing efficiency greater than 95%, allowing for the reconstruction of longer, contiguous sequences from paired-end reads.
To remove potential chimeric sequences—artifacts formed during PCR amplification—we utilized VSEARCH v2.7.1 (Rognes et al., 2016). This step ensures that the data used in downstream analyses is free of spurious sequences that could lead to inaccurate taxonomic classification. After these processing steps, we obtained 8,488 sequences, including 4,723 from 2021 and 3,765 from 2022. All raw sequences are available online on NCBI databases (
https://www.ncbi.nlm.nih.gov/). The associated numbers are from SRR30663504 to SRR30663512.
2.3.4. BOLD System MOTUs Division
All sequences were submitted to the BOLD system (Ratnasingham and Hebert, 2007) for species division via the website
http://www.boldsystems.org/index.php/IDS_IdentificationRequest. After chimera detection, the remaining high-quality sequences were clustered into operational taxonomic units (OTUs) at 97% sequence identity (Elbrecht et al., 2016). The bold.py program was utilized, with input data in ‘.fas’ format files (for example, XX.fas as input file, with filenames inside the file like ‘>22YH030930.249’), producing four output files: (a) XXouts.fa; (b) XXBOLD.sum.fas; (c) XXouts.fa.error.fas; (d) XXBOLD.fas, where ‘XXBOLD.fas’ represents the final BOLD results, with specific filenames containing six-level annotation results, such as ‘>22YH010715.1_Arthropoda_Insecta_Hymenoptera_Formicidae_Rhytidoponera_XX(55.56)’.
2.3.5. Downstream Analysis of Metagenomic Data
Downstream analysis of community composition was performed using the Phyloseq package V. 1.44.0 (McMurdie and Holmes, 2013). Specifically, an OTU table was generated by clustering OTUs at 97% similarity to document the relative abundance of each OTU in each sample, along with the taxonomy of the OTUs. After taxonomic identification, differentially abundant OTUs were selected as key OTUs for further analysis. Our analyses included species composition, diversity assessment, inter-group comparisons, heatmap visualization, and identification of key OTUs. Briefly, for alpha diversity, we assessed differences in the Shannon (Shannon, 2001) and richness indices (Magurran, 2021). Beta diversity was analyzed using Principal Coordinates Analysis (PCoA) based on weighted UniFrac distances, with statistical significance evaluated through analysis of similarity (ANOSIM), to explore differences in community composition between treatment groups and year (Liu et al., 2023). Statistical analyses were performed using R (v4.3.1) and relevant packages, like Microbiome, amplicon, microeco, and vegan packages were employed for taxonomic and diversity analyses, and visualizations were created using ggplot2, dplyr, RColorBrewer, and ggpubr, ensuring clear and publication-quality graphical outputs (Neuwirth and Neuwirth, 2014; Wickham, 2011).
2.4. Sorghum Yield and Quality Calculations
2.4.1. Sample Collection
The grain is harvested when it reaches full maturity. After harvesting, it is promptly dried, threshed, and weighed. The yield is calculated at a standard 14% moisture content and expressed in kilograms per hectare, rounded to one decimal place. During harvest, the outermost rows on both sides (one row on each side) are removed, and only the central rows are used for yield calculation.
2.4.2. Data Analysis
We calculated the yield, thousand grain weight (TGW), grain weight and grain quality. For yield, each harvest covered an area of no less than 1,200 square meters. At each sampling point, three plots were randomly selected, and the actual yield from these plots was measured and converted to yield per hectare (1 hectare = 10,000 square meters). The TGW of fully mature grains was measured when the grain moisture content reaches 14% and expressed in grams (g). The weight of the grain from a single ear was measured in grams. From each plot, a 1-kilogram sample of grain is collected and sent to the Grain and Products Quality Supervision, Inspection, and Testing Center of the Ministry of Agriculture and Rural Affairs (Harbin) for analysis. The following quality indicators were tested: crude protein (dry basis), crude fat (dry basis), crude starch (dry basis), amylopectin (as a percentage of starch), and tannin (dry basis). Then, differences in sorghum yield and productivity between green and non-green control fields were analyzed using the Wilcoxon rank-sum test.
3. Results
3.1. Arthropods Dominate Across Different Years
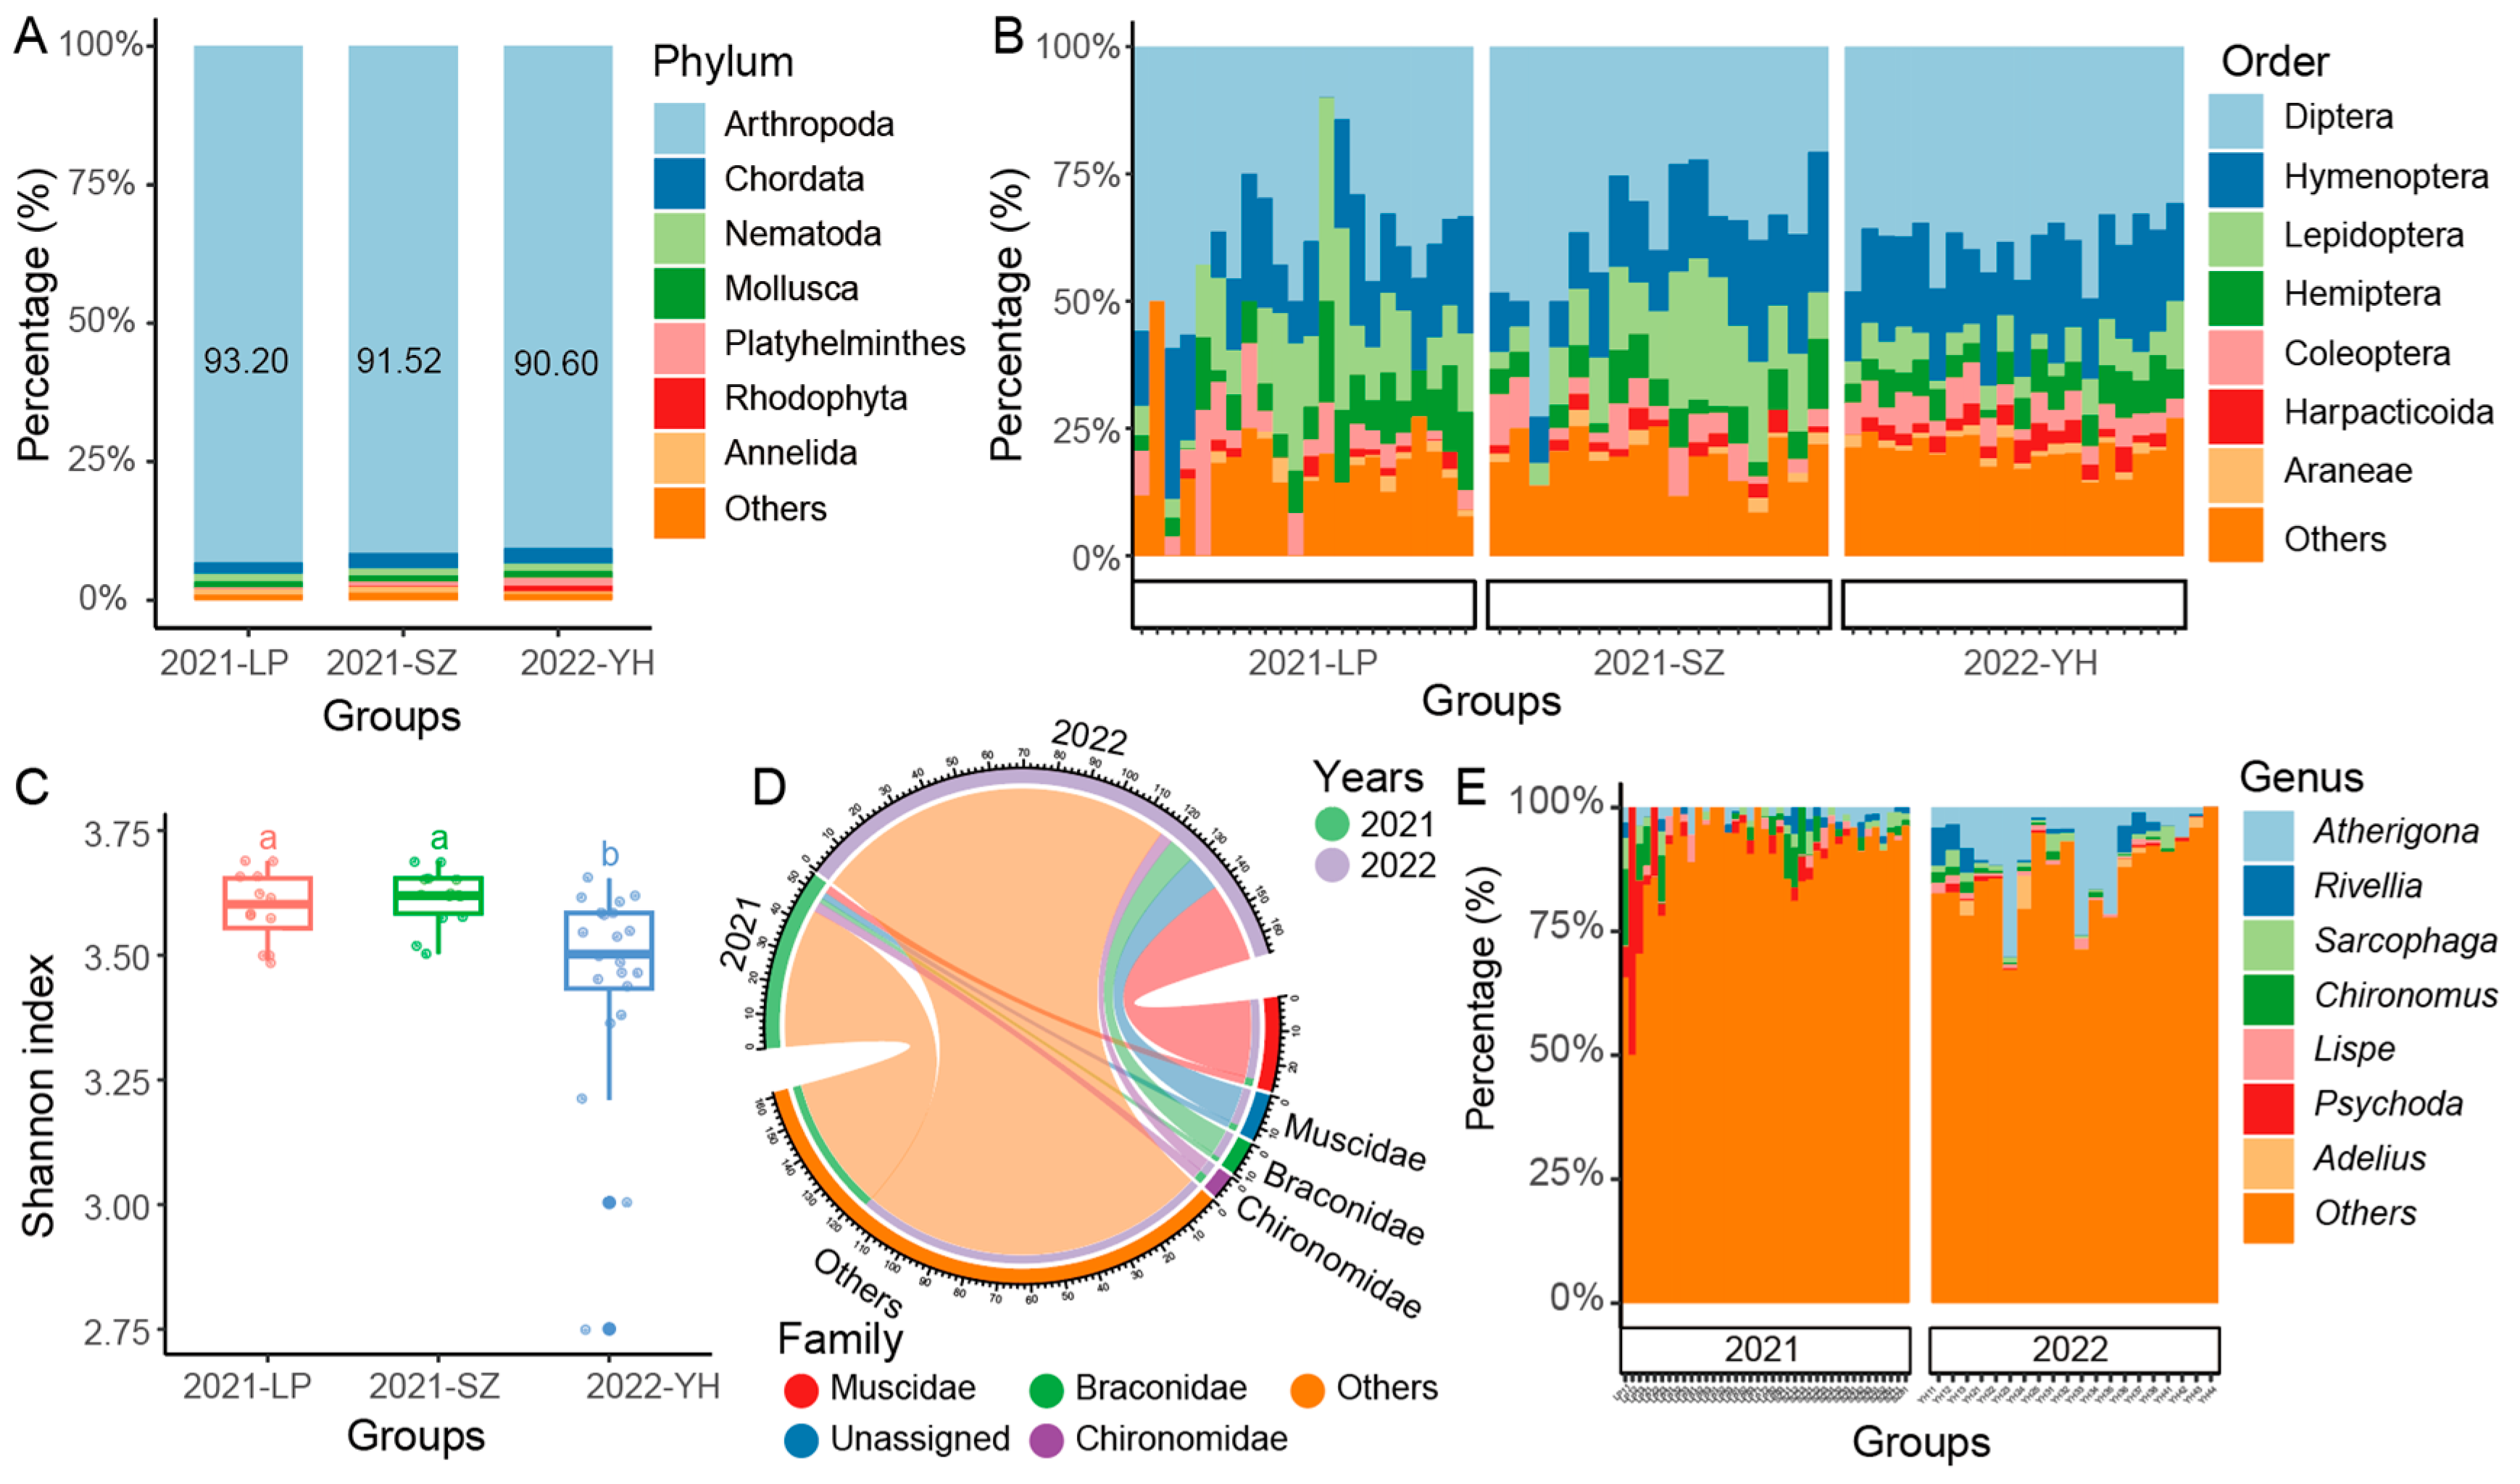
To investigate the diversity of arthropods in sorghum fields over different years, we conducted a Malaise traps survey in two fields (LP and SZ) in 2021 and in one field (YH) in 2022. Our results indicated that the Malaise traps were highly effective in capturing arthropod species, with arthropods comprising more than 90% of the collected samples (
Figure 2A). This high efficiency might indicate the dominance of arthropods in the sorghum field ecosystem. Among the collected samples, the most dominant orders were Diptera, Hymenoptera, and Lepidoptera, leading us to focus subsequent analyses on these key arthropod taxa (
Figure 2B).
In comparing diversity across the different fields and years, we observed no significant differences in the Shannon diversity index between the different fields (LP, SZ, YH) surveyed in 2021 (
Figure 2C). This suggests that, within the same year, the arthropod communities in different locations were relatively consistent in terms of species diversity. A clear distinction emerged when comparing the two years: the Shannon diversity index for 2021 was significantly higher than that for 2022, indicating that arthropod diversity was notably richer in 2021. However, it is important to note that the actual difference in the Shannon index was relatively small, suggesting that the effect size, although statistically significant, was low.
Further analysis revealed that the most abundant arthropod families across both years were Muscidae (house flies), Braconidae (parasitic wasps), and Chironomidae (non-biting midges). These families were consistently present in large numbers, contributing substantially to the overall community structure (
Figure 2D). On a more detailed level, we identified several genera that were particularly dominant in both years, including
Autherigona,
Rivellia,
Sarcophaga,
Chironomus,
Lispe,
Psychoda, and
Adelius (
Figure 2E), though their relative abundance varied between 2021 and 2022. For instance,
Psychoda and
Chironomus were notably more prevalent in the LP field samples from 2021, indicating a localized surge of these genera that year. In contrast,
Autherigona showed a pronounced dominance in 2022, appearing in 20 out of the 21 samples from that year, suggesting a shift in community structure between the two years. This may be suggested a significant shift in the arthropod community structure between 2021 and 2022, with
Autherigona becoming a dominant species in 2022 compared to 2021.
3.2. Increased Arthropod Diversity and Hymenoptera Dominance in Green Groups
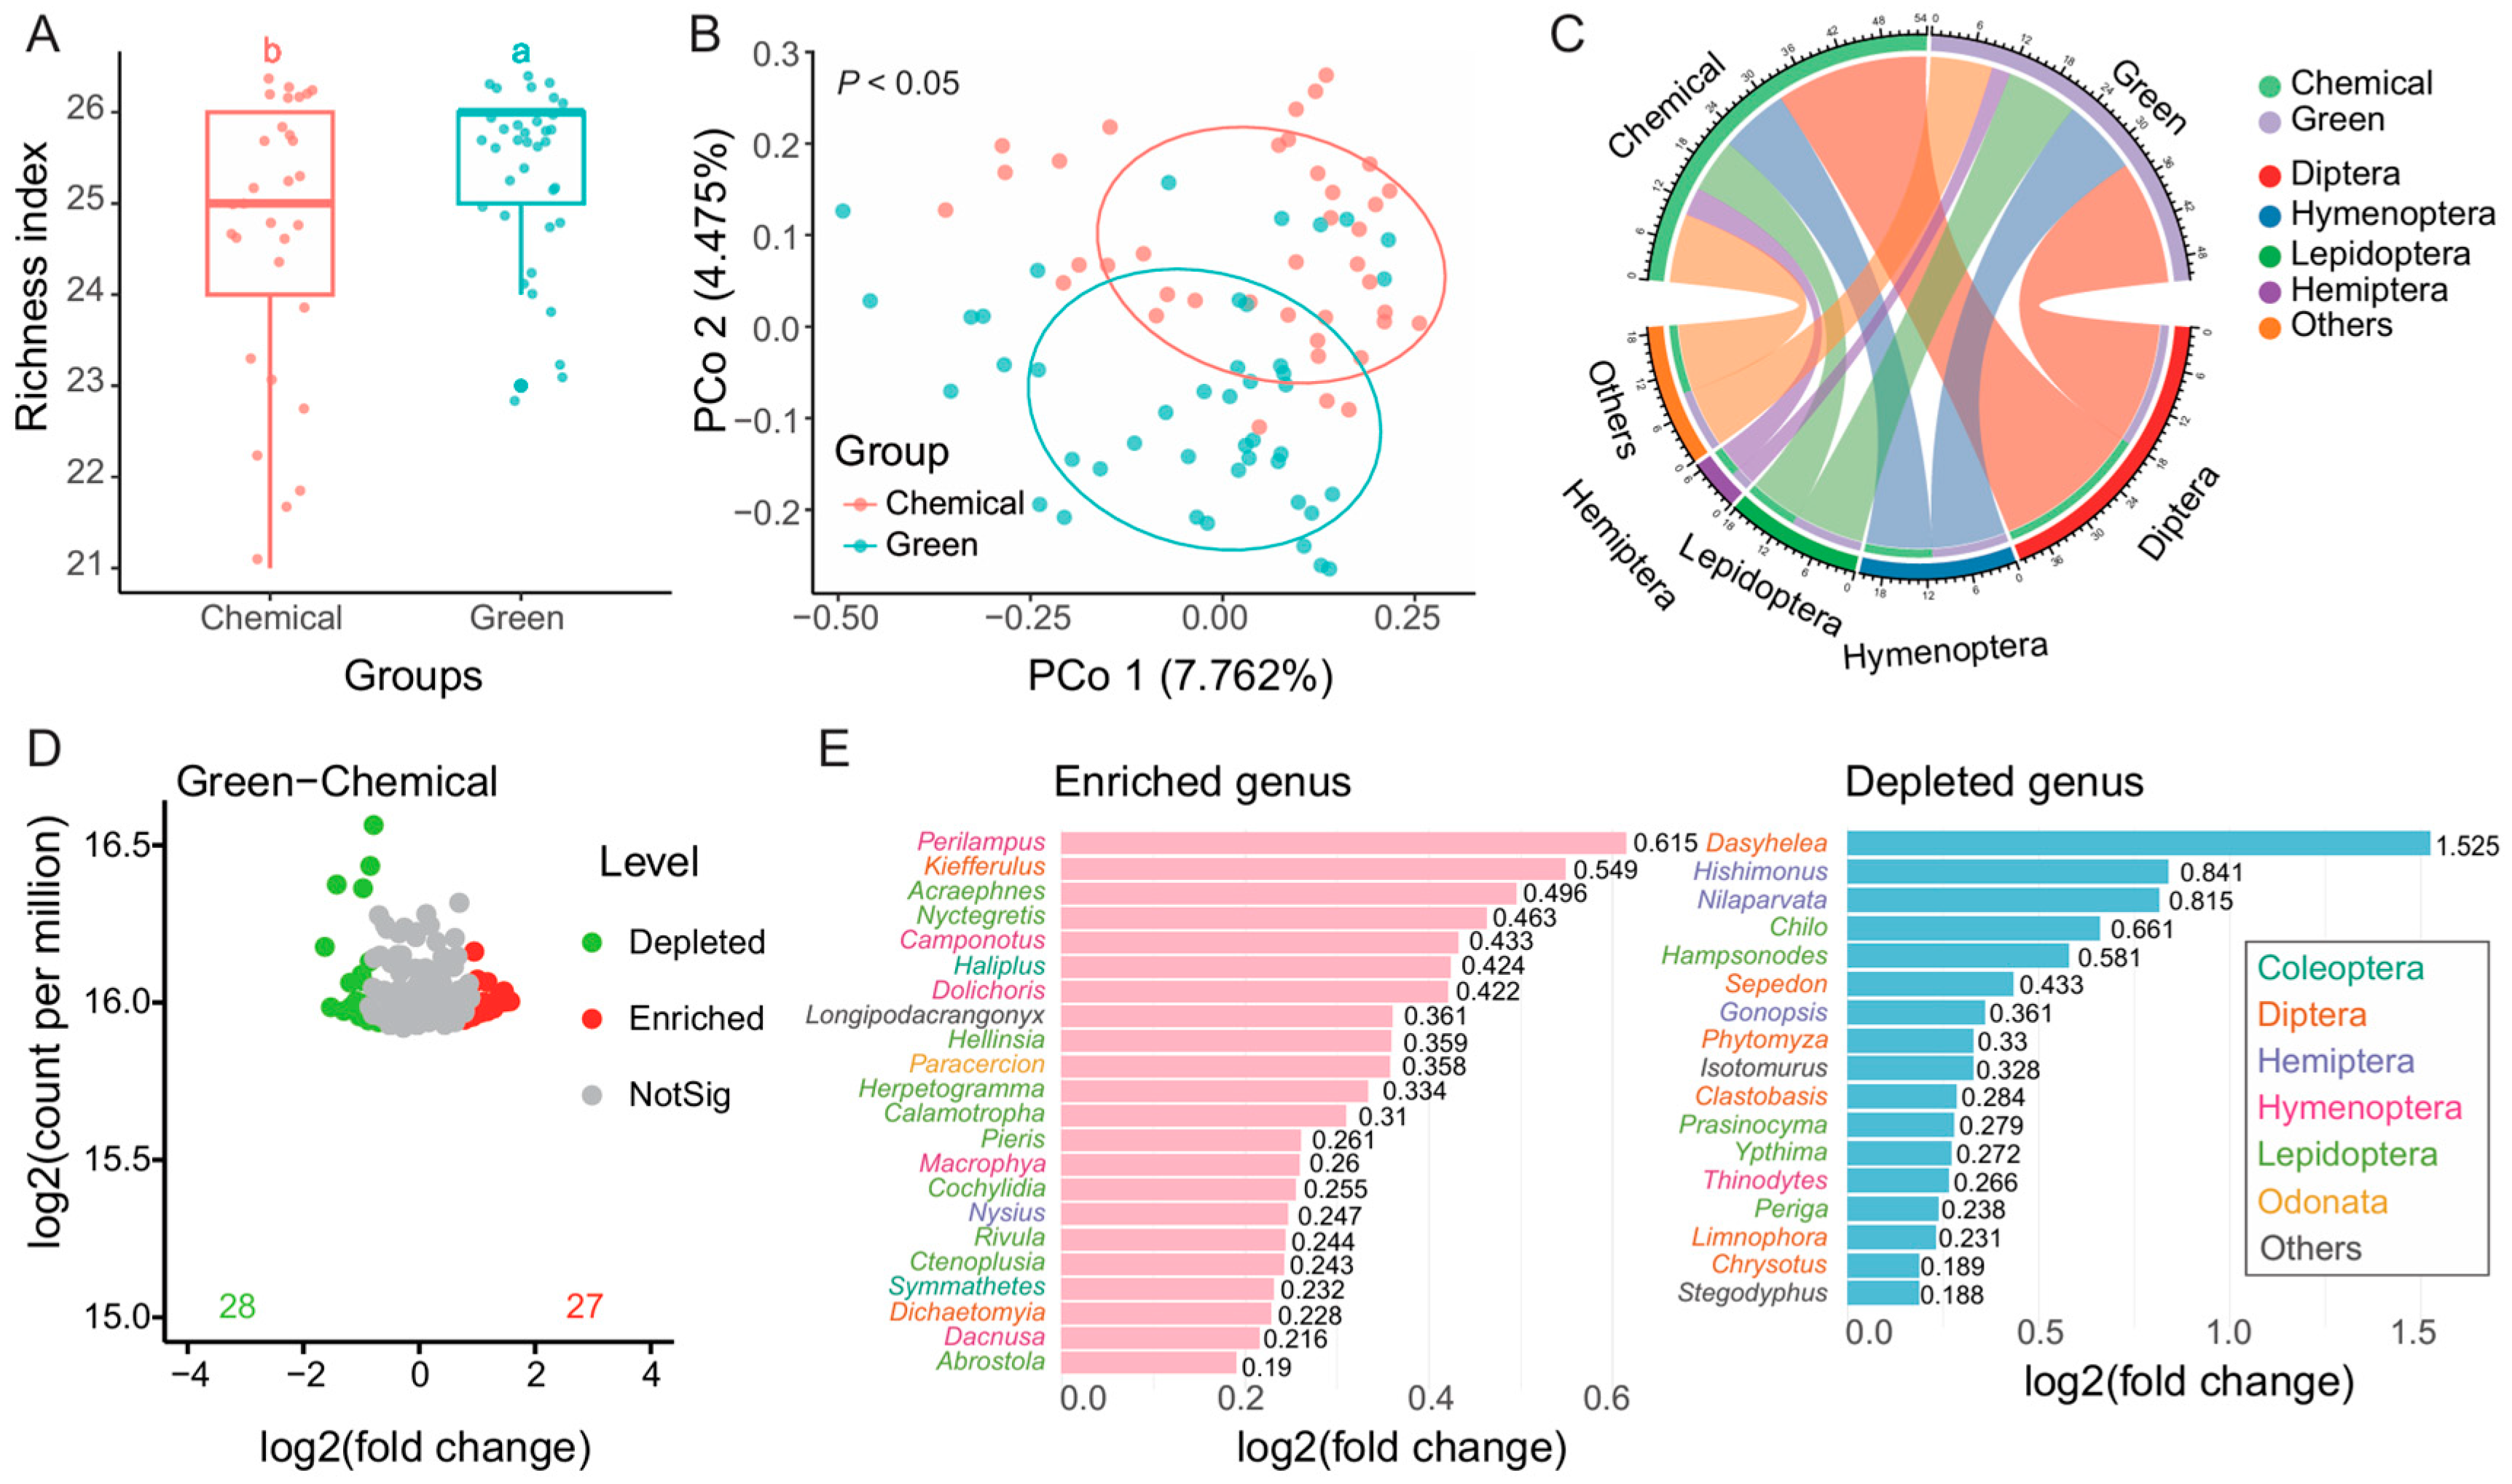
We compared the alpha and beta diversity across different fields (LP, SZ, LX, PW) in 2021, focusing on chemical control groups (LP, SZ) and green groups (LX, PW). No significant differences were observed in the Richness index (
Figure S1A) or beta diversity (
Figure S1B) within either the control (LP, SZ) or green (LX, PW) groups, indicating that our sampling was representative and that both groups exhibited reproducibility. We then analyzed the differences between the green groups (LX, PW) and the chemical control groups (LP, SZ). The green groups had a significantly higher Richness index compared to the chemical control groups (
Figure 3A), and their beta diversity was significantly distinct from the chemical control groups (
P < 0.05,
Figure 3B), although the explanation of the differences was limited. Diptera, Hymenoptera, Lepidoptera, and Hemiptera were the dominant order groups in both the chemical control and green groups (
Figure 3C).
To highlight the specific differences between the chemical control and green groups, we identified 28 OTUs that were depleted and 27 OTUs that were enriched in the green group compared to the chemical control group (
Figure 3C). To further examine these OTUs, we removed species classified only at the genus level and combined taxa within the same genus. This revealed 22 enriched genera and 17 depleted genera (
Figure 3D) in green group.
Perilampus (Hymenoptera, Perilampidae) was the most enriched genus in green group, while
Dasyhelea (Diptera, Ceratopogonidae) was the most enriched genus in chemical control group. Among these genera, those in the order of Hymenoptera were predominantly enriched in the green group, while genera in Diptera and Lepidoptera were more abundant in the chemical control group, showing higher log2 fold changes.
Additionally, there were no significant differences in the Richness index among different months across July, August, September, and October (
Figure S1C). However, beta diversity was primarily influenced by the month, with July showing significant differences compared to other months (
Figure S1D). We further compared differences between groups across different times (July, August to October). Although no differences in the Richness index were observed between groups at different times, the green group had higher values from August to October compared to the chemical control group (
Figure S1E). Significant differences in beta diversity were observed between groups and across different times, with beta diversity values being more similar along the PCo1 axis at different times (
Figure S1F), suggesting that community composition at these times was more alike based on the first principal coordinate. Notably, from August to October, the green group had a higher percentage of Hymenoptera species compared to other periods.
3.3. Green Groups Show Higher Sorghum Yield and Improved Grain Quality Trends
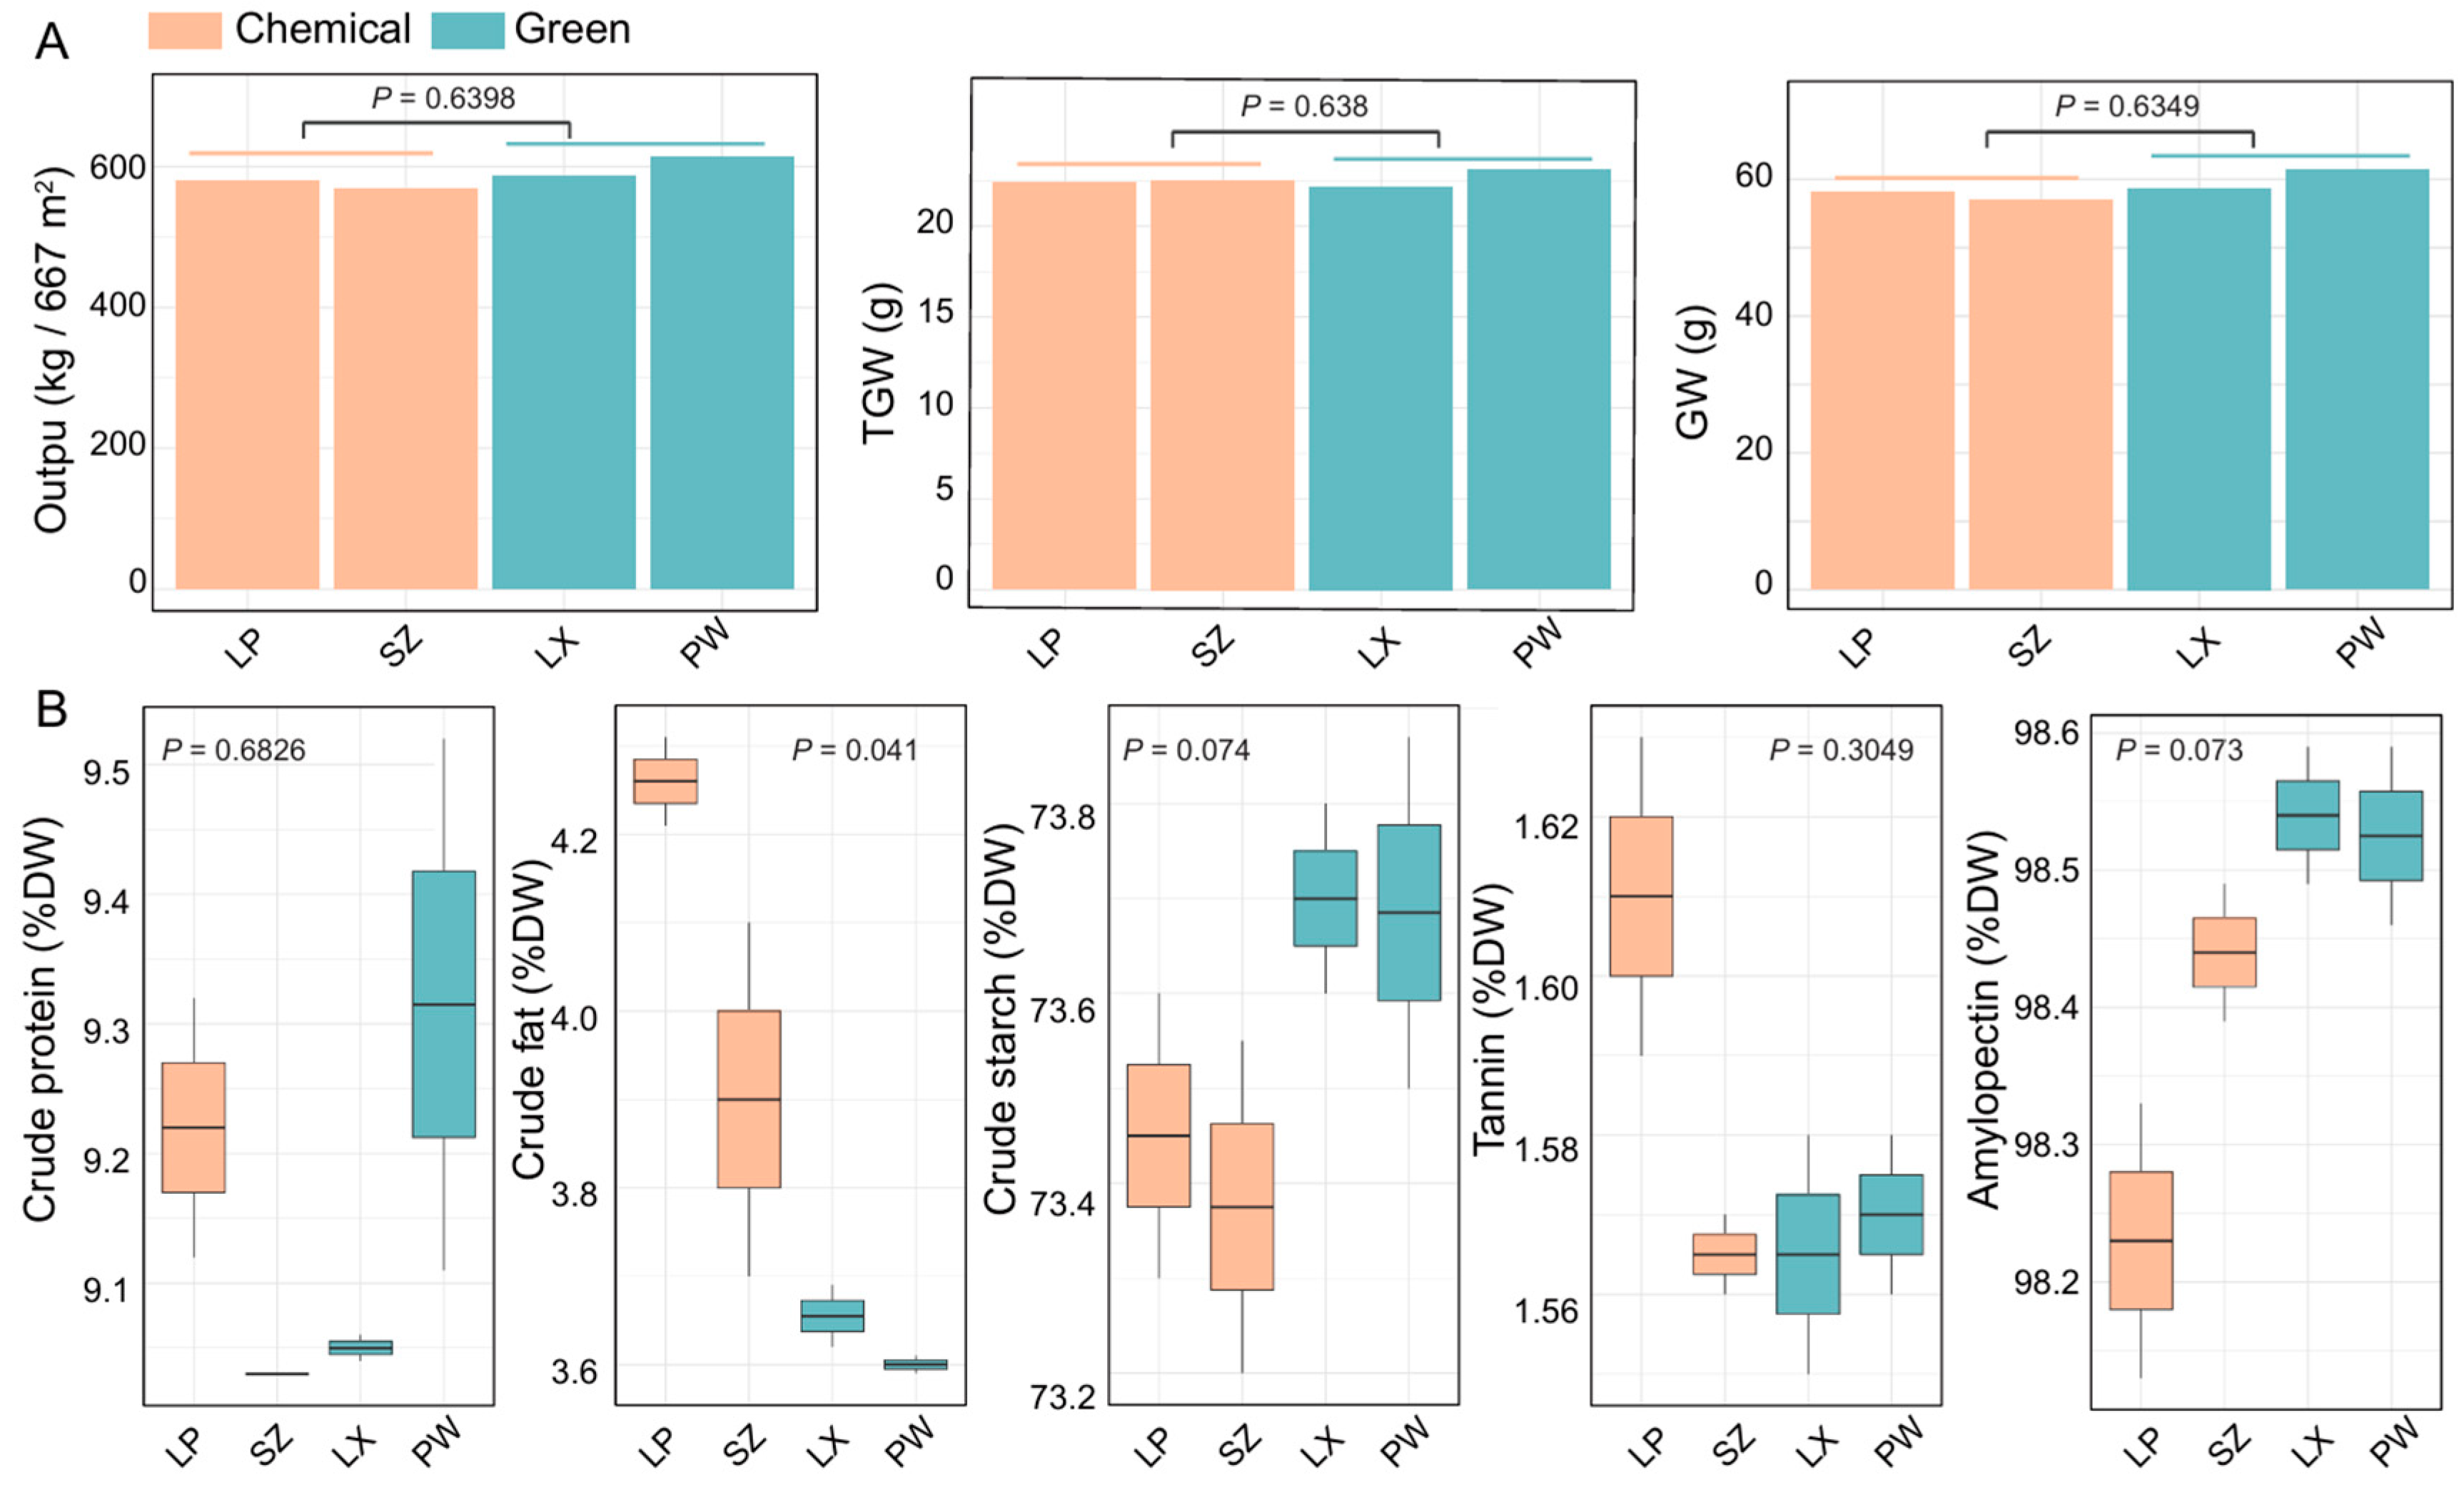
We then compared sorghum yield and quality between the green and chemical control groups using data from four locations (chemical control group: LP, SZ; Green group: LX, PW) for the years 2021-2022. To evaluate sorghum yield (
Figure 3A), we analyzed output (kg/667 m²), 1000-grain weight (g), and grain weight (g). Although no significant differences were observed between the groups, the green group showed higher average values, with output (557.30 kg/667 m²), 1000-grain weight (22.45 g), and grain weight (55.73 g) compared to the chemical control group’s average values of output (541.45 kg/667 m²), 1000-grain weight (22.30 g), and grain weight (54.15 g).
We also compared sorghum quality between the green and chemical control groups using the following metrics: crude protein content (% DW), crude fat content (% DW), crude starch content (% DW), tannin content (% DW), and amylopectin proportion of total starch (% DW). Here, DW stands for dry weight (
Figure 4B). Our analysis revealed that the green group had a significantly lower crude fat content compared to the chemical control group (
P = 0.041). Although no other metrics showed significant differences, the green group had higher average values for crude protein content (% DW), crude starch content (% DW), and amylopectin proportion of total starch (% DW), while the tannin content (% DW) was lower compared to the chemical control group (
Figure 4B).
4. Conclusion and Discussion
4.1. Arthropod Diversity Dynamics
Our analysis demonstrates that differences in arthropod diversity between years were more pronounced than differences between fields within the same year. However, we acknowledge that the limited number of sampling sites, traps, and the unbalanced sampling effort between years may influence the robustness and generalizability of our findings. To address these limitations, we have clarified that our results should be interpreted cautiously and emphasized the need for further research with expanded and balanced sampling designs to validate the observed trends.
The significant variation in arthropod diversity between 2021 and 2022, despite similar diversity within fields in a given year, highlights the influence of temporal factors on arthropod communities. In 2021, there was a distinct increase in the abundance of certain genera, such as Psychoda and Chironomus, particularly in the LP field. However, in 2022, Autherigona emerged as the dominant genus, with a substantial presence in the majority of samples. This variation underscores the importance of year-to-year fluctuations in species composition and community structure, which may be influenced by environmental changes or differences in agricultural management practices.
4.2. Impact of Green Pest Management on Arthropod Communities
Our comparison between green and chemical control groups revealed that green pest management practices lead to increased arthropod richness and a higher dominance of Hymenoptera. This play a crucial role in natural pest control and contribute significantly to ecosystem health (Fei et al., 2023; Stenberg, 2017; Zhou et al., 2024) The increased presence of Hymenoptera in green management fields suggests that these practices enhance ecosystem service provision, particularly through natural pest control mechanisms. Nowadays, Biological control through natural enemies, such as the use of parasitoids and predators, has become a key component of sustainable crop production systems (Cortez-Madrigal and Gutiérrez-Cárdenas, 2023; Ji et al., 2022). At our sampling sites, we also implemented the release of Trichogramma, a well-known biological control agent, to further support pest management (see Methods and Materials). The positive impact of green pest management on the abundance of Hymenoptera underscores the effectiveness of integrating natural enemies into pest control strategies.
4.3. Effects of Green Pest Management on Sorghum Quality
Our findings indicate that green pest management not only promotes increased arthropod diversity, particularly with a rise in Hymenoptera, but also has potential impacts on sorghum quality. While no significant differences in sorghum yield were observed between green and chemical control groups, the green group consistently exhibited higher average values in key quality metrics, including crude protein, crude starch, and amylopectin proportions, alongside a reduction in crude fat content. This raises the question of whether the shift in arthropod community structure, driven by green pest management, is influencing crop quality. Our findings might indicate that green pest management not only promotes increased arthropod diversity, particularly with a rise in Hymenoptera, but also has potential impacts on sorghum quality. While no significant differences in sorghum yield were observed between green and chemical control groups, the green group consistently exhibited higher average values in key quality metrics, including crude protein, crude starch, and amylopectin proportions, alongside a reduction in crude fat content. This raises the question of whether the shift in arthropod community structure, driven by green pest management, is influencing crop quality.
One possible mechanism behind these changes could be the increased abundance of beneficial Hymenoptera, such as parasitoids and pollinators, which enhance natural pest control and contribute to plant health. By reducing pest pressure, these insects may improve nutrient allocation in plants, affecting crop traits like protein and starch content. For instance, research has demonstrated that increased plant diversity may have positive effects on crop yield, while arthropod herbivory may be negatively impact yield (N’Woueni and Gaoue, 2022). Additionally, research into plant-insect interactions suggests that insect herbivory can alter plant biochemical pathways, influencing nutrient composition. Green pest management, by fostering a balanced arthropod community, may mitigate these negative effects of herbivory.
Although the exact mechanisms are not fully understood, promoting beneficial arthropods through sustainable pest control strategies likely enhances ecological processes that support plant health, contributing to the observed improvements in crop quality (Cortez-Madrigal and Gutiérrez-Cárdenas, 2023; Stenberg, 2017). Our study supports the idea that biodiversity, driven by practices like green pest management, plays a crucial role in improving both ecosystem services and crop performance. This aligns with broader research advocating for sustainable agriculture practices to enhance long-term yield and quality. Future research should focus on the detailed ecological interactions between arthropod communities, plant health, and crop quality to better understand the mechanisms behind these benefits.
Additionally, future studies should aim to include a greater number of sites and replicates within each treatment type to disentangle treatment effects from site-specific environmental factors. This would help address the limitations of spatial and environmental variability, ensuring a more robust and comprehensive understanding of how pest management strategies influence arthropod communities and agricultural outcomes. Expanding sampling efforts across diverse geographic regions and temporal scales will also provide greater insight into the consistency and generalizability of these findings.
Supplementary Materials
The following supporting information can be downloaded at the website of this paper posted on Preprints.org.
Author Contributions
All authors contributed to the writing, and read and approved the final manuscript.
Data Availability Statament
All data and drawing code are provided in the paper and supplementary materials. The raw sequence data project had been deposited at GenBank under BioProject accession number PRJNA1156354, and the SRR numbers were from SRR30663504 to SRR30663512.
Acknowledgments
This work was financially supported by the Suqian Sci & Tech Program (No. K202215), the Key Research and Development Program of Jiangsu Province (Grant No. BE2023345), and the ‘333 High-Level Talents Training Project’ in Jiangsu Province.
Conflicts of Interest
The authors declare that they have no conflicts of interest.
References
- Alyokhin, A.; Nault, B.; Brown, B. Soil conservation practices for insect pest management in highly disturbed agroecosystems – a review. Èntomol. Exp. et Appl. 2019, 168, 7–27. [Google Scholar] [CrossRef]
- Baker, B.P.; Green, T.A.; Loker, A.J. Biological control and integrated pest management in organic and conventional systems. 140, 1040; 95. [Google Scholar] [CrossRef]
- Bik, H.M. Just keep it simple? Benchmarking the accuracy of taxonomy assignment software in metabarcoding studies. Mol. Ecol. Resour. 2021, 21, 2187–2189. [Google Scholar] [CrossRef]
- Bolger, A.M.; Lohse, M.; Usadel, B. Trimmomatic: A flexible trimmer for Illumina sequence data. Bioinformatics 2014, 30, 2114–2120. [Google Scholar] [CrossRef] [PubMed]
- Cortez-Madrigal, H.; Gutiérrez-Cárdenas, O.G. Enhancing biological control: conservation of alternative hosts of natural enemies. Egypt. J. Biol. Pest Control. 2023, 33, 1–13. [Google Scholar] [CrossRef]
- Dabija, A.; Ciocan, M.E.; Chetrariu, A.; Codină, G.G. Maize and Sorghum as Raw Materials for Brewing, a Review. Appl. Sci. 2021, 11, 3139. [Google Scholar] [CrossRef]
- de Sena, B.G. , and Smith, A.D. (2019). Falco: high-speed FastQC emulation for quality control of sequencing data. F1000Research 8, 1-22.
- Eitzinger, B. , Abrego, N., Gravel, D., Huotari, T., Vesterinen, E.J., and Roslin, T. (2019). Assessing changes in arthropod predator–prey interactions through DNA-based gut content analysis—variable environment, stable diet. Molecular Ecology 28, 266-280.
- Elbrecht, V.; Taberlet, P.; Dejean, T.; Valentini, A.; Usseglio-Polatera, P.; Beisel, J.-N.; Coissac, E.; Boyer, F.; Leese, F. Testing the potential of a ribosomal 16S marker for DNA metabarcoding of insects. PeerJ 2016, 4, e1966–e1966. [Google Scholar] [CrossRef]
- Fei, M.; Gols, R.; Harvey, J.A. The Biology and Ecology of Parasitoid Wasps of Predatory Arthropods. Annu. Rev. Èntomol. 2023, 68, 109–128. [Google Scholar] [CrossRef] [PubMed]
- Flomer, O. (1994). DNA primers for amplification of mitochondrial cytochrome c oxidase subunit I from diverse metazoan invertebrates. Mol Mar Biol Biotech 3, 294-299.
- Ganapathy, K.N. , Rao, B.D., Rakshit, S., Gnanesh, B.N., and Patil, J.V. (2015). Sorghum for health and business. Sustainable agriculture reviews: Cereals, 173-196.
- Guo, C. , Cui, W. ( 2011). Sorghum insect problems and Managementf. Journal of integrative plant biology 53, 178–192.
- Harris-Shultz, K.; Knoll, J.; Punnuri, S.; Niland, E.; Ni, X. Evaluation of strains of Beauveria bassiana and Isaria fumosorosea to control sugarcane aphids on grain sorghum. Agrosystems, Geosci. Environ. 2020, 3. [Google Scholar] [CrossRef]
- Hebert, P.D. , Cywinska, A., Ball, S.L., and DeWaard, J.R. (2003). Biological identifications through DNA barcodes. Proceedings of the Royal Society of London Series B: Biological Sciences 270, 313-321.
- Hendrichs, J. , Vreysen, M., Enkerlin, W., and Cayol, J. (2021). Strategic options in using sterile insects for area-wide integrated pest management. In Sterile insect technique (CRC press), pp. 841-884.
- Ji, S.; Gong, J.; Cui, K.; Zhang, Y.; Mostafa, K. Performance Test and Parameter Optimization of Trichogramma Delivery System. Micromachines 2022, 13, 1996. [Google Scholar] [CrossRef] [PubMed]
- Liu, Y.-X. , Chen, L., Ma, T., Li, X., Zheng, M., Zhou, X., Chen, L., Qian, X., Xi, J., Lu, H., et al. (2023). EasyAmplicon: An easy-to-use, open-source, reproducible, and community-based pipeline for amplicon data analysis in microbiome research. iMeta 2, e83.
- Magoč, T.; Salzberg, S.L. FLASH: fast length adjustment of short reads to improve genome assemblies. Bioinformatics 2011, 27, 2957–2963. [Google Scholar] [CrossRef] [PubMed]
- Magurran, A.E. Measuring biological diversity. 31, 1174. [Google Scholar] [CrossRef]
- McMurdie, P.J.; Holmes, S. phyloseq: An R package for reproducible interactive analysis and graphics of microbiome census data. PLoS ONE 2013, 8, e61217. [Google Scholar] [CrossRef]
- Mundia, C.W.; Secchi, S.; Akamani, K.; Wang, G. A Regional Comparison of Factors Affecting Global Sorghum Production: The Case of North America, Asia and Africa’s Sahel. Sustainability 2019, 11, 2135. [Google Scholar] [CrossRef]
- N’woueni, D.K.; Gaoue, O.G. Plant Diversity Increased Arthropod Diversity and Crop Yield in Traditional Agroforestry Systems but Has No Effect on Herbivory. Sustainability 2022, 14, 2942. [Google Scholar] [CrossRef]
- Neuwirth, E. , and Neuwirth, M.E. (2014). Package ‘RColorBrewer’. ColorBrewer palettes 991.
- Poudel, S.; Poudel, B.; Acharya, B.; Poudel, P. PESTICIDE USE AND ITS IMPACTS ON HUMAN HEALTH AND ENVIRONMENT. Environ. Ecosyst. Sci. 2020, 4, 47–51. [Google Scholar] [CrossRef]
- “Critical peak pricing-San Diego Gas & Electric,” https://www. sdge.com/businesses/savings-center/energy-management-programs/ demand-response/critical-peak-pricing, accessed: 2022-03-04.
- Rognes, T.; Flouri, T.; Nichols, B.; Quince, C.; Mahé, F. VSEARCH: A versatile open source tool for metagenomics. PeerJ 2016, 2016, e2584. [Google Scholar] [CrossRef]
- Shannon, C.E. (2001). A mathematical theory of communication. ACM SIGMOBILE mobile computing and communications review 5, 3-55.
- Skvarla, M.J. , Larson, J. P. ( 2021). A review of terrestrial and canopy Malaise traps. Annals of the Entomological Society of America 114, 27–47.
- Stenberg, J.A. A Conceptual Framework for Integrated Pest Management. 22. [CrossRef]
- Suchan, T.; Talavera, G.; Sáez, L.; Ronikier, M.; Vila, R. Pollen metabarcoding as a tool for tracking long-distance insect migrations. Mol. Ecol. Resour. 2018, 19, 149–162. [Google Scholar] [CrossRef]
- Tamhane, V.A.; Sant, S.S.; Jadhav, A.R.; War, A.R.; Sharma, H.C.; Jaleel, A.; Kashikar, A.S. Label-free quantitative proteomics of Sorghum bicolor reveals the proteins strengthening plant defense against insect pest Chilo partellus. Proteome Sci. 2021, 19, 1–25. [Google Scholar] [CrossRef] [PubMed]
- Wickham, H. (2011). ggplot2. Wiley interdisciplinary reviews: computational statistics 3, 180-185.
- Xia, H.; Zhang, Z.; Luo, C.; Wei, K.; Li, X.; Mu, X.; Duan, M.; Zhu, C.; Jin, L.; He, X.; et al. MultiPrime: A reliable and efficient tool for targeted next-generation sequencing. iMeta 2023, 2, e143. [Google Scholar] [CrossRef]
- Xing-Lin, H.; De-Liang, W.; Wu-Jiu, Z.; Shi-Ru, J. The production of the Chinese baijiu from sorghum and other cereals. J. Inst. Brew. 2017, 123, 600–604. [Google Scholar] [CrossRef]
- Zhou, W.; Arcot, Y.; Medina, R.F.; Bernal, J.; Cisneros-Zevallos, L.; Akbulut, M.E.S. Integrated Pest Management: An Update on the Sustainability Approach to Crop Protection. ACS Omega 2024, 9, 41130–41147. [Google Scholar] [CrossRef] [PubMed]
|
Disclaimer/Publisher’s Note: The statements, opinions and data contained in all publications are solely those of the individual author(s) and contributor(s) and not of MDPI and/or the editor(s). MDPI and/or the editor(s) disclaim responsibility for any injury to people or property resulting from any ideas, methods, instructions or products referred to in the content. |
© 2024 by the authors. Licensee MDPI, Basel, Switzerland. This article is an open access article distributed under the terms and conditions of the Creative Commons Attribution (CC BY) license (http://creativecommons.org/licenses/by/4.0/).