
Submitted:
17 December 2024
Posted:
18 December 2024
You are already at the latest version
Abstract
The use of insecticides is widespread in the control of debilitating mosquito-borne diseases. P450 enzymes (CYPs) play essential roles in mosquito physiological function but also in the enzymatic detoxification of xenobiotics. Broadly speaking, CYPs can be classified as “stable”, meaning those that have no or very few paralogs, and “labile” constituting gene families with many paralogous members. The evolutionary dichotomy between “stable” and “labile” P450 genes is fuzzy and there is not a clear phylogenetic demarcation between P450s involved in detoxification and P450s involved in essential metabolic processes. In this study, bioinformatic methods were used to ex-plore differences in the sequences of “stable” and “labile” P450s that may facilitate their func-tional classification. Genomic and sequence data of Anopheles gambiae (Agam), Aedes aegypti (Aaeg) and Culex quinquefasciatus (Cqui) CYPs were obtained from public databases. The results of this study show that “stable” CYPs are encoded by longer genes, have longer introns and more exons, and contain a higher proportion of hydrophobic amino acids than “labile” CYPs. Com-pared to “labile” CYPs, a significantly higher proportion of “stable” CYPs are associated with biosynthetic and developmental processes.
Keywords:
A. gambiae
; A. aegypti
; C. quinquefasciatus
; CYP
; P450
; genomic and protein properties
; gene enrichment
1. Introduction
Mosquitos are infectious disease vectors having a profound impact on human health. Anopheles mosquitoes transmit the parasite Plasmodium falciparum, the causative agent of malaria, Aedes aegypti is the vector of transmission of yellow fever, and Culex mosquitoes transmit West Nile virus and Saint Louis encephalitis virus, as well as the nematode that causes lymphatic filariasis. In the absence of vaccines for these diseases, insecticides are widely applied as a means of mosquito control. This strategy has limitations in that insecticides are not only highly ecotoxic but are also becoming increasingly ineffective due to acquired resistance of the targeted insects. Resistance is mediated not only by mutations in the target insect receptors but also through insecticide detoxification. Cytochrome P450 enzymes have been shown to be essential for insect development and survival but, probably a larger number of P450s are involved in insecticide metabolism and resistance.
Cytochrome P450 enzymes, also known as CYPs, are haem-containing monooxygenases found in all kingdoms of life [1]. They first appeared in the scientific literature in 1958 [2].The Pfam database of protein families and domains classifies CYPs as a distinct family of enzymes (Pfam entry PF00067) involved in the oxidative degradation of various compounds [3]. In P450s, the haem iron forms a pentacoordinate system with the axial sulphur of a conserved cysteine (Cys) protein amino acid residue in the active site of the enzyme [4]. The conserved Cys residue exists as a thiolate anion giving a characteristic absorption band of 450 nm which is also typical of the spectral properties of other cytochromes such as the b-type haem-proteins haemoglobin and myoglobin. However, unlike these cytochromes, CYP monooxygenases are not electron-transfer proteins and function in the presence of redox partners, usually NAD(P)H-dependent ferredoxin or FAD- and FMN- containing CPR-type reductases by transferring molecular oxygen to -CH, -NH and -SH moieties of substrates with concomitant reduction of the oxygen atom to water [5]. Consequently, a more appropriate term for CYP enzymes would be P450 ‘haem-thiolate’ or P450 monooxygenase proteins rather than cytochrome P450s.
CYPs show an extraordinary diversity in their reaction chemistry. In mammals, they participate in oxidative, peroxidative and reductive metabolism of numerous endogenous compounds such as fatty acids, cholesterol, steroids, retinoids, vitamin derivatives, bile acids, porphyrins, thromboxane A2, prostacyclins, eicosanoids and other lipid mediators. In plants, they are involved in the secondary metabolism of, amongst others, phenolic compounds, alkaloids, gibberellins. The diversity of biosynthetic reactions catalysed by P450 is reviewed by Fujiyama, et al. [6]. Last but not least, CYPs metabolise an enormous range of xenobiotics and endobiotics including drugs, insecticides, environmental chemicals and pollutants, as well as natural plant products, and bacterial metabolites. P450s are involved in the metabolic detoxification of xenobiotics (phase I metabolism). This involves the addition or unmasking of polar groups, such as such hydroxy, amine or sulphydryl groups, in the xenobiotic substrate followed by hydrolysis, oxidation or reduction. The resultant reaction intermediates are then further metabolised by phase II enzymes, mainly, glutathione-S-transferases [7], and transported into the extracellular space through interactions with transmembrane proteins (phase IIII), mainly ATP-Binding Cassette (ABC) Transporters [8].
By 2018, more than 300,000 CYP sequences had been mined and collected in all areas of the tree of life [9] but the precise function of individual CYP proteins remains largely unknown. It is estimated that only 0.2% of the genes deposited in different databanks have been functionally characterised [10,11]. CYPs were first classified into distinct groups by Nerbert and Gonzalez in 1987. Following phylogenetic criteria, gene organisation and sequence similarity, CYPs are grouped into kingdom-specific clusters, named clans, each of which represent genes that diverged from a single common ancestor and can include one or multiple families [12,13]. Generally, groups of proteins having amino acid identity over 40% are assigned to the same family, whereas proteins having identity above 55% are allocated to the same subfamily. Gene families that repeatedly cluster in the same phylogenetic clade are grouped into the same clan. In this classification scheme a family-specific number is given after the root symbol CYP, followed by a letter and a number indicative of the subfamily and the gene, respectively. Clans can consist of one or multiple families and are given the name of the smallest family number present in the clade. For example, if a single clade in phylogenetic analysis comprises the CYP7, CYP8 and CYP39 families, these families become part of clan 7 [14]. Clan-based classification can be volatile and the addition of new, more distant sequences can lead to interleaved branches obscuring the boundaries between different classes [15].
Amongst animals, insects constitute the taxon with most P450 genes, which are grouped into six clans, namely, CYP2, CYP3, CYP4, CYP16, CYP20 and mitochondrial (mito). Two clans, CYP16 and CYP20, are restricted to certain species in Apterygota and Paleoptera [11]. Mosquitoes, second only to the deer tick (Ixodes scapularis), have a disproportionately large number of P450 genes [16,17]. CYP protein coding genes in the diptera D. melanogaster (Dmel), A. gambiae (Agam), A. aegypti (Aaeg) and C. quinquefasciatus (Cqui) form groups in Clans 2, 4, 6 and the mitochondrial clan. The number of CYPs populating each clan vary considerably (Table 1).
Gene assignment to clans and families may change with each new genome release and be further complicated by the fact that genomes can consist of different numbers of CYPs found in natural populations [20]. CYP assignment discrepancies may also arise from genome annotations differing in the coverage and quality of assembly of sequenced genomes, or due to homozygosity and polymorphisms in gene copy numbers [17,21].
Genes of the CYP2 and mitochondrial clans are relatively conserved and they form many families with few or even single members. Members of these clans have been shown to participate in core developmental and physiological functions and their evolution is well conserved with many families having few or even single members [15,22]. CYP clans 3 and 4 are by far the most populated due to lineage-specific gene amplification of paralogs or “phylogenetic blooms” [20,23]. These “blooms” are thought to result in response to environmental stimuli and, in particular, to the selection pressure exerted by polluted habitats and, in particular, due to the widespread application of chemical insecticides [18,24].
Phylogenetic studies have shown that the expansion of the P450 gene repertoire is shaped by gene duplication, gene birth and death, and gene neo-functionalisation [20]. These events are driven by selection acting on what is available at the time and can be described by a power law typical of simple birth and death models. An implication of this model is that CYPs may switch their function from physiology to detoxification and vice versa [16] or that some CYPs genes may be functionally redundant [25].
Yet some CYPs may deviate from this stochastic evolutionary model and a small number of CYPs have been shown to be “stable” in evolutionary terms, as for example in D. melanogaster, where 31 such “stable” genes have been identified [26]. Amongst these are the so-called “Halloween” genes, such as spook (spo), phantom (phm), disembodied (dib), shadow (sad), spookier (spok) and spookiest. These genes are essential for the biosynthesis of moulting hormones [27]. Functional investigation in different tissues of D. melanogaster, using RNAi screens, revealed that knockdown of 9 of these CYPs, resulted in lethality [28]. In the light of this evidence, it has been proposed that natural selection may also act on copy number polymorphisms within a species. Although this “selectionist” model has been contested, it is agreed that “conserved orthologous genes” are present in some phylogenetic branches of CYPs [11].
Regardless of evolutionary model, it is still not possible to distinguish phylogenetic branches related to essential physiological and developmental functions from those related to detoxification. Even in the case of D. melanogaster which serves as a model organism, well over 60% of the total number of P450s are “orphan” in terms of functional characterisation [29]. Likewise, phylogenetic branches of CYPs cannot be assigned ubiquitous xenobiotic detoxification functions as (i) different CYPs respond to insecticide selection in different mosquito populations and geographical regions [30], and (ii) CYPs are also known to play an indirect role in insecticide resistance [31,32]. As a result, susceptible and resistant strains with a common genetic background are usually not available to compare, and susceptible reference strains are biased by geographic variation or genetic drift. This makes attempts to identify one or a few metabolic genes associated with insecticide adaptation difficult or even futile [33,34].
“Gene essentiality” refers to those genes where a single gene–knockout results in lethality or severe loss of fitness. Earlier work has established that essential and non-essential genes can be recognised on the basis of their respective physical, chemical and evolutionary properties [35,36,37,38]. Based on this, bioinformatic methods were used to differentiate “stable” from “labile” mosquito P450s. Given that “stable” CYP genes may also be involved in auxiliary, non-essential, metabolic networks the analogy with “gene essentiality” may be tentative.
2. Materials, Methods and Datasets
CYPs identified in the sources specified in Table 1 were submitted to VectorBase [39] to source genomic and protein data and CYPs with ambiguous annotations were removed. The total number of CYPs in the dataset was 486 (SI1.xlsx). These were mapped onto 83 ortholog groups derived from OrthoMCL [40,41]. The latter is a genome-scale algorithm for the identification of orthologous protein sequences and provides not only groups shared by two or more species/genomes, but also groups representing species-specific gene expansion families [40,41]. The dataset was further split into two subsets, one of which included CYPs with zero or up to three paralogs and one that included CYPs with four or more paralogs (Supplementary Information 1). The division is based on earlier work with D. melanogaster CYPs in which genes with up to three duplications were shown to derive from evolutionarily stable clades, and genes with more than three duplications from “dynamic/unstable” clades. In this paper, the term “labile” is used in preference to “dynamic/unstable” [26].
Redundancy reduction. Each subset was purged by removing genes/proteins having sequence similarity > 70%. Redundancy reduction is necessary to avoid undesirable bias in statistical analysis arising from the presence of multiple copies of similar genes/proteins [42]. SkipRedundant of the EMBOSS suite of bioinformatics tools [43] was used to obtain non-redundant (culled) datasets, one from the “stable” and “labile” subsets. The numbers of CYPs in each of the resulting subsets is summarised in Table 2.
Gene and protein sequence-based features. The gene, protein, functional features and bioinformatic methods used to characterise “stable” and “labile” P450 are summarised in Table 3.
Protein sequence properties. The length of our “stable” and “labile” proteins was obtained from VectorBase. The EMBOSS program Pepstats (https://www.ebi.ac.uk/jdispatcher/seqstats/emboss_pepstats) was used to obtain statistics of a number of properties of FASTA formatted protein sequences. These attributes include: molecular weight, number of residues, charge, isoelectric point, and amino acid composition. Hydrophobicity was determined by multiplying the frequency of each amino acid in each P450 with its Kyte and Doolitttle hydropathicity index [47] and summing up the resulting values.
Pepstats groups amino acids into nine categories: Tiny (A, C, G, S and T); Small (A, B, C, D, G, N, P, S, T and V); Aliphatic (I, L and V); Aromatic (F, H, W and Y); Non-polar (A, C, F, G, I, L, M, P, V, W and Y); Polar (D, E, H, K, N, Q, R, S, T and Z); Charged (B, D, E, H, K, R and Z); Basic (H, K and R) and Acidic (B, D, E, Z). Pepstats was run with the default parameters setting. MATLAB scripts were used to extract features values from the output files and determine corresponding statistical values (MATLAB. (2024). Version R2024a. Natick, Massachusetts: The MathWorks Inc.).
Genomic properties. Genomic data (gene, CDS, intron/exon lengths) were obtained from VectorBase. %CG content data were obtained from the Ensembl Metazoa release 60 (http://metazoa.ensembl.org/index.html). For genes with multiple transcripts, the longest length transcript was used to determine the number of exons and total exon length. The intron length of a gene was calculated by subtracting the total exon length from the corresponding gene length.
Phosphorylation. Protein phosphorylation was predicted using PhosNet 3.0 [44]. The program predicts serine, threonine or tyrosine phosphorylation sites in eukaryotic proteins using neural networks. Kinase-specific predictions were used for serine and threonine, and generic predictions were used for tyrosine. In all cases, the confidence score used was > 0.7.
Signal peptides, transmembrane domains and protein localisation. Signal peptides, transmembrane domains and protein subcellular localisations were predicted using BUSCA [45]. The program runs as a web server which integrates several resources to predict sub-cellular localisation including protein feature predictors (DeepSig, TPPred3, PredGPI, BetAware and ENSEMBLE3.0) and protein localisation predictors (MemLoci, BaCelLo, SChloro). In addition, BUSCA annotates relevant protein features, such as signal/transit peptides, GPI anchors and transmembrane domains.
Gene ontology terms. GO term enrichment was obtained using the web-based application NetGO 3.0. The program predicts molecular function ontology from sequence using protein language models [46]. NetGO addresses shortcomings of GO functional annotations and is considered as one of the best methods at predicting function ontology [48,49]. Contextual visualisation of the GO terms was performed using GOATOOLS [50].
Statistical analysis. Statistical tests were carried out throughout using the statistics toolbox of MATLAB. The sequence properties did not show a normal distribution and the statistical significance of each property was determined using the two-tailed nonparametric Wilcoxon rank sum test. The test is equivalent to a Mann-Whitney U-test. Statistical significance was determined at the 0.05 level and the Bonferroni correction was applied to calculate corrected p-values. The Chi–squared (χ2) test was also carried out to check whether the frequencies of a particular feature in “stable” and “labile” genes differ from each other.
3. Results
3.1. Analysis of Genomic Features
Gene length, %CG content, transcript and exon numbers, as well as intron and exon lengths were analysed in all datasets. The results are shown in Table 4. Compared to “labile” P450s, “stable” genes were shown to be generally longer and have a greater number of exons. The opposite is true for intron lengths, where introns in the “labile” dataset are on the average considerably shorter (Table 4). The same trends are observed in the subsets of “culled” genes (Figure 1). The GC content of the “stable” CYPs is less than that of the “labile” CYPs but the difference may not be statistically significant.
3.2. Analysis of Protein Features
Protein average molecular weight, charge, isoelectric point and frequencies of different amino acid categories were analysed statistically to determine significant differences in the two groups of P450 (Table 5). “Labile” proteins were found to have greater proportions of acidic, basic, charged and polar amino acids. In the case of charged amino acids, the p-value in the culled dataset was marginally above the Bonferroni correction. “Stable” proteins had a higher median value for aliphatic amino acids and hydrophobicity. Differences between the protein features examined follow the same trend in the culled datasets (Figure 2).
Variations in the frequencies of amino acids found in “stable” and “labile” P450s are shown in Table 6. Statistically significant variations were observed in 11 amino acids (8 in the culled dataset). The relative proportion of Cys, Arg, Leu, and Trp is higher in “stable” P450s, and that of Glu, Lys, and Met higher in “labile” proteins. Variations in four of these (Ala, His) were not statistically significant in culled datasets of proteins.
3.3. Phosphorylation
Protein phosphorylation plays crucial roles in the regulation of cellular and metabolic processes such as cell differentiation and cell division. Cytochrome P450 have been shown to be subject to phosphorylation mediated by different protein kinases, cAMP-dependent protein kinase A being the most prominent one. In insects, phosphorylation is thought to play a role in the control of genotoxic metabolites [51]. P450 phosphorylation was predicted using NetPhos-3.1 [44] (SI2.xlsx). The median number of phosphorylated residues was 3 with the exception of threonine in the unculled “labile” dataset (median=4). The statistical differences between “labile” and “stable” P450s in the culled and unculled datasets were not statistically significant.
3.4. Signal Peptides, Transmembrane Domains, and Protein Location
Insect P450s are transmembrane proteins bound either to the endoplasmic reticulum (ER) or the inner mitochondrial membrane by means of the N-terminal transmembrane helix (TMH) [52]. In mitochondrial CYPs, the N-terminal anchor is missing. Instead, a topogenic sequence present at the nascent enzyme serves as a signal peptide to ensure the enzyme is transported and incorporated into the mitochondrial membrane [53]. Both transmembrane and mitochondrial P450s share the same fold and very similar tertiary structures [54]. The transmembrane domains usually adopt an α-helical structure while passing through the lipid bilayer once (single-pass proteins) or multiple times (multiple-pass proteins). In non-mitochondrial P450s, the catalytic domain of the enzyme is on the cytosolic side of ER and the N-terminus α-helix protrudes on the luminal side of ER. This posture of CYPs in relation to the membrane is stabilised by hydrophobic interactions between the residues of the N-terminal helix and the lipophilic ER environment. The N-terminal anchor has been associated with CYP trafficking into the ER or mitochondria, in interactions with different phospholipids, and as a mediator of CYP heteromer formation.
Signal peptides, subcellular localisation and number of transmembrane helices were predicted using BUSCA [45] (SI3.pdf). A summary of the results is given in Table 7. All CYPs were predicted to have at least two transmembrane domains. Approximately 80% of CYPs, both in the unculled and culled datasets, were predicted to lack the N-terminal helix. The differences between the datasets were not statistically significant.
3.5. Gene Enrichment Analysis
Gene Ontology (GO) [55]enables the classification of gene functions through the application of controlled vocabularies (ontology) to annotate the functional properties of gene and gene products across species. Each GO term is annotated with information which includes the type of gene product (e.g., protein, tRNA, etc.) and an evidence code describing the type of evidence (e.g., experimental, phylogenetic, text mining etc.). Annotations that are not curated manually are described as ‘IEA’ (inferred from electronic annotation). GO is structured as a graph comprising nodes representing each GO term. Edges between the nodes represent relationships between terms. The GO graph is hierarchical with ‘parent’ and ‘child’ terms, but unlike strict hierarchy, a given term may have more than one ‘parent’. Genes are annotated by (a) molecular function (b) cellular component and (c) biological process. One of the most common methods to perform GO term gene-set enrichment analysis is through the identification of common functions in a group of genes by means of over-representation analysis (ORA). The method compares the GO terms corresponding to a test list of genes to the functions of selected background genes (for example, a database with functionally annotated genes). If the number of functions in the test list is greater than the number of functions obtained by chance, then these functions are considered to be over-represented.
NetGO 3.0 [46] was used to predict enrichment of GO terms of the “stable” and “viable” P450s (SI4.xlsx). “Stable” and “labile” proteins were differentially enriched in the terms shown in Table 8. Although individual proteins in both datasets can show enrichment in the same GO term, the relative proportions of proteins in each set are substantially different. Comparing the numbers of “labile” and “stable” P450, considerably more “stable” P450s showed enrichment of GO terms related to biosynthetic and developmental processes. This trend is reversed in the case of deteoxification catabolic processes. GOATOOLS [50] was used to generate graphical views of enriched GO terms in biosynthetic, developmental and catabolic processes. These are shown in Figure 3 and Figure 4, respectively.
4. Discussion
The non-culled dataset was split into two subgroups which contained a total of 245 defined as phylogenetically “stable” and 241 phylogenetically “labile”. The genes were obtained from VectorBase database and cross-referred to Ensembl (Metazoa Genes 60 database). To avoid bias in statistical analyses, redundant proteins were removed from the datasets to generate non-redundant or culled datasets of “labile” and “stable” P450s. The culled and non-culled datasets were compared for a number of genomic and protein sequence properties. In general, sequence redundancy did not affect the overall picture and all sets follow similar statistical trends. Table 8 shows the gene and protein features that are strongly associated with “stable” P450 genes.
Analysis of genomic features of CYPs showed that “stable” genes are longer, have more exons, and longer intron lengths. This is consistent with recent findings showing that longer genes correlate with functions that are important in the development stages of an organism [56,57]. Additionally, “stable” CYPs the average intron length was shown to be almost twice the size of introns in “labile” P450s. This is in agreement with research showing intonic “burden” plays an important role in the evolutionary conservation of genes [58]. “Stable” CYPs were shown to have lower GC content than the “labile” ones and although the difference was not statistically significant it is noted that GC content varies inversely with intron and exon length [59].
Analysis of physicochemical and protein sequence features revealed several differences between “labile” and “stable” P450s. “Labile” proteins were found to have a greater proportion of polar and charged residues and be less hydrophobic than “stable” P450s which were relatively enriched in aliphatic amino acids. It is noted, however, that the method used to determine the relative hydrophobicity of P450s is a poor predictor as it does not take into account protein folding. It is known that the aggregation propensity of proteins is frequently linked to imperfect folding. In terms of amino acid composition, “stable” P450s were found to have Arg, Cys, Leu, Trp in greater proportion than “labile” P450s. Arg is a known chaotrope associated with the prevention of protein aggregates and increasing the solubility of hydrophobes [60]. Recent studies have shown that Trp/Tyr chains are common in enzymes utilising O2 as a substrate and that redox active Trp/Tyr chains extend the functional lifetimes of P450s [61]. The relative enrichment of “stable” P450s in Cys residues may have a two fold importance. On one hand, Cys residues may impose structural constraints necessary for specific, rather than promiscuous, protein-ligand interactions as in the case of interactions that are developmentaly important [62]. On the other, Cys has a tendency to behave as a hydrophobic residue in folded proteins, despite possessing a polar sulfhydryl group [63].
Functional analysis of “stable” and “labile” P450s was studied by enrichment analysis of GO terms. “Stable” P450s were predicted to be enriched in GO terms relevant to the biosynthesis of lipids and hormones. These biosynthetic processes are also essential for instar larval or pupal morphogenesis and play essential roles in the growth, reproduction and defence systems of insects [64,65]. “Labile” P450s were predicted to be enriched in GO terms related to biological processes involving the detoxification of xenobiotics. As a cautionary note, it is pointed out that GO gene enrichment analysis is not without methodological challenges and pitfalls [66,67,68] and results can be unreliable due to inadequate coverage and resolution of the annotation databases [69,70].
The analysis of biological features, such as signal peptides and cellular localisation, was inconclusive and merits additional investigation. For example, proportion of “labile” CYPs predicted to be located in the mitochondrion is higher than that for “stable” CYP, albeit the fact that the absolute numbers are small to draw an definitve conclusions. This is contrary to phylogenetic studies showing that mitochondrial CYPs are relatively well conserved [22]. However, the name “mitochondrial” refering to the CYP clan should not be taken as definitive evidence of subcellular localisation and CYPs of this clan can be microsomal or have dual localisations [11]. Another important feature is the composition of tranmembrane domains. The reducing power of CYPs depends on the coupling of the endoplasmic reticulum N-terminal transmembrane helix with membrane-anchored NADPH-dependent cytochrome P450 oxidoreductase [71]. Bioinformatic analysis of of sequence conservation of transmembrane anchors and the characterisation of motif patterns of signal and transit peptides can provide useful insights on the localisation and function of CYPs [72].
5. Conclusions
“Stable” and “labile” P450s were shown to be significantly different in a number of genomic and protein features. The interdependency of these features implies that multiple aspects of biology unite to determine whether a gene is “stable” or “labile” in mosquitos. The range of features analysed and discussed in this paper can be broadened and expanded to other organisms thus gaining further insights into gene “essentiality”.Broadening the scope of the bioinformatic analysis presented in this paper may enable the functional classification of insect CYPs by training machine learning classifiers for the functional identification of insect P450s. Last but not least, the identification of “stable” genes associated with “lethality” may facilitate the identification of non-viable null mutants thus the identification of new insecticide targets.
Supplementary Materials
The following supporting information can be downloaded at the website of this paper posted on Preprints.org.
References
- Nelson, D.R.; Nebert, D.W. Cytochrome P450 ( CYP ) Gene Superfamily. Encyclopedia of Life Sciences. [CrossRef]
- Klingenberg, M. Pigments of rat liver microsomes. Arch Biochem Biophys 1958, 75, 376–386. [Google Scholar] [CrossRef] [PubMed]
- Mistry, J. , et al., Pfam: The protein families database in 2021. Nucleic Acids Res, 2021. 49(D1): p. D412-D419.
- Werck-Reichhart, D.; Feyereisen, R. Cytochromes P450: a success story. Genome Biol 2000, 1, REVIEWS3003. [Google Scholar] [CrossRef] [PubMed]
- Hannemann, F.; Bichet, A.; Ewen, K.M.; Bernhardt, R. Cytochrome P450 systems--biological variations of electron transport chains. Biochim Biophys Acta 2007, 1770, 330–344. [Google Scholar] [CrossRef] [PubMed]
- Fujiyama, K.; Hino, T.; Nagano, S. Diverse reactions catalyzed by cytochrome P450 and biosynthesis of steroid hormone. Biophys Physicobiol 2022, 19, e190021. [Google Scholar] [CrossRef]
- Pavlidi, N.; Vontas, J.; Van Leeuwen, T. The role of glutathione S-transferases (GSTs) in insecticide resistance in crop pests and disease vectors. Curr Opin Insect Sci 2018, 27, 97–102. [Google Scholar] [CrossRef]
- Wu, C.; Chakrabarty, S.; Jin, M.; Liu, K.; Xiao, Y. Insect ATP-Binding Cassette (ABC) Transporters: Roles in Xenobiotic Detoxification and Bt Insecticidal Activity. Int J Mol Sci 2019, 20. [Google Scholar] [CrossRef]
- Nelson, D.R. Cytochrome P450 diversity in the tree of life. Biochim Biophys Acta Proteins Proteom 2018, 1866, 141–154. [Google Scholar] [CrossRef]
- Zhang, Y.; Pan, X.; Shi, T.; Gu, Z.; Yang, Z.; Liu, M.; Xu, Y.; Yang, Y.; Ren, L.; Song, X.; et al. P450Rdb: a manually curated database of reactions catalyzed by cytochrome P450 enzymes. J Adv Res 2023. [Google Scholar] [CrossRef]
- Dermauw, W.; Van Leeuwen, T.; Feyereisen, R. Diversity and evolution of the P450 family in arthropods. Insect Biochem Mol Biol 2020, 127, 103490. [Google Scholar] [CrossRef]
- Nelson, D.R. Cytochrome P450 and the individuality of species. Arch Biochem Biophys 1999, 369, 1–10. [Google Scholar] [CrossRef]
- Nelson, D.R. The cytochrome p450 homepage. Hum Genomics 2009, 4, 59–65. [Google Scholar] [CrossRef]
- Pankov, K.V.; McArthur, A.G.; Gold, D.A.; Nelson, D.R.; Goldstone, J.V.; Wilson, J.Y. The cytochrome P450 (CYP) superfamily in cnidarians. Sci Rep 2021, 11, 9834. [Google Scholar] [CrossRef]
- Shi, Y.; Qu, Q.; Wang, C.; He, Y.; Yang, Y.; Wu, Y. Involvement of CYP2 and mitochondrial clan P450s of Helicoverpa armigera in xenobiotic metabolism. Insect Biochem Mol Biol 2022, 140, 103696. [Google Scholar] [CrossRef]
- Nelson, D.R. A world of cytochrome P450s. Philos Trans R Soc Lond B Biol Sci 2013, 368, 20120430. [Google Scholar] [CrossRef]
- Li, F.; Zhao, X.; Li, M.; He, K.; Huang, C.; Zhou, Y.; Li, Z.; Walters, J.R. Insect genomes: progress and challenges. Insect Mol Biol 2019, 28, 739–758. [Google Scholar] [CrossRef]
- Strode, C.; Wondji, C.S.; David, J.P.; Hawkes, N.J.; Lumjuan, N.; Nelson, D.R.; Drane, D.R.; Karunaratne, S.H.; Hemingway, J.; Black, W.C.t.; et al. Genomic analysis of detoxification genes in the mosquito Aedes aegypti. Insect Biochem Mol Biol 2008, 38, 113–123. [Google Scholar] [CrossRef]
- Yan, L.; Yang, P.; Jiang, F.; Cui, N.; Ma, E.; Qiao, C.; Cui, F. Transcriptomic and phylogenetic analysis of Culex pipiens quinquefasciatus for three detoxification gene families. BMC Genomics 2012, 13, 609. [Google Scholar] [CrossRef]
- Feyereisen, R. Arthropod CYPomes illustrate the tempo and mode in P450 evolution. Biochim Biophys Acta 2011, 1814, 19–28. [Google Scholar] [CrossRef]
- Feyereisen, R. Evolution of insect P450. Biochem Soc Trans 2006, 34, 1252–1255. [Google Scholar] [CrossRef]
- Dulbecco, A.B.; Calderón-Fernández, G.M.; Pedrini, N. Cytochrome P450 Genes of the CYP4 Clan and Pyrethroid Resistance in Chagas Disease Vectors. Frontiers in Tropical Diseases 2022, 3. [Google Scholar] [CrossRef]
- Ranson, H.; Claudianos, C.; Ortelli, F.; Abgrall, C.; Hemingway, J.; Sharakhova, M.V.; Unger, M.F.; Collins, F.H.; Feyereisen, R. Evolution of supergene families associated with insecticide resistance. Science 2002, 298, 179–181. [Google Scholar] [CrossRef] [PubMed]
- Dulbecco, A.B.; Moriconi, D.E.; Calderon-Fernandez, G.M.; Lynn, S.; McCarthy, A.; Roca-Acevedo, G.; Salamanca-Moreno, J.A.; Juarez, M.P.; Pedrini, N. Integument CYP genes of the largest genome-wide cytochrome P450 expansions in triatomines participate in detoxification in deltamethrin-resistant Triatoma infestans. Sci Rep 2018, 8, 10177. [Google Scholar] [CrossRef] [PubMed]
- Sezutsu, H.; Le Goff, G.; Feyereisen, R. Origins of P450 diversity. Philos Trans R Soc Lond B Biol Sci 2013, 368, 20120428. [Google Scholar] [CrossRef] [PubMed]
- Good, R.T.; Gramzow, L.; Battlay, P.; Sztal, T.; Batterham, P.; Robin, C. The molecular evolution of cytochrome P450 genes within and between drosophila species. Genome Biol Evol 2014, 6, 1118–1134. [Google Scholar] [CrossRef]
- Schumann, I.; Kenny, N.; Hui, J.; Hering, L.; Mayer, G. Halloween genes in panarthropods and the evolution of the early moulting pathway in Ecdysozoa. R Soc Open Sci 2018, 5, 180888. [Google Scholar] [CrossRef]
- Chung, H.; Sztal, T.; Pasricha, S.; Sridhar, M.; Batterham, P.; Daborn, P.J. Characterization of Drosophila melanogaster cytochrome P450 genes. Proc Natl Acad Sci U S A 2009, 106, 5731–5736. [Google Scholar] [CrossRef]
- Feyereisen, R. Insect P450 inhibitors and insecticides: challenges and opportunities. Pest Manag Sci 2015, 71, 793–800. [Google Scholar] [CrossRef]
- Vontas, J.; Katsavou, E.; Mavridis, K. Cytochrome P450-based metabolic insecticide resistance in Anopheles and Aedes mosquito vectors: Muddying the waters. Pestic Biochem Physiol 2020, 170, 104666. [Google Scholar] [CrossRef]
- Balabanidou, V.; Kampouraki, A.; MacLean, M.; Blomquist, G.J.; Tittiger, C.; Juarez, M.P.; Mijailovsky, S.J.; Chalepakis, G.; Anthousi, A.; Lynd, A.; et al. Cytochrome P450 associated with insecticide resistance catalyzes cuticular hydrocarbon production in Anopheles gambiae. Proc Natl Acad Sci U S A 2016, 113, 9268–9273. [Google Scholar] [CrossRef]
- Yahouedo, G.A.; Chandre, F.; Rossignol, M.; Ginibre, C.; Balabanidou, V.; Mendez, N.G.A.; Pigeon, O.; Vontas, J.; Cornelie, S. Contributions of cuticle permeability and enzyme detoxification to pyrethroid resistance in the major malaria vector Anopheles gambiae. Sci Rep 2017, 7, 11091. [Google Scholar] [CrossRef]
- Saavedra-Rodriguez, K.; Suarez, A.F.; Salas, I.F.; Strode, C.; Ranson, H.; Hemingway, J.; Black, W.C.t. Transcription of detoxification genes after permethrin selection in the mosquito Aedes aegypti. Insect Mol Biol 2012, 21, 61–77. [Google Scholar] [CrossRef] [PubMed]
- Nauen, R.; Bass, C.; Feyereisen, R.; Vontas, J. The Role of Cytochrome P450s in Insect Toxicology and Resistance. Annu Rev Entomol 2022, 67, 105–124. [Google Scholar] [CrossRef] [PubMed]
- Ren, H., Yang, G., Winberg, G., Turin, L., Zhang, S., Crystal Structures of an Anopheles gambiae Odorant-binding Protein AgamOBP22a and Complexes with Bound Odorants, to be published.
- Mobegi, F.M.; Zomer, A.; de Jonge, M.I.; van Hijum, S.A. Advances and perspectives in computational prediction of microbial gene essentiality. Brief Funct Genomics 2017, 16, 70–79. [Google Scholar] [CrossRef]
- Tian, D.; Wenlock, S.; Kabir, M.; Tzotzos, G.; Doig, A.J.; Hentges, K.E. Identifying mouse developmental essential genes using machine learning. Dis Model Mech 2018, 11. [Google Scholar] [CrossRef]
- Aromolaran, O.; Aromolaran, D.; Isewon, I.; Oyelade, J. Machine learning approach to gene essentiality prediction: a review. Brief Bioinform 2021, 22. [Google Scholar] [CrossRef]
- Giraldo-Calderon, G.I.; Harb, O.S.; Kelly, S.A.; Rund, S.S.; Roos, D.S.; McDowell, M.A. VectorBase.org updates: bioinformatic resources for invertebrate vectors of human pathogens and related organisms. Curr Opin Insect Sci 2022, 50, 100860. [Google Scholar] [CrossRef]
- Li, L.; Stoeckert, C.J., Jr.; Roos, D.S. OrthoMCL: identification of ortholog groups for eukaryotic genomes. Genome Res 2003, 13, 2178–2189. [Google Scholar] [CrossRef]
- Fischer, S.; Brunk, B.P.; Chen, F.; Gao, X.; Harb, O.S.; Iodice, J.B.; Shanmugam, D.; Roos, D.S.; Stoeckert, C.J., Jr. Using OrthoMCL to assign proteins to OrthoMCL-DB groups or to cluster proteomes into new ortholog groups. Curr Protoc Bioinformatics 2011, Chapter 6, 6 12 11-16 12 19. [CrossRef]
- Sikic, K.; Carugo, O. Protein sequence redundancy reduction: comparison of various method. Bioinformation 2010, 5, 234–239. [Google Scholar] [CrossRef]
- Rice, P.; Longden, I.; Bleasby, A. EMBOSS: the European Molecular Biology Open Software Suite. Trends Genet 2000, 16, 276–277. [Google Scholar] [CrossRef]
- Blom, N.; Sicheritz-Ponten, T.; Gupta, R.; Gammeltoft, S.; Brunak, S. Prediction of post-translational glycosylation and phosphorylation of proteins from the amino acid sequence. Proteomics 2004, 4, 1633–1649. [Google Scholar] [CrossRef]
- Savojardo, C.; Martelli, P.L.; Fariselli, P.; Profiti, G.; Casadio, R. BUSCA: an integrative web server to predict subcellular localization of proteins. Nucleic Acids Res 2018, 46, W459–W466. [Google Scholar] [CrossRef]
- Wang, S.; You, R.; Liu, Y.; Xiong, Y.; Zhu, S. NetGO 3.0: Protein Language Model Improves Large-scale Functional Annotations. Genomics Proteomics Bioinformatics 2023, 21, 349–358. [Google Scholar] [CrossRef] [PubMed]
- Kyte, J.; Doolittle, R.F. A simple method for displaying the hydropathic character of a protein. J Mol Biol 1982, 157, 105–132. [Google Scholar] [CrossRef] [PubMed]
- Zhou, N.; Jiang, Y.; Bergquist, T.R.; Lee, A.J.; Kacsoh, B.Z.; Crocker, A.W.; Lewis, K.A.; Georghiou, G.; Nguyen, H.N.; Hamid, M.N.; et al. The CAFA challenge reports improved protein function prediction and new functional annotations for hundreds of genes through experimental screens. Genome Biol 2019, 20, 244. [Google Scholar] [CrossRef] [PubMed]
- Ribeiro, A.J.M.; Riziotis, I.G.; Borkakoti, N.; Thornton, J.M. Enzyme function and evolution through the lens of bioinformatics. Biochem J 2023, 480, 1845–1863. [Google Scholar] [CrossRef] [PubMed]
- Klopfenstein, D.V.; Zhang, L.; Pedersen, B.S.; Ramirez, F.; Warwick Vesztrocy, A.; Naldi, A.; Mungall, C.J.; Yunes, J.M.; Botvinnik, O.; Weigel, M.; et al. GOATOOLS: A Python library for Gene Ontology analyses. Sci Rep 2018, 8, 10872. [Google Scholar] [CrossRef]
- Oesch-Bartlomowicz, B.; Oesch, F. Phosphorylation of cytochromes P450: first discovery of a posttranslational modification of a drug-metabolizing enzyme. Biochem Biophys Res Commun 2005, 338, 446–449. [Google Scholar] [CrossRef]
- Monk, B.C.; Tomasiak, T.M.; Keniya, M.V.; Huschmann, F.U.; Tyndall, J.D.; O'Connell, J.D., 3rd; Cannon, R.D.; McDonald, J.G.; Rodriguez, A.; Finer-Moore, J.S.; et al. Architecture of a single membrane spanning cytochrome P450 suggests constraints that orient the catalytic domain relative to a bilayer. Proc Natl Acad Sci U S A 2014, 111, 3865–3870. [Google Scholar] [CrossRef]
- Srejber, M.; Navratilova, V.; Paloncyova, M.; Bazgier, V.; Berka, K.; Anzenbacher, P.; Otyepka, M. Membrane-attached mammalian cytochromes P450: An overview of the membrane's effects on structure, drug binding, and interactions with redox partners. J Inorg Biochem 2018, 183, 117–136. [Google Scholar] [CrossRef]
- Gricman, L.; Vogel, C.; Pleiss, J. Conservation analysis of class-specific positions in cytochrome P450 monooxygenases: functional and structural relevance. Proteins 2014, 82, 491–504. [Google Scholar] [CrossRef]
- Ashburner, M.; Ball, C.A.; Blake, J.A.; Botstein, D.; Butler, H.; Cherry, J.M.; Davis, A.P.; Dolinski, K.; Dwight, S.S.; Eppig, J.T.; et al. Gene ontology: tool for the unification of biology. The Gene Ontology Consortium. Nature genetics 2000, 25, 25–29. [Google Scholar] [CrossRef] [PubMed]
- Lopes, I.; Altab, G.; Raina, P.; de Magalhaes, J.P. Gene Size Matters: An Analysis of Gene Length in the Human Genome. Front Genet 2021, 12, 559998. [Google Scholar] [CrossRef] [PubMed]
- Brown, J.C. Role of Gene Length in Control of Human Gene Expression: Chromosome-Specific and Tissue-Specific Effects. Int J Genomics 2021, 2021, 8902428. [Google Scholar] [CrossRef] [PubMed]
- Gorlova, O.; Fedorov, A.; Logothetis, C.; Amos, C.; Gorlov, I. Genes with a large intronic burden show greater evolutionary conservation on the protein level. BMC Evol Biol 2014, 14, 50. [Google Scholar] [CrossRef]
- Kabir, M.; Barradas, A.; Tzotzos, G.T.; Hentges, K.E.; Doig, A.J. Properties of genes essential for mouse development. PLoS One 2017, 12, e0178273. [Google Scholar] [CrossRef]
- Mamsa, S.S.A.; Meloni, B.P. Arginine and Arginine-Rich Peptides as Modulators of Protein Aggregation and Cytotoxicity Associated With Alzheimer's Disease. Front Mol Neurosci 2021, 14, 759729. [Google Scholar] [CrossRef]
- Ravanfar, R.; Sheng, Y.; Gray, H.B.; Winkler, J.R. Tryptophan extends the life of cytochrome P450. Proc Natl Acad Sci U S A 2023, 120, e2317372120. [Google Scholar] [CrossRef]
- Lu, Y.; Sun, L.; Pang, J.; Li, C.; Wang, X.; Hu, X.; Li, G.; Li, X.; Zhang, Y.; Wang, H.; et al. Roles of cysteine in the structure and metabolic function of Mycobacterium tuberculosis CYP142A1. RSC Adv 2022, 12, 24447–24455. [Google Scholar] [CrossRef]
- Iyer, B.R.; Mahalakshmi, R. Hydrophobic Characteristic Is Energetically Preferred for Cysteine in a Model Membrane Protein. Biophys J 2019, 117, 25–35. [Google Scholar] [CrossRef]
- Wronska, A.K.; Kaczmarek, A.; Bogus, M.I.; Kuna, A. Lipids as a key element of insect defense systems. Front Genet 2023, 14, 1183659. [Google Scholar] [CrossRef]
- Arrese, E.L.; Soulages, J.L. Insect fat body: energy, metabolism, and regulation. Annu Rev Entomol 2010, 55, 207–225. [Google Scholar] [CrossRef] [PubMed]
- Khatri, P.; Sirota, M.; Butte, A.J. Ten years of pathway analysis: current approaches and outstanding challenges. PLoS Comput Biol 2012, 8, e1002375. [Google Scholar] [CrossRef] [PubMed]
- Geistlinger, L.; Csaba, G.; Santarelli, M.; Ramos, M.; Schiffer, L.; Turaga, N.; Law, C.; Davis, S.; Carey, V.; Morgan, M.; et al. Toward a gold standard for benchmarking gene set enrichment analysis. Brief Bioinform 2021, 22, 545–556. [Google Scholar] [CrossRef]
- Zhao, K.; Rhee, S.Y. Interpreting omics data with pathway enrichment analysis. Trends Genet 2023, 39, 308–319. [Google Scholar] [CrossRef]
- Haynes, W.A.; Tomczak, A.; Khatri, P. Gene annotation bias impedes biomedical research. Sci Rep 2018, 8, 1362. [Google Scholar] [CrossRef]
- Attrill, H.; Gaudet, P.; Huntley, R.P.; Lovering, R.C.; Engel, S.R.; Poux, S.; Van Auken, K.M.; Georghiou, G.; Chibucos, M.C.; Berardini, T.Z.; et al. Annotation of gene product function from high-throughput studies using the Gene Ontology. Database (Oxford) 2019, 2019. [Google Scholar] [CrossRef]
- Laursen, T.; Lam, H.Y.M.; Sorensen, K.K.; Tian, P.; Hansen, C.C.; Groves, J.T.; Jensen, K.J.; Christensen, S.M. Membrane anchoring facilitates colocalization of enzymes in plant cytochrome P450 redox systems. Commun Biol 2021, 4, 1057. [Google Scholar] [CrossRef] [PubMed]
- Sidorczuk, K.; Mackiewicz, P.; Pietluch, F.; Gagat, P. Characterization of signal and transit peptides based on motif composition and taxon-specific patterns. Sci Rep 2023, 13, 15751. [Google Scholar] [CrossRef]
Figure 1.
Distributions of the total gene length, number of exons, total length of exons, total length of introns, number of transcripts, and percentage of GC content in “stable” and “labile” genes.
Figure 1.
Distributions of the total gene length, number of exons, total length of exons, total length of introns, number of transcripts, and percentage of GC content in “stable” and “labile” genes.
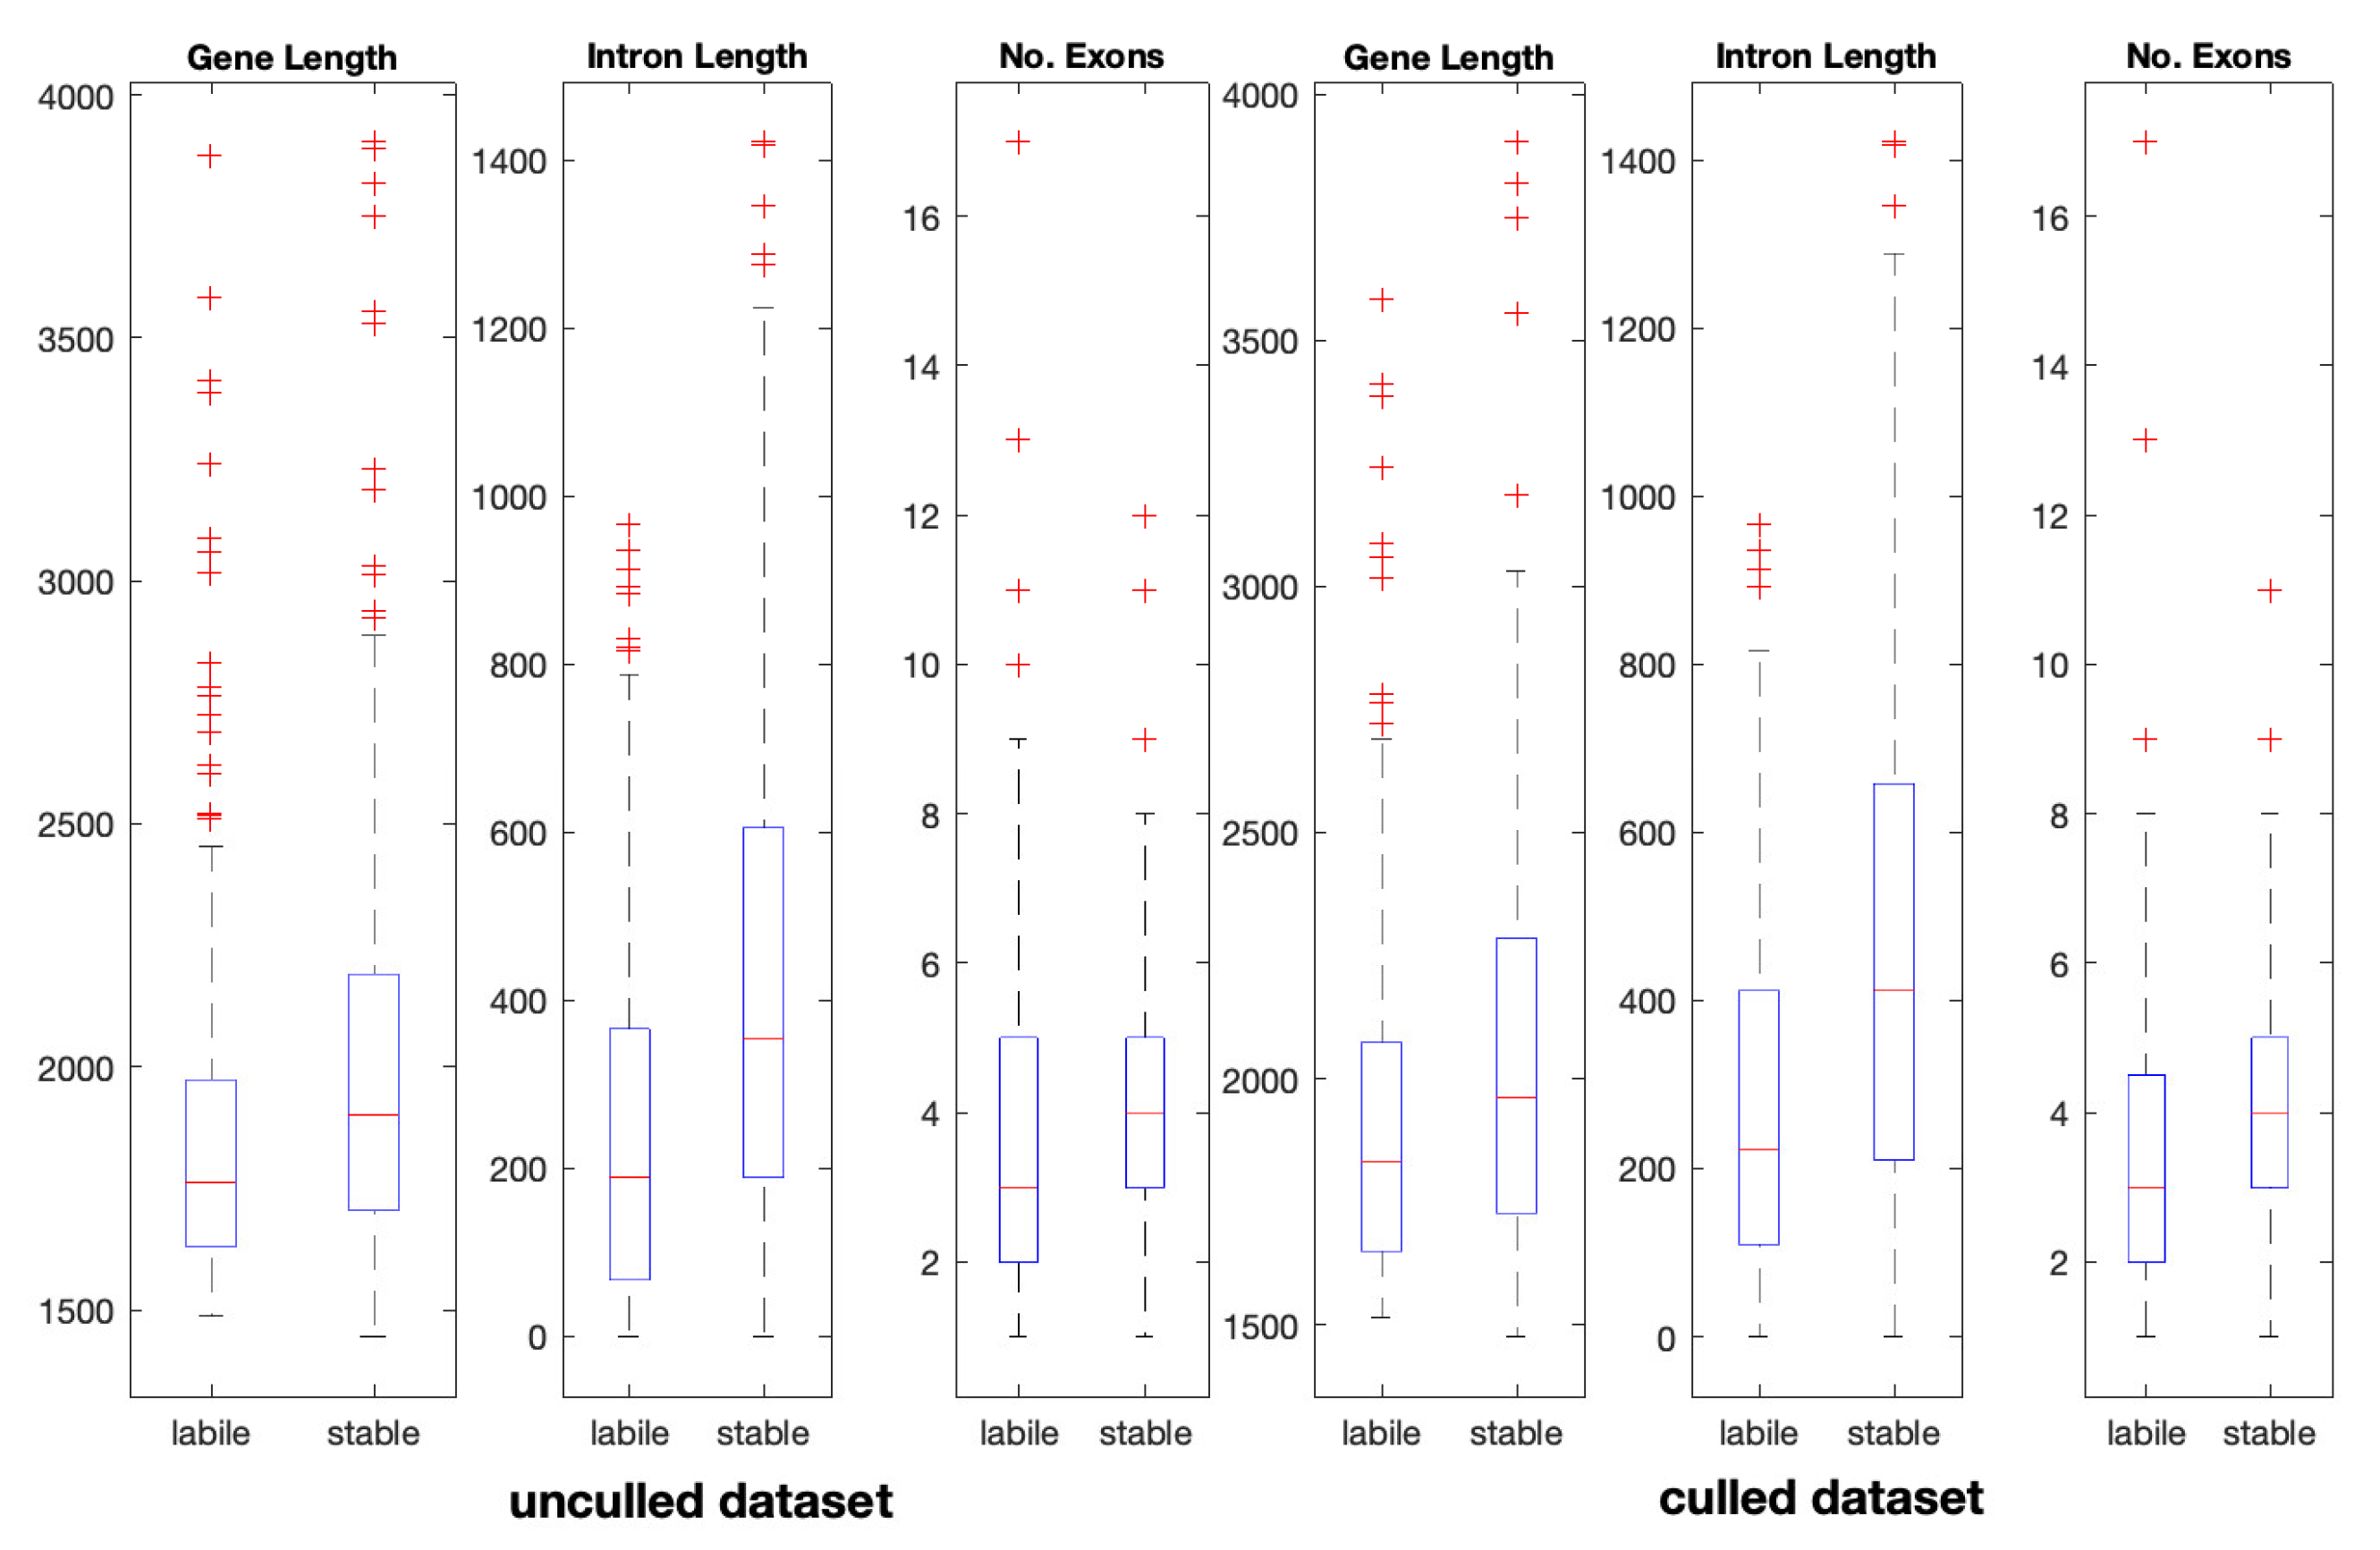
Figure 2.
Distributions of acidic, aliphatic, charged, non-polar and polar residues (%) between “labile” and “stable” P450s. Unculled and culled datasets denoted as (A) and (B), respectively.
Figure 2.
Distributions of acidic, aliphatic, charged, non-polar and polar residues (%) between “labile” and “stable” P450s. Unculled and culled datasets denoted as (A) and (B), respectively.
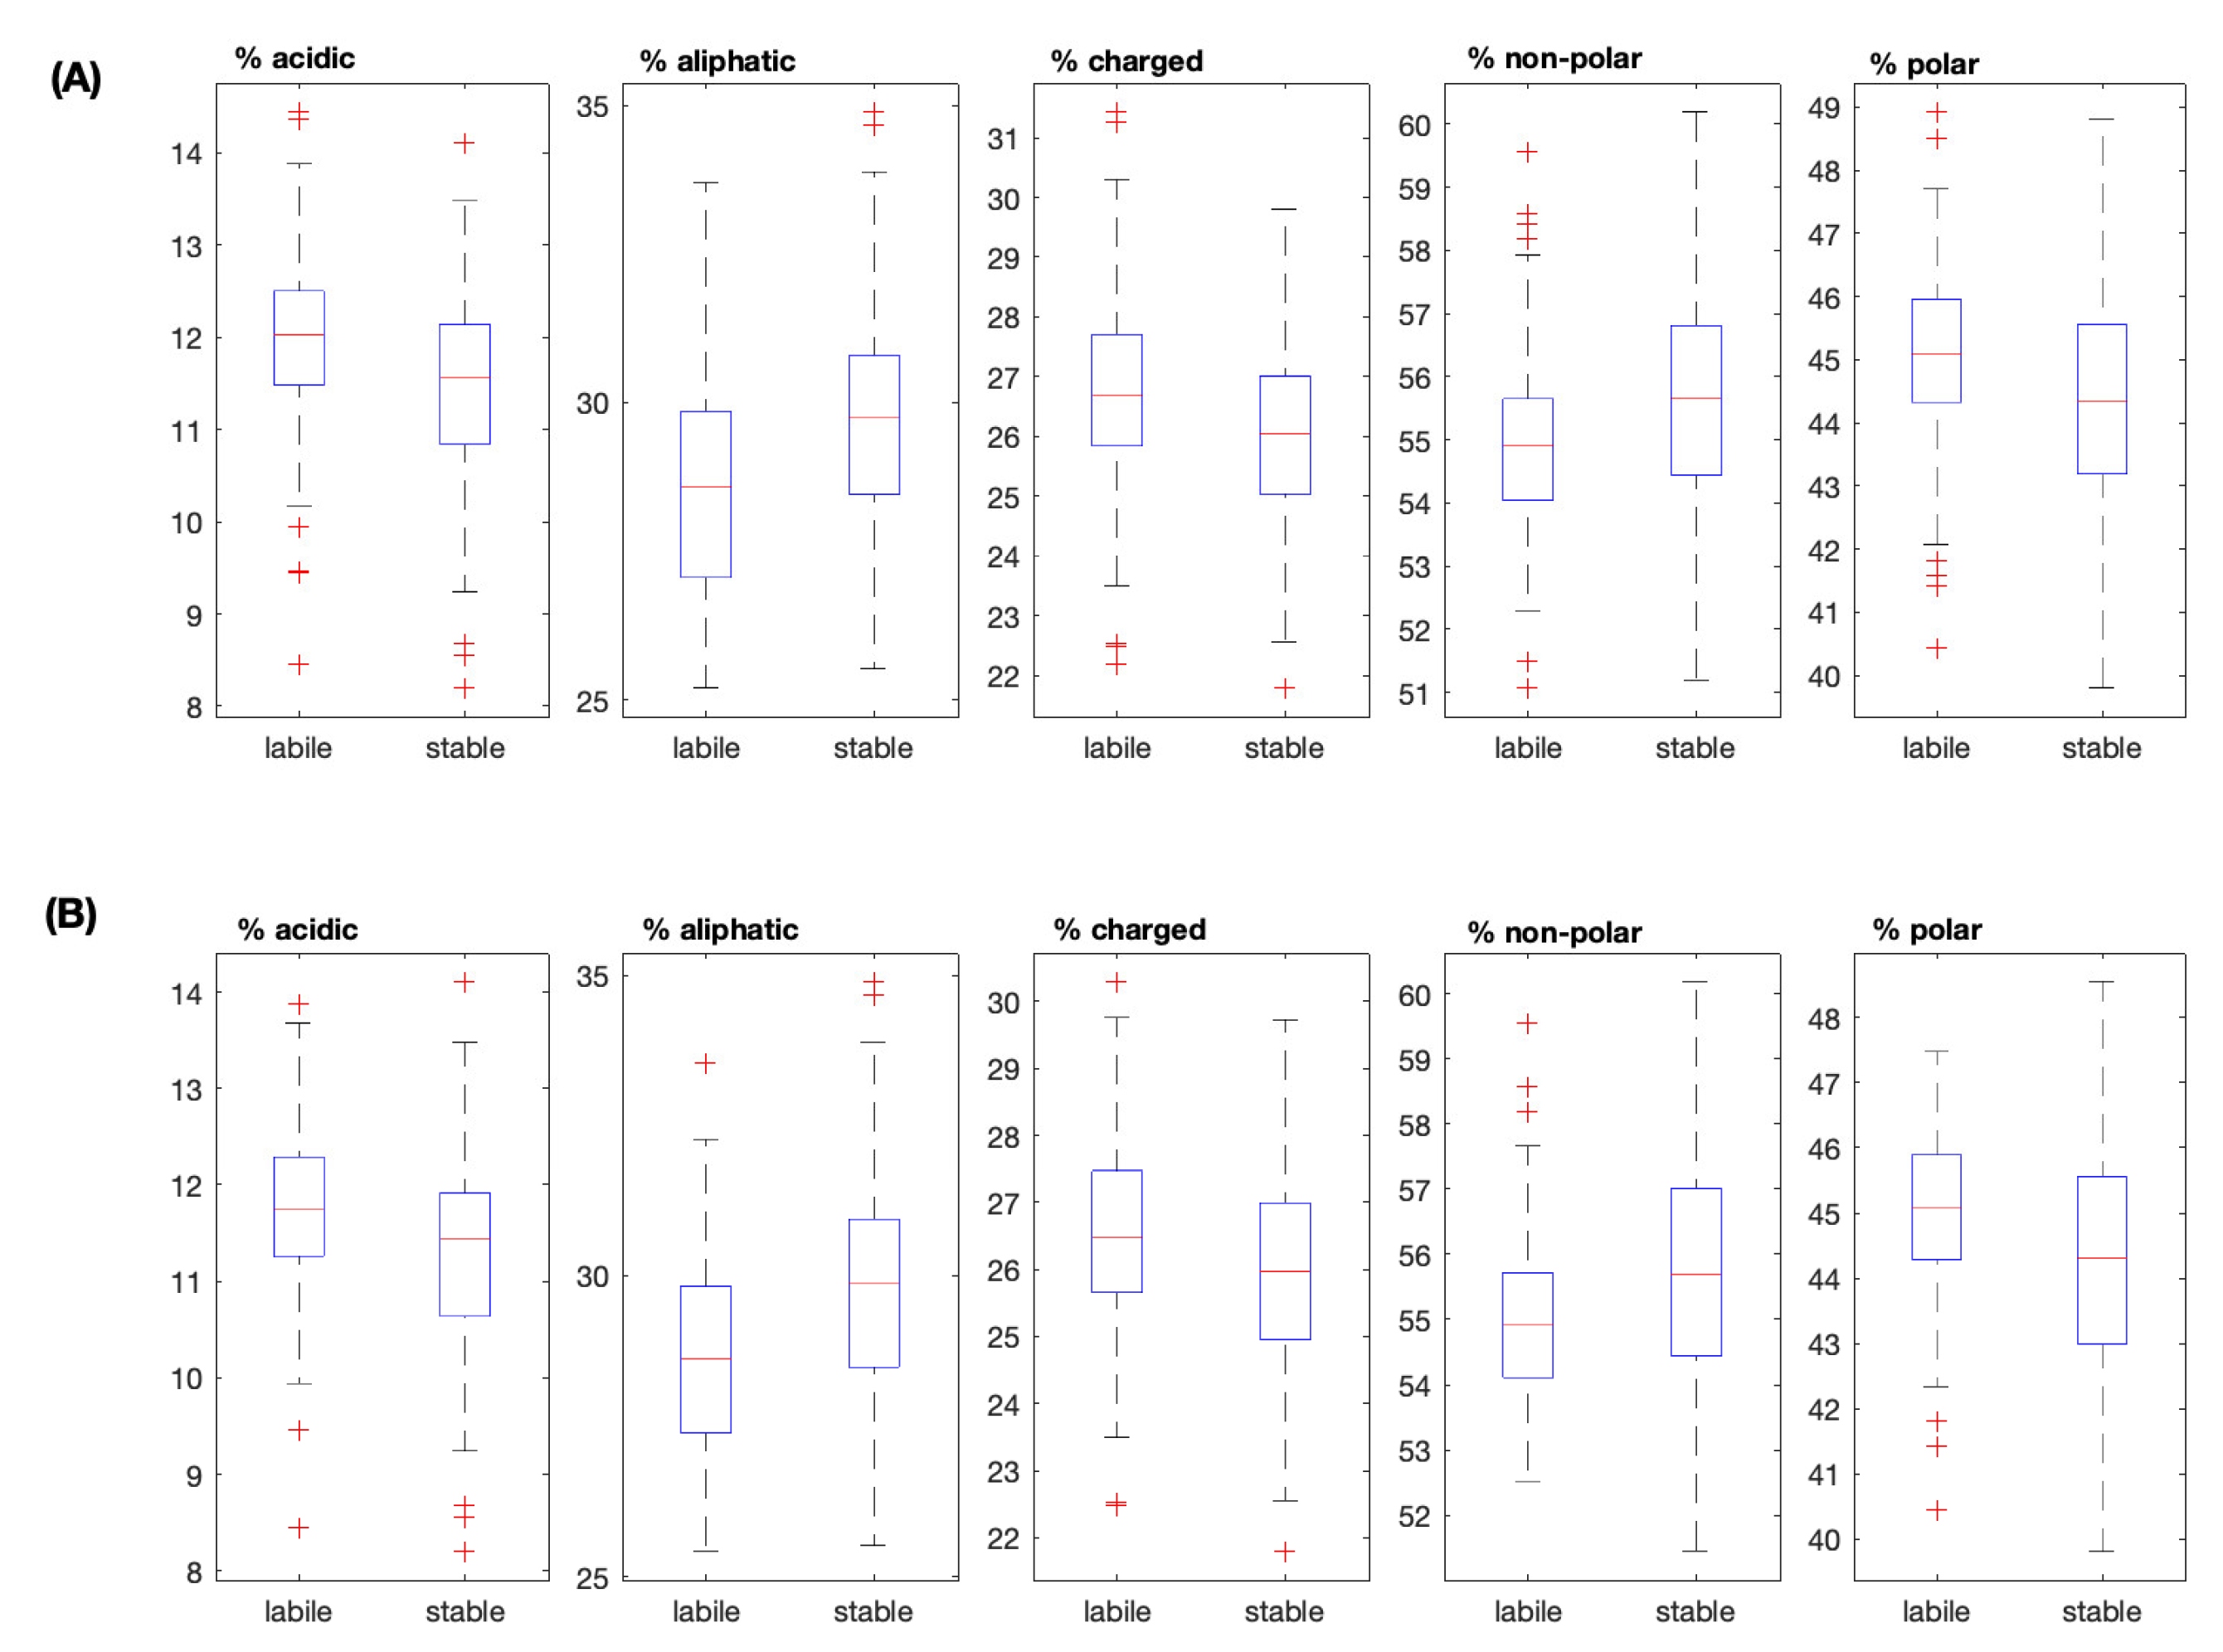
Figure 3.
Plot of the enriched GO terms and their ancestors (Table 7, GO terms 1-8).
Figure 3.
Plot of the enriched GO terms and their ancestors (Table 7, GO terms 1-8).
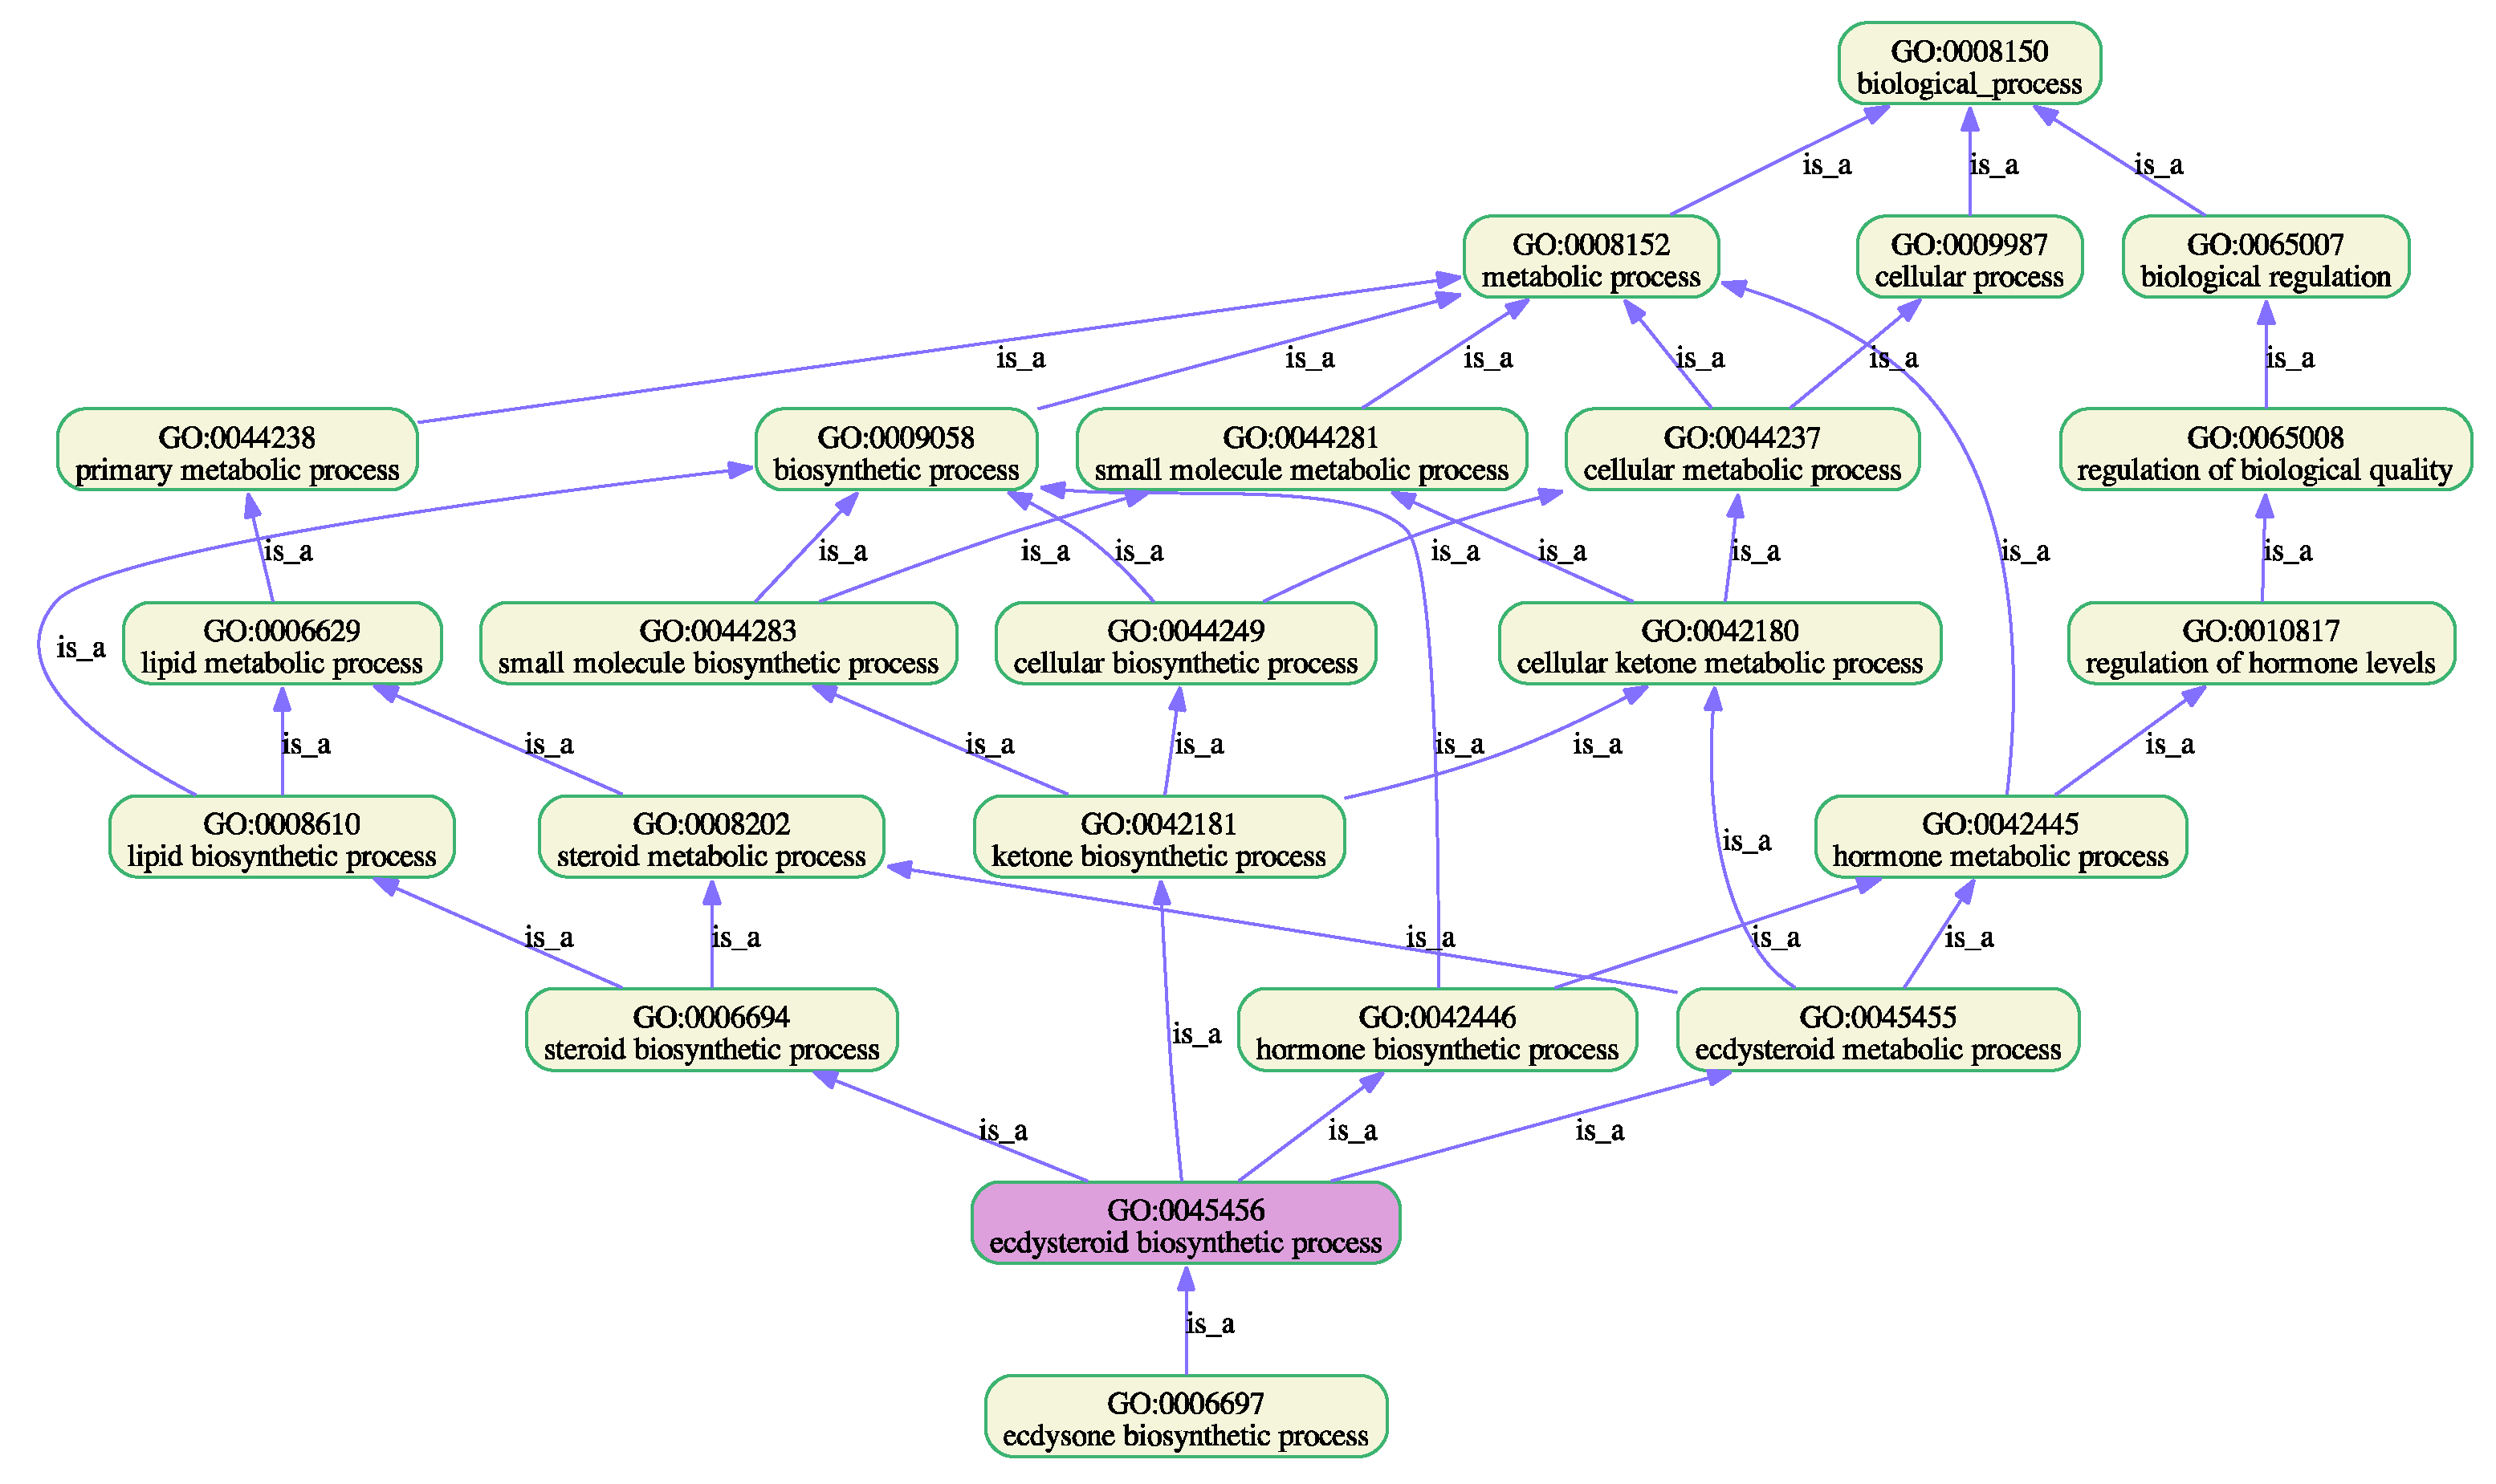
Figure 4.
Plot of the enriched GO terms and their ancestors (Table 7, GO terms 9-11.
Figure 4.
Plot of the enriched GO terms and their ancestors (Table 7, GO terms 9-11.
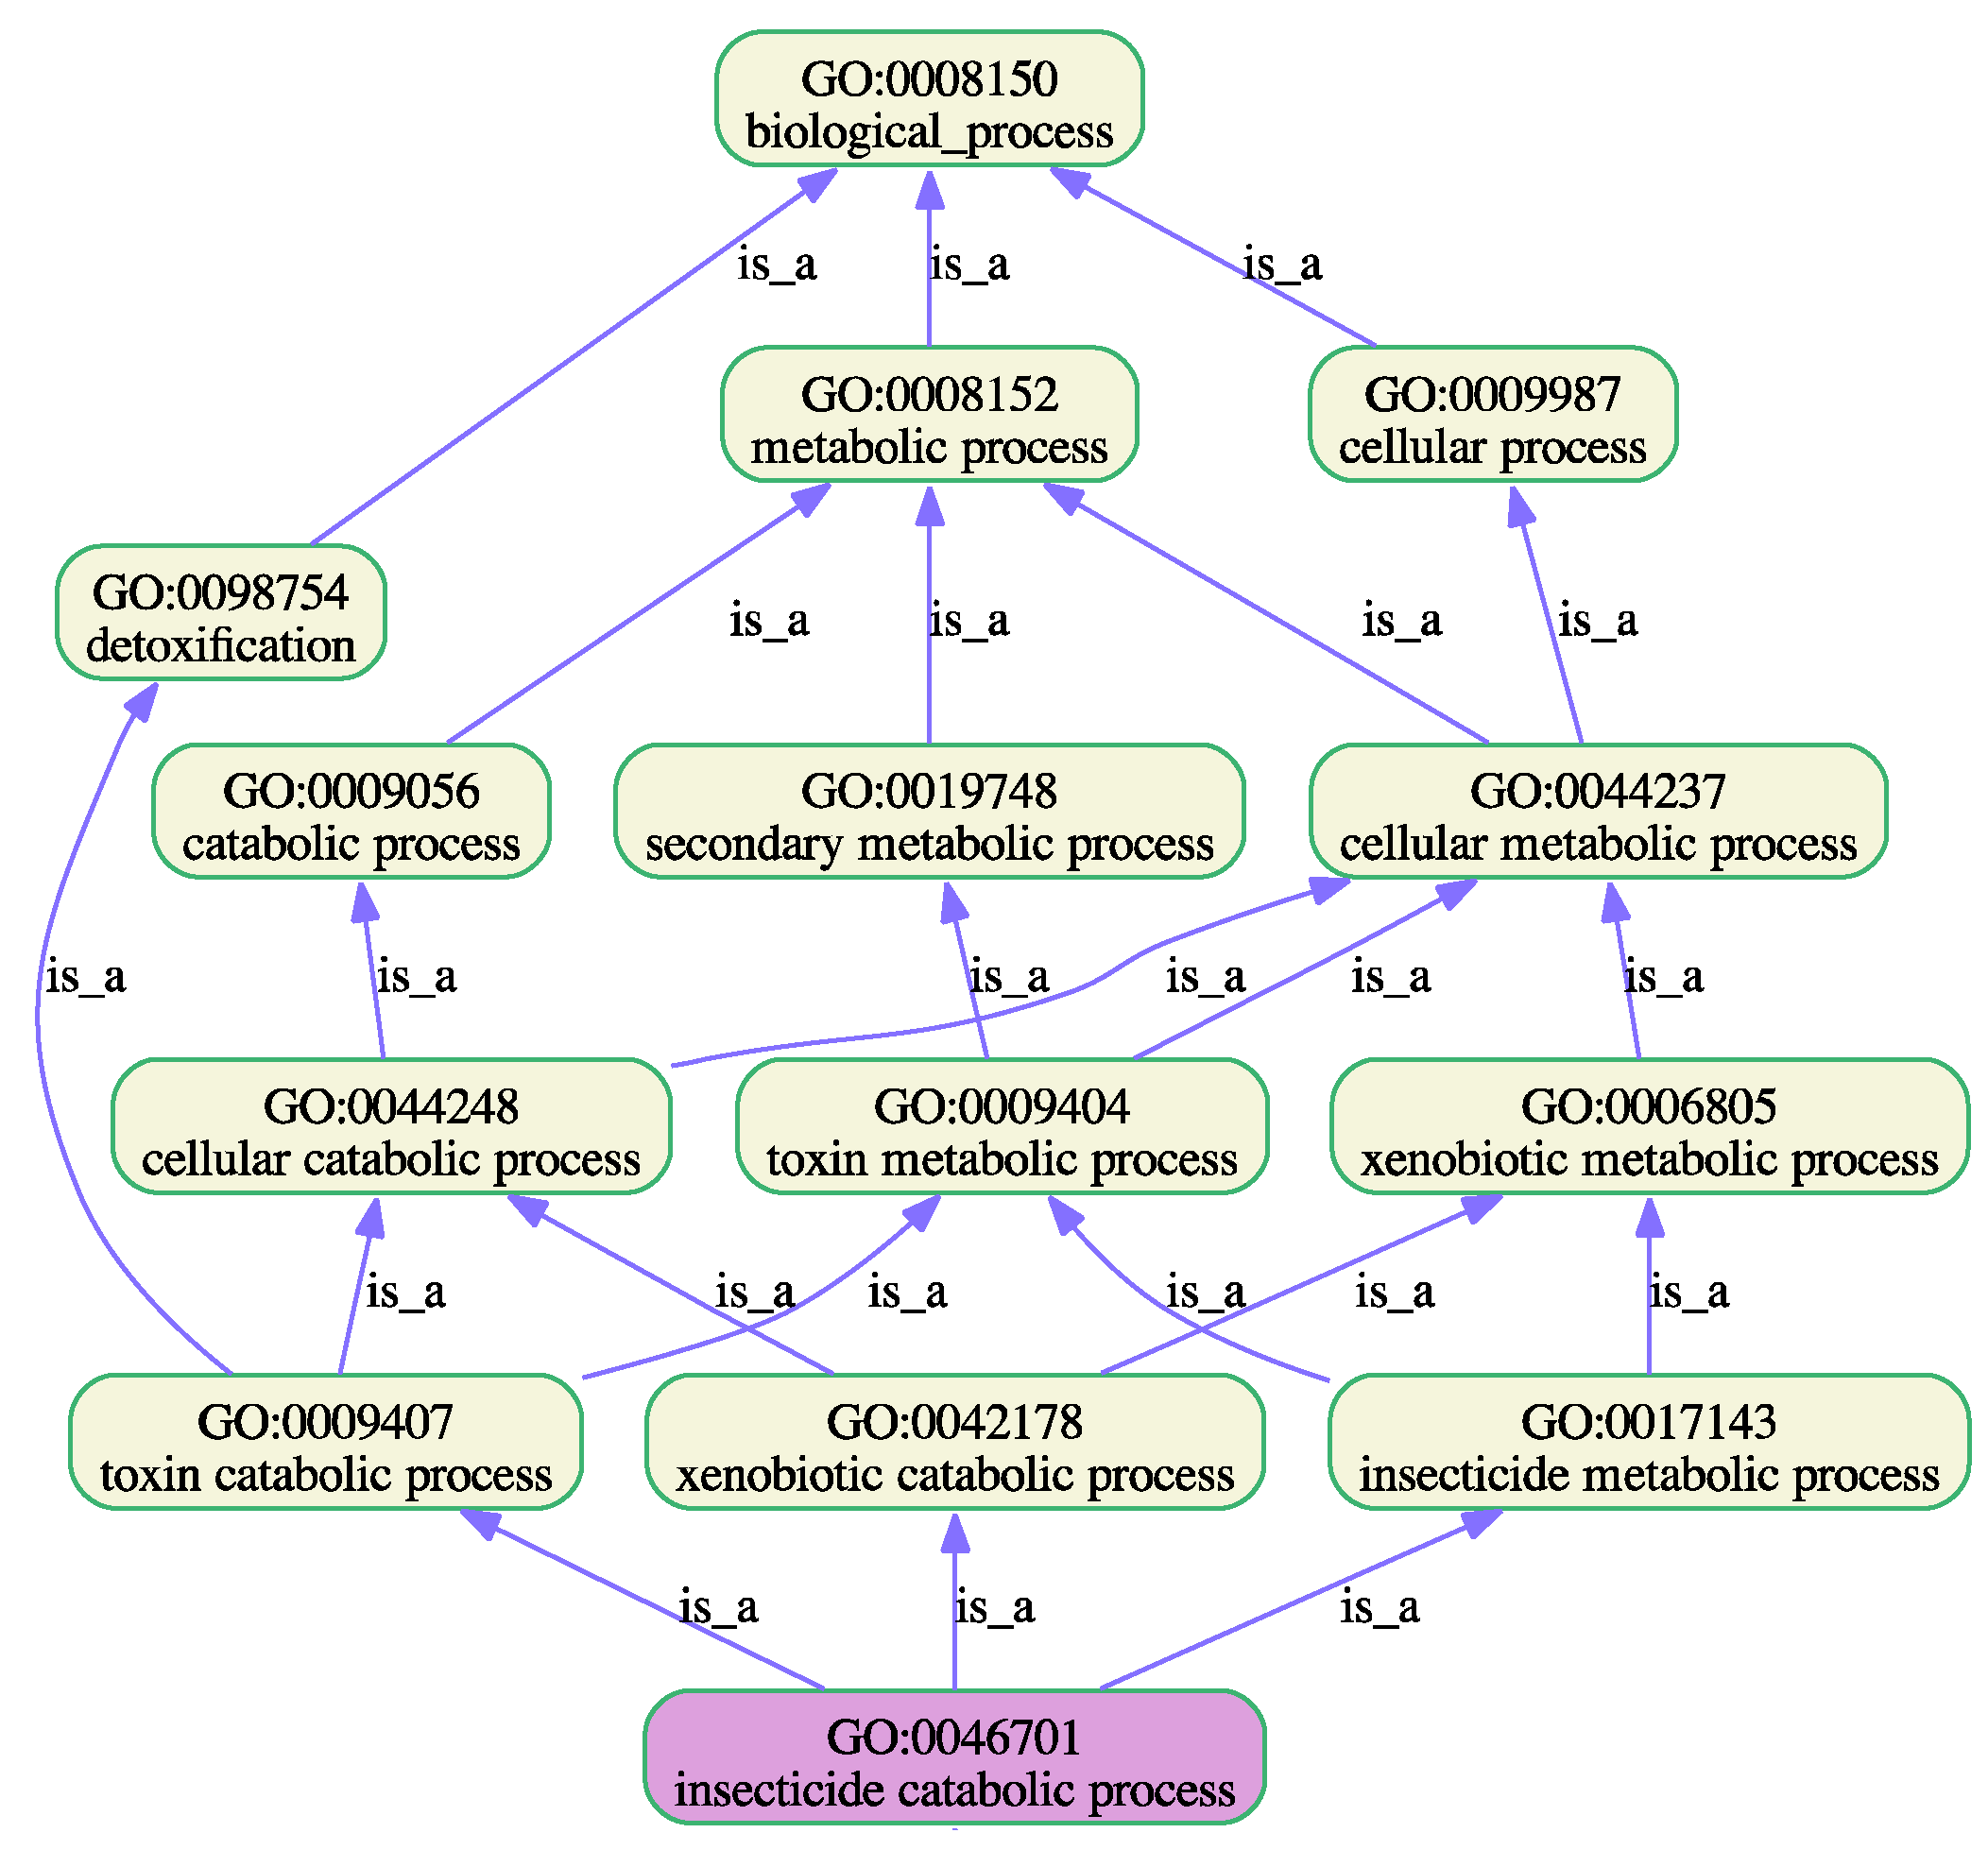

Table 1.
P450 gene numbers and their clan-wise distribution in D. melanogaster (Dmel), A. gambiae (Agam), A. aegypti (Aaeg) and C. quinquefasciatus (Cqui).
Table 1.
P450 gene numbers and their clan-wise distribution in D. melanogaster (Dmel), A. gambiae (Agam), A. aegypti (Aaeg) and C. quinquefasciatus (Cqui).
| Total | Clan2 | Clan3 | Clan4 | mitochondrial | Source | |
|---|---|---|---|---|---|---|
| Family | Family | Family | Family | |||
| Dmel | CYP18, 303-307 | CYP6, 9, 28, 308-310, 317 | CYP4, 311-313, 316, 318 | CYP12, 49, 301-2, 314-5 | ||
| 85 | No. genes: 6 | No. genes: 36 | No. genes: 32 | No. genes: 11 | [11] | |
| Agam | CYP15, 303-307 | CYP6, 9, 329 | CYP4, 325 | CYP12, 49, 301-2, 314-5 | ||
| 106 | No. genes: 10 | No. genes: 42 | No. genes: 45 | No. genes: 9 | [11] | |
| Aaeg | CYP15, 18, 303-307 | CYP6, 9, 329 | CYP4, 325 | CYP12, 49, 301-2, 314-5 | [18] | |
| 164 | No. genes: 11 | No. genes: 84 | No. genes: 59 | No. genes: 10 | ||
| Cqui | Cyp15, 303-307 | CYP6, 9, 329 | CYP4, 325 | Cyp12, 301-2, 314-14 | ||
| 196 | No. genes: 14 | No. genes: 88 | No. genes: 83 | No. genes: 11 | [19] |
Table 2.
Number of CYP genes and proteins in the “labile” and “stable” datasets.
| Unculled | Culled | ||||
|---|---|---|---|---|---|
| No. genes | “stable” | “labile” | “stable” | “labile” | |
| Dmel | 83 | 53 | 30 | 46 | 22 |
| Agam | 94 | 49 | 45 | 31 | 28 |
| Aaeg | 131 | 58 | 73 | 33 | 30 |
| Cqui | 178 | 85 | 93 | 52 | 35 |
| Total | 486 | 245 | 241 | 162 | 115 |
Table 3.
Sequence and functional features and corresponding bioinformatic tools.
| Features | Bioinformatic methods |
|---|---|
|
Genomic features: gene length, % of GC content, number of transcripts, number of exons, length of exon and intron |
VectorBase [39] |
|
Protein sequence features: protein length, molecular weight, protein charge, isoelectric point, amino acid composition, hydrophobicity |
EMBOSS Pepstats [43] |
| Phosphorylation | PhosNet 3.0 [44] |
| Signal peptide; transmembrane domains; Subcellular localisation | BUSCA [45] |
|
Gene Ontology terms: biological process, cellular component, molecular function |
NetGO 3.0 [46] |
Table 4.
Median gene length, GC contents, number of transcripts, number of exons, exon length and intron length for essential and viable genes*.
Table 4.
Median gene length, GC contents, number of transcripts, number of exons, exon length and intron length for essential and viable genes*.
| Datasets | Gene length (bp) | No. of exons | Exon length (bp) | Intron length (bp) | No. transcripts | % GC content | |
|---|---|---|---|---|---|---|---|
| Non-culled | “labile” | 1840 | 3 | 1524 | 311 | 1 | 47.20 |
| “stable” | 2149 | 4 | 1518 | 612 | 1 | 44.78 | |
| p-value | 2.8034e-07 | 1.0212e-08 | 0.0209 | 7.6899e-09 | 0.3531 | 0.0270 | |
| Culled | “labile” | 1890 | 3 | 1527 | 359 | 1 | 46.48 |
| “stable” | 2165 | 4 | 1521 | 612 | 1 | 45.63 | |
| p-value | 7.1450e-04 | 4.4157e-06 | 0.0302 | 1.5198e-04 | 0.6973 | 0.3718 | |
| * The median value of each feature is reported. p–values are determined from a Mann–Whitney U test. Statistically significant results were evaluated based on the Bonferroni corrected p–value of 0.0083. They are shown in bold typeface. | |||||||
Table 5.
Median values of different protein features and the p-values of their distribution calculated using the Mann–Whitney U test *.
Table 5.
Median values of different protein features and the p-values of their distribution calculated using the Mann–Whitney U test *.
| Unculled | Culled | |||||
|---|---|---|---|---|---|---|
| Property | “Labile” | “Stable” | p-value | “Labile” | “Stable” | p-value |
| MW | 5.8236e+04 | 5.8106e+04 | 0.0124 | 5.8454e+04 | 5.8162e+04 | 0.0249 |
| IEP | 8.3088 | 8.1503 | 0.2324 | 8.2718 | 8.3542 | 0.4991 |
| Charge | 9 | 9.5000 | 0.4037 | 10 | 10.5000 | 0.0724 |
| Hydrophobicity | -19.6450 | -16.0583 | 4.3384e-08 | -18.7226 | -15.5340 | 2.7720e-04 |
| Aromatic | 13.2110 | 13.1148 | 0.5403 | 13.2110 | 13.1417 | 0.6721 |
| Aliphatic | 28.5714 | 29.7619 | 3.4826e-10 | 28.6299 | 29.8651 | 3.1629e-06 |
| Acidic | 12.0240 | 11.5686 | 3.5141e-08 | 11.7530 | 11.4458 | 3.8132e-05 |
| Basic | 14.7810 | 14.6000 | 0.0258 | 14.6535 | 14.6939 | 0.6806 |
| Charged | 26.6791 | 26.0521 | 1.2929e-06 | 26.4706 | 25.9669 | 0.0056 |
| Polar | 45.0980 | 44.3340 | 6.3566e-07 | 45.0902 | 44.3137 | 2.4062e-04 |
| Non-polar | 54.9020 | 55.6660 | 5.1469e-07 | 54.9098 | 55.6863 | 2.4062e-04 |
| Small | 44.6000 | 44.6939 | 0.6356 | 44.6680 | 44.4890 | 0.6232 |
| Tiny | 23.3202 | 23.5887 | 0.0306 | 23.5409 | 23.8095 | 0.3240 |
| * The median value of each feature is reported. p–values are determined from a Mann–Whitney U test. Statistically significant results were evaluated based on the Bonferroni corrected p–value of 0.0038. They are shown in bold typeface. | ||||||
Table 6.
Differences in the amino acid frequency of usage between the P450 proteins of the two groups in the culled and non-culled datasets.
Table 6.
Differences in the amino acid frequency of usage between the P450 proteins of the two groups in the culled and non-culled datasets.
| Unculled | Culled | |||||
|---|---|---|---|---|---|---|
| Aa* | “Labile” | “Stable” | p-value | “Labile” | “Stable” | p-value |
| A | 5.6711 | 6.1100 | 4.0438e-04 | 5.8601 | 6.2500 | 0.0145 |
| C | 1.1811 | 1.5238 | 1.9760e-10 | 1.2048 | 1.5385 | 2.8718e-05 |
| D | 5.4409 | 5.3465 | 0.0230 | 5.4104 | 5.2427 | 0.0963 |
| E | 6.4338 | 6.1151 | 8.9284e-06 | 6.3241 | 6.0362 | 0.0012 |
| F | 6.5476 | 6.2000 | 0.0014 | 6.4833 | 6.1100 | 0.0150 |
| G | 5.6075 | 5.3254 | 0.0125 | 5.6863 | 5.3407 | 0.0966 |
| H | 2.1696 | 2.3301 | 4.2799e-05 | 2.2018 | 2.3297 | 0.0233 |
| I | 6.1185 | 6.0827 | 0.8018 | 6.1185 | 6.0038 | 0.7398 |
| K | 6.4639 | 5.4000 | 1.3464e-14 | 6.0998 | 5.3360 | 3.4017e-05 |
| L | 10.0616 | 11.0656 | 2.6111e-12 | 10.2970 | 11.0891 | 7.5251e-07 |
| M | 3.3730 | 2.9851 | 4.2922e-05 | 3.4068 | 3.0364 | 0.0015 |
| N | 4.0161 | 3.9448 | 0.3603 | 3.9062 | 3.8076 | 0.1330 |
| P | 5.0710 | 5.1081 | 0.2145 | 4.9900 | 5.0813 | 0.1682 |
| Q | 3.4765 | 3.5849 | 0.1371 | 3.6290 | 3.6735 | 0.5681 |
| R | 6.0852 | 6.6202 | 1.0888e-04 | 6.3116 | 6.7308 | 0.0013 |
| S | 5.3435 | 5.4104 | 0.4267 | 5.3465 | 5.4409 | 0.4281 |
| T | 5.4326 | 5.2104 | 0.0015 | 5.4902 | 5.1383 | 0.0011 |
| V | 6.5056 | 6.2745 | 0.0128 | 6.4885 | 6.2622 | 0.0318 |
| W | 0.9452 | 1.1236 | 4.8193e-06 | 0.9328 | 1.1494 | 3.9031e-05 |
| Y | 3.5185 | 3.6072 | 0.5588 | 3.4926 | 3.6000 | 0.5164 |
| * amino acid (aa). The p-value for the Bonferroni correction is 0.0025. Statistically significant differences are shown in bold typeface. | ||||||
Table 7.
Summary of predicted signal peptides, subcellular localisation and transmembrane helices.
| Non-culled | Culled | |||
|---|---|---|---|---|
| Biological feature | No.“labile” CYPs | No.“stable” CYPs | No. “labile” CYPs | No. “stable” CYPs |
| Signal peptide | 19 (7.9%) | 28 (11.4%) | 8 (7.0%) | 18 (11.2%) |
| Mito transit | 11 (4.6%) | 5 (2%) | 7 (6.1%) | 2 (1.3%) |
| Mitochondrial membrane | 11 (4.6%) | 5 (2%) | 7 (6.1%) | 2 (1.3%) |
| N-terminal helix | 198 (82.2%) | 196 (80.0%) | 95 (82.6%) | 132 (81.5%) |
Table 8.
Gene enrichment in GO terms related to biosynthetic, developmental and detoxification metabolic processes.
Table 8.
Gene enrichment in GO terms related to biosynthetic, developmental and detoxification metabolic processes.
| GO term | Description | Subset1 | All CYPs2 | Dmel2 | Agam2 | Aaeg2 | Cqui2 |
|---|---|---|---|---|---|---|---|
| 1. GO:0048856 | Anatomical structure development | S | 135 (55.1) | 27 (11.0) | 26 (10.6) | 33 (13.5) | 49 (20) |
| L | 75 | 7 | 18 | 23 | 27 | ||
| 2. GO:0008610 | lipid biosynthetic process | S | 141 (57.5) | 26 (10.6) | 26 (10.6) | 38 (15.5) | 51 (20.8) |
| L | 24 (9.9) | 4 (1.7) | 3 (1.2) | 8 (3.3) | 9 (3.7) | ||
| 3. GO:0008202 | steroid metabolic process | S | 95 (38.8) | 11 (4.5) | 29 (11.8) | 37 (15.1) | 18 (7.3) |
| L | 10 (4.1) | 2 (0.8) | 1 (0.4) | 1 (0.4) | 6 (2.5) | ||
| 4. GO:0042445 | hormone metabolic process | S | 53 (21.6) | 12 (4.9) | 15 (6.1) | 15 (6.1) | 11(4.5) |
| L | 4 (1.6) | - | - | - | 4 (1.6) | ||
| 5. GO:0007275 | multicellular organism development | S | 91 (37.1) | 19 (7.7) | 18 (7.3) | 22 (9.0) | 32 (13.0) |
| L | 25 (10.4) | 2 (0.8) | 7 (2.9) | 9 (3.7) | 7 (2.9) | ||
| 6. GO:0009791 | post-embryonic development | S | 19 (7.7) | 6 (2.4) | 4 (1.6) | 6 (2.4) | 3 (1.2) |
| L | - | - | - | - | - | ||
| 7. GO:0002165 | instar larval or pupal development | S | 17 (6.9) | 6 (2.4) | 6 (2.4) | 3 (1.2) | 2 (0.8) |
| L | - | - | - | - | - | ||
| 8. GO:0045456 | ecdysteroid biosynthetic process | S | 10 (4.1) | 4 (1.6) | 4 (1.6) | 1 (0.4) | 1 (0.4) |
| L | - | - | - | - | - | ||
| 9. GO:0006805 | xenobiotic metabolic process | S | 24 (9.8) | 2 (0.8) | 5 (2.0) | 6 (2.4) | 11 (4.5) |
| L | 69 (28.6) | 9 (3.7) | 11 (4.6) | 28 (11.6) | 21 (8.7) | ||
| 10. GO:0046680 | response to DDT | S | 30 (12,2) | 8 (3.3) | 5 (2.0) | 8 (3.3) | 9 (3.7) |
| L | 86 (35.7) | 10 (4.1) | 22 (9.1) | 29 (12.0) | 25 (10.4) | ||
| 11. GO:0009404 | toxin metabolic process | S | 12 (4.9) | 3 (1.2) | 2 (0.8) | 2 (0.8) | 5 (2.0) |
| L | 28 (11.6) | 7 (2.9) | 2 (0.8) | 10 (4.1) | 9 (3.7) | ||
| 1 S denotes “stable”; L denotes “labile). 2 values in () denote % | |||||||
Table 9.
Summary of characteristics likely to be associated with essential or viable genes.
| “Stable” gene tendencies | “Labile” gene tendencies |
|---|---|
| Longer genes; longer introns; more exons | Simpler, shorter gene structure |
| More hydrophobic; relative proportion of aliphatic amino acids higher; enriched in Cys, Arg, Leu, and Trp | Less hydrophobic; relative proportion of charged and polar amino acids higher; enriched in Glu, Lys, and Met |
| Involved in biosynthetic and developmental processes, such as biosynthesis of lipids and hormones essential for instar larval or pupal morphogenesis | Involved in cellular catabolic processes, detoxification of xenobiotics and insecticide metabolic processes |
Disclaimer/Publisher’s Note: The statements, opinions and data contained in all publications are solely those of the individual author(s) and contributor(s) and not of MDPI and/or the editor(s). MDPI and/or the editor(s) disclaim responsibility for any injury to people or property resulting from any ideas, methods, instructions or products referred to in the content. |
© 2024 by the authors. Licensee MDPI, Basel, Switzerland. This article is an open access article distributed under the terms and conditions of the Creative Commons Attribution (CC BY) license (http://creativecommons.org/licenses/by/4.0/).
Copyright: This open access article is published under a Creative Commons CC BY 4.0 license, which permit the free download, distribution, and reuse, provided that the author and preprint are cited in any reuse.


