
Submitted:
02 December 2024
Posted:
04 December 2024
You are already at the latest version
Abstract
Background: The swift expansion of the invasive malaria vector, Anopheles stephensi, throughout Africa presents a major challenge to malaria control initiatives. Unlike the native African vectors, An. stephensi thrives in urban settings and has developed resistance to multiple classes of insec-ticides, including pyrethroids, organophosphates, and carbamates. Methods: Insecticide suscep-tibility tests were performed on field-collected An. stephensi mosquitoes from Awash Sebac Kilo, Ethiopia, to assess insecticide resistance levels. Illumina RNA-seq analysis was then employed to compare the transcriptomes of resistant field populations and susceptible laboratory strains (STE2). Results: An. stephensi populations exhibited high levels of resistance to both deltamethrin (mortality, 39.4 ± 6.0%) and permethrin (mortality, 59.3 ± 26.3%) in WHO tube bioassays. RNA-seq analysis revealed that both resistant and untested field populations exhibited increased expression of genes associated with pyrethroid resistance, including esterases, P450s, and GSTs, compared to the susceptible STE2 strain. Notably, Esterase E4 and venom carboxylesterase-6 were significantly overexpressed, up to 70-fold, compared to the laboratory strain. Functional enrichment analysis revealed a significant overrepresentation of genes associated with catalytic activity under mo-lecular functions and metabolic process under biological process. Using weighted gene co-expression network analysis (WGCNA), we identified two co-expression modules (green and blue) that included 48 genes strongly linked to pyrethroid insecticide resistance. A co-expression network was subsequently built based on the weight values within these modules. Conclusions: This study highlights the role of esterases in pyrethroid resistance in An. stephensi. The identifi-cation of candidate genes associated with insecticide resistance will facilitate the development of rapid diagnostic tools to monitor resistance trends.
Keywords:
Anopheles stephensi
; invasive malaria vector
; RNA-seq
; differentially expressed genes
; co-expression network
; Ethiopia
1. Introduction
The rapid spread of the invasive malaria vector, Anopheles stephensi, across Africa poses a significant threat to malaria control efforts. Originating from Southeast Asia and the Arabian Peninsula, this mosquito species has rapidly colonized multiple African countries such as Djibouti, Ethiopia, Somalia, Kenya, Sudan, Nigeria and Ghana, leading to an increase in malaria cases [1,2]. Unlike the native African vectors, An. stephensi thrives in urban settings and has developed resistance to multiple classes of insecticides, including pyrethroids, organophosphates, and carbamates [3,4,5]. This widespread resistance undermines the effectiveness of traditional control measures such as long-lasting insecticidal nets (LLINs) and indoor residual spraying (IRS) [6,7]. To effectively manage insecticide resistance, it is crucial to monitor resistance patterns and understand the underlying mechanisms.
Insecticide resistance is primarily driven by two mechanisms: target-site insensitivity and metabolic resistance [8]. Target-site insensitivity, particularly mutations in the voltage-gated sodium channel (VGSC) gene, confers resistance (knockdown resistance, kdr) to pyrethroids and DDT. Mutations and duplications in the acetylcholinesterase 1 (Ace-1) gene have been associated with resistance to carbamates and organophosphates, while mutations in the GABA receptor (Rdl) gene confer resistance to phenylpyrazoles and organochlorines. Additionally, metabolic resistance, which often associated with overexpression of detoxification enzymes, can contribute to resistance to multiple insecticide classes. Other potential mechanisms, such as alterations in the mosquito microbiome and cuticle, may also play a role [9,10].
In An. stephensi, several target-site mutations associated with insecticide resistance have been detected. These include the kdr-West (L1014F) and kdr-east (L1014S) mutations in the voltage-gated sodium channel gene, the N177D mutation in the acetylcholinesterase 1 (Ace-1) gene, and the A296S mutation in the GABA receptor (Rdl) gene [11,12,13,14]. However, the frequency of these mutations is generally low. For instance, the kdr-West mutation has been reported at low frequencies in various populations [11,14,15,16]. Additionally, the V189L mutation in the GSTe2 gene has been detected at low frequency in Ethiopian mosquito populations [13]. These findings suggest that while target-site mutations contribute to insecticide resistance in An. stephensi, other mechanisms, such as metabolic resistance, may play a more significant role. Increased activity of detoxification enzymes, including glutathione S-transferases (GSTs), esterases, and cytochrome P450s, has been implicated in insecticide resistance [17]. Additionally, alterations in membrane transporters, such as ABC transporters, may contribute to reduced insecticide penetration [18,19]. Sanil et al. (2014) demonstrated a strong association between increased GST activity and resistance to multiple insecticide classes, including pyrethroids, organophosphates, organochlorines, carbamates, and biocides [20]. Recently, RNA-seq technology has been utilized to identify genes that are differentially expressed in An. stephensi larvae following permethrin exposure [21]. However, comprehensive whole-transcriptome analyses focused specifically on the molecular mechanisms of pyrethroid insecticide resistance in the newly invasive African field population of An. stephensi have not yet been conducted.
In this study, we performed standard World Health Organization (WHO) bioassays to evaluate insecticide susceptibility of a newly invasive field population of An. stephensi from Ethiopia. To investigate the molecular mechanisms underlying insecticide resistance, we conducted a whole-transcriptome analysis comparing gene expression profiles of resistant field populations with a laboratory-susceptible (STE2) strain. We further compared the transcriptomic profiles of untested field populations to identify shared patterns of gene expression associated with insecticide resistance
2. Materials and Methods
2.1. Mosquito Larval Sampling and Insecticide Susceptibility Bioassay
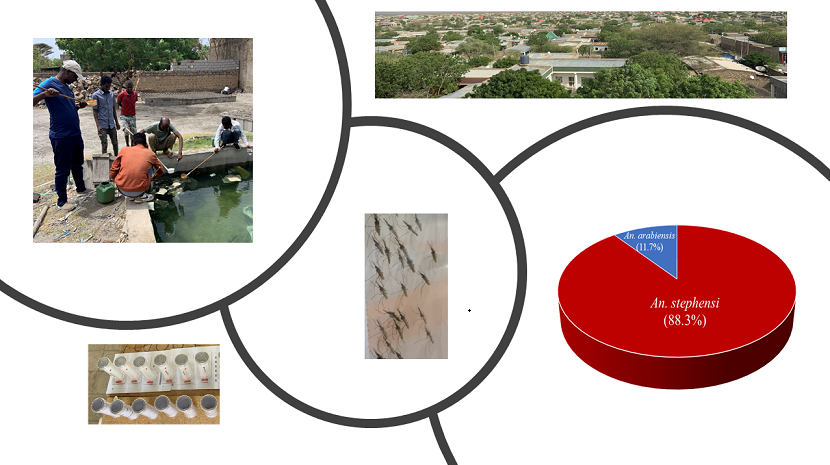
Anopheles mosquitoes were sampled from Awash Subac Kilo, a market town located in central Ethiopia at an altitude of approximately 1,000 meters. With a population of 34,669 (as of July 2021), this region experiences a hot, semi-arid climate characterized by minimal rainfall and a short-wet season from July to September. Both Plasmodium falciparum and P. vivax malaria parasites are present in this region. In June–July 2022, Anopheles larvae and pupae were collected from the field site and reared to the adult stage (3–5 days old). Prior to the insecticide susceptibility bioassay, the morphological identification of Anopheles individuals was performed while the mosquitoes were alive (a brief chill on ice if needed) following the taxonomic keys ) [22]. An. stephensi adult female mosquitoes were then used in the bioassay, where mosquitoes were exposed to pyrethroid insecticide-impregnated papers (0.05% deltamethrin and 0.75% permethrin) at diagnostic doses using WHO test tubes in a bio-secure insectary. Each insecticide was tested with batches of 25 female An. stephensi mosquitoes in both test and control tubes. At least 100 mosquitoes were exposed to each insecticide for 1 hour. Mortality was assessed 24 hours after exposure. Abbot's formula was applied to adjust for control mortality when needed. According to the WHO guidelines, mosquito populations were classified as 'resistant' if mortality rates were below 90%, as 'suspected resistant' if mortality rates were between 90% and 98%, and ‘susceptible” if mortality rates > 98% [8]. An. stephensi mosquitoes that survived the insecticide exposure test, along with unexposed samples, were promptly killed by placing them in a deep freezer for about 30 minutes until complete knockdown occurred. Samples were immediately stored in 0.5 ml Eppendorf tubes with RNALater for subsequent molecular and whole transcriptome analysis.
2.2. Molecular Identification of Anopheles Mosquito Species
DNA was extracted from a single leg of a subset of Anopheles mosquitoes to confirm species via qPCR. The highly sensitive TaqMan probe-based qPCR method was used to identify An. arabiensis and An. stephensi [23,24]. A total of 480 individuals were tested for molecular confirmation of species identification. Additionally, a subset of 20 individuals from each species underwent Sanger sequencing of ITS2 PCR products to further validate species identity [25].
2.3. RNA Extraction and Transcriptome Sequencing (RNA-seq)
RNA was extracted individually from An. stephensi female mosquito samples using column-based RNA extraction kits (cat # 2050, Zymo Research, CA, USA). The RNA was assessed for quality using agarose gel electrophoresis (1%) and quantified with the Qubit 3.0 RNA HS Assay (ThermoFisher). The RNA samples comprised three groups: field deltamethrin-resistant (AWR) mosquitoes, field unexposed control (AWK) mosquitoes, and a susceptible laboratory strain (STE2: BEI Resources, Cat# MRA-128). For each group, 10 RNA samples were pooled in equal amounts to create one composite sample. Two replicates/pools were prepared per group. In total, six pools, comprising 60 mosquitoes, were generated for RNA library preparation and RNA-seq. The IDT xGen RNA library prep kit with Illumina Ribo-zero Plus was used for library preparation. Final quality control was performed using Kapa qPCR and Agilent TapeStation. The libraries were sequenced on an Illumina® NovaSeq S4-PE150.
2.4. Data Filtering, Mapping Reads, and Transcriptome Analysis
The generated sequences underwent an initial filtering process. Raw paired-end sequence reads were assessed for quality using FASTQC (v0.12.1) [26], and the Trimmomatic (v.0.39) [27] was employed to remove Illumina adapters. After quality control and filtering, the sequence reads were analyzed using CLC Genomics Workbench v23 (CLC Bio, Cambridge, MD), with the reference genome VectorBase-68_AstephensiUCISS2018. The RNA-seq analysis was conducted using the “RNA-seq tool” and the reference genome annotated with genes and transcripts, applying the following parameters: Mismatch cost = 2, Insertion cost = 3, Deletion cost = 3, Length fraction = 0.8, Similarity fraction = 0.8, Maximum number of hits per read = 10, Count paired reads as two = No, Ignore broken pairs = Yes, and Expression value = RPKM. The Differential Expression in Two Groups tool in CLC was used to conduct a statistical differential expression analysis for a set of expression tracks and a control. The experiments included two biological replicates for both the field population group and the lab strain control group. The raw gene expression matrix was transformed into a normalized gene expression matrix. The biological coefficient of variation (BCV), representing biological variability, was estimated using edgeR, which models RNA-seq data variability through a negative binomial distribution [28]. Differentially expressed genes (DEGs) were identified using the "Differential Expression in Two Groups" tool in CLC, with the STE2 group used as the control. All RNA-seq data were screened for False Discovery Rate (FDR), and results were deemed valid if the FDR was less than 0.05 [29]. DEGs were determined based on a |fold-change| > 1.5 and false discovery rate (FDR) < 0.05. ShinyGo bioinformatics tool was used for functional annotation and pathway analysis of the DEGs [30].
2.5. Gene Co-Expression Network Construction with WGCNA
Gene co-expression networks analysis were conducted using the WGCNA package (version 1.72) in R based on differentially expressed genes (DEGs) [31]. The soft threshold (power) was determined using the “pickSoftThreshold” function to generate a scale-free network for both population datasets. The cluster dendrogram and co-expression gene module tree for DEGs were created using the "Dynamic Tree Cut" and "Merged Dynamic" methods. The module eigengene (ME), representing the expression profiles of the module genes, was calculated using WGCNA. Gene co-expression networks were then independently constructed with the blockwise Modules function using these parameters: power = 28, minModuleSize = 30, deepSplit = 2, and mergeCutHeight = 0.3. Edge and node data for the target module were exported with the "export Network To Cytoscape" function to build a co-expression network, which was visualized using Cytoscape software [32].
3. Results
3.1. Species Composition and Pyrethroid Susceptibility of An. Stephensi
Molecular identification of the Anopheles species indicated that 88.3% were An. stephensi and 11.7% were An. arabiensis (n=480), with no other Anopheles species identified. High levels of pyrethroid insecticide resistance were detected in the An. stephensi field population, with mortality rates falling below 60% for both tested insecticides. The mortality rate for permethrin was 59.3% ± 26.3% (n = 176), while for deltamethrin, it was 39.4% ± 18.9% (n = 250) (Figure S1).
3.2. RNA Sequencing and Preliminary Analysis of the Raw Data
RNA-seq was performed from three different groups: field resistant (AWR), field unexposed (AWK), and lab strain (STE2), with two independent biological replicates per group. The RNA used for library construction had to pass quantity and quality control criteria. Six libraries were constructed from the three different groups, and raw reads were produced from the six libraries using the Illumina sequencing platform. RNA-seq generated a total of 70–85 million reads per sample, with an average of 80.6 ± 23.6 million reads. After trimming, 57.5% ± 0.7% of paired end reads, 19.5% ± 0.2% of forward reads, and 9.4% ± 0.3% of reverse reads were retained, while 14.1% ± 0.5% of reads were discarded (Table 1).
3.3. Differentially Expressed Gene Analyses
The cleaned, high-quality RNA-seq reads were used to evaluate differences in gene expression (Figure 1), with FPKM values calculated to quantify expression levels across all genes in the three groups (6 pooled samples). The raw gene expression matrix was transformed into a normalized gene expression matrix (Figure S2). A total of 10,568 protein-coding genes (83.2% of the 12,705 total genes) were expressed at a minimum exon read count of 5 across the six pooled samples (Table S1). Principal component analysis (PCA) of the RNA-seq data revealed greater variation between groups than within groups (Figure 2A). The estimated coefficient of variation was 0.0517, corresponding to a biological coefficient of variation (BCV) of 0.2273. This BCV value is lower than that typically observed in other studies for well-controlled experiments (BCV = 0.4)(Figure 2B) [33], indicating the stability and reliability of the RNA-seq data.
Differential gene expression analysis identified 885 significantly differentially expressed genes (DEGs) of the two groups (Table S2). Specifically, 560 DEGs were found between AWR and STE2, with 168 downregulated and 392 upregulated genes (Figure 3A). Similarly, 490 DEGs were identified between AWK and STE2 (Figure 3B). These results provide insights into the molecular mechanisms underlying phenotypic differences between the two groups.
3.4. Classification of the Differentially Expressed Genes
Cluster analysis of the 885 differentially expressed genes revealed distinct patterns of gene expression of the two groups (Figure S3). Approximately one-third of the genes (165) were shared between the two groups, while the remaining two-thirds (395 and 325) were unique to each group, indicating significant genetic divergence among the populations (Figure S4).
A total of 20 genes involved in metabolic detoxification (P450s, GSTs, and esterases) were consistently differentially expressed between resistant, untested field, and susceptible laboratory An. stephensi populations (Table 2). Notably, genes from the esterase family, including venom carboxylesterase-6 and esterase E4, exhibited the most significant upregulation (up to 70-fold) in resistant populations compared to the susceptible strain. Additionally, four P450 genes and three UGT genes were consistently upregulated. In contrast, a few genes, such as chorion peroxidase and protein arginine N-methyltransferase 5, were downregulated (Table 2).
3.5. Functional Annotation of the Differentially Expressed Genes
Gene Ontology (GO) enrichment analysis was conducted to functionally annotate the differentially expressed genes (DEGs) based on the An. stephensi SDA-500 annotation. The GO analysis identified a total of 27 enriched GO categories, which include nine biological processes, one cellular components, and 17 molecular functions (Table S3). The most significantly enriched categories were in the catalytic activity under molecular functions and metabolic process under biological process (Figure 4). Furthermore, the pathway network analysis of functional linkages highlighted the top 20 GO enrichments, including GO:0003824 catalytic activity, GO:0016491 oxidoreductase activity, GO:0016787 hydrolase activity, GO:0004252 serine-type endopeptidase activity, GO:0008236 serine-type peptidase activity, GO:0017171 serine hydrolase activity, GO:0005576 extracellular region, GO:0008252 nucleotidase activity, GO:0008061 chitin binding, GO:0004175 endopeptidase activity, GO:0016788 hydrolase activity acting on ester bonds, GO:1901564 organonitrogen compound metabolic proc., GO:0008152 metabolic process, GO:0052689 carboxylic ester hydrolase activity, GO:0004497 monooxygenase activity, GO:0055085 transmembrane transport, GO:0005506 iron ion binding, GO:0022857 transmembrane transporter activity, GO:0005215 transporter activity, GO:0006575 cellular modified amino acid metabolic proc (Figure 5).
3.6. Construction of Gene Co-Expression Network
A soft threshold (power) of 28 was applied to construct a scale-free network for the differentially expressed genes (Figure S5A and Figure S5B). From the 560 differentially expressed genes between the resistant field population and the susceptible lab strain, five gene co-expression modules were identified from the original 20 modules (Figure 6). The blue and green modules exhibited consistent expression patterns across replicates (Figure S6). Most genes in the green module were upregulated, while those in the blue module were downregulated. A total of 48 genes in each module showed co-expression (Table S4 and Table S5). Figure 7 presents the co-expression network of genes associated with pyrethroid insecticide resistance in An. stephensi, with edge weight thresholds of 0.4 and 0.68, respectively.
4. Discussion
The recent invasion of An. stephensi in the Horn of Africa poses a significant threat to malaria control efforts. To effectively combat this invasive vector, it is crucial to assess it susceptibility to insecticides and understand the mechanisms underlying its insecticide resistance. This study aimed to investigate the molecular basis of insecticide resistance in An. stephensi populations in Ethiopia. Through RNA-seq analysis, we identified significant upregulation of esterase E4 and venom carboxylesterase-6 in the resistant field populations compared to a laboratory-susceptible strain. While the kdr mutation was reported at low frequencies, our findings suggest that metabolic resistance, mediated by detoxification enzymes, could be a primary driver of insecticide resistance in An. stephensi. These insights emphasize the need for implementing insecticide resistance management strategies which include integrated vector management to combat this growing challenge.
Esterases are enzymes that catalyze the hydrolysis of ester bonds. Esterase E4 has been previously implicated in insecticide resistance in other insects [34]. Recent studies have highlighted the potential role of venom carboxylesterase-6-like genes in insecticide resistance. For instance, Wang et al. (2023) identified a potential insecticide resistance marker within this gene in Bemisia tabaci [35]. Additionally, Kang et al. (2021) identified venom carboxylesterase-6-like as a critical odorant-degrading enzyme (ODE) in Aphidius gifuensis [36]. In our study, we observed significantly higher expression of venom carboxylesterase-6-like (a 52- to 70-fold increase) and Esterase E4 (a 26- to 33-fold increase) in the field population. This suggests that these genes may play a role in the detoxification of pyrethroid insecticides. Additionally, several other metabolic detoxification genes were found to be overexpressed, including monooxygenases (e.g., CYP6D3), glutathione S-transferases (e.g., GST1), and immunity genes (e.g., scaf, SP24D, SND1).
Next-generation sequencing (NGS), particularly RNA-seq, has revolutionized transcriptomic analysis by providing a comprehensive and unbiased view of gene expression [37,38]. Despite advancements, challenges persist, especially with organisms that have high rRNA content, such as archaea and certain insects [39,40,41]. Although RNA-seq protocols have greatly improved, residual rRNA contamination can still affect data quality, particularly in studies using kits developed for mammalian samples, where rRNA removal may be less specific in non-target organisms like mosquitoes. In our study, we successfully employed RNA-seq to identify differentially expressed genes in An. stephensi mosquitoes despite these limitations. While the Illumina Ribo-Zero Plus rRNA Depletion Kit proved effective, residual rRNA contamination was observed, highlighting the need for optimized protocols for non-standard organisms.
In Ethiopia, An. stephensi populations developed resistance to various insecticides. Several target-site mutations, including kdr-West (L1014F) in the voltage-gated sodium channel, N177D in acetylcholinesterase 1 (Ace-1), and A296S in the GABA receptor (Rdl), were detected in these populations [11,12,13]. While our RNA-seq analysis provides valuable insights into gene expression patterns, it was not optimal for SNP detection due to the limitations of pooled RNA-seq, such as reduced genomic coverage and potential allele frequency bias. To address these limitations, future studies should focus on high-quality RNA extraction and increased sequencing depth to enable accurate SNP detection and analysis.
5. Conclusions
The rapid spread of the invasive malaria vector, Anopheles stephensi, poses a significant threat to malaria control efforts in Africa. The emergence of insecticide resistance in this species further complicates vector control strategies. Our RNA-seq analysis revealed that An. stephensi populations in Ethiopia exhibited elevated expression of genes associated with pyrethroid resistance, including esterases (e.g., esterase E4 and venom carboxylesterase-6), P450s, and GSTs. These findings suggest that metabolic resistance plays a crucial role in the development of insecticide resistance in this species. Functional validation of key genes involved in insecticide resistance, coupled with the development of improved resistance markers, will be essential for monitoring resistance trends and guiding future control efforts.
Supplementary Materials
The following supporting information can be downloaded at: Preprints.org, Figure S1: The mortality rates after insecticide exposure in the Anopheles stephensi field population in Awash Subac Kilo, Ethiopia; Figure S2: Violin plot of gene expression patterns for each population; Figure S3: Heatmap and hierarchical clustering of the 885 DEGs across the three groups; Figure S4: Venn diagram shows the 885 differentially expressed genes identified in the field An. stephensi population compared to lab strain (STE2). AWK, field un-pheneotyped; AWR, field resistant; Figure S5: Determine the threshold value for construction of a biological correlation network. A, Scale independence; B, Mean connectivity; Figure S6: Heatmap showing the five gene co-expression modules detected from the differentially expressed genes between resistant field population and susceptible lab strain; Table S1: List of the 10,568 protein-coding genes expressed at a minimum exon read count of five across the six pooled samples; Table S2 List of the 885 significantly differentially expressed genes (DEGs) predicted from the two comparison; Table S3: List of the 27 significantly enriched GO terms of the differentially expressed genes; Table S4 Gene co-expression network identified in the green module (weight > 0.4, 48 genes); Table S5 Gene co-expression network identified in the blue module (weight > 0.68, 48 genes).
Author Contributions
Conceptualization, supervision, and project administration, G.Y. and D.Z.; resources and validation, G.Y and D.Y.; data curation, software, investigation, and formal analysis, D.Z. J.C., and T.D.; methodology and writing—original draft, D.Z.; funding acquisition, G.Y.; writing—review and editing, D.Z., T.D., D.Y. M.L., G.Z., X.W., and G.Y. All authors have read and agreed to the published version of the manuscript.
Funding
This research was funded by the National Institutes of Health (Grants U19 AI129326 and D43 TW001505). The funders did not participate in the study design, data collection and analysis, publication decisions, or manuscript preparation.
Institutional Review Board Statement
Not applicable.
Informed Consent Statement
Not applicable.
Data Availability Statement
The data supporting the findings of this study are available within the paper and its supplementary information file. The original contributions presented in the study are publicly accessible. The RNA-seq data generated in this study have been deposited in the NCBI repository under accession number PRJNA1182831. BioSample accession numbers SAMN44614196 - SAMN44614201.
Acknowledgments
We would like to express our sincere gratitude to the field team of the ICEMR project and study participants in Ethiopia for their invaluable contributions in collecting mosquito samples. We also thank the University of California, Irvine, for providing the necessary facilities and support for this study.
Conflicts of Interest
All authors declare no conflicts of interest.
References
- Ochomo, E. O.; Milanoi, S.; Abong’o, B.; Onyango, B.; Muchoki, M.; Omoke, D.; Olanga, E.; Njoroge, L.; Juma, E. O.; Otieno, J. D. , Detection of Anopheles stephensi mosquitoes by molecular surveillance, Kenya. Emerg. Infect. Dis. 2023, 29, 2498. [Google Scholar] [CrossRef] [PubMed]
- Zhou, G.; Zhong, D.; Yewhalaw, D.; Yan, G. , Anopheles stephensi ecology and control in Africa. Trends Parasitol. 2024, 40, 102–105. [Google Scholar] [CrossRef] [PubMed]
- Teshome, A.; Erko, B.; Golassa, L.; Yohannes, G.; Irish, S. R.; Zohdy, S.; Yoshimizu, M.; Dugassa, S. , Resistance of Anopheles stephensi to selected insecticides used for indoor residual spraying and long-lasting insecticidal nets in Ethiopia. Malar J 2023, 22, 218. [Google Scholar] [CrossRef] [PubMed]
- Taylor, R.; Messenger, L. A.; Abeku, T. A.; Clarke, S. E.; Yadav, R. S.; Lines, J. , Invasive Anopheles stephensi in Africa: insights from Asia. Trends Parasitol. 2024, 40, 731–743. [Google Scholar] [CrossRef] [PubMed]
- Abbasi, M.; Hanafi-Bojd, A. A.; Yaghoobi-Ershadi, M. R.; Vatandoost, H.; Oshaghi, M. A.; Hazratian, T.; Sedaghat, M. M.; Fekri, S.; Safari, R.; Mojahedi, A. R.; Salari, Y. , Resistance status of main malaria vector, Anopheles stephensi Liston (Diptera: Culicidae) to insecticides in a malaria Endemic Area, Southern Iran. Asian Pac. J. Trop. Med. 2019, 12, 43–48. [Google Scholar]
- Okumu, F. O.; Moore, S. J. , Combining indoor residual spraying and insecticide-treated nets for malaria control in Africa: a review of possible outcomes and an outline of suggestions for the future. Malaria J. 2011, 10, 1–13. [Google Scholar] [CrossRef]
- Mosha, J. F.; Kulkarni, M. A.; Lukole, E.; Matowo, N. S.; Pitt, C.; Messenger, L. A.; Mallya, E.; Jumanne, M.; Aziz, T.; Kaaya, R. , Effectiveness and cost-effectiveness against malaria of three types of dual-active-ingredient long-lasting insecticidal nets (LLINs) compared with pyrethroid-only LLINs in Tanzania: a four-arm, cluster-randomised trial. The Lancet 2022, 399, 1227–1241. [Google Scholar] [CrossRef]
- WHO, Test procedures for insecticide resistance monitoring in malaria vector mosquitoes. World Health Organization 2016.
- Muturi, E. J.; Dunlap, C.; Smartt, C. T.; Shin, D. , Resistance to permethrin alters the gut microbiota of Aedes aegypti. Sci. Rep. 2021, 11, 14406. [Google Scholar] [CrossRef]
- Liu, N. , Insecticide resistance in mosquitoes: impact, mechanisms, and research directions. Annu. Rev. Entomol. 2015, 60, 537–559. [Google Scholar] [CrossRef]
- Samake, J. N.; Yared, S.; Getachew, D.; Mumba, P.; Dengela, D.; Yohannes, G.; Chibsa, S.; Choi, S. H.; Spear, J.; Irish, S. R. , Detection and population genetic analysis of kdr L1014F variant in eastern Ethiopian Anopheles stephensi. Infect. Genet. Evol. 2022, 99, 105235. [Google Scholar] [CrossRef] [PubMed]
- Carter, T. E.; Gebresilassie, A.; Hansel, S.; Damodaran, L.; Montgomery, C.; Bonnell, V.; Lopez, K.; Janies, D.; Yared, S. , Analysis of the knockdown resistance locus (kdr) in Anopheles stephensi, An. arabiensis, and Culex pipiens sl for insight Into the evolution of target-site pyrethroid resistance in eastern Ethiopia. Am. J. Trop. Med Hyg. 2022, 106, 632. [Google Scholar] [CrossRef] [PubMed]
- Acford-Palmer, H.; Phelan, J. E.; Tadesse, F. G.; Kristan, M.; Collins, E.; Spadar, A.; Walker, T.; Bousema, T.; Messenger, L. A.; Clark, T. G. , Identification of two insecticide resistance markers in Ethiopian Anopheles stephensi mosquitoes using a multiplex amplicon sequencing assay. Sci. Rep. 2023, 13, 5612. [Google Scholar] [CrossRef] [PubMed]
- Singh, O. P.; Dykes, C. L.; Lather, M.; Agrawal, O. P.; Adak, T. , Knockdown resistance (kdr)-like mutations in the voltage-gated sodium channel of a malaria vector Anopheles stephensi and PCR assays for their detection. Malaria J. 2011, 10, 59. [Google Scholar] [CrossRef]
- Dykes, C. L.; Das, M. K.; Eapen, A.; Batra, C. P.; Ghosh, S. K.; Vijayan, V.; Mishra, S.; Singh, O. P. , Knockdown resistance (kdr) mutations in Indian Anopheles stephensi (Diptera: Culicidae) populations. J. Med. Entomol. 2016, 53, 315–320. [Google Scholar] [CrossRef]
- Yared, S.; Gebressielasie, A.; Damodaran, L.; Bonnell, V.; Lopez, K.; Janies, D.; Carter, T. E. , Insecticide resistance in Anopheles stephensi in Somali Region, eastern Ethiopia. Malar J 2020, 19, 180. [Google Scholar] [CrossRef]
- Vontas, J.; David, J. P.; Nikou, D.; Hemingway, J.; Christophides, G.; Louis, C.; Ranson, H. , Transcriptional analysis of insecticide resistance in Anopheles stephensi using cross-species microarray hybridization. Insect Mol. Biol. 2007, 16, 315–324. [Google Scholar] [CrossRef]
- Epis, S.; Porretta, D.; Mastrantonio, V.; Comandatore, F.; Sassera, D.; Rossi, P.; Cafarchia, C.; Otranto, D.; Favia, G.; Genchi, C. , ABC transporters are involved in defense against permethrin insecticide in the malaria vector Anopheles stephensi. Parasit. Vectors 2014, 7, 1–7. [Google Scholar] [CrossRef]
- Mastrantonio, V.; Ferrari, M.; Epis, S.; Negri, A.; Scuccimarra, G.; Montagna, M.; Favia, G.; Porretta, D.; Urbanelli, S.; Bandi, C. , Gene expression modulation of ABC transporter genes in response to permethrin in adults of the mosquito malaria vector Anopheles stephensi. Acta Trop. 2017, 171, 37–43. [Google Scholar] [CrossRef]
- Sanil, D.; Shetty, V.; Shetty, N. J. , Differential expression of glutathione s-transferase enzyme in different life stages of various insecticide-resistant strains of Anopheles stephensi: A malaria vector. J. Vector Borne Dis. 2014, 51, 97–105. [Google Scholar]
- De Marco, L.; Sassera, D.; Epis, S.; Mastrantonio, V.; Ferrari, M.; Ricci, I.; Comandatore, F.; Bandi, C.; Porretta, D.; Urbanelli, S. , The choreography of the chemical defensome response to insecticide stress: insights into the Anopheles stephensi transcriptome using RNA-Seq. Sci. Rep. 2017, 7, 41312. [Google Scholar] [CrossRef] [PubMed]
- Coetzee, M. , Key to the females of Afrotropical Anopheles mosquitoes (Diptera: Culicidae). Malaria J. 2020, 19, 1–20. [Google Scholar] [CrossRef] [PubMed]
- Walker, E. D.; Thibault, A. R.; Thelen, A. P.; Bullard, B. A.; Huang, J.; Odiere, M. R.; Bayoh, N. M.; Wilkins, E. E.; Vulule, J. M. , Identification of field caught Anopheles gambiae s.s. and Anopheles arabiensis by TaqMan single nucleotide polymorphism genotyping. Malar J 2007, 6, 23. [Google Scholar] [CrossRef] [PubMed]
- Singh, O. P.; Kaur, T.; Sharma, G.; Kona, M. P.; Mishra, S.; Kapoor, N.; Mallick, P. K. , Molecular tools for early detection of invasive malaria vector Anopheles stephensi mosquitoes. Emerg. Infect. Dis. 2023, 29, 36–44. [Google Scholar] [CrossRef]
- Zhong, D.; Hemming-Schroeder, E.; Wang, X.; Kibret, S.; Zhou, G.; Atieli, H.; Lee, M. C.; Afrane, Y. A.; Githeko, A. K.; Yan, G. , Extensive new Anopheles cryptic species involved in human malaria transmission in western Kenya. Sci. Rep. 2020, 10, 16139. [Google Scholar] [CrossRef]
- Andrews, S. , FastQC: a quality control tool for high throughput sequence data. Cambridge, United Kingdom: 2010.
- Bolger, A. M.; Lohse, M.; Usadel, B. , Trimmomatic: a flexible trimmer for Illumina sequence data. Bioinformatics 2014, 30, 2114–2120. [Google Scholar] [CrossRef]
- Robinson, M. D.; McCarthy, D. J.; Smyth, G. K. , edgeR: a Bioconductor package for differential expression analysis of digital gene expression data. Bioinformatics 2009, 26, 139–140. [Google Scholar] [CrossRef]
- Benjamini, Y.; Hochberg, Y. , Controlling the false discovery rate: a practical and powerful approach to multiple testing. J. R. Stat. Soc. Series B Stat. Methodol. 1995, 57, 289–300. [Google Scholar] [CrossRef]
- Ge, S. X.; Jung, D.; Yao, R. , ShinyGO: a graphical gene-set enrichment tool for animals and plants. Bioinformatics 2020, 36, 2628–2629. [Google Scholar] [CrossRef]
- Langfelder, P.; Horvath, S. , WGCNA: an R package for weighted correlation network analysis. BMC bioinformatics 2008, 9, 1–13. [Google Scholar] [CrossRef]
- Shannon, P.; Markiel, A.; Ozier, O.; Baliga, N. S.; Wang, J. T.; Ramage, D.; Amin, N.; Schwikowski, B.; Ideker, T. , Cytoscape: a software environment for integrated models of biomolecular interaction networks. Genome Res. 2003, 13, 2498–2504. [Google Scholar] [CrossRef] [PubMed]
- Chen, Y.; McCarthy, D.; Ritchie, M.; Robinson, M.; Smyth, G.; Hall, E. , edgeR: differential analysis of sequence read count data User’s Guide. R Packag 2020, 1–121. [Google Scholar]
- Field, L. M.; Devonshire, A. L. , Evidence that the E4 and FE4 esterase genes responsible for insecticide resistance in the aphid Myzus persicae (Sulzer) are part of a gene family. Biochem. J. 1998, 330 Pt 1, 169–73. [Google Scholar] [CrossRef] [PubMed]
- Wang, H. L.; Rao, Q.; Chen, Z. Z. , Identifying potential insecticide resistance markers through genomic-level comparison of Bemisia tabaci (Gennadius) lines. Arch. Insect Biochem. Physiol. 2023, 114, e22034. [Google Scholar] [CrossRef]
- Kang, Z.-W.; Liu, F.-H.; Xu, Y.-Y.; Cheng, J.-H.; Lin, X.-L.; Jing, X.-F.; Tian, H.-G.; Liu, T.-X. , Identification of candidate odorant-degrading enzyme genes in the antennal transcriptome of Aphidius gifuensis. Entomol. Res. 2021, 51, 36–54. [Google Scholar] [CrossRef]
- Mortazavi, A.; Williams, B. A.; McCue, K.; Schaeffer, L.; Wold, B. , Mapping and quantifying mammalian transcriptomes by RNA-Seq. Nat. Methods 2008, 5, 621–628. [Google Scholar] [CrossRef]
- Sultan, M.; Schulz, M. H.; Richard, H.; Magen, A.; Klingenhoff, A.; Scherf, M.; Seifert, M.; Borodina, T.; Soldatov, A.; Parkhomchuk, D. , A global view of gene activity and alternative splicing by deep sequencing of the human transcriptome. Science 2008, 321, 956–960. [Google Scholar] [CrossRef]
- Raz, T.; Kapranov, P.; Lipson, D.; Letovsky, S.; Milos, P. M.; Thompson, J. F. , Protocol dependence of sequencing-based gene expression measurements. PloS one 2011, 6, e19287. [Google Scholar] [CrossRef]
- Mane, S. P.; Evans, C.; Cooper, K. L.; Crasta, O. R.; Folkerts, O.; Hutchison, S. K.; Harkins, T. T.; Thierry-Mieg, D.; Thierry-Mieg, J.; Jensen, R. V. , Transcriptome sequencing of the Microarray Quality Control (MAQC) RNA reference samples using next generation sequencing. BMC genomics 2009, 10, 1–12. [Google Scholar] [CrossRef]
- Cui, P.; Lin, Q.; Ding, F.; Xin, C.; Gong, W.; Zhang, L.; Geng, J.; Zhang, B.; Yu, X.; Yang, J. , A comparison between ribo-minus RNA-sequencing and polyA-selected RNA-sequencing. Genomics 2010, 96, 259–265. [Google Scholar] [CrossRef]
Figure 1.
Heatmap of gene expression patterns for each population.
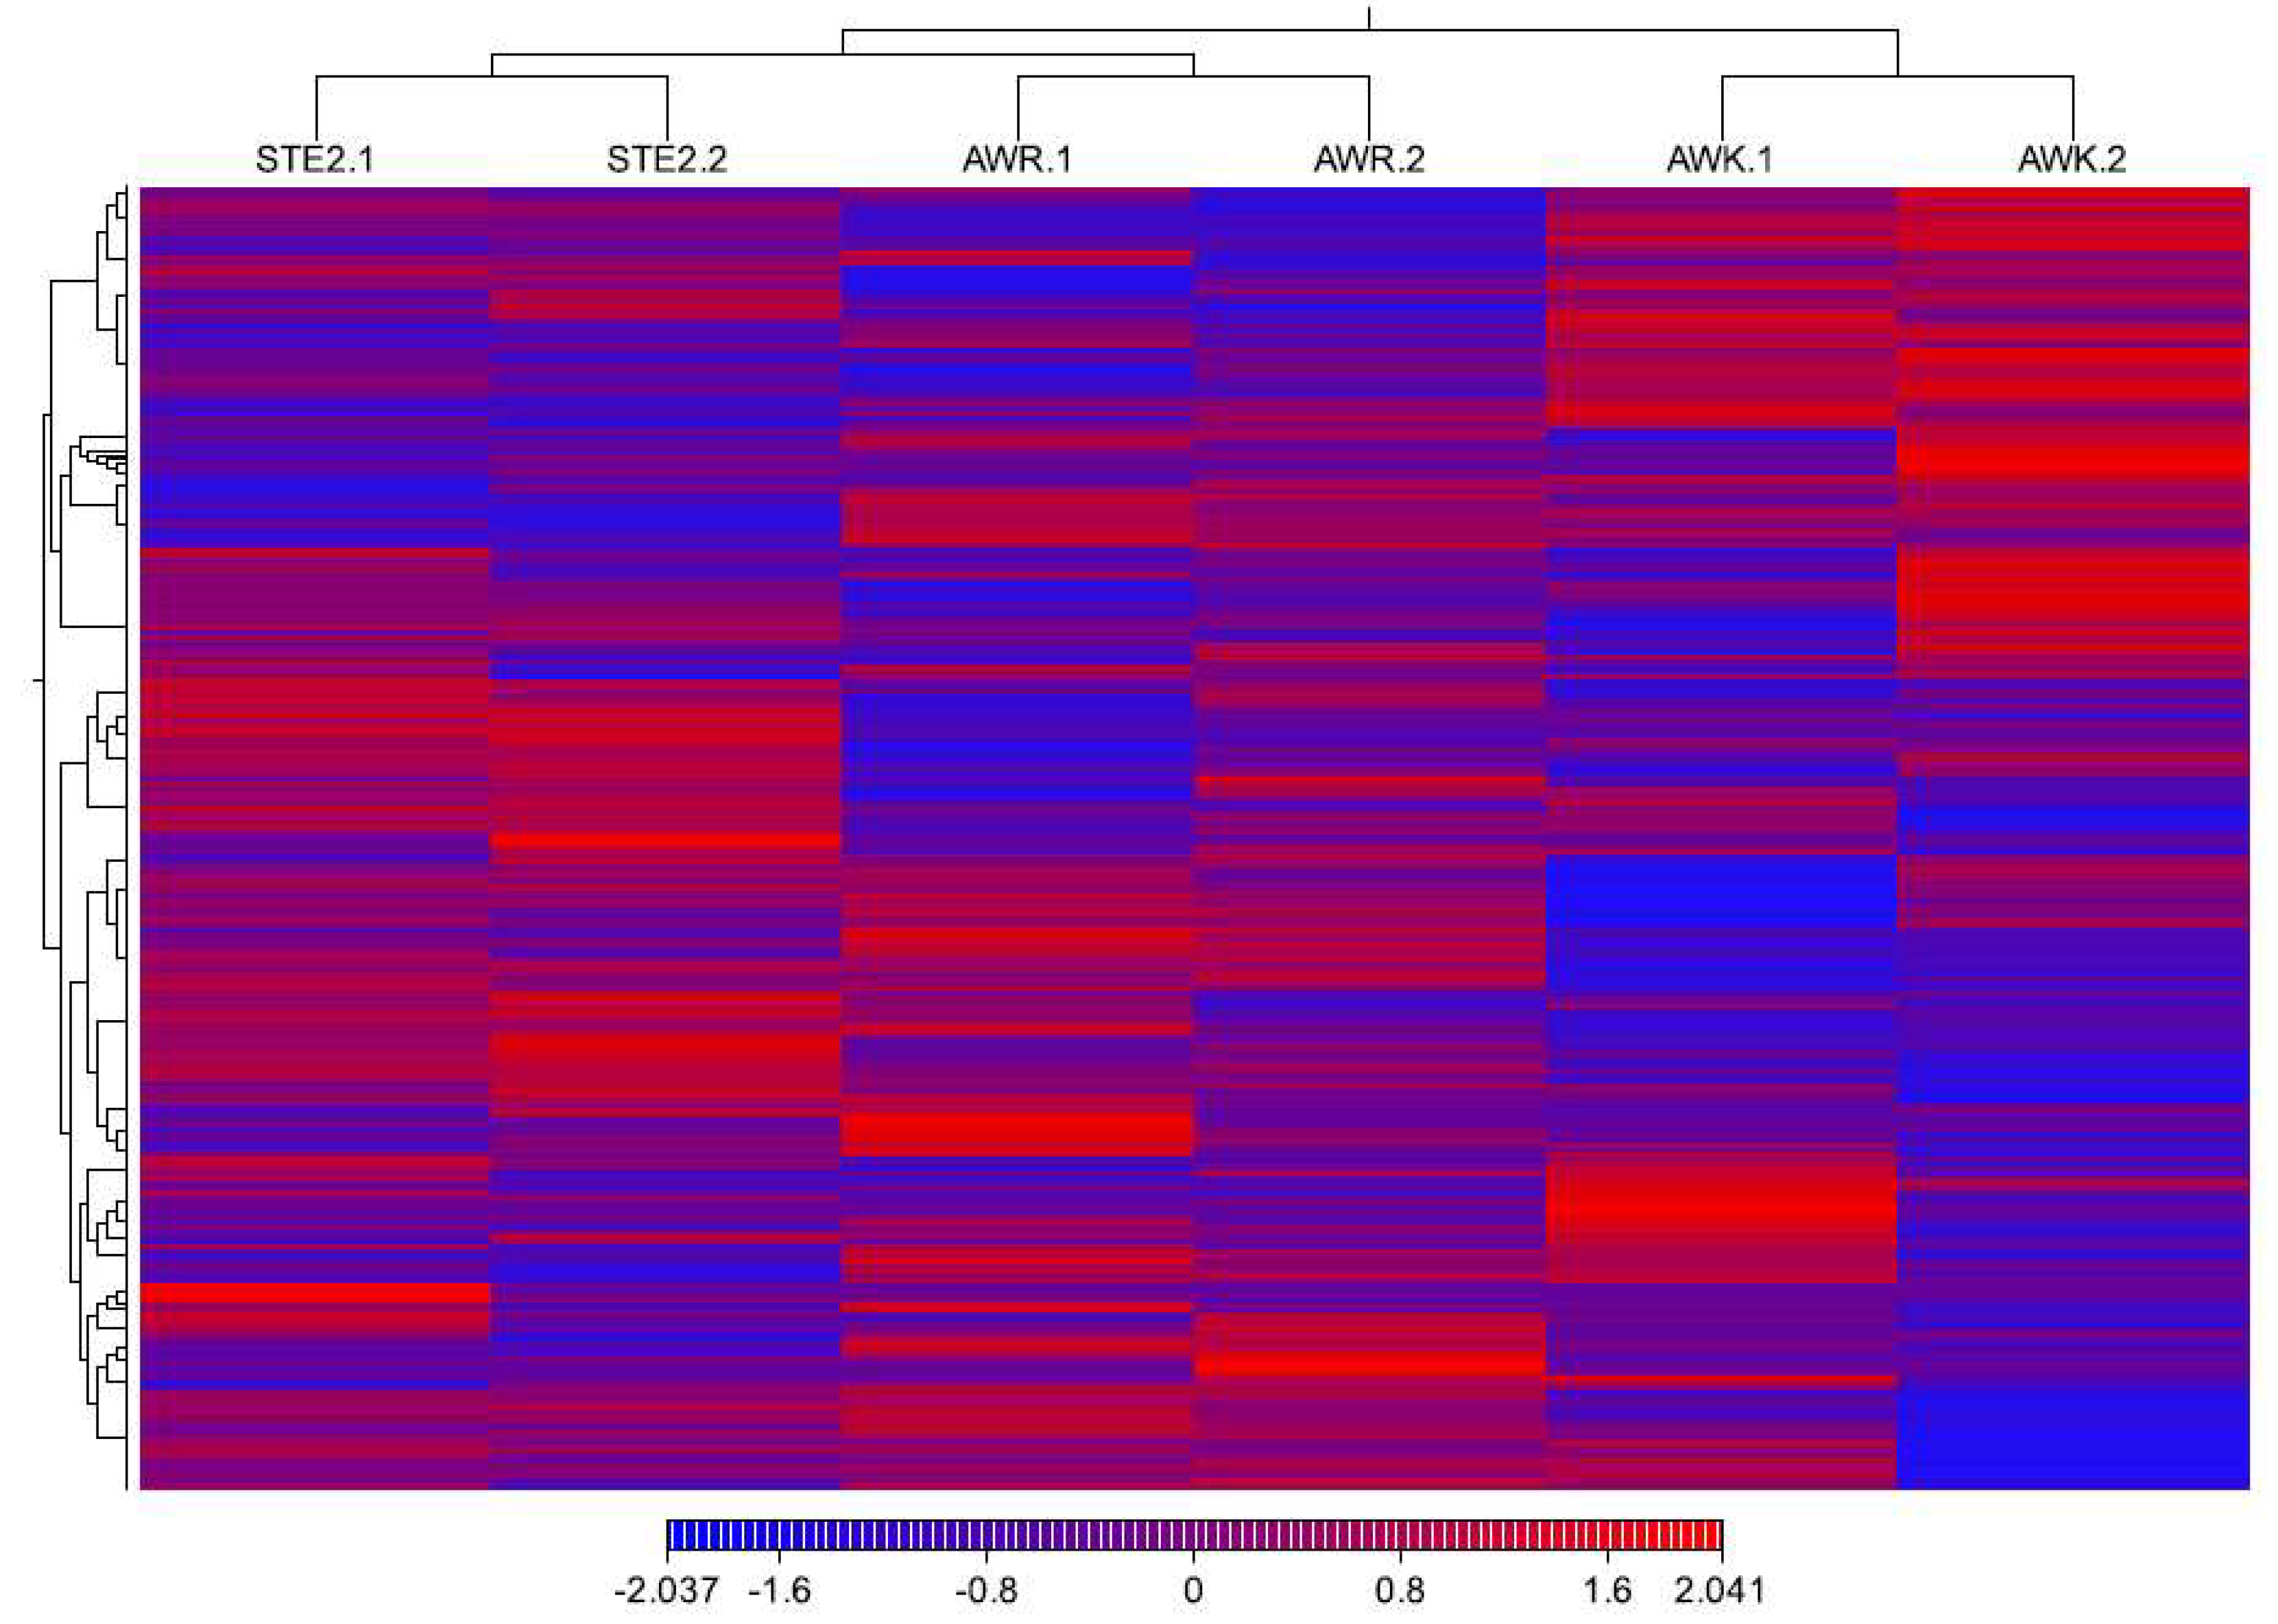
Figure 2.
Principal component analysis (PCA) and biological coefficient of variation (BCV) plot for RNA-seq data. A, PCA of gene expression dataset; B, gene expression displayed against the average log CPM (counts per million), as estimated by edgeR. The blue line represents the global or abundance-dependent dispersion trend, while the red line indicates the common dispersion value.
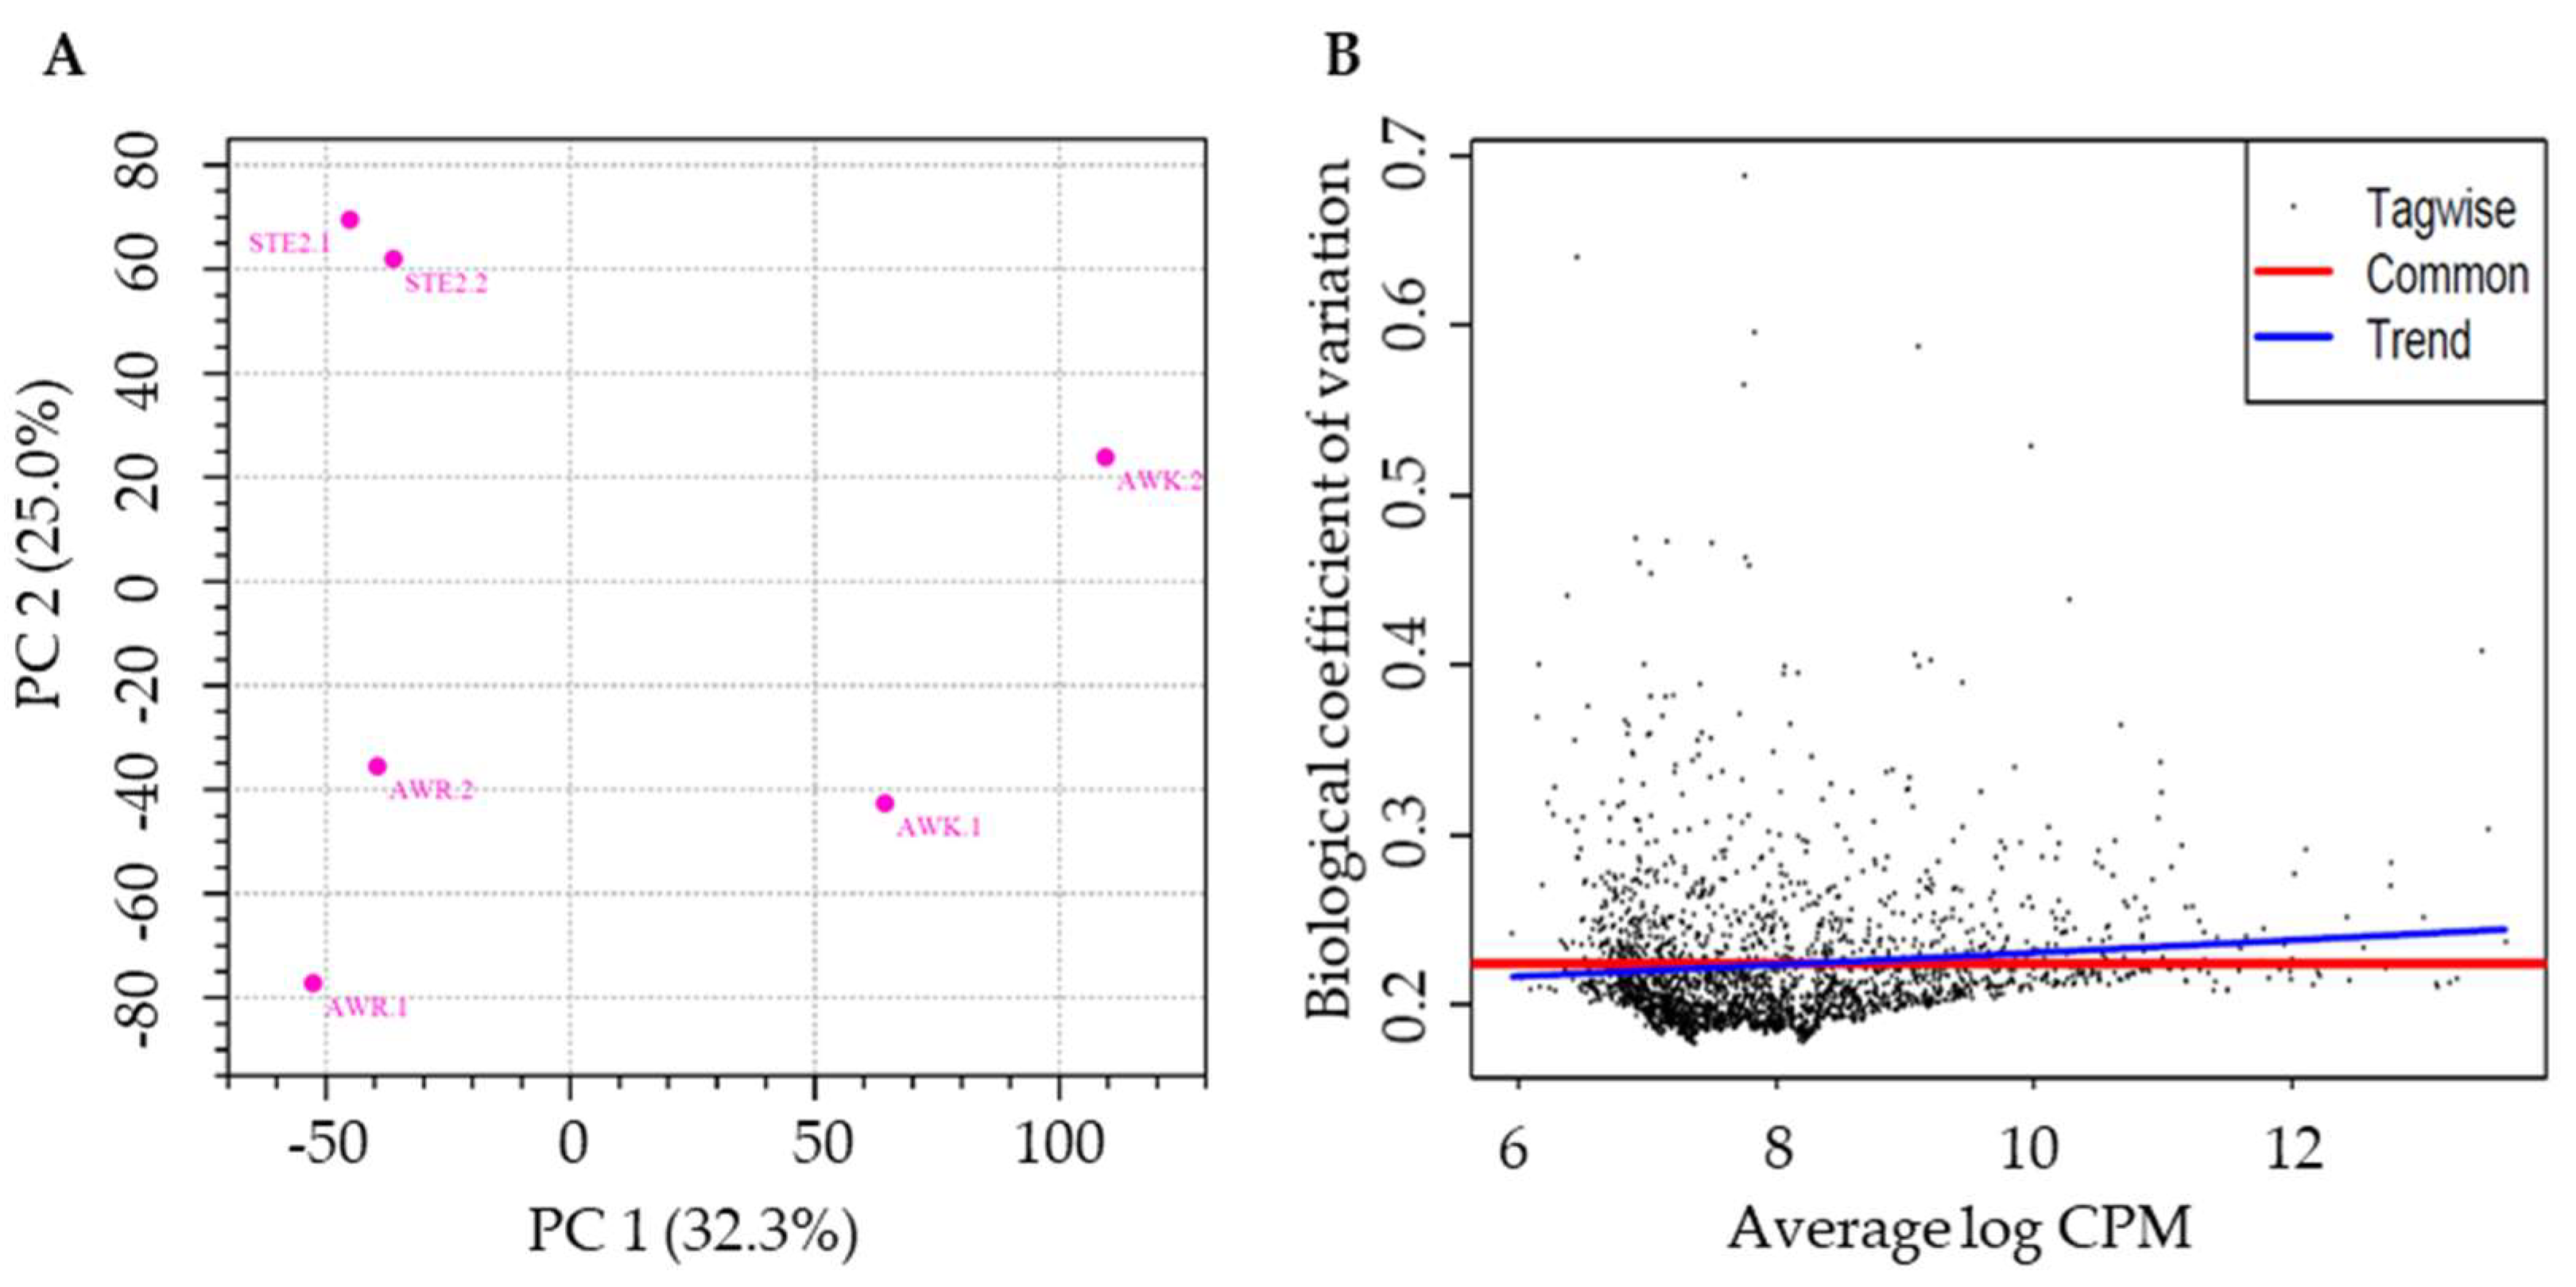
Figure 3.
Volcano plot showing transcripts identified by RNA-seq analysis of An. stephensi population. Gray dots represent genes that do not meet the criteria for log2 fold change (FC) > 1.5 (up or down) or significant adjusted P value < 0.05. Green dots represent genes that meet the criterion for log2 FC > 1.5 (up or down) but not adjusted P value < 0.05. Blue dots represent genes with adjusted P value < 0.05 but not log2 FC > 1.5 (up or down). The horizontal red dashed line is located at a value equivalent to the adjusted P value (0.05). Vertical blue dashed lines are located at + and − 1.5 log2 FC. Several highly differentially expressed genes across geographic locations are also labelled. D, down-regulated; U, up-regulated.
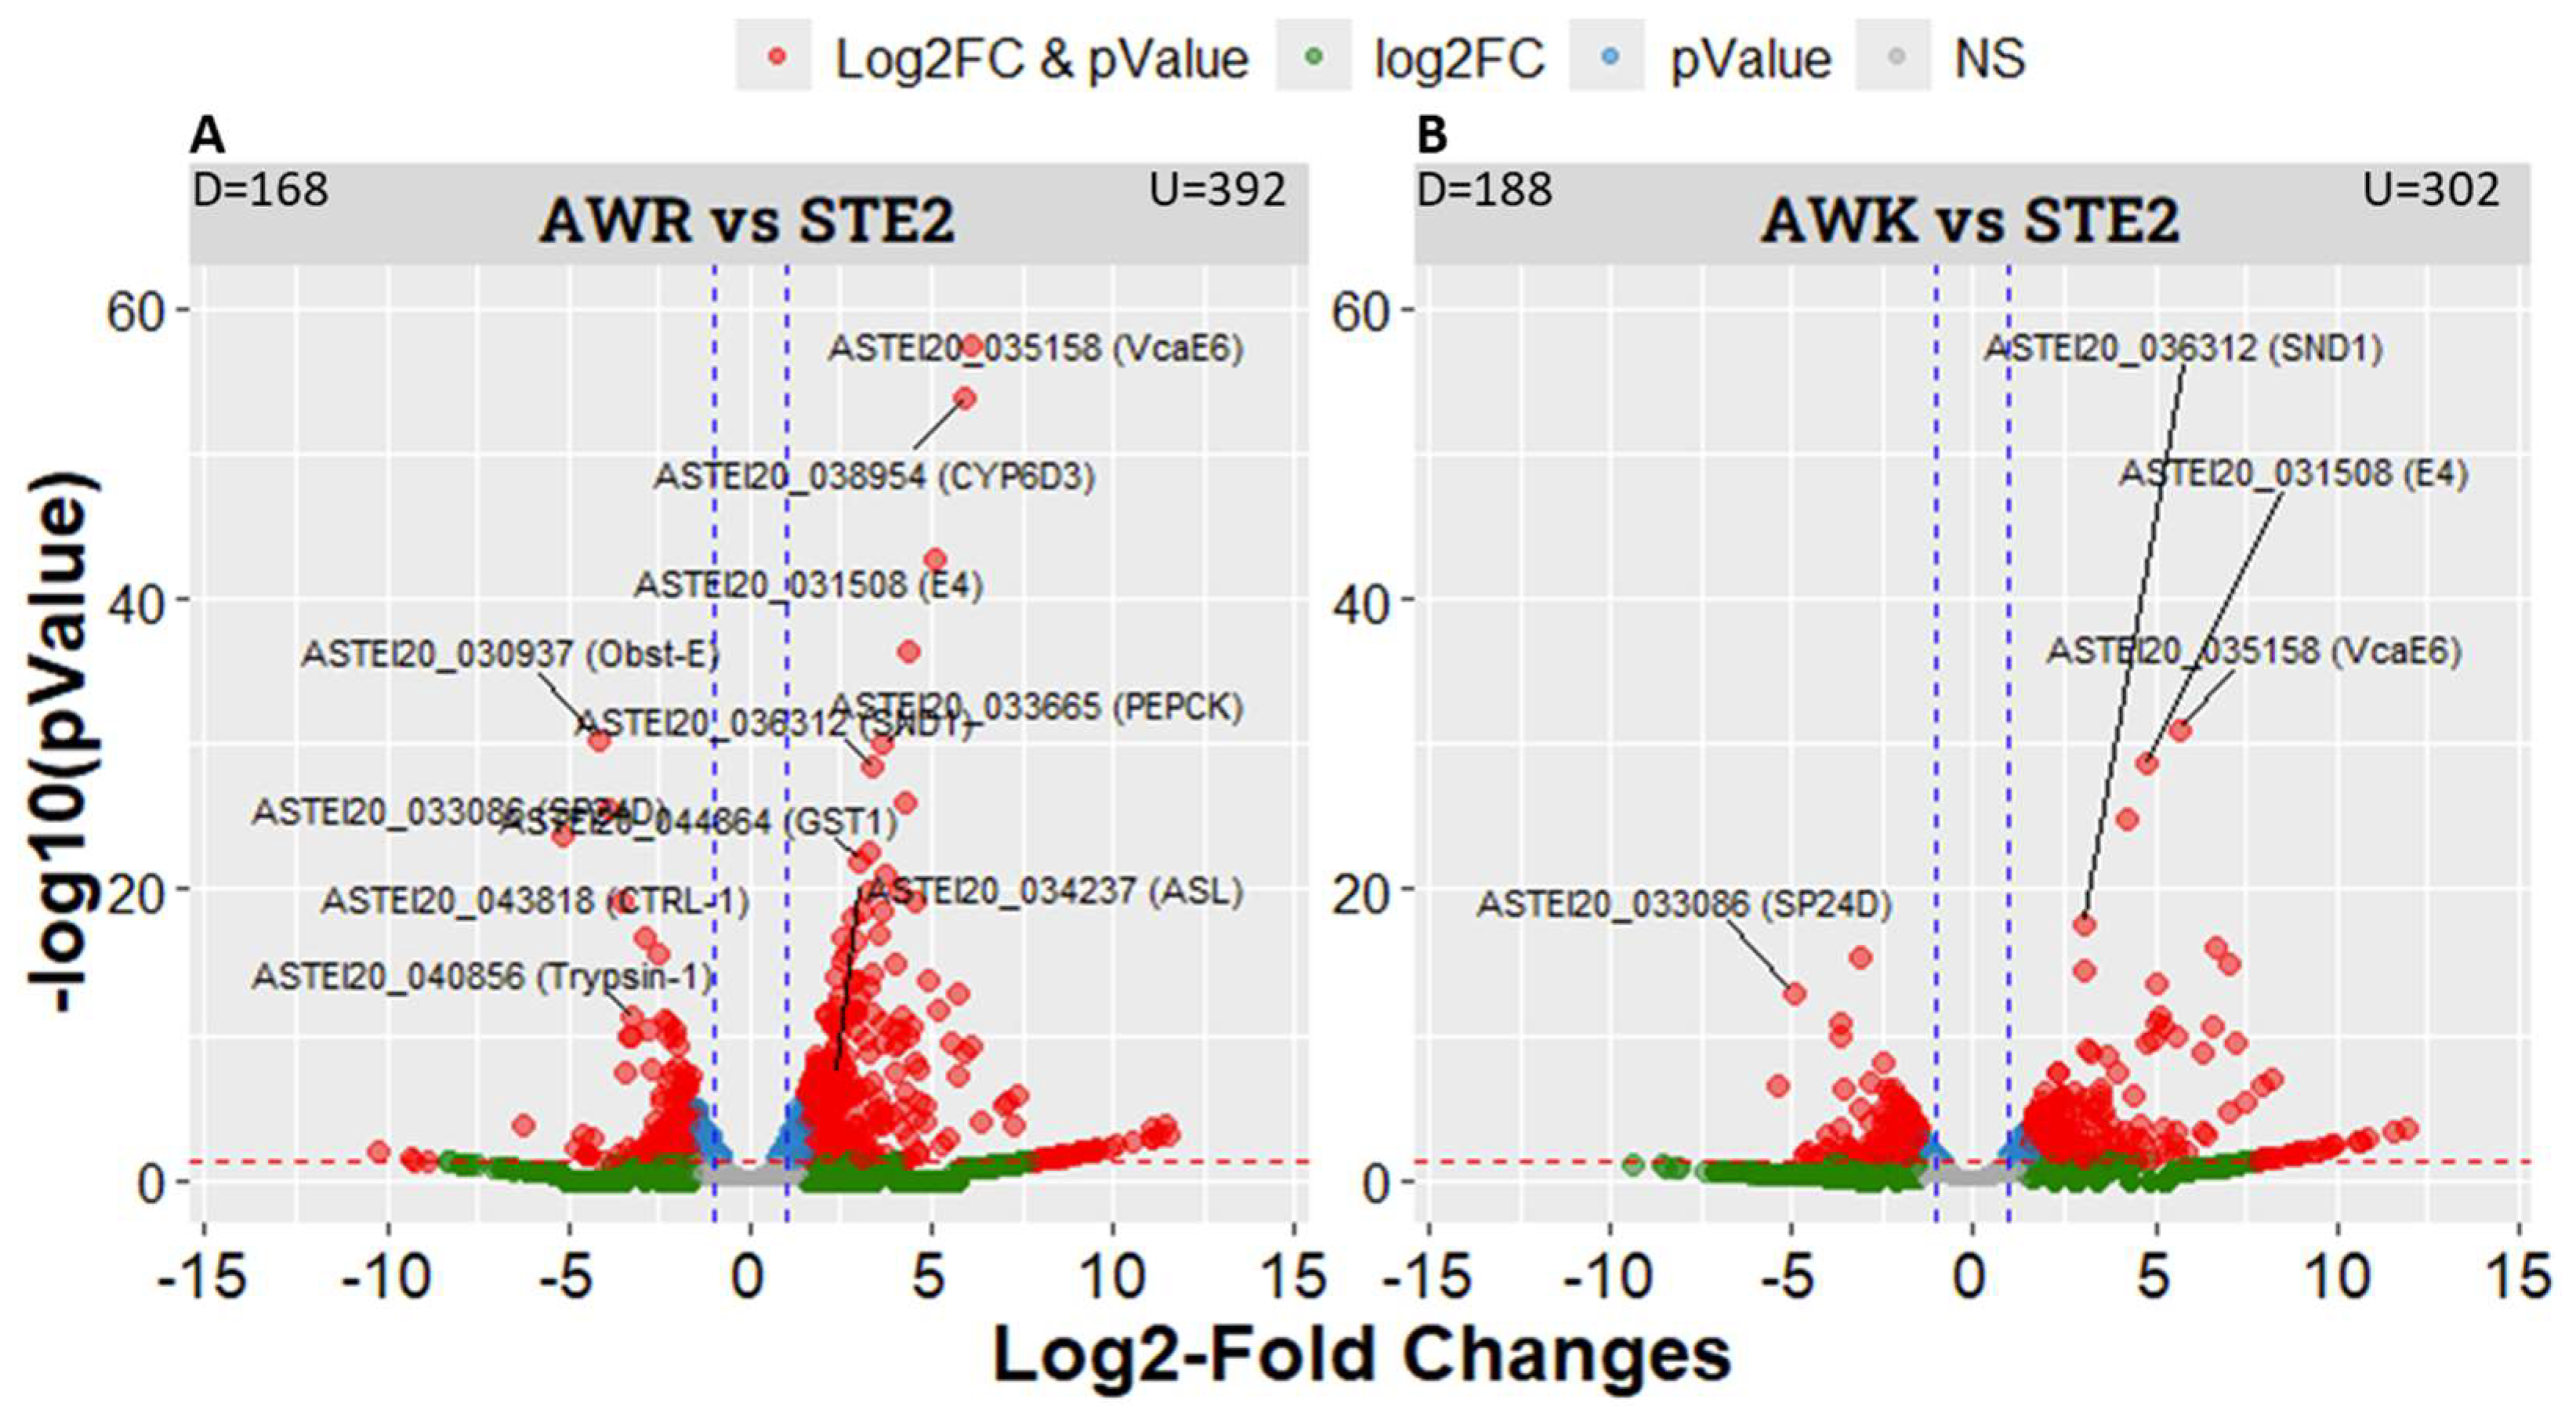
Figure 4.
Gene Ontology (GO) term enrichment analysis of genes differentially expressed between pyrethroid resistant mosquitoes and susceptible lab strain (STE2). Significantly enriched GO terms were selected based on an FDR cutoff of 0.05.
Figure 4.
Gene Ontology (GO) term enrichment analysis of genes differentially expressed between pyrethroid resistant mosquitoes and susceptible lab strain (STE2). Significantly enriched GO terms were selected based on an FDR cutoff of 0.05.
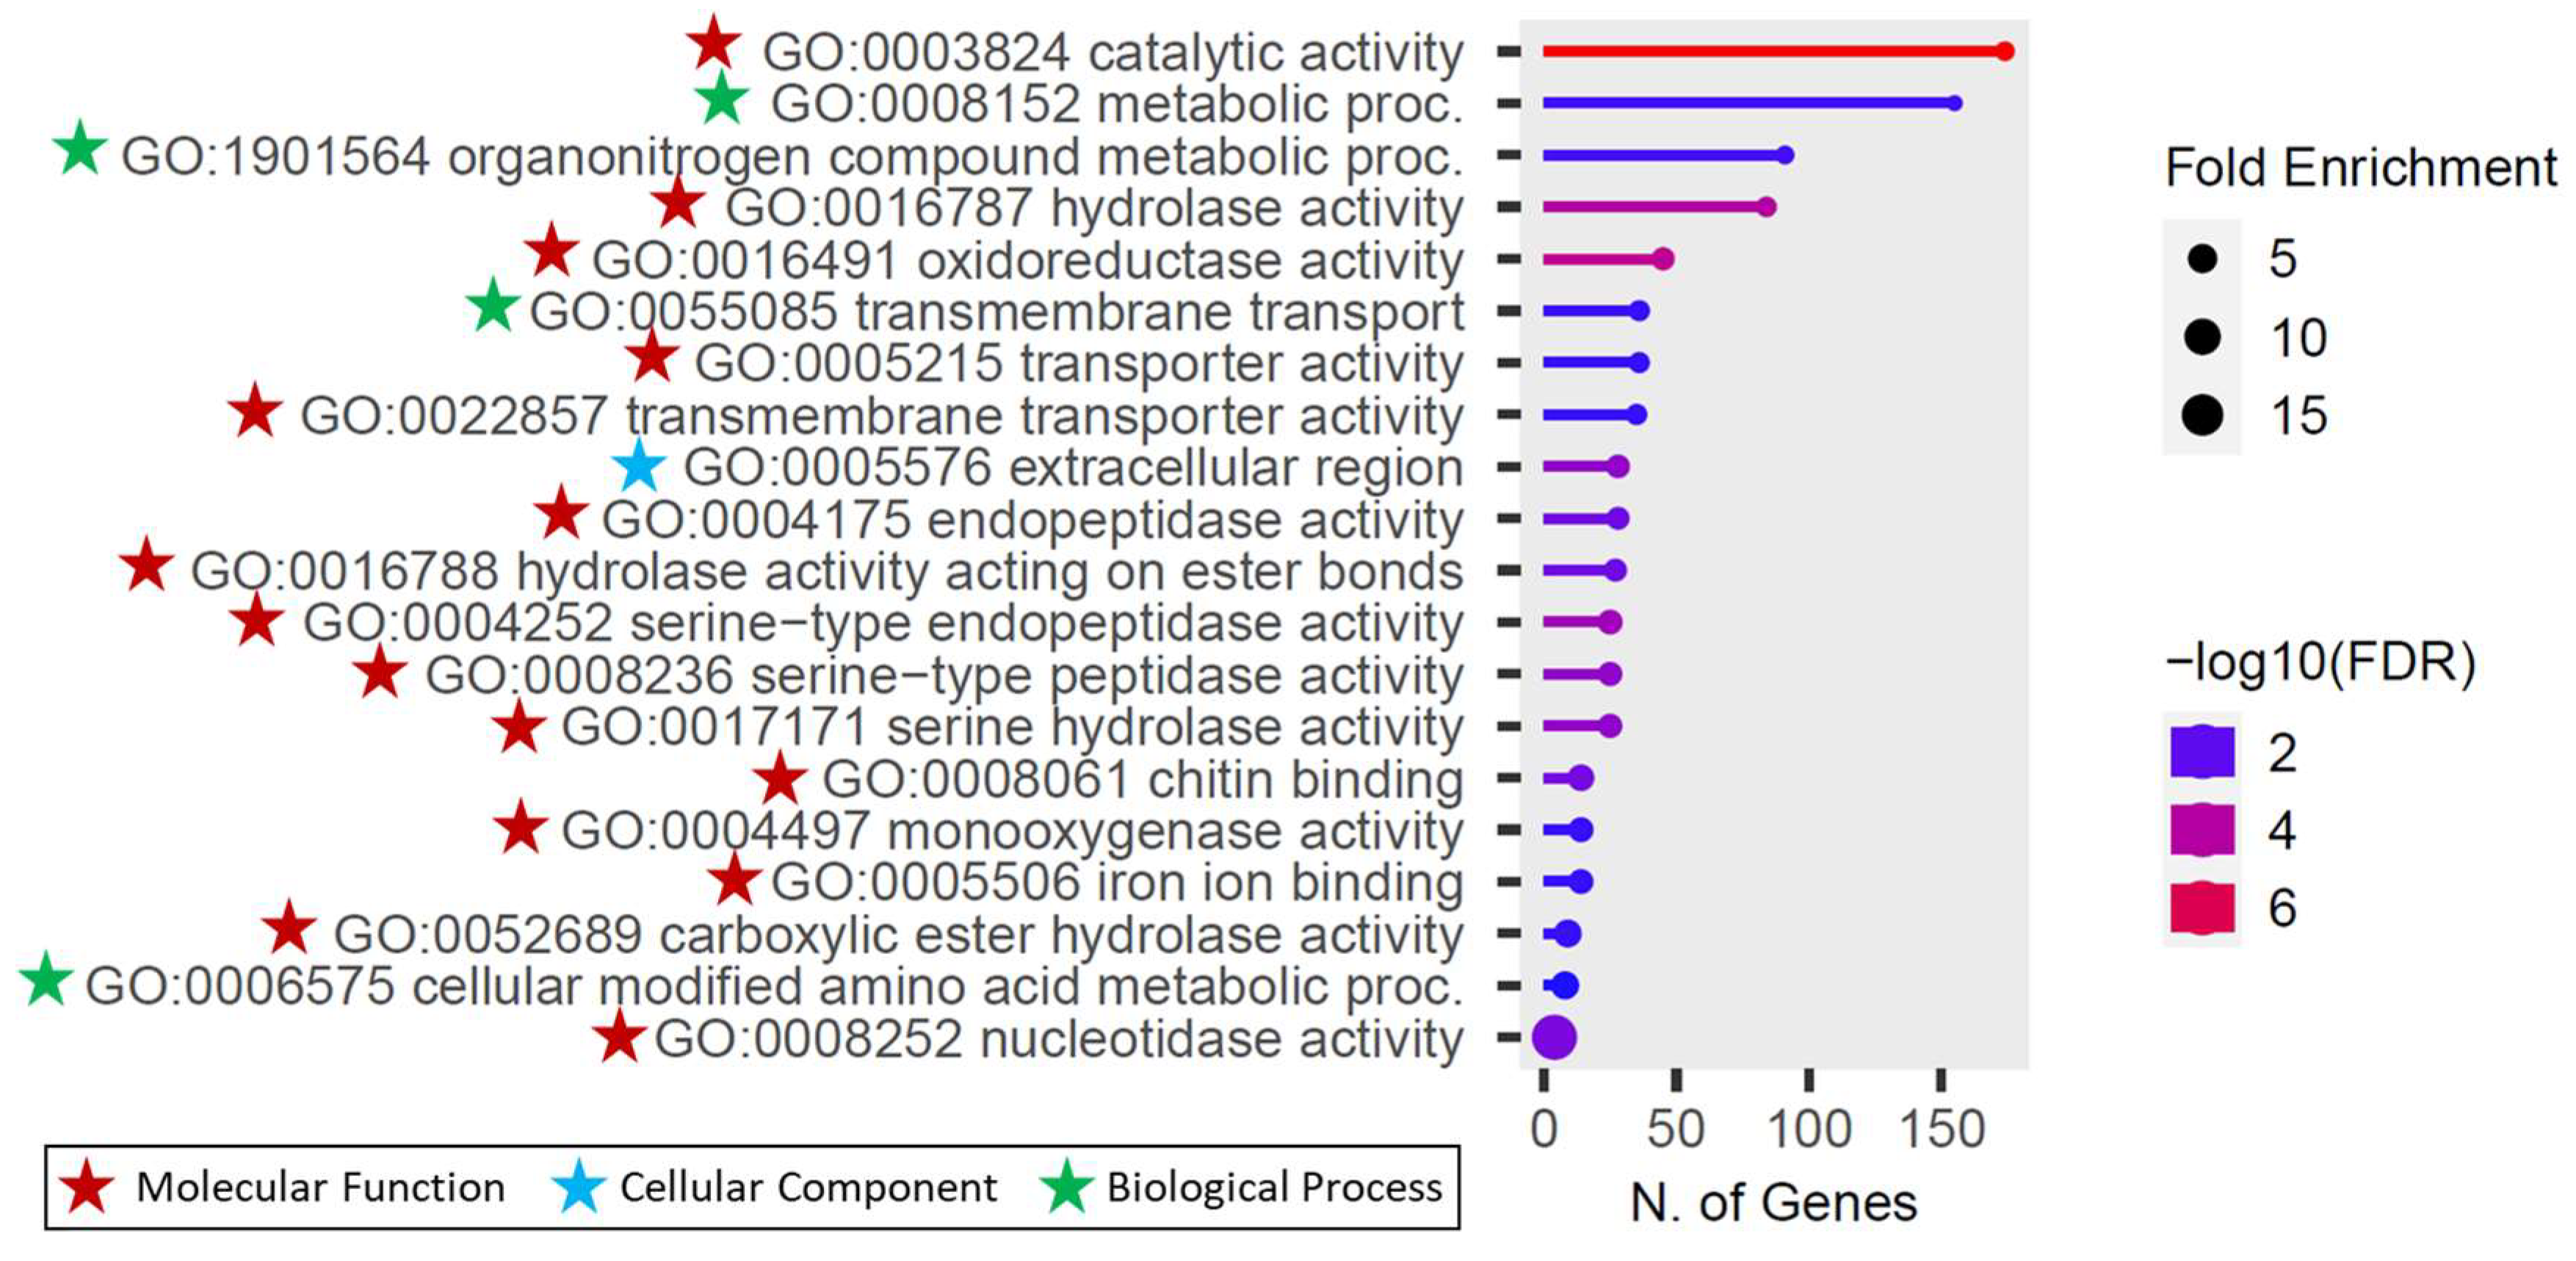
Figure 5.
The relationship between enriched pathways. Darker nodes are more significantly enriched gene sets. Bigger nodes represent larger gene sets. Thicker edges represent more overlapped genes.
Figure 5.
The relationship between enriched pathways. Darker nodes are more significantly enriched gene sets. Bigger nodes represent larger gene sets. Thicker edges represent more overlapped genes.
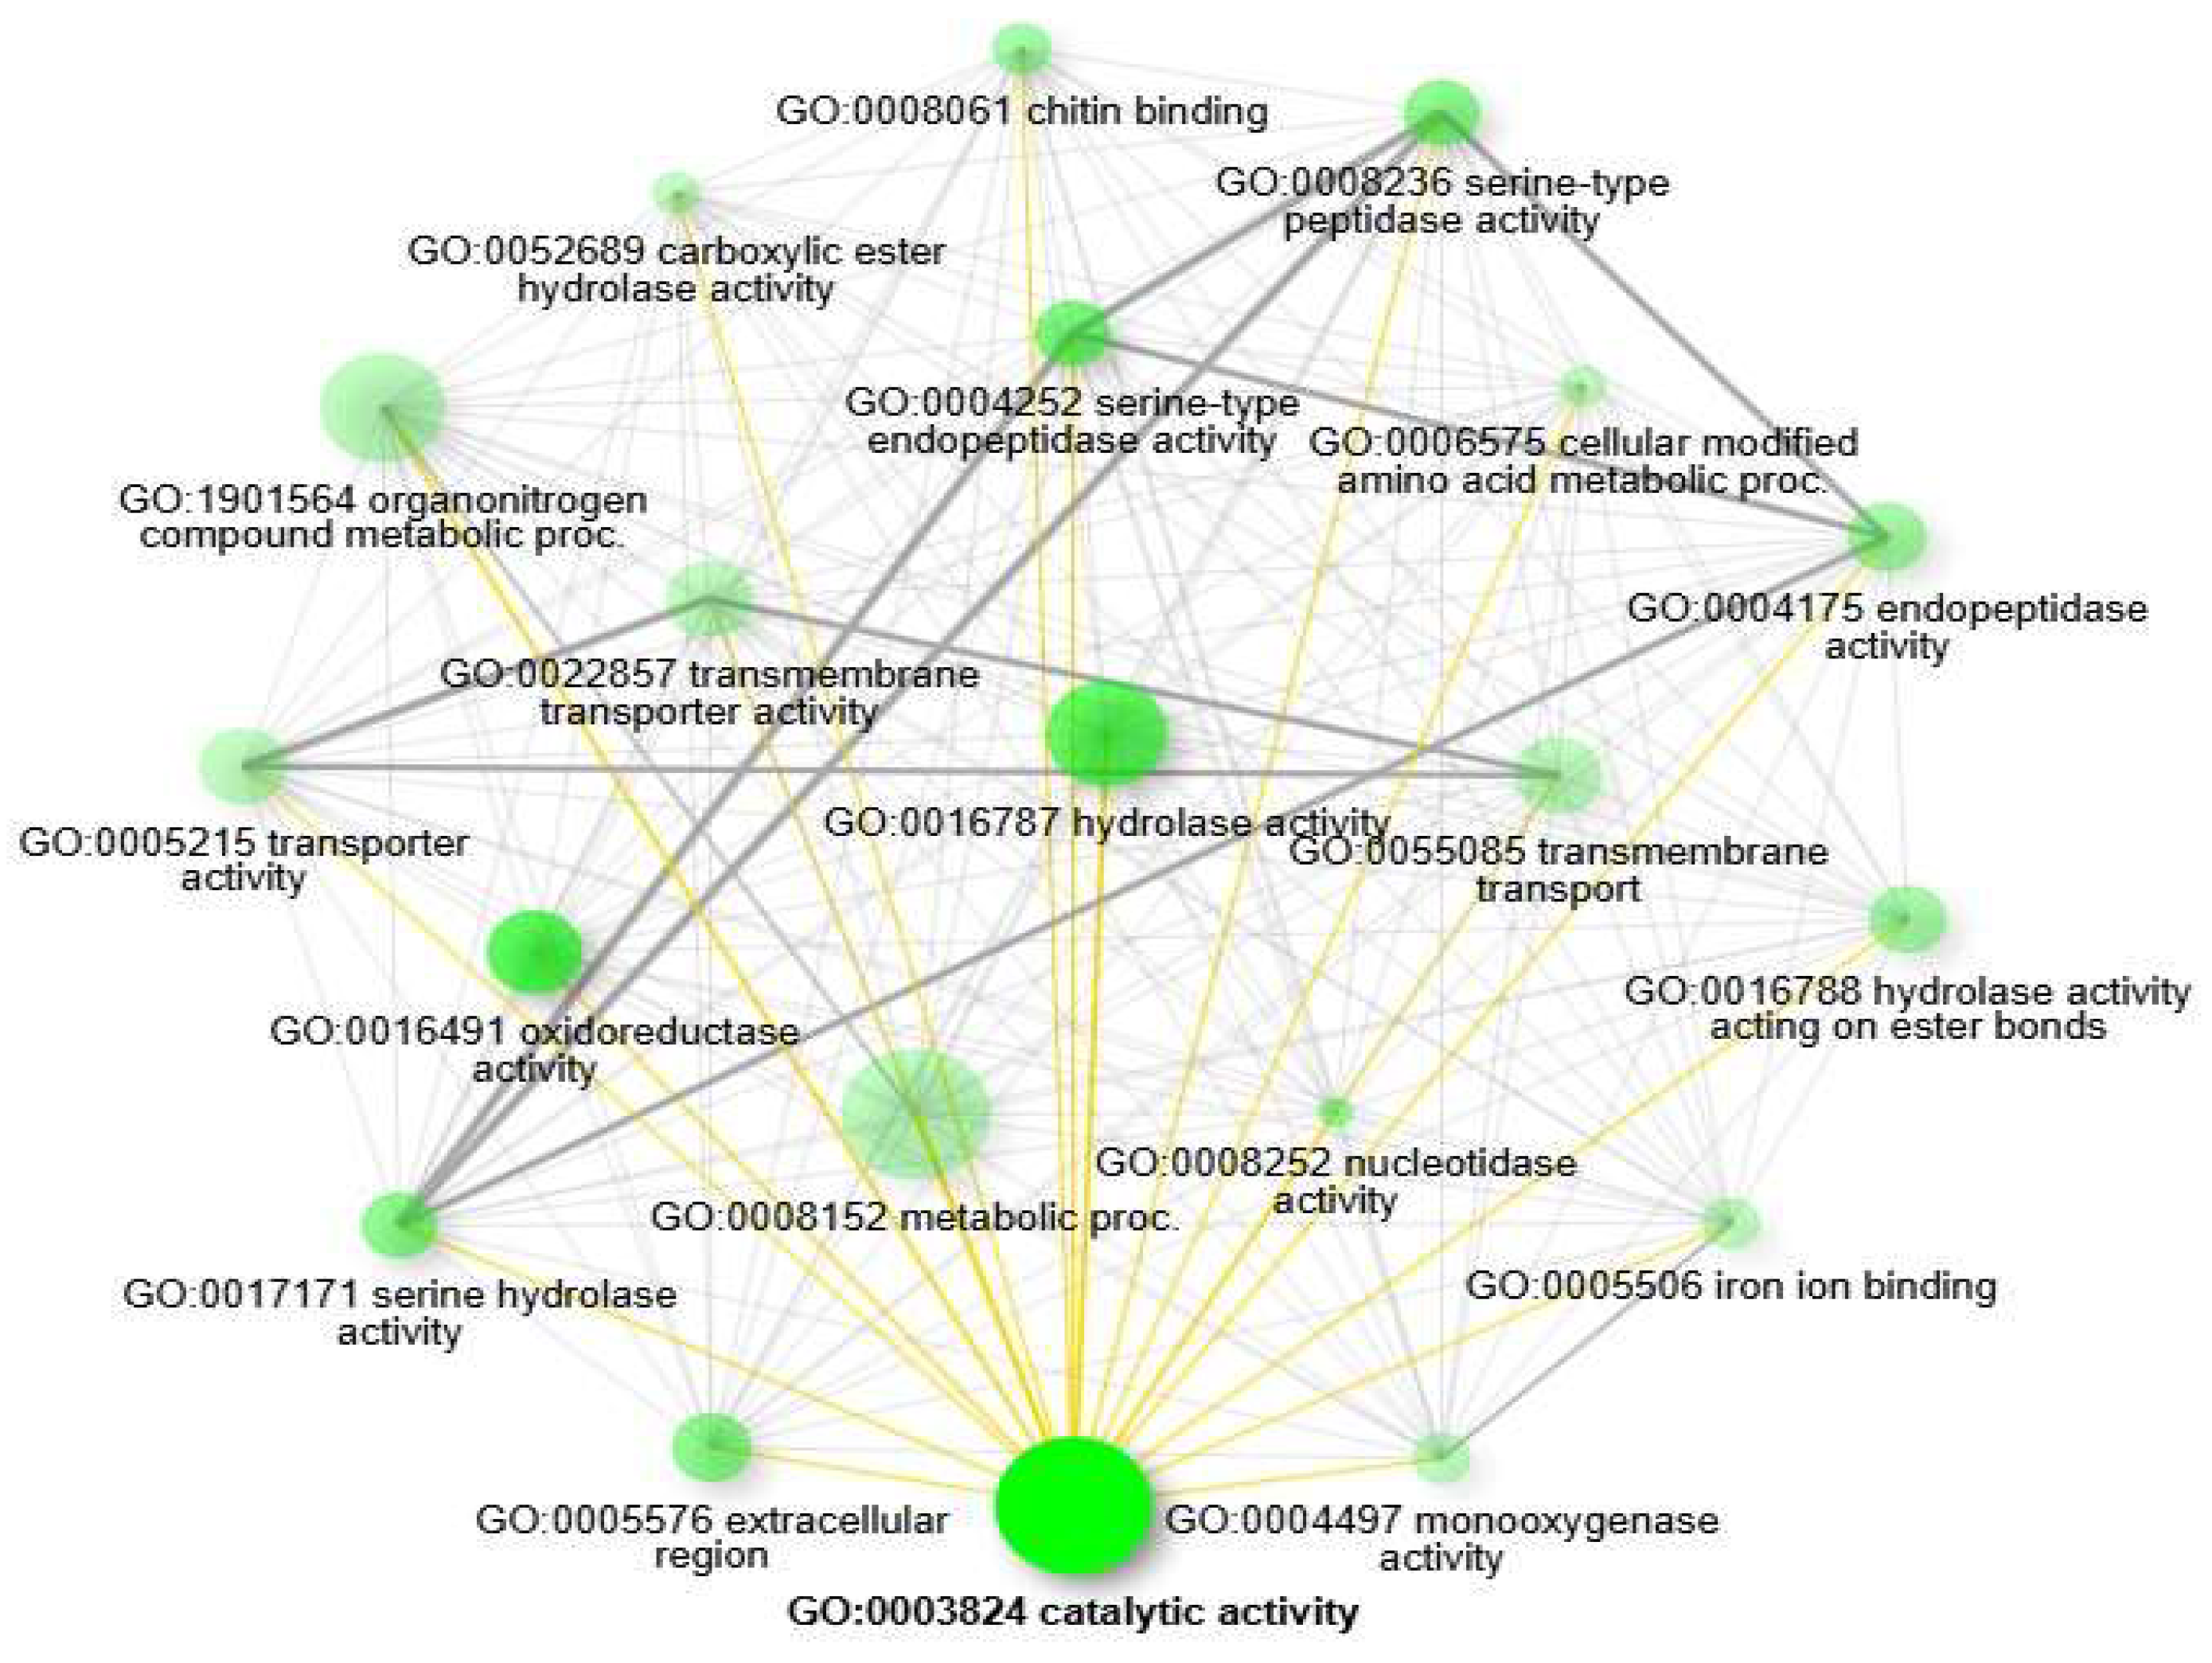
Figure 6.
Gene co-expression module identification using dynamic tree cut methods.
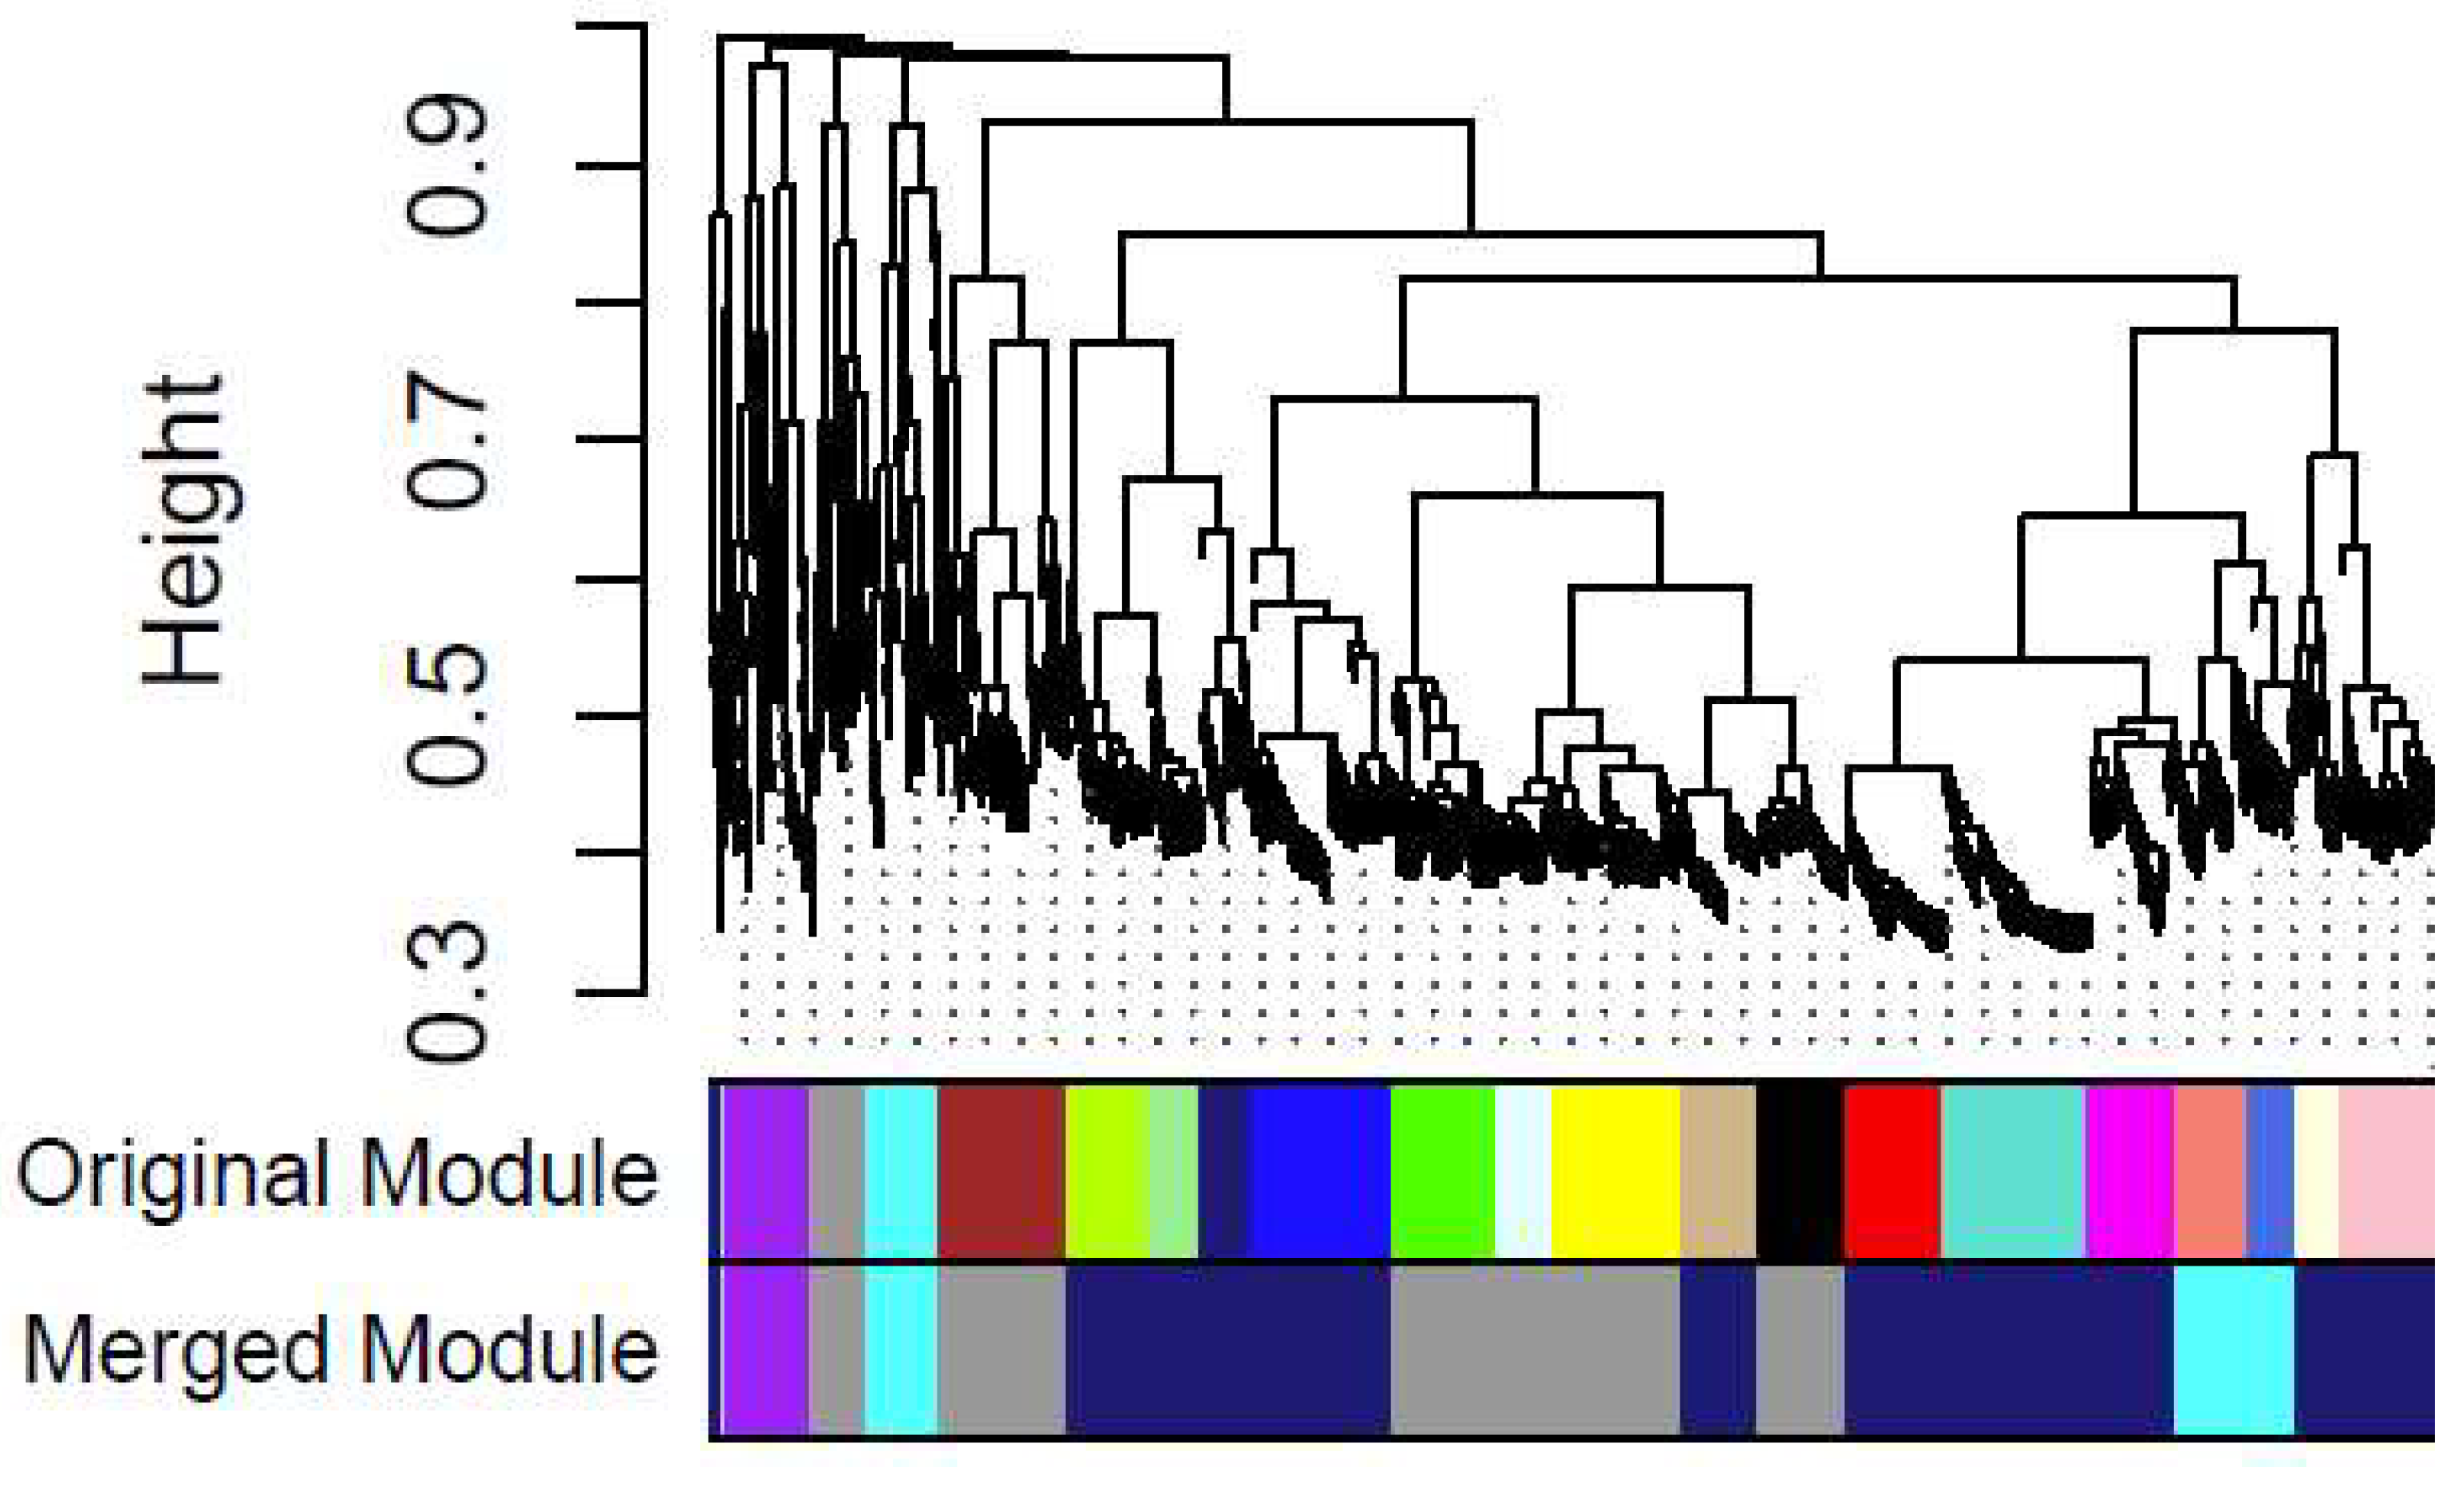
Figure 7.
Co-expression network of the genes related to pyrethroid insecticide resistance in An. stephensi. Node size and coloring depth represent node connectivity. The coloring line depth represents the weight value. The red dots indicate highly interacting gene clusters. A, green module; B, blue module.
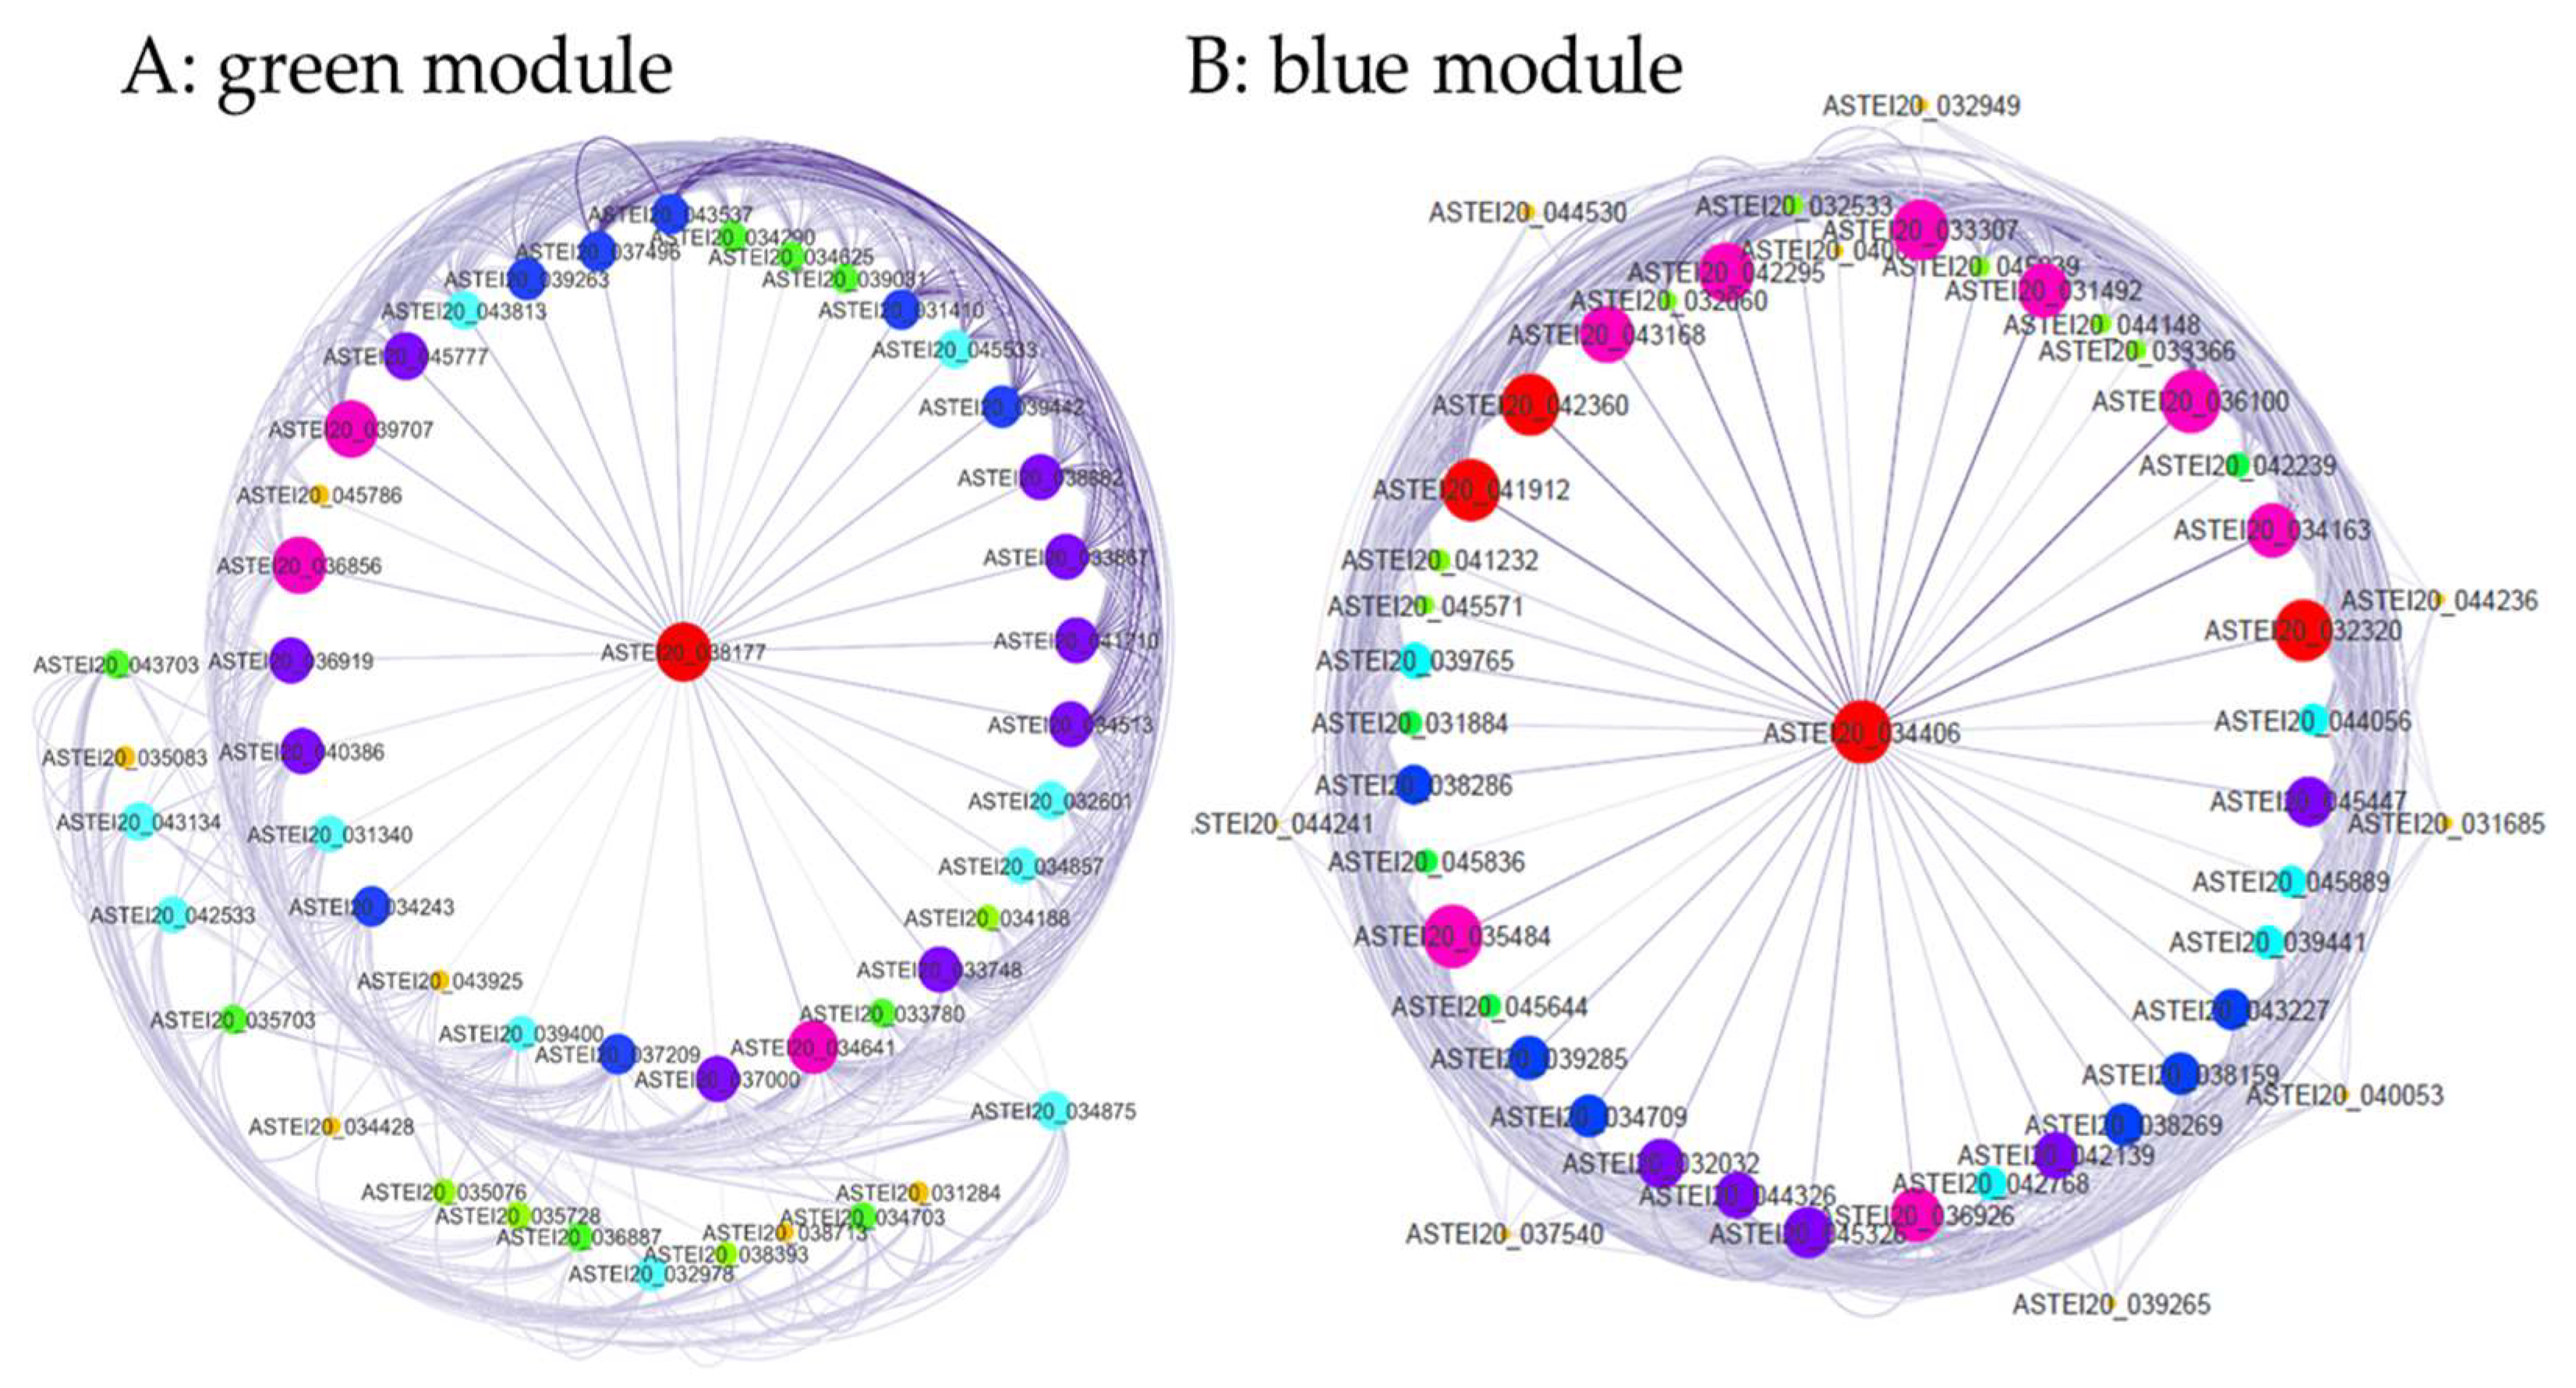

Table 1.
RNA-seq read filtering statistics for An. stephensi field population from Ethiopia and susceptible lab strain.
Table 1.
RNA-seq read filtering statistics for An. stephensi field population from Ethiopia and susceptible lab strain.
| Sample | Population | Input Raw Reads (PE150) | Both Surviving | % | Forward Only Surviving | % | Reverse Only Surviving | % | Dropped | % |
|---|---|---|---|---|---|---|---|---|---|---|
| AWU.1 | Unexposed | 84895174 | 47073550 | 55.5% | 16517385 | 19.5% | 8087876 | 9.5% | 13216363 | 15.6% |
| AWU.2 | Unexposed | 70500535 | 40077550 | 56.9% | 13039840 | 18.5% | 7395075 | 10.5% | 9988070 | 14.2% |
| AWR.1 | Resistant | 77387200 | 44172164 | 57.1% | 14860161 | 19.2% | 7087466 | 9.2% | 11267409 | 14.6% |
| AWR.2 | Resistant | 81621753 | 49604580 | 60.8% | 15114460 | 18.5% | 6958266 | 8.5% | 9944447 | 12.2% |
| STE2.1 | STE2( Lab) | 83335260 | 46749249 | 56.1% | 15935401 | 19.1% | 8002670 | 9.6% | 12647940 | 15.2% |
| STE2.2 | STE2( Lab) | 85893152 | 50424191 | 58.7% | 16746130 | 19.5% | 7601598 | 8.9% | 11121233 | 13.0% |
| Average | 80605512 | 46350214 | 57.5% | 15368896 | 19.1% | 7522159 | 9.4% | 11364244 | 14.1% | |
| Standard Error (SE) | 2361586 | 1548772 | 0.8% | 556320 | 0.2% | 189764 | 0.3% | 549434 | 0.5% | |
Table 2.
List of the top 20 consistently expressed detoxification enzyme genes in resistant and untested field Anopheles stphensi populations.
Table 2.
List of the top 20 consistently expressed detoxification enzyme genes in resistant and untested field Anopheles stphensi populations.
| Gene ID | Gene description | Length | R vs S (FC) | U vs S (FC) | Gene expression |
|---|---|---|---|---|---|
| ASTEI20_031161 | probable cytochrome P450 6a14 | 1797 | 3.62 | 3.60 | up |
| ASTEI20_031508 | esterase E4, transcript variant X2 | 2198 | 33.67 | 26.56 | up |
| ASTEI20_031614 | probable cytochrome P450 9f2 | 2220 | 4.50 | 3.36 | up |
| ASTEI20_032042 | xanthine dehydrogenase-like | 4648 | 3.35 | 6.99 | up |
| ASTEI20_032249 | UDP-glycosyltransferase UGT5-like, transcript | 1944 | 22.68 | 20.87 | up |
| ASTEI20_033905 | cytochrome b-c1 complex subunit 8 | 556 | 2.88 | 3.52 | up |
| ASTEI20_034193 | UDP-glycosyltransferase UGT4-like | 1991 | 12.31 | 11.07 | up |
| ASTEI20_035158 | venom carboxylesterase-6-like | 1930 | 69.94 | 51.97 | up |
| ASTEI20_035228 | esterase E4-like | 1958 | 5.54 | 6.30 | up |
| ASTEI20_035931 | chorion peroxidase-like | 2536 | -2.98 | -3.23 | down |
| ASTEI20_036049 | venom carboxylesterase-6-like | 2722 | -6.20 | -5.81 | down |
| ASTEI20_039992 | multidrug resistance-associated protein 1-like | 5024 | 11.68 | 5.64 | up |
| ASTEI20_040345 | glutathione S-transferase 1-like | 1773 | 10.54 | 13.14 | up |
| ASTEI20_041459 | probable cytochrome P450 6a14 | 1767 | 4.09 | 3.57 | up |
| ASTEI20_041713 | probable cytochrome P450 6a14, transcript | 4297 | 5.75 | 8.04 | up |
| ASTEI20_042864 | protein arginine N-methyltransferase 5 | 2130 | -3.35 | -7.23 | down |
| ASTEI20_044419 | UDP-glycosyltransferase UGT5-like, transcript | 2008 | 5.81 | 3.63 | up |
| ASTEI20_044800 | esterase B1-like | 2161 | -6.41 | -13.64 | down |
| ASTEI20_044864 | glutathione S-transferase 1-like, transcript | 1973 | 8.25 | 5.16 | up |
| ASTEI20_046113 | multidrug resistance-associated protein 1-like | 4601 | 3.51 | 3.66 | up |
Note: R, resistant population (AWR); U, unexposed field population (AWK); S, susceptible population (STE2); FC, fold changes.
Disclaimer/Publisher’s Note: The statements, opinions and data contained in all publications are solely those of the individual author(s) and contributor(s) and not of MDPI and/or the editor(s). MDPI and/or the editor(s) disclaim responsibility for any injury to people or property resulting from any ideas, methods, instructions or products referred to in the content. |
© 2024 by the authors. Licensee MDPI, Basel, Switzerland. This article is an open access article distributed under the terms and conditions of the Creative Commons Attribution (CC BY) license (http://creativecommons.org/licenses/by/4.0/).
Copyright: This open access article is published under a Creative Commons CC BY 4.0 license, which permit the free download, distribution, and reuse, provided that the author and preprint are cited in any reuse.


