Submitted:
16 December 2024
Posted:
18 December 2024
You are already at the latest version
Abstract
Polydactylus macrochir (Günther, 1867) is a number of family Polynemidae. The placement of the Polynemidae among teleosts has varied over the years. Therefore, in this study we sequenced the complete mitochondrial genome of P. macrochir, analyzed the characterization of the mito-chondrial genome, and investigated the phylogenetic relationships of Polynemidae. The lengths of the P. macrochir mitogenomes was 16,738 bp with the typical order. Nucleotide composition analysis showed that P. macrochir mitogenome was AT biased (54.15%), and the PCGs tended to use A and C than T and G at the third codon. All the PCGs started with the regular codon ATG, except for the cox1 which started with GTG. The termination codon varied across PCGs. It was shown that the ka/ks ratios of all PCGs were less than 1. The phylogenetic analysis, based on the maximum likelihood (ML) and Bayesian inference (BI) methods, indicated that 8 Threadfins spe-cies formed a well-supported monophyletic cluster. Polynemidae and Sphyraenidae clustered together as a monophyletic group. According to TimeTree analyses, the most recent common ancestor (MRCA) of Polynemidae was traced back to about 52.81 million years ago (MYA), while 6 species within Polynemidae diverged from 11.70 MYA to 20.05 MYA. The present study provides valuable mitochondrial information for the classiffcation of P. macrochir and new insights in phylogenetic relationships of Polynemidae.
Keywords:
Polydactylus macrochir
; Polynemidae
; Phylogenetic Analysis
1. Introduction
Threadfins are easily identified due to their numerous, elongated and threadlike pectoral-fin rays [1]. These filamentous fin rays are necessary for threadfins inhabiting sandy or muddy bottoms of turbid shallow waters to detect food, with both tactile and gustatory functions [2]. Threadfins belong to the family Polynemidae which includes eight genera and 42 extant species [3].
For the past years, the placement of the Polynemidae among teleosts has varied according to different studies. Polynemidae had been previously considered related to Mugilidae, Sphyraenidae, Atherinidae, and Phallostethoidei, and clustered into Mugiliformes [4]. The later study insisted that Polynemidae, Mugilidae and Sphyraenidae should remain within Perciformes [5]. Other studies based on morphological features suggested that Sciaenidae and Polynemidae were sister-groups [6,7,8]. Phylogenetic placement of Polynemidae inferred from molecular analyses was also conflicted with each other. Different studies have alternatively aligned polynemids with Menidae [9], Menidae + Lactariidae [10], or Pleuronectiformes [11,12]. A study grouped Polynemidae with Menidae as the sister group of Sphyraenidae [13]. The rencent study thought that polynemids should not be included in the Order Mugiliformes or Order Perciformes and reset the Order Polynemiformes [14]. As mentioned above, different studies have advanced alternative hypotheses of relationships for the family Polynemidae and a consensual phylogenetic position is still lacking.
The mitochondrial genome, typically spanning 16-17 k bp, generally consists of 13 protein-coding, two ribosomal RNAs (rRNAs), 22 transfer RNAs (tRNAs), and two noncoding regions-the control region (CR) and the origin of L-strand replication (OL) [15]. Notably, the mitochondrial DNA evolves at a faster rate and exhibits a remarkable degree of conservation in gene organization and low recombination level [16]. In addition, the complete mitogenome has an advantage in providing comprehensive information when used for evolutionary analysis compared with partial mitogenome gene. so, the complete mitogenome has been used widely to study phylogenetic relationships and species classification among teleosts [17,18,19].
To date, only seven species within the family Polynemidae have its complete mitogenomes been sequenced worldwide. Polydactylus macrochir (Günther, 1867) is a number of family Polynemidae. In this study, we sequenced the mitochondrial genome of P. macrochir and conducted genome characterization and phylogenetic analysis. This study will provide new insights regarding classiffcation of Threadfins and would be helpful to resolve uncertainties of phylogenetic position of Polynemidae.
2. Materials and Methods
2.1. Samples, DNA Extraction and Sequencing
The samples of Polydactylus macrochir was purchased from Fangchenggang local maket, Guangxi, China, sent to Genepioneer Biotechnologies (Nanjing, China) for sequencing. Total genomic DNA was extracted using the MagPure Tissue DNA LQ Kit (Magen Biotechnology, Guangzhou, China). The DNA purity was detected with 1.0% agarose gel. After that the qualified library was sequenced using the Illumina Novaseq platform and the paired end sequencing (PE) read length was 150 bp.
2.2. Genome Assembly and Annotation
The fastp (v0.20.0, https:// github. com/ OpenGene/ fastp) software was used to filter the original data and obtained the clean data. To reduce the complexity of subsequent sequence assembly, the software bowtie2 v2.2.4 (http:// bowtie-bio. sourceforge. net/ bowtie2/ index. shtml) was used to compare the mitochondrial genome database built by the company and the compared sequencing sequences were regarded as the mitochondrial genome sequencing sequences of project samples. Then the mt DNA sequence is assembled by SPAdes soft-ware to obtain seed sequence of mitochondrial genome [20]. Kmer iterative extend seed, if the result is a contig, the result is determined as pseudo genome sequence. The sequenced sequence is aligned to pseudo genome for genome correction. Otherwise, SSPACE v2.0 (https://www. baseclear. com/ services/bioinformatics/ basetools/ sspace-standard/) software is used to connect the previously obtained contig sequences to obtain scaffolds; Gapfiller v2.1.1 (https:// sourceforge. net/ projects/ gapfiller/) software was used to fill in the scaffolds sequence. If there was still gap after the above operation, primers were designed for PCR sequencing and assembly until a complete pseudo genome sequence was obtained, and then we aligned the sequenced sequence to the pseudo genome to determine the accuracy of the final assembly results for genome correction. Finally, according to the structure of mitochondrial, the corrected pseudo genome was rearranged to obtain a complete mitochondrial circular genome sequence. The annotations of mitochondrial genome were performed in the Mitos2 web server [21] (Parameters: E-value Exponent=5, Maximum Overlap=100, ncRNA overlap=100). The Mitos2 annotation results were compared with closely related species, and the final annotation results were obtained after manual correction. Mitochondrial gene structure maps were drawn using the OGDRAW(https:// chlor obox. mpimp-golm. mpg. de/ OGDraw. html).
2.3. Codon Usage Analysis
Relative Synonymous Codon Usage (RSCU) is thought to result from a combination of natural selection, mutation and genetic drift, the numerical value is the ratio of the actual frequency of codon usage to the theoretical frequency of codon usage.A script wrote in Perl was used to filterUniq CDS(choose one of multiple copies of CDS) and do the calculations.
2.4. Ka/Ks Value Analyses
To understand the natural selection pressure in the evolution of the family Polynemidae, homologous protein sequences between P. macrochir and other threadfins were obtained using BLASTN. Then, the shared protein-coding genes were aligned using MAFFT v7.427 [22]. The non-synonymous (Ka)and synonymous (Ks) ratios (Ka/Ks) were calculated using KaKs_Calculator v2.0 [23].
2.5. Phylogenetic Analysis TimeTree Estimation
The mitochondrial genomes of 22 species were downloaded from GenBank (Table 1). The shared CDS was aligned using MAFFT [5] procedure. Maximum likelihood (ML): Maximum likelihood (ML) phylogenetic tree was conducted by RAxML v8.2.10 (https://cme.h-its.org/exelixis/software.html)(GTRGAMMA model) estimation with 1000 bootstrap replications. Bayesian inference (BI): The optimal nucleotide substitution model was calculated by jModelTestv2.1.10 (https://github.com/ddarriba/jmodeltest2), and then MrBayes v3.2.7a (http://nbisweden.github.io/MrBayes/) was used to establish Bayesian inference (BI) phylogenetic tree, the parameters of MrBayes v3.2.7 software are based on jModelTest v2.1.10 results. After inputting the sequence data, the constructed Bayesian inference topology (.nwk format) was used as a baseline tree. Fossil records acquired from the TimeTree website (http://www.timetree.org) were used to calibrate the divergence times. Estimate divergence times using PAML mcmctree (http://abacus.gene.ucl.ac.uk/software/paml.html)
3. Results
3.1. Mitogenomic Structure and Organization
In the present study, the mitogenome of P. macrochir (GenBank Accession No. PQ675801) was determined, with a total length of 16,738 bp. The complete length of P. macrochir mitogenome is similar to that of other sequenced Polynemidae species. It comprised 13 protein-coding genes (PCGs), 22 transfer RNA genes (tRNAs), 2 ribosomal RNA genes (rRNAs), and 1 noncoding region (D-loop) (Figure 1 ). NAD6 and 8 tRNAs (trnQ, trnA, trnN, trnC, trnY, trnS2, trnE, and trnP) were located on the light (L) strand, while the remaining genes including 12 PCGs, 2 rRNAs, and 14 tRNAs were encoded by the heavy (H) strand. The P. macrochir mitogenome had six overlapping regions, with the longest overlapping region (10) detected between atp6 and cox3 genes (Table 2). Nucleotide composition analysis showed that P. macrochir mitogenome was AT biased(54.15%). PCGs, tRNAs, and rRNAs exhibited an AT content similar to that of the total mitogenomes. CR had the highest A+T content. All the AT skews in the mitogenome, tRNAs, rRNAs, and Dloop were positive, while AT skews of PCGs was negative. The GC skew of mitogenome, PCGs, rRNAs, and Dloop was negative, while GC skew of tRNAs was positive. In addition, the GC skew for the complete mitogenomes and PCGs were strongly negative, with a value of -0.286, -0.329, respectively (Table 3).
3.2. Protein-Coding Genes and Codon Usage
The total length of P. macrochir PCGs was 11,447 bp, accounting for 68.39% of the whole mitogenome. The the largest PCG was nad5, with a length of 1839 bp, the shortest PCG was atp8, with a length of 1839 bp. All the PCGs started with the regular codon ATG, except for the cox1 which started with GTG. The termination codon varied across PCGs. nad6 terminated with the TAG stop codon. nad2 terminated with the incomplete stop codon TA. The cox2, nad3, and nad4 used an incomplete T stop codon. The other PCGs shared the same complete stop codon TAA (Table 2).
The relative synonymous codon usage (RSCU) values of PCGs are revealed in Figure 2. There were 30 codons with RSCU > 1. The number of codons ending with the A base was 14, with 1 codon ending with U. Similarly, there were 14 codons ending with C and 1codon ending with G. The results also showed that serine and leucine were encoded by six codons with greater codon abundance compared to other amino acids.
(The y-axis represents the usage frequency of the corresponding amino acid codons in 13 PCGs. Different colors represent the different codons in the amino acid)
3.3. Ka/Ks Value Analyses
To evaluate the selective pressures of PCGs, we detected Nonsynonymous (Ka) and synonymous (Ks) substitution rates. It was shown that the ka/ks ratios of all PCGs were less than 1. The Ka/Ks ratio was the lowest in cox1 (Figure 3).
3.4. Phylogenetic Analysis and TimeTree Estimation
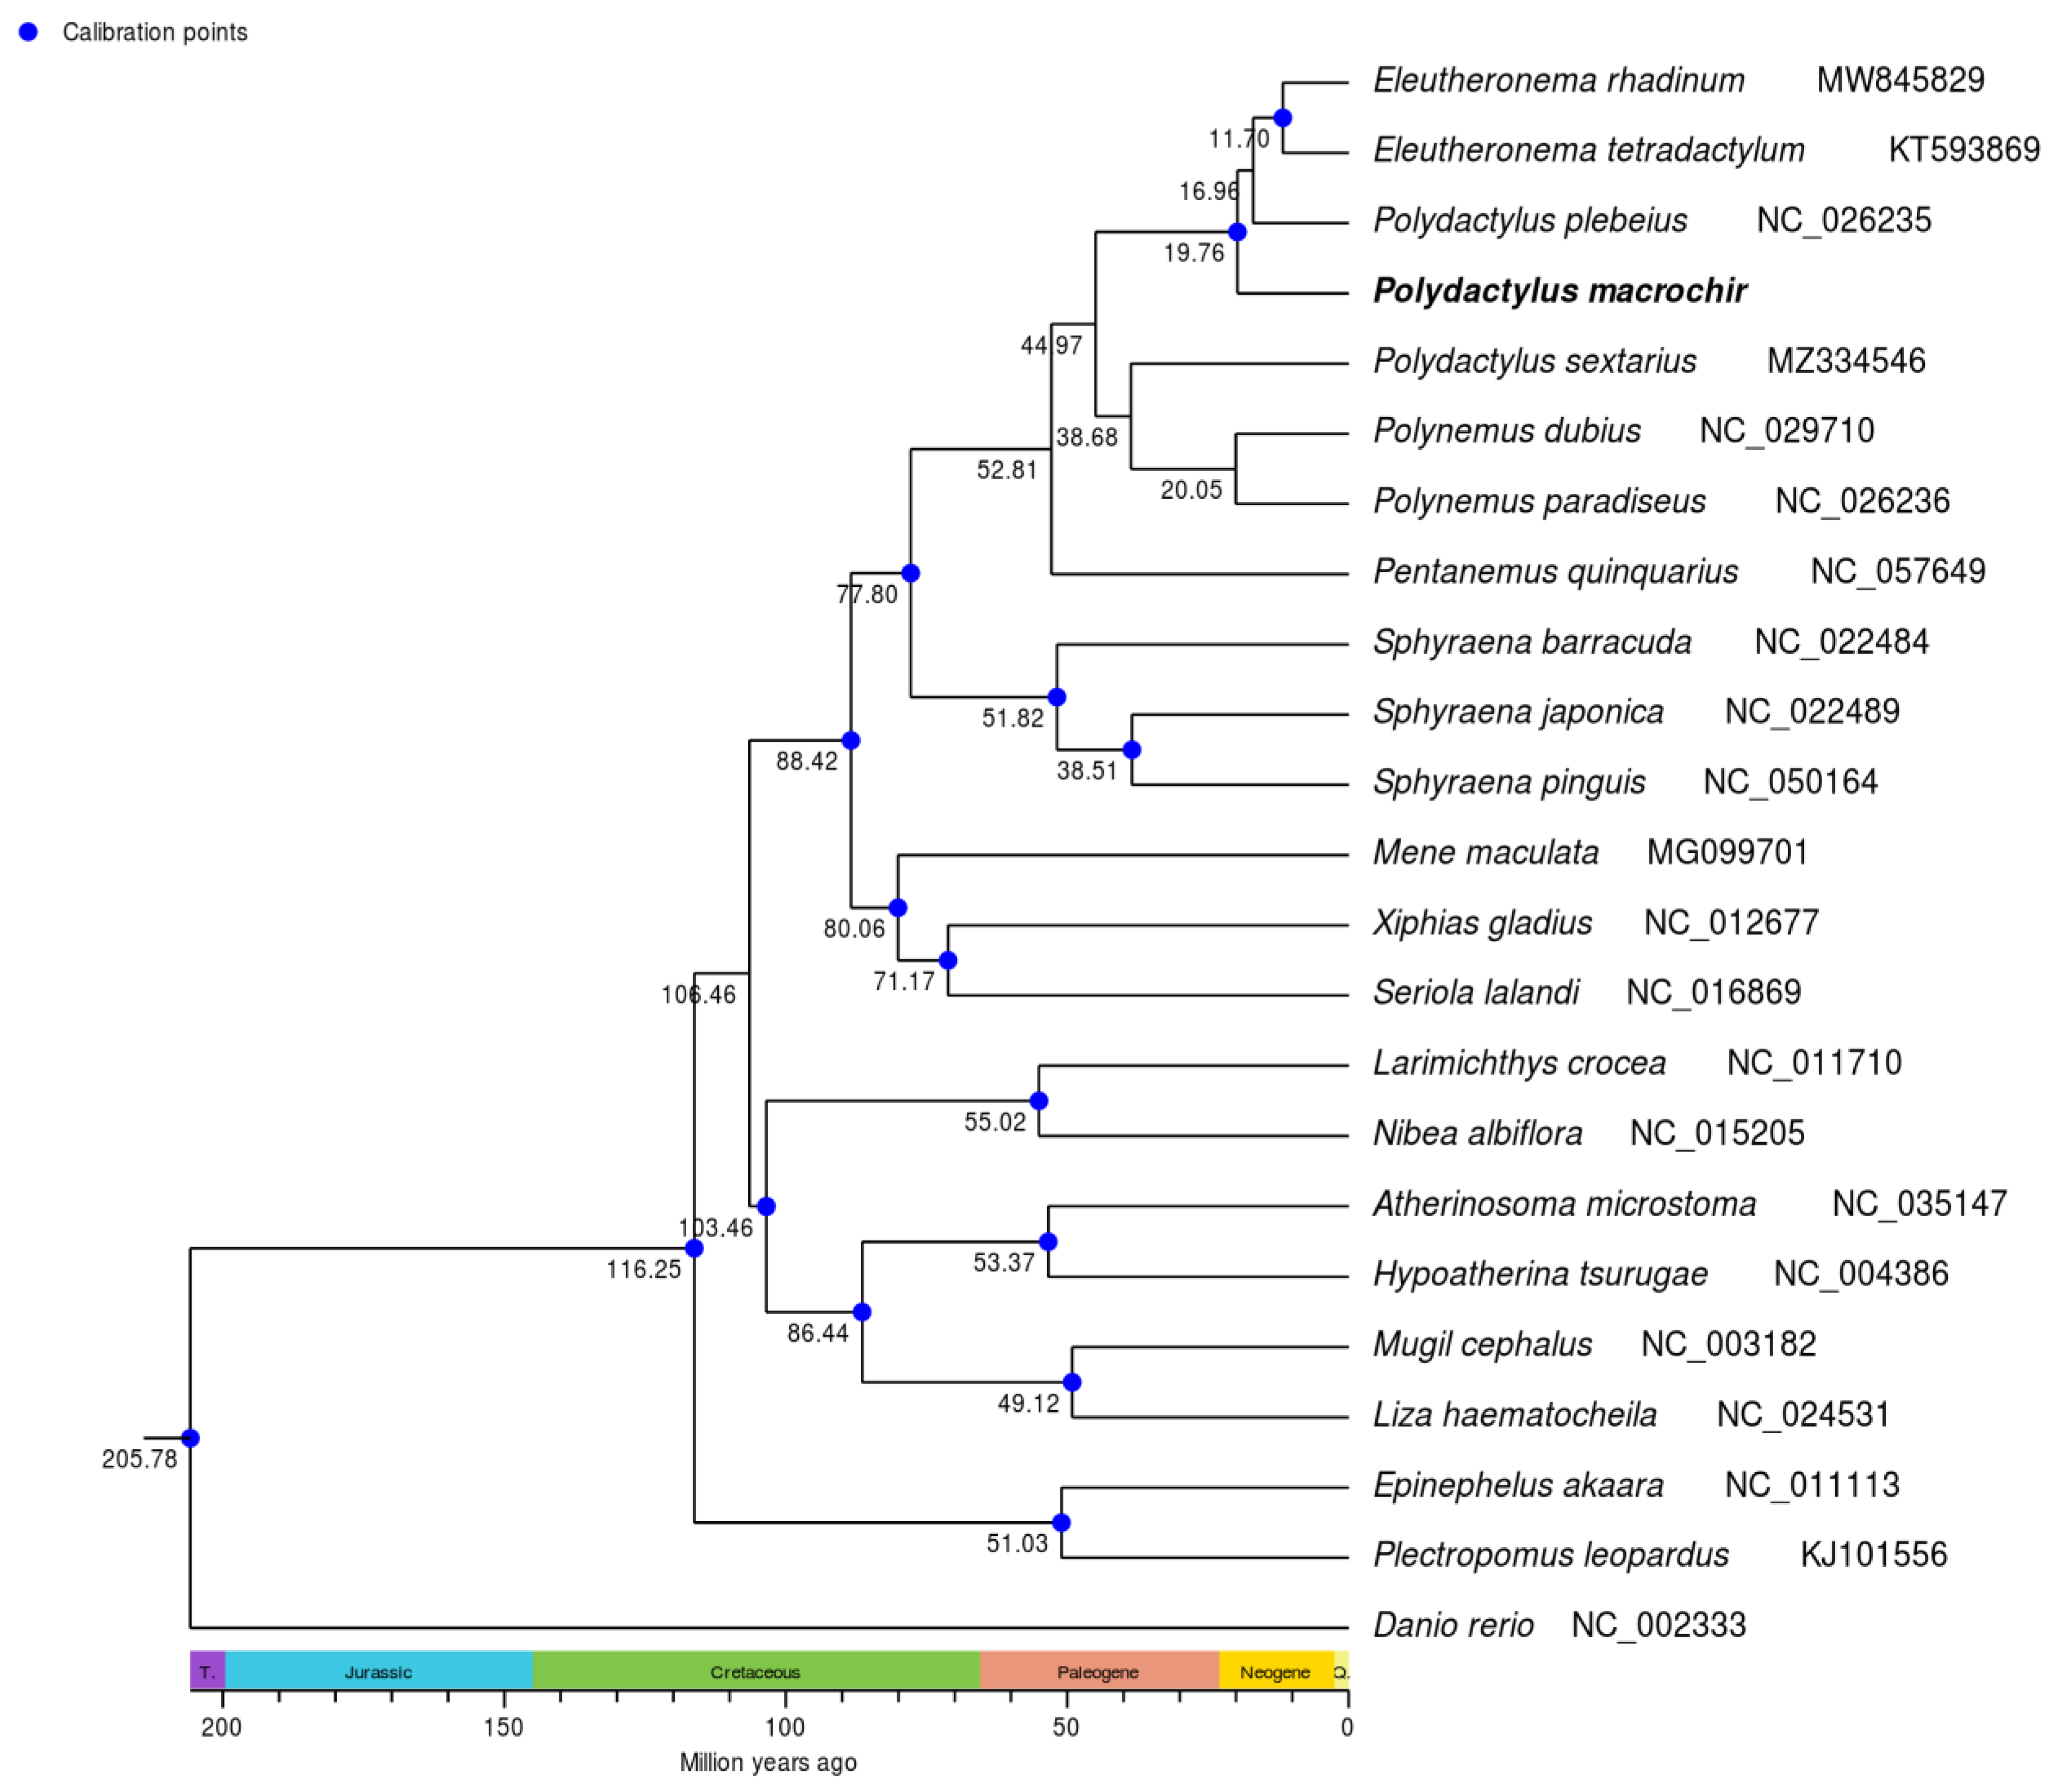
To find the position of P. macrochir among 22 other species, the phylogenetic tree was constructed using maximum likelihood (ML) and Bayesian inference (BI) based on coding sequence. It was shown that ML trees and BI trees shared a similar topological structure (. As an outgroup, D. rerio was distinct from the other fish species. The remaining fish species was grouped into two major clades. Eight polynemid species formed a well-supported monophyletic cluster. P. macrochir and the monophyletic cluster consists of Eleutheronema tetradactylum Polydactylus plebeius formed a sister group. Polynemidae formed a sister cluster with the clade of Sphyraenidae with high bootstrap support value (100%). Then, (Polynemidae + Sphyraenidae) and (Menidae + Xiphiidae + Carangidae) were sister lineage. The other representative species from different family display distinct monophyletic clustering patterns. According to TimeTree analyses, the most recent common ancestor (MRCA) of Polynemidae was traced back to about 52.81 million years ago(MYA), while 6 species within Polynemidae diverged from 11.70 MYA to 20.05 MYA.
Figure 4.
ML phylogenetic trees based on the nucleotide datasets for 13 PCGs from the mitogenomes of 23 species. The posterior probabilities were overlaid with each node.
Figure 4.
ML phylogenetic trees based on the nucleotide datasets for 13 PCGs from the mitogenomes of 23 species. The posterior probabilities were overlaid with each node.
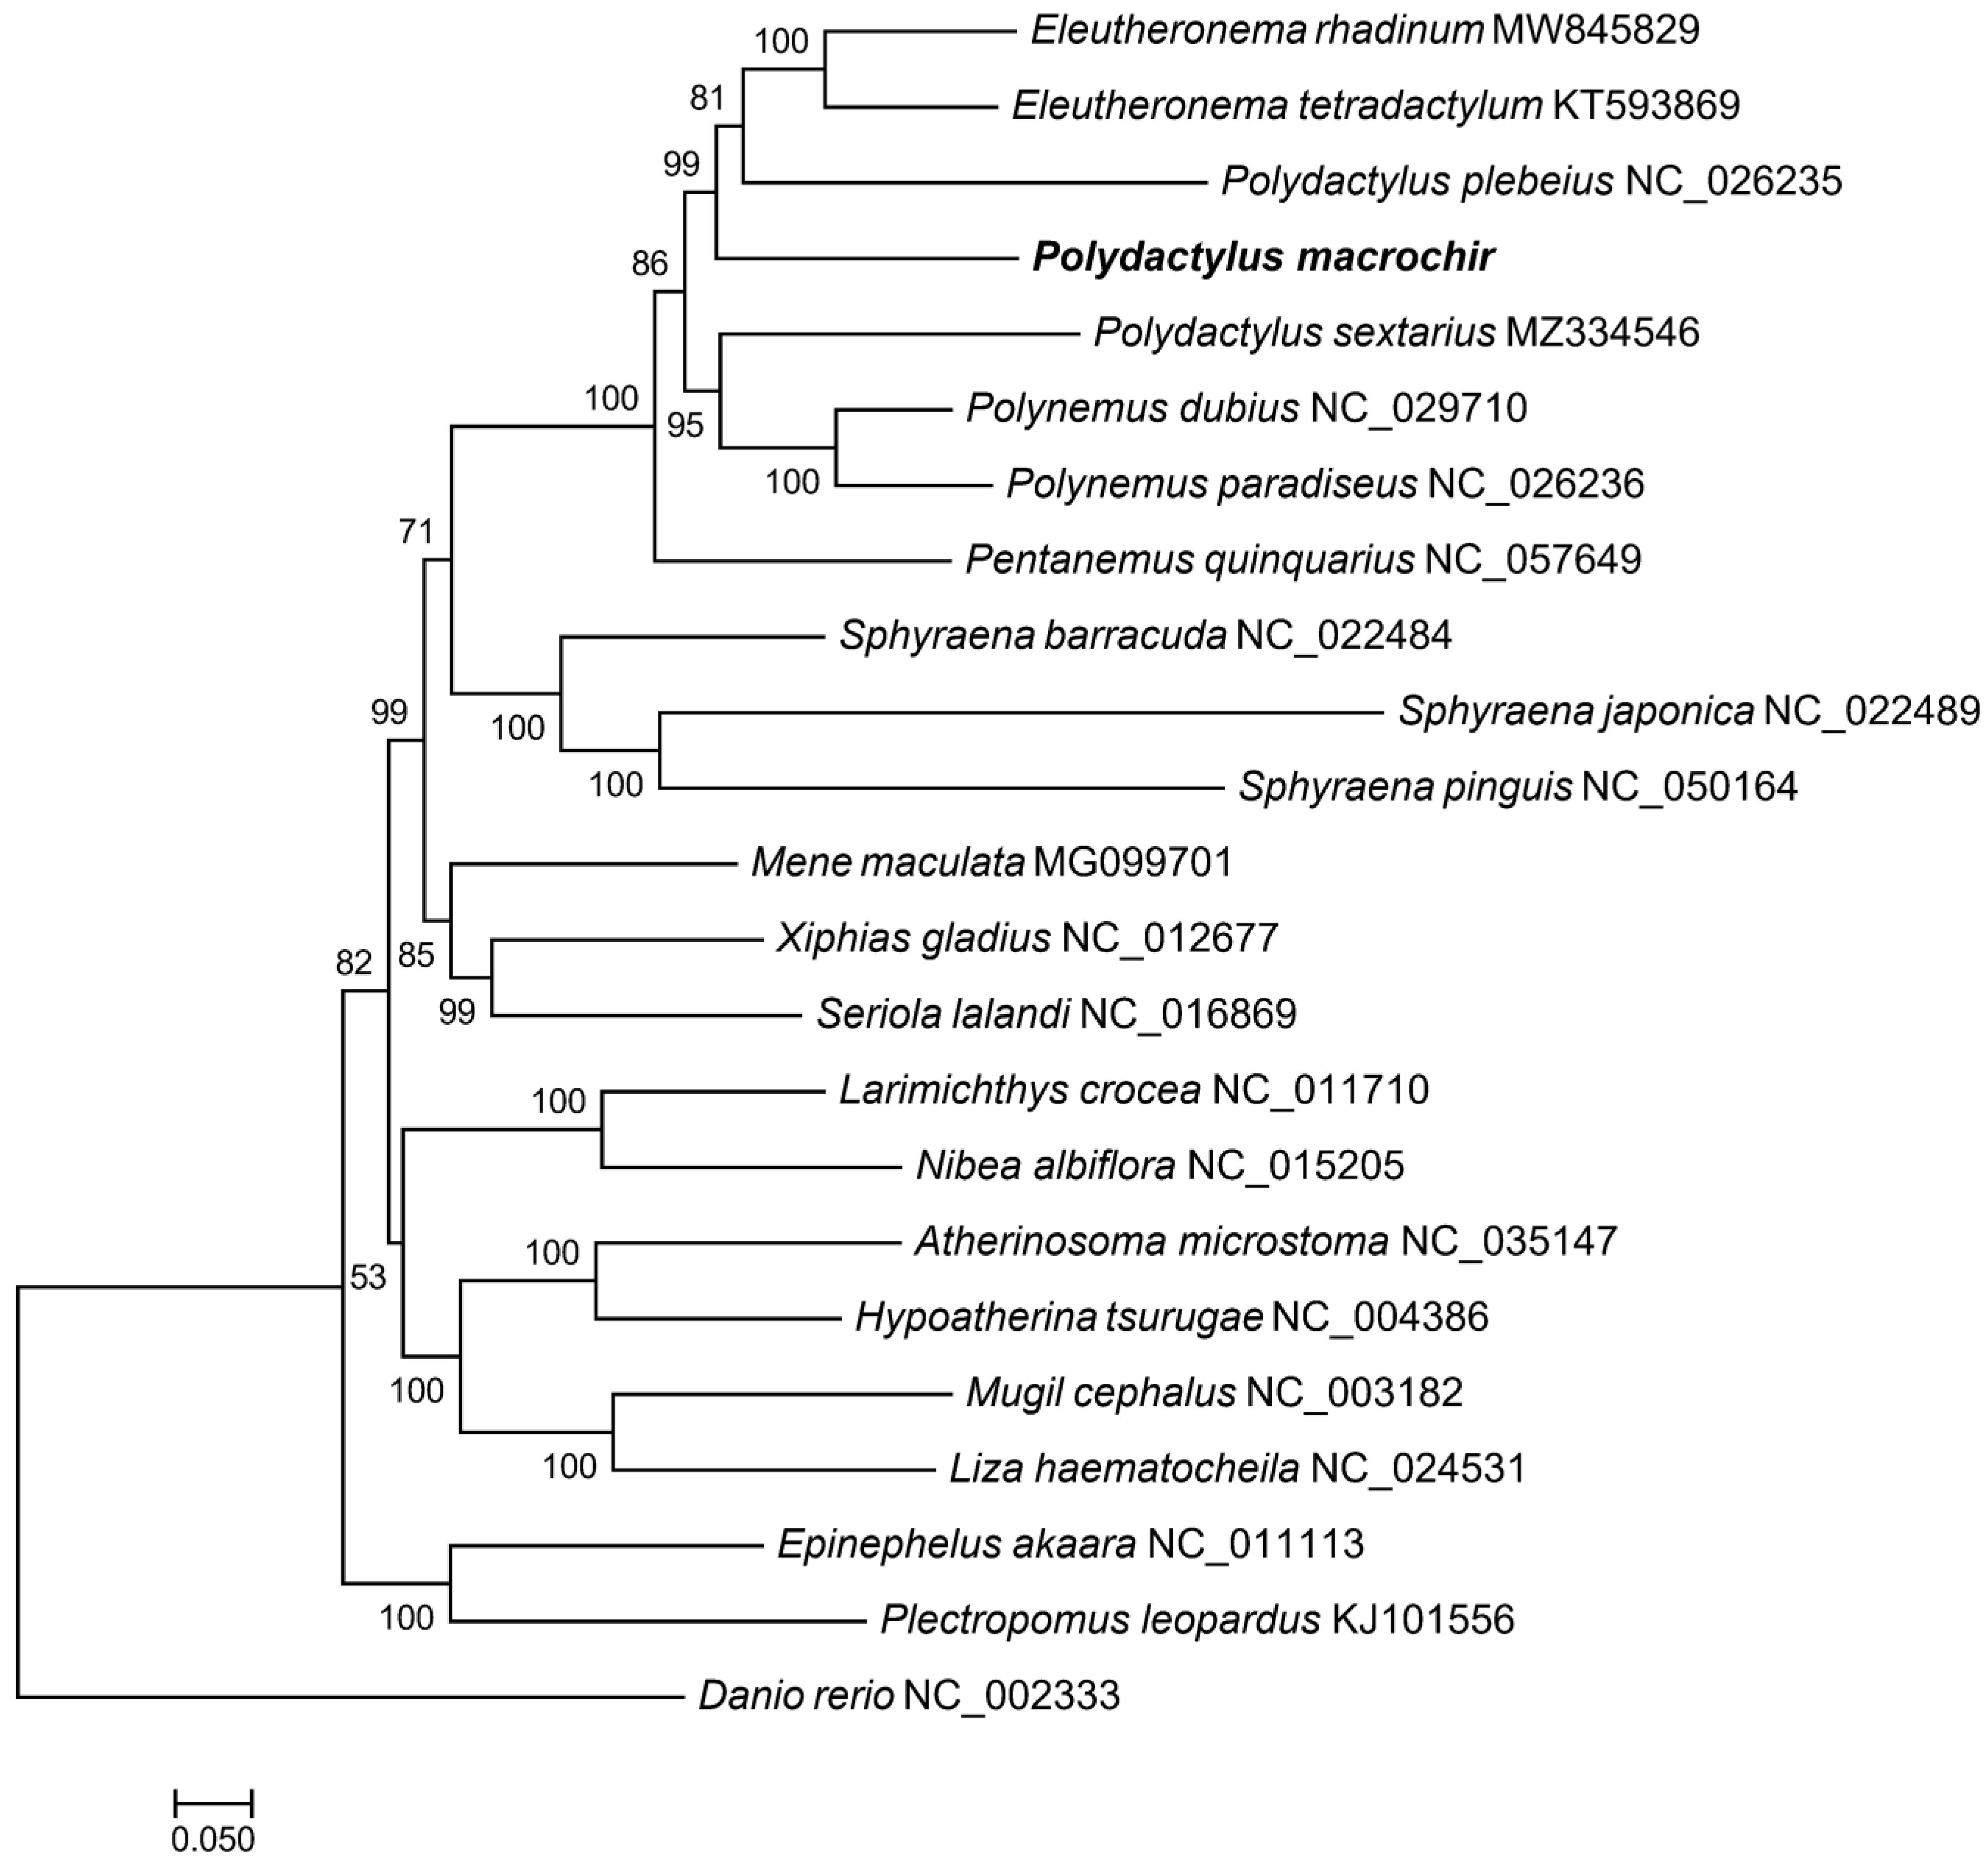
Figure 5.
BI phylogenetic trees based on the nucleotide datasets for 13 PCGs from the mitogenomes of 23 species. The posterior probabilities were overlaid with each node.
Figure 5.
BI phylogenetic trees based on the nucleotide datasets for 13 PCGs from the mitogenomes of 23 species. The posterior probabilities were overlaid with each node.

Figure 6.
Divergence time estimation of the threadfins. Number at nodes indicate estimated age.
4. Discussion
The mitochondrial genome of P. macrochir has a total length of 16,738 bp, containing 13 PCGs, 22 tRNAs, 2 rRNAs, and 1 noncoding CR, with a typical gene content of vertebrates [24]. In terms of gene arrangement, P. macrochir is consistent with other sequenced related species [14]. Both of these results indicated that P. macrochir was conserved. The nucleotide composition of the P. macrochir mitogenome was rich in A + T (54.15%), with slightly positive AT-skew (0.049), while GC-skew was moderately negative (-0.286). The overlapping and intergenic region, which has commonly been observed in other species, were both present in the mitogenome of P. macrochir. The length of overlap or intergenic region between adjacent genes varied with special lineage. All the PCGs started with the typical ATN codons, except for cox1, initiated by the GTG. In P. macrochir, TAA was the most frequent codon used as stop codon, while TAG terminating codon was used once, with the remaining incomplete T and TA codon. The atypical initiation codons and incomplete terminating codons were also reported in mitogenome of other fish species [25].
As we know, the RSCU usually reflects the preference for codon usage [26]. In P. macrochir, the PCGs were more prone to use A and C than T and G at the third codon, different from Epinephelidae [27]. The bias in the usage of codons may provide hits to understand the evolutionary history of P. macrochir.
The analysis of nonsynonymous (Ka) and synonymous (Ks) substitution rates within miogenome PCGs provides evidence for studying natural selection and local adaption [28]. In this study, the Ka/Ks ratio of all PCGs was much less than 1, indicating a strong negative selection among the selected species. Mitochondrial PCGs play a crucial role in oxygen utilization and energy metabolism, which was vital for the survival and development of organism. The low Ka/Ks ratio of all PCGs ensure their functional conservation, reflecting the evolutionary strategy for ecological niche adaptation.
Previous studies did not resolve the uncertainties of Polynemidae phylogenetic position. In this study, we reconstructed a phylogenetic tree for P. macrochir and 22 other species based on 13 PCGs from the mitochondrial genome. Same topologies were generated by both BI and ML analysis.P. macrochir another 7 species of Polynemidae were clustered into a clade with high nodal support values, validating the monophyly of the family Polynemidae. Within Polynemidae, P. macrochir and the other Polydactylus species cannot form a monophyletic group. The ability to fully understand the phylogeny of Polynemidae was restricted by limited mitogenome data. Because, there are 8 genera including 42 extant species, only 8 mitogenomes were determined. Therefore, more mitogenomes need to be sequenced to reconstruct Polynemidae phylogenetic tree. It was shown that Polynemidae and Sphyraenidae were sister groups. Furthermore, sister-group relationships between (Polynemidae + Sphyraenidae) and (Menidae + Xiphiidae + Carangidae) were robustly supported. These results conflicted with earlier studies which proposed that polynemids were closer to Mugilidae, Sphyraenidae, Atherinidae, and Phallostethoidei, Mugilidae and Sphyraenidae or Sciaenidae according to different phenotypic analyses [4-8]. Alternative hypotheses for the phylogenetic placement of Polynemidae based on molecular analyses, such as, Polynemidae + Menidae as the sister group of Sphyraenidae [13], Polynemidae were grouped with Menidae and Lactariidae [10], Polynemidae and Menidae was sisiter-lineage [9], were also in conflict with present study. Rencently, sister-group relationship between Polynemidae and Pleuronectiformes was supported by molecular and morphological data [11,12]. Our study was not invloved in the relationship between Polynemidae and Pleuronectiformes, which should be resolved by future research. According to the present results, we tend to locate Polynemidae in Perciformes and do not support independent Order Polynemiformes [14]. Polynemidae and Sphyraenidae clustered together as a monophyletic group, might form a new suborder of Perciformes needing more evidences. The estimation of divergence time displayed that Polynemidae and Sphyraenidae diverged from the most recent common ancestor in the late Cretaceous at 77.80 MYA. Threadfins may originate in the Paleogene at 52.81 MYA. Some species of Polynemida may undergo an accelerated diversification during the Neogene period. This enhances our understanding of the phylogenetic relationship and speciation of Polynemidae.
5. Conclusions
In this study, the complete mitogenome of P. macrochir was sequenced and analyzed. The mitochondrial genome had a total size of 16,738 bp and had a conserved gene contents and arrangement. The PCGs tended to use A and C than T and G at the third codon. All of the PCGs were under purifying selection. Phylogenetic analysis revealed that Polynemidae were clustered into a monophyletic group being sister group to Sphyraenidae. Threadfins may originate in the Paleogene at 52.81 MYA. Some species of Polynemida may undergo an accelerated diversification during the Neogene period. These results provide valuable information for future studies on the phylogenetic relationships and speciation of Polynemidae.
Supplementary Materials
The following supporting information can be downloaded at the website of this paper posted on Preprints.org, Table S1: ka/ks value list and Relative synonymous codon usage (RSCU) of P. macrochir.
Author Contributions
Conceptualization, W.J.; methodology, W.J.; software, W.J.; validation, W.J.; formal analysis, W.J.; investigation, W.J.; resources, W.J.; data curation, W.J.; writing—original draft preparation, W.J.; writing—review and editing, W.J.; visualization, W.J.; supervision, W.J.; project administration, W.J.; funding acquisition, W.J. All authors have read and agreed to the published version of the manuscript.
Funding
The study was funded by Science and Technology Planning Project of Guangdong Province (2017A020208001).
Institutional Review Board Statement
The animal study protocol was approved by the Institutional Animal Care and Use Committee of the Institute of Hydrobiology, Chinese Academic of Sciences (protocol code: 2022/LL/036; date of approval: 25 September 2022).
Informed Consent Statement
Not applicable
Data Availability Statement
The data presented in this study are available in NCBI GenBank. (Accession number: PQ675801).
Conflicts of Interest
The authors declare no conflict of interest.
References
- Motomura: H. Treadfns of the world (Family Polynemidae): An annotated and illustrated catalogue of polynemid species known to date (Food & Agriculture Org, Rome, 2004).
- Presti, P.; Johnson, G.D.; Datovo, A. Anatomy and evolution of the pectoral filaments of threadfins (Polynemidae). Sci Rep. 2020, 10, 17751. [CrossRef]
- Fricke R, Eschmeyer W, Fong J. Eschmeyer’s catalog of fishes: genera/species by family/subfamily. San Francisco: California Academy of Sciences, 2022.
- Gosline WA. Systematic position and relationships of the percesocine fishes. Pac. Sci. 1962, 16, 207-217.
- Rosen DE. The relationships and taxonomic position of the halfbeaks, killifishes, silversides, and their relatives. Bull. Am. Mus. Nat. Hist. 1964, 127, 217-268.
- Johnson, D.G Percomorph phylogeny: Progress and problems. Bulletin of Marine Science. 1993, 52, 3-28.
- Kang, S.; Imamura, H.; Kawai, T. Morphological evidence supporting the monophyly of the family Polynemidae (Teleostei: Perciformes) and its sister relationship with Sciaenidae. Ichthyol. Res. 2017, 65, 29-41. [CrossRef]
- Presti P, Johnson GD, Datovo A. Facial and gill musculature of polynemid fishes, with notes on their possible relationships with sciaenids (Percomorphacea: Perciformes). J Morphol. 2020, 281, 662-675. [CrossRef]
- Mirande, J.M. Combined phylogeny of ray-ffnned fishes (Actinopterygii) and the use of morphological characters in large-scale analyses. Cladistics. 2017, 33, 333-350.
- Sanciangco, M.D.; Carpenter, K.E.; Betancur-R, R. Phylogenetic placement of enigmatic percomorph families (Teleostei: Percomorphaceae). Molecular Phylogenetics and Evolution. 2015, 94, 565-576. [CrossRef]
- Betancur-R, R.; Broughton, R.E.; Wiley, E.O.; Carpenter, K.; López, J.A.; Li, C.; Holcroft, N.I.; Arcila, D.; Sanciangco, M.; Cureton, Ii.J.C.; Zhang, F.; Buser, T.; Campbell, M.A.; Ballesteros, J.A.; Roa-Varon, A.; Willis, S.; Borden, W.C.; Rowley, T.; Reneau, P.C.; Hough, D.J.; Lu, G.; Grande, T.; Arratia, G.; Ortí, G. The tree of life and a new classification of bony fishes. PLoS Currents. 2013, 5. [CrossRef]
- Hughes, L.C.; Ortí, G.; Huang, Y.; Sun, Y.; Baldwin, C.C.; Thompson, A.W.; Arcila, D.; Betancur-R, R.; Li, C.; Becker, L.; Bellora, N.; Zhao, X.; Li, X.; Wang, M.; Fang, C.; Xie, B.; Zhou, Z.; Huang, H.; Chen, S.; Venkatesh, B.; Shi, Q. Comprehensive phylogeny of rayffnned ffshes (Actinopterygii) based on transcriptomic and genomic data. Proc. Natl. Acad. Sci. U.S.A. 2018, 115, 6249-6254.
- Girard, M.G.; Davis, M.P.; Smith, W.L. The phylogeny of Carangiform fishes: morphological and genomic investigations of a new fish clade. Copeia. 2020, 108, 265-298. [CrossRef]
- Zhong, L.Q.; Wang, M.H.; Li, D.M.; Tang, S.K.; Chen, X.H. Mitochondrial genome of Eleutheronema rhadinum with an additional non-coding region and novel insights into the phylogenetics. Front. Mar. Sci. 2021, 8, 746598. [CrossRef]
- Taanman, J.W. The mitochondrial genome: structure, transcription, translation and replication. Biochim. Biophys. Acta Bioenerg. 1999, 1410, 103-123. [CrossRef]
- Moritz, C.; Dowling, T. E.; Brown, W.M. Evolution of animal mitochondrial DNA: relevance for population biology and systematics. Annu. Rev. Ecol. Syst. 1987, 18, 269–292. [CrossRef]
- Wang, C.; Ye, P.; Liu, M.; Zhang, Y.; Feng, H.; Liu, J.; Zhou, H.; Wang, J.; Chen, X. Comparative Analysis of Four Complete Mitochondrial Genomes of Epinephelidae (Perciformes). Genes (Basel). 2022, 13, 660. [CrossRef]
- Gao, J.; Li, C.; Yu, D.; Wang, T.; Lin, L.; Xiao, Y.; Wu, P.; Liu, Y. Comparative mitogenome analyses uncover mitogenome features and phylogenetic implications of the parrotfishes (Perciformes: Scaridae). Biology (Basel). 2023, 12, 410. [CrossRef]
- Yang, L.M.; Xue, J.F.; Zhao, X.M.; Ding, K.; Liu, Z.W.; Wang, Z.S.; Chen, J.B.; Huang, Y.K. Mitochondrial genome characteristics reveal evolution of Acanthopsetta nadeshnyi (Jordan and Starks, 1904) and phylogenetic relationships. Genes (Basel). 2024, 15, 893.
- Bankevich, A.; Nurk, S.; Antipov, D.; Gurevich, A.A.; Dvorkin, M.; Kulikov, A.S.; Lesin, V.M, Nikolenko, S.I.; Pham, S.; Prjibelski, A.D.; Pyshkin, A.V.; Sirotkin, A.V.; Vyahhi, N.; Tesler, G.; Alekseyev, M.A.; Pevzner, P.A. SPAdes: a new genome assembly algorithm and its applications to single-cell sequencing. J Comput Biol. 2012, 19, 455-77.
- Bernt, M.; Donath, A.; Jühling, F.; Externbrink, F.; Florentz, C.; Fritzsch, G.; Pütz, J.; Middendorf, M.; Stadler, P.F. MITOS: Improved de novo metazoan mitochondrial genome annotation. Mol. Phylogenet. Evol. 2013, 69, 313-319. [CrossRef]
- Katoh, K.; Rozewicki, J.; Yamada, K.D. MAFFT online service: Multiple sequence alignment, interactive sequence choice and visualization. Brief. Bioinform. 2019, 20, 1160-1166. [CrossRef]
- Wang, D.; Zhang, Y.; Zhang, Z.; Zhu, J.; Yu, J. KaKs_Calculator 2.0: A Toolkit incorporating γ-series methods and sliding window strategies. Genom. Proteom. Bioinform. 2010, 8, 77-80.
- Montaña-Lozano, P.; Moreno-Carmona, M.; Ochoa-Capera, M.; Medina, N.S.; Boore, J.L.; Prada, C.F. Comparative genomic analysis of vertebrate mitochondrial reveals a differential of rearrangements rate between taxonomic class. Sci. Rep. 2022, 12, 5479. [CrossRef]
- Ke Z, Zhou K, Hou M, Luo H, Li Z, Pan X, Zhou J, Jing T, Ye H. Characterization of the Complete Mitochondrial Genome of the Elongate Loach and Its Phylogenetic Implications in Cobitidae. Animals (Basel). 2023, 13, 3841. [CrossRef]
- Gun, L.; Yumiao, R.; Haixian, P.; Liang, Z. Comprehensive analysis and comparison on the codon usage pattern of whole Mycobacterium tuberculosis coding genome from different area. Biomed. Res. Int. 2018, 2018, 3574976. [CrossRef]
- Kundu S, Kang HE, Kim AR, Lee SR, Kim EB, Amin MHF, Andriyono S, Kim HW, Kang K. Mitogenomic Characterization and Phylogenetic Placement of African Hind, Cephalopholis taeniops: Shedding Light on the Evolution of Groupers (Serranidae: Epinephelinae). Int. J. Mol. Sci. 2024, 25, 1822.
- Yang, Z.H.; Nielsen, R. Estimating synonymous and nonsynonymous substitution rates under realistic evolutionary models. Mol. Biol. Evol. 2000, 17, 32-43. [CrossRef]
Figure 1.
Mitochondrial genome map of the P. macrochir.
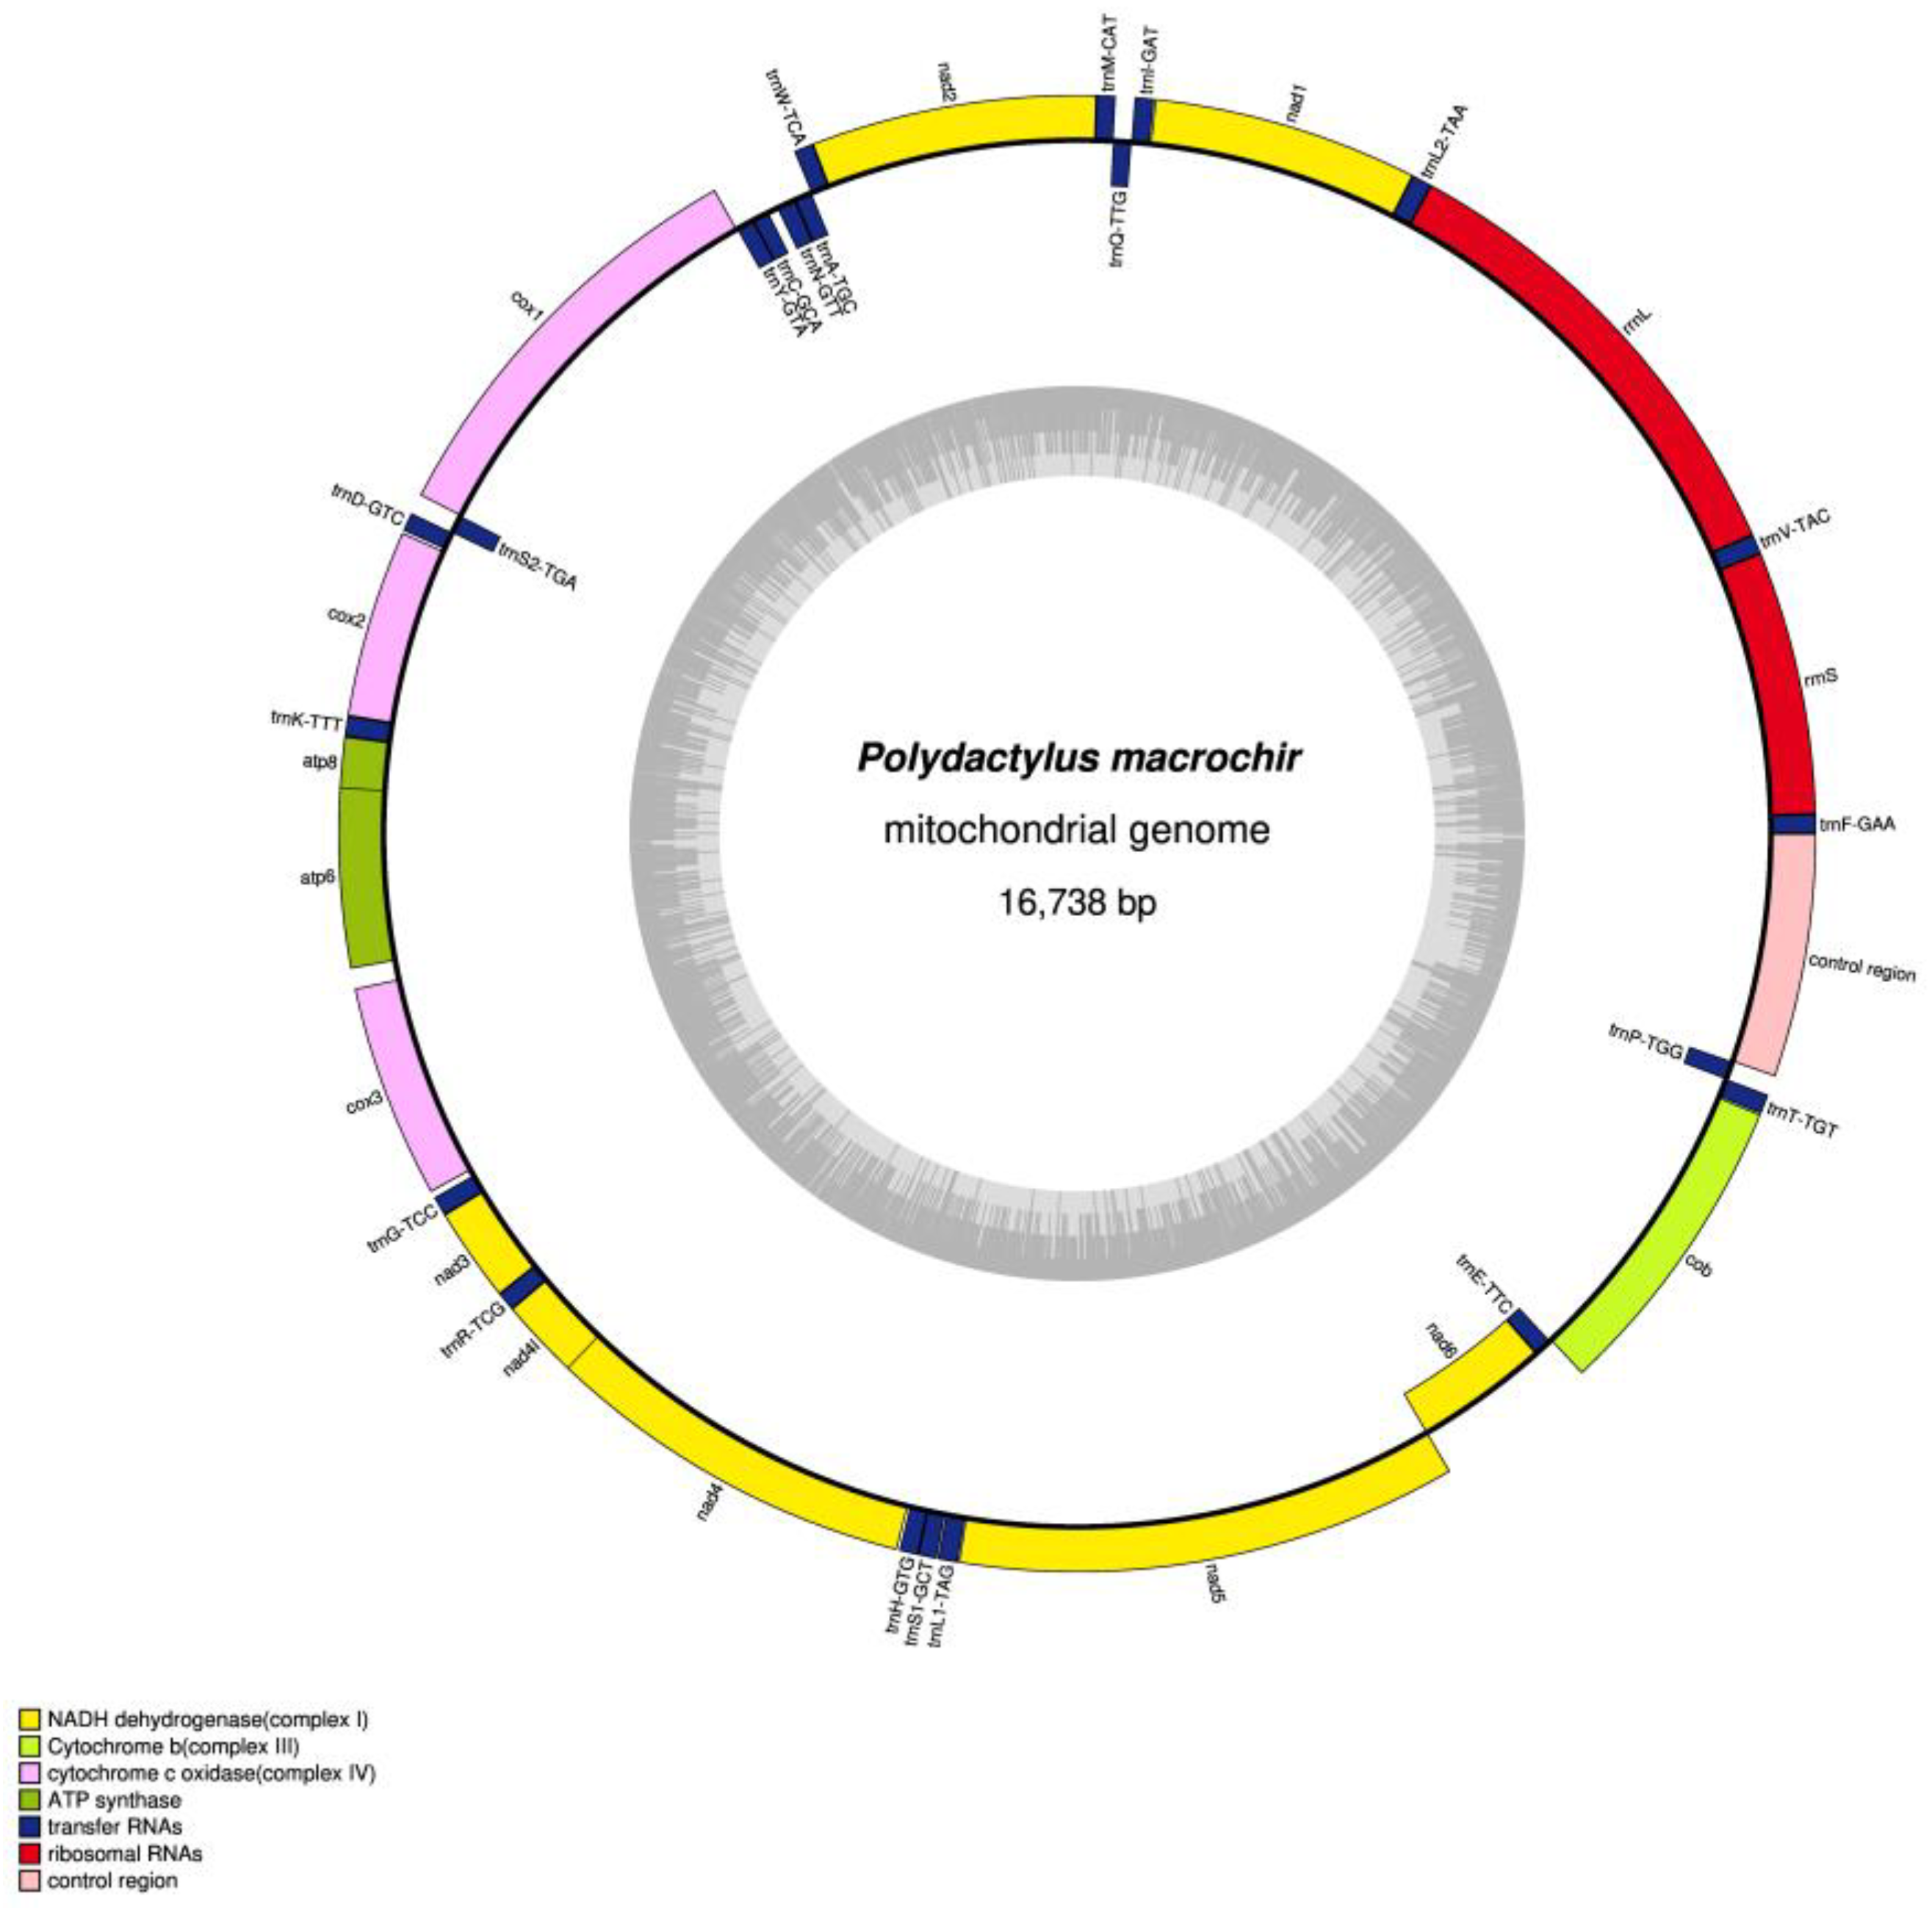
Figure 2.
The relative synonymous codon usage (RSCU) in the mitogenome of P. macrochir . .
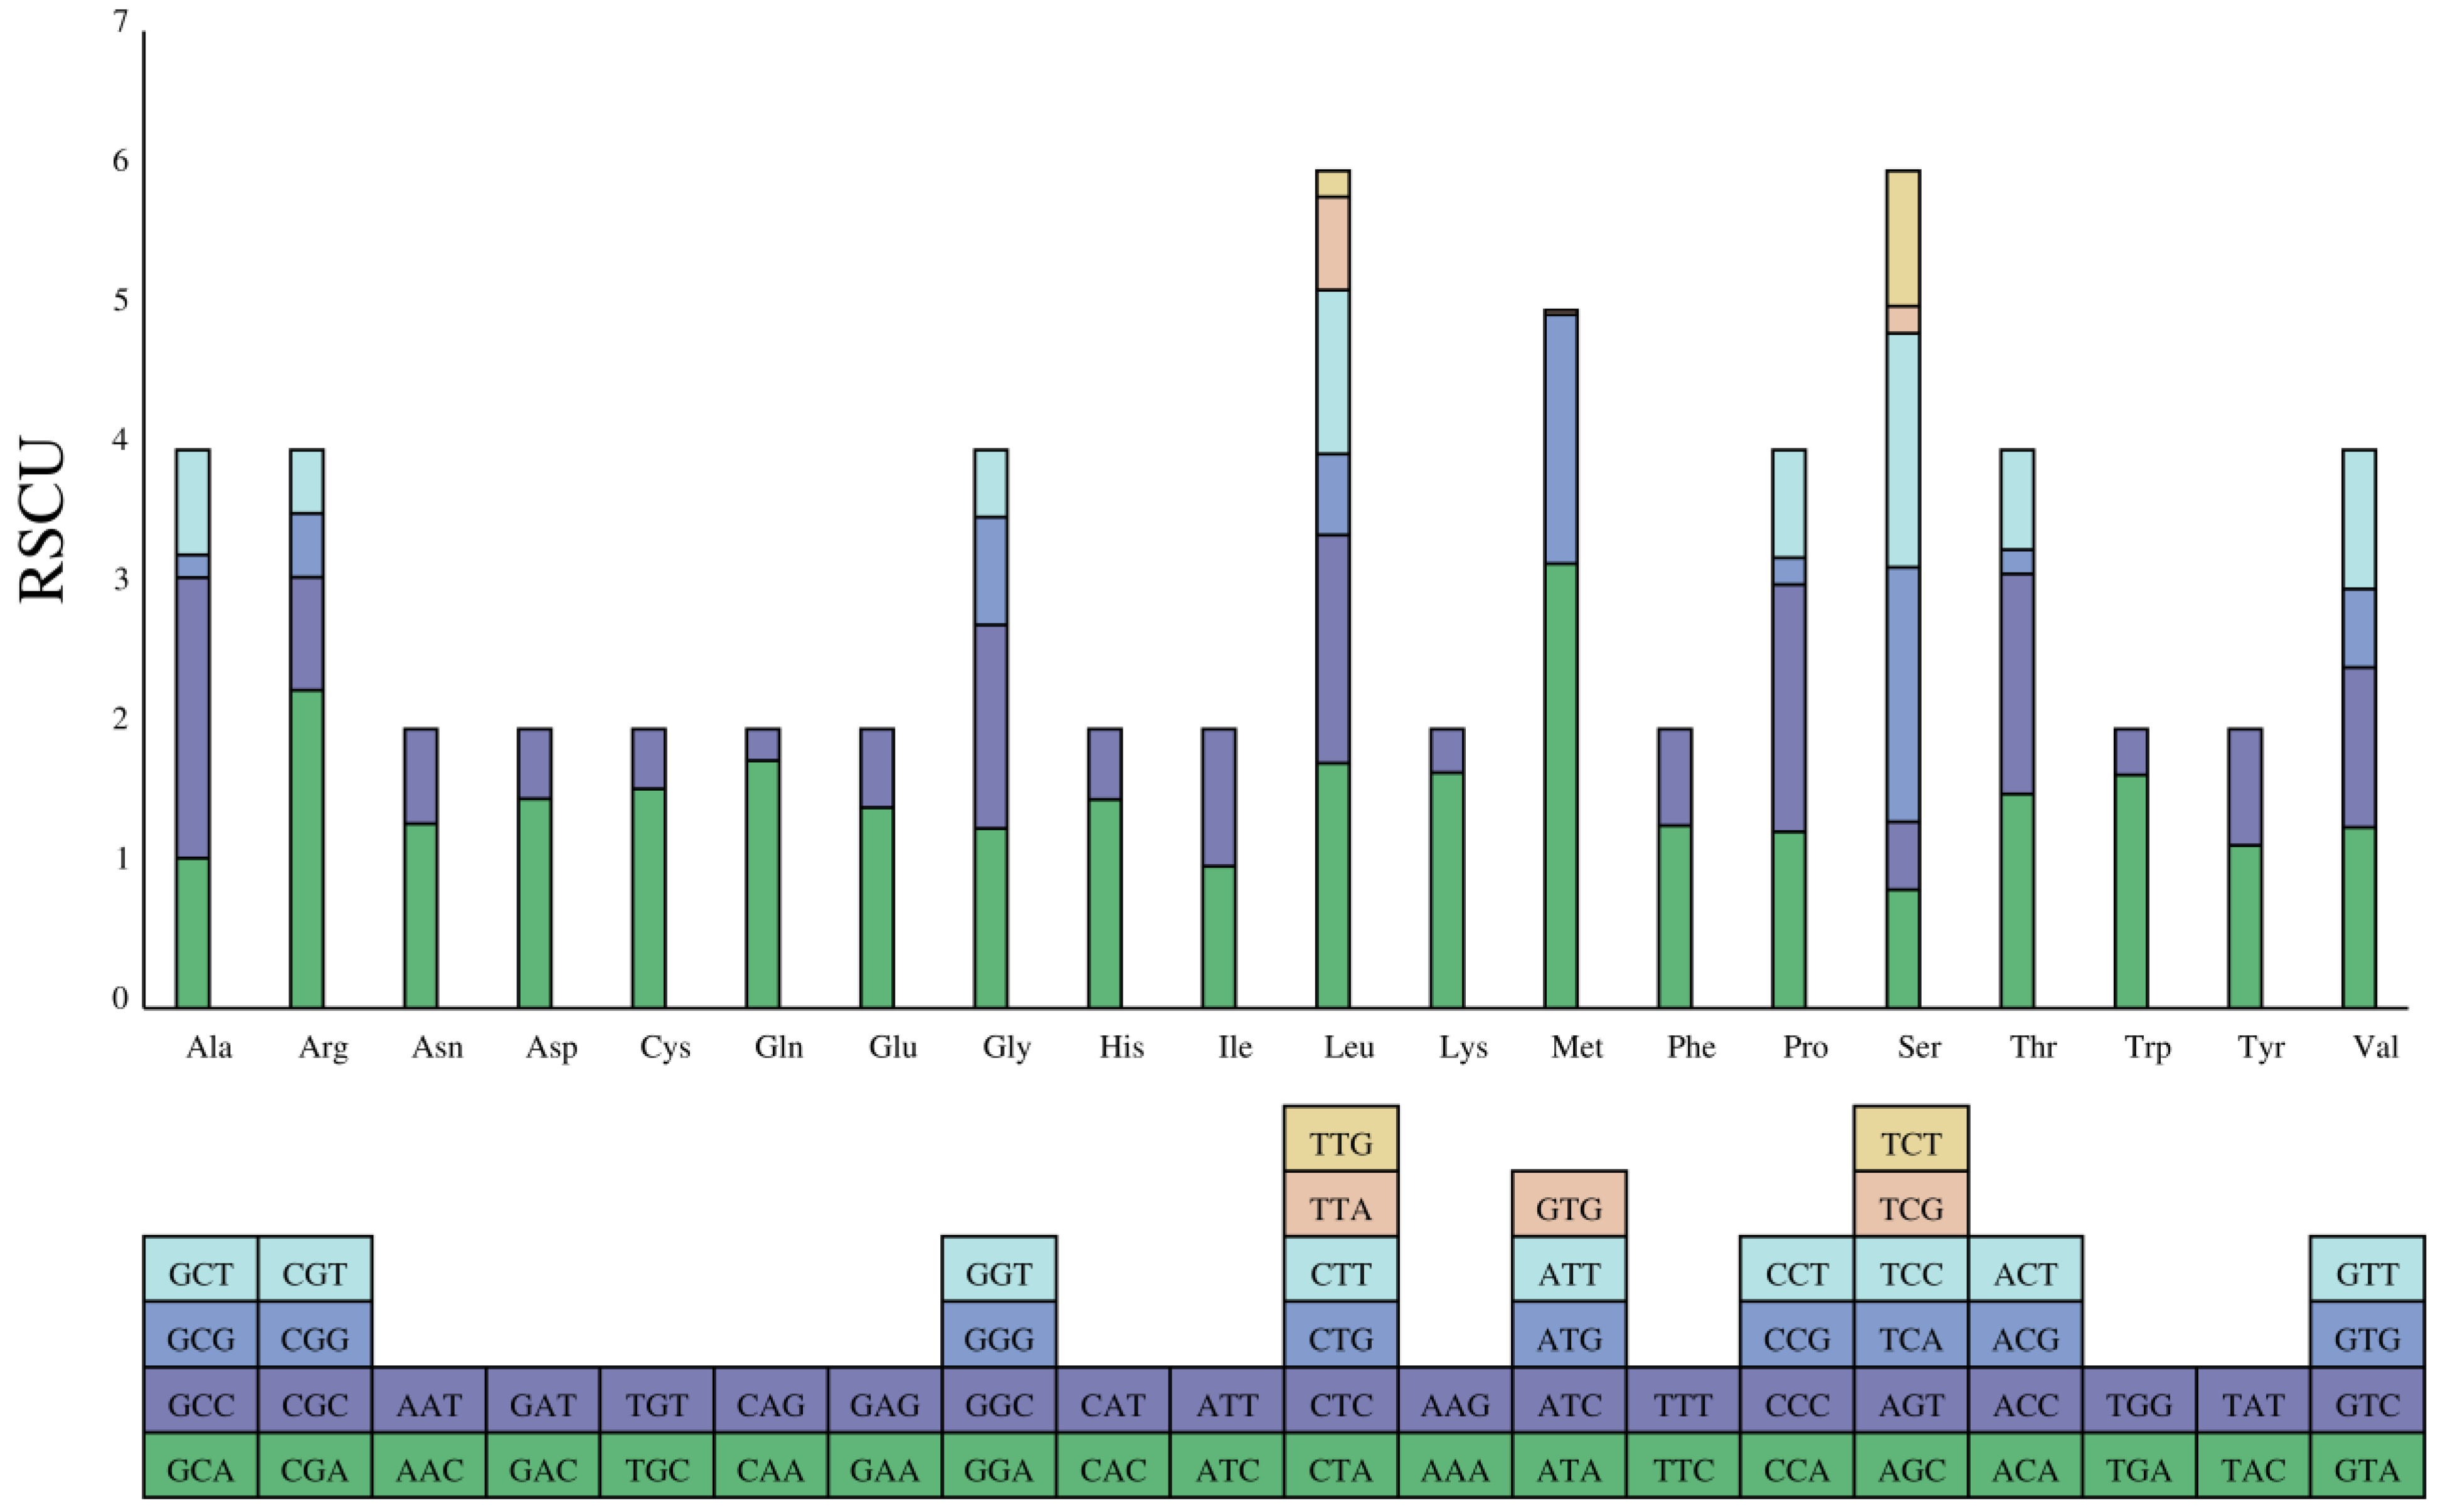
Figure 3.
Ka/Ks values for the 13 PCGs of P. macrochir comaparated to other threadfins.
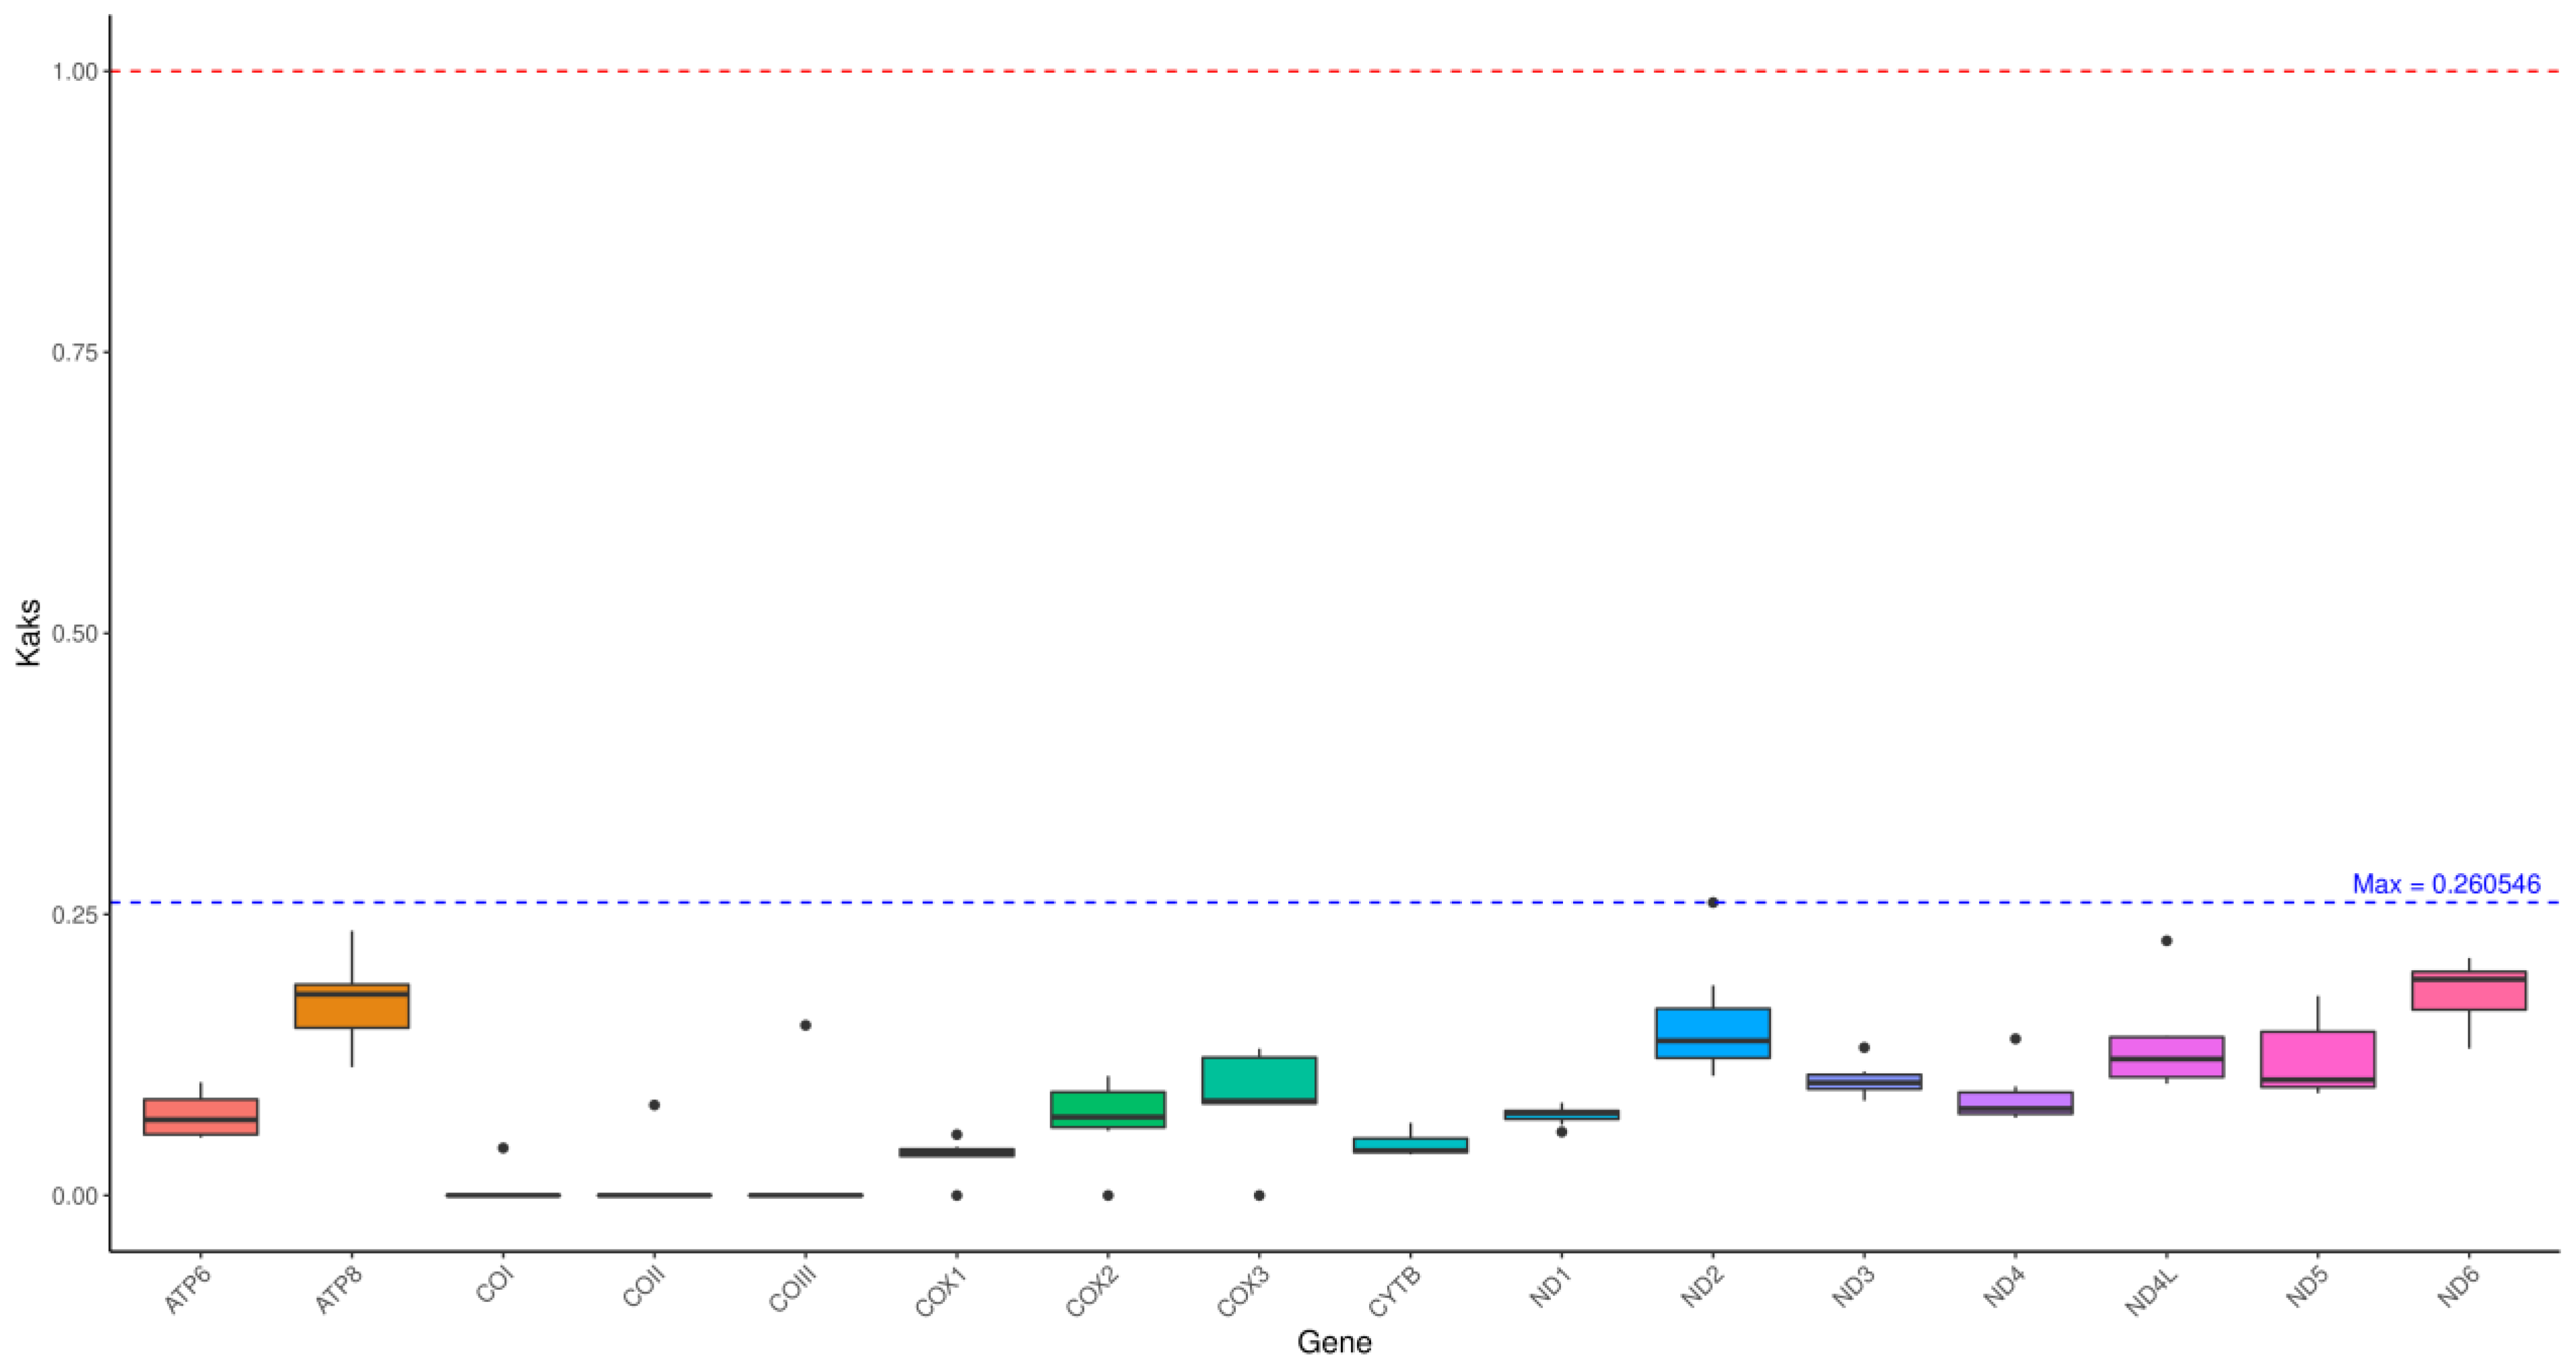

Table 1.
Species attribution and accession number.
| Order | Family | Genus | Species | Size (bp) | Accession No. |
|---|---|---|---|---|---|
| Perciformes | Polynemidae | Eleutheronema | Eleutheronema rhadinum | 16718 | MW845829.1 |
| Eleutheronema tetradactylum | 16491 | KT593869.1 | |||
| Pentanemus | Pentanemus quinquarius | 16708 | NC_057649.1 | ||
| Polydactylus | Polydactylus sextarius | 16841 | MZ334546.1 | ||
| Polydactylus plebeius | 16765 | NC_026235.1 | |||
| Polynemus | Polynemus paradiseus | 16710 | NC_026236.1 | ||
| Polynemus dubius | 16555 | NC_029710.1 | |||
| Sphyraenidae | Sphyraena | Sphyraena pinguis | 16620 | NC_050164.1 | |
| Sphyraena barracuda |
16707 | NC_022484.1 | |||
| Sphyraena japonica | 16760 | NC_022489.1 | |||
| Xiphiidae | Xiphias | Xiphias gladius | 16520 | NC_012677.1 | |
| Carangidae | Seriola | Seriola lalandi | 16532 | NC_016869.1 | |
| Menidae | Mene | Mene maculata | 16733 | MG099701.1 | |
| Sciaenidae | Larimichthys | Larimichthys crocea | 16466 | NC_011710.1 | |
| Nibea | Nibea albiflora | 16499 | NC_015205.1 | ||
| Atheriniformes | Atherinidae | Atherinosoma | Atherinosoma microstoma | 16573 | NC_035147.1 |
| Hypoatherina | Hypoatherina tsurugae | 16566 | NC_004386.1 | ||
| Serranidae | Epinephelus | Epinephelus akaara | 16795 | NC_011113.1 | |
| Plectropomus | Plectropomus leopardus | 16754 | KJ101556.1 | ||
| Mugiliformes | Mugilidae | Mugil | Mugil cephalus | 16685 | NC_003182.1 |
| Planiliza | Liza haematocheila | 16822 | NC_024531.1 | ||
| Cypriniformes | Danionidae | Danio | Danio rerio | 16596 | NC_002333.2 |
Table 2.
General features of the mitogenome of P. macrochir.
| Position | codon | |||||||
|---|---|---|---|---|---|---|---|---|
| Gene | stand | From | To | size | Intergenic Length | start | stop | |
| trnF | H | 1 | 70 | 70 | 0 | |||
| rrnS | H | 71 | 1037 | 967 | 0 | |||
| trnV | H | 1038 | 1110 | 73 | 0 | |||
| rrnL | H | 1111 | 2853 | 1743 | 0 | |||
| trnL2 | H | 2854 | 2927 | 74 | 0 | |||
| nad1 | H | 2928 | 3902 | 975 | 0 | ATG | TAA | |
| trnI | H | 3907 | 3976 | 70 | 4 | |||
| trnQ | L | 3976 | 4046 | 71 | -1 | |||
| trnM | H | 4046 | 4114 | 69 | -1 | |||
| nad2 | H | 4115 | 5160 | 1046 | 0 | ATG | TA- | |
| trnW | H | 5161 | 5231 | 71 | 0 | |||
| trnA | L | 5233 | 5301 | 69 | 1 | |||
| trnN | L | 5303 | 5375 | 73 | 1 | |||
| trnC | L | 5414 | 5479 | 66 | 38 | |||
| trnY | L | 5480 | 5549 | 70 | 0 | |||
| cox1 | H | 5551 | 7101 | 1551 | 1 | GTG | TAA | |
| trnS2 | L | 7102 | 7173 | 72 | 0 | |||
| trnD | H | 7174 | 7242 | 69 | 0 | |||
| cox2 | H | 7252 | 7942 | 691 | 9 | ATG | T-- | |
| trnK | H | 7943 | 8016 | 74 | 0 | |||
| atp8 | H | 8018 | 8206 | 189 | 1 | ATG | TAA | |
| atp6 | H | 8176 | 8859 | 684 | -31 | ATG | TAA | |
| cox3 | H | 8933 | 9718 | 786 | 73 | ATG | TAA | |
| trnG | H | 9742 | 9813 | 72 | 23 | |||
| nad3 | H | 9814 | 10162 | 349 | 0 | ATG | T-- | |
| trnR | H | 10163 | 10231 | 69 | 0 | |||
| nad4l | H | 10232 | 10528 | 297 | 0 | ATG | TAA | |
| nad4 | H | 10522 | 11896 | 1375 | -7 | ATG | T-- | |
| trnH | H | 11906 | 11974 | 69 | 9 | |||
| trnS1 | H | 11975 | 12043 | 69 | 0 | |||
| trnL1 | H | 12048 | 12120 | 73 | 4 | |||
| nad5 | H | 12124 | 13962 | 1839 | 3 | ATG | TAA | |
| nad6 | L | 13959 | 14480 | 522 | -4 | ATG | TAG | |
| trnE | L | 14482 | 14551 | 70 | 1 | |||
| cob | H | 14556 | 15698 | 1143 | 4 | ATG | TAA | |
| trnT | H | 15703 | 15774 | 72 | 4 | |||
| trnP | L | 15774 | 15845 | 72 | -1 | |||
| D-loop | H | 15846 | 16738 | 893 | 0 | |||
Table 3.
Nucleotide composition and skewness values of the P. macrochir mitogenome.
| Polydactylus_macrochir | Size(bp) | A% | T% | G% | C% | A+T% | G+C% | AT-skew | GC-skew |
|---|---|---|---|---|---|---|---|---|---|
| Mitogenome | 16738 | 28.4 | 25.75 | 16.36 | 29.49 | 54.15 | 45.85 | 0.049 | -0.286 |
| PCGs | 11447 | 25.6 | 27.71 | 15.65 | 31.03 | 53.32 | 46.68 | -0.039 | -0.329 |
| tRNAs | 1557 | 27.49 | 26.59 | 23.83 | 22.09 | 54.08 | 45.92 | 0.017 | 0.038 |
| rRNAs | 2710 | 31.51 | 22.77 | 20.92 | 24.8 | 54.28 | 45.72 | 0.161 | -0.085 |
| Dloop | 893 | 35.72 | 31.02 | 14.22 | 19.04 | 66.74 | 33.26 | 0.07 | -0.145 |
Disclaimer/Publisher’s Note: The statements, opinions and data contained in all publications are solely those of the individual author(s) and contributor(s) and not of MDPI and/or the editor(s). MDPI and/or the editor(s) disclaim responsibility for any injury to people or property resulting from any ideas, methods, instructions or products referred to in the content. |
© 2024 by the authors. Licensee MDPI, Basel, Switzerland. This article is an open access article distributed under the terms and conditions of the Creative Commons Attribution (CC BY) license (http://creativecommons.org/licenses/by/4.0/).
Copyright: This open access article is published under a Creative Commons CC BY 4.0 license, which permit the free download, distribution, and reuse, provided that the author and preprint are cited in any reuse.


