
Submitted:
25 April 2025
Posted:
26 April 2025
You are already at the latest version
Abstract
Insect mitochondrial genomes are pivotal for understanding evolutionary relationships and species identification. This study focuses on Microtendipes (Chironomidae), a genus with unresolved phylogenetic positioning and cryptic species challenges. We sequenced and analyzed eight mitogenomes from five Microtendipes species, integrating 18 published Chironominae mitogenomes to reconstruct phylogenies using Maximum Likelihood and Bayesian Inference. The mitogenomes exhibited conserved gene arrangements but variable control region lengths (338–1,266 bp) and high AT content (94.14–96.42% in control regions). Comparative analyses revealed significant intraspecific genetic distances (5.3–13.8% across 13 protein-coding genes), challenging COI-based barcoding for species delimitation. Phylogenetic reconstructions resolved Microtendipes as a distinct clade, refuting its inclusion in the Polypedilum complex. Notably, larval morphology-based species groupings conflicted with molecular data, suggesting cryptic diversity. Our results support Microtendipes as a potential independent tribe within Chironominae, highlighting mitogenomes’ utility in resolving taxonomic uncertainties. This study advances the evolutionary understanding of Chironomidae and underscores the limitations of single-gene barcodes in species-rich genera.
Keywords:
Mitogenome
; Chironomidae
; Phylogeny
; Microtendipes
1. Introduction
Insect mitochondrial genomes are typically circular molecules ranging in size from 14 to 20 kilobases (kb), encoding a conserved arrangement of 13 protein-coding genes (PCGs), 22 transfer RNAs (tRNAs), and two ribosomal RNAs (rRNAs) in a characteristic order and orientation across most insect orders [1]. These genomes have proven instrumental in diverse fields, including species identification [2,3,4] and population genetics [5,6]. This is due to their advantages, which stem from maternal inheritance, rapid substitution rates, and ease of accessibility [7]. Moreover, investigating mitochondrial genome characteristics, such as nucleotide composition, codon usage, evolutionary rates, and secondary structures of RNA genes, has significantly contributed to a deeper understanding of the evolutionary trajectories of diverse organismal groups [8,9,10,11,12,13]. Within the insect family Chironomidae, mitogenomes have been extensively utilized in studies aimed at elucidating phylogenetic relationships within the family and exploring its evolutionary history [14,15,16,17].
Chironomidae, normally known as non-biting midges, exhibit the greatest diversity of species that have evolved to thrive under extreme abiotic environments. These include species capable of enduring a wide range of temperatures, from extremely low temperatures to extremely high temperatures, as well as those resilient to oxygen scarcity, high levels of salinity, both acidic and alkaline conditions (low and high pH), and even complete desiccation [18,19]. Their remarkable adaptability allows them to inhabit an extensive range of habitats, spanning from the frigid, glacier-covered peaks of the tallest mountains to the depths of freshwater bodies, demonstrating their remarkable versatility and resilience in diverse environments [20,21].
Microtendipes Kieffer, 1915, a genus of the tribe Chironomini in the subfamily Chironominae, exhibits a cosmopolitan distribution across all zoogeographical regions [22]. Its immature stages are predominantly found within littoral and sublittoral sediments of vast aquatic habitats, with a limited number of species also inhabiting flowing water environments. The extensive variability in body colors, encompassing thoracic, leg, and wing pigmentation, poses challenges in defining species solely based on color pattern changes [23]. DNA barcode data are pivotal in supporting the interpretation of pigmentation variations as interspecific differences [24].
Previous studies have employed morphological analysis and molecular markers to investigate species delimitation and phylogeny within Microtendipes [22,23,24], yet certain questions remain unaddressed. Firstly, a complex scenario arises when samples displaying identical color patterns form distinct clades on the evolutionary tree based on COI (cytochrome oxidase subunit I) gene sequences, accompanied by significant genetic distances, rendering species delimitation uncertain. There is debate regarding the appropriateness of classifying deeply divergent specimens, forming paraphyletic groups in COI-based phylogenetic trees, as the same species, as suggested by Song et al. (2024) [24]. This underscores the need for unexplored avenues such as the application of mitogenomes to elucidate phylogenetic relationships. Prior to this investigation, only a single Microtendipes species had been documented with a mitogenome [25], and no comparative analysis of nucleotide composition or evolutionary rates within the genus had been conducted. Secondly, the phylogenetic position of Microtendipes has long been a subject of controversy. Sæther (1977) constructed a phylogenetic tree based on female chironomid characteristics, placing this genus within Chironomini [26]. In the phylogenetic tree, Microtendipes formed a monophyletic group with Paratendipes Kieffer /Nilothauma Kieffer, leading to the suggestion of establishing these genera as a fourth subfamily-level taxonomic unit. However, when Sasa (1989) documented the chironomid fauna of Japan, he placed Microtendipes within the Polypedilum complex (including Nilothuma and Paratendipes), belonging to the Chironomini [27]. When molecular data were introduced, Cranston et al. (2012) supported the grouping of Microtendipes with several related genera (excluding Paratendipes) into a generic group, which formed a sister relationship with Pseudochironomini [28].
In this study, we have presented eight specimens belonging to five species of Microtendipes, specifically M. bimaculatus, M. baishanzuensis, M. wuyiensis, M. robustus, and M. tuberosus. Following this, we conducted a thorough analysis of their mitogenomic characteristics. By incorporating previously documented mitogenomes into our analysis, we reconstructed the phylogenetic evolution of the Chironominae using a comprehensive dataset comprising 25 mitochondrial genomes. To achieve this, we employed both Maximum Likelihood (ML) and Bayesian Inference (BI) methodologies, enabling us to accurately determine the phylogenetic positioning of Microtendipes within the subfamily.
2. Materials and Methods
2.1. Taxon Sampling and Sequencing
All the samples of Microtendipes individuals were collected from Baishanzu National Reserve and Wuyi Mountain National Reserve in the year of 2021 and 2022 except Microtendipes bimaculatus-Clade1 (MZ981734) retrieved from our previous study [25]. Targeted specimens were dissected and mounted into Euparal except the tissues for total genomic DNA extraction (thorax, head and a pair of legs). The extraction procedure followed the Qiagen DNeasy Blood and Tissue kit except for elusion buffer ranging from 100-150 µl according to different body size. The exoskeletons of thorax were cleared and mounted on corresponding voucher. A segment of cox1-5P for each species was amplified with primer pair LCO1490-L and HCO2198-L [29] and sequenced with Sanger sequencing as described by Song et al. (2018) [30], and further confirmed the identification. The genomic DNA was subsequently pooled and sequenced using the Illumina Novaseq 6000 (PE150, Ullumina, San Diego, CA) platform. Multi softwares, Mitoz (v3.4) [31], NOVOPlasty (v4.3.1) [32] and SPAdes (v4.0.0) [33], were employed to assemble the reads, and the results of three assemblers were used to revise each other to obtain accurate mito genomes. The mito genomes were annotated using MITOS2 (v2.1.7) [34] and then visualized using java package CGView (v2.0.3) [35].
2.2. Genome Composition and Codon Usage
2.3. Substitution Rate and Phylogenetic Analyses
The mitochondrial genomes of species listed in Table 1, including the eight newly sequenced mitogenomes reported in this study, were selected for phylogenetic reconstruction. Rheocricotopus villiculus (MW373526) was designated as the outgroup. The thirteen protein-coding genes (PCGs) were aligned using MAFFT (version 7.505) [39], with all stop codons retained and indels removed during the process. Subsequent to alignment, all sequences were manually reviewed, corrected, and concatenated for further analyses. Pairwise genetic distances among the 13 PCGs were computed using MEGA11 [40]. Statistical comparisons of genetic distances were conducted using the Friedman test in R, with multiple pairwise comparisons performed using the Wilcoxon rank-sum test, and p-values adjusted using the Benjamini-Hochberg (BH) method to control for false discovery rate. The resulting boxplot was generated using the R package ggplot2.
A total of four datasets were concatenated for phylogenetic analyses, namely: (i) a PCG matrix comprising all thirteen protein-coding genes (PCGs) totaling 11,094 base pairs (bp), (ii) a PCGrRNA matrix incorporating the thirteen PCGs and the two ribosomal RNA (rRNA) genes, amounting to 12,643 bp, (iii) a PCG12 matrix containing the first and second codon positions of the thirteen PCGs, and (iv) a PCG12rRNA matrix (7,396 bp) that includes PCG12 and the two rRNA genes, totaling 8,945 bp. All matrices underwent analysis using maximum likelihood (ML) with RAxML (version 8.2.12) [41] and Bayesian inference (BI) with MrBayes (version 3.2.7a) [42]. PartitionFinder2 (version 2.1.1) [43] was employed to identify the optimal partitioning schemes and substitution models. Both ML and BI analyses were performed on both partitioned and non-partitioned data to construct the phylogenetic trees. For the ML analysis, the "GTRGAMMA" nucleotide substitution model was selected, and a bootstrap analysis with 1000 replicates was conducted. In the BI analysis, four simultaneous Markov chain Monte Carlo (MCMC) runs of 100 million generations each were executed, with trees sampled every 2000 generations. The first 25% of the steps were discarded as burn-in. Stationarity was deemed achieved when the average standard deviation of split frequencies dropped below 0.01. The resulting trees from all analyses were visualized and edited using iTOL (https://itol.embl.de) [44].
3. Results
3.1. Genome Organization
The complete mitochondrial genomes of Microtendipes species have been successfully sequenced. These genomes consist of double-stranded circular molecules, with sizes ranging from 15,756 bp (PP966950) to 16,340 bp (PP966952). Each genome encodes a total of 37 genes, comprising 13 protein-coding genes (PCGs), 2 ribosomal RNA (rRNA) genes, and 22 transfer RNA (tRNA) genes, as detailed in Table 1. The primary source of length variation among these genomes is the control region, which exhibits a size range from 338 bp (PP966951) to 1,266 bp (PP966952). Regarding the coding sequences, minimal variation is observed in the lengths of the PCGs, tRNAs, and rRNAs. Specifically, the PCGs span from 11,106 bp (PP966952) to 11,154 bp (PP966949), the tRNAs range from 1,575 bp (PP966952) to 1,595 bp (PP966949), and the rRNAs vary between 1,488 bp (PP966950) and 1,508 bp (PP966949). Notably, these 37 genes maintain a consistent order across all nine genomes examined. Furthermore, 23 of these genes (including 9 PCGs and 14 tRNAs) are encoded by the majority strand (J-strand), while the remaining genes are encoded by the minority strand (N-strand), as illustrated in Figure 1.
3.2. Nucleotide Composition
The nucleotide compositions of the nine mitochondrial genomes exhibit considerable similarity, as outlined in Table 2. The AT content varies between 79.19% in Microtendipes wuyiensis (PP966951) and 80.77% in Microtendipes robustus (PP966954). Notably, the AT content within the control region is significantly elevated compared to the entire genome, with a range from 94.14% in Microtendipes bimaculatus (PP966953) to 96.42% in Microtendipes robustus (PP966950). Similarly, the AT content in both rRNA and tRNA regions surpasses the overall genome level, with rRNA varying between 81.43% and 82.51%, and tRNA ranging from 82.18% to 82.93%. Conversely, the PCG sequences demonstrate a lower AT content, spanning from 76.07% in Microtendipes wuyiensis to 78.09% in Microtendipes robustus (PP966954). All nine mitogenomes exhibit a positive AT-skew, ranging from 1.08% to 2.66%, and a negative GC-skew, varying between -22.26% and -18.04%. In contrast, the tRNA sequences display a negative AT-skew, ranging from -2.43% to -3.76%, and a positive GC-skew, spanning from 27.47% to 31.67%. The rRNA sequences exhibit positive AT-skew and GC-skew values, with ranges of 3.92% to 5.05% and 12.23% to 16.23%, respectively. For the PCG sequences, a notable negative AT-skew is observed, ranging from -17.31% to -19.16%, whereas the GC-skew is relatively insignificant, varying from -1.57% to 2.38%.
3.3. Protein-Coding Genes and Codon Usage
Among the 13 protein-coding genes (PCGs) in the nine mitochondrial genomes, 12 utilize ATG/ATT as their start codons. An exception is the cox1 gene, which employs ATA as the start codon in Microtendipes wuyiensis (PP966951) and TTG in the other eight mitogenomes. The nad1 gene in Microtendipes wuyiensis terminates with a TAG stop codon, whereas all other genes in the remaining mitochondrial genomes utilize TAA as their stop codon. Tables S1 and S2 provide the amino acid compositions and codon usage tables, respectively. Excluding stop codons, the total number of codons ranges from 3,689 to 3,705. Notably, the four M. bimaculatus mitogenomes contain 3,689, 3,689, 3,694, and 3,694 codons. The most frequently utilized codons are Leu (UUA), Phe (UUU), and Ile (AUU), as illustrated in Figure 2. It is worth mentioning that, with the exception of Microtendipes bimaculatus (Clade3), the AGG codon (encoding Ser) is absent in the other mitogenomes. Similarly, the CUG codon (encoding Leu) is absent in all mitogenomes except for Microtendipes robustu and Microtendipes wuyiensis. After excluding termination codons, the relative synonymous codon usage (RSCU) was calculated and summarized for the Microtendipes species, as shown in Figure 3. Additionally, we evaluated a suite of codon usage bias metrics, including the Codon Adaptation Index (CAI), Frequency of Optimal Codons (FOP), Effective Number of Codons (ENC), and GC content at the third codon position (GC3), which are detailed in Tables S3–S7. No significant differences were observed among the Microtendipes species in these metrics.
3.4. Phylogeny of Chironominae
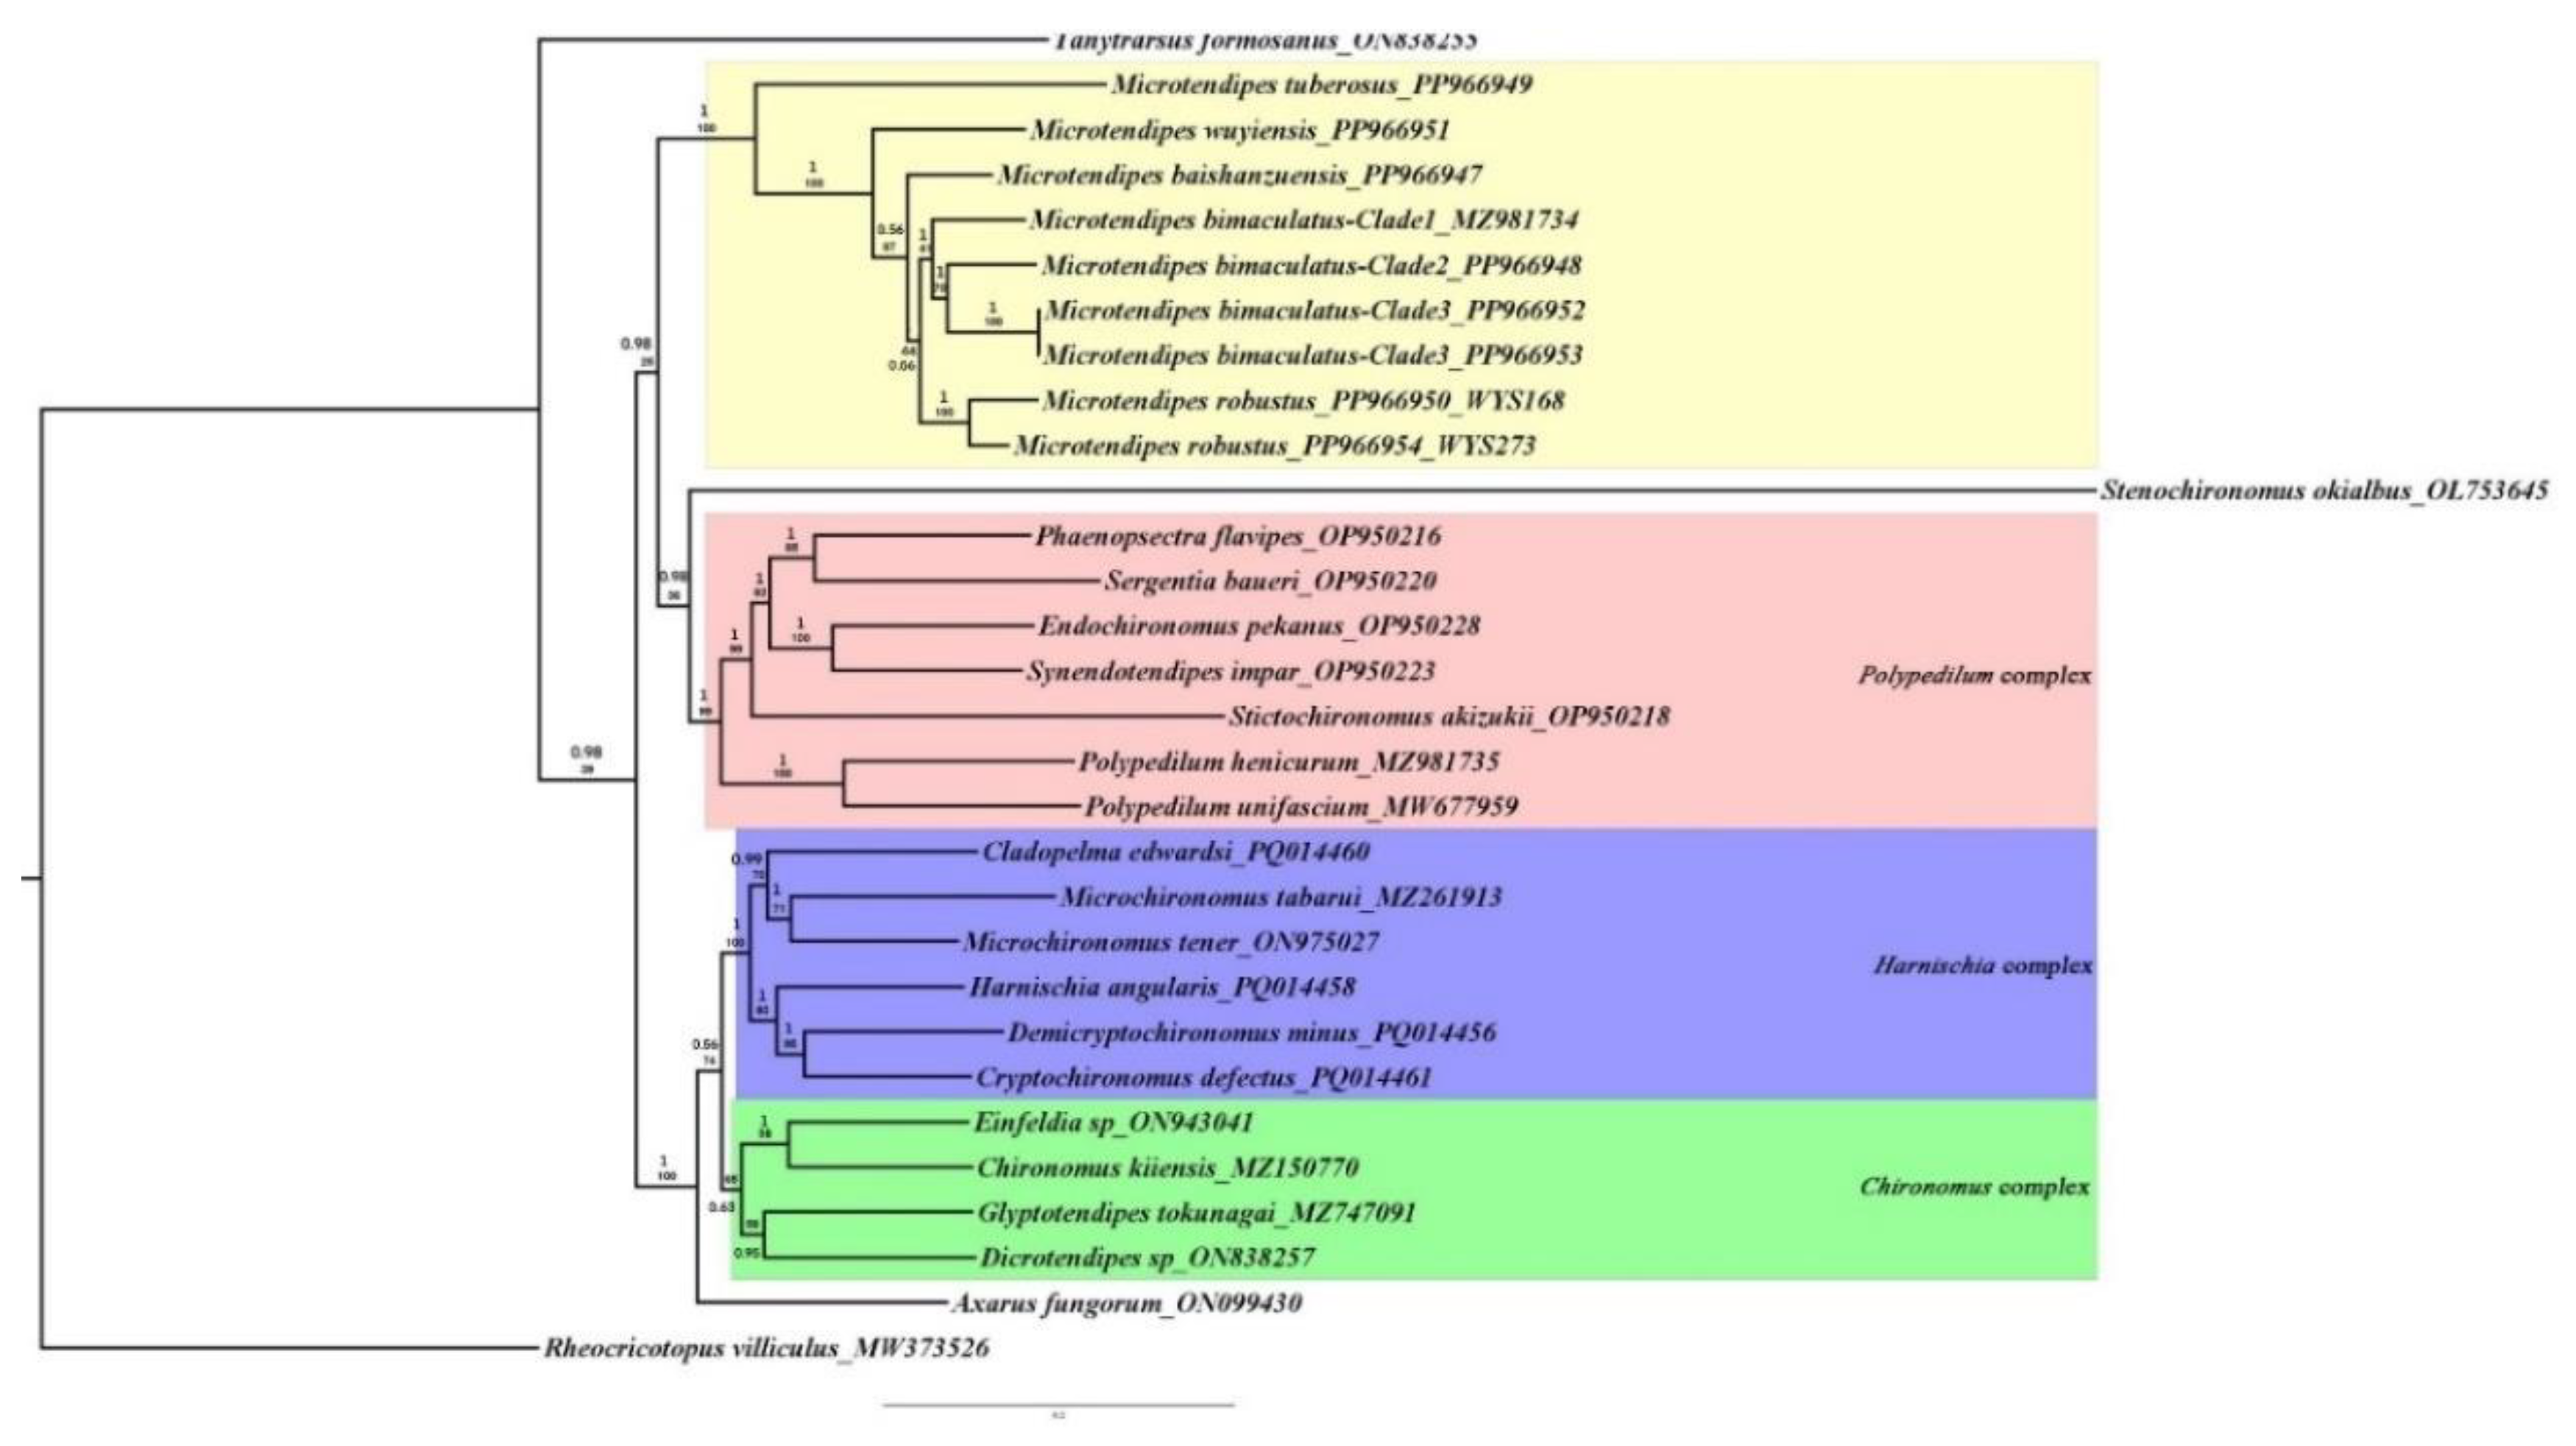
In our analysis, all the generic complexes, such as the Polypedilum complex (excluding Microtendipes), Chironomus complex, and Harnischia complex, formed monophyletic groups (Figure 5 and Supplementary Trees S16-S23). The genus Stenochironomus exhibited instability in our phylogenetic trees, being either sister to other Chironominae species or to species within the Polypedilum complex. Similarly, the phylogenetic position of Microtendipes within Chironominae was unstable. Three primary topologies were constructed: (1) Tanytarsus, (Polypedilum complex, (Microtendipes, (Harnischia complex + Chironomus complex))), (2) Tanytarsus, ((Chironomus complex + Harnischia complex), (Polypedilum complex, Microtendipes)), and (3) Tanytarsus, (Microtendipes, (Polypedilum complex, (Chironomus complex + Harnischia complex))), with the last one resembling that proposed by Sæther (1977).
Figure 4.
Phylogenetic tree of Chironominae species based on Mitogenome sequences. Values- up on branch present bootstrap supports (%) and Values-down are Bayesian posterior probabilities (PP).
Figure 4.
Phylogenetic tree of Chironominae species based on Mitogenome sequences. Values- up on branch present bootstrap supports (%) and Values-down are Bayesian posterior probabilities (PP).
4. Discussion
4.1. 658 bp COI Based Barcode vs Mitogenome-Based Barcode
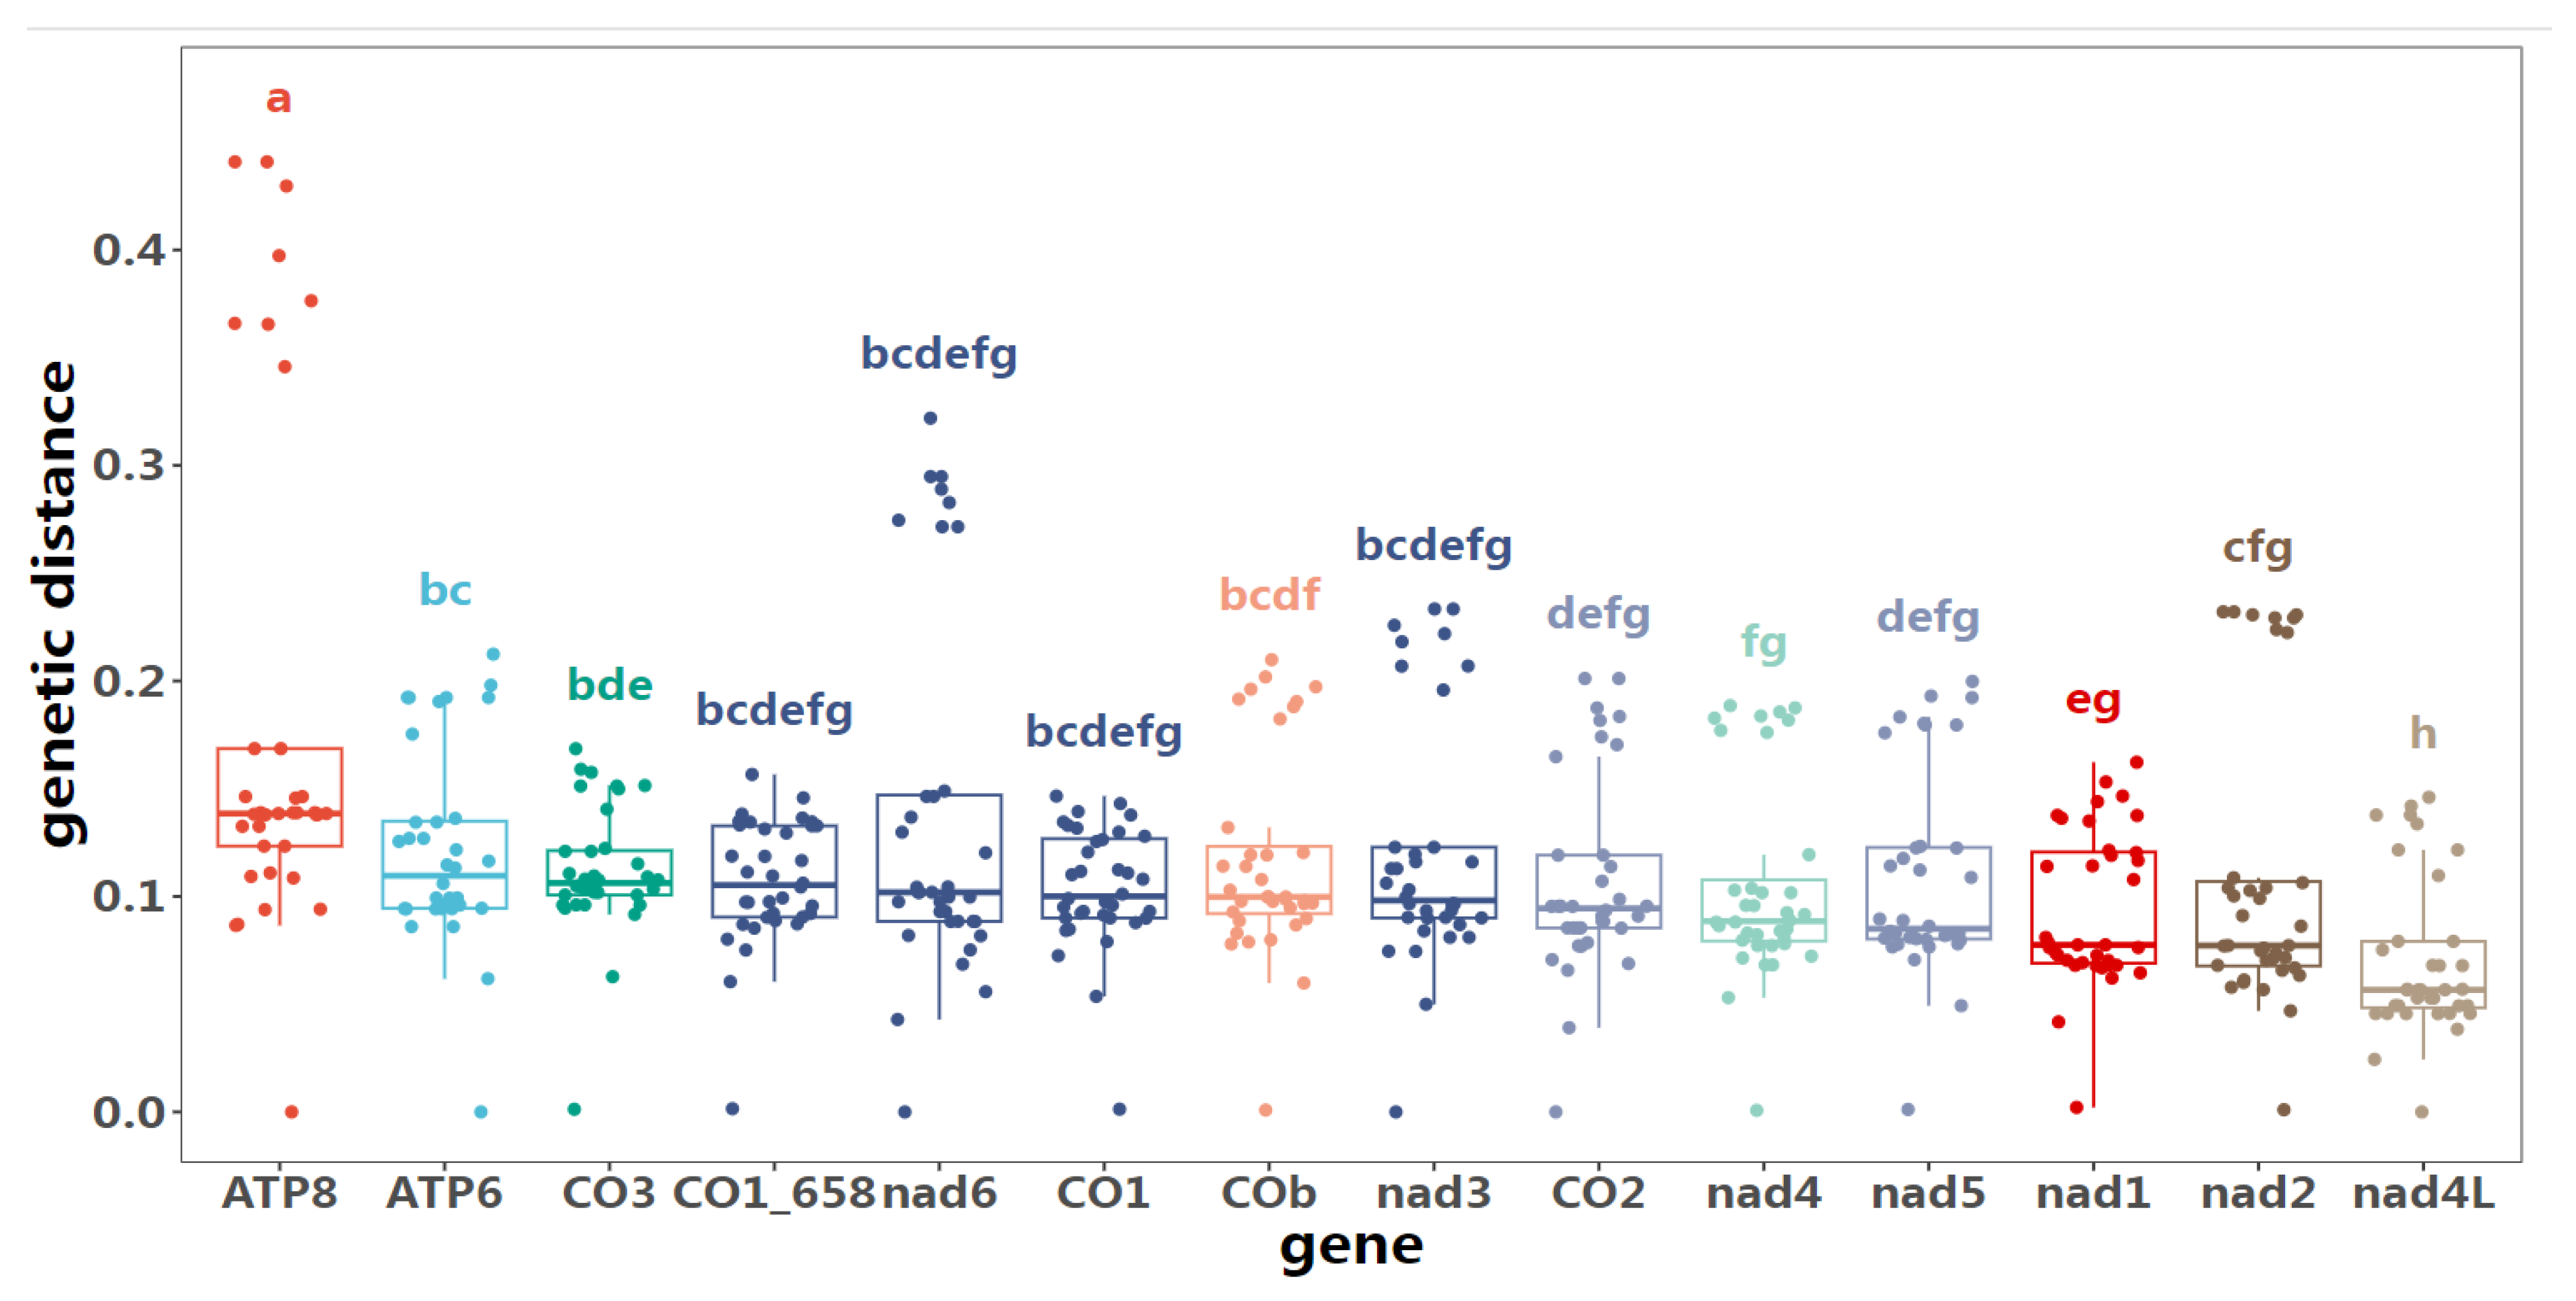
The 658bp COI barcode has been instrumental in advancing our understanding of species diversity by leveraging its high level of sequence variation and ease of amplification. However, as our understanding of species complexity deepens, the limitations of this barcode have become increasingly apparent. One potential problem exposed by DNA barcodes is the excessive division of species especially in some super diverse genus, e.g. Tanytarsus and Polypedilum [30,46]. Whereas in Song et al. (2023) Microtendipes bimaculatus Song et Qi, with deep intraspecific genetic divergence and forming three paraphyletic clades in phylogenic tree [24]. It is difficult to judge whether there are potential cryptic species in this species group based on the overall situation at that time. While in this study, four specimens mitogenomes from the three clades were used, for Microtendipes bimaculatus-clade 1 (MZ981734); Microtendipes bimaculatus-clade 2 (PP966948); Microtendipes bimaculatus-clade 3 (PP966952 and PP966953), with the genetic distance up to 10.6%. We try to compare the genetic difference between different protein coding genes. The genetic distances were reassessed individually based on 13 protein-coding genes (PCGs), as detailed in Supp. table S8 to S21. The intraspecific distances varied considerably, spanning from 5.3% for NAD4L, 7.0% for NAD1, 7.2% for NAD2, 8.8% for NAD4, 8.2% for NAD5, 9.0% for NAD3, 9.3% for COI, 9.5% for COII, 9.6% for ATP6, 10.0% for COB, 10.0% for NAD6, 10.1% for COIII, to 13.8% for ATP8. Judging from distance-threshold methods, such as insect species proposes a threshold of 2–3%; however, genus-specific thresholds have been suggested for some Chironomidae including 4–5% for Tanytarsus [46] and 5–8% for Polypedilum [30]. Such single gene-based barcodes might mislead when closely related species deep intraspecific splits [46,47]. We also constructed phylogenetic trees to infer the relationships among Microtendipes species separately, using each coding gene, the concatenated 13-protein coding mitogenome genes, and all mitogenome sequences to infer their phylogeny (Supplementary Trees S1-S15). Only the trees based on nad3 and nad4 supported the monophyly of Microtendipes bimaculatus, albeit with low bootstrap values. Therefore, they should be considered part of the Microtendipes bimaculatus species complex, as defined by Song et al. (2023), or sibling species that are difficult to distinguish morphologically [24]. The other divergent species, Microtendipes robustus (PP966950 versus PP966954), formed robust relationships. Further analysis of the variance among different genes was conducted (Figure 4). The pairwise genetic distances of 13 PCGs across nine specimens were computed. For the majority of PCGs, the genetic distances remained statistically indistinguishable. However, two notable exceptions were observed: the genetic distance of ATP8 was significantly higher compared to that of all other PCGs, whereas the genetic distance of nad4l was markedly lower than that of its counterparts.
While the 658bp COI barcode has served as a valuable foundation for species identification and biodiversity research, the mitogenome-based barcode offers a promising alternative that may prove to be more suitable for certain applications. The mitogenome-based barcode’s primary advantage lies in its ability to harness the vast genetic information contained within the mitochondrial genome. This allows for a more nuanced and accurate assessment of species relationships. Furthermore, the mitogenome-based barcode’s comprehensive nature enables researchers to delve deeper into the evolutionary history and population dynamics of species, providing insights that can inform conservation efforts and management strategies.
Figure 4.
The genetic distance of PCGs between 9 specimens. CO1_658 represents the 658 bp COI barcode.
Figure 4.
The genetic distance of PCGs between 9 specimens. CO1_658 represents the 658 bp COI barcode.
4.2. Phylogenetic Position of Microtendipes
In our analysis, all the generic complexes, such as the Polypedilum complex (excluding Microtendipes), Chironomus complex, and Harnischia complex, formed monophyletic groups (Figure 5 and Supplementary Trees S16-S23). The genus Stenochironomus exhibited instability in our phylogenetic trees, being either sister to other Chironominae species or to species within the Polypedilum complex. Similarly, the phylogenetic position of Microtendipes within Chironominae was unstable. Three primary topologies were constructed: (1) Tanytarsus, (Polypedilum complex, (Microtendipes, (Harnischia complex + Chironomus complex))), (2) Tanytarsus, ((Chironomus complex + Harnischia complex), (Polypedilum complex, Microtendipes)), and (3) Tanytarsus, (Microtendipes, (Polypedilum complex, (Chironomus complex + Harnischia complex))), with the last one resembling that proposed by Sæther (1977) [26]. This similarity suggests that Microtendipes and its related taxa may constitute a generic complex or potentially represent the fourth tribe within this subfamily. Dataset (iii) proposed a relationship of (Chironomus complex (Polypedilum complex (Tanytarsus, Microtendipes))), which does not align ideally with current taxonomy. Specifically, the positioning of Tanytarsus within the Chironomini tribe is incongruent, whereas the similar relationship between Microtendipes and Tanytarsus echoes observations made by Cranston et al. (2012) [28]. Importantly, most results do not support the inclusion of Microtendipes within the Polypedilum complex, thereby refuting the categorization proposed by Sasa (1989) [27]. Given the absence of mitochondrial genome data for Pseudochironomini, we are currently unable to conclusively determine the genus’s taxonomic status. Nonetheless, we are committed to expanding our study by incorporating additional taxa from Tanytarsini and Pseudochironomini, aiming to unravel the precise phylogenetic positioning of Microtendipes with greater accuracy.
4.3. Phylogeny Within Microtendipes
The phylogenetic relationships within the genus Microtendipes have persisted as an enigmatic puzzle, particularly concerning the subdivision into species groups. Two distinct species groups, the pedellus group and the rydalensis group, were established based on larval stages, utilizing two pivotal characters: the number of premandibular teeth and the shape of a median tooth on the mentum [48]. According to this diagnostic criterion, M. baishanzuensis is classified within the rydalensis group, whereas Microtendipes tuberosus and Microtendipes robustus are assigned to the pedellus group (unpublished data). However, it is evident that this classification system does not align seamlessly with the phylogenetic tree, as Microtendipes tuberosus occupies a basal position within the genus’s clade, while other species occupy distinct and separate clades (Figure 5). This discrepancy underscores the need for further investigation to clarify the evolutionary relationships and taxonomic structure within the genus Microtendipes.
5. Conclusions
All eight newly sequenced mitogenomes in this study demonstrated a striking congruity in their structural features and nucleotide compositions when juxtaposed against previously published Chironomidae data. The mitogenome-based species delimitation within the genus Microtendipes offers a more precise and nuanced perspective than COI-based barcoding, particularly those that involve substantial intraspecific genetic distances. The comparative analysis of Microtendipes (Diptera: Chironomidae) mitogenomes has yielded invaluable insights into their phylogenetic relationships, which do not support two species group division based on larvae. This analysis also has definitively refuted the placement of Microtendipes within the Polypedilum complex, instead tentatively establishing it as a distinct species group and tribe, thereby advancing our understanding of this intriguing taxonomic entity.
Supplementary Materials
The following supporting information can be downloaded at the website of this paper posted on Preprints.org, Table S1 Amino acids composition of Microtendipes; Table S2 codon usage of Microtendipes; Table S3 codon adaptation index of Microtendipes; Table S4 frequency of optical codons of Microtendipes; Table S5 effective number of codon of Microtendipes; Table S6 base composition by position of Microtendipes; Table S7 relative synonymous codon usage of Microtendipes; Table S8 Genetic divergences based on ATP6; Table S9 Genetic divergences based on ATP8; Table S10 Genetic divergences based on Cob; Table S11 Genetic divergences based on CO1; Table S12 Genetic divergences based on CO1-658; Table S13 Genetic divergences based on COII; Table S14 Genetic divergences based on CO3; Table S15 Genetic divergences based on nad1; Table S16 Genetic divergences based on nad2; Table S17 Genetic divergences based on nad3; Table S18 Genetic divergences based on nad4; Table S19 Genetic divergences based on na4L; Table S20 Genetic divergences based on nad5; Table S21 Genetic divergences based on nad6; Tree S1 ML tree based on ATP6; Tree S2 ML tree based on ATP8; Tree S3 ML tree based on COi; Tree S4 ML tree based on COii; Tree S5 ML tree based on CO3; Tree S6 ML tree based on COb; Tree S7 ML tree based on nad1; Tree S8 ML tree based on nad2; Tree S9 ML tree based on nad3; Tree S10 ML tree based on nad4; Tree S11 ML tree based on nad4L; Tree S12 ML tree based on nad5; Tree S13 ML tree based on nad6; Tree S14 BI tree based on protein coding genes; Tree S15 BI tree based on mitogenome genes; Tree S16 ML tree based protein coding genes without partition; Tree S17 ML tree based protein coding genes codon 1st and Condon 2nd without partition; Tree S18 ML tree-based protein coding genes codon 1st and Condon 2nd and rDNA without partition; Tree S19 ML tree based protein coding genes and rDNA without partition; Tree S20 ML tree based protein coding genes with partition; Tree S21 ML tree based protein coding genes codon 1st and Condon 2nd with partition; Tree S22 ML tree based protein coding genes codon 1st and Condon 2nd and rDNA with partition; Tree S23 ML tree based protein coding genes and rDNA with partition.
Author Contributions
Performed the experimental procedures and data collection: Wenji Wang, Yiyi Wang, Teng Lei, and Chao Song. Conceived and designed the research project: Luxian Li and Xin Qi. Analyzed the data and wrote the manuscript: Chao Song, Luxian Li, and Xin Qi. All authors have read and approved the final manuscript for publication.
Funding
This research was funded by the National Natural Science Foundation of China (NSFC, Grant No. 32100353, 32070481) and the Zhejiang Provincial Natural Science Foundation of China (Grant No. LY22C040003).
Institutional Review Board Statement
Not applicable.
Data Availability Statement
Data supporting this study are available in the article and accompanying online supplementary material, and in NCBI GenBank (https://www.ncbi.nlm.nih.gov/) under the following accession numbers (PP966947-PP966954).
Conflicts of Interest
The authors declare no conflicts of interest.
References
- Cameron, S.L. Insect Mitochondrial Genomics: Implications for Evolution and Phylogeny. Annu. Rev. Entomol. 2014, 59, 95–117. [Google Scholar] [CrossRef] [PubMed]
- Chen, L.P.; Zheng, F.Y.; Bai, J.; Wang, J.M.; Li, X.J. Comparative analysis of mitogenomes among six species of grasshoppers (Orthoptera: Acridoidea: Catantopidae) and their phylogenetic implications in wing-type evolution. Int. J. Biol. Macromol. 2020, 159, 1062–1072. [Google Scholar] [CrossRef] [PubMed]
- Jiang, J.; Chen, X.; Li, C.; Song, Y.H. Mitogenome and phylogenetic analysis of typhlocybine leafhoppers (Hemiptera: Cicadellidae). Sci. Rep. 2021, 11, 10053. [Google Scholar] [CrossRef] [PubMed]
- Zheng, C.; Zhu, X.; Wang, Y.; Dong, X.; Yang, R.; Tang, Z.; Bu, W. Mitogenomes Provide Insights into the Species Boundaries and Phylogenetic Relationships among Three Dolycoris Sloe Bugs (Hemiptera: Pentatomidae) from China. Insects. 2024, 15, 134. [Google Scholar] [CrossRef]
- Mohamed, W.M.A.; Moustafa, M.A.M.; Thu, M.J.; et al. Comparative mitogenomics elucidates the population genetic structure of Amblyomma testudinarium in Japan and a closely related Amblyomma species in Myanmar. Evol. appl. 2022, 15, 1062–1078. [Google Scholar] [CrossRef]
- Yamamoto, K.; Sakaue, S.; Matsuda, K.; et al. Genetic and phenotypic landscape of the mitochondrial genome in the Japanese population. Commun. Biol. 2020, 3, 104. [Google Scholar] [CrossRef]
- Boore, J.L. Animal mitochondrial genomes. Nucleic. Acids. Res. 1999, 27, 1767–1780. [Google Scholar] [CrossRef]
- Finstermeier, K.; Zinner, D.; Brameier, M.; et al. A mitogenomic phylogeny of living primates. PloS. one. 2013, 8, e69504. [Google Scholar] [CrossRef]
- Ma, Q.; Li, F.; Zheng, J.; Liu, C.; Wang, A.; Yang, Y.; Gu, Z. Mitogenomic phylogeny of Cypraeidae (Gastropoda: Mesogastropoda). Front Ecol Evol. 2023, 11, 1138297. [Google Scholar] [CrossRef]
- Irwin, A.R.; Strong, E.E.; Kano, Y.; Harper, E.M.; Williams, S.T. Eight new mitogenomes clarify the phylogenetic relationships of Stromboidea within the caenogastropod phylogenetic framework. Mol. Phylogenet. Evol. 2021, 158, 107081. [Google Scholar] [CrossRef]
- Phillips, M.J.; Zakaria, S.S. Enhancing mitogenomic phylogeny and resolving the relationships of extinct megafaunal placental mammals. Mol. Phylogenet. Evol. 2021, 158, 107082. [Google Scholar] [CrossRef] [PubMed]
- Poliseno, A.; Feregrino, C.; Sartoretto, S.; Aurelle, D.; Wörheide, G.; McFadden, CS.; Vargas, S. Comparative mitogenomics, phylogeny and evolutionary history of Leptogorgia (Gorgoniidae). Mol. Phylogenet. Evol. 2017, 115, 181–189. [Google Scholar] [CrossRef] [PubMed]
- Timmermans, M.J.T.N.; Lees, D.C.; Simonsen, T.J. Towards a mitogenomic phylogeny of Lepidoptera. Mol. Phylogenet. Evol. 2014, 79, 169–178. [Google Scholar] [CrossRef] [PubMed]
- Fang, X.; Wang, X.; Mao, B.; et al. Comparative mitogenome analyses of twelve non-biting flies and provide insights into the phylogeny of Chironomidae (Diptera: Culicomorpha). Sci. Rep. 2023, 13, 9200. [Google Scholar] [CrossRef]
- Li, S.Y.; Chen, M.H.; Sun, L.; Wang, R.H.; Li, C.H.; Gresens, S.; Li, Z.; Lin, X.L. New mitogenomes from the genus Cricotopus (Diptera: Chironomidae, Orthocladiinae): Characterization and phylogenetic implications. Arch Insect Biochem Physiol. 2024, 115, e22067. [Google Scholar] [CrossRef]
- Lin, X.L.; Liu, Z.; Yan, L.P.; Duan, X.; Bu, W.J.; Wang, X.H.; Zheng, C.G. Mitogenomes provide new insights of evolutionary history of Boreheptagyiini and Diamesini (Diptera: Chironomidae: Diamesinae). Ecol Evol. 2022, 12, e8957. [Google Scholar] [CrossRef]
- Zhang, D.; He, F.X.; Li, X.B.; Aishan, Z.; Lin, X.L. New mitogenomes of the Polypedilum generic complex (Diptera: Chironomidae): characterization and phylogenetic implications. Insects. 2023, 14, 238. [Google Scholar] [CrossRef]
- Kawai, K.; Kawaguchi, K.; Kodama, A.; Saito, H. Fundamental studies on acid-tolerant chironomids in Japan. Limnology. 2019, 20, 101–107. [Google Scholar] [CrossRef]
- Pinder, L.C.V. Biology of freshwater Chironomidae. Annu Rev Entomol. 1986, 31, 1–23. [Google Scholar] [CrossRef]
- Martel-Cea, A.; Astorga, G.A.; Hernández, M.; Caputo, L.; Abarzúa, A.M. Modern chironomids (Diptera: Chironomidae) and the environmental variables that influence their distribution in the Araucanian lakes, south-central Chile. Hydrobiologia. 2021, 848, 2551–2568. [Google Scholar] [CrossRef]
- Kozeretska, I.; Serga, S.; Kovalenko, P.; Gorobchyshyn, V.; Convey, P. Belgica antarctica (Diptera: Chironomidae): A natural model organism for extreme environments. Insect Science. 2022, 29, 2–20. [Google Scholar] [CrossRef] [PubMed]
- Qi, X.; Wang, X.H. A review of Microtendipes Kieffer from China (Diptera: Chironomidae). Zootaxa. 2006, 1108, 37–51. [Google Scholar] [CrossRef]
- Tang, H.; Niitsuma, H. Review of the Japanese Microtendipes (Diptera: Chironomidae: Chironominae), with description of a new species. Zootaxa. 2017, 4320, 535–553. [Google Scholar] [CrossRef]
- Song, C.; Wang, L.; Lei, T.; Qi, X. New color-patterned species of Microtendipes Kieffer, 1913 (Diptera: Chironomidae) and a deep intraspecific divergence of species by DNA barcodes. Insects 2023, 14, 227. [Google Scholar] [CrossRef]
- Cao, J.K.; Lei, T.; Gu, J.J.; Song, C.; Qi, X. Codon bias analysis of the mitochondrial genome reveals natural selection in the nonbiting midge Microtendipes umbrosus Freeman, 1955 (Diptera: Chironomidae). The Pan-Pacific Entomologist 2023, 99, 217–225. [Google Scholar] [CrossRef]
- Sæther, O.A. Female genitalia in Chironomidae and other Nematocera: morphology, phylogenies, keys. Bull Fish Res Board Can. 1977, 197, 1–209. [Google Scholar]
- Sasa, M. Chironomidae of Japan: Checklist of species recorded, key to males and taxonomic notes. NIES Res Rep. 1989, 125, 1–177. [Google Scholar]
- Cranston, P.S.; Hardy, N.B.; Morse, G.E. A dated molecular phylogeny for the Chironomidae (Diptera). Syst Entomol. 2012, 37, 172–188. [Google Scholar] [CrossRef]
- Folmer, O.; Black, M.; Hoeh, W.; Lutz, R.; Vrijenhoek, R. DNA primers for amplification of mitochondrial oxidase subunit I from diverse metazoan invertebrates. Mol Mar Biol Biotechnol. 1994, 3, 294–299. [Google Scholar]
- Song, C.; Lin, X.L.; Wang, Q.; Wang, XH. DNA barcodes successfully delimit morphospecies in a superdiverse insect genus. Zool Scr. 2018, 47, 311–324. [Google Scholar] [CrossRef]
- Meng, G.; Li, Y.; Yang, C.; Liu, S. MitoZ: a toolkit for animal mitochondrial genome assembly, annotation and visualization. Nucleic Acids Res. 2019, 47, e63. [Google Scholar] [CrossRef] [PubMed]
- Dierckxsens, N.; Mardulyn, P.; Smits, G. NOVOPlasty: De novo assembly of organelle genomes from whole genome data. Nucleic Acids Res. 2017, 45, e18. [Google Scholar] [PubMed]
- Prjibelski, A.; Antipov, D.; Meleshko, D.; Lapidus, A.; Korobeynikov, A. Using SPAdes de novo assembler. Current Protocols in Bioinformatics. 2020, 70, e102. [Google Scholar] [CrossRef] [PubMed]
- Stothard, P.; Wishart, D.S. Circular genome visualization and exploration using CGView. Bioinformatics. 2005, 21, 537–539. [Google Scholar] [CrossRef]
- Donath, A.; Jühling, F.; Al-Arab, M.; Bernhart, S.H.; Reinhardt, F.; Stadler, P.F.; Middendorf, M.; Bernt, M. Improved annotation of protein-coding genes boundaries in metazoan mitochondrial genomes. Nucleic Acids Res. 2019, 47, 10543–10552. [Google Scholar] [CrossRef]
- Shen, W.; Sipos, B.; Zhao, L. SeqKit2: A Swiss army knife for sequence and alignment processing. iMeta. 2024, 5, e191. [Google Scholar] [CrossRef]
- Rice, P.; Longden, I.; Bleasby, A. EMBOSS: the European molecular biology open software suite. Trends in genetics. 2000, 16, 276–277. [Google Scholar] [CrossRef]
- Wickham, H.; Chang, W.; Wickham, M.H. Package ‘ggplot2’. Create elegant data visualisations using the grammar of graphics. Version. 2016, 2, 1–189. [Google Scholar]
- Katoh, K.; Standley, D.M. MAFFT multiple sequence alignment software version 7: improvements in performance and usability. Molecular biology and evolution. 2013, 30, 772–780. [Google Scholar] [CrossRef]
- Tamura, K.; Stecher, G.; Kumar, S. MEGA11: Molecular evolutionary genetics analysis version 11. Mol Biol Evol. 2021, 38, 3022–3027. [Google Scholar] [CrossRef]
- Stamatakis, A. RAxML version 8: a tool for phylogenetic analysis and post-analysis of large phylogenies. Bioinformatics. 2014, 30, 1312–1313. [Google Scholar] [CrossRef] [PubMed]
- Ronquist, F.; Teslenko, M.; Van der Mark, P.; Ayres, D.L.; Darling, A.; Höhna, S.; Larget, B.; Liu, L.; Suchard, M.A.; Huelsenbeck, J.P. MRBAYES 3.2: Efficient Bayesian phylogenetic inference and model selection across a large model space. Syst. Biol. 2012, 61, 539–542. [Google Scholar] [CrossRef] [PubMed]
- Lanfear, R.; Frandsen, P.B.; Wright, A.M.; Senfeld, T.; Calcott, B. PartitionFinder 2: new methods for selecting partitioned models of evolution for molecular and morphological phylogenetic analyses. Mol Biol Evol. 2017, 34, 772–773. [Google Scholar] [CrossRef] [PubMed]
- Letunic, I.; Bork, P. Interactive Tree of Life (iTOL) v5: an online tool for phylogenetic tree display and annotation. Nucleic Acids Res. 2021, 49, W293–296. [Google Scholar] [CrossRef]
- Lin, X.L.; Stur, E.; Ekrem, T. Exploring genetic divergence in a species-rich insect genus using 2790 DNA barcodes. PLoS. One. 2015, 10, e0138993. [Google Scholar] [CrossRef]
- Meier, R.; Shiyang, K.; Vaidya, G.; Ng, P.K.L. DNA barcoding and taxonomy in diptera: A tale of high intraspecific variability and low identification success. Syst Biol. 2006, 55, 715–728. [Google Scholar]
- Yeo, D.; Puniamoorthy, J.; Ngiam, R.W.; Meier, R. Towards holomorphology in entomology: rapid and cost-effective adult–larva matching using NGS barcodes. Syst. entomol. 2018, 43, 678–691. [Google Scholar] [CrossRef]
- Epler, J.H.; Ekrem, T.; Cranston, P.S. 10. The larvae of Holarctic Chironominae (Diptera: Chironomidae)–Keys and diagnoses. Chironomidae of the Holarctic Region. Keys and diagnoses. Part 1 2013, 387–556. [Google Scholar]
Figure 1.
The mitogenome map depicted the distinctive mitochondrial genome attributes of various representative species of Microtendipes.
Figure 1.
The mitogenome map depicted the distinctive mitochondrial genome attributes of various representative species of Microtendipes.
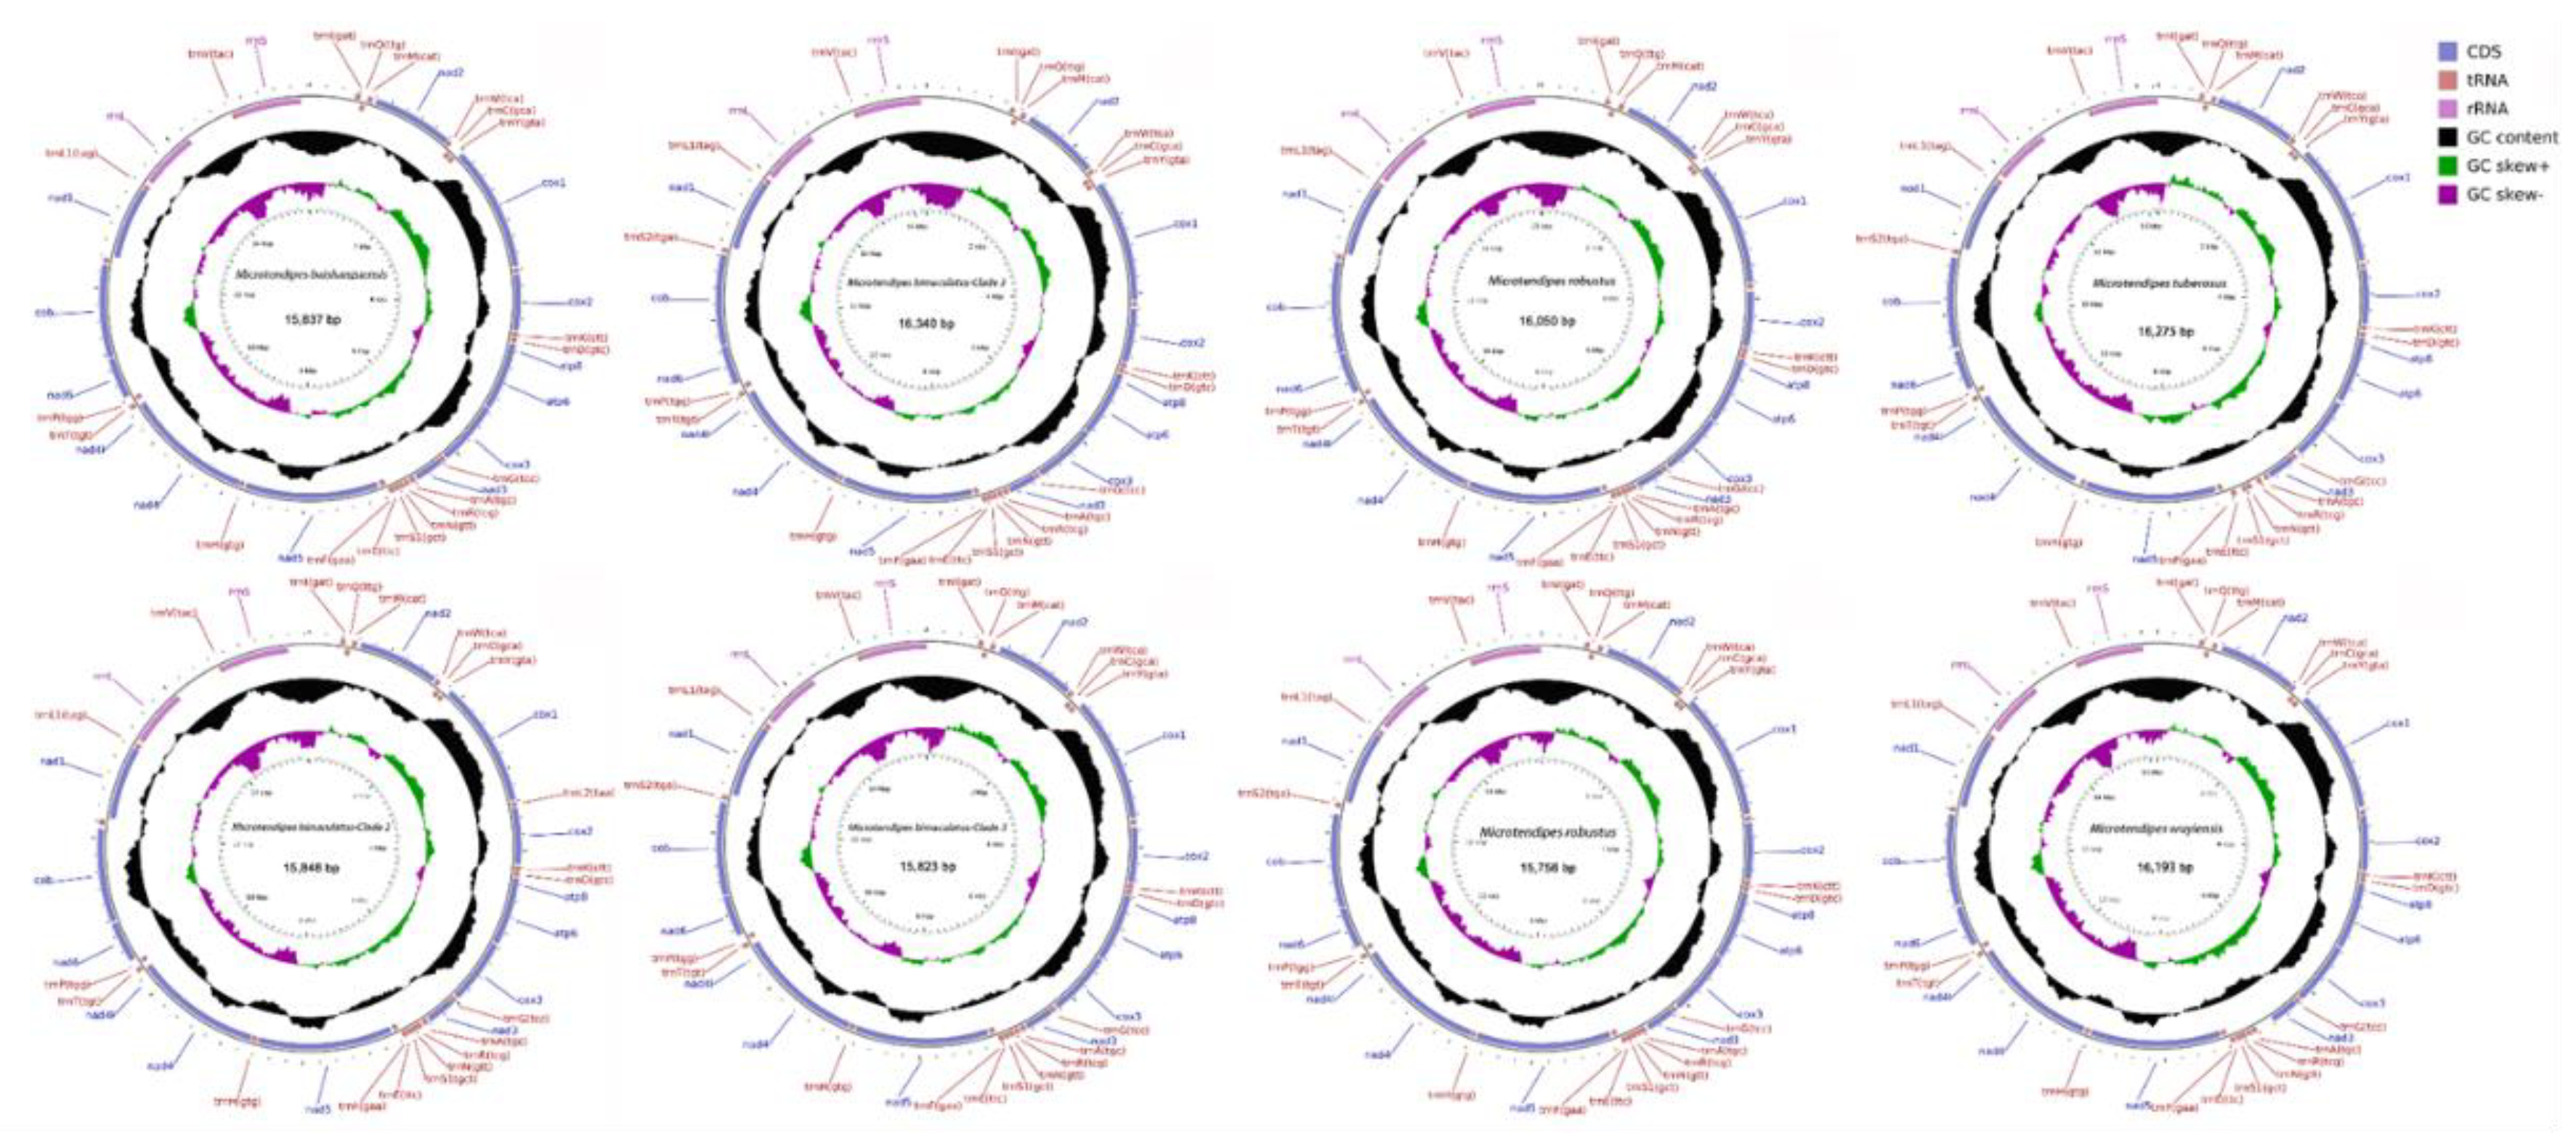
Figure 2.
Amino acid frequency of PCGs in mitochondrial genomes of Microtendipes species.
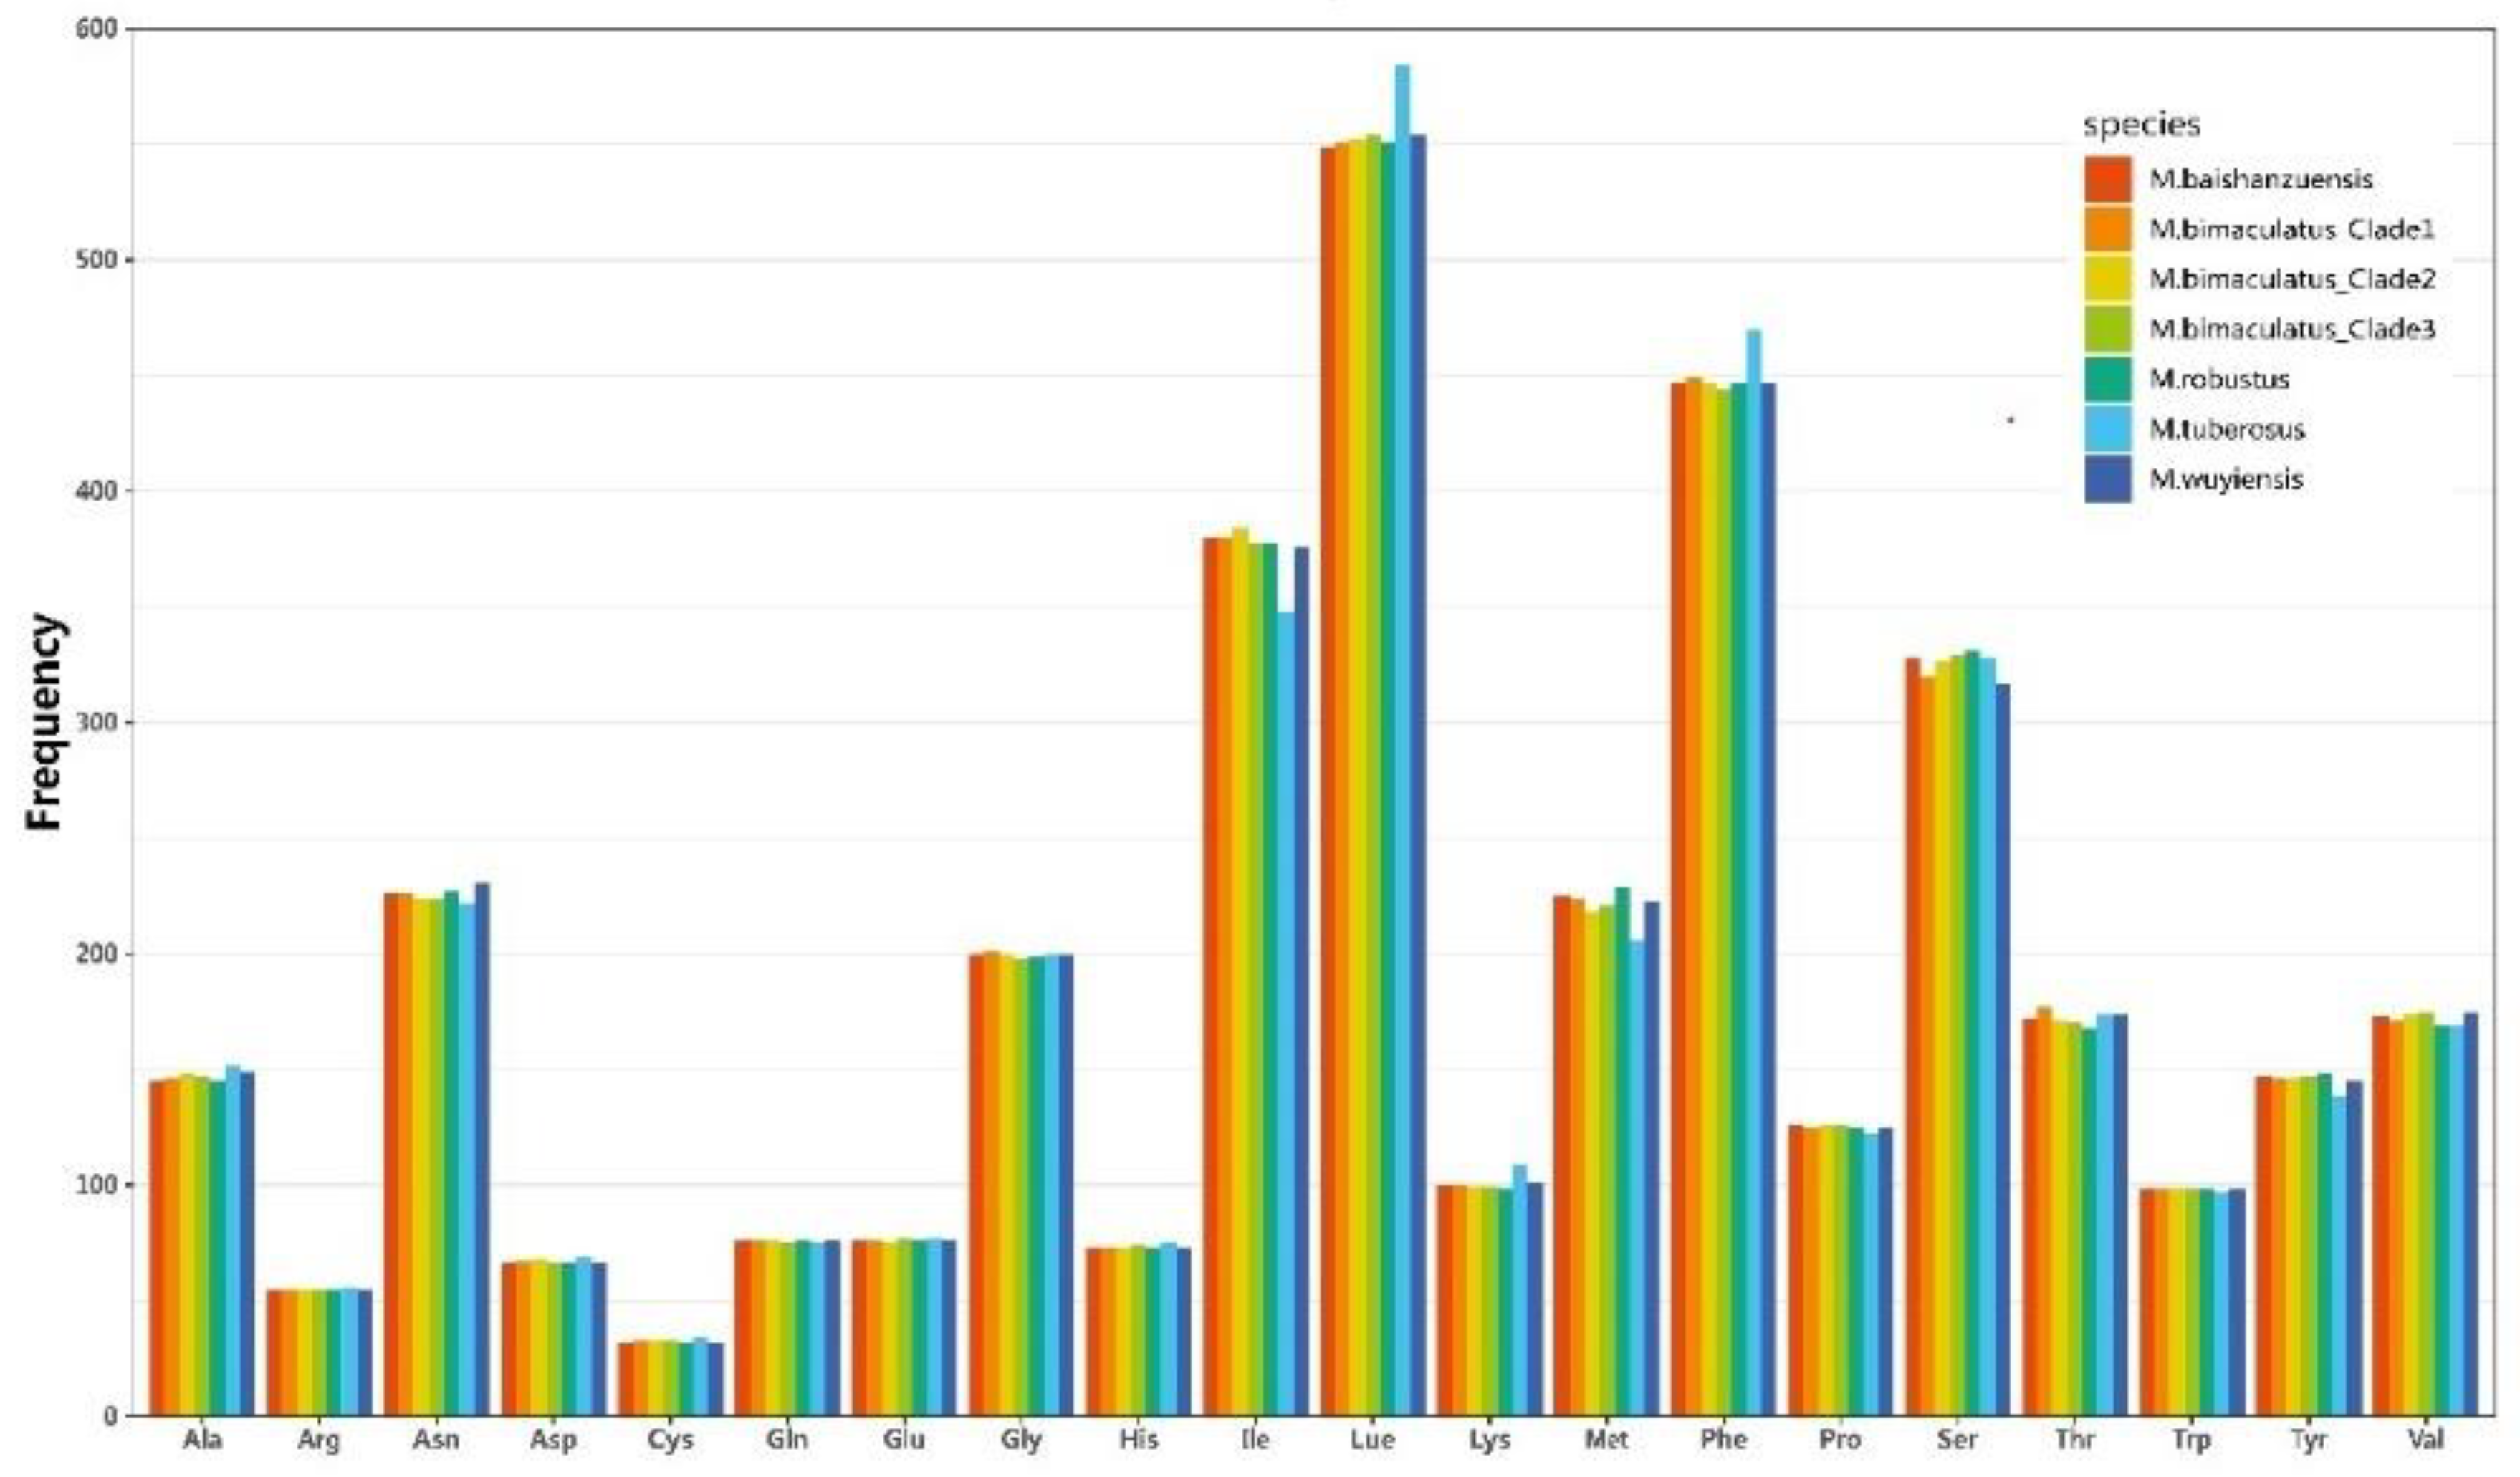
Figure 3.
Relative synonymous codon usage (RSCU) of PCGs in mitochondrial genomes of Microtendipes species. The seven bars of each group represent M. baishanzuensis, M. bimaculatus_Clade1, M. bimaculatus_Clade2, M. bimaculatus_Clade3, M. robustus, M. tuberosus, and M. wuyiensis, separately.
Figure 3.
Relative synonymous codon usage (RSCU) of PCGs in mitochondrial genomes of Microtendipes species. The seven bars of each group represent M. baishanzuensis, M. bimaculatus_Clade1, M. bimaculatus_Clade2, M. bimaculatus_Clade3, M. robustus, M. tuberosus, and M. wuyiensis, separately.
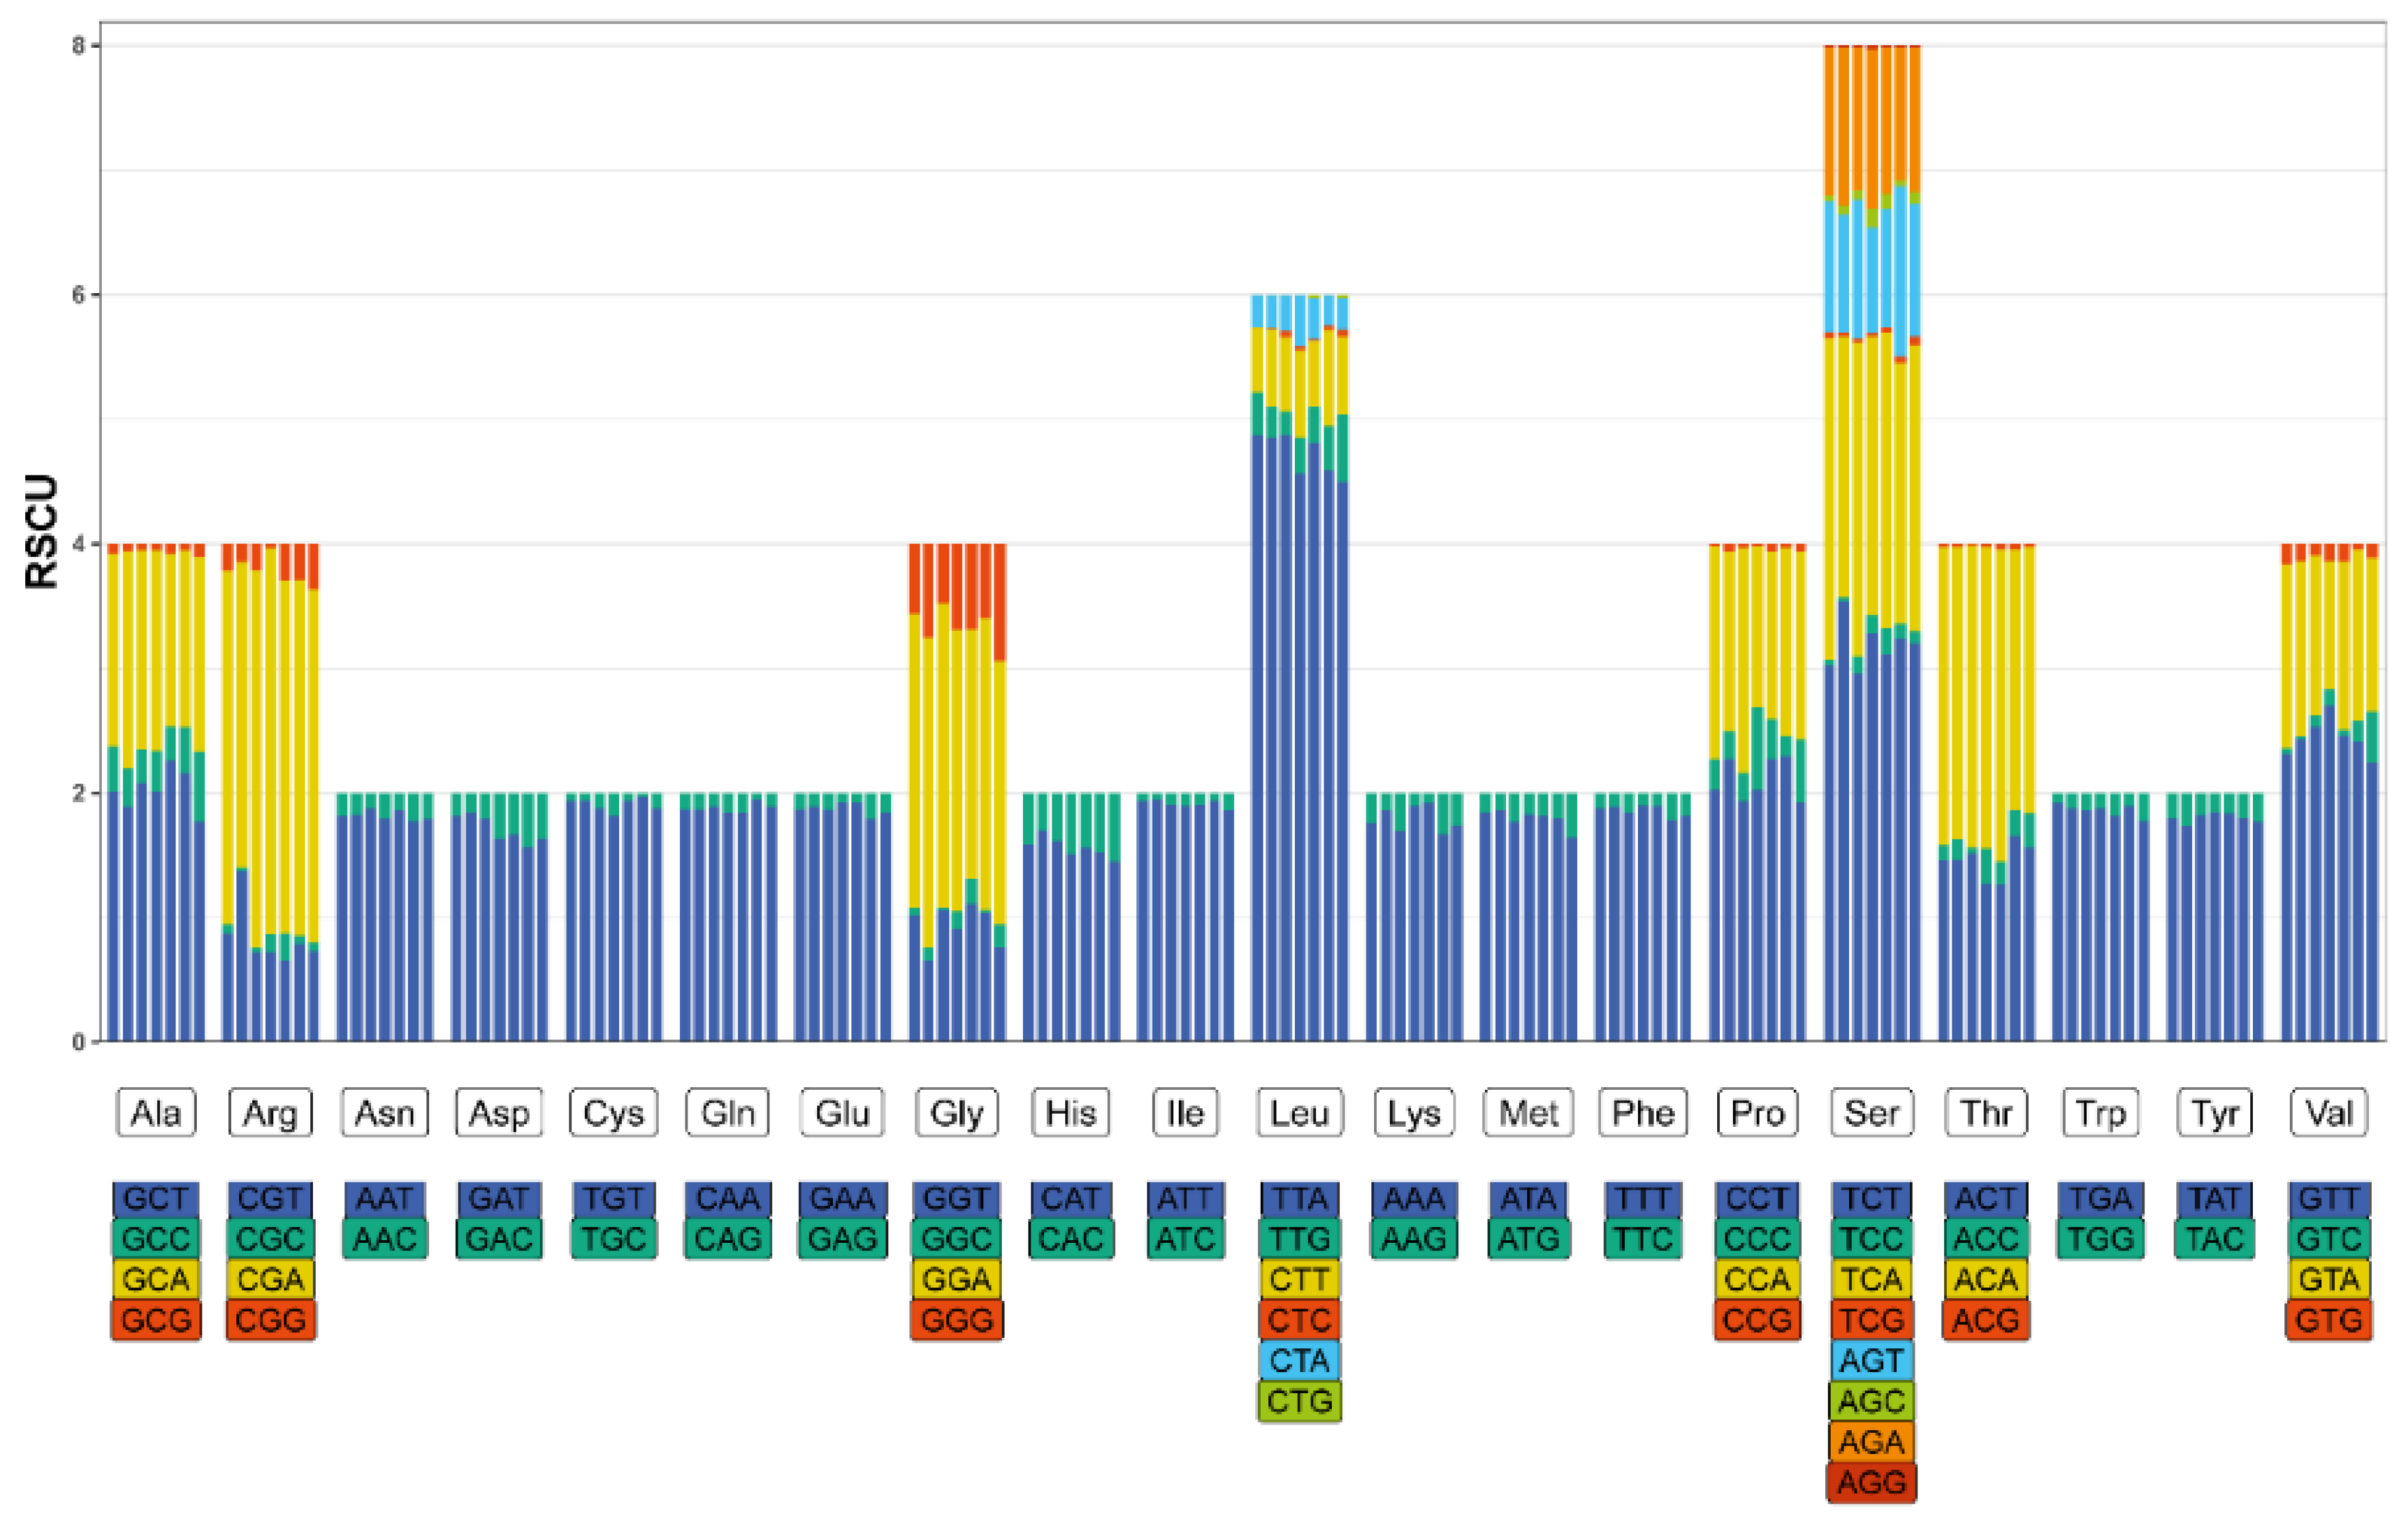

Table 1.
List of the mitochondrial genomes analyzed in the present study, * means from this study.
| Species | Accession No. | Species | Accession No. |
|---|---|---|---|
| Axarus fungorum | ON099430 | Demicryptochironomus minus | PQ014456 |
| Chironomus kiiensis | MZ150770 | Cryptochironomus defectus | PQ014461 |
| Microchironomus tabarui | MZ261913 | Cladopelma edwardsi | PQ014460 |
| Microtendipes bimaculatus-Clade1 | MZ981734 | Dicrotendipes sp. | ON838257 |
| Microtendipes bimaculatus-Clade2 | PP966948* | Einfeldia sp. | ON943041 |
| Microtendipes bimaculatus-Clade3 | PP966952* | Endochironomus pekanus | OP950228 |
| Microtendipes bimaculatus-Clade3 | PP966953* | Glyptotendipes tokunagai | MZ747091 |
| Microtendipes baishanzuensis | PP966947* | Microchironomus tener | ON975027 |
| Microtendipes tuberosus | PP966949* | Phaenopsectra flavipes | OP950216 |
| Microtendipes wuyiensis | PP966951* | Sergentia baueri | OP950220 |
| Microtendipes robustus | PP966950* | Stictochironomus akizukii | OP950218 |
| Microtendipes robustus | PP966954* | Synendotendipes impar | OP950223 |
| Polypedilum henicurum | MZ981735 | Synendotendipes sp.1 | OP950221 |
Table 2.
Nucleotide composition of nine Microtendipes mitogenomes.
| Species | Whole Genome | PCG | tRNA | |||||||||||||
| Length (bp) |
AT% | AT -Skew% |
GC% | GC- Skew% |
Length (bp) |
AT% | AT- Skew% |
GC% | GC- Skew% |
Length (bp) |
AT% | AT- Skew% |
GC% | GC- Skew% |
||
| M. bimaculatus | 15827 | 80.41 | 1.08 | 19.59 | -18.13 | 11121 | 77.84 | -17.69 | 22.16 | 1.62 | 1578 | 82.76 | -3.67 | 17.24 | 29.41 | |
| M. bimaculatus | 15848 | 80.1 | 1.88 | 19.9 | -18.87 | 11121 | 77.63 | -17.66 | 22.37 | 0.88 | 1583 | 82.56 | -3.76 | 17.44 | 28.99 | |
| M. bimaculatus | 16340 | 80.28 | 2.62 | 19.72 | -20.73 | 11106 | 77.06 | -17.91 | 22.94 | -1.65 | 1575 | 82.67 | -3.69 | 17.33 | 29.67 | |
| M. bimaculatus | 15823 | 79.76 | 2.66 | 20.24 | -20.3 | 11106 | 77.02 | -17.94 | 22.98 | -1.57 | 1583 | 82.82 | -3.43 | 17.18 | 30.15 | |
| M. baishanzuensis | 15837 | 80.35 | 2.08 | 19.65 | -19.54 | 11121 | 77.8 | -17.32 | 22.2 | 1.90 | 1577 | 82.18 | -3.70 | 17.82 | 31.67 | |
| M. tuberosus | 16257 | 79.97 | 2.61 | 20.03 | -19.74 | 11154 | 76.94 | -19.16 | 23.06 | 0.16 | 1595 | 82.88 | -2.43 | 17.12 | 27.47 | |
| M. robustus | 15756 | 80.12 | 2.10 | 19.88 | -18.97 | 11109 | 77.5 | -18.04 | 22.5 | 0.56 | 1593 | 82.93 | -2.95 | 17.07 | 29.41 | |
| M. robustus | 16050 | 80.77 | 1.67 | 19.23 | -18.04 | 11109 | 78.09 | -17.92 | 21.91 | 2.38 | 1582 | 82.62 | -3.29 | 17.38 | 31.64 | |
| M. wuyiensis | 16193 | 79.19 | 2.34 | 20.81 | -22.26 | 11118 | 76.07 | -18.13 | 23.93 | 0.56 | 1587 | 82.61 | -3.16 | 17.39 | 28.99 | |
| Species | rRNA | CR | ||||||||||||||
| Length (bp) |
AT% | AT -Skew% |
GC% | GC- Skew% |
Length (bp) |
AT% | AT- Skew% |
GC% | GC- Skew% |
|||||||
| M. bimaculatus | 1492 | 82.44 | 5.05 | 17.56 | 12.98 | 726 | 94.9 | -8.27 | 5.1 | -56.76 | ||||||
| M. bimaculatus | 1494 | 82.26 | 4.48 | 17.74 | 16.23 | 408 | 94.36 | -2.33 | 5.64 | -47.83 | ||||||
| M. bimaculatus | 1496 | 82.29 | 4.79 | 17.71 | 13.96 | 1266 | 94.55 | 0.58 | 5.45 | -62.32 | ||||||
| M. bimaculatus | 1498 | 82.31 | 4.94 | 17.69 | 13.96 | 922 | 94.14 | 0 | 5.86 | -55.56 | ||||||
| M. baishanzuensis | 1492 | 82.51 | 4.30 | 17.49 | 13.41 | 798 | 94.74 | -9.52 | 5.26 | -57.14 | ||||||
| M. tuberosus | 1508 | 81.43 | 3.92 | 18.57 | 14.29 | 664 | 94.58 | 5.41 | 5.42 | -72.22 | ||||||
| M. robusts | 1488 | 82.39 | 4.73 | 17.61 | 15.27 | 727 | 96.42 | 0.72 | 3.58 | -53.85 | ||||||
| M. robusts | 1490 | 82.42 | 5.05 | 17.58 | 13.74 | 615 | 95.45 | -0.85 | 4.55 | -35.71 | ||||||
| M. wuyiensis | 1501 | 81.48 | 5.65 | 18.52 | 12.23 | 338 | 95.56 | -3.41 | 4.44 | -46.67 | ||||||
Disclaimer/Publisher’s Note: The statements, opinions and data contained in all publications are solely those of the individual author(s) and contributor(s) and not of MDPI and/or the editor(s). MDPI and/or the editor(s) disclaim responsibility for any injury to people or property resulting from any ideas, methods, instructions or products referred to in the content. |
© 2025 by the authors. Licensee MDPI, Basel, Switzerland. This article is an open access article distributed under the terms and conditions of the Creative Commons Attribution (CC BY) license (http://creativecommons.org/licenses/by/4.0/).
Copyright: This open access article is published under a Creative Commons CC BY 4.0 license, which permit the free download, distribution, and reuse, provided that the author and preprint are cited in any reuse.


