
Submitted:
11 December 2024
Posted:
12 December 2024
You are already at the latest version
Abstract
Solid oxide fuel cells (SOFCs) are attracting attention as an eco-friendly power source because they show high power density. However, SOFC requires a high-temperature environment of 800℃ or higher, and accordingly, the problem of thermal stability of the material constituting SOFC has been raised. On the other hand, low-temperature solid oxide fuel cells (LT-SOFCs) research is steadily progressing to improve the electrochemical performance at low temperatures by improving the oxygen reduction reaction of the cathode by applying a cathode interlayer of various materials. In this study, LT-SOFCs were manufactured and electrochemical evaluated using praseodymium oxide (PrOx) as a cathode interlayer. Scandium Stabilized Zirconia (ScSZ) pellets were used as electrolyte support for LT-SOFC, and PrOx was deposited by various thicknesses as a cathode interlayer on ScSZ pellets by a sputtering process. Pt and Ni were deposited under the same process conditions for cathode and anode, respectively. To analyze the thin film characteristics of the PrOx cathode interlayer, SEM (Scanning Electron Microscopy), X-ray Diffraction (XRD), and XPS (X-ray Photoelectron Spectroscopy) were analyzed. The electrochemical characteristics of LT-SOFCs were evaluated by electrochemical impedance spectroscopy (EIS). 50 sccm of hydrogen is supplied to the anode and the performance of LT-SOFC is evaluated at 500°C by exposure to the cathode in the atmosphere.
Keywords:
solid oxide fuel cell
; cathode interlayer
; praseodymium oxide
; reactive sputtering
; electrochemical impedance spectroscopy
1. Introduction
Due to recent climate changes, the concepts of eco-friendliness and sustainable development have become increasingly prominent. Therefore, research on eco-friendly power sources that can replace conventional internal combustion engines has intensified. In particular, Solid Oxide Fuel Cells (SOFCs) are gaining attention as eco-friendly power sources due to their excellent efficiency [1,2,3,4,5]. Generally, SOFCs require high operating temperatures, typically above 800°C, because the ionic conductivity of the electrolyte is very low at lower temperatures [1,6]. However, the high-temperature operating conditions raise concerns about the thermal stability of SOFCs. Therefore, research is consistently being conducted to reduce operating temperatures for thermal stability and to prevent performance degradation during low-temperature operation [7,8,9].
Among the various methods to improve the electrochemical performance of low-temperature SOFCs(LT-SOFCs), research on introducing a cathode interlayer has been continuously conducted [10,11,12]. Applying a cathode interlayer optimizes the cathode nanostructure, reducing resistance as oxygen ions (O2-) move from the cathode to the electrolyte, facilitating electrochemical reactions more effectively [13]. Additionally, it promotes the oxygen reduction reaction, enhancing catalytic activity even at relatively low temperatures [14]. According to the study by Lee et al., the performance of LT-SOFCs was improved by applying Gadolinia doped ceria(Gd2O3 ,GDC,) as a cathode interlayer to reduce the activation energy of the ORR reaction at the interface between the cathode and the electrolyte [15].
Praseodymium oxide (PrOx) is a rare earth oxide containing a mixed state of Pr ions with various oxidation states, such as Pr3+ and Pr4+ [16,17]. PrOx is characterized by oxygen vacancies, which enhance its catalytic activity [18,19]. In PrOx, Pr3+ promotes the formation of oxygen vacancies, thereby enhancing oxygen ion conductivity. Additionally, Pr4+ increases reversible redox activity, improving catalytic performance [20,21]. According to previous studies, PrOx was applied to the cathode using the wet-chemical infiltration method to improve the charge transfer process of the existing cathode, thereby enhancing the electrochemical performance of SOFCs [22]. Furthermore, according to the study by Satoshi Okada et al., a symmetric cell was fabricated using PrOx through a thin-film process, followed by surface modification with BaPrO3 on both electrodes, after which electrochemical evaluations were conducted [23].
Meanwhile, powder-based fabrication methods, such as tape casting and infiltration, are widely used as fabrication techniques for manufacturing components of LT-SOFCs. [22,23,24,25,26,27,28]. However, such powder processes have difficulty achieving uniform thin film formation and precise nanoscale control [6,29]. Among these methods, the sputtering process is a physical vapor deposition technique that forms thin films by bombarding a target material with ions under high vacuum conditions [4,15]. Through the sputtering process, components of LT-SOFCs, including electrodes, can be fabricated at the nanoscale, and the microstructure can be controlled by adjusting temperature and pressure conditions [30,31]. The sputtering process not only enables mass production but also allows for the formation of uniform thin films. By optimizing the structure and thickness of the thin films, it enhances electrochemical performance [15,29].
However, research on the fabrication of PrOx interlayers using thin-film processes and their application in LT-SOFCs remains limited. In this study, PrOx is fabricated as a cathode interlayer using a thin-film process for LT-SOFCs. Furthermore, the electrochemical performance is evaluated based on the thickness of the cathode interlayer to determine the optimal thickness.
2. Experiments
The fabrication process of the PrOx cathode interlayer was conducted using RF sputtering, as illustrated in Figure 1 (KVS-2000L, Korea Vacuum Tech, Korea). A silicon wafer was used as the deposition substrate to analyze the physical and chemical properties of PrOx. For the PrOx deposition process, a 2-inch diameter Pr6O11 target was used (VTM, Korea). Additionally, reactive sputtering was utilized during the sputtering process to ensure stable deposition of Pr6O11 [23,32]. To fabricate dense PrOx thin films, the process pressure was uniformly set to 5 mTorr. For reactive sputtering, Ar and oxygen were supplied at 24 sccm and 6 sccm, respectively. The substrate rotated at 20 rpm, and PrOx thin films of varying thicknesses were deposited based on deposition time. To analyze the thickness of the PrOx films, Scanning Electron Microscopy (SEM, S-5200, Hitachi, Japan) was used. In addition, annealed for 1 hr and as-deposited PrOx thin films were produced at 500 °C to analyze the crystal structure change caused by the operating temperature of LT-SOFCs. X-ray Diffraction (XRD, SmartLab, Rigaku, Japan) analysis was performed to analyze the crystallinity of the thin film. In addition, X-ray Photoelectron Spectroscopy (XPS, AXIS Supra+, Kratos, U.K.) was performed to analyze the chemical composition of PrOx.
As shown in Figure 2, LT-SOFCs with a reaction area of 1.5 mm² were fabricated. Sc2O3-stabilized zirconia (ScSZ) pellets were used as electrolyte support. ScSZ is known for its high oxygen ion conductivity and excellent thermal stability [33]. LT-SOFCs were fabricated under the same process conditions as those used to prepare PrOx samples on Si wafers. The cathode was deposited using a Pt target (VTM, Korea) at 50 mTorr with a supply of 30 sccm Ar gas at 100 W. Similarly, the anode was deposited using a Ni target (VTM, Korea) at 30 mTorr with 30 sccm Ar gas supply at 100 W.
To analyze the electrochemical properties of LT-SOFCs with interlayers of varying thickness, a custom-made SOFC test station, as shown in Figure 3, was utilized. The anode and cathode were connected using Ag wire and Ag paste (Silver Conductive Ink Liquid S-020, Alfa Aesar, US). Ceramic sealant (Ceramabond 571, Aremco, US) was used for sealing. LT-SOFC tests were conducted at 500°C. Hydrogen gas (H₂) was supplied at a flow rate of 50 sccm at 1.2 bar, while the cathode was exposed to ambient air. Electrochemical properties were measured using potentiostats (SP-300, Biologic, France). After performance measurements, electrochemical impedance spectroscopy (EIS) was performed by applying an alternating current perturbation of 10 mV at 0.5 V over a frequency range of 1 Hz to 1 MHz.

Table 1.
Experimental Parameters of LT-SOFCs.
| Parameters | Pr30 | Pr55 | Pr150 |
| PrOx Thickness | 30nm | 55nm | 150nm |
| PrOx Power | 5mTorr, Ar 24sccm + O2 6sccm, RT, 40W | ||
| PrOx Deposition time | 1hr 7min | 2hr 15min | 4hr 30min |
| Cathode (Pt) | 50mTorr, Ar 30sccm, RT, 100W, 5min | ||
| Anode (Ni) | 30mTorr, Ar 30sccm, RT, 100W, 25min | ||
3. Results and Discussion
Figure 4 shows the surface of PrOx thin films deposited with various thicknesses on a Si wafer. All films were observed to be deposited in a dense form. However, as the thickness of the PrOx thin film decreased, a trend of decreasing grain size was observed. This trend of smaller grain sizes in thinner films is consistent with previous studies [31,34,35]. The decrease in grain size results in a relatively larger number of grain boundaries, which increases the likelihood of resistance during oxygen ion movement compared to larger grain sizes [36,37].
Figure 5 shows the cross-sections of PrOx thin films with various thicknesses deposited on a Si wafer, along with the Pt thin films deposited on top of them. In Figure 5(a), the PrOx thickness is approximately 30 nm; in Figure 5(b), it is about 55 nm; and in Figure 5(c), it is approximately 150 nm. The Pt layer in all samples showed a uniform thickness of approximately 150 nm. According to numerous previous studies, an increase in the thickness of the cathode interlayer tends to elongate the conduction path, leading to a decrease in oxygen ion conductivity. Consequently, this leads to an increase in ohmic resistance in LT-SOFCs [1].
Pr6O11 has a crystal structure based on a fluorite structure. Notably, it exhibits a mixed state of Pr3+ and Pr4+, which leads to the formation of oxygen vacancies, resulting in a defective-fluorite structure [32]. As shown in Figure 6, XRD analysis revealed that peaks were observed at (111), (200), (220), and (311) planes both in the as-deposited state and after annealing at 500°C for 1 hour. The XRD analysis confirmed that the peak positions remained the same before and after heat treatment, indicating that no phase change occurred in the material [16]. Meanwhile, in the case of annealing at 500°C, sharper peaks were observed compared to the as-deposited state. This indicates that crystallinity improved with heat treatment at 500°C. At the operating temperature of LT-SOFCs, this suggests reduced internal defects and micro strains, enhancing lattice stability and increasing pathways of ion conduction, thereby improving electrochemical performance [38].
XPS was used to investigate the composition ratio of Pr³⁺ and Pr⁴⁺ in both the as-deposited sample and the sample annealed at 500 °C [39]. As shown in Figure 7, deconvolution was performed on the Pr 3d spectrum to separate the superimposed peaks associated with various oxidation states (Pr³⁺, Pr⁴⁺) and bonding states [40]. The results showed the coexistence of Pr³⁺ and Pr⁴⁺ in both Figure 7 (a) and (b). Additionally, the areas of the main peaks obtained through deconvolution were calculated to determine the chemical composition ratio of the two oxidation states, as summarized in Table 2. For the case annealed at 500 °C, the Pr⁴⁺ ratio was 76.64 %, slightly higher than the 73.48 % observed in the as-deposited sample. This shows a similar trend to the findings of L. Grima et al., where heat treatment in an oxidizing atmosphere at high temperatures resulted in a higher Pr4+ content [41]. Although the XPS analysis of annealed PrOx film showed a slight increase in Pr4+ over as-deposited, Pr3+ was still present. The relative increase in Pr4+ content means that Pr4+ can be more readily reduced to Pr3+, which improves the ability of oxygen to absorb and release [42]. However, the fact that the composition ratio of Pr3+ and Pr4+ is maintained even at the operating temperature of 500 °C suggests that the structure of the PrOx catalyst remains stable under the operating conditions of LT-SOFCs.
The electrochemical performance evaluation of LT-SOFCs with cathode interlayers of various thicknesses was conducted at 500 °C. For comparison, a case without a PrOx cathode interlayer was also included. As shown in Figure 8, the OCV of all LT-SOFCs conditions was approximately 1.0V. In the case of pure Pt without a cathode interlayer, the maximum power density reached 8.68 mW/cm². The Pr30 sample achieved 13.1 mW/cm², while the Pr55 sample showed a 26.5% improvement, reaching 17.9 mW/cm². However, the maximum power density of the Pr150 sample was 15.9 mW/cm², representing a 12.2% decrease compared to Pr55.
EIS was measured to analyze the electrochemical behavior of LT-SOFCs in greater detail. Ohmic resistance, which occurs when current flows through electrically conductive materials, corresponds to the x-intercept in the high-frequency region of the EIS graph shown in Figure 8 (b). The curve in the graph represents the faradaic resistance of the anode and cathode [1].
Figure 9 presents the EIS results at 0.5 V for LT-SOFCs with PrOx cathode interlayers of various thicknesses. For Pr30, the ohmic resistance and activation resistance were 5.42 Ω·cm² and 3.05 Ω·cm², respectively. Comparing the resistances of Pr30 with those of Pure Pt (Ohmic: 5.07 Ω·cm², Activation: 13.5 Ω·cm²), the ohmic resistance showed a 6.37% increase, while the activation resistance decreased by approximately 3.4 times. This reduction of activation resistance leads to improved ORR performance, indicating an enhancement in the electrochemical reaction rate at the electrode. As in the preceding of Yuan Li et al., Pr6O11 was applied to LSFM electrodes in a filtration method to significantly improve the electrode performance of LT-SOFCs by increasing the catalytic activity of the electrode and reducing the activation resistance [43]. Compared to previous studies, the PrOx cathode interlayer would have promoted the ORR kinetics in this study.
The ohmic resistance and faradaic resistance of Pr55 were measured as 6.12 Ω·cm² and 2.57 Ω·cm², respectively, while those of Pr150 were measured as 6.74 Ω·cm² and 2.45 Ω·cm². It was observed that as the thickness of the PrOx thin film increased, the ohmic resistance increased slightly, while the activation resistance decreased. This increase in ohmic resistance is attributed to the longer ion conduction pathways through the thicker cathode interlayer. Meanwhile, the increasement of cathode interlayer thickness expands the Triple Phase Boundary (TPB) region, providing more active sites [4,28]. The TPB is the point where electrons, ions, and gases meet, serving as the primary location for electrochemical reactions [44,45]. The decrease in activation resistance is attributed to the presence of these additional active sites. Similar to the findings of previous study of Park et al., the application of a GDC interlayer resulted in an increase in ohmic resistance but a significant reduction in activation resistance due to improved ionic conductivity, demonstrating a comparable trend [46]. This is because the relatively thicker cathode interlayer promotes the ORR reaction to reduce activation resistance, thereby improving electrochemical performance [43]. However, the performance degradation due to ohmic resistance due to an increase in thickness should also be considered.
Meanwhile, in LT-SOFCs with a PrOx cathode interlayer, Warburg impedance was commonly observed in the low-frequency region [47].Warburg impedance appears as a straight line with a slope of 45 degrees in the low-frequency region and represents the resistance arising from the diffusion of oxygen ions generated by the ORR reaction within the PrOx layer [1,48]. Since oxygen ions neither move nor diffuse within the cathode in the case of Pure Pt, Warburg impedance was not observed. However, when a PrOx cathode interlayer was applied, its excellent oxygen exchange capability rapidly facilitated the ORR reaction. Nonetheless, the inability to diffuse oxygen ions correspondingly as quickly resulted in the observed losses [22,32,49].
4. Conclusions
Throughout this study, it was demonstrated that stable PrOx thin films can be deposited via reactive sputtering. SEM analysis confirmed the microstructure of the thin films. Considering the operating temperature of 500 °C for LT-SOFCs, the thin-film properties of PrOx were analyzed using XRD, revealing improved crystallinity compared to the as-deposited state. XPS analysis showed a higher oxidation state (Pr⁴⁺) at 500 °C. This higher oxidization state provides a higher oxygen storage capacity and can easily cause redox reactions through high reduction potential. Additionally, electrochemical performance evaluation was conducted on LT-SOFCs fabricated with ScSZ electrolytes based on this process condition. It was observed that the application of the PrOx interlayer and the increase in interlayer thickness led to an increase in ohmic resistance. However, the increment of TPB regions for oxygen reduction reactions increased, resulting in a significant reduction of activation resistance. In conclusion, the application of the PrOx cathode interlayer effectively enhanced the performance of LT-SOFCs.
Acknowledgements
This work was supported by Korea Institute of Energy Technology Evaluation and Planning(KETEP) grant funded by the Korea government(MOTIE)(20213030030260). This work was supported by the National Research Foundation of Korea(NRF) grant funded by the Korea government(MSIT). (No. RS-2023-00213741). This work was supported by the Technology Innovation Program (20025646) funded By the Ministry of Trade, Industry & Energy(MOTIE, Korea)
References
- F. B. Ryan, O’H., Cha, S.-W., Colella, W., Prinz, Fuel Cell Fundamentals 3rd edition. 2016.
- O. Z. Sharaf and M. F. Orhan, “An overview of fuel cell technology: Fundamentals and applications,” Renew. Sustain. Energy Rev., vol. 32, pp. 810–853, Apr. 2014. [CrossRef]
- M. Liu, M. E. Lynch, K. Blinn, F. M. Alamgir, and Y. Choi, “Rational SOFC material design: new advances and tools,” Mater. Today, vol. 14, no. 11, pp. 534–546, Nov. 2011. [CrossRef]
- G. Y. Cho, Y. H. Lee, and S. W. Cha, “Multi-component nano-composite electrode for SOFCS via thin film technique,” Renew. Energy, vol. 65, pp.130–136, May 2014. [CrossRef]
- E. Ivers-Tiffée, A. Weber, and D. Herbstritt, “Materials and technologies for SOFC-components,” J. Eur. Ceram. Soc., vol. 21, no. 10–11, pp. 1805–1811, Jan. 2001. [CrossRef]
- N. Mahato, A. Banerjee, A. Gupta, S. Omar, and K. Balani, “Progress in material selection for solid oxide fuel cell technology: A review,” Prog. Mater. Sci., vol. 72, pp. 141–337, Jul. 2015. [CrossRef]
- K. A. González-García et al., “Electrical and thermal properties of LT-SOFC solid electrolytes: Sm cerates/zirconates obtained by mechanochemistry,” Int. J. Hydrogen Energy, Jan. 2024. [CrossRef]
- X. Guo et al., “Thermodynamic analysis of a novel combined heating and power system based on low temperature solid oxide fuel cell (LT-SOFC) and high temperature proton exchange membrane fuel cell (HT-PEMFC),” Energy, vol. 284, p. 129227, Dec. 2023. [CrossRef]
- J. Patakangas, Y. Ma, Y. Jing, and P. Lund, “Review and analysis of characterization methods and ionic conductivities for low-temperature solid oxide fuel cells (LT-SOFC),” J. Power Sources, vol. 263, pp. 315–331, Oct. 2014. [CrossRef]
- Y. B. Kim, J. H. Shim, T. M. Gür, and F. B. Prinz, “Epitaxial and Polycrystalline Gadolinia-Doped Ceria Cathode Interlayers for Low Temperature Solid Oxide Fuel Cells,” J. Electrochem. Soc., vol. 158, no. 11, p. B1453, 2011. [CrossRef]
- J. Bae, S. Hong, B. Koo, J. An, F. B. Prinz, and Y. B. Kim, “Influence of the grain size of samaria-doped ceria cathodic interlayer for enhanced surface oxygen kinetics of low-temperature solid oxide fuel cell,” J. Eur. Ceram. Soc., vol. 34, no. 15, pp. 3763–3768, Dec. 2014. [CrossRef]
- W. Jeong, W. Yu, M. S. Lee, S. J. Bai, G. Y. Cho, and S. W. Cha, “Ultrathin sputtered platinum–gadolinium doped ceria cathodic interlayer for enhanced performance of low temperature solid oxide fuel cells,” Int. J. Hydrogen Energy, vol. 45, no. 56, pp. 32442–32448, Nov. 2020. [CrossRef]
- K. Develos-Bagarinao, R. A. Budiman, S. S. Liu, T. Ishiyama, H. Kishimoto, and K. Yamaji, “Evolution of cathode-interlayer interfaces and its effect on long-term degradation,” J. Power Sources, vol. 453, p. 227894, Mar. 2020. [CrossRef]
- A. Chrzan, J. Karczewski, D. Szymczewska, and P. Jasinski, “Nanocrystalline cathode functional layer for SOFC,” Electrochim. Acta, vol. 225, pp. 168–174, Jan. 2017. [CrossRef]
- Y. H. Lee, H. Ren, E. A. Wu, E. E. Fullerton, Y. S. Meng, and N. Q. Minh, “All-Sputtered, Superior Power Density Thin-Film Solid Oxide Fuel Cells with a Novel Nanofibrous Ceramic Cathode,” Nano Lett., vol. 20, no. 5, pp. 2943–2949, 2020. [CrossRef]
- B. Matović et al., “Synthesis and characterization of Pr6O11 nanopowders,” Ceram. Int., vol. 39, no. 3, pp. 3151–3155, Apr. 2013. [CrossRef]
- Y. Yi et al., “Boosting the Performance and Stability of Perovskites by Construction of NiFe Alloy and PrOx Heterogeneously Structured Composites for High-Performance Solid Oxide Fuel Cell Anode,” Adv. Funct. Mater., vol. 2412486, pp. 1–11, 2024. [CrossRef]
- C. Nicollet et al., “An innovative efficient oxygen electrode for SOFC : Pr6O11 infiltrated into Gd-doped ceria backbone To cite this version : An innovative efficient oxygen electrode for SOFC : Pr 6 O 11 infiltrated into Gd-doped ceria backbone,” 2021.
- V. Thangadurai, R. A. Huggins, and W. Weppner, “Mixed ionic-electronic conductivity in phases in the praseodymium oxide system,” J. Solid State Electrochem., vol. 5, no. 7–8, pp.531–537. 2001. [CrossRef]
- V. Frizon et al., “Tuning the Pr Valence State to Design High Oxygen Mobility, Redox and Transport Properties in the CeO2-ZrO2-PrO x Phase Diagram,” J. Phys. Chem. C, vol. 123, no. 11, pp. 6351–6362, 2019. [CrossRef]
- S. Corby, L. Francàs, A. Kafizas, and J. R. Durrant, “Determining the role of oxygen vacancies in the photoelectrocatalytic performance of WO3 for water oxidation,” Chem. Sci., vol. 11, no. 11, pp. 2907–2914, 2020. [CrossRef]
- M. Y. Lu, R. Scipioni, B. K. Park, T. Yang, Y. A. Chart, and S. A. Barnett, “Mechanisms of PrOx performance enhancement of oxygen electrodes for low and intermediate temperature solid oxide fuel cells,” Mater. Today Energy, vol. 14, p. 100362, Dec. 2019. [CrossRef]
- S. Okada, S. Miyoshi, and S. Yamaguchi, “Rate Determining Step in ORR of PrO x -Based Film Cathodes,” ECS Trans., vol. 68, no. 1, pp. 987–994, Jun. 2015. [CrossRef]
- Z. Naiqing, S. Kening, Z. Derui, and J. Dechang, “Study on Properties of LSGM Electrolyte Made by Tape Casting Method and Applications in SOFC,” J. Rare Earths, vol. 24, no. 1, pp. 90–92, Dec. 2006. [CrossRef]
- H. Moon, S. D. Kim, S. H. Hyun, and H. S. Kim, “Development of IT-SOFC unit cells with anode-supported thin electrolytes via tape casting and co-firing,” Int. J. Hydrogen Energy, vol. 33, no. 6, pp. 1758–1768, Mar. 2008. [CrossRef]
- H. Lee, J. Park, Y. Lim, H. Yang, and Y. B. Kim, “Flash light sintered SDC cathodic interlayer for enhanced oxygen reduction reaction in LT-SOFCs,” J. Alloys Compd., vol. 861, p. 158397, Apr. 2021. [CrossRef]
- S. U. Dubal, A. P. Jamale, S. T. Jadhav, S. P. Patil, C. H. Bhosale, and L. D. Jadhav, “Yttrium doped BaCeO3 thin films by spray pyrolysis technique for application in solid oxide fuel cell,” J. Alloys Compd., vol. 587, pp. 664–669, Feb. 2014. [CrossRef]
- S. Choi, S. Yoo, J.-Y. Shin, and G. Kim, “High Performance SOFC Cathode Prepared by Infiltration of Lan + 1NinO3n + 1 (n = 1, 2, and 3) in Porous YSZ,” J. Electrochem. Soc., vol. 158, no. 8, p. B995, 2011. [CrossRef]
- W. Yu, S. Lee, W. Jeong, G. Y. Cho, Y. H. Lee, and S. W. Cha, “High performance, enhanced structural stability of co-sputtered nanocomposite anode with neutral stress state for low-temperature solid oxide fuel cells,” Mater. Today Energy, vol. 34, p. 101308, Jun. 2023. [CrossRef]
- Y. Pan, J. Wang, Z. Lu, R. Wang, and Z. Xu, “A review on the application of magnetron sputtering technologies for solid oxide fuel cell in reduction of the operating temperature,” Int. J. Hydrogen Energy, vol. 50, pp. 1179–1193, Jan. 2024. [CrossRef]
- Y. Yang, Y. Zhang, and M. Yan, “A review on the preparation of thin-film YSZ electrolyte of SOFCs by magnetron sputtering technology,” Sep. Purif. Technol., vol. 298, p. 121627, Oct. 2022. [CrossRef]
- T.-M. Pan, C.-I. Hsieh, F.-J. Tsai, and T.-W. Wu, “Excellent Electrical Characteristics of Praseodymium Oxide Dielectrics on Si Substrate by Reactive RF Sputtering,” ECS Trans., vol. 6, no. 1, pp. 247–250, Apr. 2007. [CrossRef]
- V. Vijaya Lakshmi, R. Bauri, A. S. Gandhi, and S. Paul, “Synthesis and characterization of nanocrystalline ScSZ electrolyte for SOFCs,” Int. J. Hydrogen Energy, vol. 36, no. 22, pp. 14936–14942, Nov. 2011. [CrossRef]
- H. Liang, J. Xu, D. Zhou, X. Sun, S. Chu, and Y. Bai, “Thickness dependent microstructural and electrical properties of TiN thin films prepared by DC reactive magnetron sputtering,” Ceram. Int., vol. 42, no. 2, pp. 2642–2647, Feb. 2016. [CrossRef]
- L. Zhang, H. Yang, X. Pang, K. Gao, and A. A. Volinsky, “Microstructure, residual stress, and fracture of sputtered TiN films,” Surf. Coatings Technol., vol. 224, pp. 120–125, Jun. 2013. [CrossRef]
- D. Chen, S. R. Bishop, and H. L. Tuller, “Praseodymium-cerium oxide thin film cathodes: Study of oxygen reduction reaction kinetics,” J. Electroceramics, vol. 28, no. 1, pp.62–69, 2012. [CrossRef]
- M. Faryna, M. Adamczyk-Habrajska, and M. Lubszczyk, “Influence of grain boundary plane distribution on ionic conductivity in yttria-stabilized zirconia sintered at elevated temperatures,” Arch. Civ. Mech. Eng., vol. 24, no. 2, pp. 1–7, 2024. [CrossRef]
- C. Korte, A. Peters, J. Janek, D. Hesse, and N. Zakharov, “Ionic conductivity and activation energy for oxygen ion transport in superlattices-the semicoherent multilayer system YSZ (ZrO2 + 9.5 mol% Y2O3)/Y2O3,” Phys. Chem. Chem. Phys., vol. 10, no. 31, pp. 4623–4635, 2008. [CrossRef]
- W. Zhang et al., “Pr/Ba cation-disordered perovskite Pr2/3Ba1/3CoO31δ as a new bifunctional electrocatalyst for oxygen reduction and oxygen evolution reactions,” J. Ceram. Soc. Japan, vol. 126, no. 10, pp.814–819, 2018. [CrossRef]
- B. Kamecki, T. Miruszewski, and J. Karczewski, “Structural and electrical transport properties of Pr-doped SrTi 0.93 Co 0.07 O 3-δ a novel SOEC fuel electrode materials,” J. Electroceramics, vol. 42, no. 1–2, pp. 31–40, 2019. [CrossRef]
- L. Grima, J. I. Peña, and M. L. Sanjuán, “Pyrochlore-like ZrO2-PrOx compounds: The role of the processing atmosphere in the stoichiometry, microstructure and oxidation state,” J. Alloys Compd., vol. 923, p. 166449, 2022. [CrossRef]
- E. Poggio-Fraccari, G. Baronetti, and F. Mariño, “Pr3+ surface fraction in CePr mixed oxides determined by XPS analysis,” J. Electron Spectros. Relat. Phenomena, vol. 222, pp. 1–4, 2018. [CrossRef]
- Y. Li, Y. Tian, Z. Li, X. Wu, L. Wang, and T. Bian, “Boosting the performance of La0.5Sr0.5Fe0.9Mo0.1O3-δ oxygen electrode via surface-decoration with Pr6O11 nano-catalysts,” Int. J. Hydrogen Energy, vol. 84, pp. 305–312, Sep. 2024. 2024. [CrossRef]
- B. Timurkutluk, T. Altan, S. Toros, O. Genc, S. Celik, and H. G. Korkmaz, “Engineering solid oxide fuel cell electrode microstructure by a micro-modeling tool based on estimation of TPB length,” Int. J. Hydrogen Energy, vol. 46, no. 24, pp. 13298–13317, Apr. 2021. [CrossRef]
- Y. Li, S. Wang, and P. C. Su, “Proton-conducting Micro-solid Oxide Fuel Cells with Improved Cathode Reactions by a Nanoscale Thin Film Gadolinium-doped Ceria Interlayer,” Sci. Rep., vol. 6, no. February, 2016. [CrossRef]
- T. Park et al., “Effect of the thickness of sputtered gadolinia-doped ceria as a cathodic interlayer in solid oxide fuel cells,” Thin Solid Films, vol. 584, pp. 120–124, Jun. 2015. [CrossRef]
- J. Nielsen, T. Jacobsen, and M. Wandel, “Impedance of porous IT-SOFC LSCF:CGO composite cathodes,” Electrochim. Acta, vol. 56, no. 23, pp. 7963–7974, Sep. 2011. [CrossRef]
- A. C. Lazanas and M. I. Prodromidis, “Electrochemical Impedance Spectroscopy─A Tutorial,” ACS Meas. Sci. Au, vol. 3, no. 3, pp. 162–193, 2023. [CrossRef]
- Y. A. Chart, M. Y. Lu, and S. A. Barnett, “High-Performance Oxygen Electrodes for Low Temperature Solid Oxide Cells,” ECS Meet. Abstr., vol. MA2019-01, no. 33, p. 1713, 2019. [CrossRef]
Figure 1.
Schematic Diagram of DC/RF magnetron Sputtering System.
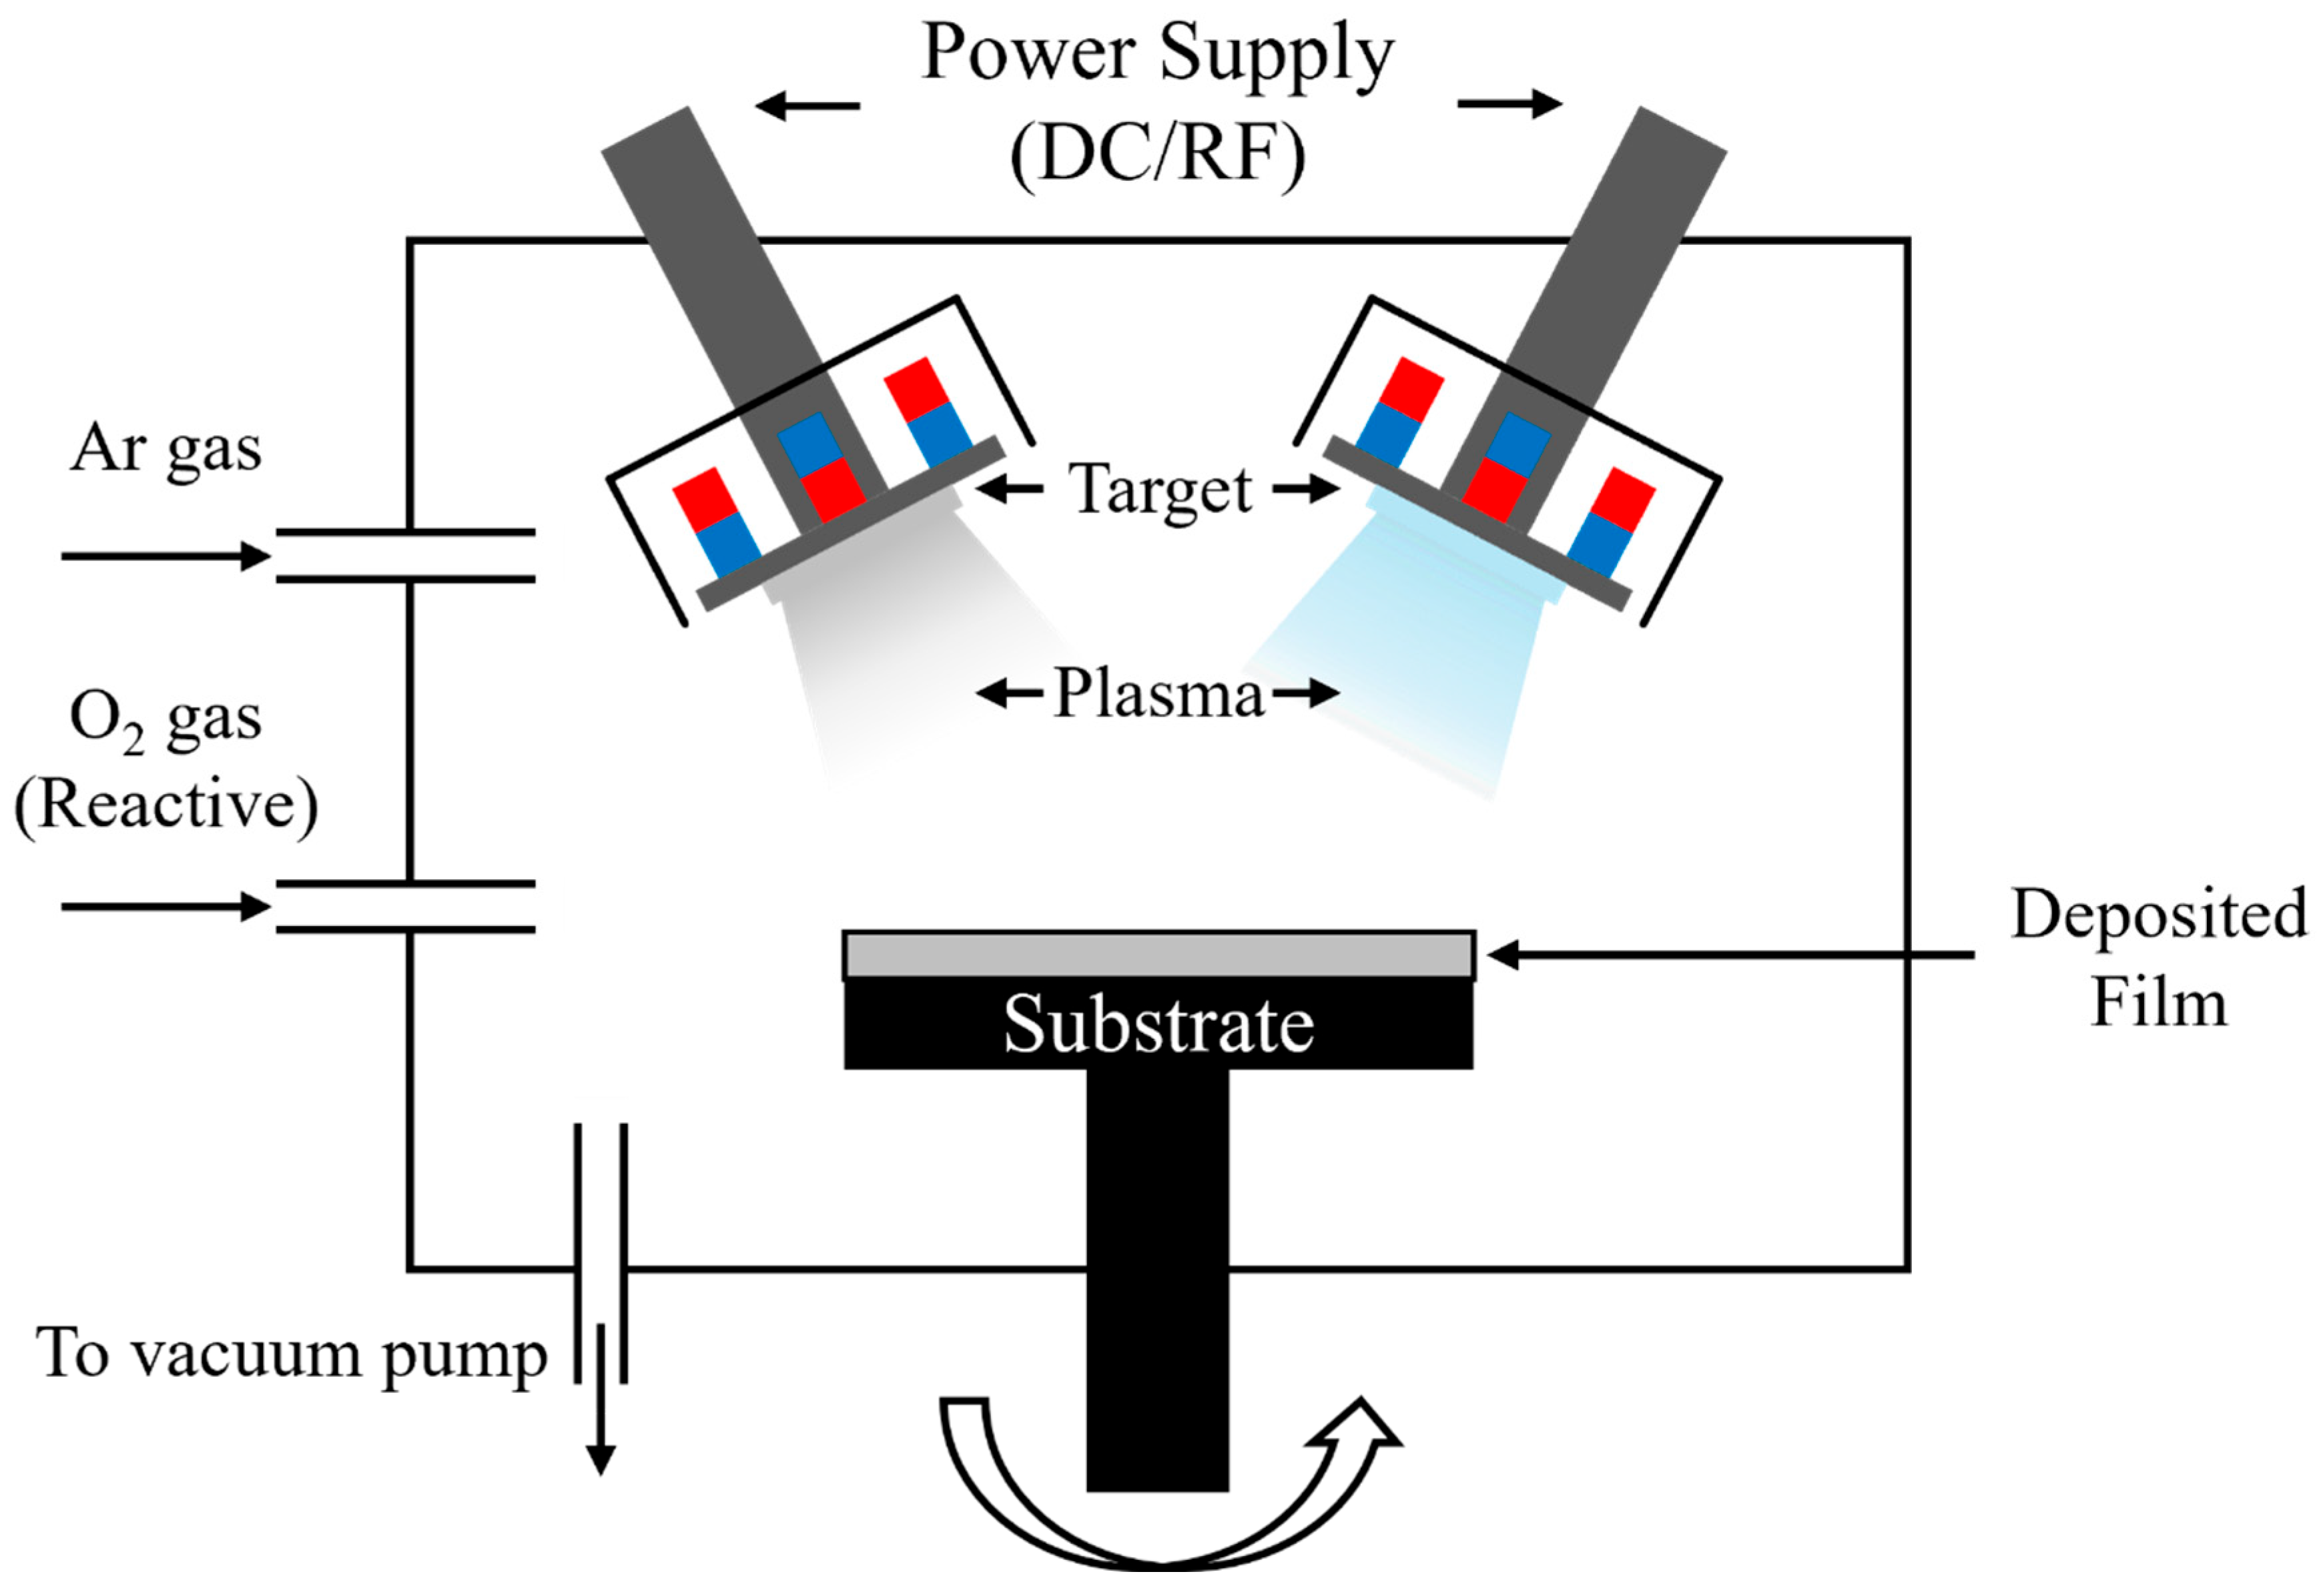
Figure 2.
Schematic Diagram of LT-SOFCs.
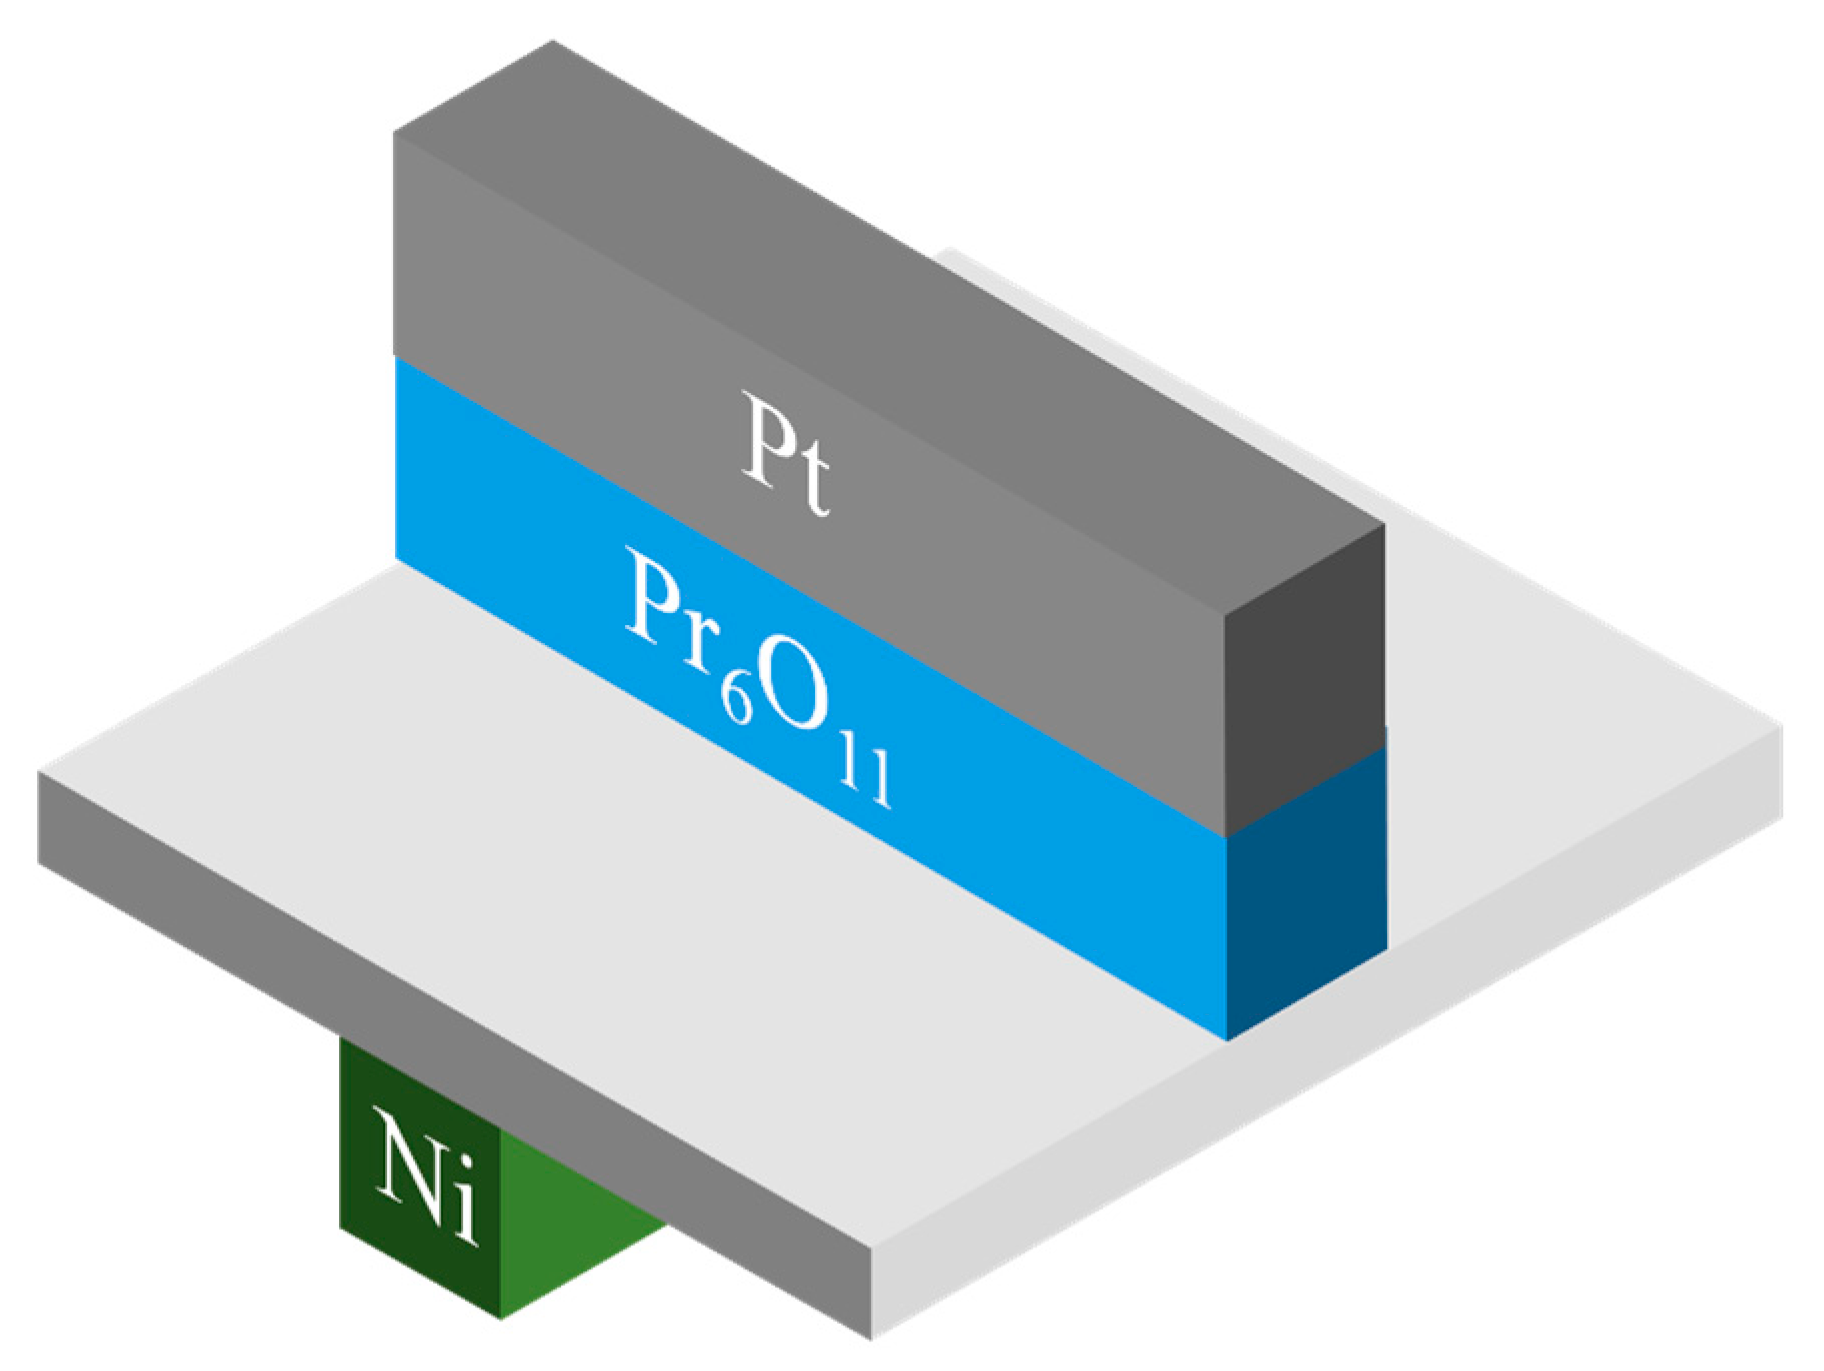
Figure 3.
Schematic Diagram of custom-made LT-SOFCs system.
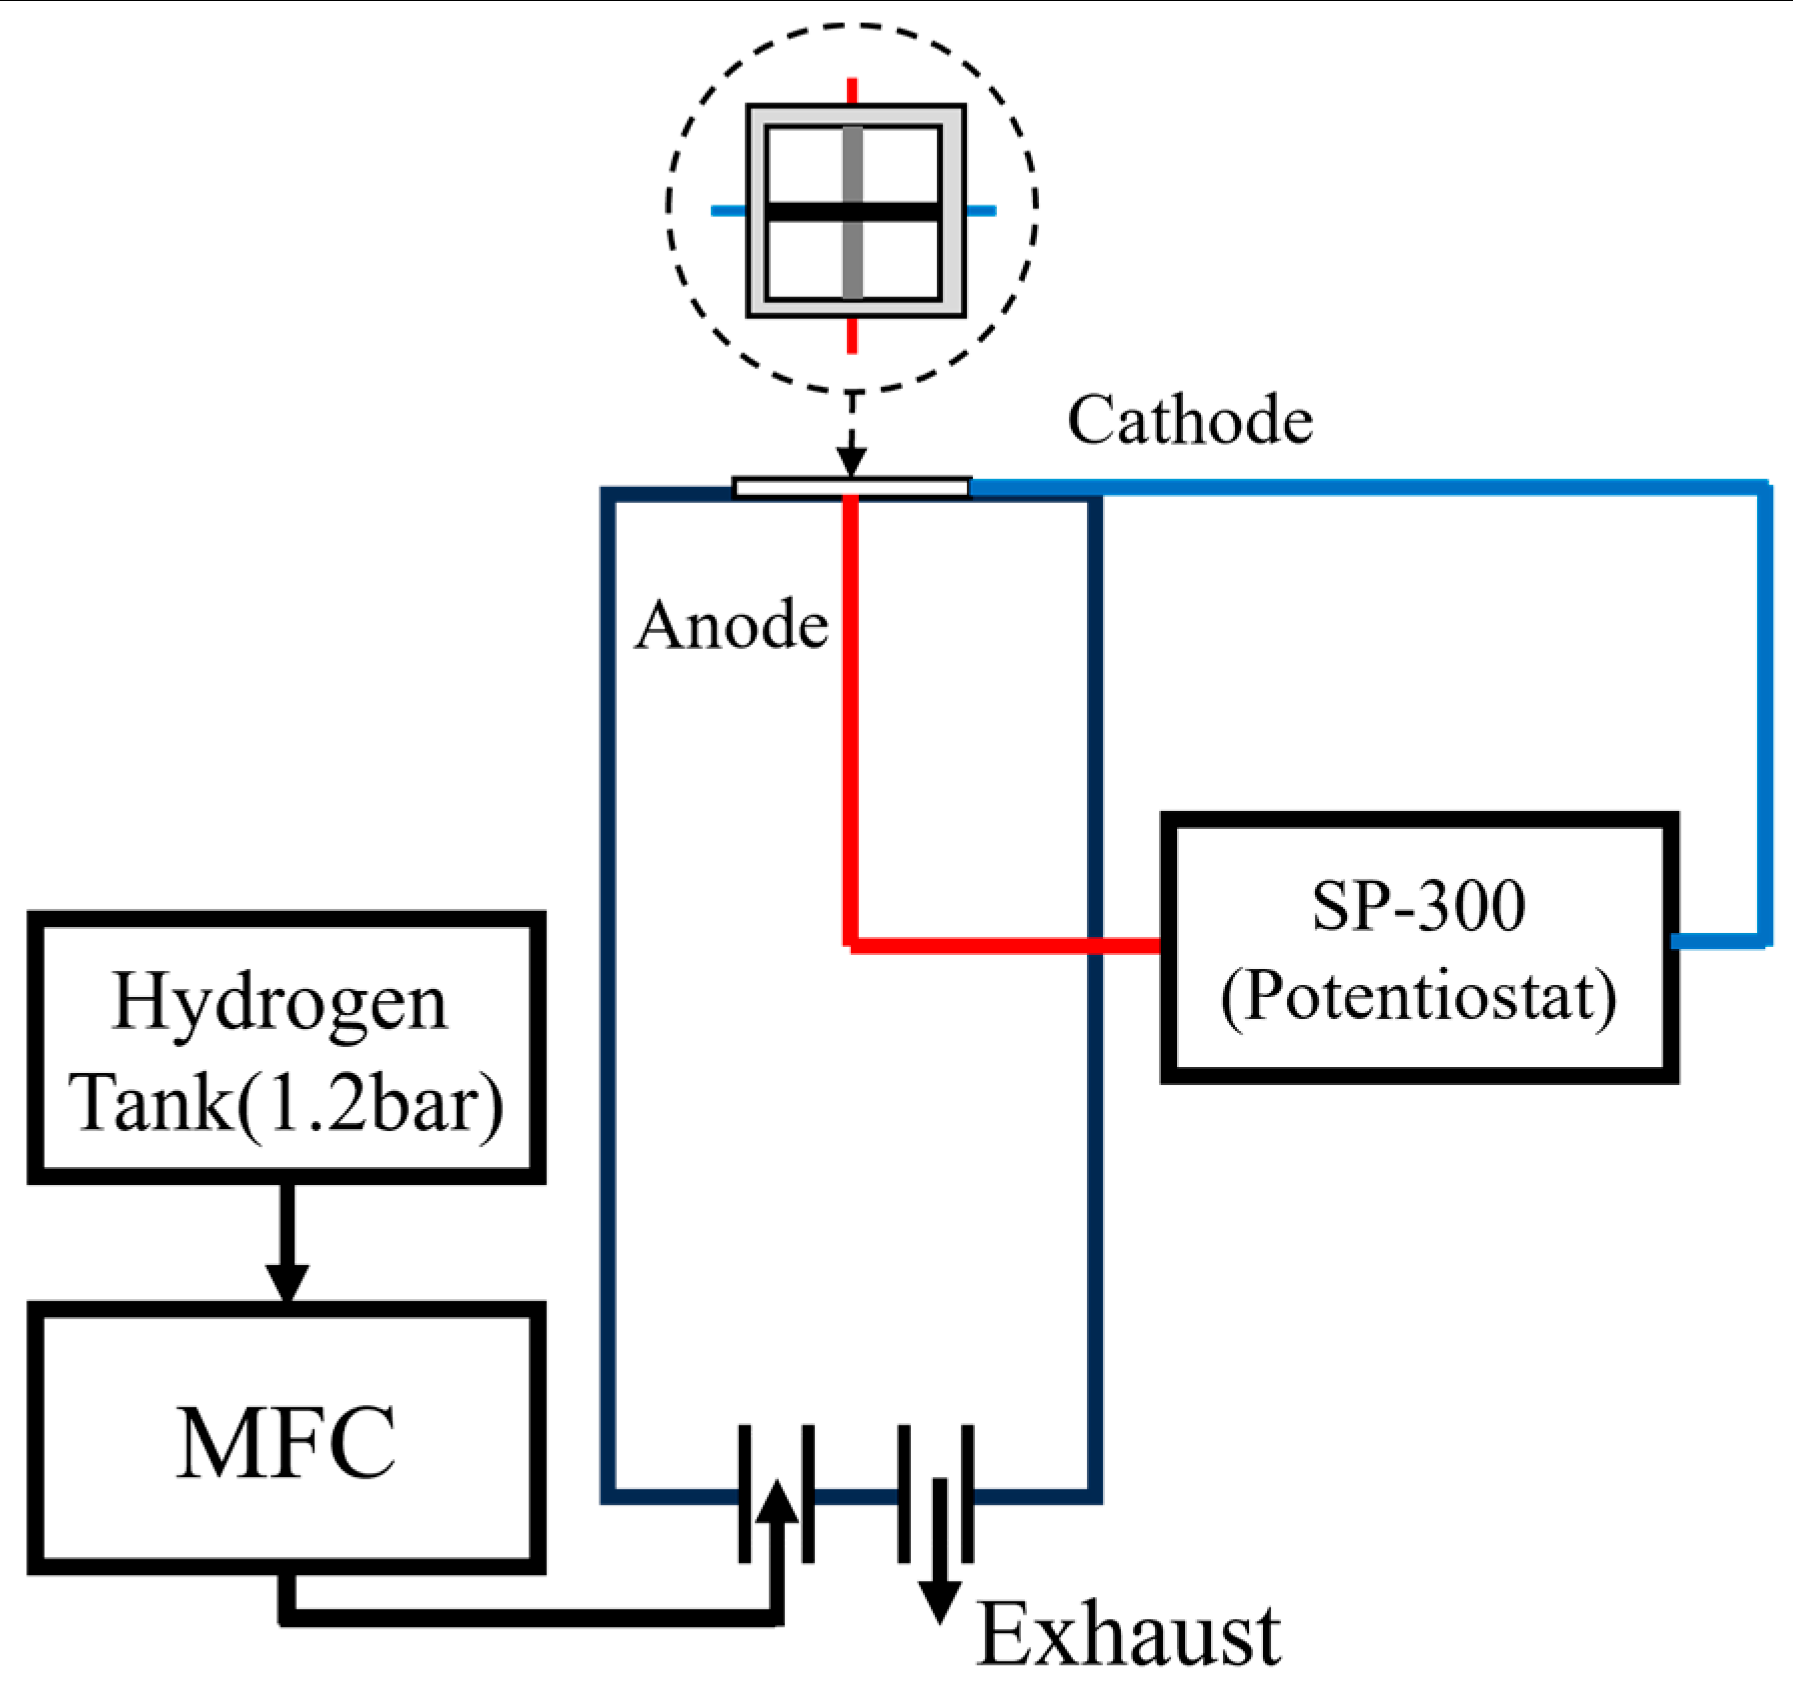
Figure 4.
Surface images of PrOx thin films on Si wafer measure by SEM image. (a) Pr30 (b) Pr55 (c) Pr150.
Figure 4.
Surface images of PrOx thin films on Si wafer measure by SEM image. (a) Pr30 (b) Pr55 (c) Pr150.
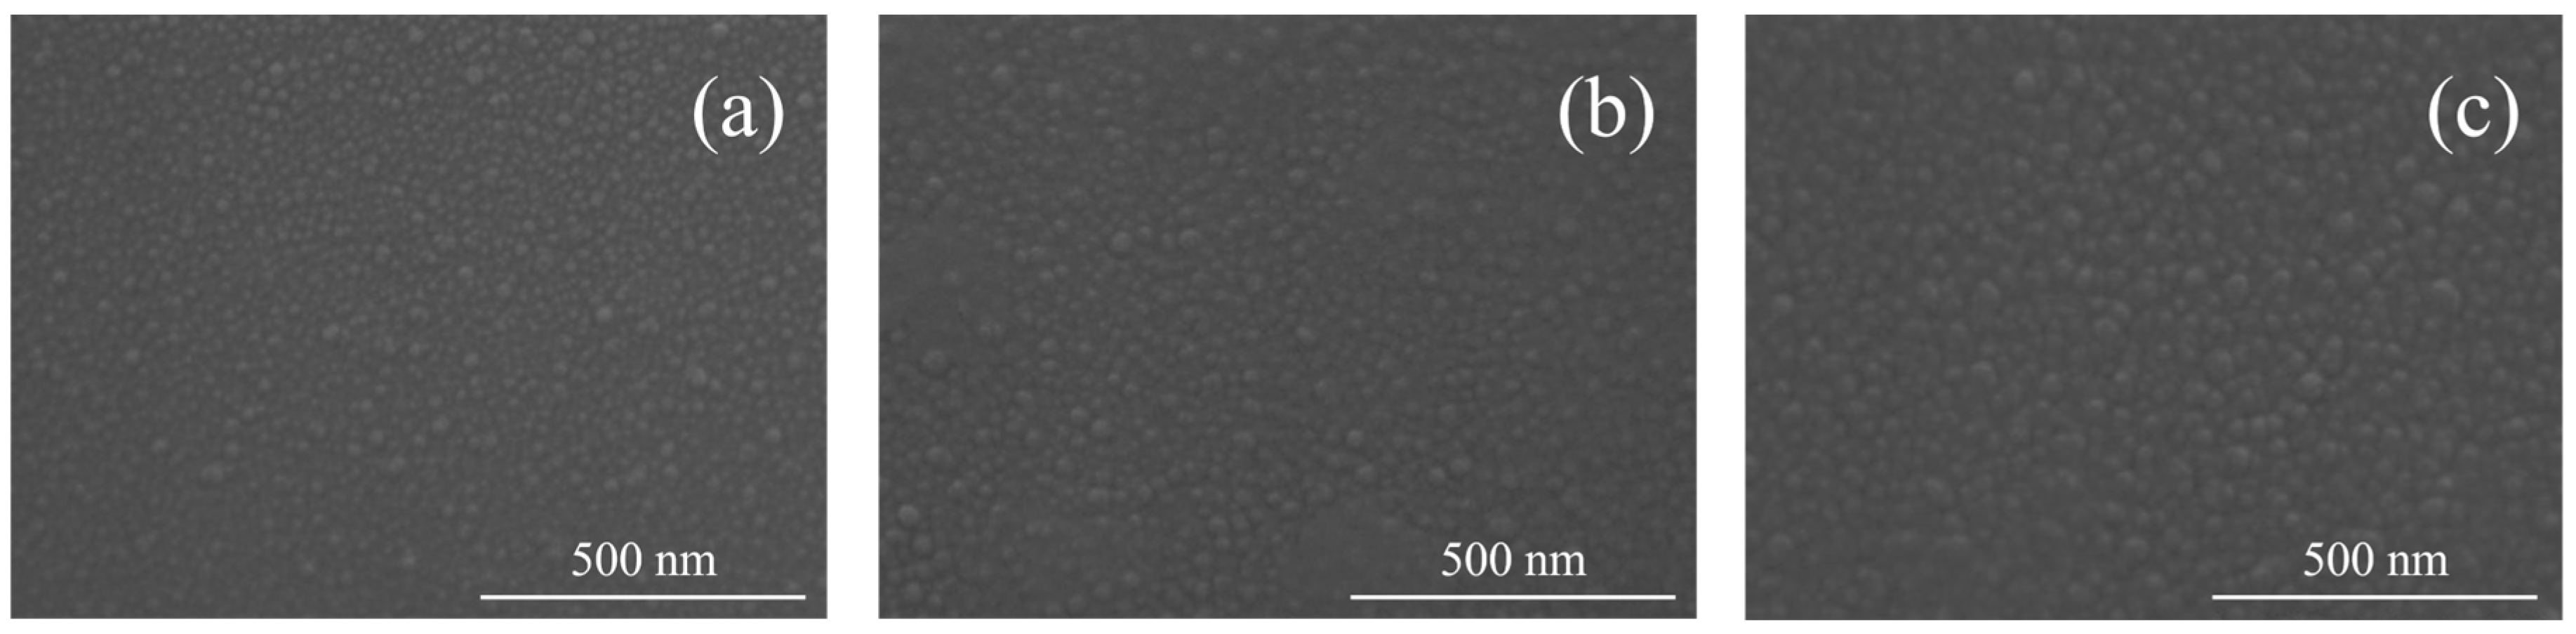
Figure 5.
Cross-sectional images of PrOx thin films on Si wafer measure by SEM image. (a) Pr30 (b) Pr55 (c) Pr150.
Figure 5.
Cross-sectional images of PrOx thin films on Si wafer measure by SEM image. (a) Pr30 (b) Pr55 (c) Pr150.
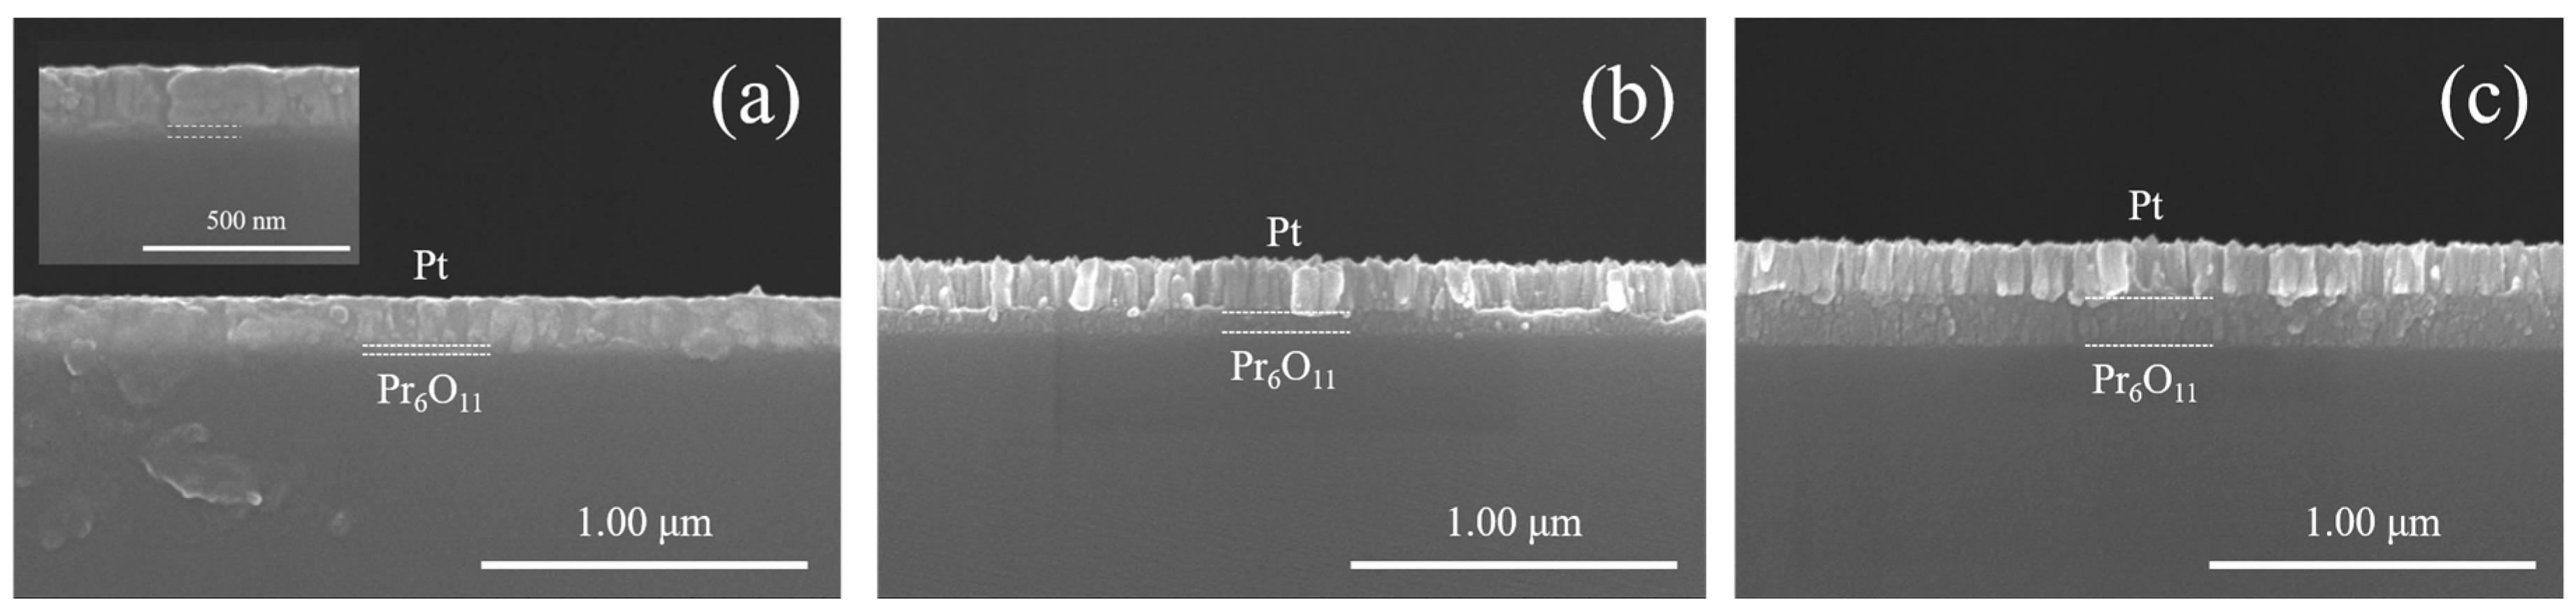
Figure 6.
Crystal structure of PrOx thin films measured by XRD.
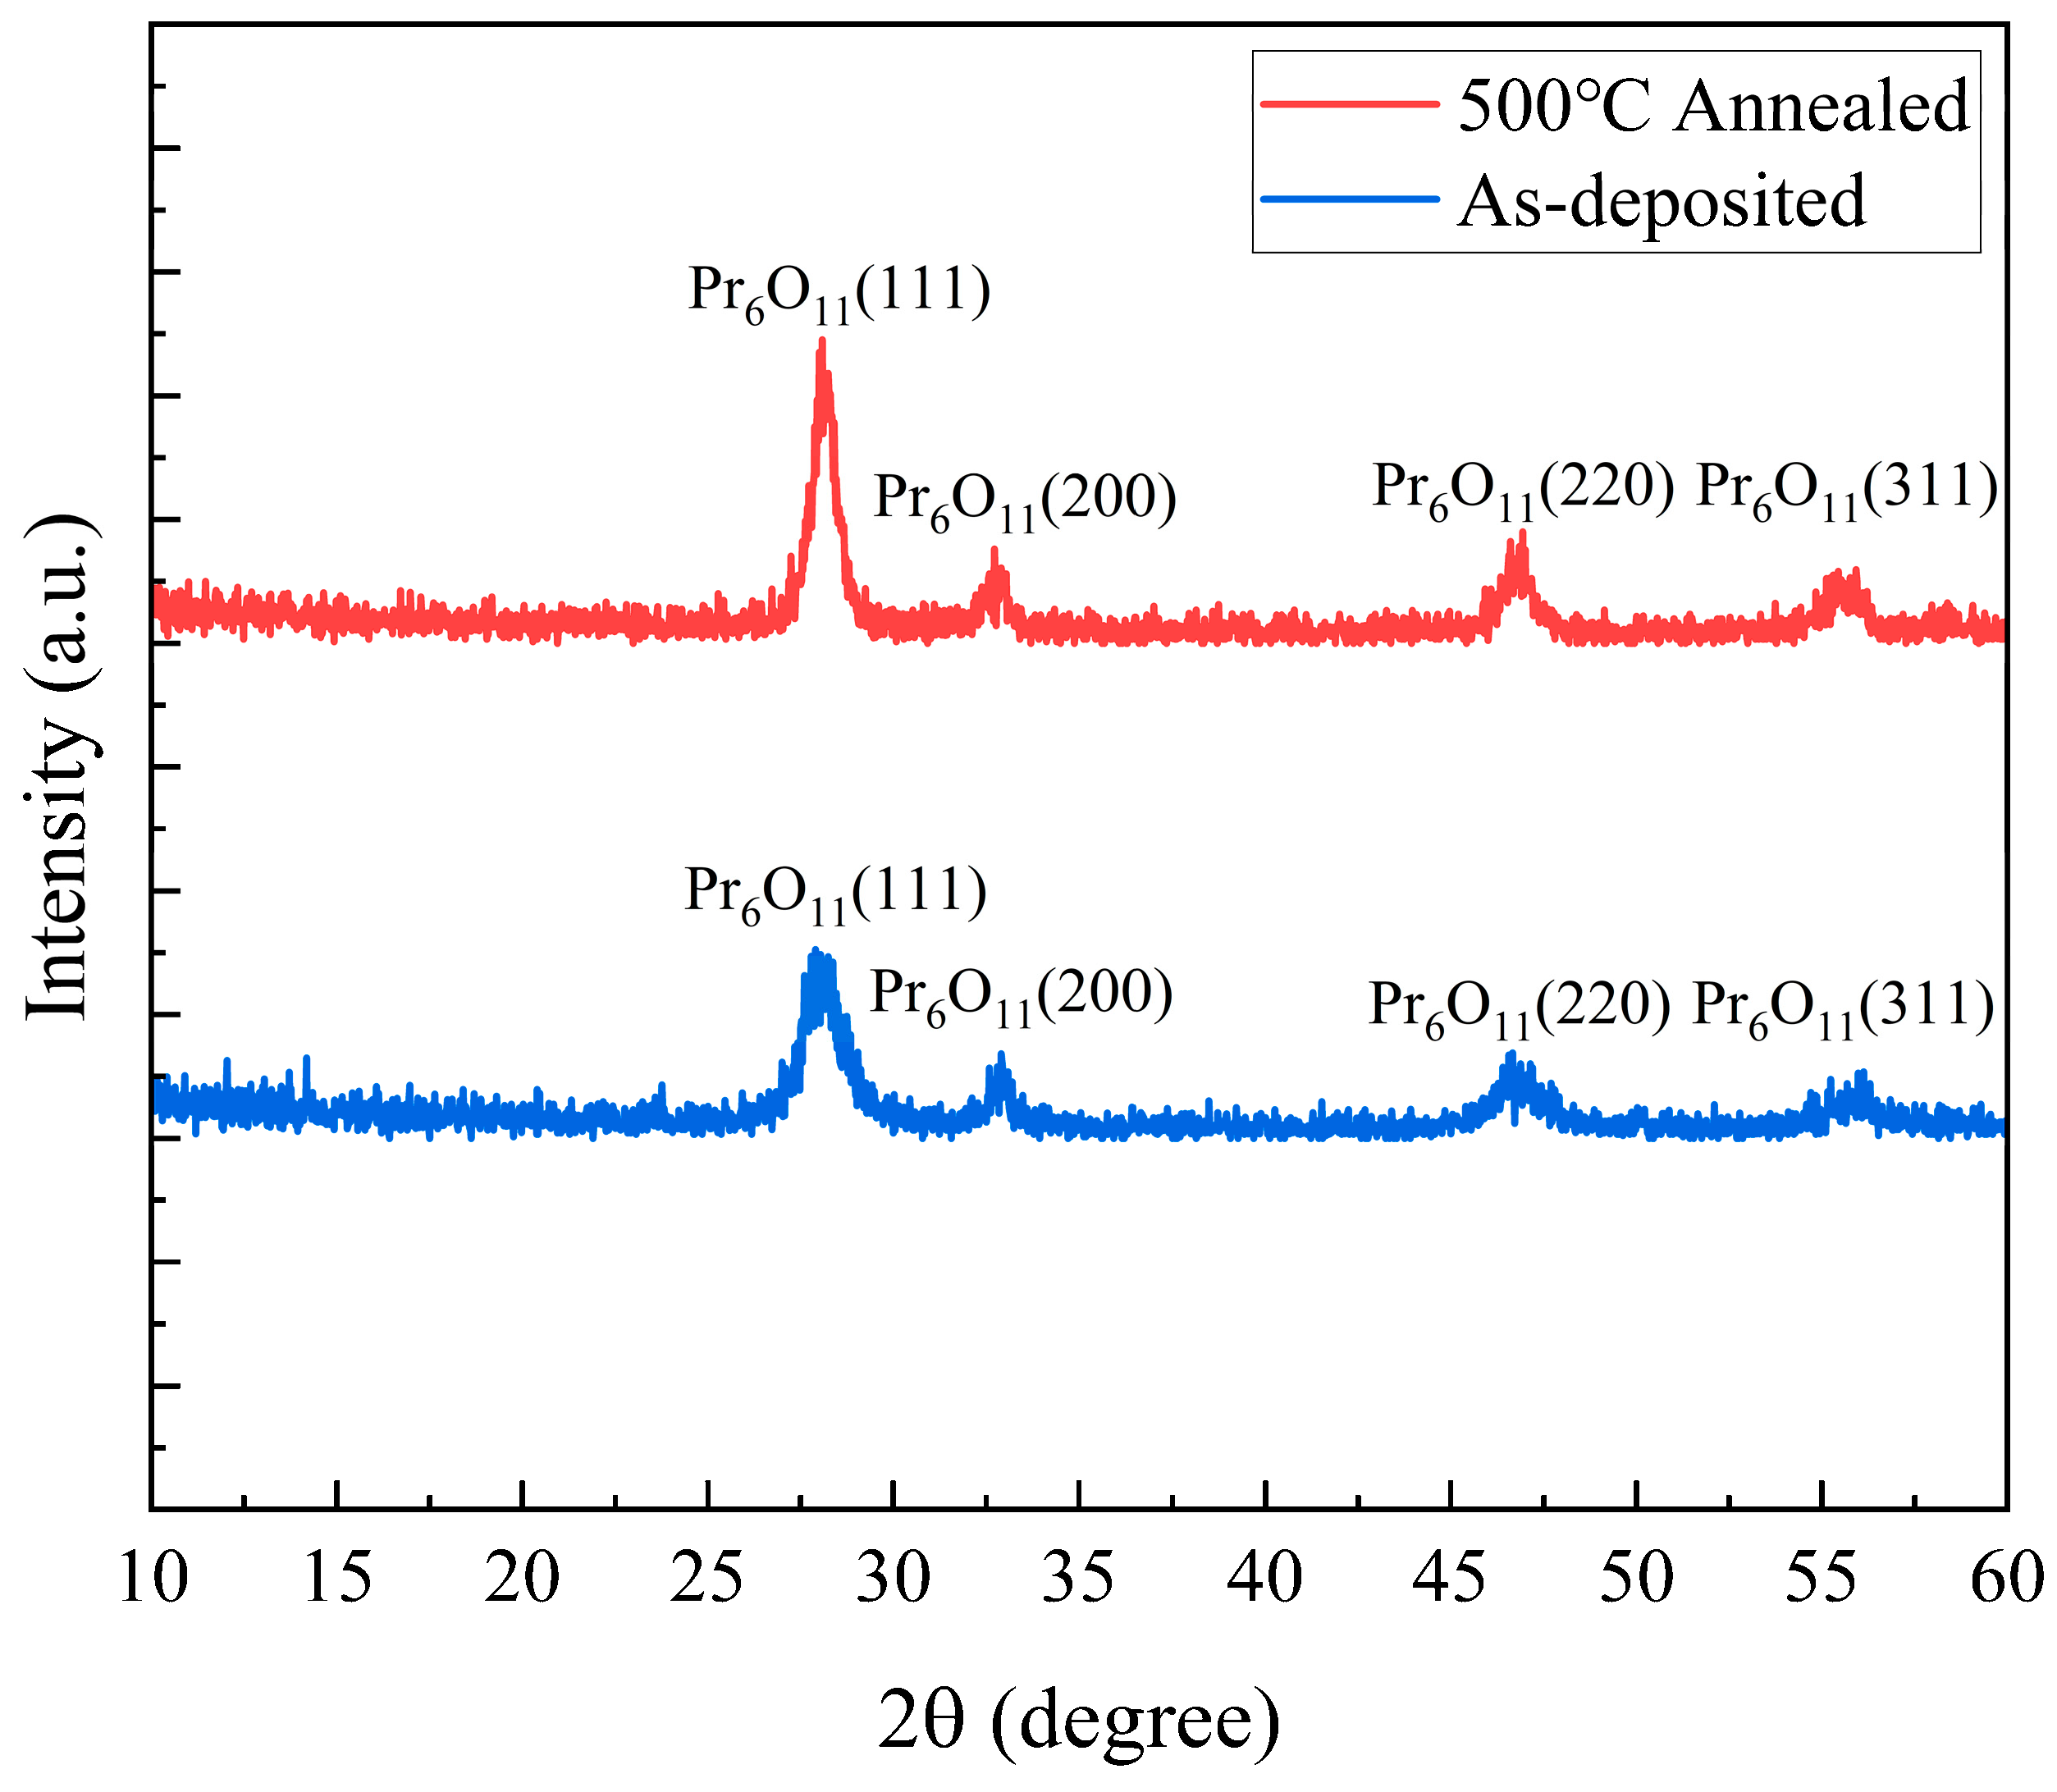
Figure 7.
Pr 3d XPS spectra of PrOx Thin Films. (a) 500℃ 1hr Annealed, (b) As-deposited.
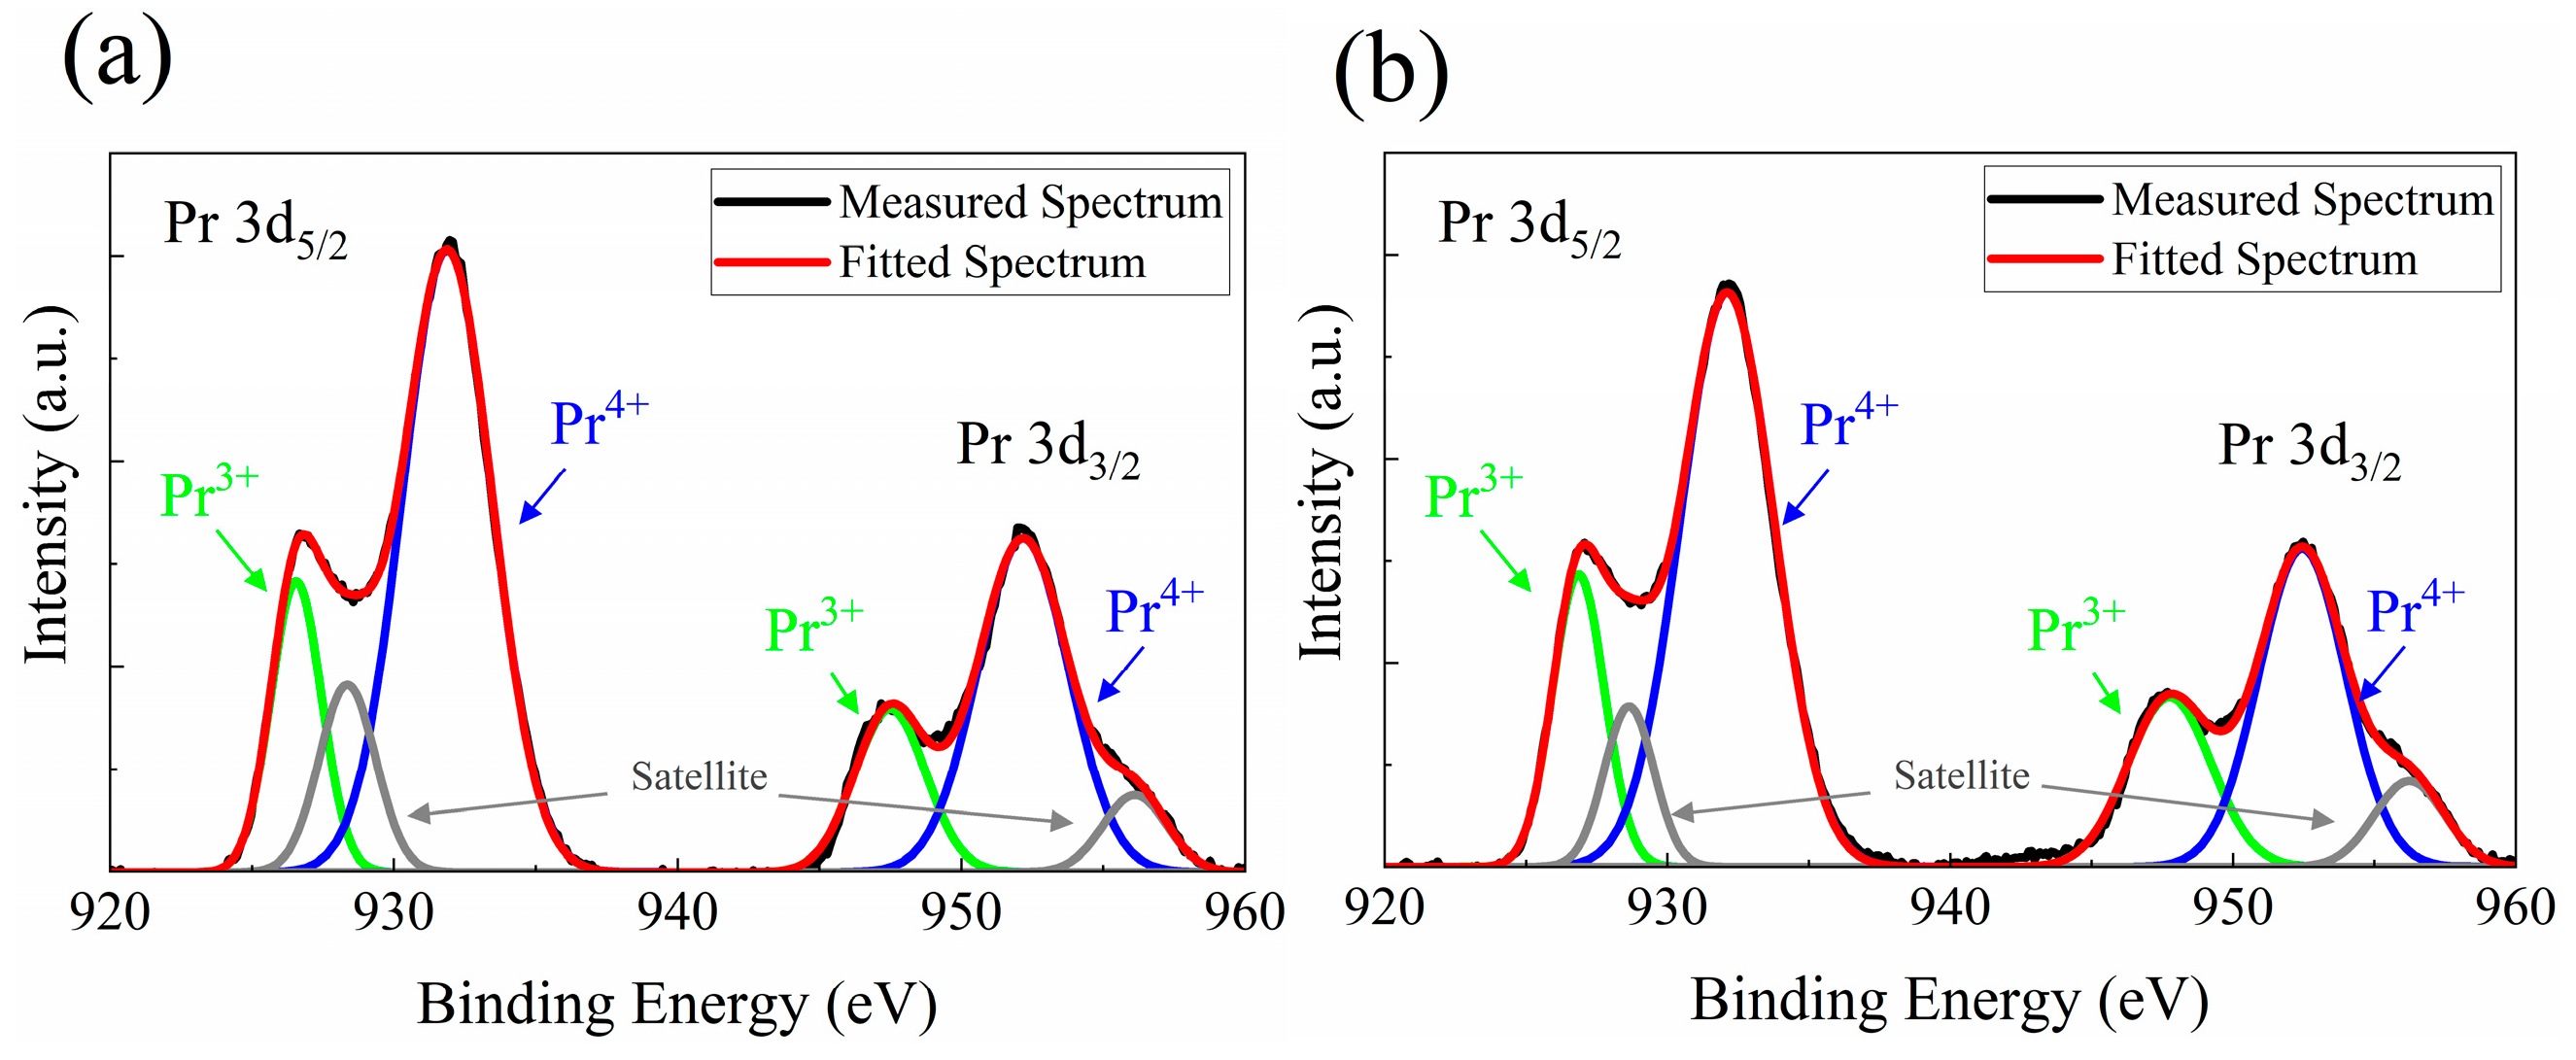
Figure 8.
(a) j-V-P curves and (b) Maximum Power Density.
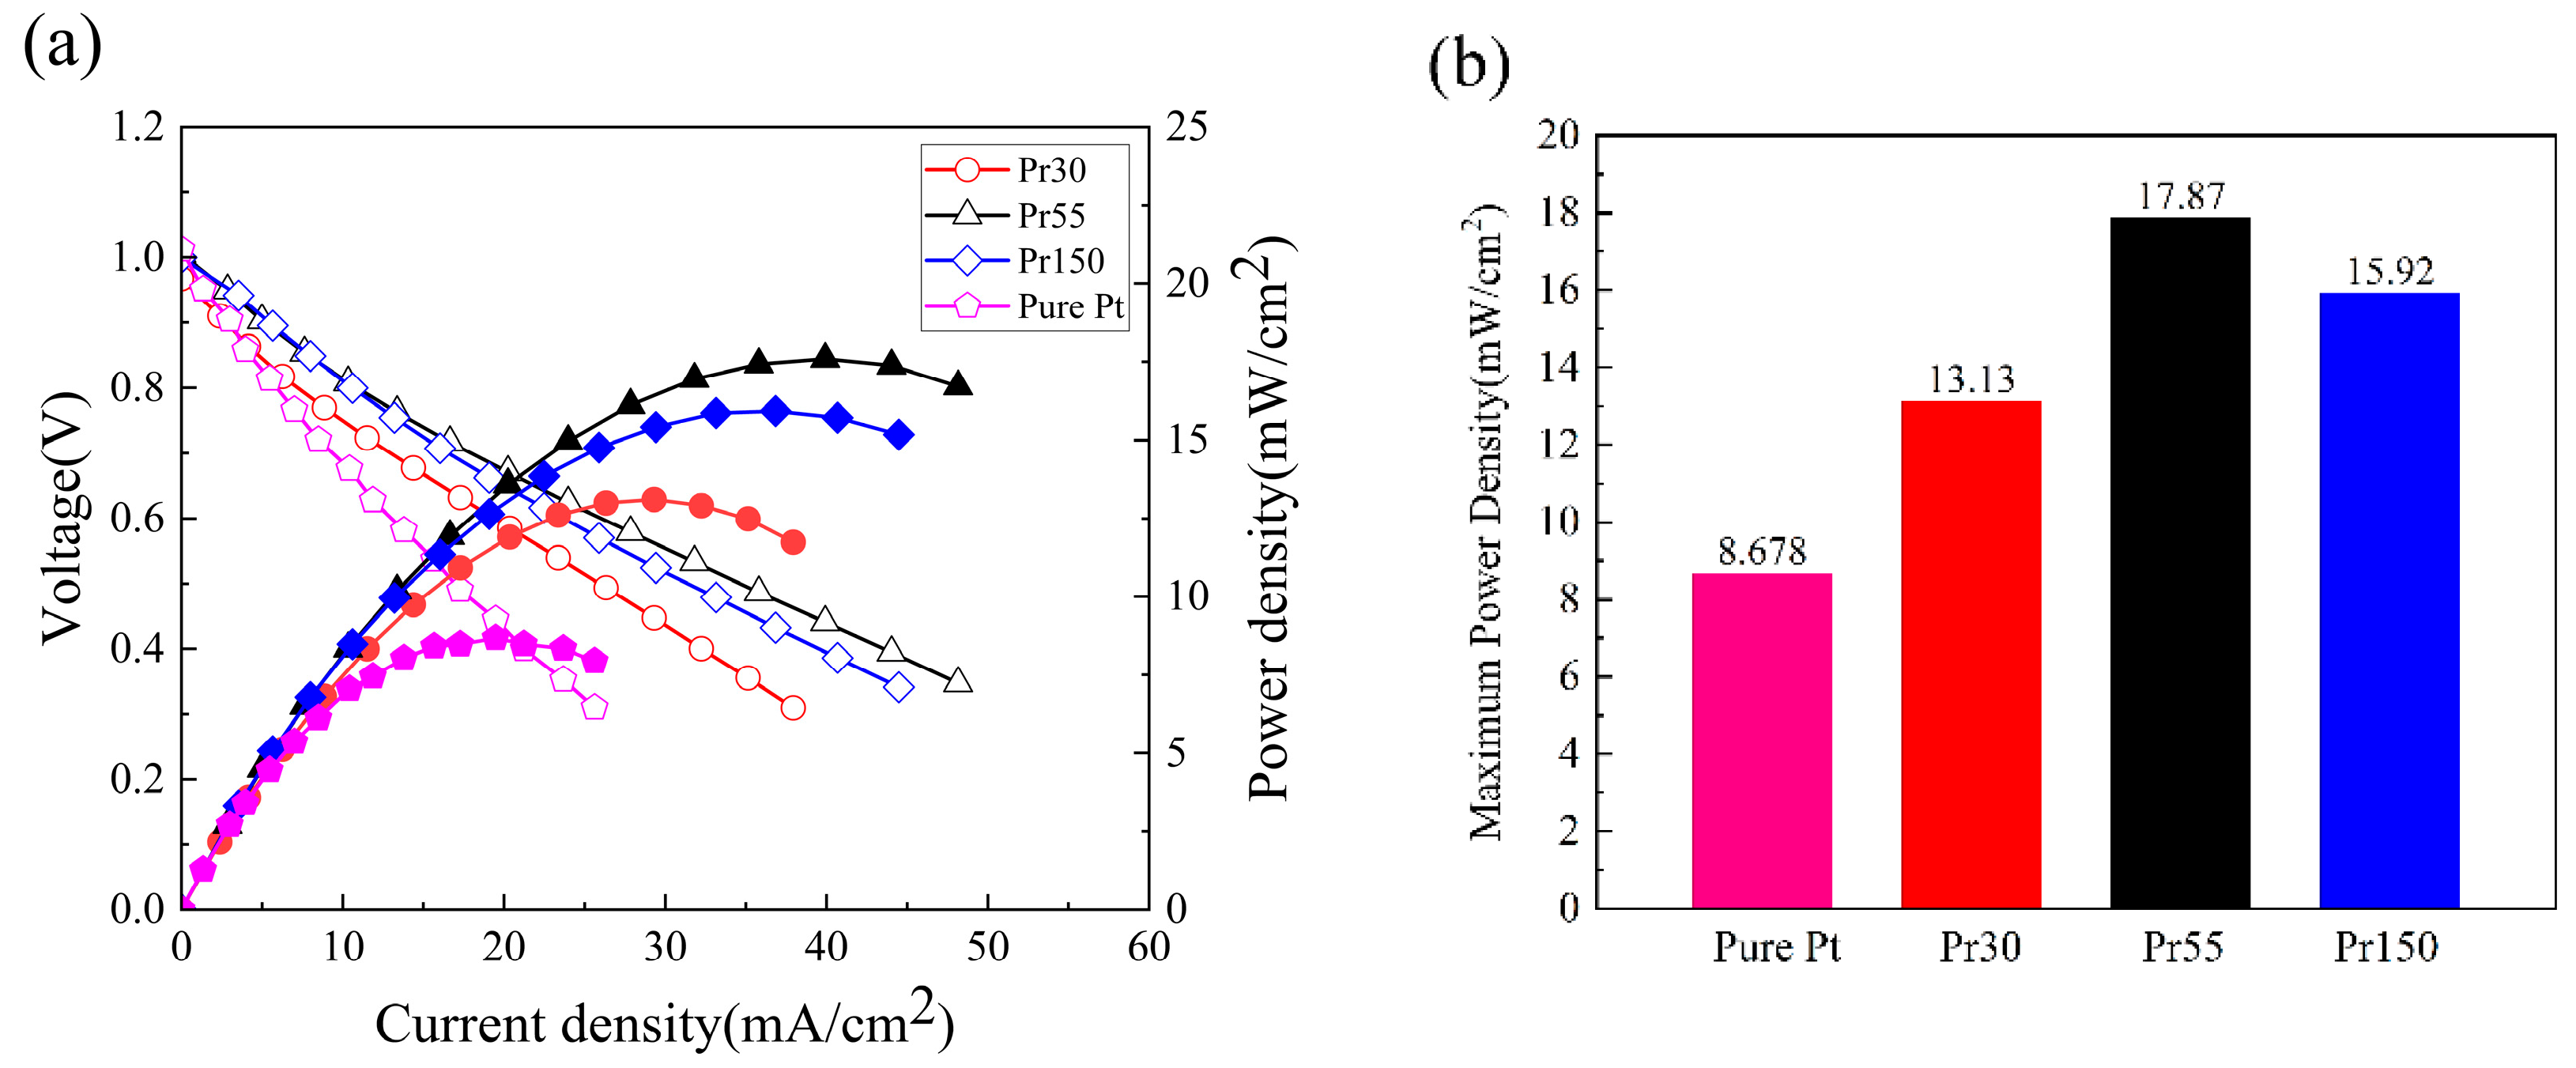
Figure 9.
(a) EIS Curves at 0.5 V (b) Magnitude of Ohmic and Activation Resistance.
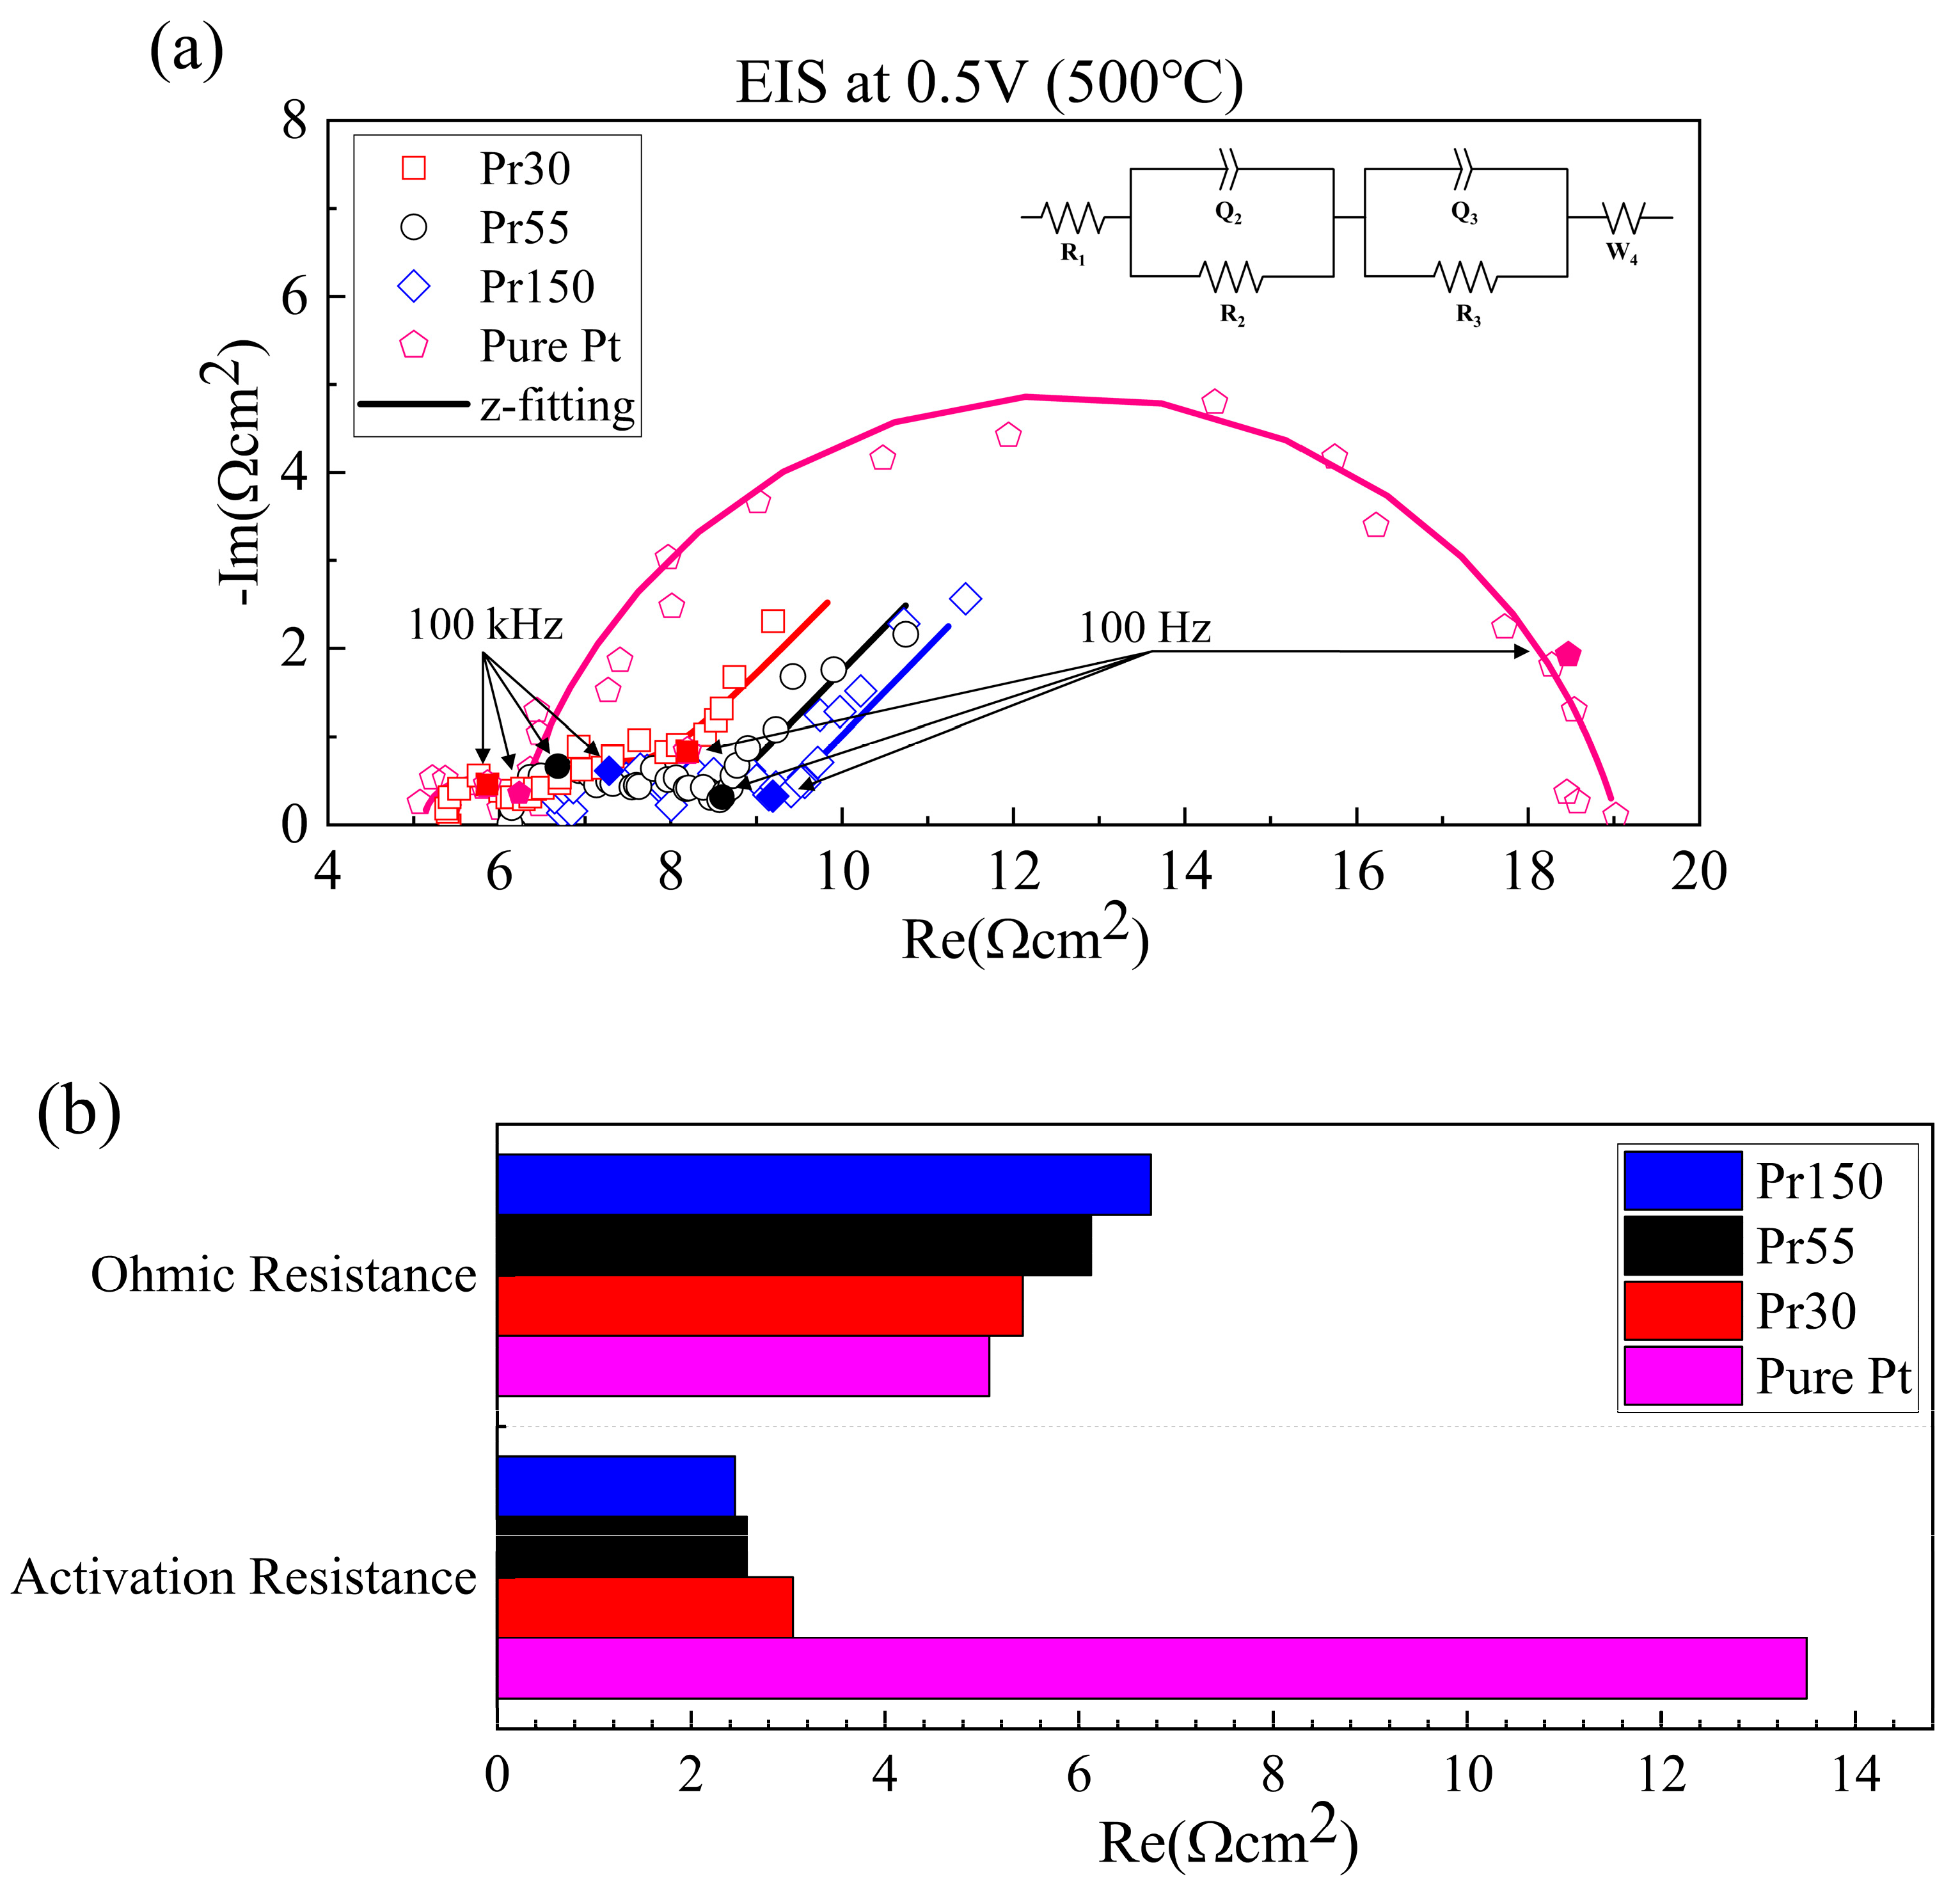
Table 2.
The chemical composition ratio of Pr3+ and Pr4+.
| 500℃ 1hr Annealed | As-deposited | |
| Pr3+ | 23.36 % | 26.52 % |
| Pr4+ | 76.64 % | 73.48 % |
Disclaimer/Publisher’s Note: The statements, opinions and data contained in all publications are solely those of the individual author(s) and contributor(s) and not of MDPI and/or the editor(s). MDPI and/or the editor(s) disclaim responsibility for any injury to people or property resulting from any ideas, methods, instructions or products referred to in the content. |
© 2024 by the authors. Licensee MDPI, Basel, Switzerland. This article is an open access article distributed under the terms and conditions of the Creative Commons Attribution (CC BY) license (http://creativecommons.org/licenses/by/4.0/).
Copyright: This open access article is published under a Creative Commons CC BY 4.0 license, which permit the free download, distribution, and reuse, provided that the author and preprint are cited in any reuse.


