
Submitted:
12 December 2024
Posted:
12 December 2024
You are already at the latest version
Abstract
Harnessing solar energy offers a sustainable alternative for powering electrolysis for green hydrogen production as well as wastewater treatment. High costs and logistical challenges of electrolysis have limited widespread investigation and implementation of electrochemical technologies on an industrial scale. To overcome these challenges this study designs and tests a new approach to chemical experiments and wastewater treatment research using a portable stand-alone open-source solar photovoltaic (PV)-powered station that can be located onsite at a wastewater treatment plant with unreliable electrical power. The experimental system is equipped with an energy monitoring data acquisition system. In addition, sensors enable real-time monitoring of gases: CO, CO₂, CH₄, H₂, H₂S, and NH₃, along with temperature, humidity, and volatile organic compounds, enhancing safety during electrochemical experiments on wastewater, which may release hazardous gases. SAMA software was used to evaluate energy-sharing scenarios under different grid-connected conditions and the system can operate off the power grid for 98% of the year in Ontario, Canada. The complete system has been tested utilizing a laboratory-scale electrolyzer (electrodes of SS316L, Duplex 2205, titanium grade II and graphite) with electrolyte solutions of potassium hydroxide, sulfuric acid and also secondary wastewater effluent. The electrolytic cell specifically developed for testing electrode materials and wastewater showed a Faraday efficiency up to 95% and an energy efficiency of 55% at STP demonstrating the potential for use of this technology in future work.
Keywords:
solar photovoltaic
; electrolysis
; electrochemistry
; environmental sensor
; water treatment
; portable station
; electrode material
1. Introduction
The application of electrolysis and electrochemistry in wastewater treatment presents a novel and promising opportunity [1]. Electrochemistry, particularly in wastewater, is being explored as a treatment targeting recalcitrant pollutants [2,3]. Electrolysis, on the other hand, is attracting attention as a green and sustainable method to produce hydrogen, and if applied to wastewater could simultaneously provide treatment of conventional pollutants it, representing a great opportunity [4,5]. This approach aligns with global efforts to develop environmentally friendly technologies that address both energy production and water management challenges [6,7]. By harnessing renewable energy to power electrolysis [6], wastewater electrolysis could offer a more economical and sustainable alternative for green hydrogen production compared to traditional methods [8], [9]. Moreover, it is well known how the use of gas produced in electrolysis (hydrogen and oxygen) can be used to meet oxygen demand associated with aerobic treatment and hydrogen can directly combusted or be biologically converted to methane, providing a fuel source of heat and power; representing 50-60% of the plant's energy costs [10,11]. Chemical reactions using wastewater instead of more common electrolytes such as potassium hydroxide (KOH) or sulfuric acid (H2SO4) can lead to the production of hazardous gases beyond hydrogen and oxygen, making this approach a subject of ongoing research [12,13]. As an emerging field, however, electrolysis for wastewater treatment remains underexplored [8], and requires intensive research to understand its full capabilities, efficiency, and scalability [14], [15]. The dual benefit of wastewater treatment and hydrogen generation positions electrolysis as a potentially extremely useful technology for future development [8,9].
Despite the potential of wastewater electrolysis, significant barriers remain in advancing research and experimentation in this field. Conducting experiments and in-depth research demand substantial financial resources and time, both of which are frequently limited in scientific endeavors [16,17]. Under-resourced laboratories in developing and developed countries alike are challenged by access to scientific hardware [18]. Additionally, the geographical distance between research facilities and field locations where wastewater samples or operational conditions exist can further complicate experimentation [16]. Transporting materials, equipment, and personnel to and from these sites incurs additional costs and logistical challenges, which can delay research progress and hinder real-time experimentation [17,19]. Addressing these challenges requires innovative solutions that can bring laboratory technologies closer to the field, reducing costs and improving efficiency in the research process.
To solve these issues this research proposes a new approach to chemical experiments for wastewater treatment research using a solar photovoltaic (PV)-powered station which can be placed directly in the wastewater treatment plant or anywhere it is needed. This design will follow best practices in open hardware [20,21], which has been proven to substantially reduce capital costs [22]. The open hardware design aims to harness solar energy and use it for powering research experiments in locations that either do not have access to power or access to reliable power.
To develop a portable chemical system, an off-grid PV system was designed, incorporating an inverter, AC/DC converter, and battery to ensure a reliable power supply for the experiments conducted within the photovoltaic box. This system is equipped with an energy-monitoring data acquisition system, as well as sensors that continuously track environmental and chemical parameters [23]. Data from these sensors are logged onto an SD card for subsequent analysis. To enhance energy resilience, minimize energy wastage, and reduce dependency on battery backup in locations with poor grid connectivity, a detailed simulation model of the PV system was developed using the open-source PV optimization software SAMA (Solar Alone Multi-objective Advisor) [24]. This model evaluates various energy-sharing scenarios with the grid, alongside the PV system performance under different grid-connected conditions. The complete setup has been rigorously tested through a series of wastewater treatment experiments utilizing a laboratory-scale electrolyzer.
2. Materials and Methods
2.1. Electrolyzer Apparatus
The experimental system (Figure 1) has been developed for testing electrodes of different materials, in forms of ½ inch rods, 13 unified national coarse (UNC) of 20 cm of length. The system was designed to test common electrolyte solutions as well as wastewater from different parts of the wastewater treatment plant. Electrode materials selected include stainless steel 316L, duplex 2205, titanium grade II and graphite (Figure 2). Initial material choices have been informed by their use in literature reports, availability on the market and price [25,26,27]. To accommodate different types of liquid matrices with different viscosity and particulate loads, the electrodes have been placed 3 cm apart to avoid clogging. An adjustable DC bench power supply PSC-6932 (Circuit Test Electronics, British Columbia, Canada), working in a range 0-0.1-32V and 0-0.1-30A has been included to ensure flexibility in electrolysis experiments. Econ TD peristaltic pumps (Stenner Pump Company, Florida, USA) are employed to facilitate water recirculation within the vessels during experiments. Additionally, LZB-3WB flowmeters (Shanghai Cixi, China) are installed downstream of the silica drier to measure gas flow generated during electrolysis, with a measurement range of 0 to 300 mL/min. The vessels are 1.8 L each, although only 1 L of solution is used in each experiment. This quantity has been selected considering a surface area of 100 cm², allowing the system to achieve a maximum current density of up to 300 mA/cm² with adequate submersion of the electrode rods in the electrolyte solution.
2.2. Electrical Load Consideration
The system load considering all electrical components (Table 1) is supplied by solar panels and if needed supported by a grid connection. For each electrolyzer, 40 W of consumption is estimated, considering they are made from 1 cell each working mostly in a steady-state condition. Various working scenarios have been considered, defining hourly datasets for 1 year of operation. All data and designs are available on the Open Science Framework [28].
The scenarios examined in this investigation considered a working load focused on 8 h work (9 am to 5 pm) from Monday to Friday. One scenario addresses the system being completely off-grid with energy supplied by solar panels a second scenario considers connecting the to the power grid if power supply would be needed [28]. The load dataset has been studied on open-source software Solar Alone Multi-objective Advisor for sizing the photovoltaic panels [24].
2.3. Photovoltaic Box Design and Implementation
The photovoltaic system (PV-box) has been designed (Figure 2) as a mobile workstation on 6 wheels able to support up to 500 kg [28]. The chassis (Figure 2a) has been constructed of aluminum extrusion 3030 of 2.05 m x 1.85 m x 1.05 m (LxWxH) with angle brackets to maintain structure rigidity. On the long sides of the PV-box, 3 bifacial solar panels LG400N2T-J5 (LG Electronics USA, USA) have been installed in integrated cladding. With 72 cells (6x12) the panels can supply up to 400 W each for a total of 1.2 kW. The panels on the sides are designed to rotate and open, providing easy access to the workstation. Supported by four hinges, the panels can rotate to an angle of 34° (Figure 2c), which is the optimal tilt angle for solar radiation in London ON, where the PV-box has been designed and implemented [28].
While designing the system, wind load has been considered for the scenario when the system is closed under remote operations. The PV-box in its closed state was considered with a uniform weight distribution and the wind load over the largest surface area (PV panel of 2m2). These calculations consider the size and weight of the structure, to determine the maximum sustainable wind speed, with and without ground cables. The weight of the structure was estimated at 250 ±10 kg [28]. Equations 1 and 2 were used to calculate the turning moment of the structure; equalizing these equations allows calculation of the maximum wind speed which balances the two forces (Equation 4) [30].
The wind speed limit (V) is equal to 28 m/s (100.8 km/h) which requires adding 2 metal cables to attach the structure to the ground to hold possible wind speeds up to 140 km/h, as shown in Table 2.
The PV system wiring configuration is shown in Figure 4, with the system voltage set at 24V. Two independent maximum power point tracking (MPPT) controllers were utilized: a 30A-rated controller was connected to one of the side PV panels and the roof-mounted PV panel, and another 20A-rated controller was connected to the remaining side panel, both feeding into the DC bus. A 24V, 1.2kVA inverter provides 120V, 60Hz AC power for the AC-DC converter, sensors, pumps, and auxiliary components. Electrical protection of the system has been implemented placing circuit breakers (CB) and fuses as shown in Figure 4. The system performance, including PV power generation and total power consumption, was continuously monitored and logged using a Cerbo GX, a proprietary data logging and monitoring system from Victron Energy (Almere, Netherlands) [31]. The Cerbo GX communicates with both MPPT controllers and the inverter, all manufactured by Victron, via VE. Direct connections indicated using green lines, ensuring seamless data transfer and system integration. A meteorological weather station WS501-UMB (Lufft, Germany) installed close to the testing station has been placed to gather the irradiance data [32].
2.4. Environmental Sensor
The environmental monitoring system incorporates multi-gas sensors, temperature and humidity monitoring, data logging, and alert mechanisms. The schematic of the system, designed in KiCad and includes the full circuit layout [28]: an Arduino Nano Every as the main controller, various sensors, graphical user interface (GUI) components, and supporting circuitry [28]. Key components include an SCD41 sensor for temperature, humidity, and CO₂ measurements [33], an ENS160 sensor for air quality index (AQI) [34], volatile organic compounds (VOCs), and eCO₂, along with multiple MQ-series gas sensors (MQ-8 for H₂ [35], MQ-136 for H₂S [36], MQ-137 for NH₃ [37], and MQ-9B for CO and CH₄) [38] . The MQ-series sensors present an average measuring error < 5% [39], the sensors SCD41 and ENS160 have 5 and 12%, respectively [33,34]. Additional circuitry drives the MQ sensor heaters, enables audio-visual alarms, logs timestamped data, and displays real-time information. The straightforward GUI comprises an LCD screen, a push button for scrolling through parameters, an RGB LED for status indication, and a piezo buzzer for alarms. Designed for modularity and serviceability, the board is mechanically robust and reliable, with headers and standoffs securing all components (Figure 5). The monitor is housed in a custom-fit 3D-printed PETG enclosure, manufactured with a 0.8mm nozzle on a RepRap class [40,41] fused filament fabrication-based 3D printer (Prusa MK3S+, Prusa Research, Czech Republic)and optimized for support-free printing.
2.5. Preliminary Tests
Preliminary tests were conducted to assess the electrical behavior to demonstrate feasibility of the experimental station. Potassium peroxide and sulfuric acid were used as electrolytes because of their common use for this application [42,43]. Tests were conducted at standard temperatures and pressure (STP) with a molarity concentration of 0.5 mol/L and 1 mol/L. During experiments, temperature and gas flow were monitored, and the full range of the adjustable power supply was tested to assess system performance.
Filtered, secondary effluent (post-sand clarification) from the Ilderton, ON wastewater treatment plant, were tested using various electrodes to demonstrate feasibility of the testing station for wastewater experiments
3. Results
3.1. Load Simulations
The load simulations on SAMA showed different results between a complete stand-alone solution and a grid-supported solution. Using weather data from London, ON, the software optimizes the system with 5 kWh of batteries alongside a 1.2kW PV panel to supply 810 kWhr over an annual load of 824 kWhr with an annual capacity shortage of only 14 kWhr (1.67%). Figure 6a,b show the batter state of charge (SOC) and monthly load supply which highlights an energy surplus which could be used for other experiments. Figure 6c and Figure 6d show the interconnection between the PV-box and the grid throughout the year. Over the total amount of energy in this scenario, 91.2% of the energy is renewable with only 8.8 % (176 kW) supplied by the grid.
3.2. PV-Box Implementation
The PV-box prototype is shown in Figure 7 with the side panels closed and open. The system supported wind loads up to 50 km/h without any visible issues or instability; and in case of rain, the system remained dry and protected the system from water damage. Figure 7c shows photos of the system components; the electrolyzer is located on the left side with open doors, allowing easy access to the workspace. The electrical components are placed on the right side with the protection equipment (circuit breakers, fuses and busbar) on the side wall with the MPPTs, the Cerbo GX, the fan, and the environmental sensor. The prototype is equipped with ceiling-mounted LED lights and a Raspberry Pi-powered 7'' touchscreen for accessing the Victron remote monitoring (VRM) portal. This supports real-time monitoring and display of data from the PV system, as well as real-time serial data from the environmental sensor box.
3.3. Load and Solar Data
Several trial runs were conducted to develop the performance curves related to the PV system’s energy production, the inverter output data, and the state of charge of the battery. Data shown in Figure 8 are from tests conducted on November 7th at Ilderton, ON. The irradiance data, Figure 8a, collected from the WS501-UMB sensor installed in loco has been plotted against the PV power generated. Data collected from the CerboGX demonstrates system performance on a clear, sunny day in southwest Ontario. With the battery pack initially fully charged, the PV panels supplied most of the load independently. As the day progressed and load increased (Figure 8b), the MPPTs shifted from float mode to bulk mode, supplying power while simultaneously charging the battery until it reached a fully charged state. Toward the end of the day, as irradiance decreased, the PV panels could no longer cover the entire load, causing a gradual discharge of the battery to make up for the energy shortfall. Nevertheless, the battery retained over 80% of its charge, ensuring it was prepared for operation the next day.
3.4. Environmental and Gas Concentration Monitoring Results
The environmental parameters and gas concentration data collected from the monitoring setup are presented in Figure 9. Figure 9a shows CO₂, temperature, humidity, and total VOC over an 8-hour period, with the average Air AQI provided as annotation. Because AQI is reported as a discrete integer from 1 to 5, its variability is not well-represented in a plot, thus, mean AQI is displayed to indicate general air quality. In Figure 9b, concentrations of key gases—hydrogen (H₂), hydrogen sulfide (H₂S), ammonia (NH₃), methane (CH₄), and carbon monoxide (CO)—are presented for the same monitoring period. These gases were measured using MQ-series gas sensors, where the analog output is processed on a microcontroller via exponential regression to convert readings to parts per million (ppm) concentrations. Given the analog nature and regression-based calibration of these sensors, substantial noise is inherent in the data. To improve clarity, a rolling mean with a window size of 30 data points (2 and half minutes interval) was applied to smooth the readings, reducing random fluctuations and allowing for clearer trend analysis over time.
3.5. Electrolyzer Preliminary Results
Preliminary results of electrochemical experiments are focused on differentiating electrical behavior of the materials. Figure 10 highlights that steel-based electrodes draw more current at the same voltage, resulting in higher gas production. In contrast, titanium showed very little current drawing and required higher voltages to initiate electrolysis; the flowmeter did not detect any gas flow with this electrode. The efficiency of each cell was measured, revealing differences and similarities among materials (Figure 11); specifically, SS316L and Duplex2205 electrodes demonstrated superior performance in alkaline conditions (KOH solution) compared to acidic conditions (H2SO4 solution). Graphite electrodes, however, showed consistent behavior in both environments. Data also indicate a significant drop in energy efficiency with increasing cell voltage. This trend results from the cell design, where the gap between the electrodes necessitates higher voltages to achieve elevated current levels.
Similar tests were performed on filtered, secondary wastewater effluent. Figure 12 shows, without spiking, different electrodes performed electrochemical reactions reaching over 1 A, even considering a low conductivity of 0.07 S/m.
4. Discussion & Future Work
These results validate the open-source portable chemical station which sustain electrochemical experiments using solar energy. Solar PV electricity production is the least expensive [44] and fastest-growing source of energy globally [45]. PV is also intrinsically distributed as an off-grid power source [46,47]. Companies like Allpowers (Allpower, USA) [48], Jackery (Jackery, USA) [49], Anker Solix (Anker Innovation, China) [50], are investing and currently offering portable solutions using small solar panels (<400 W) and a battery pack for easy deployment. Compared to these solutions, the open-source photovoltaic box proposed offers a compact solution with 1.2 kW of solar energy to be deployed and transported anywhere.
In wastewater treatment plants, solar panels are becoming an important part of making treatment more sustainable [51,52]. The use of electrochemical techniques is developing with most applications at research and laboratory scale [53]. To address the challenges of conventional energy sources, the proposed system, powered by renewable and eco-friendly alternatives is necessary [54].
Several companies offer modular laboratories, such as Boxx Modular (Black Diamond Group, Canada) or Modular Genius (Modular Genius, USA). They provide pre-fabricated solutions that can be deployed quickly but they cannot be relocated, and still require substantial footprint [55,56]. The open-source system, using solar energy, addresses the need for a portable chemical station for in situ testing, while saving time and reducing greenhouse gas emissions.
The environmental sensor, housed in a modular, low-cost, 3D-printed enclosure, is accessible, easy to maintain, and deploy. The MQ-series analog gas sensors, calibrated through exponential regression on a microcontroller can effectively classify air quality variations in different settings. Wang et al (2023) also highlighted how combing multiple gas sensors can improve sensitivity and reliability of gas analyses [57,58]. Similar approaches using MQ-sensors have been adopted in other applications proofing their effectiveness as low-cost sensors for environmental monitoring, and for safety in laboratories [59,60]. Beyond laboratory applications, the proposed system holds potential for field-based air quality assessments, industrial safety, and pollution monitoring. Future work could improve calibration, improve reliability, integrate artificial intelligence and IoT for real-time monitoring to enhance data interpretation, and add wireless capabilities [58,61].
The electrical efficiency of the electrolytic cell with different materials has demonstrated characteristics of the system. The single-cell alkaline electrolyzer showed a consistent Faraday efficiency of 85% with peaks of over 95% using KOH and H2SO4 solutions at 1 mol/L concentration. The energy efficiency, considering the gas production and power consumption reached 55% at room temperature (22 °C) in a less concentrated solution [62]. Figure 9b and 9d display a decreasing efficiency trend across all materials, aligning with the patterns observed by Park et al. [63]. This result is mostly due to increasing Ohmic resistance over the distance (3 cm) between electrodes, which is significant at higher voltages.
In terms of current densities, Chauhan et al. (2023) reached up to 100 mA/cm2 by spiking wastewater with sodium hydroxide (NaOH) and KOH, while the cell developed and materials adopted were able to reach up to 300 mA/cm2 using KOH and H2SO4 as electrolyte [8]. Huang et al. (2016) used current densities ranging from 0.39 to 2.4 mA/cm2, which was achieved in unmodified wastewater (12 mA/cm2 measured with SS316L electrode) showing potential and capabilities for wastewater treatment applications [15].
The system here has been designed for experimental treatments and chemical experiments with opportunities for optimization. The limitations of the PV-box can yet be optimized. For example, the angle of the panel openings are optimum for one side, but do not allow the full access to covered portion of the system and opening the side panel is necessary to capture more solar energy. Additionally, the portable laboratory can stand wind in a close and open modality, but it can only resist rainwater when closed, not allowing the lateral panels to open during precipitation to avoid electrical damage. While SAMA simulations suggest an improved scenario with the PV-box connected to the grid, Canada’s vehicle-to-grid (V2G) regulations are in early stages [64]. As a result, connecting the device to the grid remains challenging, especially given the PV-box mobility and varying grid regulations at different locations.
The PV-box and its setup is a unique and new open-source approach to research which brings together renewable energy and electrochemical experiments and monitoring wherever they are needed. Future work is needed to evaluate the system over a longer period and electrode materials should be tested on variable wastewater qualities to obtain a comprehensive understanding of how electrochemical treatment could be used. Having a glass jar containing the electrodes allows visualization of reactions at the anode and cathode; images and image analyses could enhance investigations of studies by elucidating water parameters such as turbidity, size of bubbles forming and corrosion [65,66].
5. Conclusions
The proposed, designed and tested system is a novel approach for testing electrochemical and electrolytic treatment with various materials and wastewater qualities using solar energy. This innovative, portable and adaptable solution is eco-friendly and mobile, making it deployable anywhere, allowing data to be generated from any wastewater system. This compact, mobile design is novel within the targeted field and offers easy deployment in remote and off-grid locations. Its self-sufficiency enables continuous operation for extended periods, making it an ideal solution for field-based research in isolated areas. As shown by SAMA simulations the PV capacity of 1.2 kW is able to supply 810 kWhr with an annual shortage of 1.67% using weather data from London Ontario. In case of being attached to the grid and not being able to rely on any battery pack, the PV-box is able to cover more than 91 % using solar energy. Test results show that even in November, the energy required for the system to operate 9 am to 5 pm can be provided directly from the PV or supported by the battery pack.
The electrolytic cell developed for testing various materials and wastewaters showed a Faraday efficiency of up to 95 % and an energy efficiency of 55 % at STP. With a secondary effluent conductivity of 0.07 S/m, the electrolyzer cell could draw 12 mA/cm2 at 22 °C indicating that additional future testing will be warranted. The open-source environmental sensor integrated into the system enables real-time monitoring of product gasses (CO, CO₂, CH₄, H₂, H₂S, and NH₃) along with temperature, humidity, and volatile organic compounds (VOCs). This capability enhances safety during electrochemical experiments on wastewater, which may release hazardous gases. Controlling the air temperature combining the environmental sensor and the air fan, and adjusting the electrical load for electrolyzer through the adjustable power supply, the system is suitable and for remote-controlled tests
In conclusion, its flexibility and adaptability make it suitable for a wide range of scenarios and applications, in wastewater treatment and monitoring. The system is well-suited for industrial settings where small-scale pilot studies are needed before implementing full-scale systems. It could provide a robust tool for disaster relief and emergency response where access to clean water and energy is compromised; it could serve as a mobile laboratory for educational institutions, promoting hands-on learning. In each of these scenarios, the system portability, adaptability, and solar-powered design allow it to operate independently, making it a versatile tool for sustainable field research, testing, and treatment across a diverse array of fields.
Supplementary Materials
The supporting materials, data repositories, schematics and source code for this study is available on the Open Science Framework: https://osf.io/fbdgc/.
Author Contributions
Conceptualization, G.A. and J.M.P; methodology, G.A. and M.M.R.; hardware, G.A., M.M.R. and C.B.: validation, G.A., M.M.R and C.B.; data curation, G.A. and M.M.R.; resources, J.M.P. and D.S.; writing-original draft preparation, G.A.; writing-review and editing, M.M.R., J.M.P, C.B., C.M. and D.S.; supervision, J.M.P and D.S.; project administration, J.M.P; funding acquisition, J.M.P and D.S. All authors have read and agreed to the published version of the manuscript.
Funding
This study was supported by the Thompson Endowment and The Natural Sciences and Engineering Research Council of Canada.
Institutional Review Board Statement
Not applicable.
Informed Consent Statement
Not applicable.
Data Availability Statement
The supporting materials, data repositories, schematics and code is available: https://osf.io/fbdgc/.
Conflicts of Interest
The authors declare no conflicts of interest. The funders had no role in the design of the study; in the collection, analyses, or interpretation of data; in the writing of the manuscript; or in the decision to publish the results.
References
- Lee, J.; Antonini, G.; Pearce, J.M.; Al-Omari, A.; Santoro, D. Electrochemical Methods for Nutrient Removal in Wastewater: A Review of Advanced Electrode Materials, Processes, and Applications. Sustainability 2024, 16, 9764. [Google Scholar] [CrossRef]
- Das, P.P.; Sharma, M.; Purkait, M.K. Recent Progress on Electrocoagulation Process for Wastewater Treatment: A Review. Separation and Purification Technology 2022, 292, 121058. [Google Scholar] [CrossRef]
- Shahedi, A.; Darban, A.K.; Taghipour, F.; Jamshidi-Zanjani, A. A Review on Industrial Wastewater Treatment via Electrocoagulation Processes. Current Opinion in Electrochemistry 2020, 22, 154–169. [Google Scholar] [CrossRef]
- Gil-Carrera, L.; Escapa, A.; Mehta, P.; Santoyo, G.; Guiot, S.R.; Morán, A.; Tartakovsky, B. Microbial Electrolysis Cell Scale-up for Combined Wastewater Treatment and Hydrogen Production. Bioresource Technology 2013, 130, 584–591. [Google Scholar] [CrossRef]
- Katuri, K.P.; Ali, M.; Saikaly, P.E. The Role of Microbial Electrolysis Cell in Urban Wastewater Treatment: Integration Options, Challenges, and Prospects. Current Opinion in Biotechnology 2019, 57, 101–110. [Google Scholar] [CrossRef]
- Kollmann, R.; Neugebauer, G.; Kretschmer, F.; Truger, B.; Kindermann, H.; Stoeglehner, G.; Ertl, T.; Narodoslawsky, M. Renewable Energy from Wastewater - Practical Aspects of Integrating a Wastewater Treatment Plant into Local Energy Supply Concepts. Journal of Cleaner Production 2017, 155, 119–129. [Google Scholar] [CrossRef]
- Maktabifard, M.; Zaborowska, E.; Makinia, J. Achieving Energy Neutrality in Wastewater Treatment Plants through Energy Savings and Enhancing Renewable Energy Production. Rev Environ Sci Biotechnol 2018, 17, 655–689. [Google Scholar] [CrossRef]
- Chauhan, D.; Ahn, Y.-H. Alkaline Electrolysis of Wastewater and Low-Quality Water. Journal of Cleaner Production 2023, 397, 136613. [Google Scholar] [CrossRef]
- Mohammadpour, H.; Cord-Ruwisch, R.; Pivrikas, A.; Ho, G. Utilisation of Oxygen from Water Electrolysis – Assessment for Wastewater Treatment and Aquaculture. Chemical Engineering Science 2021, 246, 117008. [Google Scholar] [CrossRef]
- Hamawand, I. Energy Consumption in Water/Wastewater Treatment Industry—Optimisation Potentials. Energies 2023, 16, 2433. [Google Scholar] [CrossRef]
- Tartakovsky, B.; Mehta, P.; Bourque, J.-S.; Guiot, S.R. Electrolysis-Enhanced Anaerobic Digestion of Wastewater. Bioresource Technology 2011, 102, 5685–5691. [Google Scholar] [CrossRef] [PubMed]
- Simoes, S.G.; Catarino, J.; Picado, A.; Lopes, T.F.; di Berardino, S.; Amorim, F.; Gírio, F.; Rangel, C.M.; Ponce de Leão, T. Water Availability and Water Usage Solutions for Electrolysis in Hydrogen Production. Journal of Cleaner Production 2021, 315, 128124. [Google Scholar] [CrossRef]
- Kobayashi, T.; Hirose, J.; Sano, K.; Hiro, N.; Ijiri, Y.; Takiuchi, H.; Tamai, H.; Takenaka, H.; Tanaka, K.; Nakano, T. Evaluation of an Electrolysis Apparatus for Inactivating Antineoplastics in Clinical Wastewater. Chemosphere 2008, 72, 659–665. [Google Scholar] [CrossRef] [PubMed]
- Baeza, J.A.; Martínez-Miró, À.; Guerrero, J.; Ruiz, Y.; Guisasola, A. Bioelectrochemical Hydrogen Production from Urban Wastewater on a Pilot Scale. Journal of Power Sources 2017, 356, 500–509. [Google Scholar] [CrossRef]
- Huang, X.; Qu, Y.; Cid, C.A.; Finke, C.; Hoffmann, M.R.; Lim, K.; Jiang, S.C. Electrochemical Disinfection of Toilet Wastewater Using Wastewater Electrolysis Cell. Water Research 2016, 92, 164–172. [Google Scholar] [CrossRef]
- Ramsey, M.H. Challenges for the Estimation of Uncertainty of Measurements Made in Situ. Accred Qual Assur 2021, 26, 183–192. [Google Scholar] [CrossRef]
- Li, B.; Ou, L.; Dang, Q.; Meyer, P.; Jones, S.; Brown, R.; Wright, M. Techno-Economic and Uncertainty Analysis of in Situ and Ex Situ Fast Pyrolysis for Biofuel Production. Bioresource Technology 2015, 196, 49–56. [Google Scholar] [CrossRef]
- Maia Chagas, A. Haves and Have Nots Must Find a Better Way: The Case for Open Scientific Hardware. PLoS Biol 2018, 16, e3000014. [Google Scholar] [CrossRef]
- Allahverdi, A. The Third Comprehensive Survey on Scheduling Problems with Setup Times/Costs. European Journal of Operational Research 2015, 246, 345–378. [Google Scholar] [CrossRef]
- Gibb, A. Building Open Source Hardware: DIY Manufacturing for Hackers and Makers; Addison-Wesley Professional, 2014; ISBN 978-0-13-337390-5.
- Oberloier, S.; Pearce, J.M. General Design Procedure for Free and Open-Source Hardware for Scientific Equipment. Designs 2018, 2, 2. [Google Scholar] [CrossRef]
- Pearce, J.M. Economic Savings for Scientific Free and Open Source Technology: A Review. HardwareX 2020, 8, e00139. [Google Scholar] [CrossRef] [PubMed]
- Hafting, F.; Kulas, D.; Michels, E.; Chipkar, S.; Wisniewski, S.; Shonnard, D.; Pearce, J. Modular Open-Source Design of Pyrolysis Reactor Monitoring and Control Electronics. Electronics 2023, 12, 4893. [Google Scholar] [CrossRef]
- Sadat, S.A.; Pearce, J.M. SAMA (Solar Alone Multi-Objective Advisor). 2023. [Google Scholar] [CrossRef]
- Wissler, M. Graphite and Carbon Powders for Electrochemical Applications. Journal of Power Sources 2006, 156, 142–150. [Google Scholar] [CrossRef]
- Kovendhan, M.; Kang, H.; Jeong, S.; Youn, J.-S.; Oh, I.; Park, Y.-K.; Jeon, K.-J. Study of Stainless Steel Electrodes after Electrochemical Analysis in Sea Water Condition. Environmental Research 2019, 173, 549–555. [Google Scholar] [CrossRef]
- Chen, G. Electrochemical Technologies in Wastewater Treatment. Separation and Purification Technology 2004, 38, 11–41. [Google Scholar] [CrossRef]
- PV-Box Repository Available online: https://osf.io/fbdgc/.
- National Renewable Energy Laboratory (NREL) Home Page Available online:. Available online: https://www.nrel.gov/index.html (accessed on 7 September 2024).
- Mohammed, G.; Messerman, A.; Mayhan, B.; Trauth, K. Theory and Practice of the Hydrodynamic Redesign of Artificial Hellbender Habitat. Herpetological Review 2016, 47, 586–591. [Google Scholar]
- Victron Energy Available online:. Available online: https://www.victronenergy.com/ (accessed on 12 November 2024).
- Corporation, G.S. German Solar Corporation Available online:. Available online: https://germansolarcorp.com/ (accessed on 12 November 2024).
- 2024.
- 2024.
- Wins MQ8 - v1. 2024.
- Winsen MQ136 - v1. 2024.
- Winsen MQ137 v1. 2024.
- Winsen MQ-9B- v1. 2024.
- Nagamora, J.A.; Vertudes, R.; Ken, J.; Halil, A. Design and Implementation of Water Quality Control and Monitoring Devices in a Small-Scale Aquaculture System. International Journal of Biosciences 2022, 21, 91–105. [Google Scholar]
- Sells, E.; Bailard, S.; Smith, Z.; Bowyer, A.; Olliver, V. RepRap: The Replicating Rapid Prototyper: Maximizing Customizability by Breeding the Means of Production. In Handbook of Research in Mass Customization and Personalization; World Scientific Publishing Company, 2009; pp. 568–580 ISBN 978-981-4280-25-9.
- Jones, R.; Haufe, P.; Sells, E.; Iravani, P.; Olliver, V.; Palmer, C.; Bowyer, A. RepRap – the Replicating Rapid Prototyper. Robotica 2011, 29, 177–191. [Google Scholar] [CrossRef]
- Gebremariam, G.K.; Jovanović, A.Z.; Pašti, I.A. The Effect of Electrolytes on the Kinetics of the Hydrogen Evolution Reaction. Hydrogen 2023, 4, 776–806. [Google Scholar] [CrossRef]
- Sun, C.-W.; Hsiau, S.-S. Effect of Electrolyte Concentration Difference on Hydrogen Production during PEM Electrolysis. J. Electrochem. Sci. Technol 2019, 9, 99–108. [Google Scholar] [CrossRef]
- Staff, C.B. Solar Is Now ‘Cheapest Electricity in History’, Confirms IEA Available online:. Available online: https://www.carbonbrief.org/solar-is-now-cheapest-electricity-in-history-confirms-iea/ (accessed on 23 July 2024).
- Saefong, M.P. Why Solar Is the Fastest-Growing Source of U.S. Electricity - MarketWatch Available online:. Available online: https://www.marketwatch.com/story/why-solar-is-the-fastest-growing-source-of-u-s-electricity-72e7d489 (accessed on 17 July 2024).
- Ghafoor, A.; Munir, A. Design and Economics Analysis of an Off-Grid PV System for Household Electrification. Renewable and Sustainable Energy Reviews 2015, 42, 496–502. [Google Scholar] [CrossRef]
- Feron, S. Sustainability of Off-Grid Photovoltaic Systems for Rural Electrification in Developing Countries: A Review. Sustainability 2016, 8, 1326. [Google Scholar] [CrossRef]
- ALLPOWERS Canada Official Generator and Power Station & Solar Panels Available online:. Available online: https://iallpowers.ca/ (accessed on 16 September 2024).
- Solar Generators, Portable Power Stations & Solar Panels Available online:. Available online: https://ca.jackery.com/ (accessed on 16 September 2024).
- Anker SOLIX - Portable Power Stations & Solar Generators Available online:. Available online: https://www.anker.com/ca/anker-solix (accessed on 16 September 2024).
- Demir, M.E.; Dincer, I. An Integrated Solar Energy, Wastewater Treatment and Desalination Plant for Hydrogen and Freshwater Production. Energy Conversion and Management 2022, 267, 115894. [Google Scholar] [CrossRef]
- Pandey, A.K.; Reji Kumar, R.; B, K.; Laghari, I.A.; Samykano, M.; Kothari, R.; Abusorrah, A.M.; Sharma, K.; Tyagi, V.V. Utilization of Solar Energy for Wastewater Treatment: Challenges and Progressive Research Trends. Journal of Environmental Management 2021, 297, 113300. [Google Scholar] [CrossRef]
- Merabet, N.H.; Kerboua, K.; Hoinkis, J. Hydrogen Production from Wastewater: A Comprehensive Review of Conventional and Solar Powered Technologies. Renewable Energy 2024, 226, 120412. [Google Scholar] [CrossRef]
- Wang, B.; Jiang, H.; Gu, D.; Li, C.; Nie, C.; Yan, C.; Yuan, D.; Wang, X. An Insight into Solar Thermo-Assisted and Organic-Molecule Alternated Water Splitting Chemistry for Hydrogen Production and Wastewater Treatment by Elucidating Redox Model and Thermodynamics. Energy Conversion and Management 2020, 226, 113551. [Google Scholar] [CrossRef]
- isoosi Modular Genius | New & Used Modular Buildings Available online:. Available online: https://www.modulargenius.com/ (accessed on 16 September 2024).
- Lease or Buy Modular Buildings | BOXX Modular US Available online:. Available online: https://www.boxxmodular.com/ (accessed on 16 September 2024).
- Wang, J.; Viciano-Tudela, S.; Parra, L.; Lacuesta, R.; Lloret, J. Evaluation of Suitability of Low-Cost Gas Sensors for Monitoring Indoor and Outdoor Urban Areas. IEEE Sensors Journal 2023, PP, 1–1. [Google Scholar] [CrossRef]
- Dorcea, D.; Hnatiuc, M.; Lazar, I. Acquisition and Calibration Interface for Gas Sensors. In Proceedings of the 2018 IEEE 24th International Symposium for Design and Technology in Electronic Packaging (SIITME); October 2018; pp. 120–123. [Google Scholar]
- Jiang, H.; Han, Y.; Zalhaf, A.S.; Yang, P.; Wang, C. Low-Cost Urban Carbon Monitoring Network and Implications for China: A Comprehensive Review. Environ Sci Pollut Res 2023, 30, 105012–105029. [Google Scholar] [CrossRef]
- Khadim, H.J.; Obaed, F.K.; Abd Ali, Z.T. Application of MQ-Sensors to Indoor Air Quality Monitoring in Lab Based on IoT. In Proceedings of the 2021 International Conference on Intelligent Technology, System and Service for Internet of Everything (ITSS-IoE); November 2021; p. 1. [Google Scholar]
- Popescu, S.M.; Mansoor, S.; Wani, O.A.; Kumar, S.S.; Sharma, V.; Sharma, A.; Arya, V.M.; Kirkham, M.B.; Hou, D.; Bolan, N.; et al. Artificial Intelligence and IoT Driven Technologies for Environmental Pollution Monitoring and Management. Front. Environ. Sci. 2024, 12. [Google Scholar] [CrossRef]
- Zeng, K.; Zhang, D. Recent Progress in Alkaline Water Electrolysis for Hydrogen Production and Applications. Progress in Energy and Combustion Science 2010, 36, 307–326. [Google Scholar] [CrossRef]
- Park, H.; Choo, K.-H.; Park, H.-S.; Choi, J.; Hoffmann, M.R. Electrochemical Oxidation and Microfiltration of Municipal Wastewater with Simultaneous Hydrogen Production: Influence of Organic and Particulate Matter. Chemical Engineering Journal 2013, 215–216, 802–810. [Google Scholar] [CrossRef]
- Pischke, C. The Current State of Bidirectional EV Charging in Canada. Electric Vehicle Association of Alberta 2024.
- Davis, J.T.; Brown, D.E.; Pang, X.; Esposito, D.V. High Speed Video Investigation of Bubble Dynamics and Current Density Distributions in Membraneless Electrolyzers. J. Electrochem. Soc. 2019, 166, F312. [Google Scholar] [CrossRef]
- Antonini, G.; Pearce, J.M.; Berruti, F.; Santoro, D. A Novel Camera-Based Sensor for Real-Time Wastewater Quality Monitoring. Water Practice and Technology 2024, (pt2024211), wpt2024211. [Google Scholar] [CrossRef]
Figure 1.
Electrolyzer schematic:(1. Peristaltic pump; 2. Anode; 3. Cathode; 4. Bench power supply; 5. Thermocouple; 6. Drier; 7. Flowmeter; 8. Gas sampling; 9. Gas washing vessel; 10. Exhaust).
Figure 1.
Electrolyzer schematic:(1. Peristaltic pump; 2. Anode; 3. Cathode; 4. Bench power supply; 5. Thermocouple; 6. Drier; 7. Flowmeter; 8. Gas sampling; 9. Gas washing vessel; 10. Exhaust).
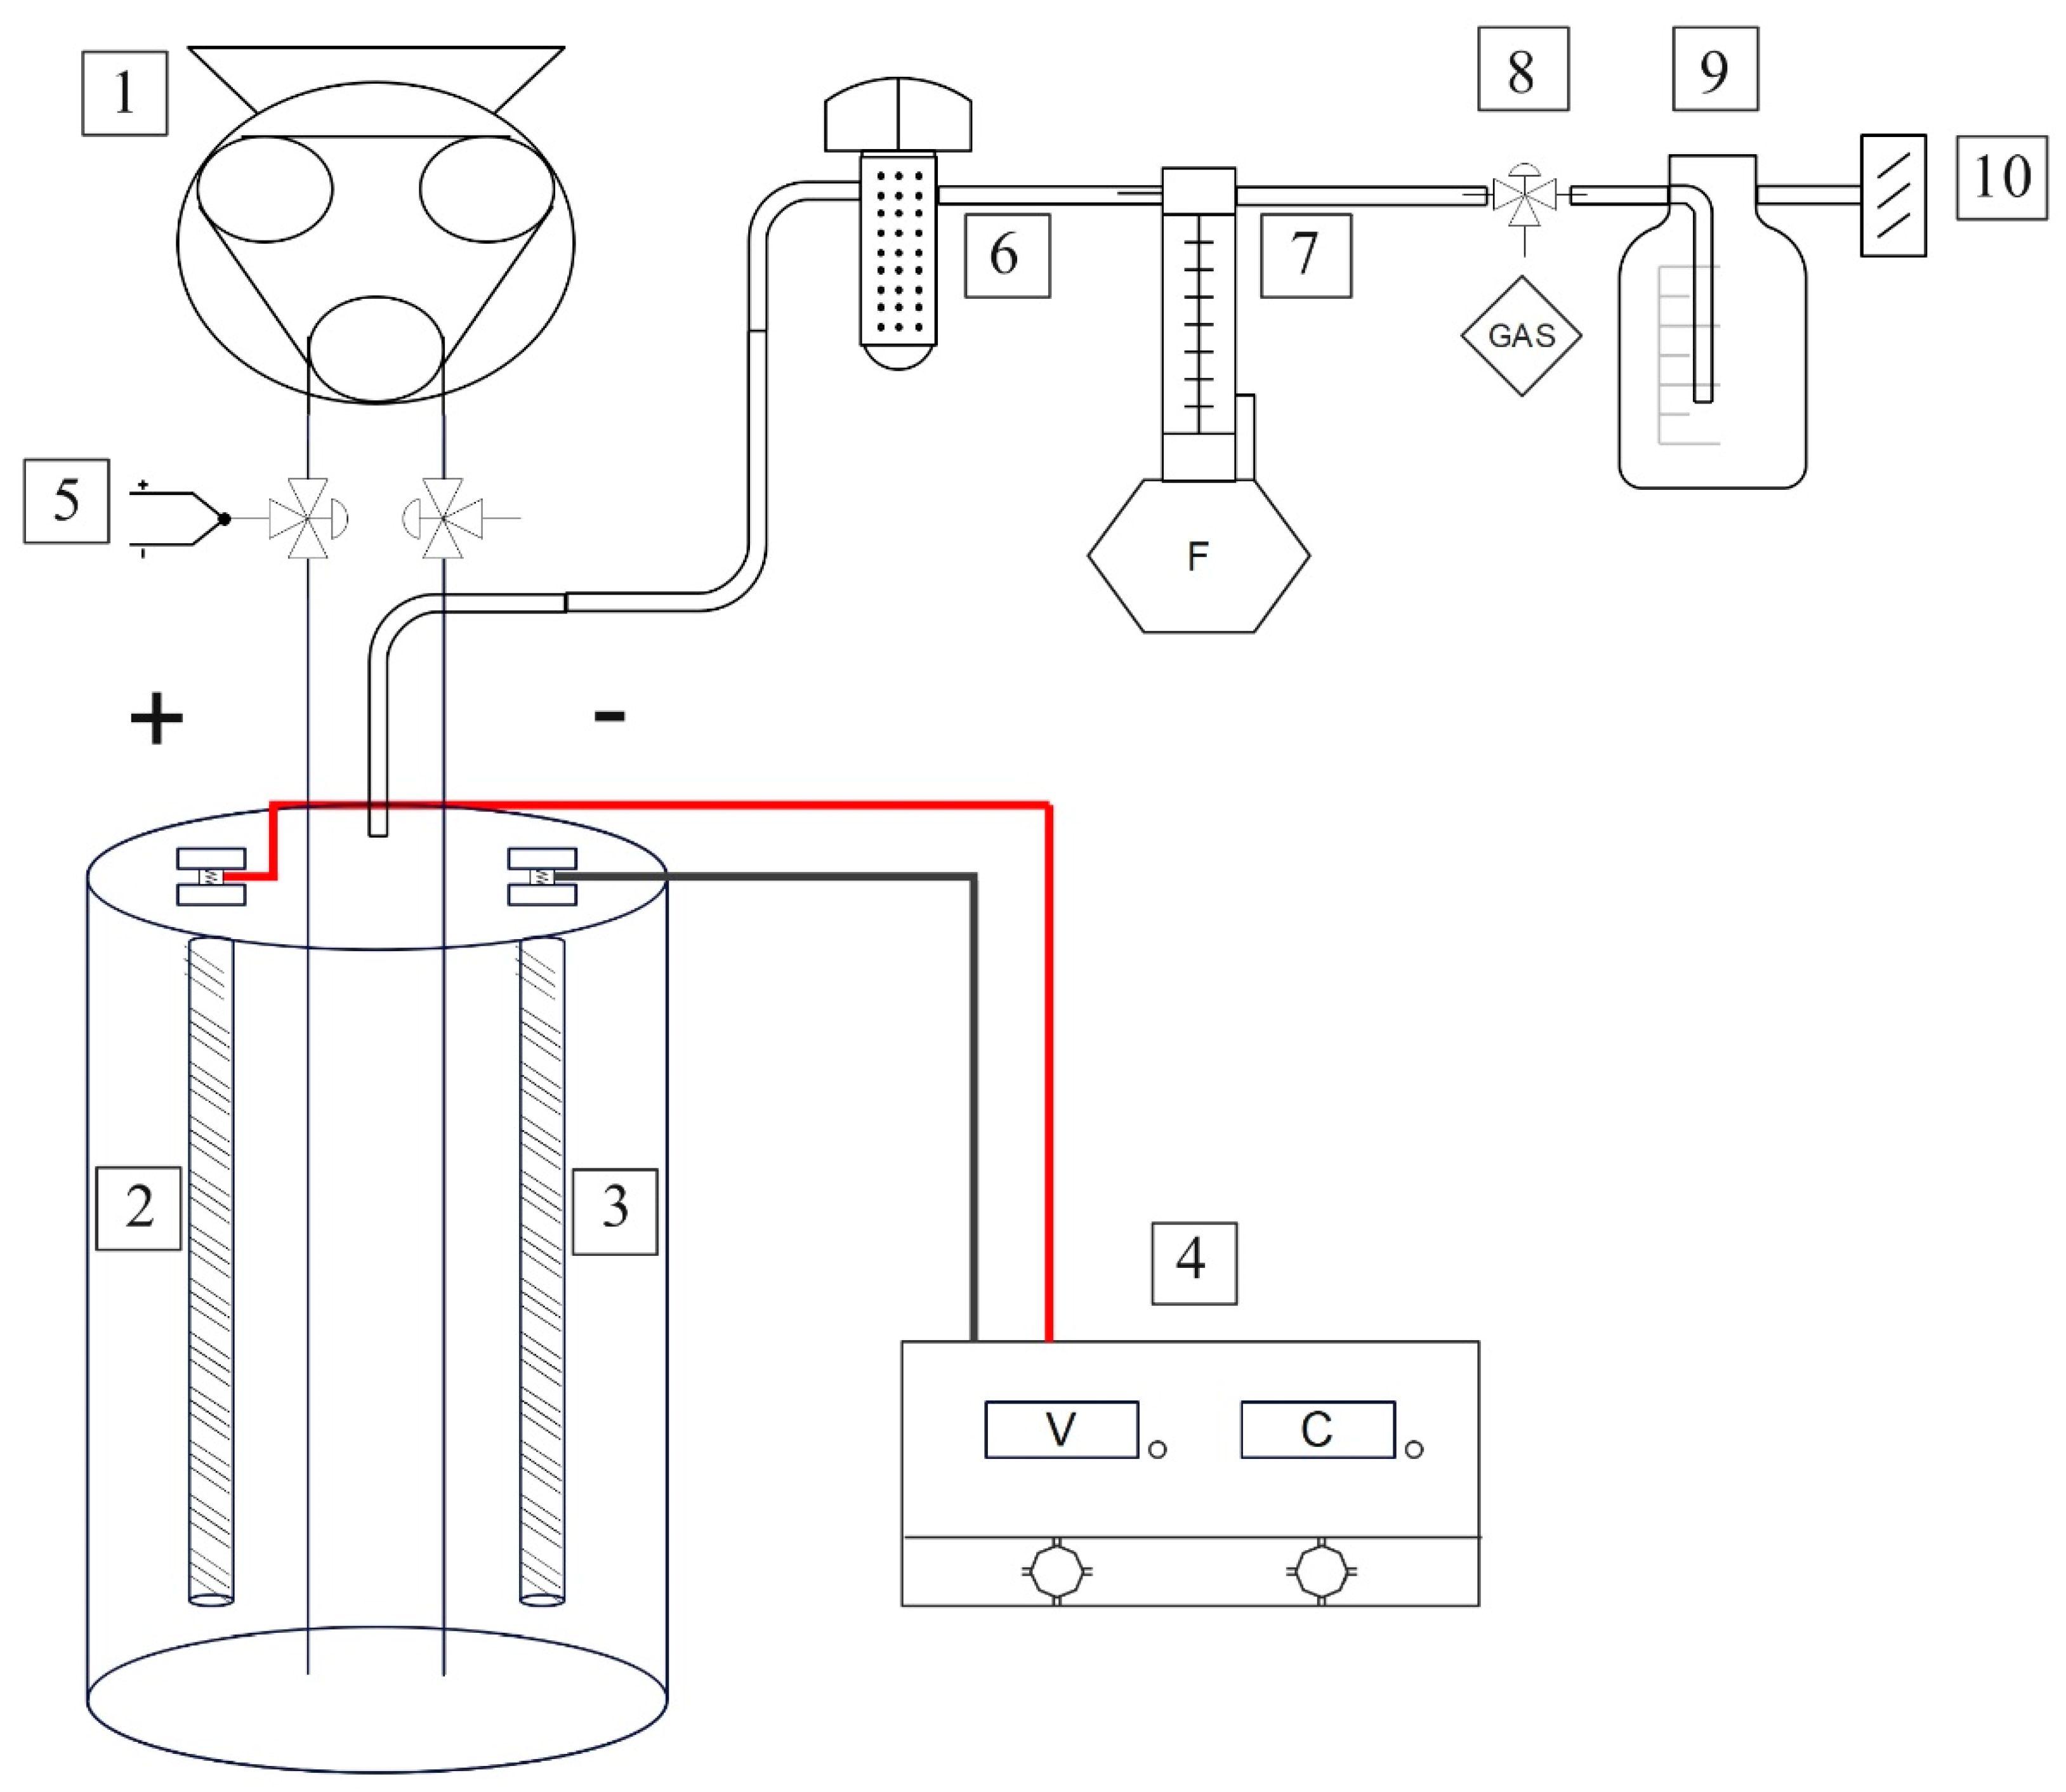
Figure 2.
Electrode materials a) SS316L, b) Duplex2205, c) titanium and d) graphite.
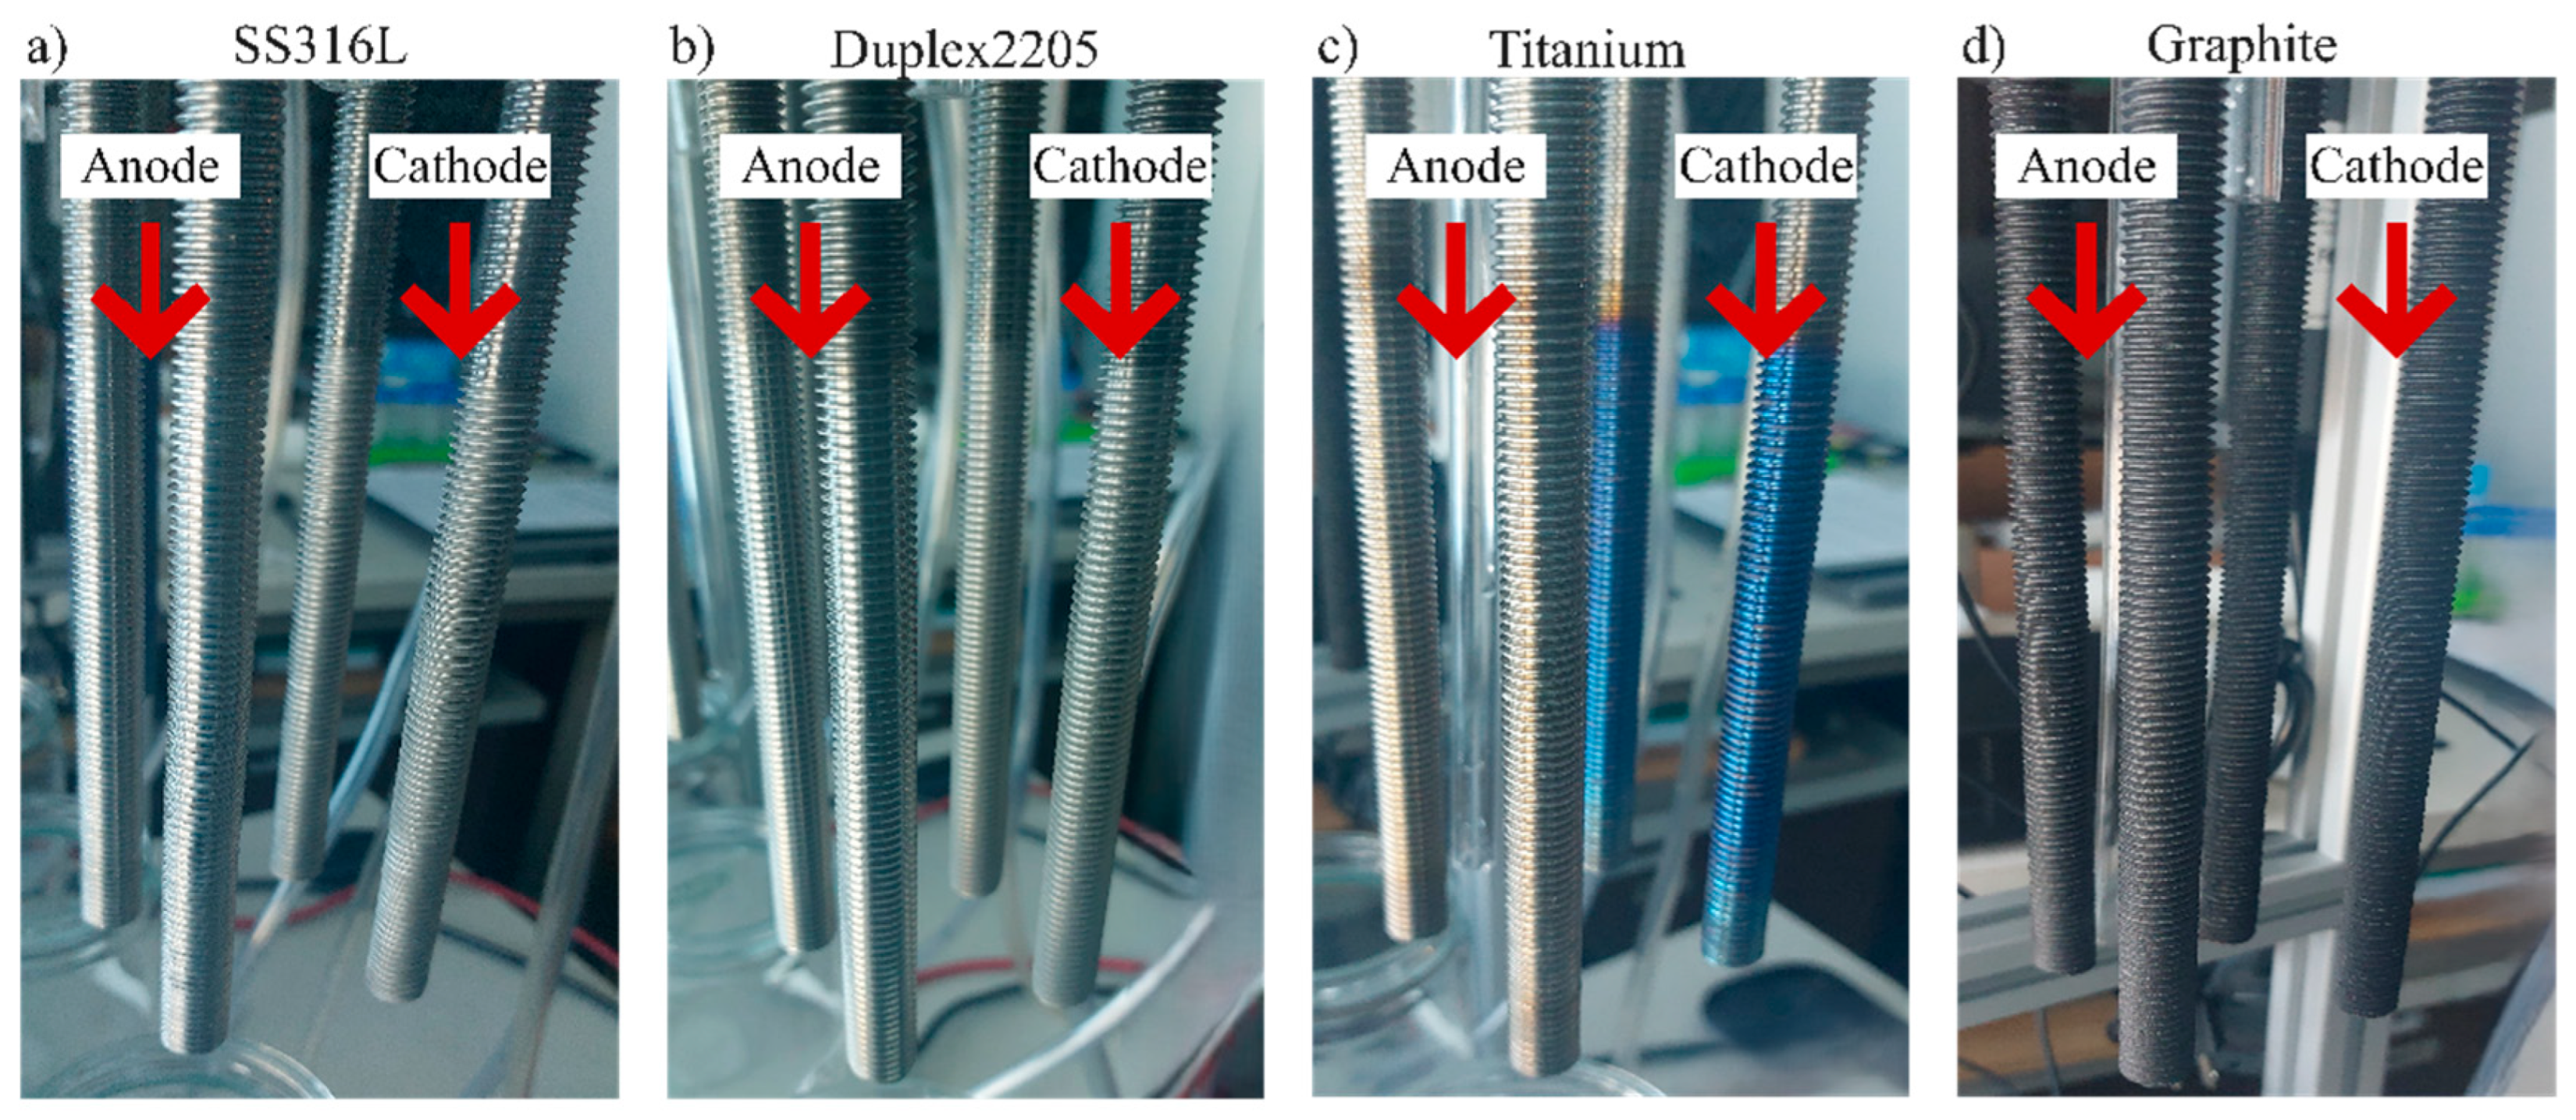
Figure 3.
PV-box design a) Structure chassis b) Structure PV closed c) Structure PV open.
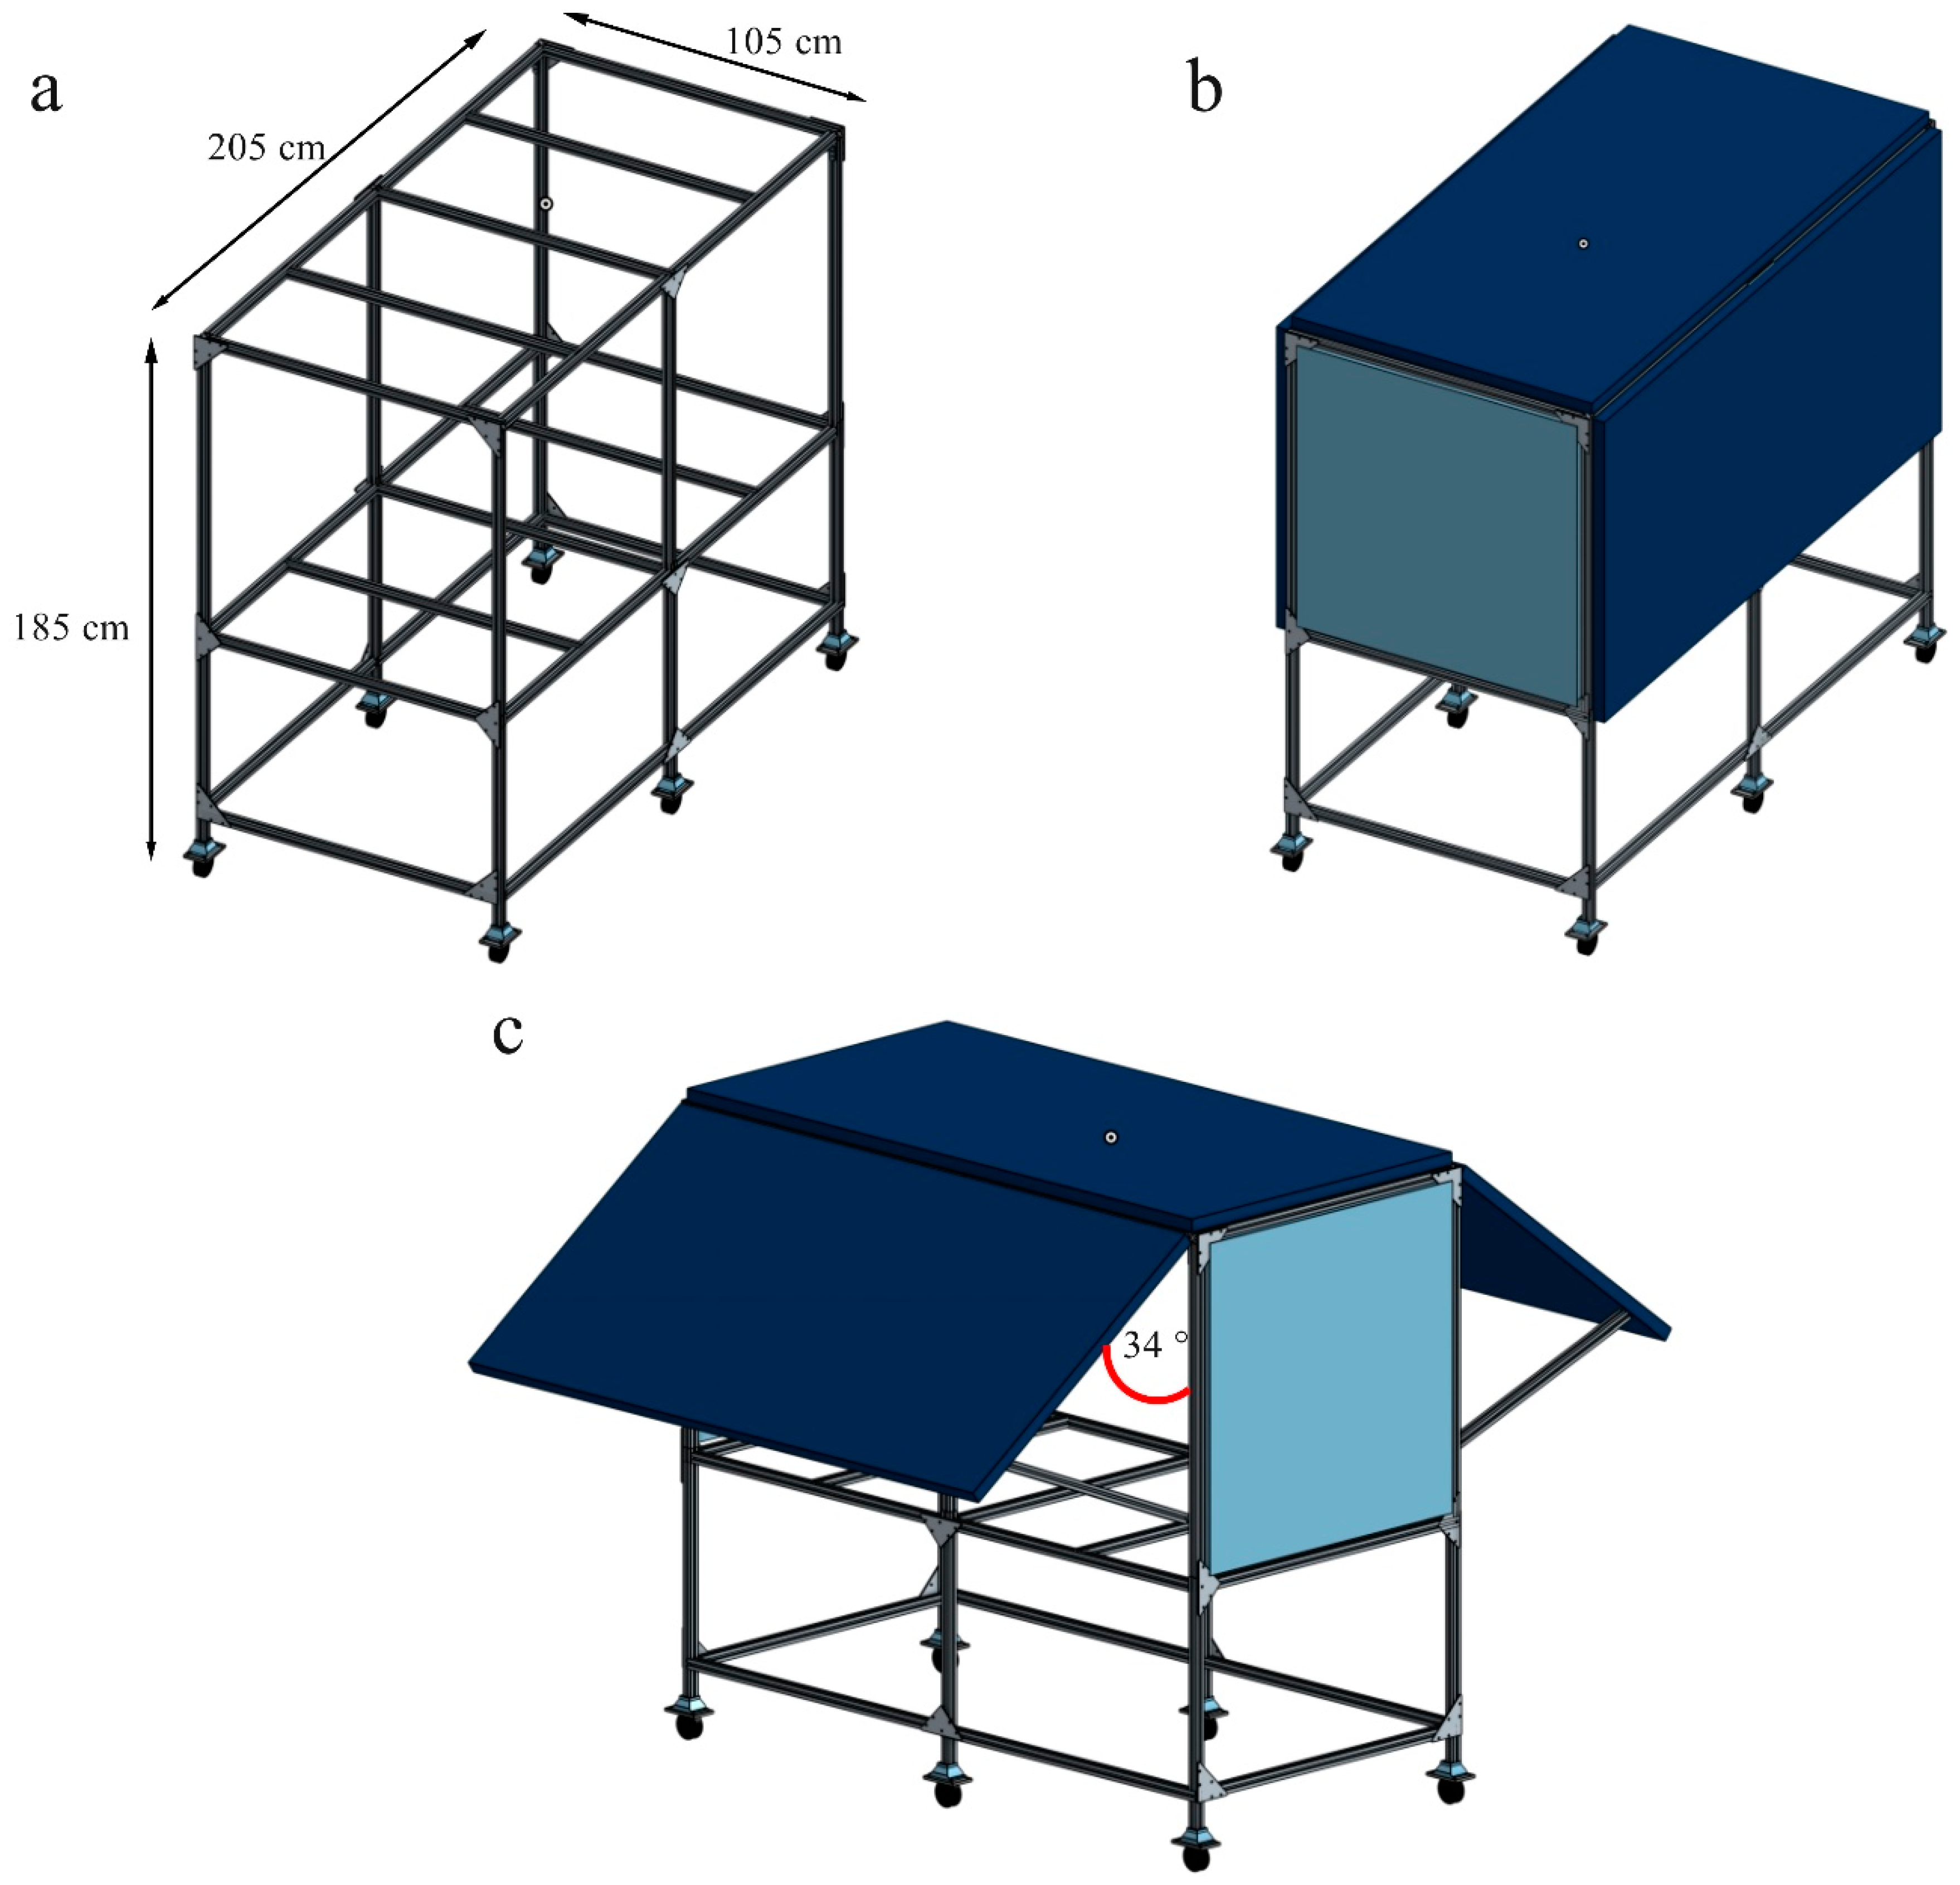
Figure 4.
Electrical schematic PV-box.
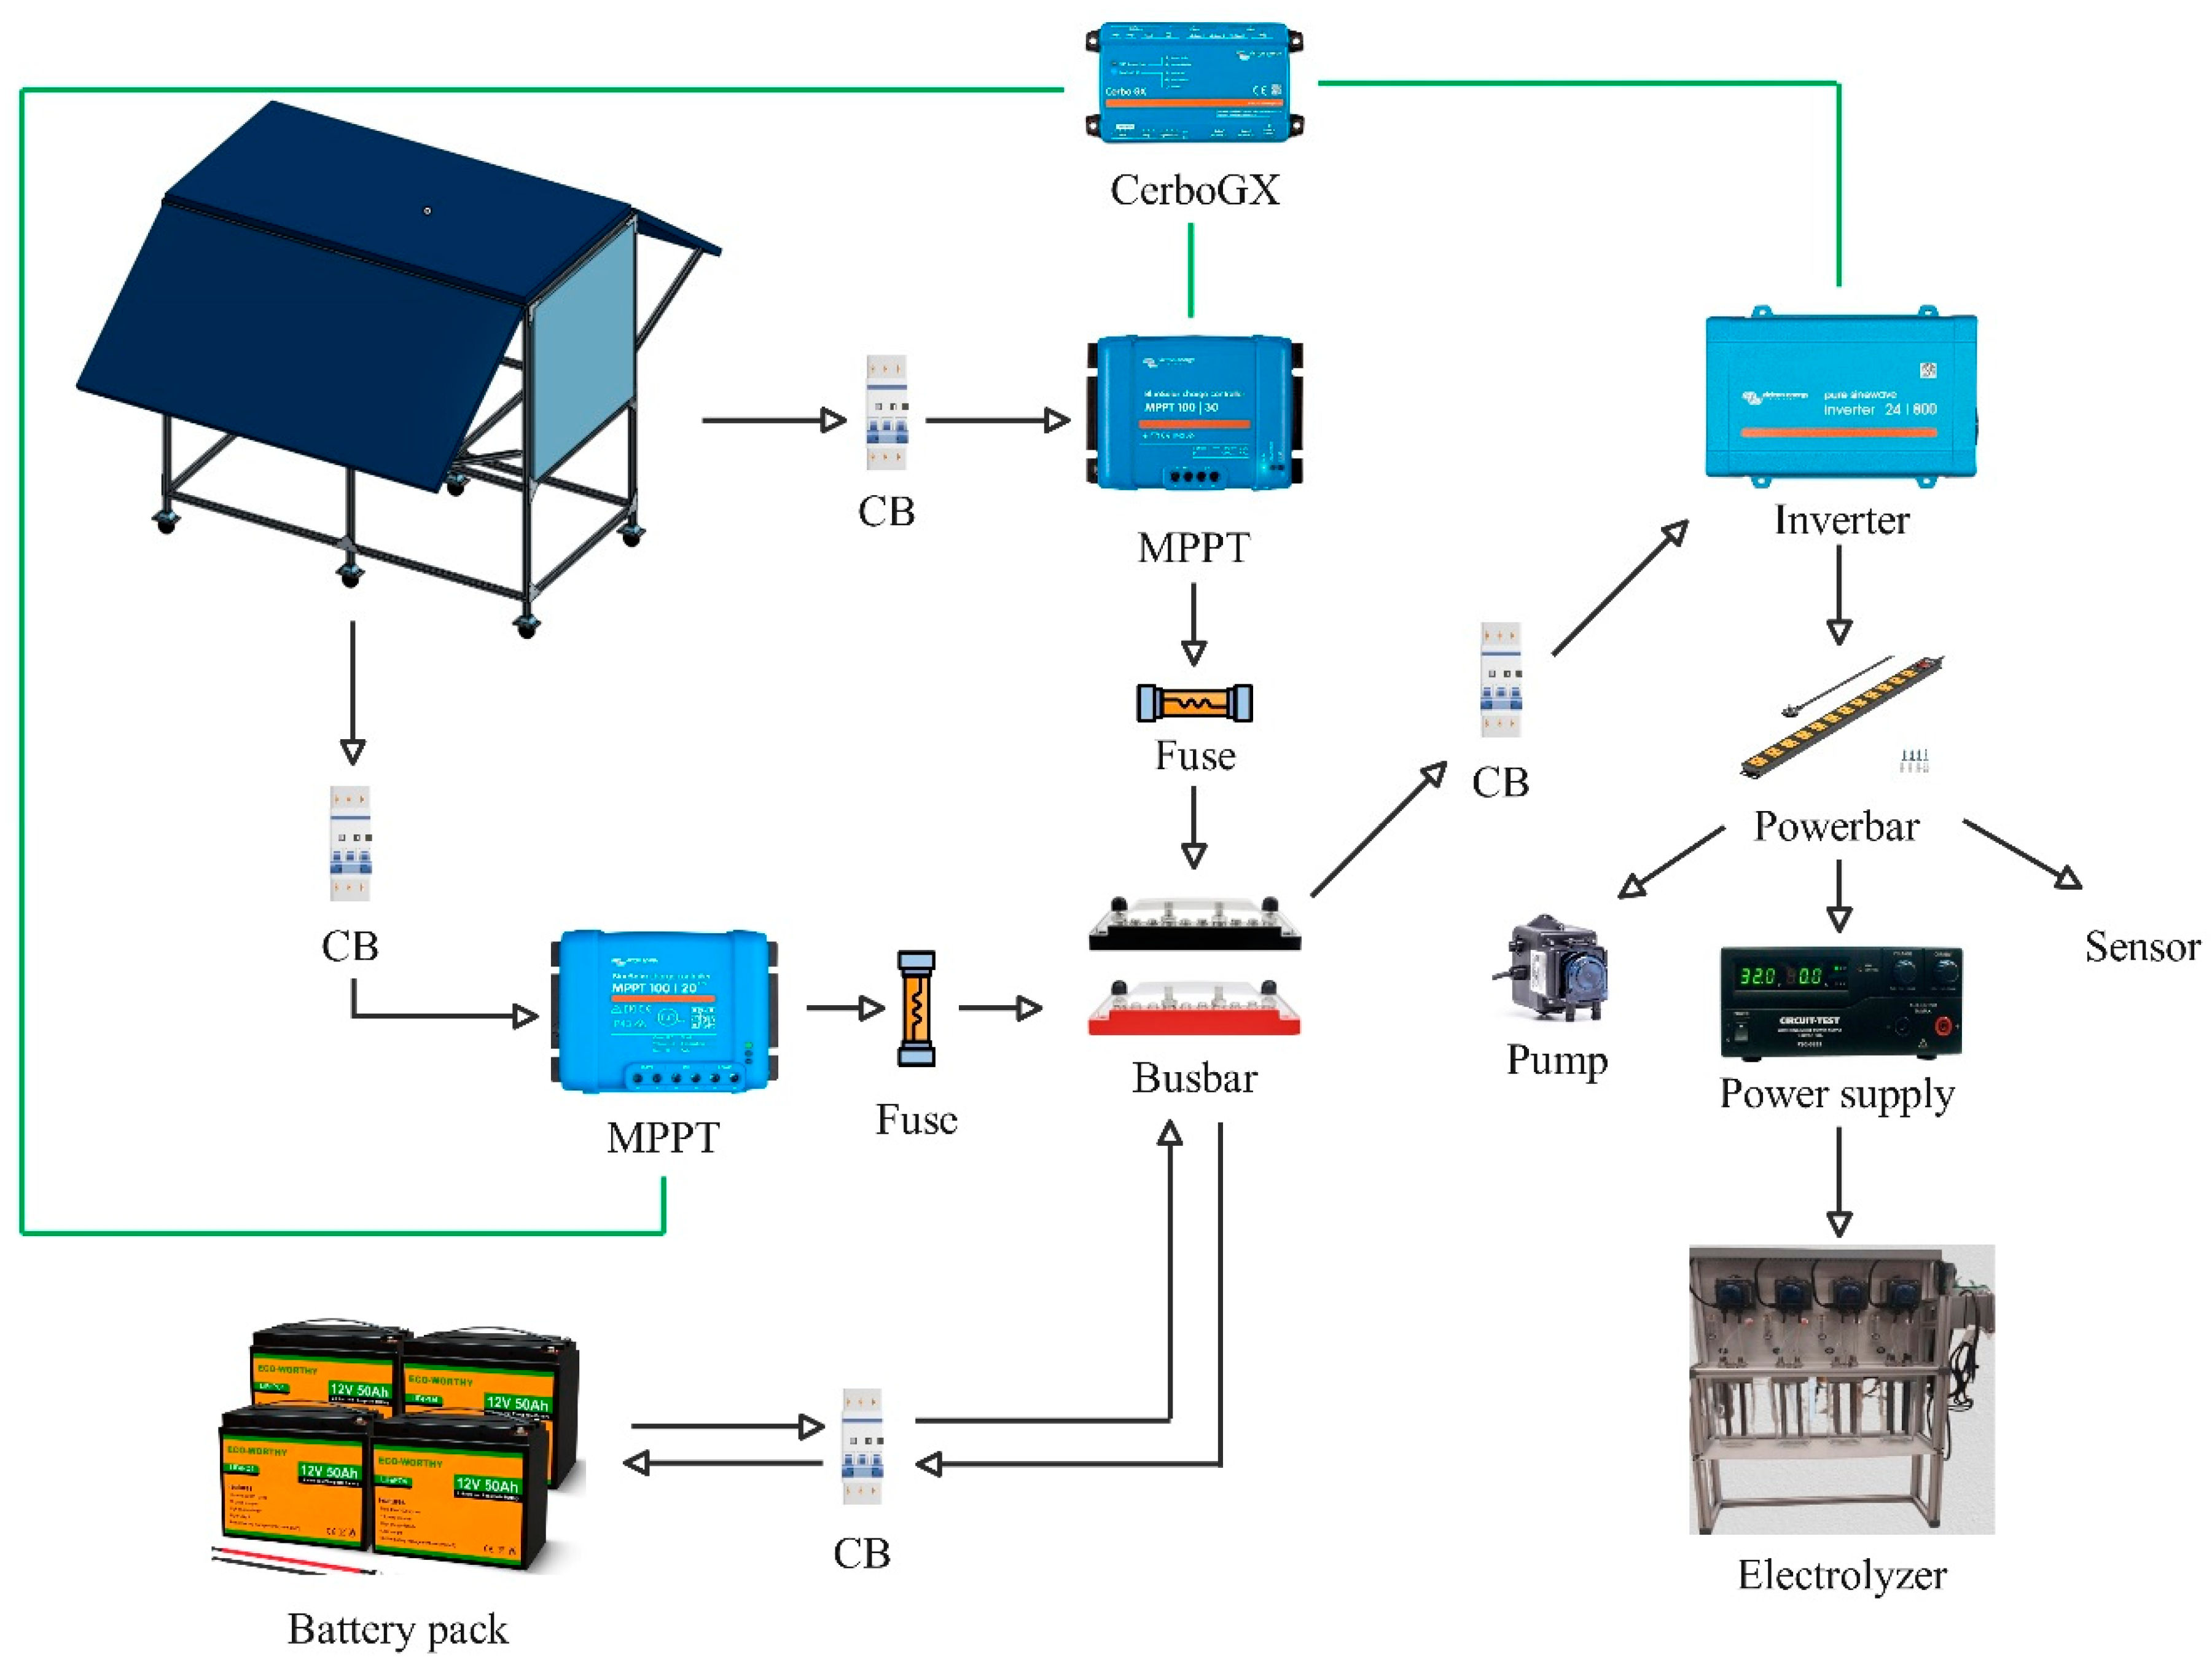
Figure 5.
Environmental sensor board wired.
Figure 6.
a) State of charge over the year; b) Monthly energy supply no grid connection; c) Grid power interconnection, red – sold, blue – bought; d) Monthly energy supply grid connected.
Figure 6.
a) State of charge over the year; b) Monthly energy supply no grid connection; c) Grid power interconnection, red – sold, blue – bought; d) Monthly energy supply grid connected.
Figure 7.
a) Photovoltaic box closed; b) Photovoltaic box open; c) Photovoltaic box inside.
Figure 8.
a) Irradiance and power produced by the panels in their configuration; b) Battery voltage, load supplied and total PV power generated.
Figure 8.
a) Irradiance and power produced by the panels in their configuration; b) Battery voltage, load supplied and total PV power generated.
Figure 9.
Environmental sensor 8 hours readings a) Combines CO₂, temperature, humidity, and TVOC levels with average AQI shown (1.32/5); b) Concentrations of H₂, H₂S, NH₃, CH₄, and CO gases with smoothed data for clearer trend interpretation.
Figure 9.
Environmental sensor 8 hours readings a) Combines CO₂, temperature, humidity, and TVOC levels with average AQI shown (1.32/5); b) Concentrations of H₂, H₂S, NH₃, CH₄, and CO gases with smoothed data for clearer trend interpretation.
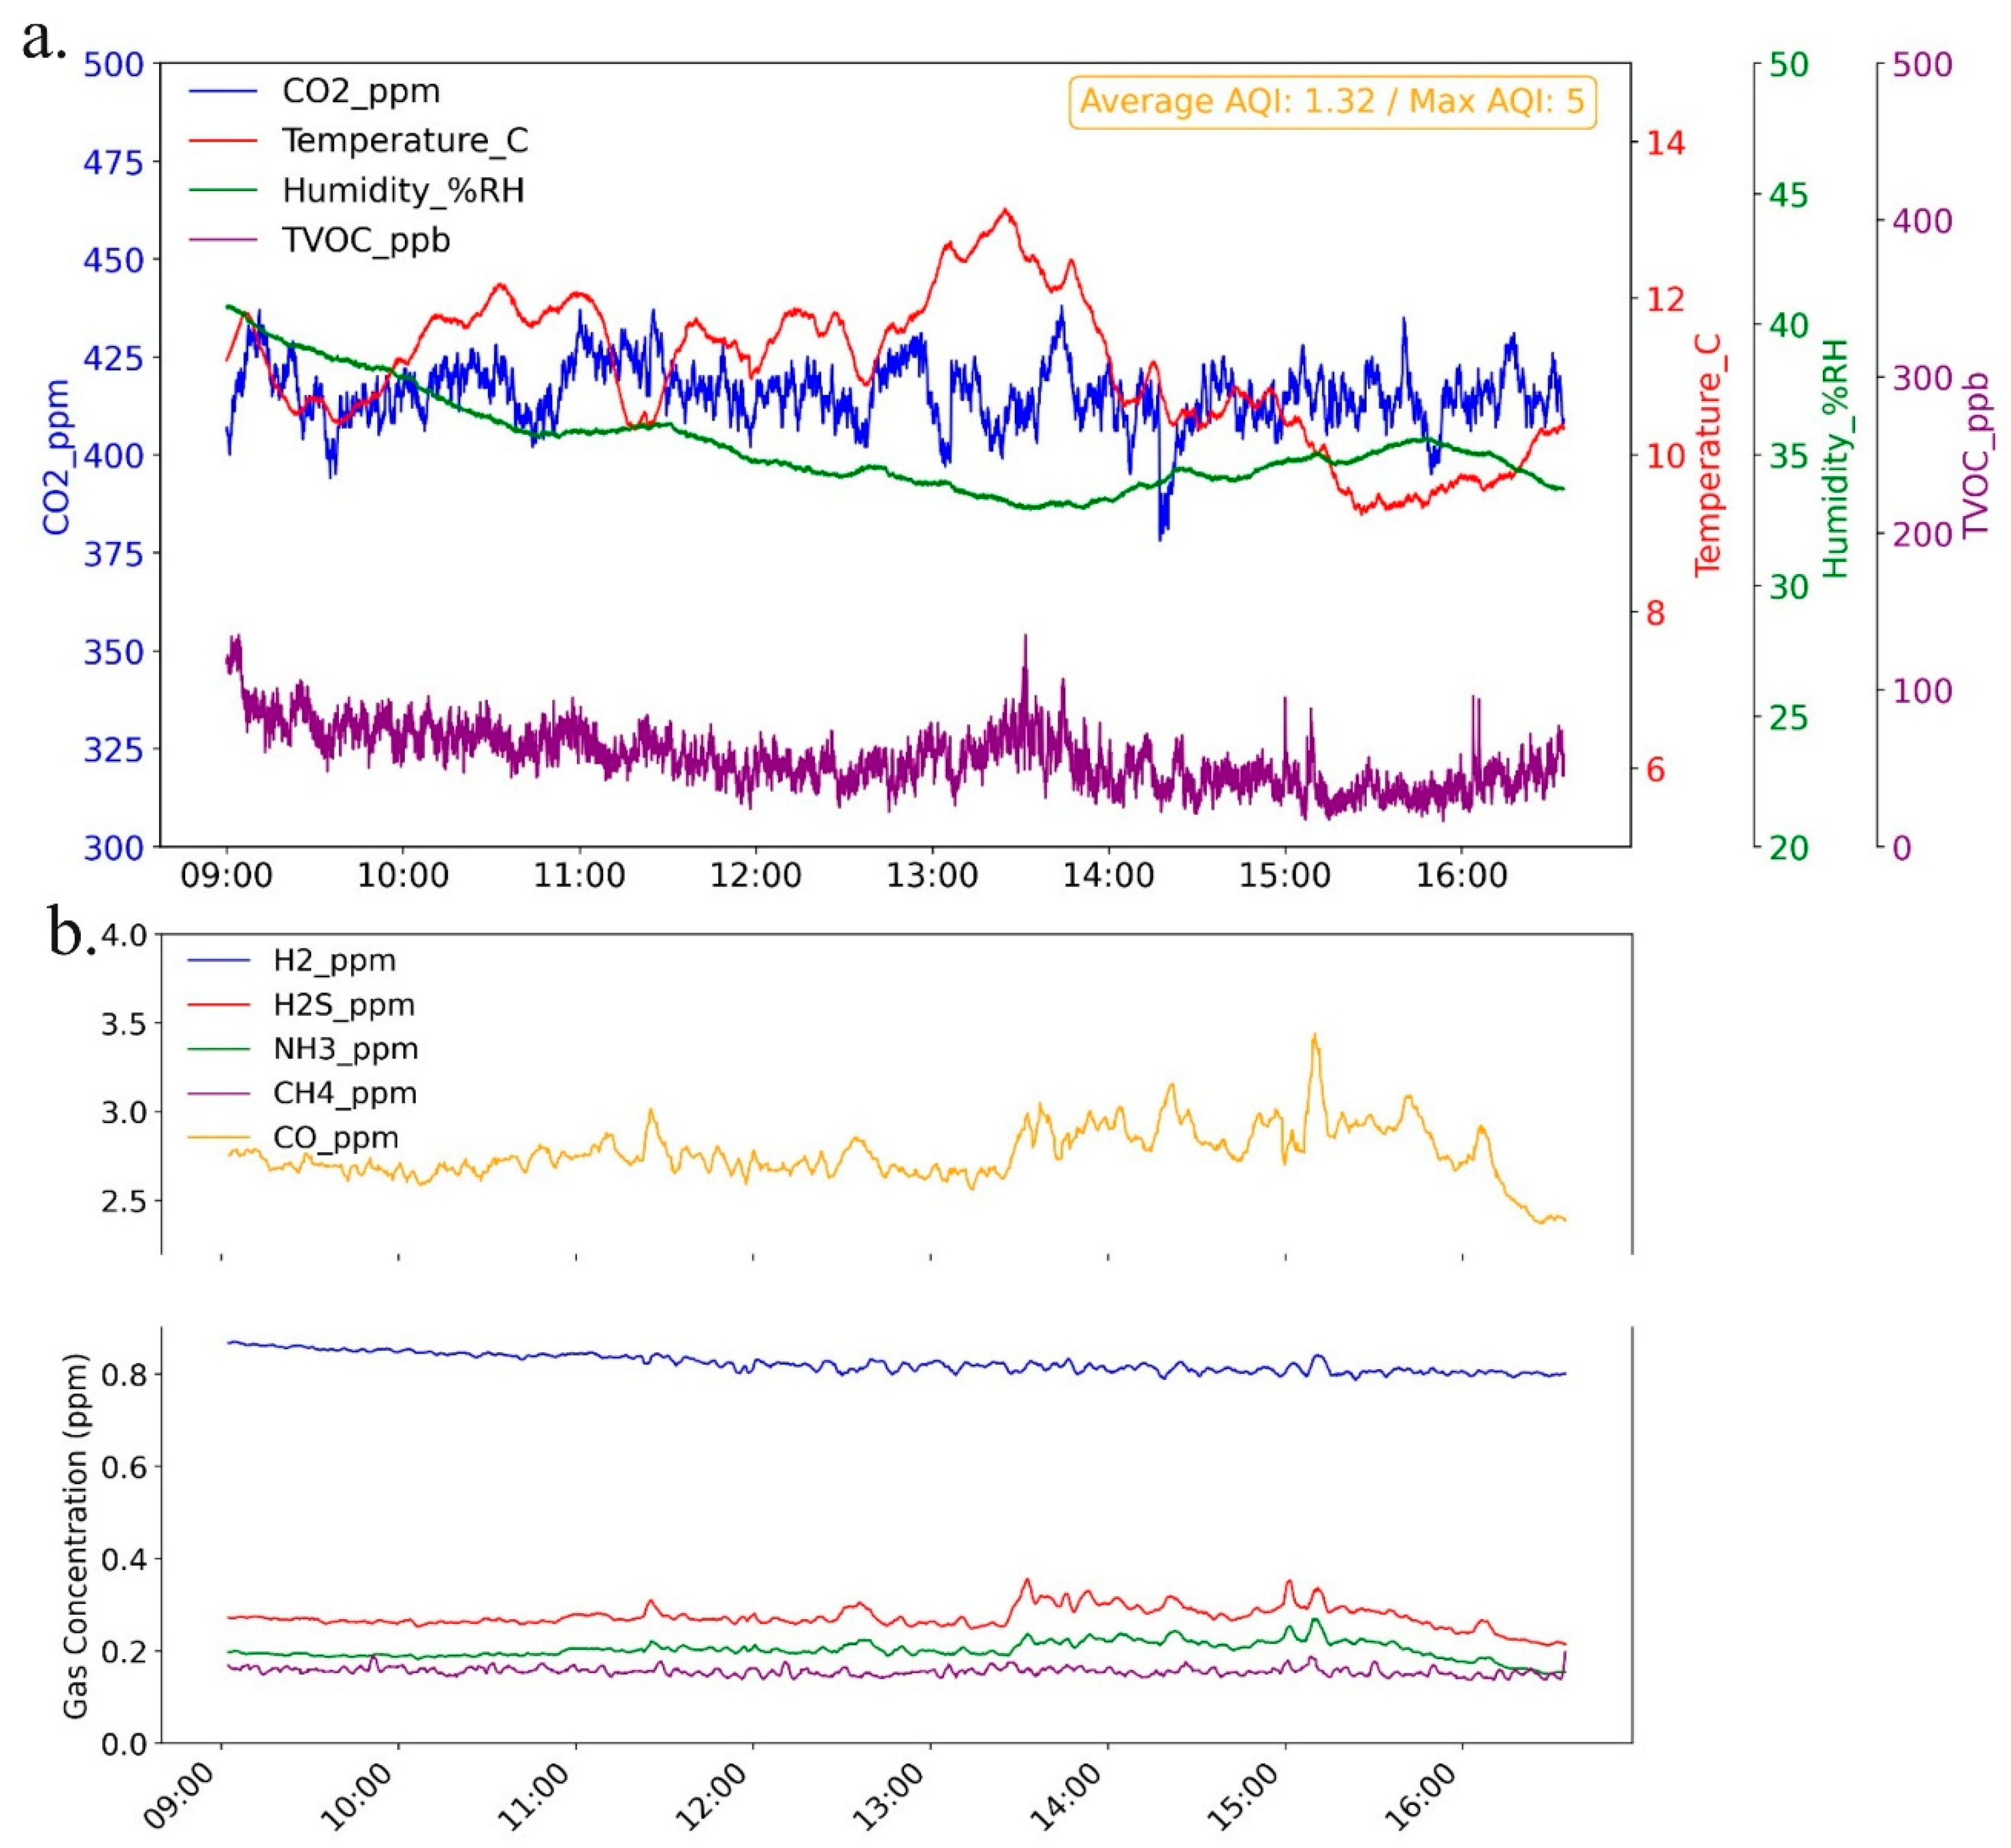
Figure 10.
Material result comparison a) Current vs voltage curve KOH; b) Gas flow measured KOH; c) Current vs voltage curve H2SO4; d) Gas flow measured H2SO4.
Figure 10.
Material result comparison a) Current vs voltage curve KOH; b) Gas flow measured KOH; c) Current vs voltage curve H2SO4; d) Gas flow measured H2SO4.
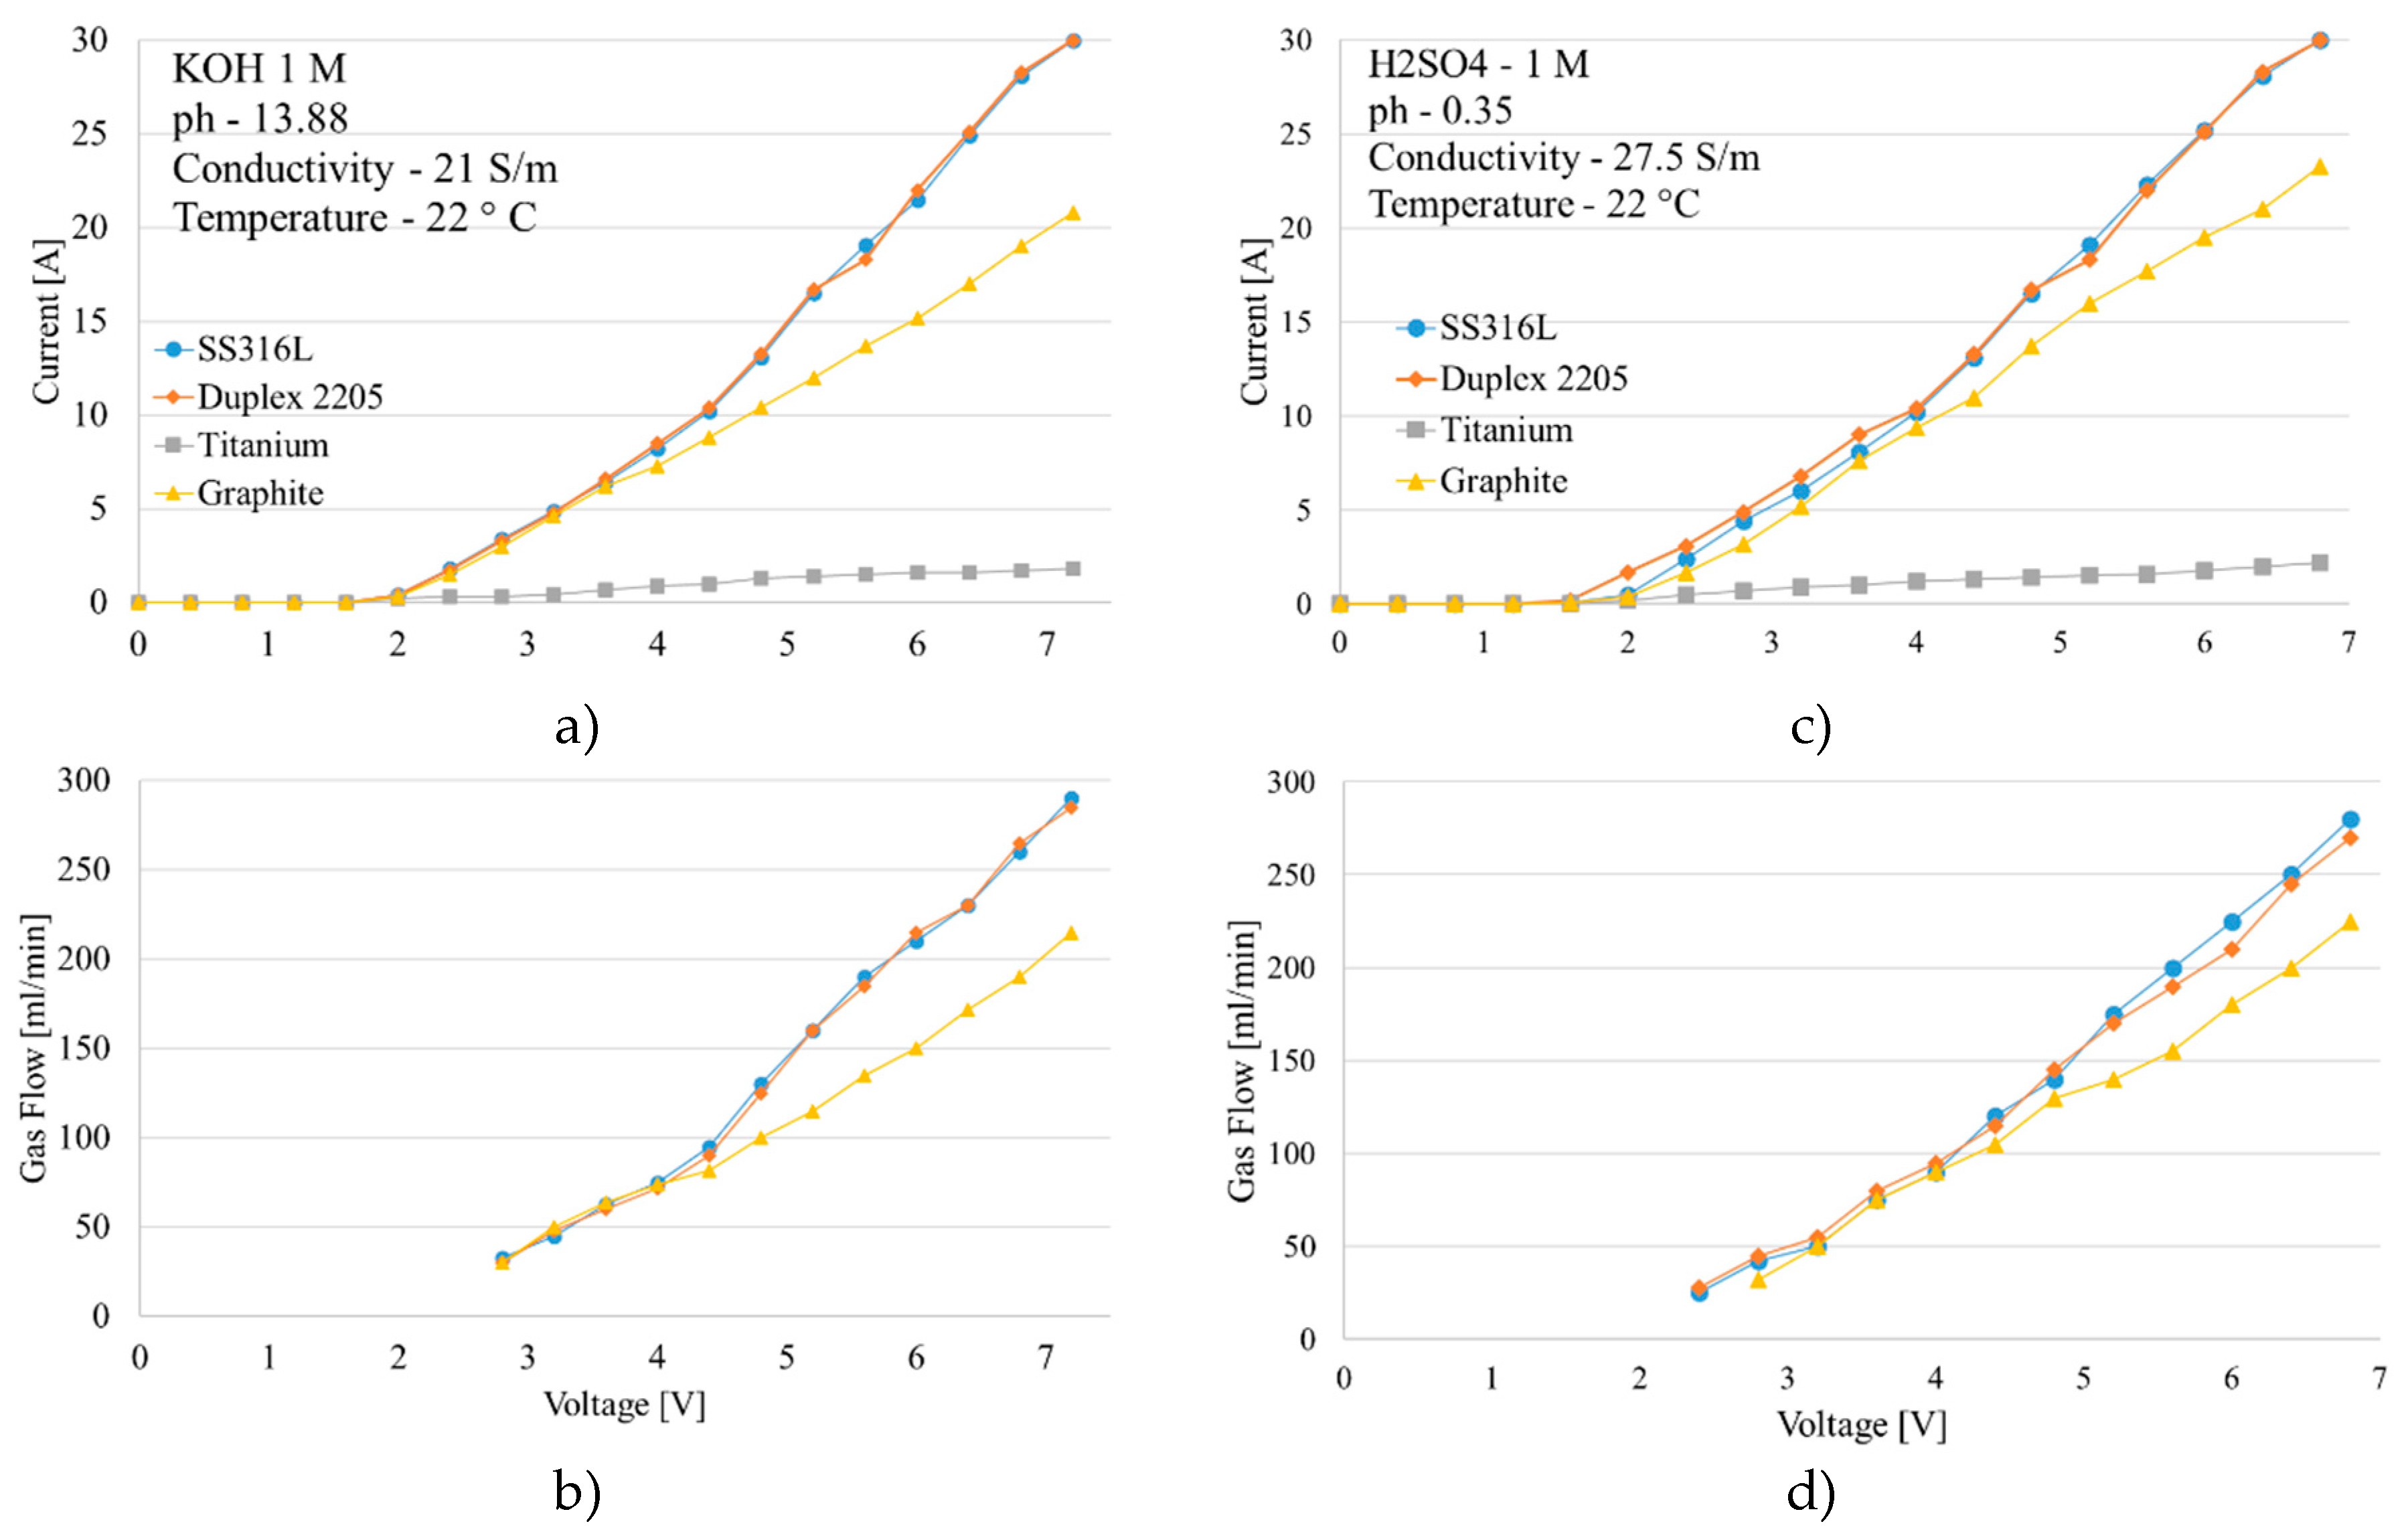
Figure 11.
Material comparisons efficiency results a) Faraday efficiency KOH; b) Energy efficiency KOH; c) Faraday efficiency H2SO4; d) Energy efficiency H2SO4.
Figure 11.
Material comparisons efficiency results a) Faraday efficiency KOH; b) Energy efficiency KOH; c) Faraday efficiency H2SO4; d) Energy efficiency H2SO4.
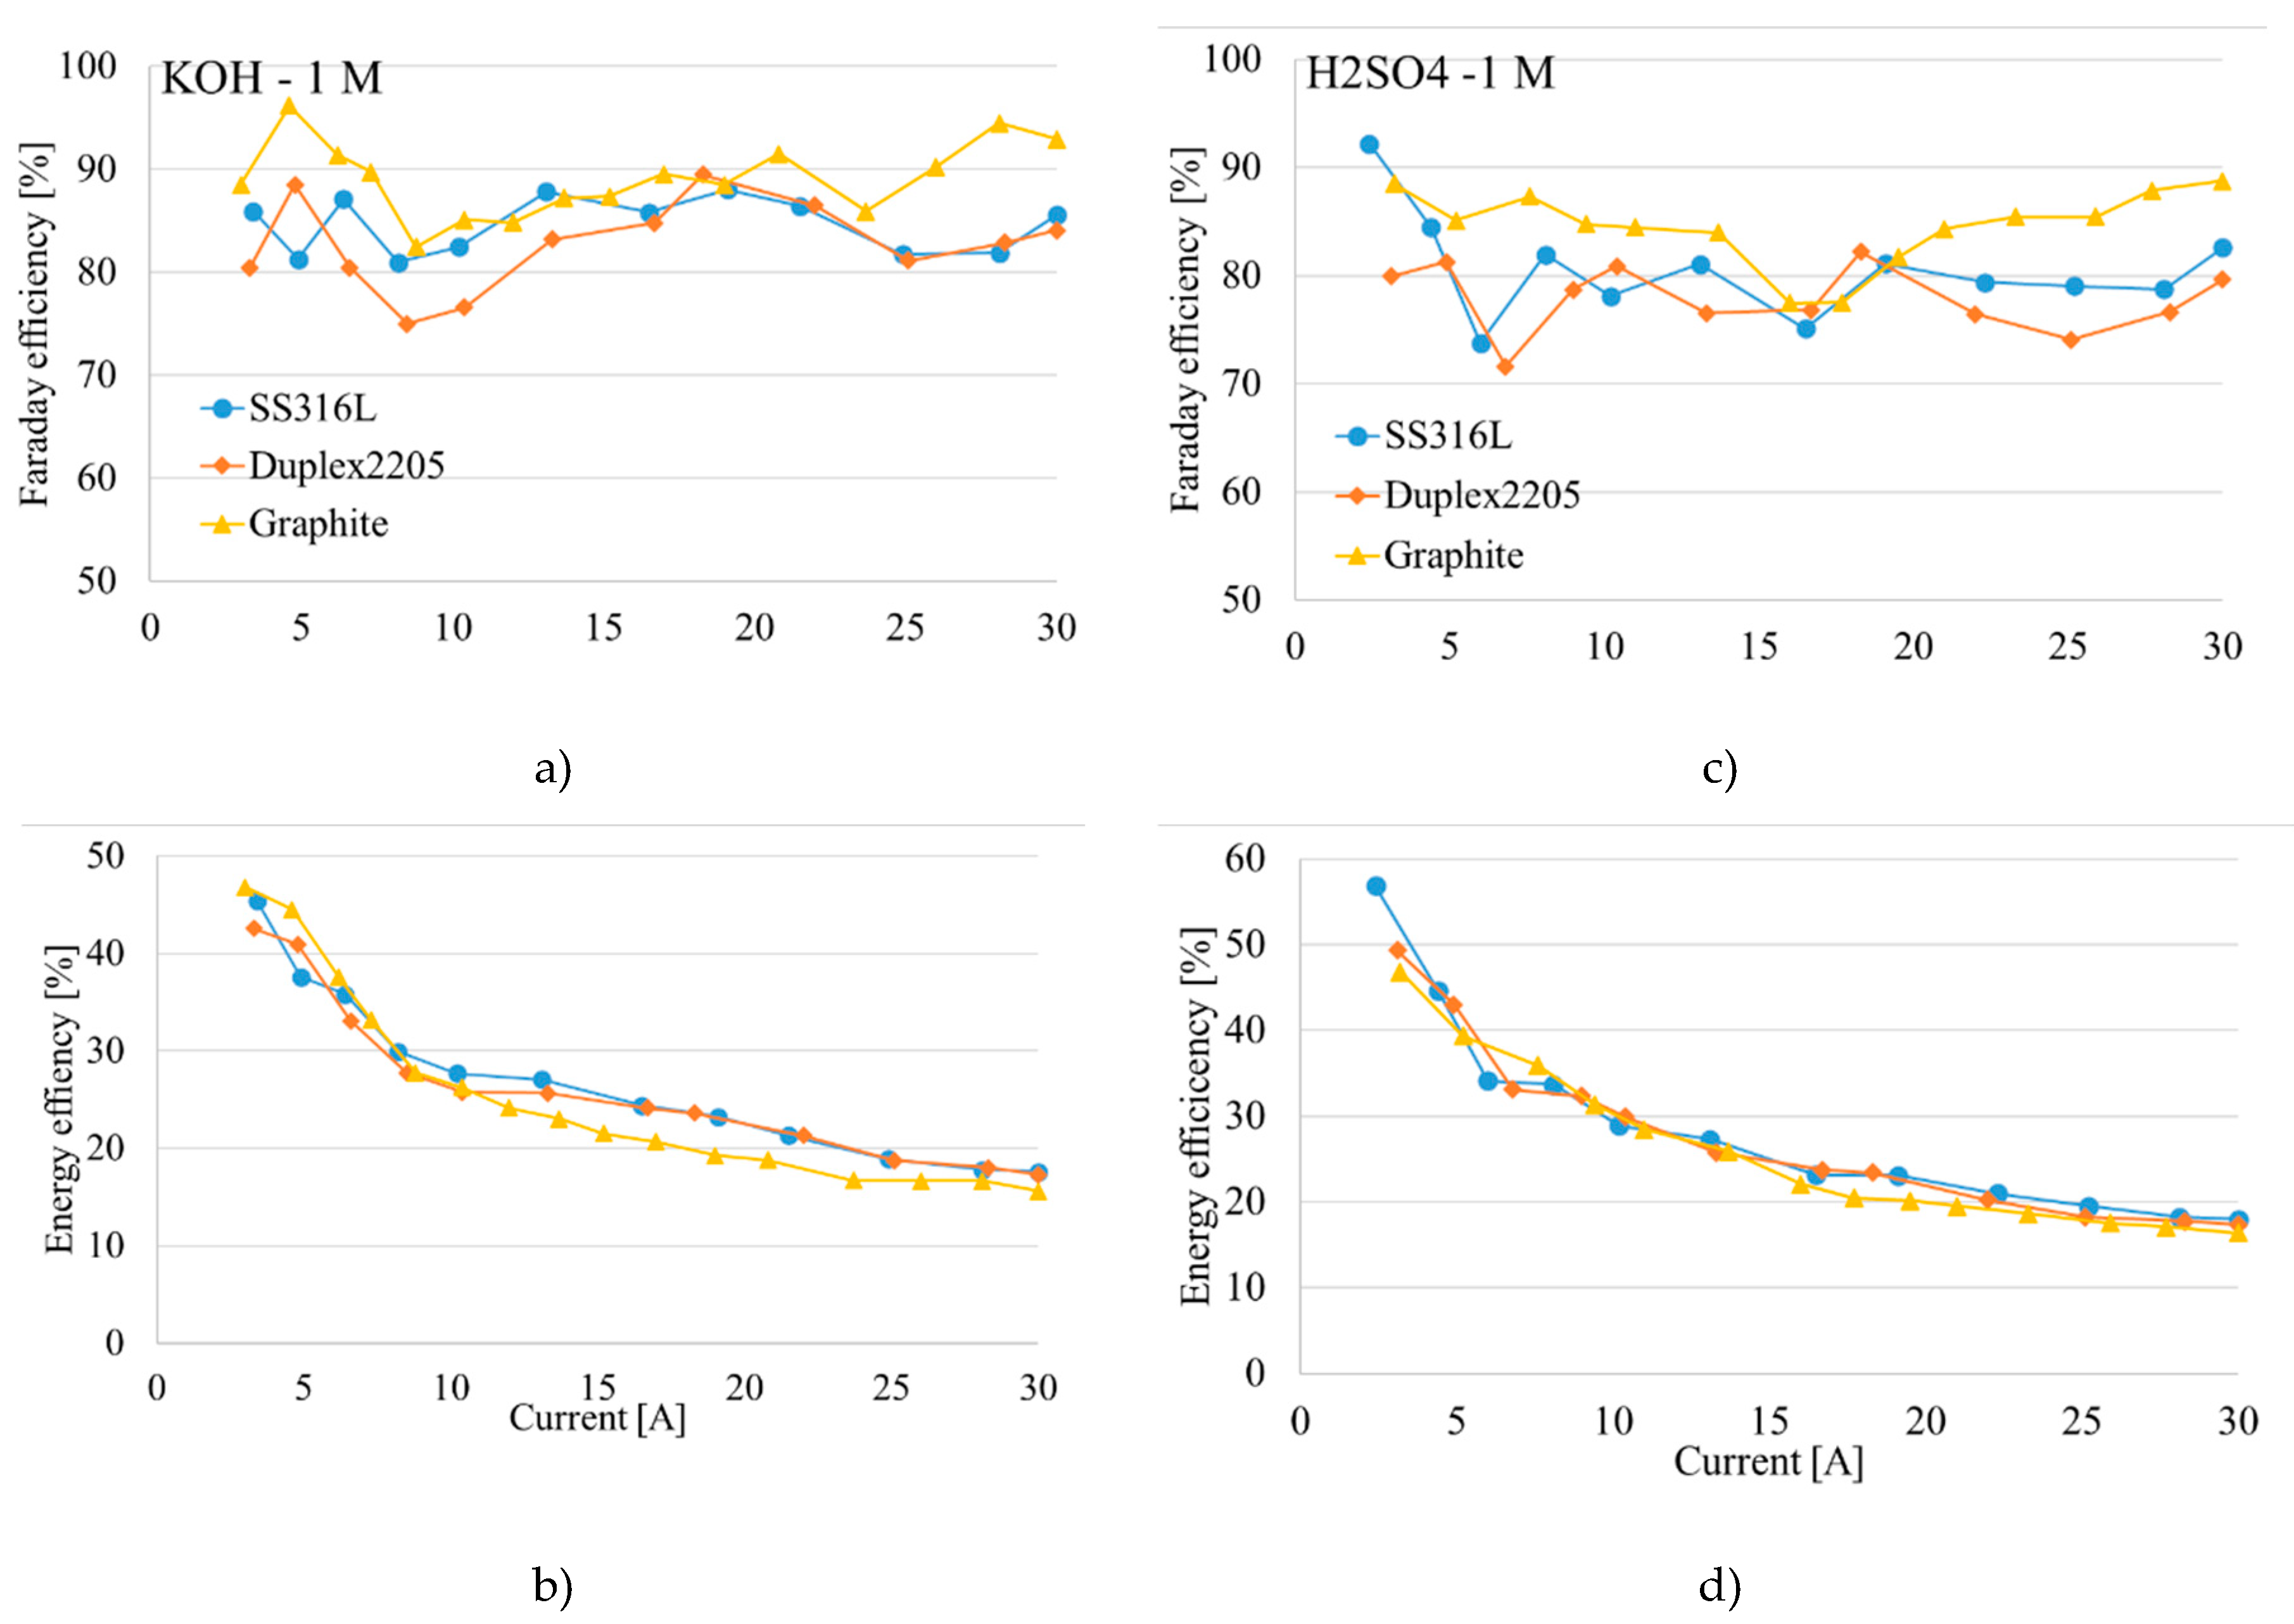
Figure 12.
Current vs voltage curve with secondary wastewater.
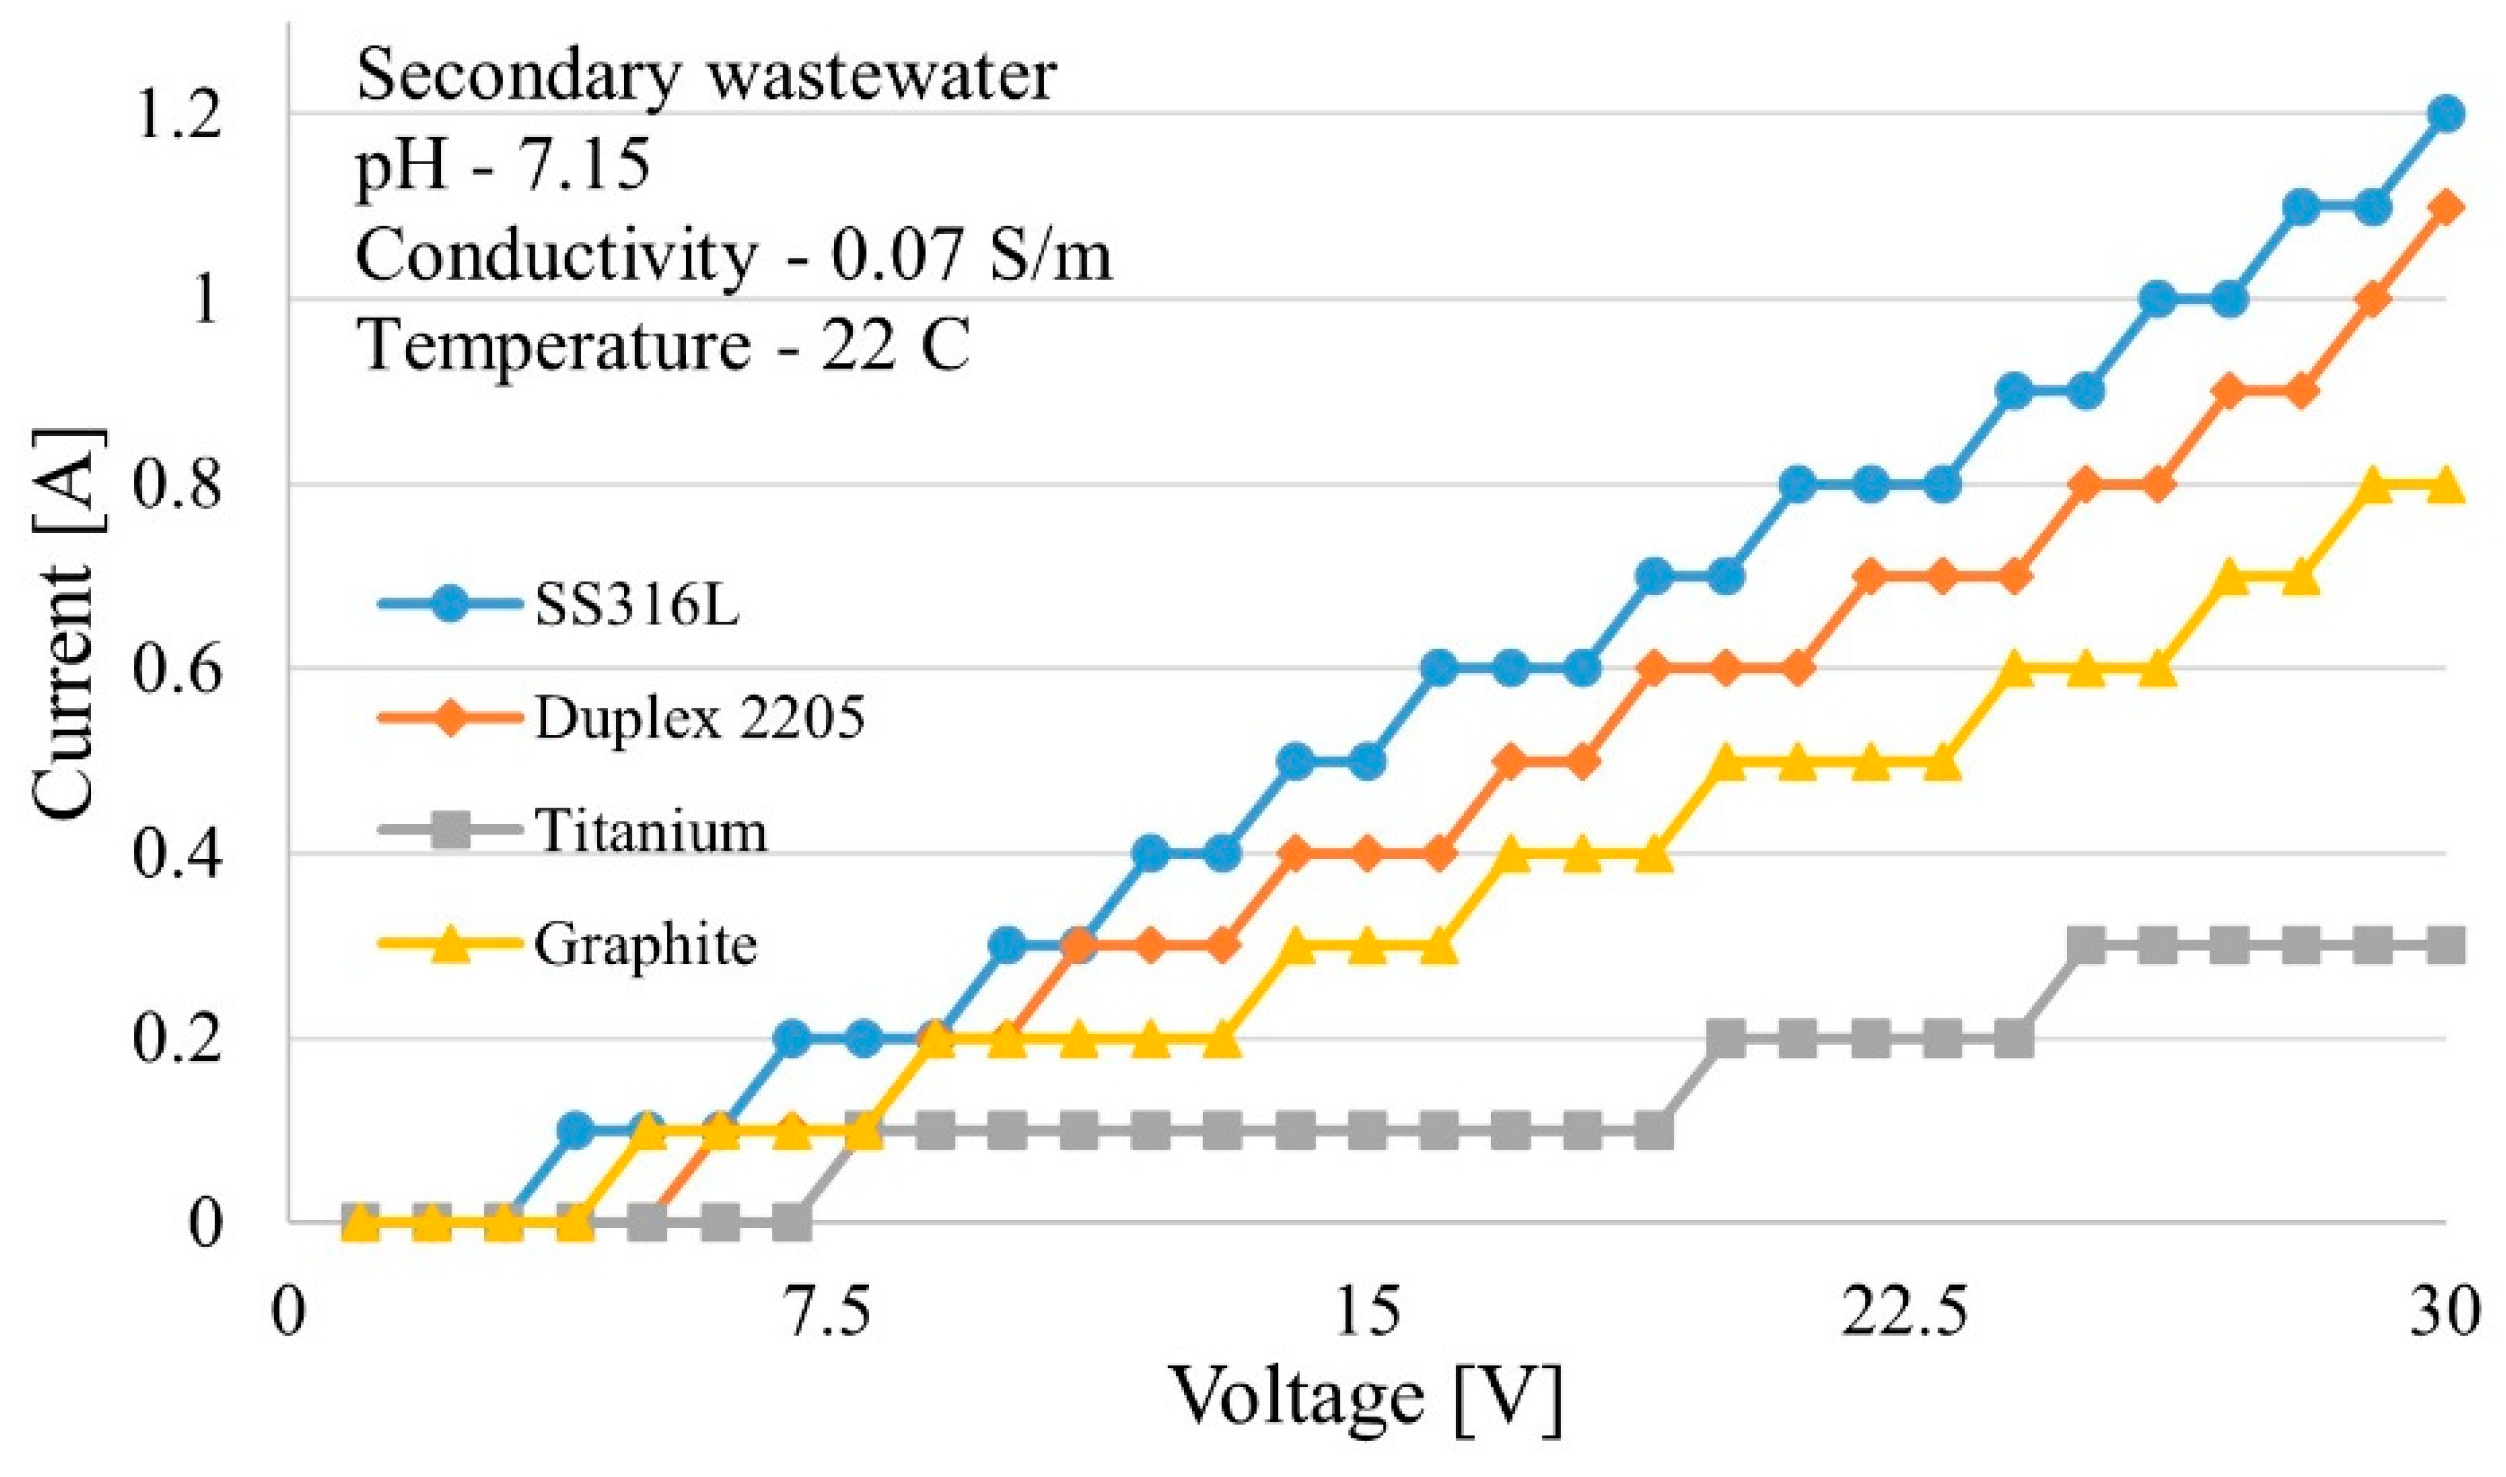

Table 1.
Electrical components and estimated load.
| Component | Estimated power required [W] |
|---|---|
| Electrolyzer | 160 |
| Pump | 160 |
| Fan | 30 |
| Pipe heater | 15 |
| LED lights | 10 |
| Sensors | 5 |
Table 2.
Value considered for wind calculation.
| Description | Symbol | Value |
|---|---|---|
| Impact surface wind | A | 2 m2 |
| Structure weight | m | 250 kg |
| Drag coefficient perpendicular panel | Cd | 2 [30] |
| Air density | 1.225 kg/m3 | |
| Flipping moment | MF | Nm |
| Stabilizing moment | MS | Nm |
| Flipping moment arm | 1.3 m | |
| Stabilizing moment arm | 0.5 m |
Disclaimer/Publisher’s Note: The statements, opinions and data contained in all publications are solely those of the individual author(s) and contributor(s) and not of MDPI and/or the editor(s). MDPI and/or the editor(s) disclaim responsibility for any injury to people or property resulting from any ideas, methods, instructions or products referred to in the content. |
© 2024 by the authors. Licensee MDPI, Basel, Switzerland. This article is an open access article distributed under the terms and conditions of the Creative Commons Attribution (CC BY) license (http://creativecommons.org/licenses/by/4.0/).
Copyright: This open access article is published under a Creative Commons CC BY 4.0 license, which permit the free download, distribution, and reuse, provided that the author and preprint are cited in any reuse.


