Submitted:
06 December 2024
Posted:
09 December 2024
Read the latest preprint version here
Abstract
Background: The rising popularity of snacks has increased concerns for metabolic health because many of these products—often marketed as healthy—are packed with carbohydrates that cause rapid blood sugar spikes followed by sharp drops. This cycle can lead to unstable energy levels and unhealthy eating habits. Methods: Here, we analyzed the glycemic response to the NotProtein bar, a protein bar formulated with Palatinose, and compared it to two of the top-selling snack bars in Chile. Ten healthy adults participated in the study, and their blood sugar levels were monitored after consuming portions standardized to contain 25 g of available carbohydrates. Results: The findings showed that the NotProtein bar had the most favorable glycemic response, with the lowest glycemic load (4.4). Accordingly, the NotProtein bar had a slower glucose absorption rate and faster clearance, promoting a more stable and sustained blood sugar response. Conclusions: The observed benefits can be attributed to the unique formulation of NotProtein, which combines Palatinose with higher levels of protein and fiber. This study underscores the potential of scientifically crafted snacks to improve metabolic health, offering a promising solution for those seeking balanced energy and better nutritional options in their daily diets.
Keywords:
carbohydrate metabolism
; glycemic load
; NotProtein bar
; Palatinose
; sugar crash
1. Introduction
Snack consumption has surged in recent years, driven by their convenience and the evolving lifestyle patterns of modern populations 1. Consumers often perceive protein bars as a healthy option among these products. However, many of these bars contain high levels of sugar that may harm health 2. Excessive sugar intake is strongly associated with poor metabolic outcomes 3. Sugary snacks can cause rapid spikes in blood sugar levels, followed by a sharp decline, a phenomenon known as a “sugar crash”. This sudden drop in energy often triggers cravings and promotes repetitive consumption, potentially contributing to unhealthy eating patterns 4. Thus, consuming foods with a minimal impact on blood glucose is increasingly recognized as essential for supporting metabolic health.
Snacking is a widespread habit in Chile, with around 25% of individuals reporting food consumption during the mid-morning, mid-afternoon, or late evening 5. Furthermore, snacks provide over one-quarter of the daily energy intake for children and adolescents in the country 6. Given the alarming rise in obesity and diabetes worldwide—including Chile, where more than 70% of the population is classified as overweight or obese 7—the food industry faces an urgent need to reimagine the composition of widely consumed products such as snacks to align with public health goals.
Isomaltulose (trade name Palatinose) is a disaccharide composed of glucose and fructose, linked by a stable α-1,6 glycosidic bond, which renders it less efficiently digested by intestinal enzymes compared to sucrose (de Souza et al., 2022). This characteristic allows Palatinose to exert a lower impact on blood glucose levels, providing metabolic benefits and sustaining energy release over time 8,9. In Latin America, Palatinose is already used in various sports nutrition products, including energy gels and powders 10.
This brief report evaluated the glycemic impact of the NotProtein bar (herein NotProtein), a commercial protein bar formulated with Palatinose to prevent blood sugar spikes, compared to two top-selling snack bars in the Chilean market. The findings highlight the potential of innovative formulations to support metabolic health through improved snack options.
2. Materials and Methods
2.1. Test Foods
The study evaluated three snack bars currently available in the Chilean market. The NotProtein bar was developed by The Not Company. Snack Bar 1 (SB1) was chosen for its popularity as a top-selling cereal bar, widely marketed as a snack for schoolchildren. Snack Bar 2 (SB2) is one of Chile’s leaders in the protein bar category. A glucose solution was used as the control food. Table 1 lists the nutritional information of the three bars.
2.2. Study Design
2.2.1. Subjects
The participants were 10 healthy adults (six females and four males) aged 20 to 54, with body mass index (BMI) values between 20 and 24.3 kg/m². Anthropometric measurements, including weight and height, were taken using standardized procedures (Amigo et al., 2010). Participants were selected based on inclusion criteria that required them to be healthy adults who had maintained a stable body weight over the past six months and were not using supplements or medications. Individuals were excluded if they had diagnosed medical conditions, allergies, intolerances to the test foods, or, in the case of women, a diagnosis of polycystic ovary syndrome. All participants were instructed to follow their regular diet throughout the study. Participation was voluntary, and each individual provided informed consent before the study began.
2.2.2. Experimental Procedure
The study was conducted at the Nutrition Department of the University of Chile and received approval from the Ethical Committee of Research in Human Subjects (CEISH, by its Spanish acronym) of the School of Medicine, University of Chile. The experimental procedure adhered to the ISO 26642:2010 guidelines for determining the glycemic index (GI).
Participants consumed the equivalent of 25 g of available carbohydrate for each bar, or a control sample composed of 25 g of glucose dissolved in 250 mL of water. Capillary blood samples were obtained via finger puncture at baseline (0 min, fasting glucose) and at subsequent intervals of 15, 30, 45, 60, 90, and 120 min after consumption. Blood glucose levels were measured using an Accu-Chek Instant glucometer (Roche Diabetes Care Inc., Indiana, US).
To ensure accuracy, participants were required to fast overnight (12 h) before the test and instructed to avoid alcohol consumption or vigorous physical activity on the morning of the assessment.
2.3. Glycemic Index Calculation
The incremental area under the curve (iAUC) for each test food was determined geometrically using the trapezoidal rule according to the ISO 26642:2010 guidelines 11. Fasting blood glucose levels were set as the baseline, and this area was excluded from the calculations.
The GI for each test food was calculated using Eq. 1:
where iAUCtest food represents the iAUC calculated for each snack bar, and iAUCcontrol food corresponds to the iAUC derived from the glucose solution.
The final GI value for each snack bar was obtained by averaging the GI values calculated individually for each of the 10 participants.
2.4. Glycemic Load Calculation
The glycemic load (GL) for each test food was determined following the method described by Salmerón et al. (1997). The calculation was performed using Eq. 2:
where GITest food represents the GI of the test food and the available carbohydrates are expressed in g/serving.
2.5. Kinetic and Thermodynamic Analysis
The kinetic and thermodynamic parameters of the test foods were determined to evaluate the foods’ glycemic responses. The analysis included the following parameters:
2.5.1. Time to Peak
This is the time between ingestion and the moment when the maximum blood glucose level is reached.
2.5.2. Absorption and Clearance Rates (Rab and Rcl) and Kinetic Constants (kab and kcl)
C0 (mg/dL) is the initial blood glucose concentration, Cpeak is the maximum concentration, and Cfinal is the concentration when blood glucose stabilizes at a constant value. Similarly, t0, tpeak, and tfinal denote the times associated with the above-mentioned points, measured in minutes.
Kinetic constants were calculated by dividing the Rab or Rcl by C0.
2.5.3. Gibbs Free Energy
The standard Gibbs free energy change (∆G’) was calculated using Eq. 5:
where R is the universal gas constant (8.314 J/mol K), T is the absolute temperature in Kelvin (310 K (37 °C)), and K is the equilibrium constant of the process (Eq. 6).
2.6. Statistical Analysis
The data were analyzed using repeated-measures analysis of variance (ANOVA) to evaluate variations across the tested foods. Differences in the iAUC, GI, and GL among the snack bars were assessed using the Friedman test, followed by Tukey’s post-hoc analysis for pairwise comparisons. A p-value < 0.05 was considered statistically significant.
Additionally, the values in the bar graphs illustrating the results were analyzed using one-way ANOVA to determine significant differences among the snack bars, ensuring robust statistical validation of the observed trends.
3. Results
3.1. Study Design and Participant Characteristics
The study involved 10 healthy participants (fasting glucose = 88.4 ± 3.8 mg/dL, fasting insulin = 6.9 ± 2.9 μL U/mL, and homeostatic model assessment for insulin resistance (HOMA-IR) = 1.5 ± 0.6 pmol × mmol). Each participant consumed an isocarbohydrate portion (25 g total) of the tested bars, and the postprandial glycemic response was monitored for 2 h.
3.2. Glycemic Response and iAUC
Glycemic response variations were observed across the tested bars (Fig. 1A). The NotProtein bar resulted in the smallest increase in blood glucose levels, followed by SB2. By contrast, SB1 elicited the highest glycemic response, approaching that of the glucose solution (control). Blood glucose levels peaked at 15 min post-consumption for the NotProtein and SB2 samples, whereas SB1 peaked at 30 min. A decline in glucose levels was noted at 30 min for NotProtein, whereas this decline occurred at 45 min for SB2. For SB1, glucose levels continuously decreased until 60 min, at which point all bars demonstrated similar levels. Thereafter, blood glucose levels remained comparable until the 120 min mark, with SB1 exhibiting slightly lower values during this period (Fig. 1A).
The iAUC analysis revealed that NotProtein elicited the lowest glycemic response, followed by SB2 and SB1. However, no significant differences were observed among them (Fig. 1B).
3.3. Glycemic Index and Glycemic Load
The GI analysis revealed that SB1 exhibited the highest value (83.7 ± 27.1), whereas NotProtein and SB2 indicated 42.9 ± 13.6 and 39.9 ± 12.6, respectively, with no significant differences between the latter two (Table 2). Furthermore, NotProtein presented the lowest GL value (4.4), followed by SB2 (7.0) and SB1 (10.8) (Table 2).
3.4. Metabolic Parameters
The time to reach peak glucose levels varied significantly among the samples. NotProtein required the longest time to reach peak glucose levels, in contrast with SB1, SB2, and the glucose control, which peaked around 30 min (Fig. 2A). NotProtein exhibited the lowest glucose Rab, similar to SB2, whereas SB1 and the glucose control showed the highest Rab (Fig. 2B). By contrast, NotProtein had the highest glucose Rcl, comparable to SB2, whereas the lowest Rcl corresponded to the glucose control and SB1 (Fig. 2C).
The changes in Gibbs free energy (ΔG’) further underscore the balance in metabolic dynamics. NotProtein had a ΔG’ closest to zero, indicating a near-equilibrium state, where the absorption and clearance rates are closely aligned (Fig. 2D). On the other hand, SB2 exhibited a more negative ΔG’, reflecting a moderate imbalance where absorption slightly exceeded clearance. SB1 and the glucose control had significantly negative ΔG’ values compared to NotProtein, but less negative than SB2.
4. Discussion
The NotProtein bar exhibited the most favorable glycemic profile among the three bars tested. Although no significant differences were observed in GI due to data variability, a subject-by-subject analysis revealed a clear trend. The SB1 bar showed the highest GI, aligning with its higher content of available carbohydrates compared with the other bars. The GI, which measures the rate at which a food raises blood glucose levels, is an inherent characteristic of carbohydrate-rich foods 13. However, the GI does not account for the glycemic impact of portion size, for which GL is more informative 14. Among the bars, NotProtein had the lowest GL (4.4), followed by SB2 (7.0) and SB1 (10.8), indicating that its consumption had a lower and more controlled glycemic impact.
Several factors influence the glycemic response, including the type and amount of carbohydrates, the presence of other nutrients such as proteins, fats, and fiber, and individual physiological differences 10,15. The NotProtein bar was formulated to minimize its glycemic impact, avoiding the sharp glucose spikes and subsequent crashes commonly associated with sweet snacks. To achieve this, Palatinose, a slow-digesting disaccharide that promotes a gradual and sustained rise in blood glucose, was used as the primary carbohydrate in the NotProtein bar formulation 16–18.
Palatinose and sucrose provide approximately 4 kcal/g, yet their metabolism rates differ considerably 19. Sucrose, which has an α-1,2 glycosidic bond, is rapidly hydrolyzed by intestinal invertase (sucrase) activity (Km ~10 mM; Vmax ~143 μmol/min/mg), releasing glucose and fructose for absorption 20,21. By contrast, Palatinose, which has an α-1,6 glycosidic bond, undergoes a slower hydrolysis, resulting in a prolonged release of its monosaccharides and avoiding abrupt glucose spikes. This slower metabolism is attributed to Palatinose’s higher Km and lower Vmax, supporting its classification as a slow-release carbohydrate 22.
The results show that the ΔG’ of the NotProtein bar is close to zero, which is favorable because it indicates the reaction is near equilibrium. This result reflects a balance between the absorption and clearance rates, promoting metabolic harmony. By contrast, although SB1 and the glucose control have less negative ΔG’ values, closer to that of the NotProtein Bar, their absorption and clearance rates exhibit significant differences. This finding suggests that ΔG’ alone is insufficient to fully assess the metabolic response and must be interpreted alongside the magnitudes of Rab and Rcl. On the other hand, SB2 shows a more negative ΔG’, indicating an imbalance in metabolic rates, with absorption outweighing clearance, which may not align with an optimized metabolic objective. This analysis underscores the importance of integrating multiple variables for a comprehensive understanding of the results. These findings are supported by the data previously reported for Palatinose vs. sucrose, suggesting a more stable and efficient metabolic profile for the former, improving postprandial glycemia and overall energy balance in the case of the NotProtein Bar, which uses Palatinose in its formulation.
The nutritional composition further contributed to the glycemic impact of the different bars. SB1 primarily contained wheat flour and sucrose, whereas SB2 incorporated date paste. The GI of these ingredients varied significantly, with Palatinose being the lowest (32), followed by date paste (60) and sucrose (65) 23. Additionally, the NotProtein bar contained more protein than SB1 (but was comparable to SB2) and had the highest fiber content among the bars. Proteins and fiber slow gastric emptying and glucose absorption, reducing the glycemic response 24.
The variability observed in the data emphasized the consistency of NotProtein’s glycemic effect, with its glycemic curve remaining nearly flat compared to the curves of the other bars. This behavior was noteworthy because a flatter curve minimizes glucose peaks and troughs, promoting metabolic stability 25.
Finally, the analysis of metabolic parameters highlighted the superior efficiency of NotProtein, which exhibited the lowest Rab and the highest Rcl. These findings and its ΔG’ closer to the equilibrium underscored NotProtein’s optimal postprandial glucose regulation. This is relevant because repeated glucose and insulin spikes are strongly associated with the development of metabolic disorders such as type 2 diabetes and obesity. In a global context where such conditions affect a substantial portion of the population, products like NotProtein are a tangible example of how scientific innovation can drive the creation of functional foods that improve metabolic and energy health.
5. Conclusions
This study highlights the potential of NotProtein to address the paradox of traditional snack and protein bars, which are often marketed as energy-boosting yet may lead to sugar spikes, subsequent energy crashes, and increased cravings. By incorporating Palatinose as its primary carbohydrate, NotProtein minimizes blood sugar fluctuations, delivering sustained energy without the abrupt peaks and troughs associated with high-sugar snacks. This glycemic stability aligns with consumer expectations of satiety, balanced energy levels, and improved overall health.
The findings demonstrate that NotProtein provides a low glycemic load and supports metabolic efficiency, as evidenced by its reduced blood glucose absorption rate, faster glucose clearance, and ΔG’ values closer to equilibrium. Such characteristics are fundamental in the context of global public health challenges, where the prevalence of conditions like type-2 diabetes and obesity continues to rise. By rethinking snack formulations to balance functionality, health, and indulgence, NotProtein demonstrates the potential of science-driven innovation to create products that meet consumer needs while promoting healthier lifestyles.
References
- Monteiro, C. A.; Moubarac, J.-C.; Cannon, G.; Ng, S. W.; Popkin, B. Ultra-Processed Products Are Becoming Dominant in the Global Food System. Obesity Reviews 2013, 14 (S2), 21–28. [CrossRef]
- Thakur, M.; Sharma, C.; Mehta, A.; Torrico, D. D. Health Claim Effects on Consumer Acceptability, Emotional Responses, and Purchase Intent of Protein Bars. J Agric Food Res 2022, 8, 100291. [CrossRef]
- Sturt, J. Higher Consumption of Sugar-Sweetened Beverages Is Associated with Increased Risk of Developing Type 2 Diabetes or Metabolic Syndrome. Evidence Based Nursing 2011, 14 (2), 35. [CrossRef]
- Mantantzis, K.; Schlaghecken, F.; Sünram-Lea, S. I.; Maylor, E. A. Sugar Rush or Sugar Crash? A Meta-Analysis of Carbohydrate Effects on Mood. Neurosci Biobehav Rev 2019, 101, 45–67. [CrossRef]
- Amigo, H.; Bustos, P.; Pizarro, M.; Pino, P.; Gutiérrez, L.; Aranda, W.; González, P.; Araneda, D.; Araya, H.; Mayas, N.; Urquidi, C.; Ulloa, L.; Erazo, M.; Pinheiro, A. C.; Cerda, R.; Valencia, A.; Gálvez, P.; Castillo, E.; Jelvez, I.; Godoy, J. P.; Quijada, S.; Martínez, C.; Carriquiry, A.; Cerecera Cabalín, F.; Ormazábal, F. Encuesta Nacional de Consumo Alimentario. Informe Final; Santiago of Chile, 2010.
- Jensen, M. L.; Corvalán, C.; Reyes, M.; Popkin, B. M.; Taillie, L. S. Snacking Patterns among Chilean Children and Adolescents: Is There Potential for Improvement? Public Health Nutr 2019, 22 (15), 2803–2812. [CrossRef]
- Margozzini, P.; Passi, Á. Encuesta Nacional de Salud, ENS 2016-2017: Un Aporte a La Planificación Sanitaria y Políticas Públicas En Chile. ARS MEDICA Revista de Ciencias Médicas 2018, 43 (1), 30–34. [CrossRef]
- Maresch, C. C.; Petry, S. F.; Theis, S.; Bosy-Westphal, A.; Linn, T. Low Glycemic Index Prototype Isomaltulose—Update of Clinical Trials. Nutrients 2017, 9 (4). [CrossRef]
- Kokubo, E.; Morita, S.; Nagashima, H.; Oshio, K.; Iwamoto, H.; Miyaji, K. Blood Glucose Response of a Low-Carbohydrate Oral Nutritional Supplement with Isomaltulose and Soluble Dietary Fiber in Individuals with Prediabetes: A Randomized, Single-Blind Crossover Trial. Nutrients 2022, 14 (12). [CrossRef]
- de Souza, W. F. C.; Almeida, F. L. C.; de Castro, R. J. S.; Sato, H. H. Isomaltulose: From Origin to Application and Its Beneficial Properties – A Bibliometric Approach. Food Research International 2022, 155, 111061. [CrossRef]
- ISO. Food Products — Determination of the Glycaemic Index (GI) and Recommendation for Food Classification; Geneva, Switzerland, Geneva, Switzerland, 2010.
- Salmerón, J.; Manson, J. E.; Stampfer, M. J.; Colditz, G. A.; Wing, A. L.; Willett, W. C. Dietary Fiber, Glycemic Load, and Risk of Non—Insulin-Dependent Diabetes Mellitus in Women. JAMA 1997, 277 (6), 472–477. [CrossRef]
- Esfahani, A.; Wong, J. M. W.; Mirrahimi, A.; Srichaikul, K.; Jenkins, D. J. A.; Kendall, C. W. C. The Glycemic Index: Physiological Significance. J Am Coll Nutr 2009, 28 (sup4), 439S-445S. [CrossRef]
- Vlachos, D.; Malisova, S.; Lindberg, F. A.; Karaniki, G. Glycemic Index (GI) or Glycemic Load (GL) and Dietary Interventions for Optimizing Postprandial Hyperglycemia in Patients with T2 Diabetes: A Review. Nutrients 2020, 12 (6), 1561. [CrossRef]
- de Aquino Souza Miskinis, R.; do Nascimento, L. Á.; Colussi, R. Bioactive Compounds from Acerola Pomace: A Review. Food Chem 2023, 404, 134613. [CrossRef]
- Miao, M.; Jiang, B.; Cui, S. W.; Zhang, T.; Jin, Z. Slowly Digestible Starch—A Review. Crit Rev Food Sci Nutr 2015, 55 (12), 1642–1657. [CrossRef]
- Angarita Dávila, L.; Bermúdez, V.; Aparicio, D.; Céspedes, V.; Escobar, Ma. C.; Durán-Agüero, S.; Cisternas, S.; de Assis Costa, J.; Rojas-Gómez, D.; Reyna, N.; López-Miranda, J. Effect of Oral Nutritional Supplements with Sucromalt and Isomaltulose versus Standard Formula on Glycaemic Index, Entero-Insular Axis Peptides and Subjective Appetite in Patients with Type 2 Diabetes: A Randomised Cross-Over Study. Nutrients 2019, 11 (7). [CrossRef]
- Aguiar, L. M.; Cazarin, C. B. B. In Vitro and in Vivo Methods to Predict Carbohydrate Bioaccessibility. Curr Opin Food Sci 2021, 42, 69–75. [CrossRef]
- Sawale, P. D.; Shendurse, A. M.; Mohan, M. S.; Patil, G. R. Isomaltulose (Palatinose) – An Emerging Carbohydrate. Food Biosci 2017, 18, 46–52. [CrossRef]
- Manoochehri, H.; Hosseini, N. F.; Saidijam, M.; Taheri, M.; Rezaee, H.; Nouri, F. A Review on Invertase: Its Potentials and Applications. Biocatal Agric Biotechnol 2020, 25, 101599. [CrossRef]
- Her, C.; Singh, J.; Krishnan, V. V. Effect of Sucralose on the Enzyme Kinetics of Invertase Using Real-Time NMR Spectroscopy and Progress Curve Analysis. Carbohydr Res 2018, 455, 5–9. [CrossRef]
- Sokołowska, E.; Sadowska, A.; Sawicka, D.; Kotulska-Bąblińska, I.; Car, H. A Head-to-Head Comparison Review of Biological and Toxicological Studies of Isomaltulose, d-Tagatose, and Trehalose on Glycemic Control. Crit Rev Food Sci Nutr 2022, 62 (21), 5679–5704. [CrossRef]
- Brand-Miller, J. Glycemic Index Research and GI News. https://glycemicindex.com/.
- Pasmans, K.; Meex, R. C. R.; van Loon, L. J. C.; Blaak, E. E. Nutritional Strategies to Attenuate Postprandial Glycemic Response. Obesity Reviews 2022, 23 (9), e13486. [CrossRef]
- McHill, A. W.; Butler, M. P. Eating Around the Clock: Circadian Rhythms of Eating and Metabolism. Annu Rev Nutr 2024, 44 (Volume 44, 2024), 25–50. [CrossRef]
- Aguiar, L. M., & Cazarin, C. B. B. (2021). In vitro and in vivo methods to predict carbohydrate bioaccessibility. Current Opinion in Food Science, 42, 69–75. [CrossRef]
- Amigo, H., Bustos, P., Pizarro, M., Pino, P., Gutiérrez, L., Aranda, W., González, P., Araneda, D., Araya, H., Mayas, N., Urquidi, C., Ulloa, L., Erazo, M., Pinheiro, A. C., Cerda, R., Valencia, A., Gálvez, P., Castillo, E., Jelvez, I., … Ormazábal, F. (2010). Encuesta Nacional de Consumo Alimentario. Informe Final.
- Angarita Dávila, L., Bermúdez, V., Aparicio, D., Céspedes, V., Escobar, Ma. C., Durán-Agüero, S., Cisternas, S., de Assis Costa, J., Rojas-Gómez, D., Reyna, N., & López-Miranda, J. (2019). Effect of Oral Nutritional Supplements with Sucromalt and Isomaltulose versus Standard Formula on Glycaemic Index, Entero-Insular Axis Peptides and Subjective Appetite in Patients with Type 2 Diabetes: A Randomised Cross-Over Study. Nutrients, 11(7). [CrossRef]
- Brand-Miller, J. (2024, November 20). Glycemic Index Research and GI News. Https://Glycemicindex.Com/.
- de Aquino Souza Miskinis, R., do Nascimento, L. Á., & Colussi, R. (2023). Bioactive compounds from acerola pomace: A review. Food Chemistry, 404, 134613. [CrossRef]
- de Souza, W. F. C., Almeida, F. L. C., de Castro, R. J. S., & Sato, H. H. (2022). Isomaltulose: From origin to application and its beneficial properties – A bibliometric approach. Food Research International, 155, 111061. [CrossRef]
- Esfahani, A., Wong, J. M. W., Mirrahimi, A., Srichaikul, K., Jenkins, D. J. A., & Kendall, C. W. C. (2009). The Glycemic Index: Physiological Significance. Journal of the American College of Nutrition, 28(sup4), 439S-445S. [CrossRef]
- Her, C., Singh, J., & Krishnan, V. V. (2018). Effect of sucralose on the enzyme kinetics of invertase using real-time NMR spectroscopy and progress curve analysis. Carbohydrate Research, 455, 5–9. [CrossRef]
- ISO. (2010). Food products — Determination of the glycaemic index (GI) and recommendation for food classification. In ISO 26642:2010.
- Jensen, M. L., Corvalán, C., Reyes, M., Popkin, B. M., & Taillie, L. S. (2019). Snacking patterns among Chilean children and adolescents: is there potential for improvement? Public Health Nutrition, 22(15), 2803–2812. [CrossRef]
- Kokubo, E., Morita, S., Nagashima, H., Oshio, K., Iwamoto, H., & Miyaji, K. (2022). Blood Glucose Response of a Low-Carbohydrate Oral Nutritional Supplement with Isomaltulose and Soluble Dietary Fiber in Individuals with Prediabetes: A Randomized, Single-Blind Crossover Trial. Nutrients, 14(12). [CrossRef]
- Manoochehri, H., Hosseini, N. F., Saidijam, M., Taheri, M., Rezaee, H., & Nouri, F. (2020). A review on invertase: Its potentials and applications. Biocatalysis and Agricultural Biotechnology, 25, 101599. [CrossRef]
- Mantantzis, K., Schlaghecken, F., Sünram-Lea, S. I., & Maylor, E. A. (2019). Sugar rush or sugar crash? A meta-analysis of carbohydrate effects on mood. Neuroscience & Biobehavioral Reviews, 101, 45–67. [CrossRef]
- Maresch, C. C., Petry, S. F., Theis, S., Bosy-Westphal, A., & Linn, T. (2017). Low Glycemic Index Prototype Isomaltulose—Update of Clinical Trials. Nutrients, 9(4). [CrossRef]
- Margozzini, P., & Passi, Á. (2018). Encuesta Nacional de Salud, ENS 2016-2017: un aporte a la planificación sanitaria y políticas públicas en Chile. ARS MEDICA Revista de Ciencias Médicas, 43(1), 30–34. [CrossRef]
- McHill, A. W., & Butler, M. P. (2024). Eating Around the Clock: Circadian Rhythms of Eating and Metabolism. Annual Review of Nutrition, 44(Volume 44, 2024), 25–50. [CrossRef]
- Miao, M., Jiang, B., Cui, S. W., Zhang, T., & Jin, Z. (2015). Slowly Digestible Starch—A Review. Critical Reviews in Food Science and Nutrition, 55(12), 1642–1657. [CrossRef]
- Monteiro, C. A., Moubarac, J.-C., Cannon, G., Ng, S. W., & Popkin, B. (2013). Ultra-processed products are becoming dominant in the global food system. Obesity Reviews, 14(S2), 21–28. [CrossRef]
- Pasmans, K., Meex, R. C. R., van Loon, L. J. C., & Blaak, E. E. (2022). Nutritional strategies to attenuate postprandial glycemic response. Obesity Reviews, 23(9), e13486. [CrossRef]
- Salmerón, J., Manson, J. E., Stampfer, M. J., Colditz, G. A., Wing, A. L., & Willett, W. C. (1997). Dietary Fiber, Glycemic Load, and Risk of Non—insulin-dependent Diabetes Mellitus in Women. JAMA, 277(6), 472–477. [CrossRef]
- Sawale, P. D., Shendurse, A. M., Mohan, M. S., & Patil, G. R. (2017). Isomaltulose (Palatinose) – An emerging carbohydrate. Food Bioscience, 18, 46–52. [CrossRef]
- Soares, B., Gouveia, C., Albuquerque, D., & Pinho, P. (2024). Impact and Classification of Body Stature and Physiological Variability in the Acquisition of Vital Signs Using Continuous Wave Radar. Applied Sciences, 14(2). [CrossRef]
- Sokołowska, E., Sadowska, A., Sawicka, D., Kotulska-Bąblińska, I., & Car, H. (2022). A head-to-head comparison review of biological and toxicological studies of isomaltulose, d-tagatose, and trehalose on glycemic control. Critical Reviews in Food Science and Nutrition, 62(21), 5679–5704. [CrossRef]
- Sturt, J. (2011). Higher consumption of sugar-sweetened beverages is associated with increased risk of developing type 2 diabetes or metabolic syndrome. Evidence Based Nursing, 14(2), 35. [CrossRef]
- Thakur, M., Sharma, C., Mehta, A., & Torrico, D. D. (2022). Health claim effects on consumer acceptability, emotional responses, and purchase intent of protein bars. Journal of Agriculture and Food Research, 8, 100291. [CrossRef]
- Vlachos, D., Malisova, S., Lindberg, F. A., & Karaniki, G. (2020). Glycemic Index (GI) or Glycemic Load (GL) and Dietary Interventions for Optimizing Postprandial Hyperglycemia in Patients with T2 Diabetes: A Review. Nutrients, 12(6), 1561. [CrossRef]
Figure 1.
Postprandial glycemic response to the tested snack bars and glucose control. (a) Blood glucose levels (mg/dL) over time (min) after consuming the glucose control, Snack Bar 1, Snack Bar 2, and the NotProtein bar. (b) The incremental area under the curve (iAUC) is calculated using the glycemic responses in (a). Data are presented as the mean ± SE (n = 10). Different letters indicate statistically significant differences (p < 0.05).
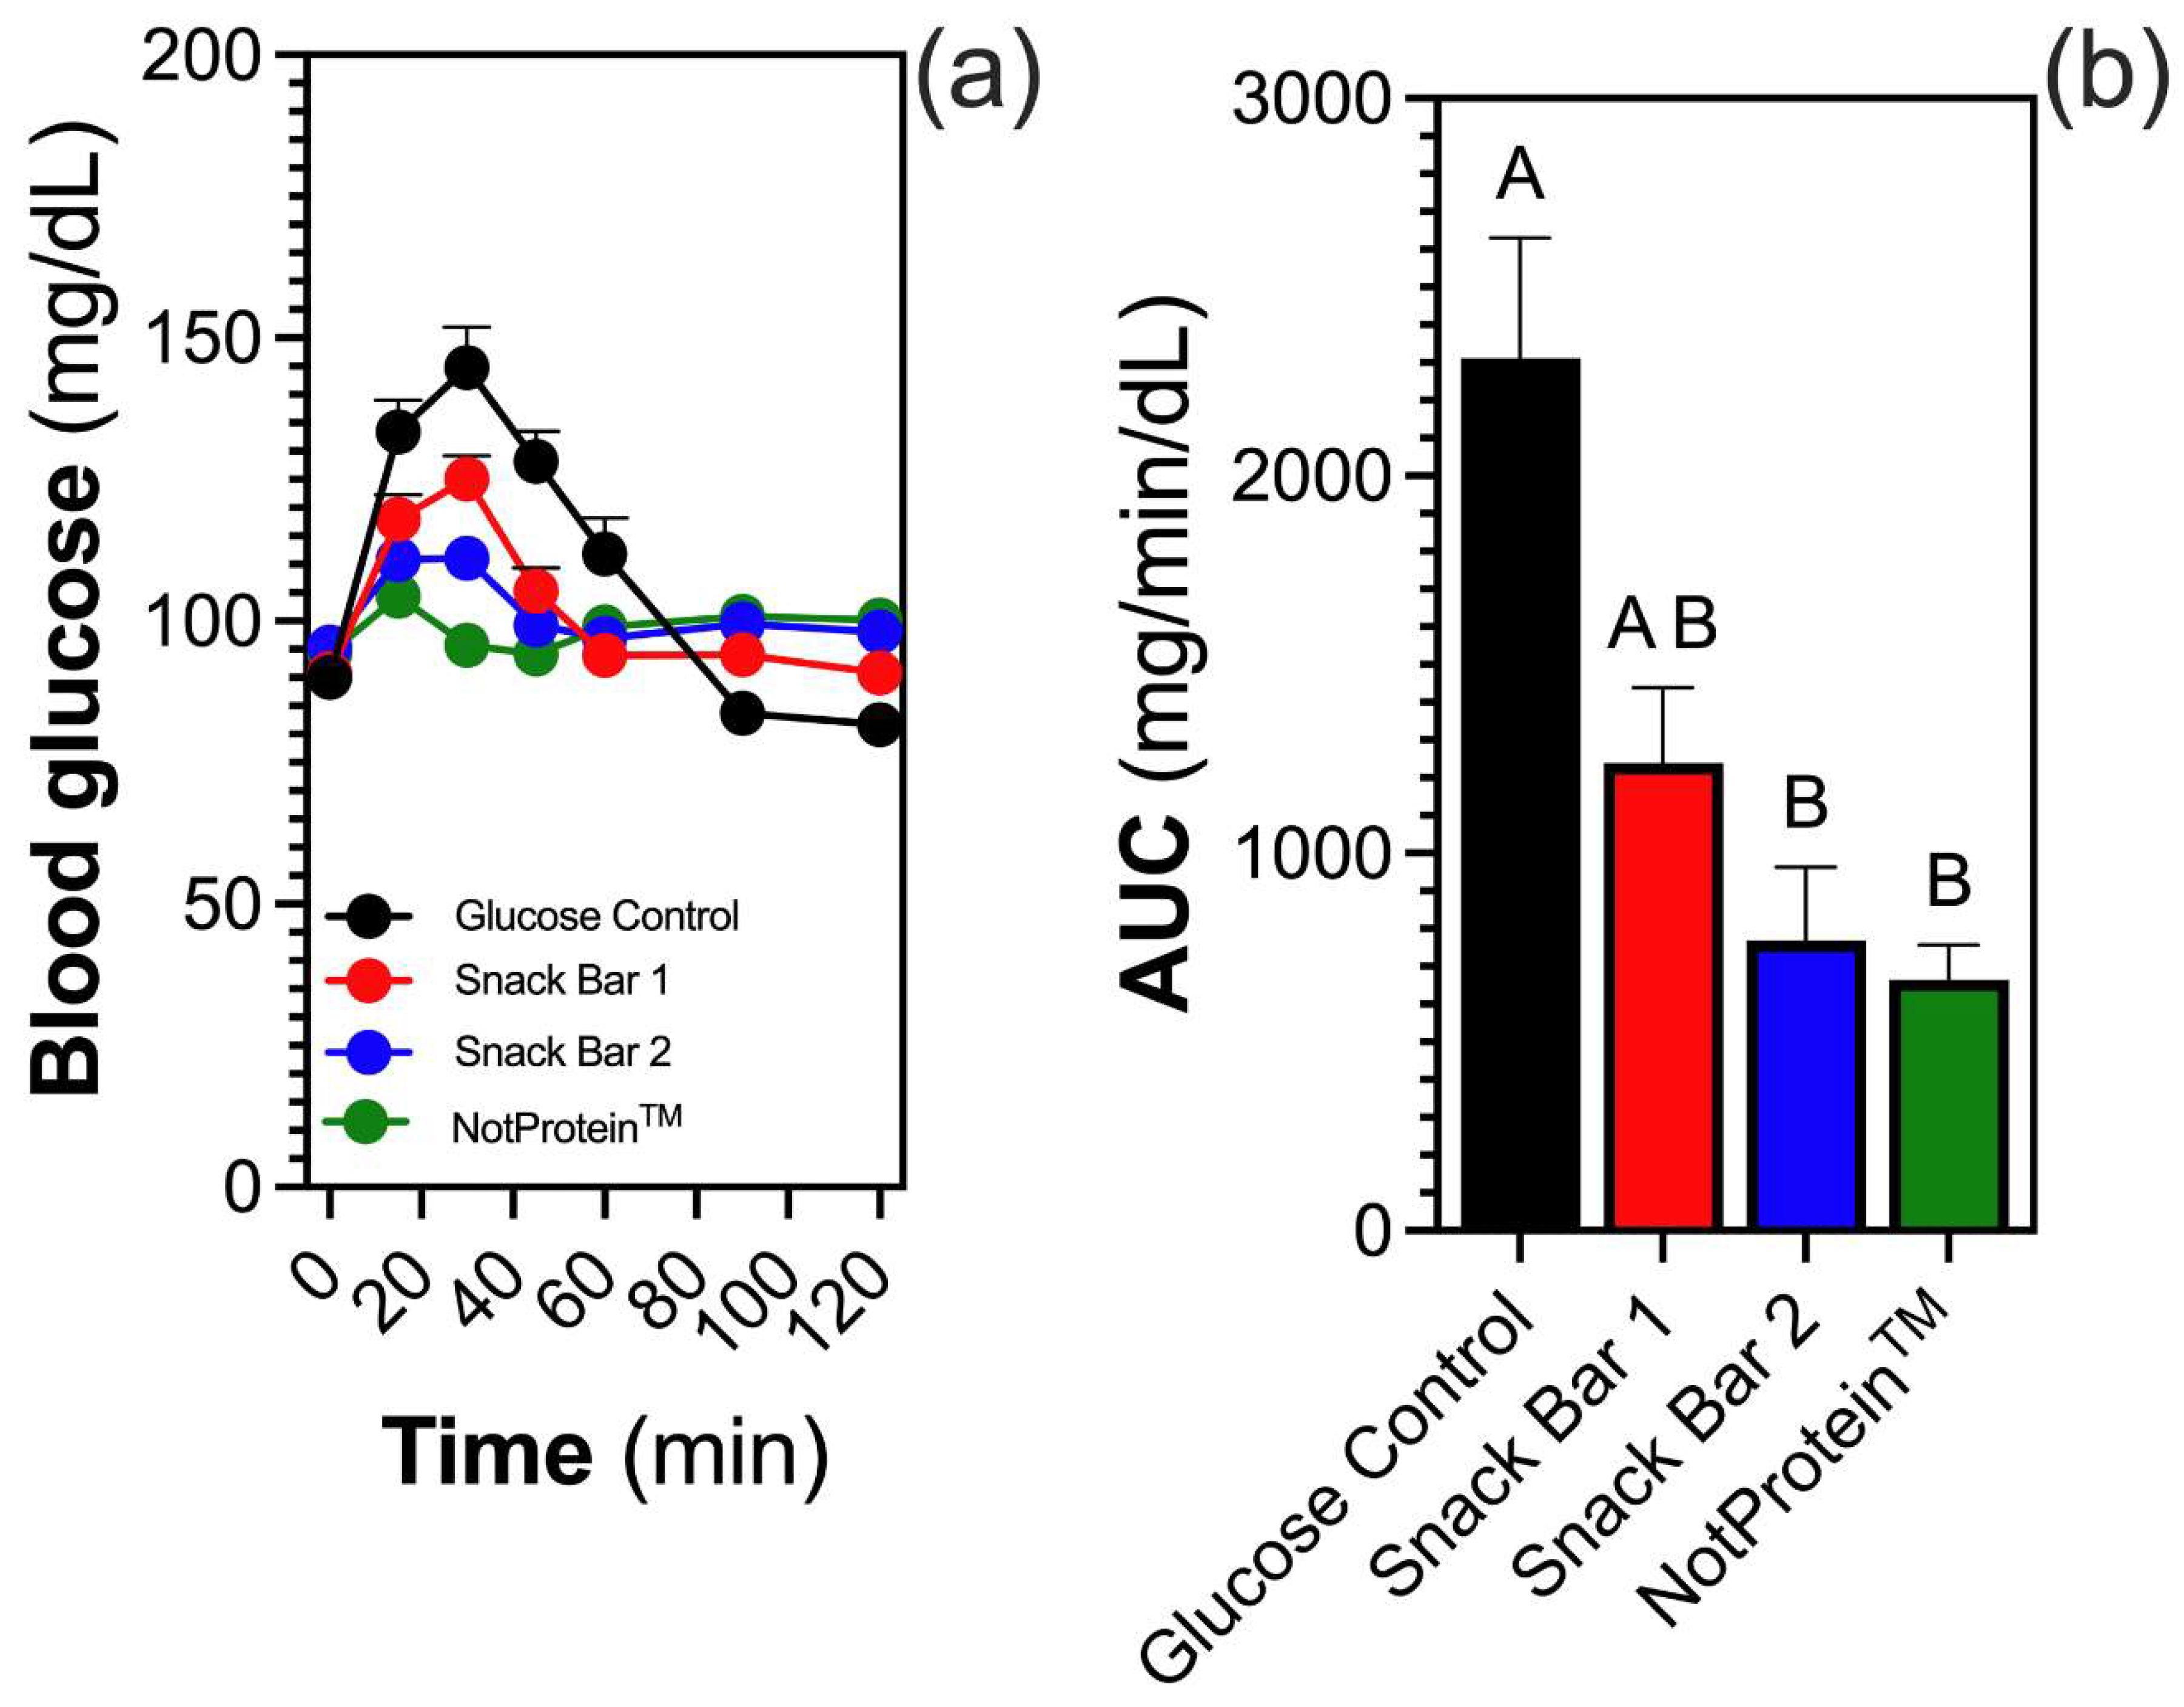
Figure 2.
Violin plots showing the effects of different snack bar formulations on key metabolic parameters. (a) Time to peak glucose levels (min) after consumption, indicating the duration required to reach maximum glucose levels. (b) Glucose absorption rate (Rab, mg/dL/min), representing differences in sugar uptake. (c) Glucose clearance rate (Rcl, mg/dL/min), reflecting the dynamics of glucose removal. (d) Change in Gibbs free energy (∆G’, kJ/mol), associated with metabolic efficiency. Data are presented for the glucose control, Snack Bar 1, Snack Bar 2, and NotProtein bar groups. Significant differences between groups are indicated by different letters (p < 0.05).
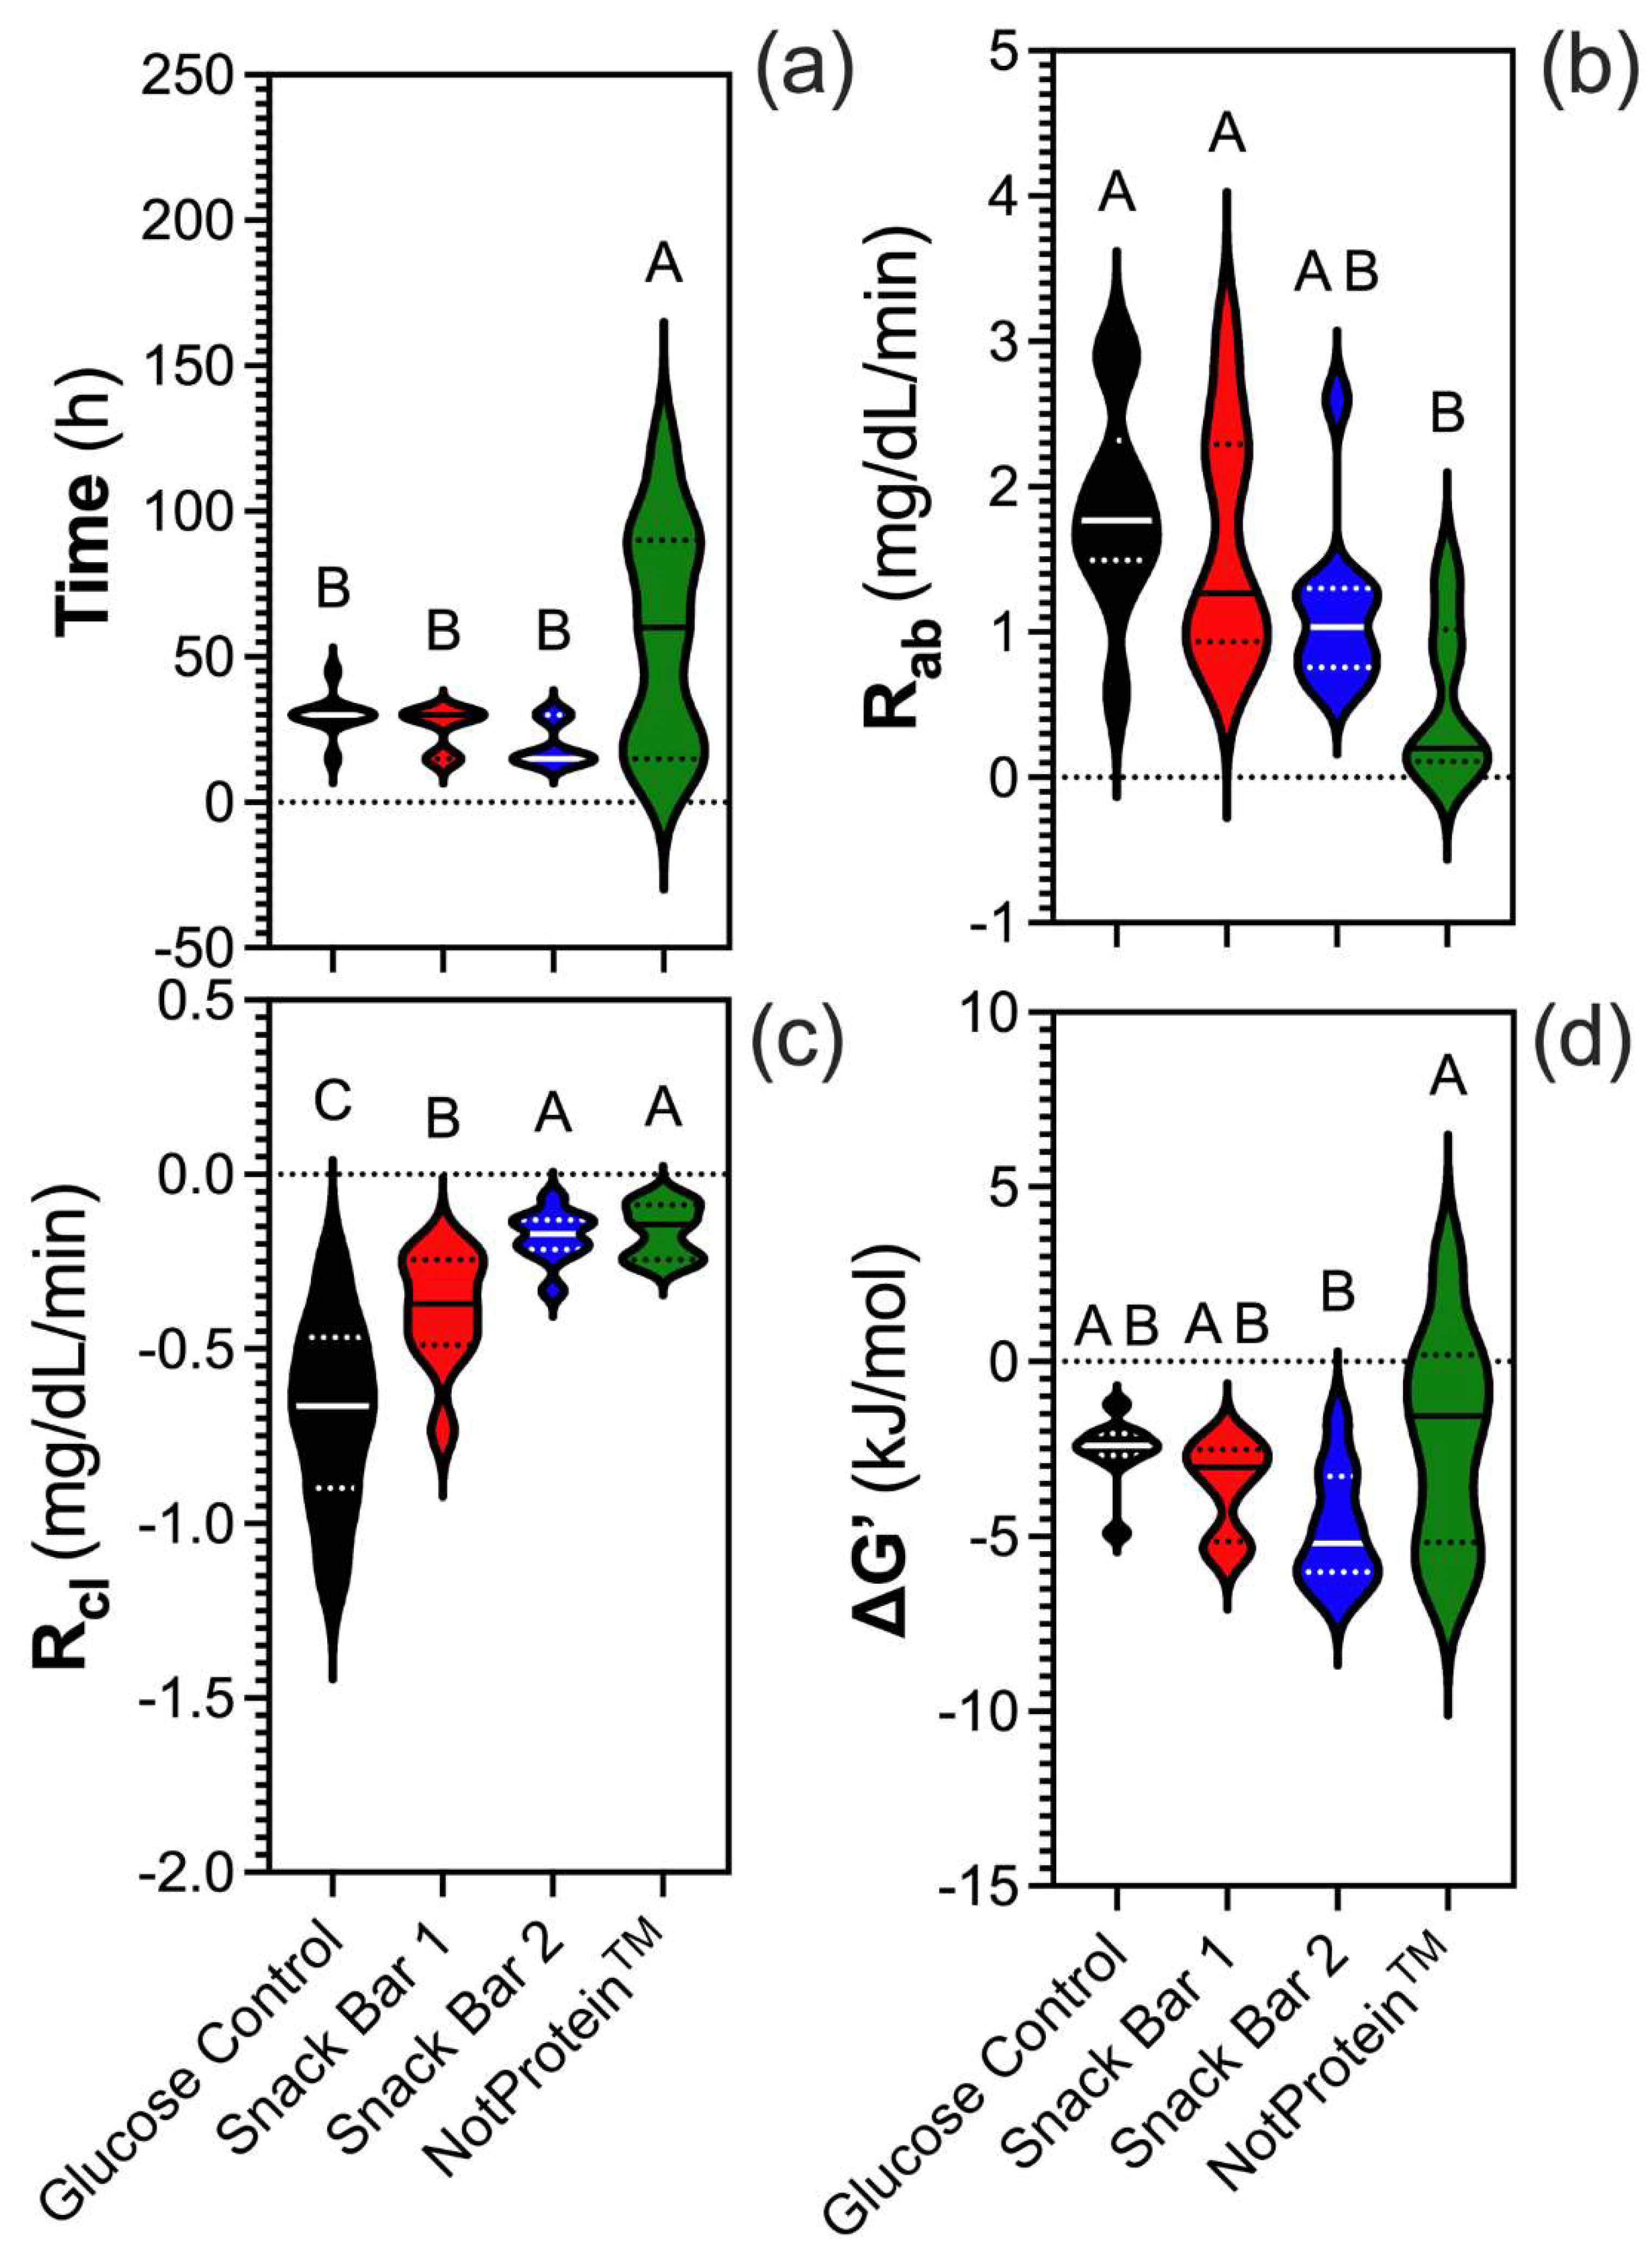

Table 1.
Nutritional information of the snack bars used in this study. Values are per 100 g.
| Constituent (100 g) | Snack Bar 1 | Snack Bar 2 | NotProtein bar |
|---|---|---|---|
| Energy (kcal) | 385 | 373 | 303 |
| Protein (g) | 5.2 | 33.4 | 35 |
| Total fat (g) | 9.3 | 9.3 | 7.7 |
| Available carbohydrates (g) | 71.5 | 38.9 | 23.0 |
| Total sugar (g) | 40.1 | 13.9 | 5.4 |
| Fiber (g) | 3.4 | - | 17.0 |
Table 2.
Glycemic index and glycemic load of the snack bars evaluated.
| Parameter | Snack Bar 1 | Snack Bar 2 | NotProtein bar |
|---|---|---|---|
| Glycemic index | 83.7 ± 27.1a | 39.9 ±12.6b | 42.9 ± 13.6 b |
| Available carbohydrates/serving (g) | 12.87 | 17.51 | 10.35 |
| Glycemic load | 10.8 | 7.0 | 4.4 |
Disclaimer/Publisher’s Note: The statements, opinions and data contained in all publications are solely those of the individual author(s) and contributor(s) and not of MDPI and/or the editor(s). MDPI and/or the editor(s) disclaim responsibility for any injury to people or property resulting from any ideas, methods, instructions or products referred to in the content. |
© 2024 by the authors. Licensee MDPI, Basel, Switzerland. This article is an open access article distributed under the terms and conditions of the Creative Commons Attribution (CC BY) license (http://creativecommons.org/licenses/by/4.0/).
Copyright: This open access article is published under a Creative Commons CC BY 4.0 license, which permit the free download, distribution, and reuse, provided that the author and preprint are cited in any reuse.


