Preprint
Article

This version is not peer-reviewed.

Validation of Monilinia fructicola Putative Effector Genes in Different Host Peach (Prunus persica) Cultivars and Defense Response Investigation

A peer-reviewed article of this preprint also exists.

Submitted:

05 December 2024

Posted:

06 December 2024

You are already at the latest version

Abstract

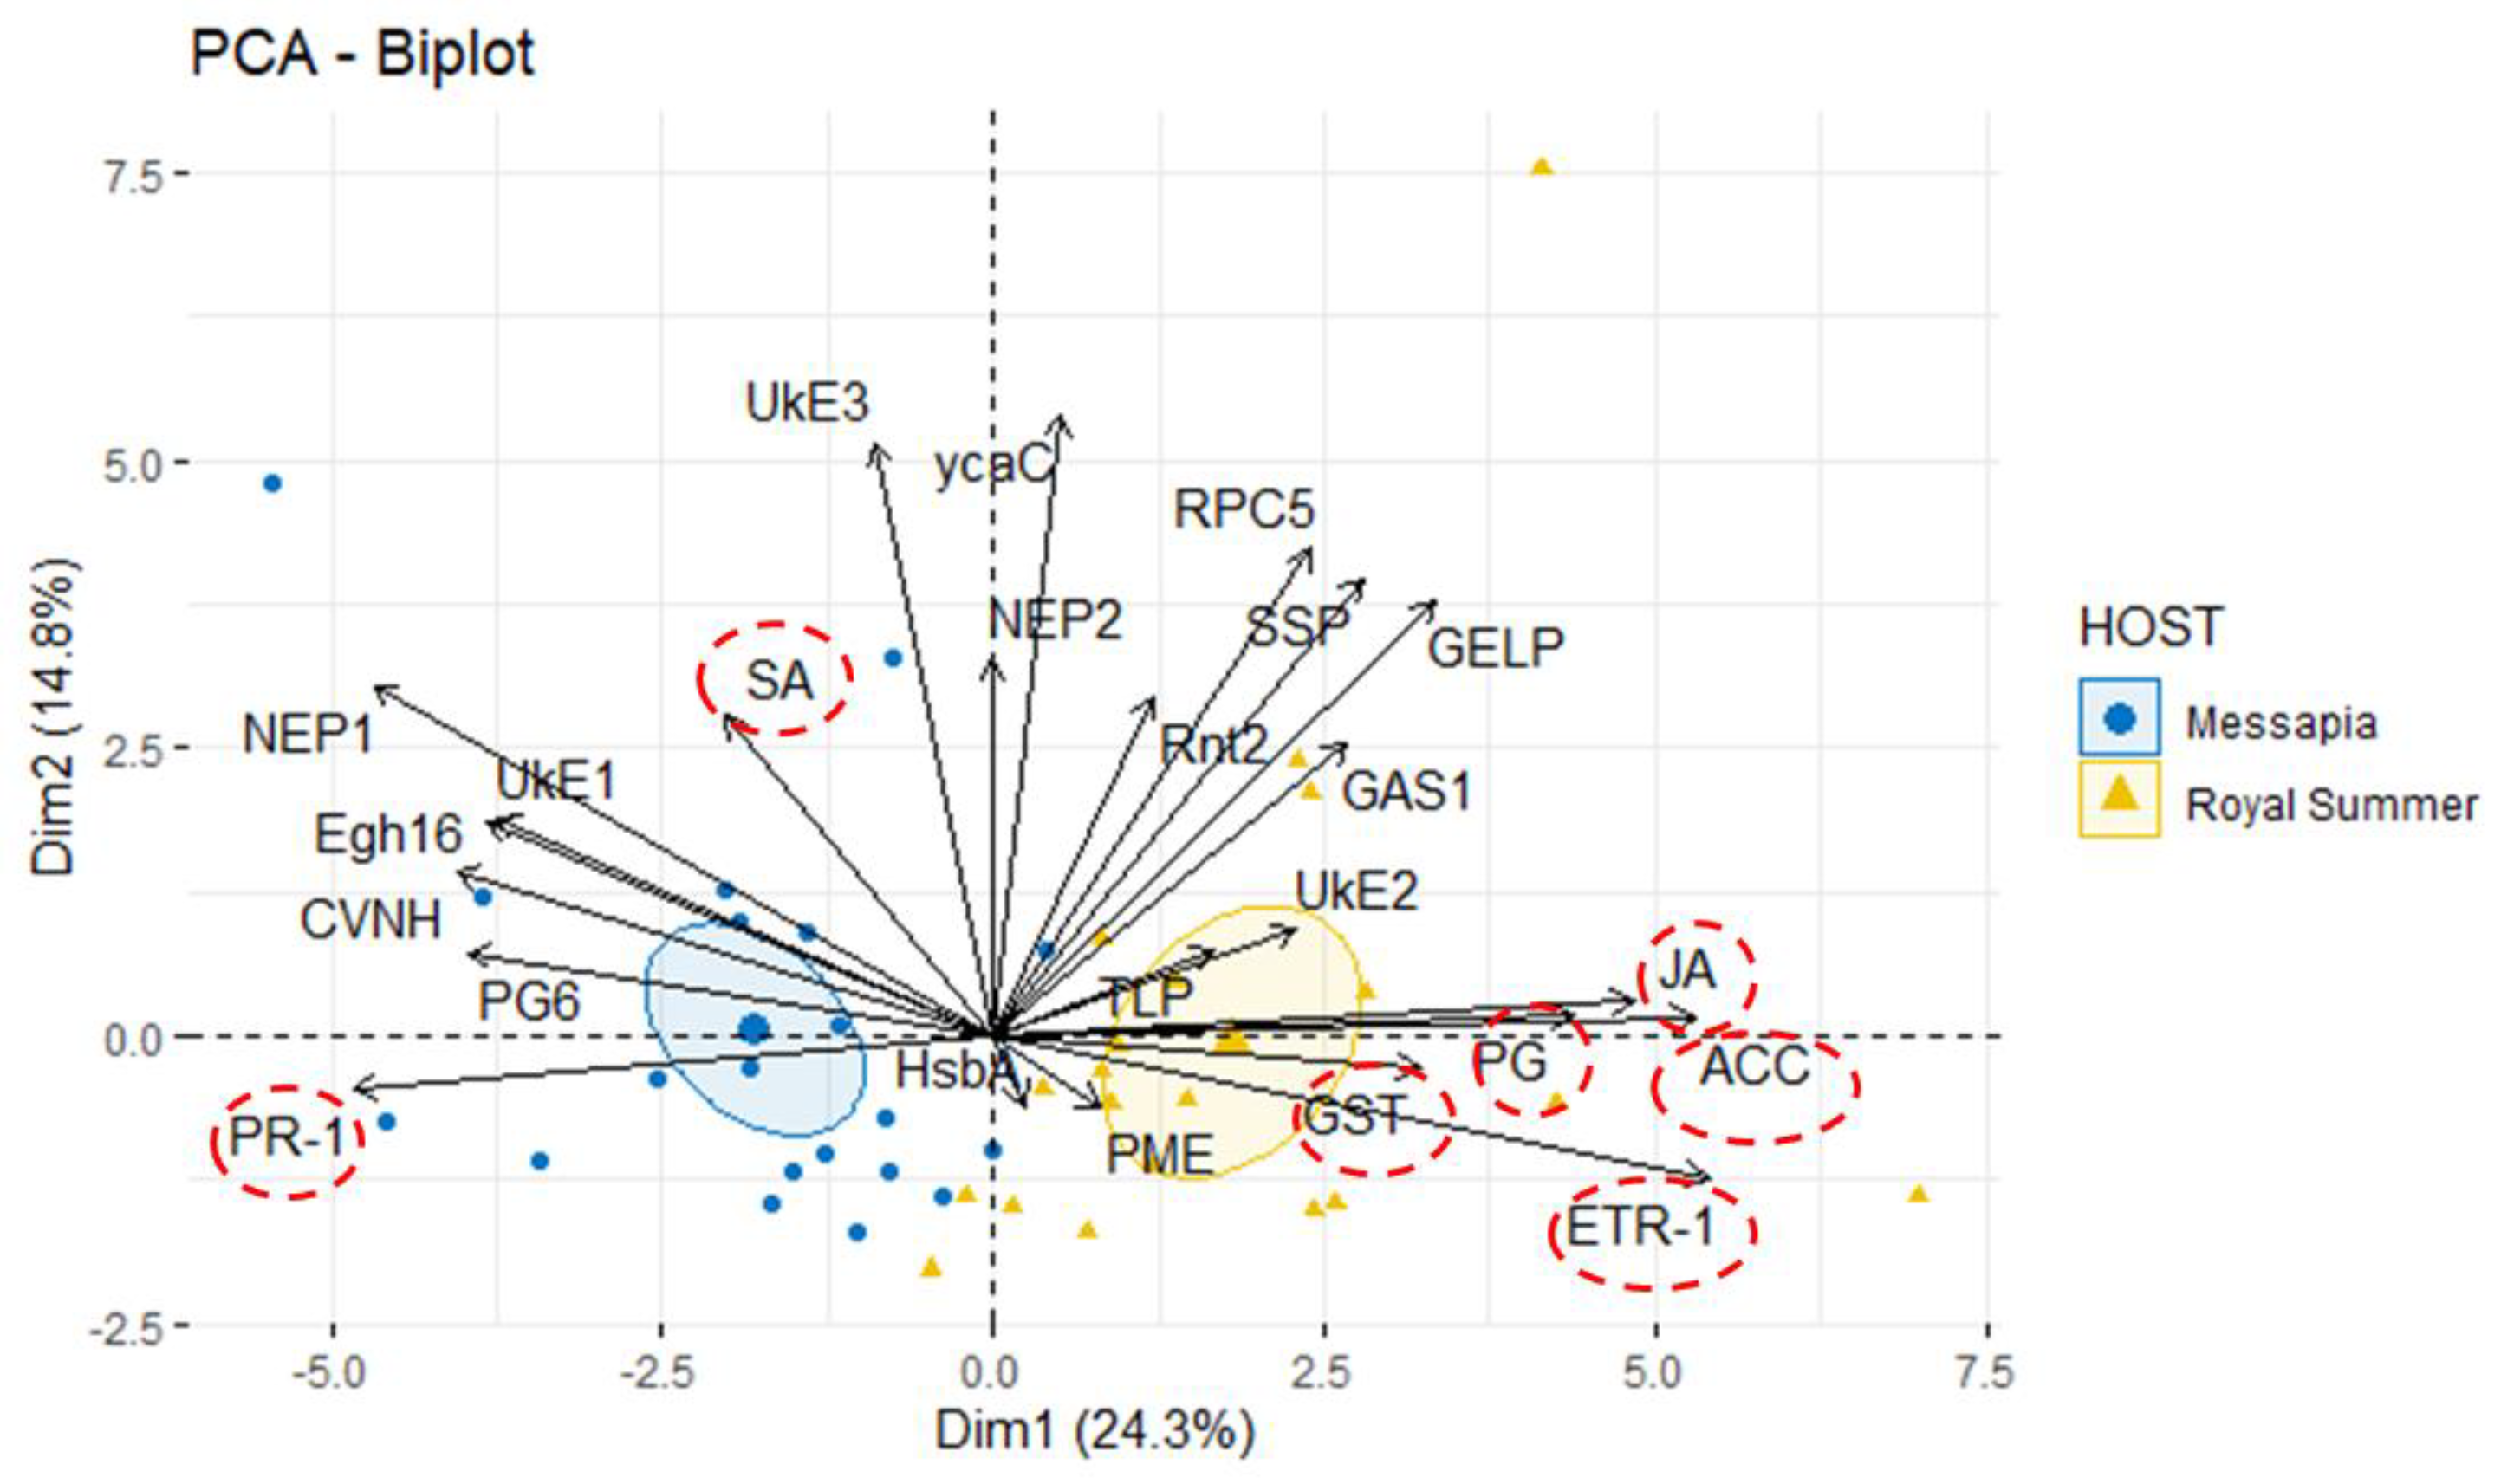
Monilinia fructicola is the most common and destructive brown rot agent on peaches. Knowledge of gene expression mediating host–pathogen interaction is essential to manage fungal plant diseases. M. fructicola putative virulence factors have been predicted by genome investigations. The pathogen interaction with the host was validated. Five M. fructicola isolates were inoculated on two cultivars (cv.s) of peach [Prunus persica (L.) Batsch] ‘Royal Summer’ and ‘Messapia’ with intermediate and late ripening periods, respectively. The expression pattern of 17 candidate effector genes of M. fructicola with functions linked to host invasion and fungal life, and seven peach genes involved in the immune defense system were monitored at 0, 2, 6, 10, and 24 h-post inoculation (hpi). All fungal isolates induced similar brown rot lesions on both cv.s whereas the modulation of effector genes was regulated mainly at 2, 6, and 10 hpi, when disease symptoms appeared on the fruit surface, confirming the involvement of effector genes in the early infection stage. Although differences were observed among the fungal isolates, the principal component investigation identified the main differences linked to the host genotype. The salicylic acid and jasmonate/ethylene signaling pathways were differently modulated in the host independent from the fungal isolate used for inoculation. On plants susceptible to brown rot, the pathogen may have adapted to the host’s physiology by modulating its effectors as weapons.

Keywords: 
;  ;  ;  ;  

1. Introduction

Brown rot is one of the most destructive diseases of stone and pome fruits (peach, nectarine, apricot, cherry, and plum) both in the field and postharvest [1]. The most important causal agents are the fungal species Monilinia fructicola (G. Winter) Honey, Monilinia laxa (Aderhold and Ruhland) Honey, and Monilinia fructigena (Aderhold and Ruhland) Honey. In the field, they induce indistinguishable symptoms on blossoms, twigs, branches, and fruits of susceptible host plants [2]. Estimates of losses are usually about 30% during the growing season [3]. Stone fruits with latent Monilinia infection develop disease symptoms at the market stage, leading to losses during postharvest storage that can exceed 80% [4,5]. Of the three closely related fungal species causing brown rot, M. fructicola is the most common on stone fruits and frequently found in North America, Australia, New Zealand, Japan, Brazil, and other South American countries [6]. In 2001, M. fructicola was reported in France on peach [7] and has rapidly spread to other European countries, becoming more prevalent than the former indigenous species [8,9,10]. Preharvest and postharvest brown rot disease management is performed using synthetic fungicide application in the orchard during the growing season [11]. The use of sustainable and environmentally friendly alternatives has increased in the last few decades [4,12,13]. However, for fruits such as peaches and nectarines, included in the list of the most produced fruits in Europe (FAOSTAT, 2021), brown rot is still highly destructive from fruit formation to storage [4].
Investigating the molecular mechanisms of plant-microbe interaction, fungal pathogenicity, and plant resistance is crucial to developing novel and safer strategies for the effective control of plant diseases. Plants have developed multilayered defense mechanisms to effectively prevent pathogen infections [14]. Pattern-triggered immunity (PTI) functions as the first layer of the plant immune system, which is activated by pathogen-associated molecular patterns (PAMPs) and microbe-associated molecular patterns (MAMPs) related to fungal chitin or bacterial flagellin, or molecules resulting from the plant–pathogen interaction (damage-associated molecular patterns – DAMPs), such as peptides and oligosaccharides [14,15]. To detect PAMPs, MAMPs, or DAMPs, plants use cell surface-localized pattern recognition receptors (PRRs), mainly in the form of receptor-like protein kinases and receptor-like proteins [16]. Activation of these receptors provokes an array of plant defense responses, including influx of extracellular Ca2+ into the cytosol, reactive oxygen species (ROS) signaling, and defense pathways mediated by hormones, such as salicylic acid, jasmonic acid, ethylene, and cytokinin [17,18]. However, to defeat PTI responses, many pathogens deploy a variety of effector proteins. When they are recognized by specialized receptors in the plant, called resistance (R) proteins, the second layer of plant immune responses, referred to as effector-triggered immunity (ETI) is activated. Fungal effector proteins can be generally grouped based on their mode of deployment within the host effectors secreted into the apoplast or xylem of the host plant and cytoplasmic effectors translocated into host cells [19]. Effector proteins increase host susceptibility via multiple pathways, especially by suppressing plant defense responses [20]. Therefore, pathogen effector identification is critical for the development of crop disease resistance [21]. An improved understanding of fungal effector function and the associated underlying mechanisms, in conjunction with the use of host-resistant genotypes and induction of gene-silencing plants to obtain disease resistance, could be a critical strategy to prevent and control plant diseases in the future.
Genomics has revolutionized our ability to characterize pathogens, increasing public databases with new genomic resources. High-quality draft genomes of M. fructicola and other Monilinia species have recently become available [22,23,24,25,26,27]. Furthermore, they represent useful sources for investigations into the evolutionary history of the Monilinia genus within the Sclerotiniaceae family, as well as into pathogenicity mechanisms and host–pathogen interactions. The necrotrophic lifestyle associated with Monilinia spp. typically involves secretion of cell-wall-degrading enzymes and toxic metabolites to destroy tissues, degrade plant cell-wall components, and start infection [27,28,29,30]. However, more research is required to validate key virulence factors in the host-compatible responses.
With the aim to validate the in vivo involvement of putative effector genes of M. fructicola selected by genomic investigation [30], five different M. fructicola fungal isolates were inoculated in two host peach cv.s (Prunus persica), ‘Royal Summer’ and ‘Messapia’ with intermediate and very late ripening time maturation, respectively. After inoculation, the expression profiles of 17 putative effector genes and seven defense genes induced in peach fruits by M. fructicola colonization were analyzed at 0, 2, 6, 10, and 24 h-post inoculation (hpi).

2. Materials and Methods

2.1. Tested Fungal Isolates

The tested fungi were the monoconidic strains of M. fructicola AN7 and AN26 isolated from nectarine commercial orchards located in Fermo (Marche Region of Italy), and AN12, AN13, and AN14 isolated from peach commercial orchards located in Pesaro (Marche Region). The M. fructicola isolates were grown on Potato Dextrose Agar (PDA) medium at 25 °C and identified by polymerase chain reaction (PCR) using protocols described by Côte et al. [31]. For conidia preparation, 10 mL sterile water was added to the one-week-old PDA cultures. Conidia were collected by scraping the plates followed by filtration to remove mycelium and then resuspended in distilled water to a concentration of 109 conidia/mL.

2.2. Virulence In Vivo Assay

The test was performed on two peach cv.s, ‘Royal Summer’ and ‘Messapia’, both susceptible to brown rot. The cv. ‘Royal Summer’ is characterized by early blossoming and intermediate ripening time maturation, while the cv. ‘Messapia’ is characterized by medium-late blossoming and very late ripening time. Fruits used for inoculation were collected in conventional orchards in the Marche region (Central-Eastern Italy) in 2022 at the ripening in mid-July for the cv. ‘Royal Summer’ and mid-September for the cv. ‘Messapia’. Fruits were surface sterilized in 1% sodium hypochlorite solution for 2 min, rinsed in sterile distilled water three times, and air-dried at room temperature. Then, four wounds (5 × 5 mm, deep × wide) were made with a sterile nail around the equator of peach fruits. Artificial infection was performed by inoculating 30 μL of a strong conidia suspension (109 conidia/mL) in each wound. The control fruits were inoculated with 30 μL sterile distilled water. For each treatment, three peach fruits were inoculated and kept in the dark at a temperature of 25 °C and relative humidity of 90% for a maximum of 24 h. The inoculated peach sample was collected at 0, 2, 6, 10, and 24 hpi. The five sampling time points included an initial asymptomatic invasion stage and a necrotrophic life stage with brown rot lesion and evident pathogen sporulation. After the lesion diameter was measured at each inoculation point [32], sample material was collected from each lesion, frozen with liquid N immediately after sampling, and stored at −80 °C until RNA extraction. After inoculation, the rest of the conidia suspensions from each M. fructicola isolate were stored at −80 °C until RNA extraction and used as positive control.

2.3. Gene Expression Investigation

The genes analyzed in this work were 17 putative pathogenic effector genes identified by EffectorP 1.0, EffectorP 2.0, and EffectorP 3.0 (https://effector.csiro.au) prediction tools in M. fructicola genome with or without orthologs with M. laxa, M. fructigena, Botrytis cinerea, and Sclerotinia sclerotiorum [30], and seven key genes linked to plant defense in peach (Table 1). The gene expression analysis was carried out by reverse transcription-quantitative real-time PCR (RT-qPCR) using a SYBR-green dye system, according to Minimum Information for Publication of Quantitative Real-Time PCR Experiments (MIQE) guidelines [33].

2.3.1. RNA Extraction

RNA from both peach and fungal mycelium was extracted following the methodology of Molina Hernandez et al. [34]. Briefly, 1 mL of the CTAB extraction buffer [35] was added to samples. The efficient disruption of biological material in each sample was then obtained using the TissueLyser III (Qiagen, Hilden, Germany) at 30 Hz for 30 s, repeated twice. Following incubation at 65 °C for 40 min, the supernatant was recovered and vigorously mixed with an equal volume solution of chloroform/isoamyl alcohol (24:1) for 15 s and finally centrifuged at 10,000 × g for 8 min at 4 °C. This last step was repeated twice. The total RNA was precipitated overnight at 4 °C, adding 0.25 µl 10 M LiCl. Finally, samples were washed with 70% ethanol, and the pellet obtained was resuspended in 50 µl of Milli-Q water. The quantity and quality of the RNA extracted was assessed based on an absorbance ratio of 1.80 to 1.90 at 260/280 nm and 1.8 to 2.0 at 230/260 nm, using BioPhotometer Plus (Eppendorf Inc., Westbury, NY, USA). For each sample two RNA extractions were performed. Then RNA solutions were pooled before the next step.

2.3.2. Reverse Transcription

For each sample, 0.5 ng of RNA was used for cDNA synthesis, performed using iScript TM cDNA synthesis kits (Bio-Rad Laboratories, Hercules, CA, United States) according to the manufacturer's instructions. For each sample, the products from cDNA synthesis were performed twice to obtain an adequate quantity of cDNA to analyze the different genes. The mixed products obtained (40 µl each) were diluted (1/10) according to preliminary assessments.

2.3.3. Primers and Reference Gene Selection

Target and reference genes were chosen from the gene sequences of M. fructicola (NCBI GenBank accession number GCA_008692225.1) and peach (P. persica) (GenBank accession number GCF_000346465.2 deposited in NCBI GenBank). The accession code and main function of target genes are reported on Table 1. Concerning the reference genes used for gene expression normalization, the β-tubulin cofactor d protein (EYC84_002797), β-actin (EYC84_004375), and elongation factor 1-alpha (EYC84_000787) were selected for M. fructicola, while β actin (XM_007205304.2), tubulin beta-1 chain (XM_007217941.2), EF-1 elongation factor 1-alpha (XR_002271124.1), and histone H1(XM_034347152.1) were selected for peach fruits. The primer sets were selected using the Primer3 software (http://biotools.umassmededu/bioapps/primer3_www.cgi). The primer pairs were chosen and validated in silico using primer BLAST-specific analysis (http://www.ncbi.nlm.nih.gov/Blast.cgi) and then from RT-qPCR, as described later, according to the melting profiles obtained from cDNA extracted from uninoculated peach cv.s ‘Messapia’ and ‘Royal Summer’, and M. fructicola conidia. The stabilities of candidate reference genes were evaluated using algorithms geNorm module of qbase + (Biogazelle) [36]. These algorithms rank the reference genes based on the stability value (M-value). A lower M-value corresponds to a more stable gene. The recommended stability for homogenous samples is M-value < 0.5 [coefficient of variation, (CV) < 0.25], and for heterogeneous samples, it is M-value < 1 (CV < 0.5) [33].

2.3.4. Quantitative Real-Time PCR

The RT-qPCR reactions were carried out in duplicate in a total volume of 10 µl each, which contained 4.6 µl of diluted cDNA, 0.10 µM of each primer, and 5 µl of 2 × SsoAdvanced Universal SYBR Green Supermix, in CFX Connect thermal cycle (CFX Connect, Bio-Rad Laboratories). The PCR cycling conditions were 95 °C for 3 min, followed by 40 cycles of 95 °C for 15 s, and 60 °C for 45 s. Melting curve analysis was performed over the range of 68–98 °C. The assays included cDNA from M. fructicola fungal isolates, uninoculated peach fruits, and no-template controls to determine the nonspecific amplification. The RT-qPCR efficiency (E) of each primer pair was determined using standard curves generated according to E = 10 – 1/slope. In detail, for the standard curve, the diluted cDNAs from samples (10 μl each) were mixed, and then four serial dilutions 1:5 (initial dilution, 0.2, 0.04, 0.008) were obtained. The comparative 2^(-ΔΔCt) method [59] was used for the analyses. The 0 hpi was used as the control sample for both effector and peach gene expressions.

2.4. Statistical Analysis
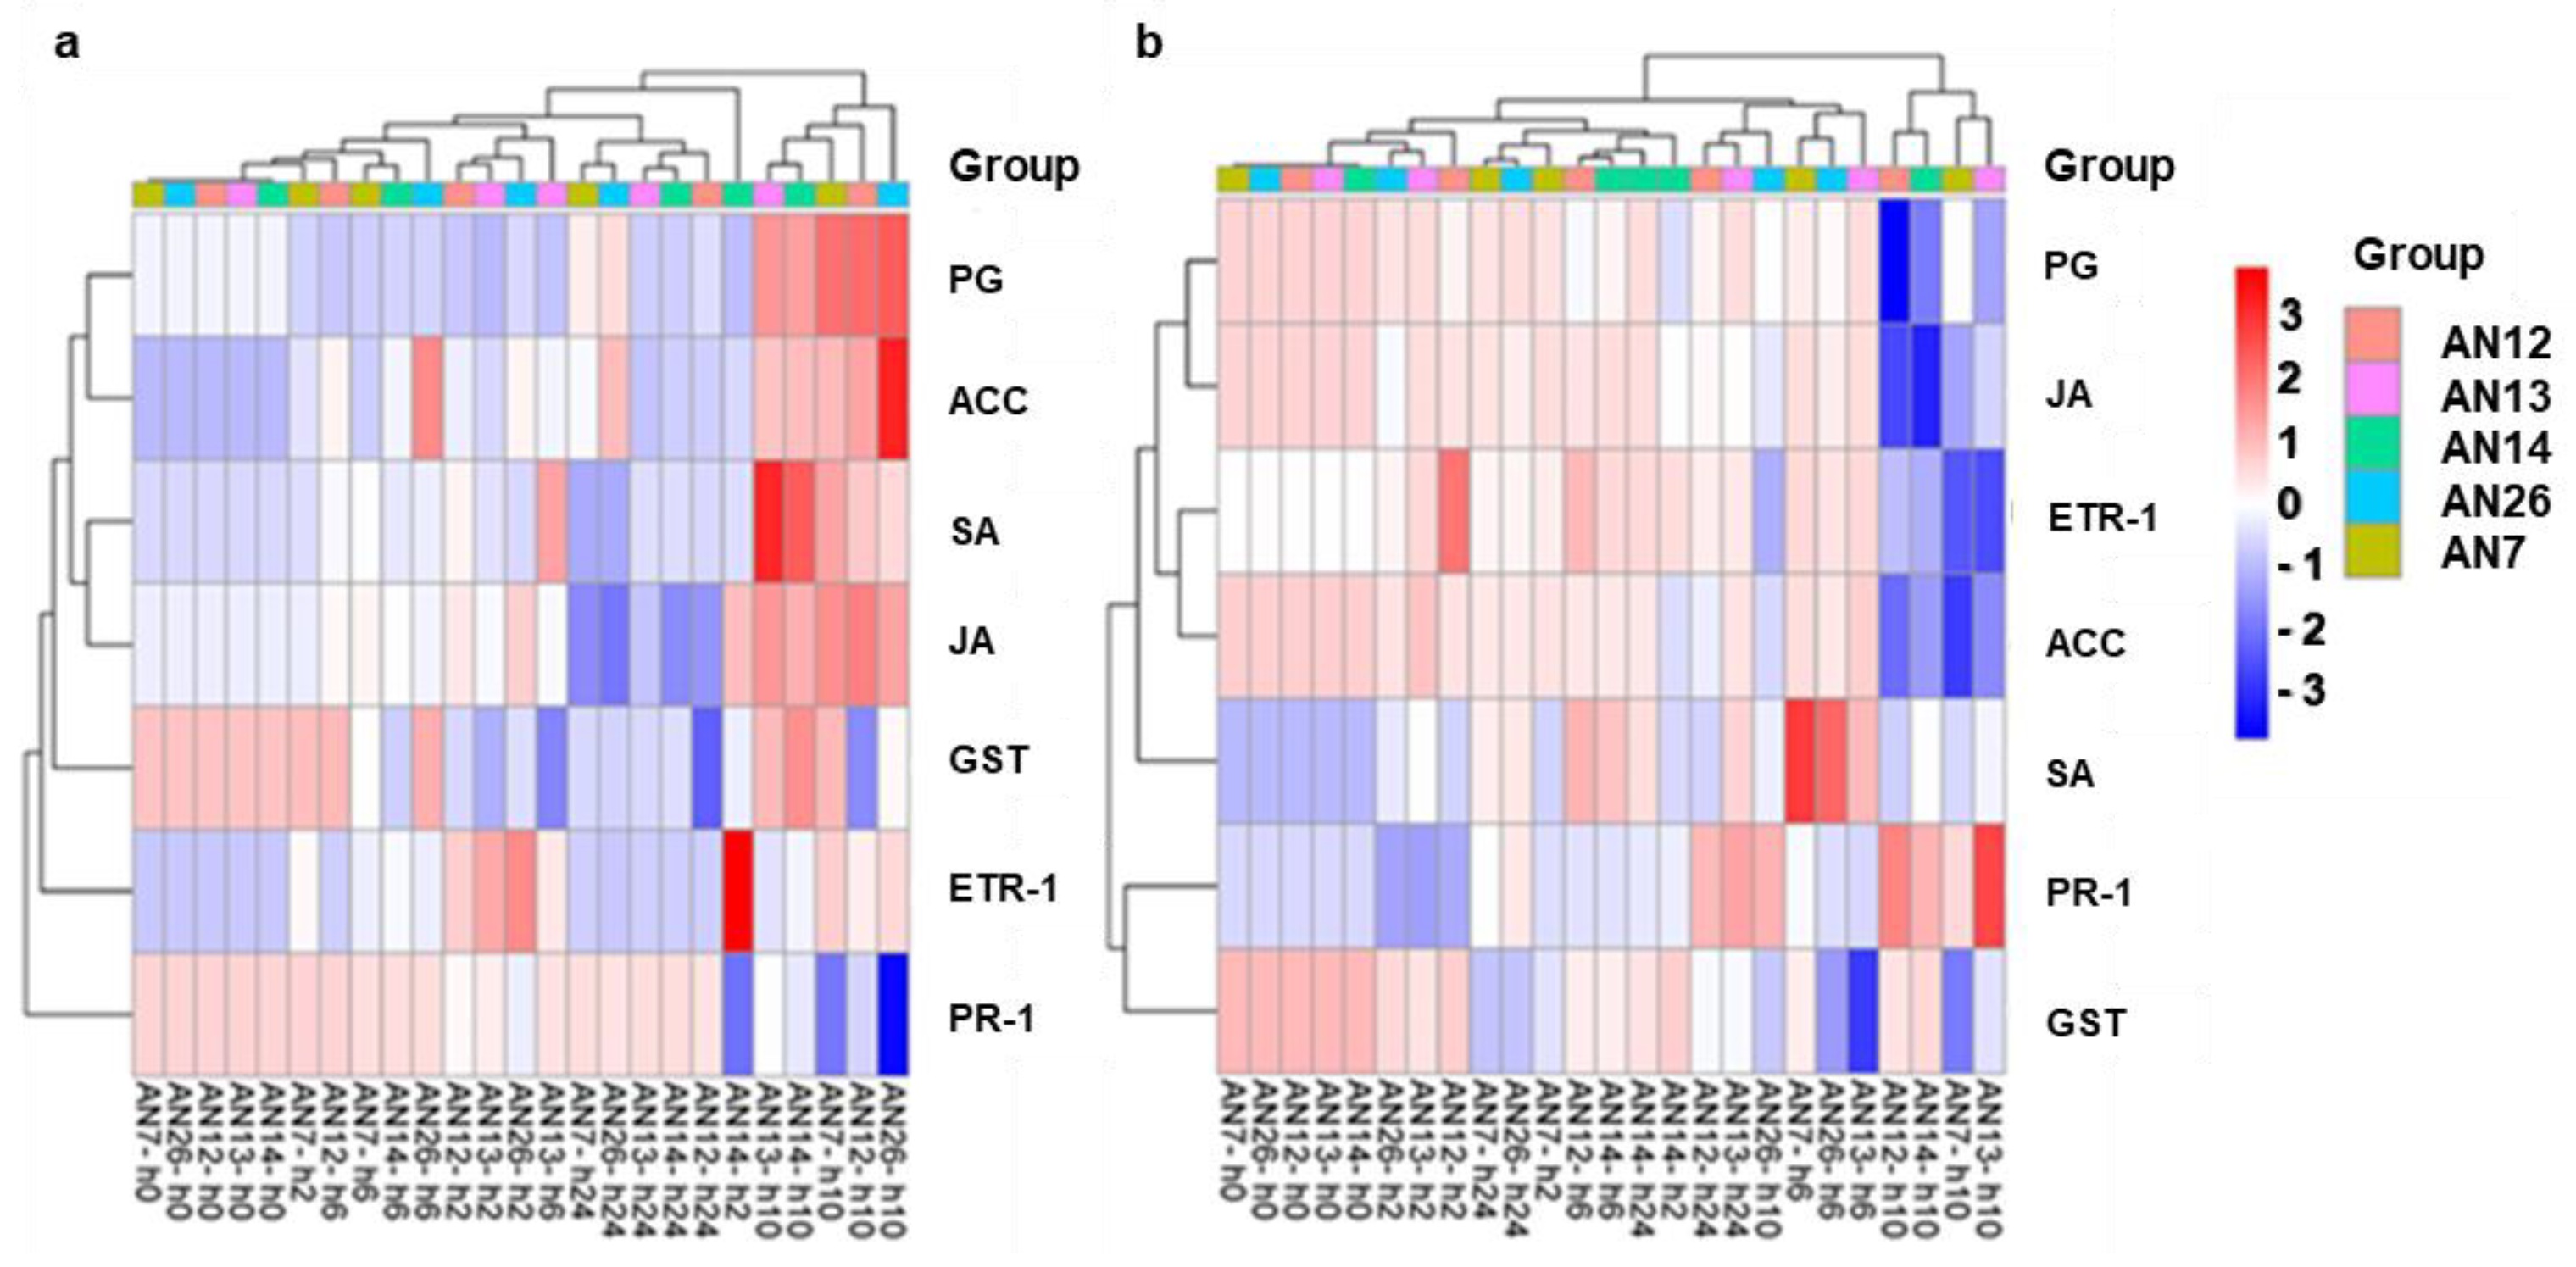
For each isolate, three peach fruits were inoculated, and the experiment was repeated twice. All the data were expressed as means ± standard deviation and subjected to one-way ANOVA with Tukey HSD post-hoc test. Differences were considered statistically significant for p < 0.05. To explain a large fraction of the observed variability among different gene expressions of effectors in M. fructicola isolates after peach inoculation, principal component analysis (PCA) was performed and computed using the PCA function [FactoMineR] (package R_2.9.tar.gz) [60]. Then, the factoextra R package (1.0.7.tar.gz) was used to produce ggplot2-based visualization of the PCA results [61].

3. Results

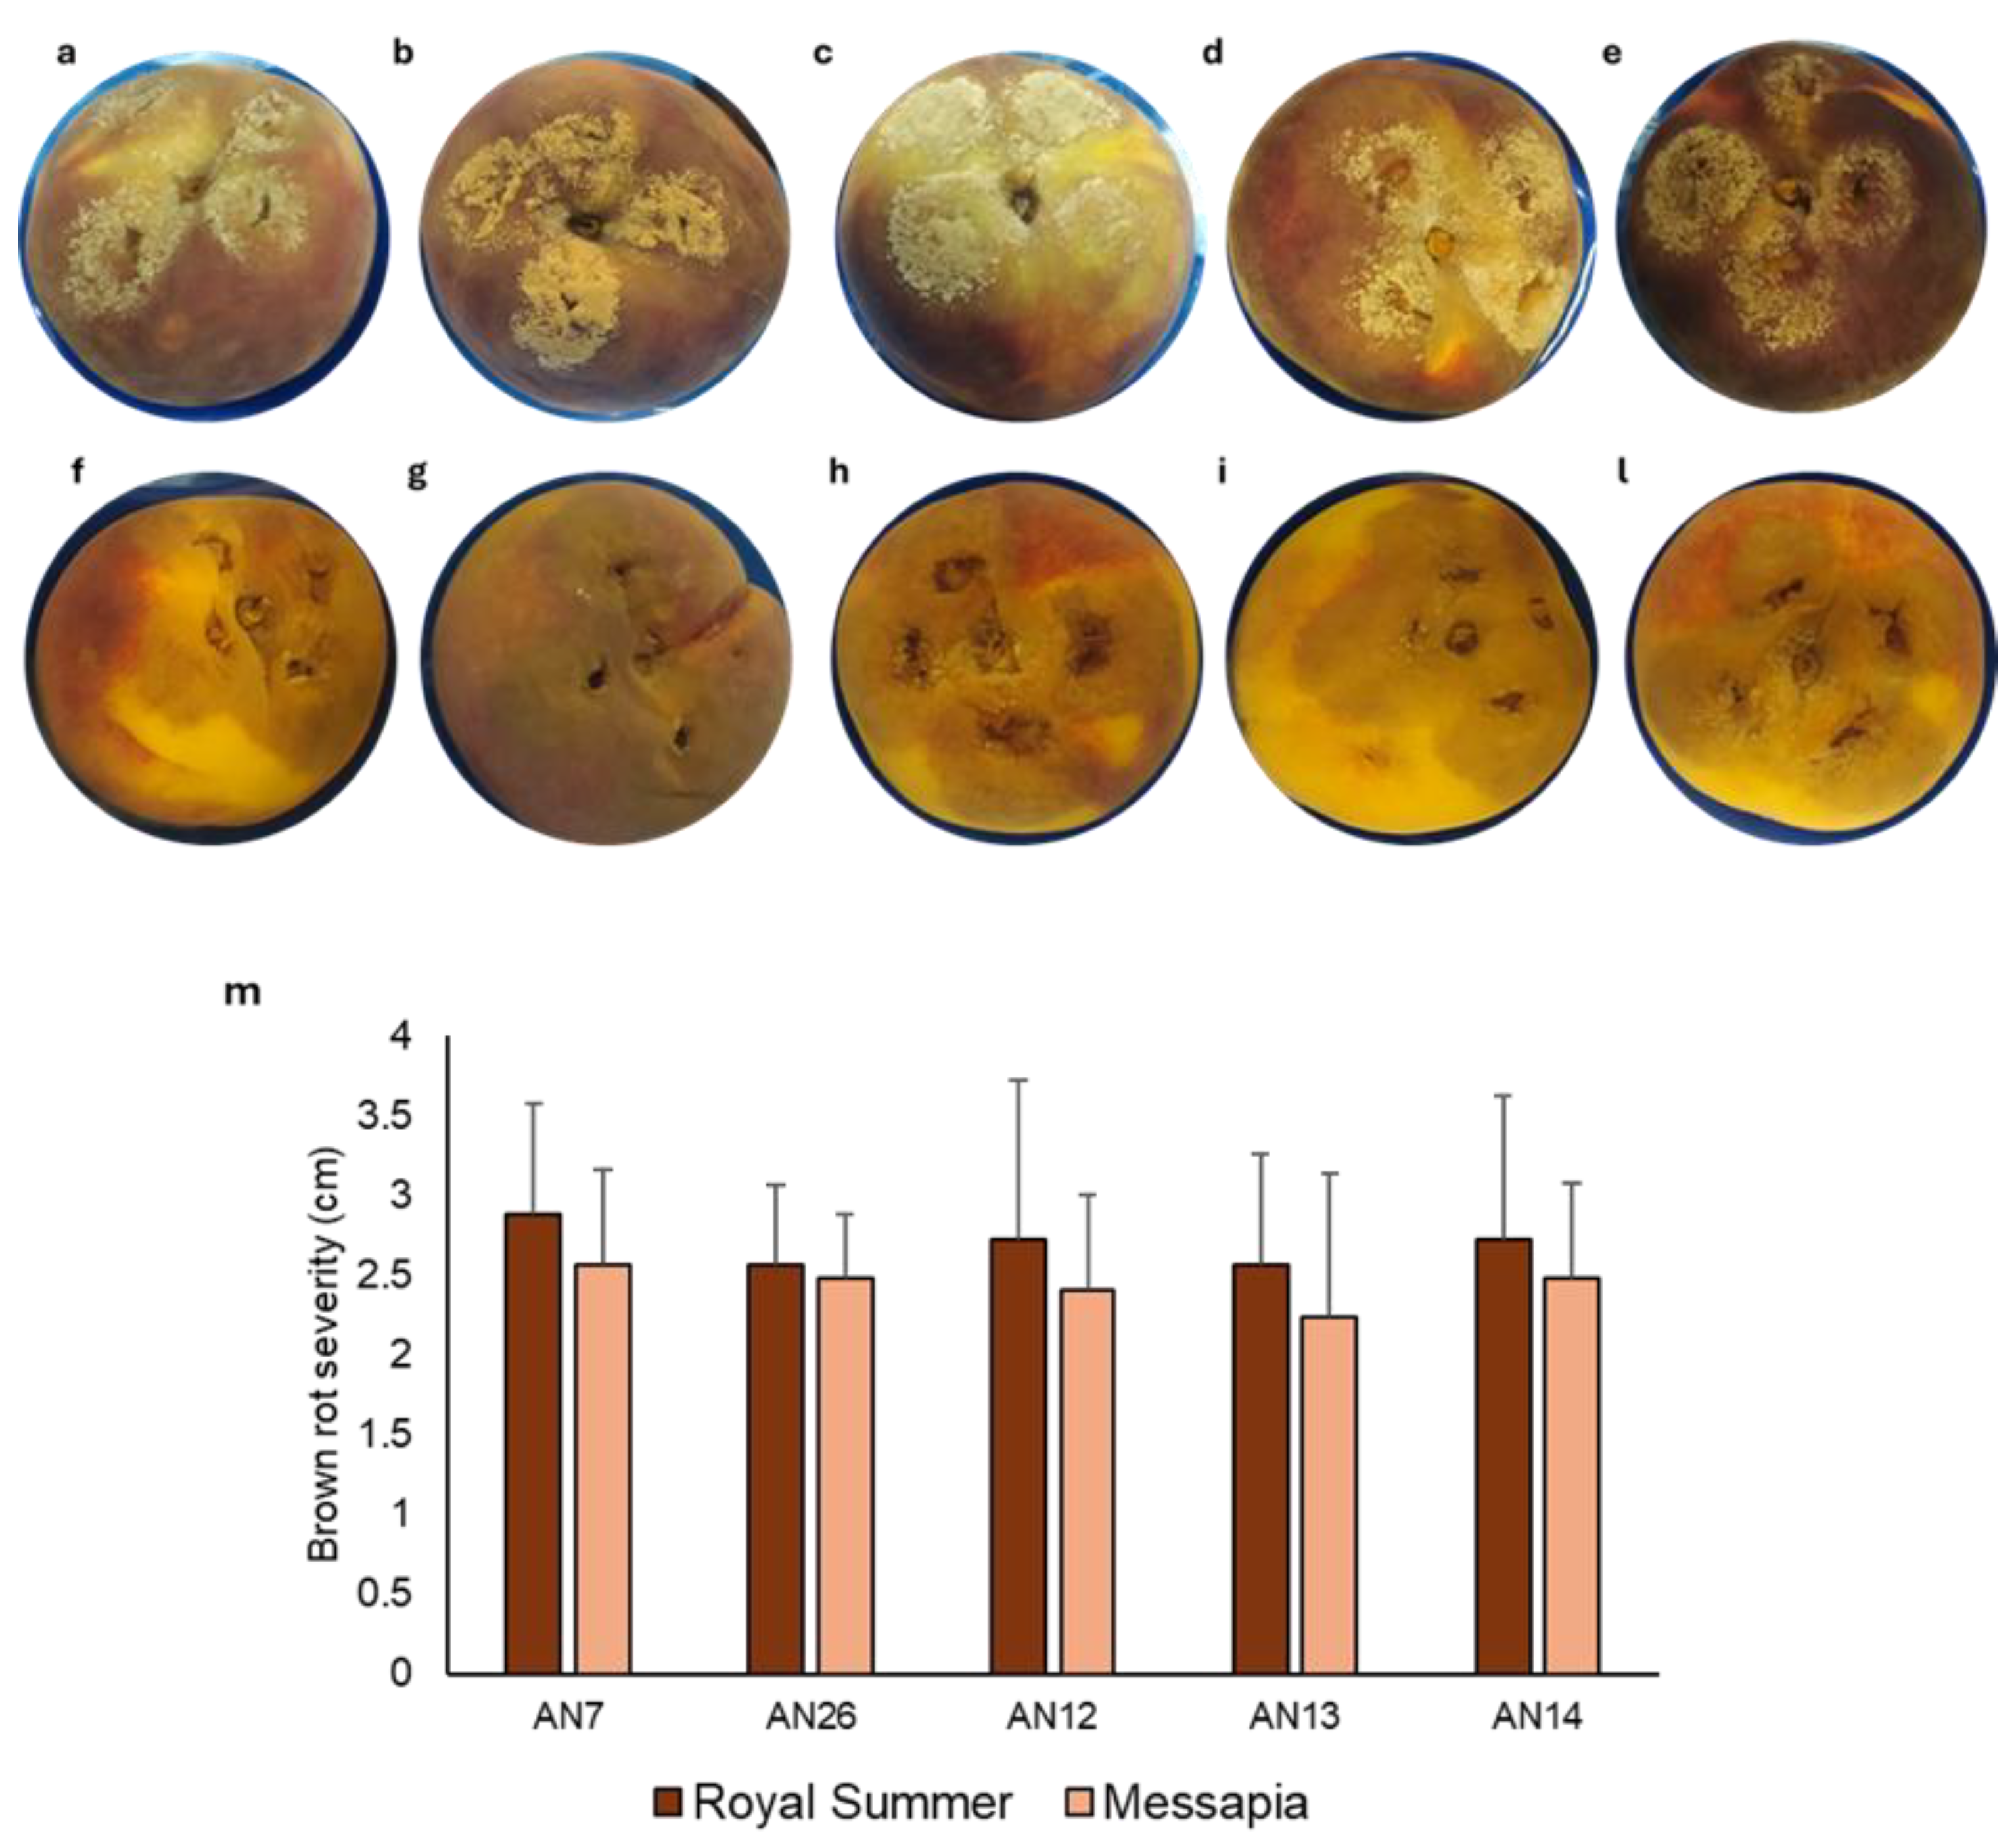
3.1. In Vivo Test: Virulence Assay

Virulence of M. fructicola isolates AN7, AN26, AN12, AN13, and AN14 were compared. No significant differences were observed regarding brown rot severity related to lesion diameter among inoculated isolates on both cv.s ‘Royal Summer’ and ‘Messapia’ (Figure 1). However, differences were observed in fungal sporulation on the two cultivars. At 24 hpi, all isolates showed evident fungal sporulation on ‘Royal Summer’ surface while sporulation was rarely present on ‘Messapia’. (Figure 1).

3.2. Gene Expression Analysis

Specific primer sets were selected for both putative effector and peach genes analyzed (Supplementary material Table S1). The melting curve analyses for all the amplicons showed a single peak, and no specific products or primer–dimer formation was detected with the amplification of the samples (data not shown). The standard curves generated for each gene showed high efficiency of each specific primer pair for RT-qPCR ranging from 95.2 to 108.3% (Supplementary Table 1). The specificity of the primers was confirmed by analyzing cDNA from uninoculated peaches or M. fructicola isolates.
In the gene expression effector investigation, among the three putative candidate reference genes, the lowest M-values were detected for the β-tubulin (0.4357 ± 0.046; CV, 0.1732 ± 0.048) and β-actin (0.3661 ± 0.043; CV, 0.2381 ± 0.071). This indicated that these two reference genes were suitable for the RT-qPCR investigation. Concerning the four candidate reference genes tested on peach, the most suitable reference genes were β-actin (0.3647 ± 0.032; CV, 0.1512 ± 0.032) and histone H1 (0.4131 ± 0.028; CV, 0.1234 ± 0.056).
The gene expression data are discussed according to their relative fold-changes compared to relevant controls.

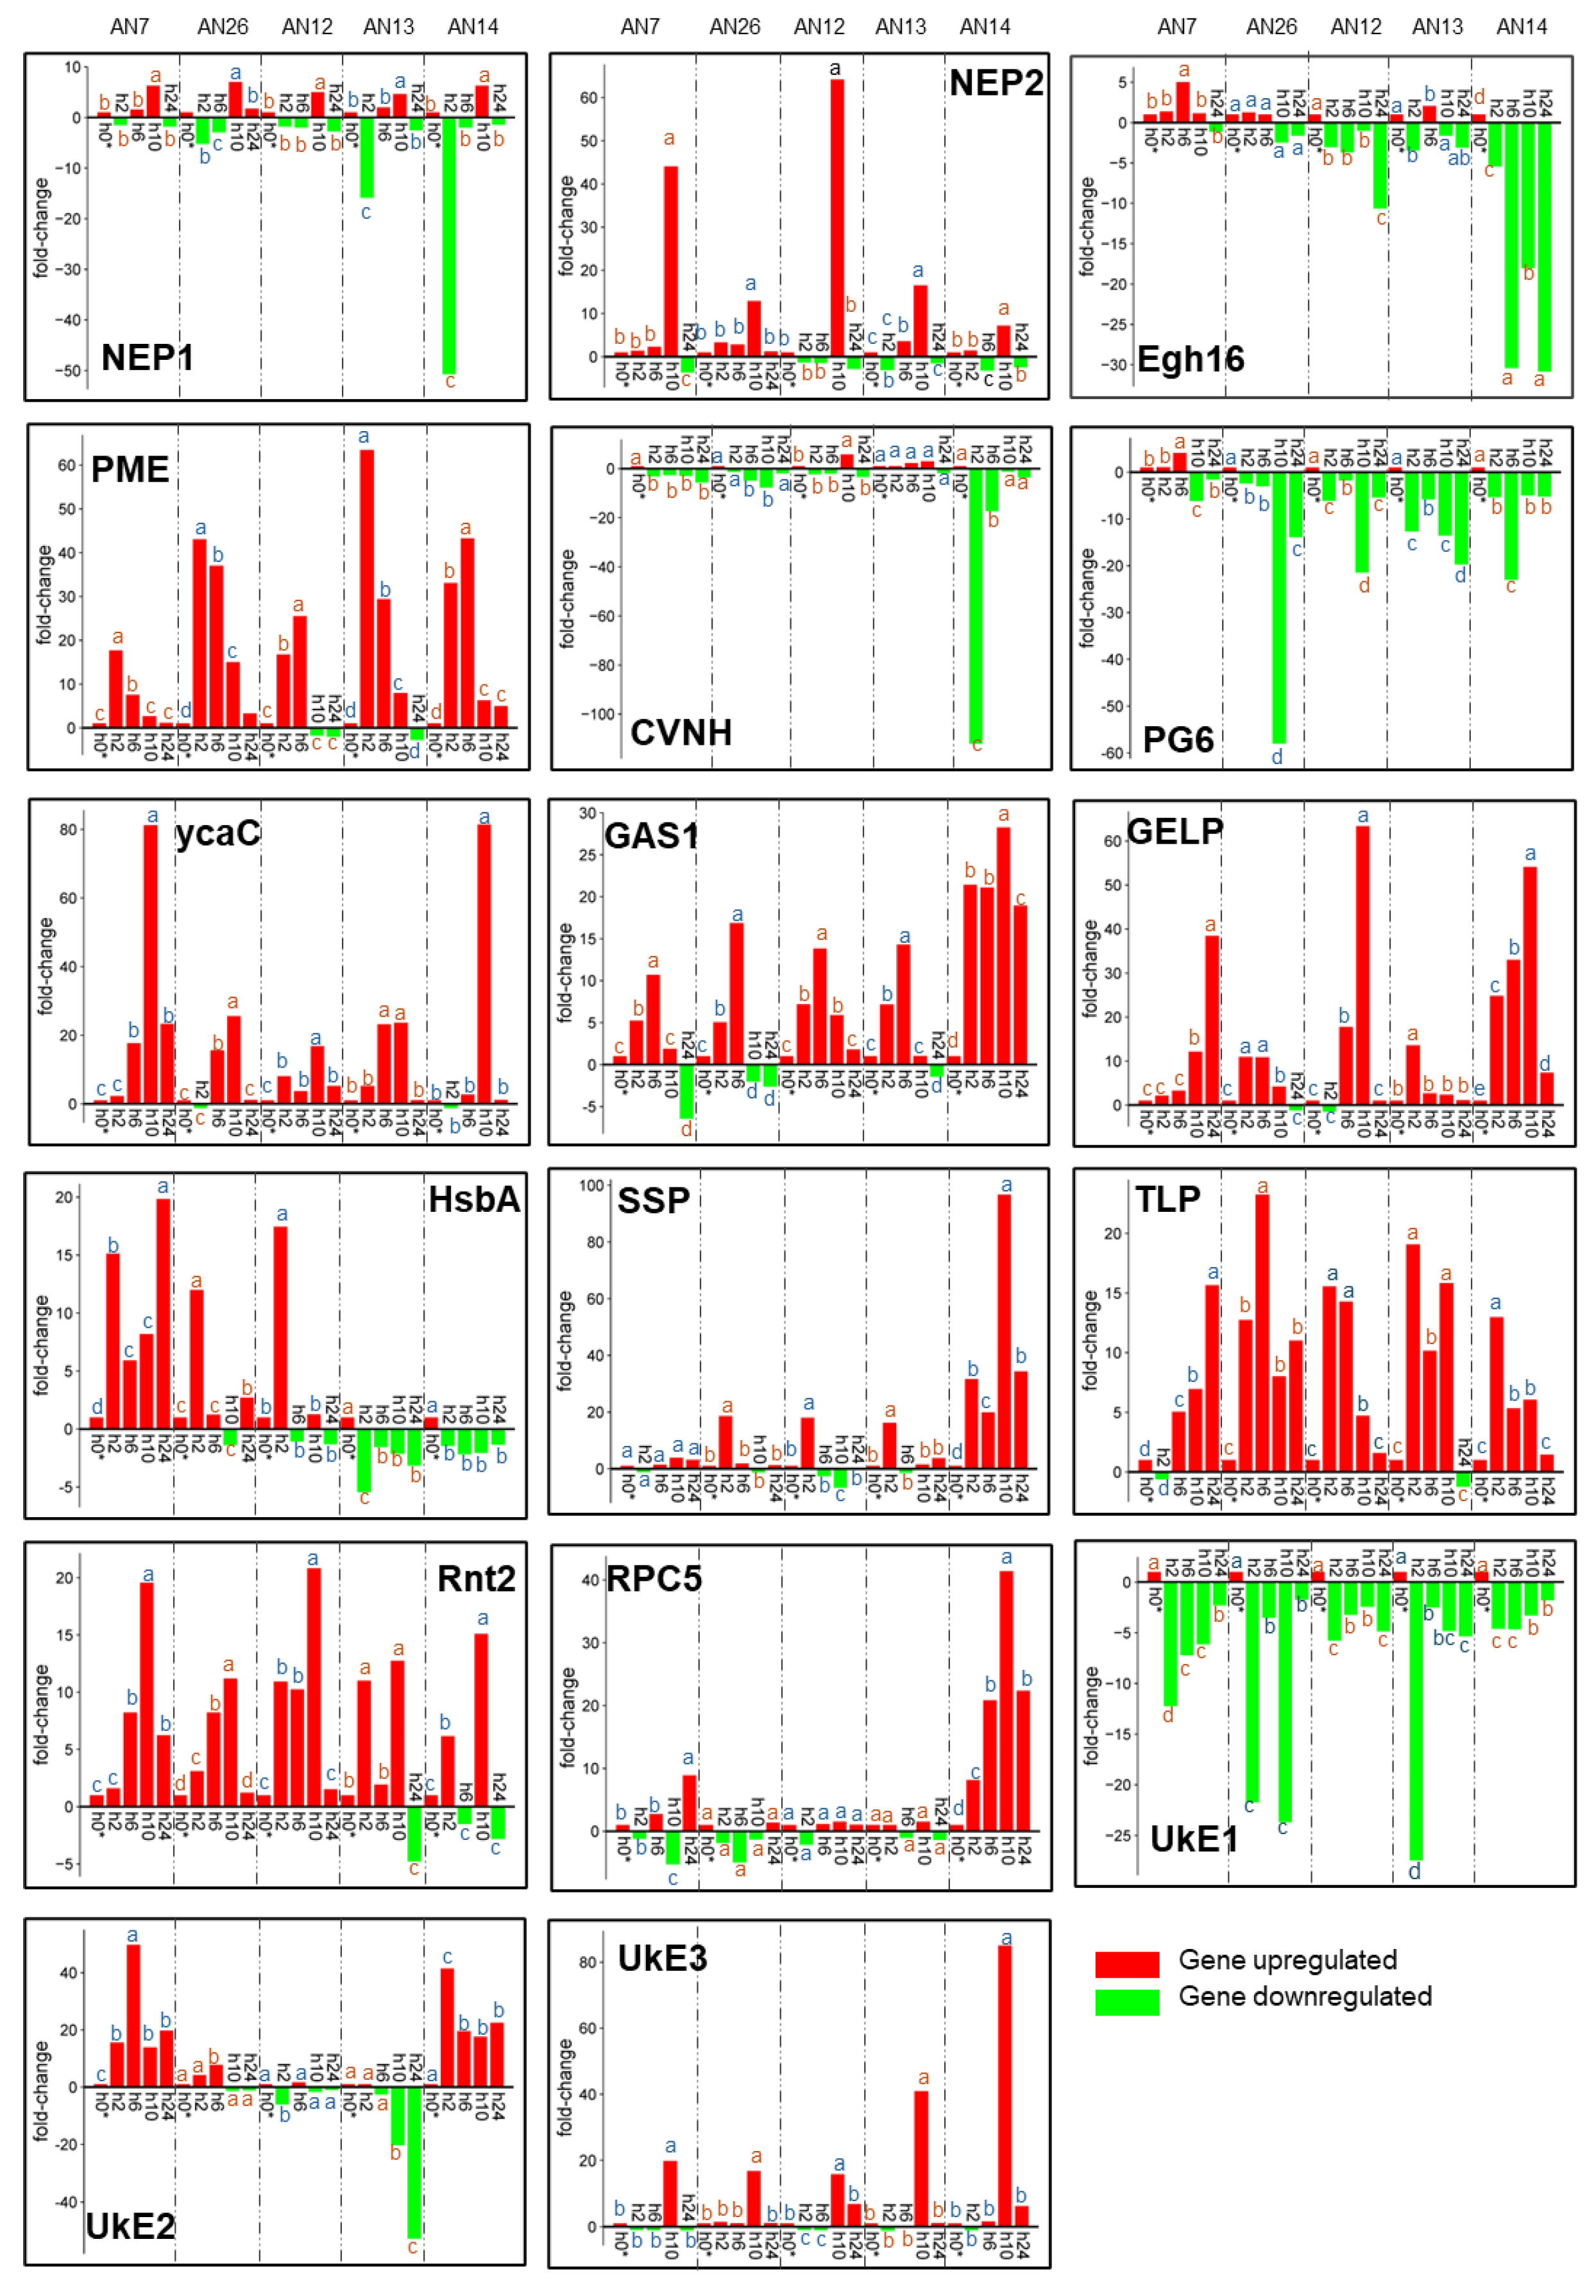
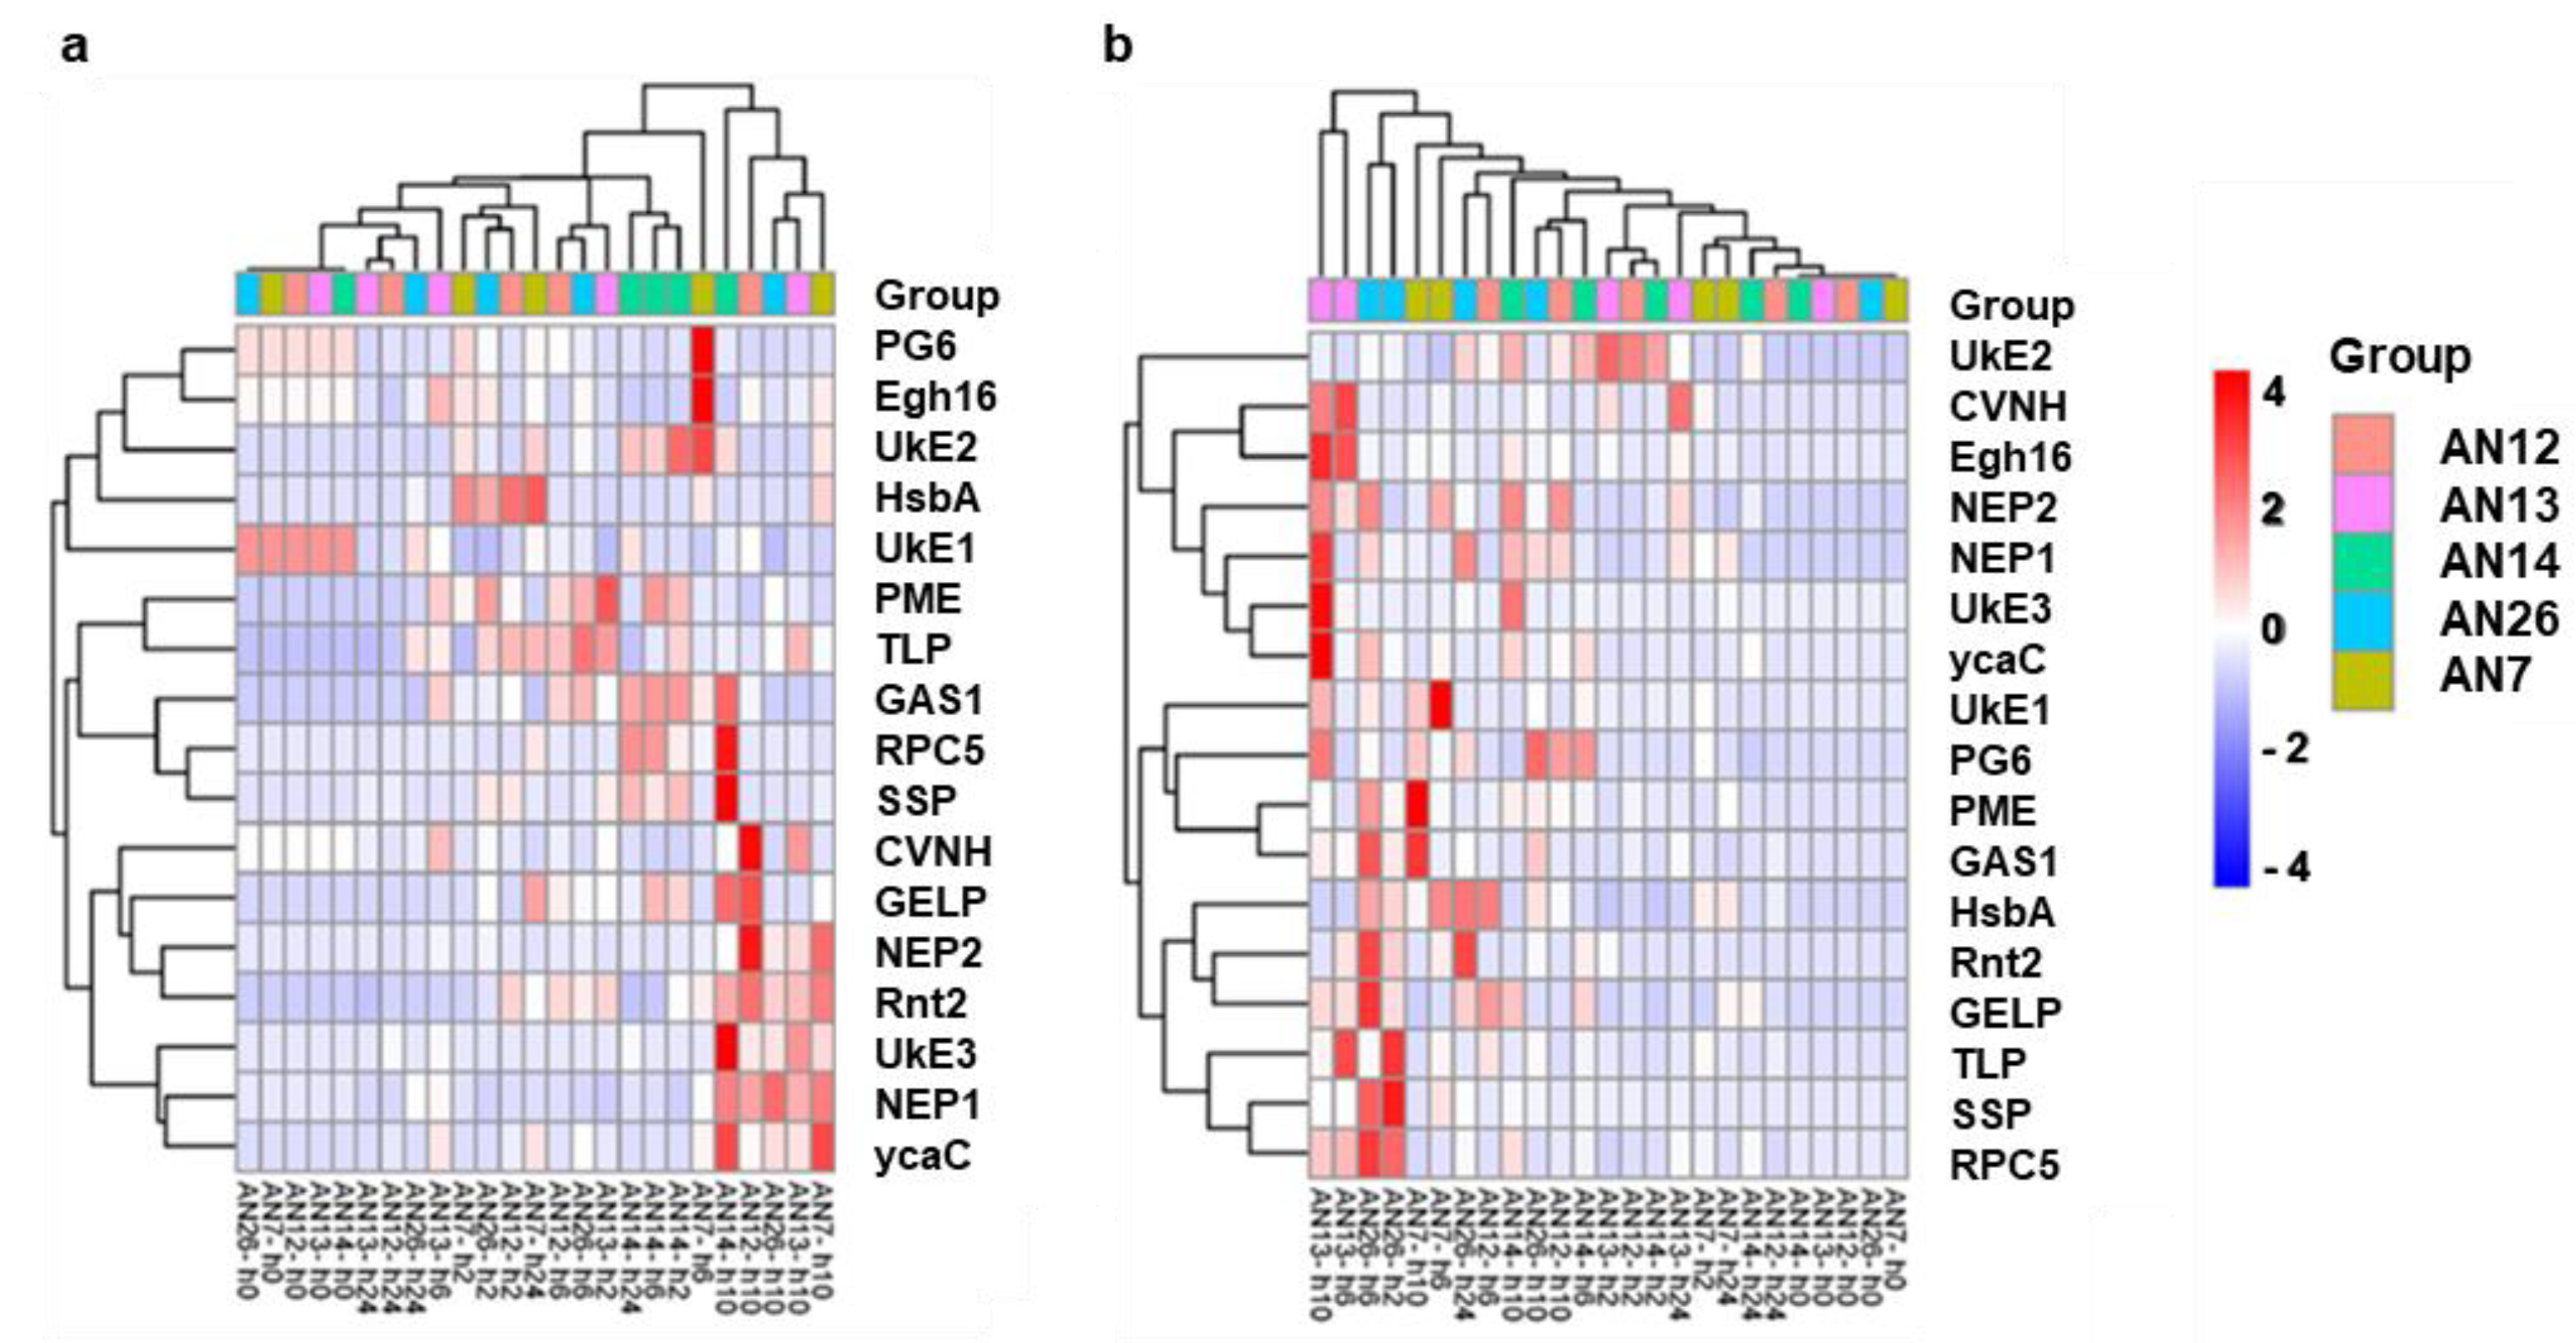
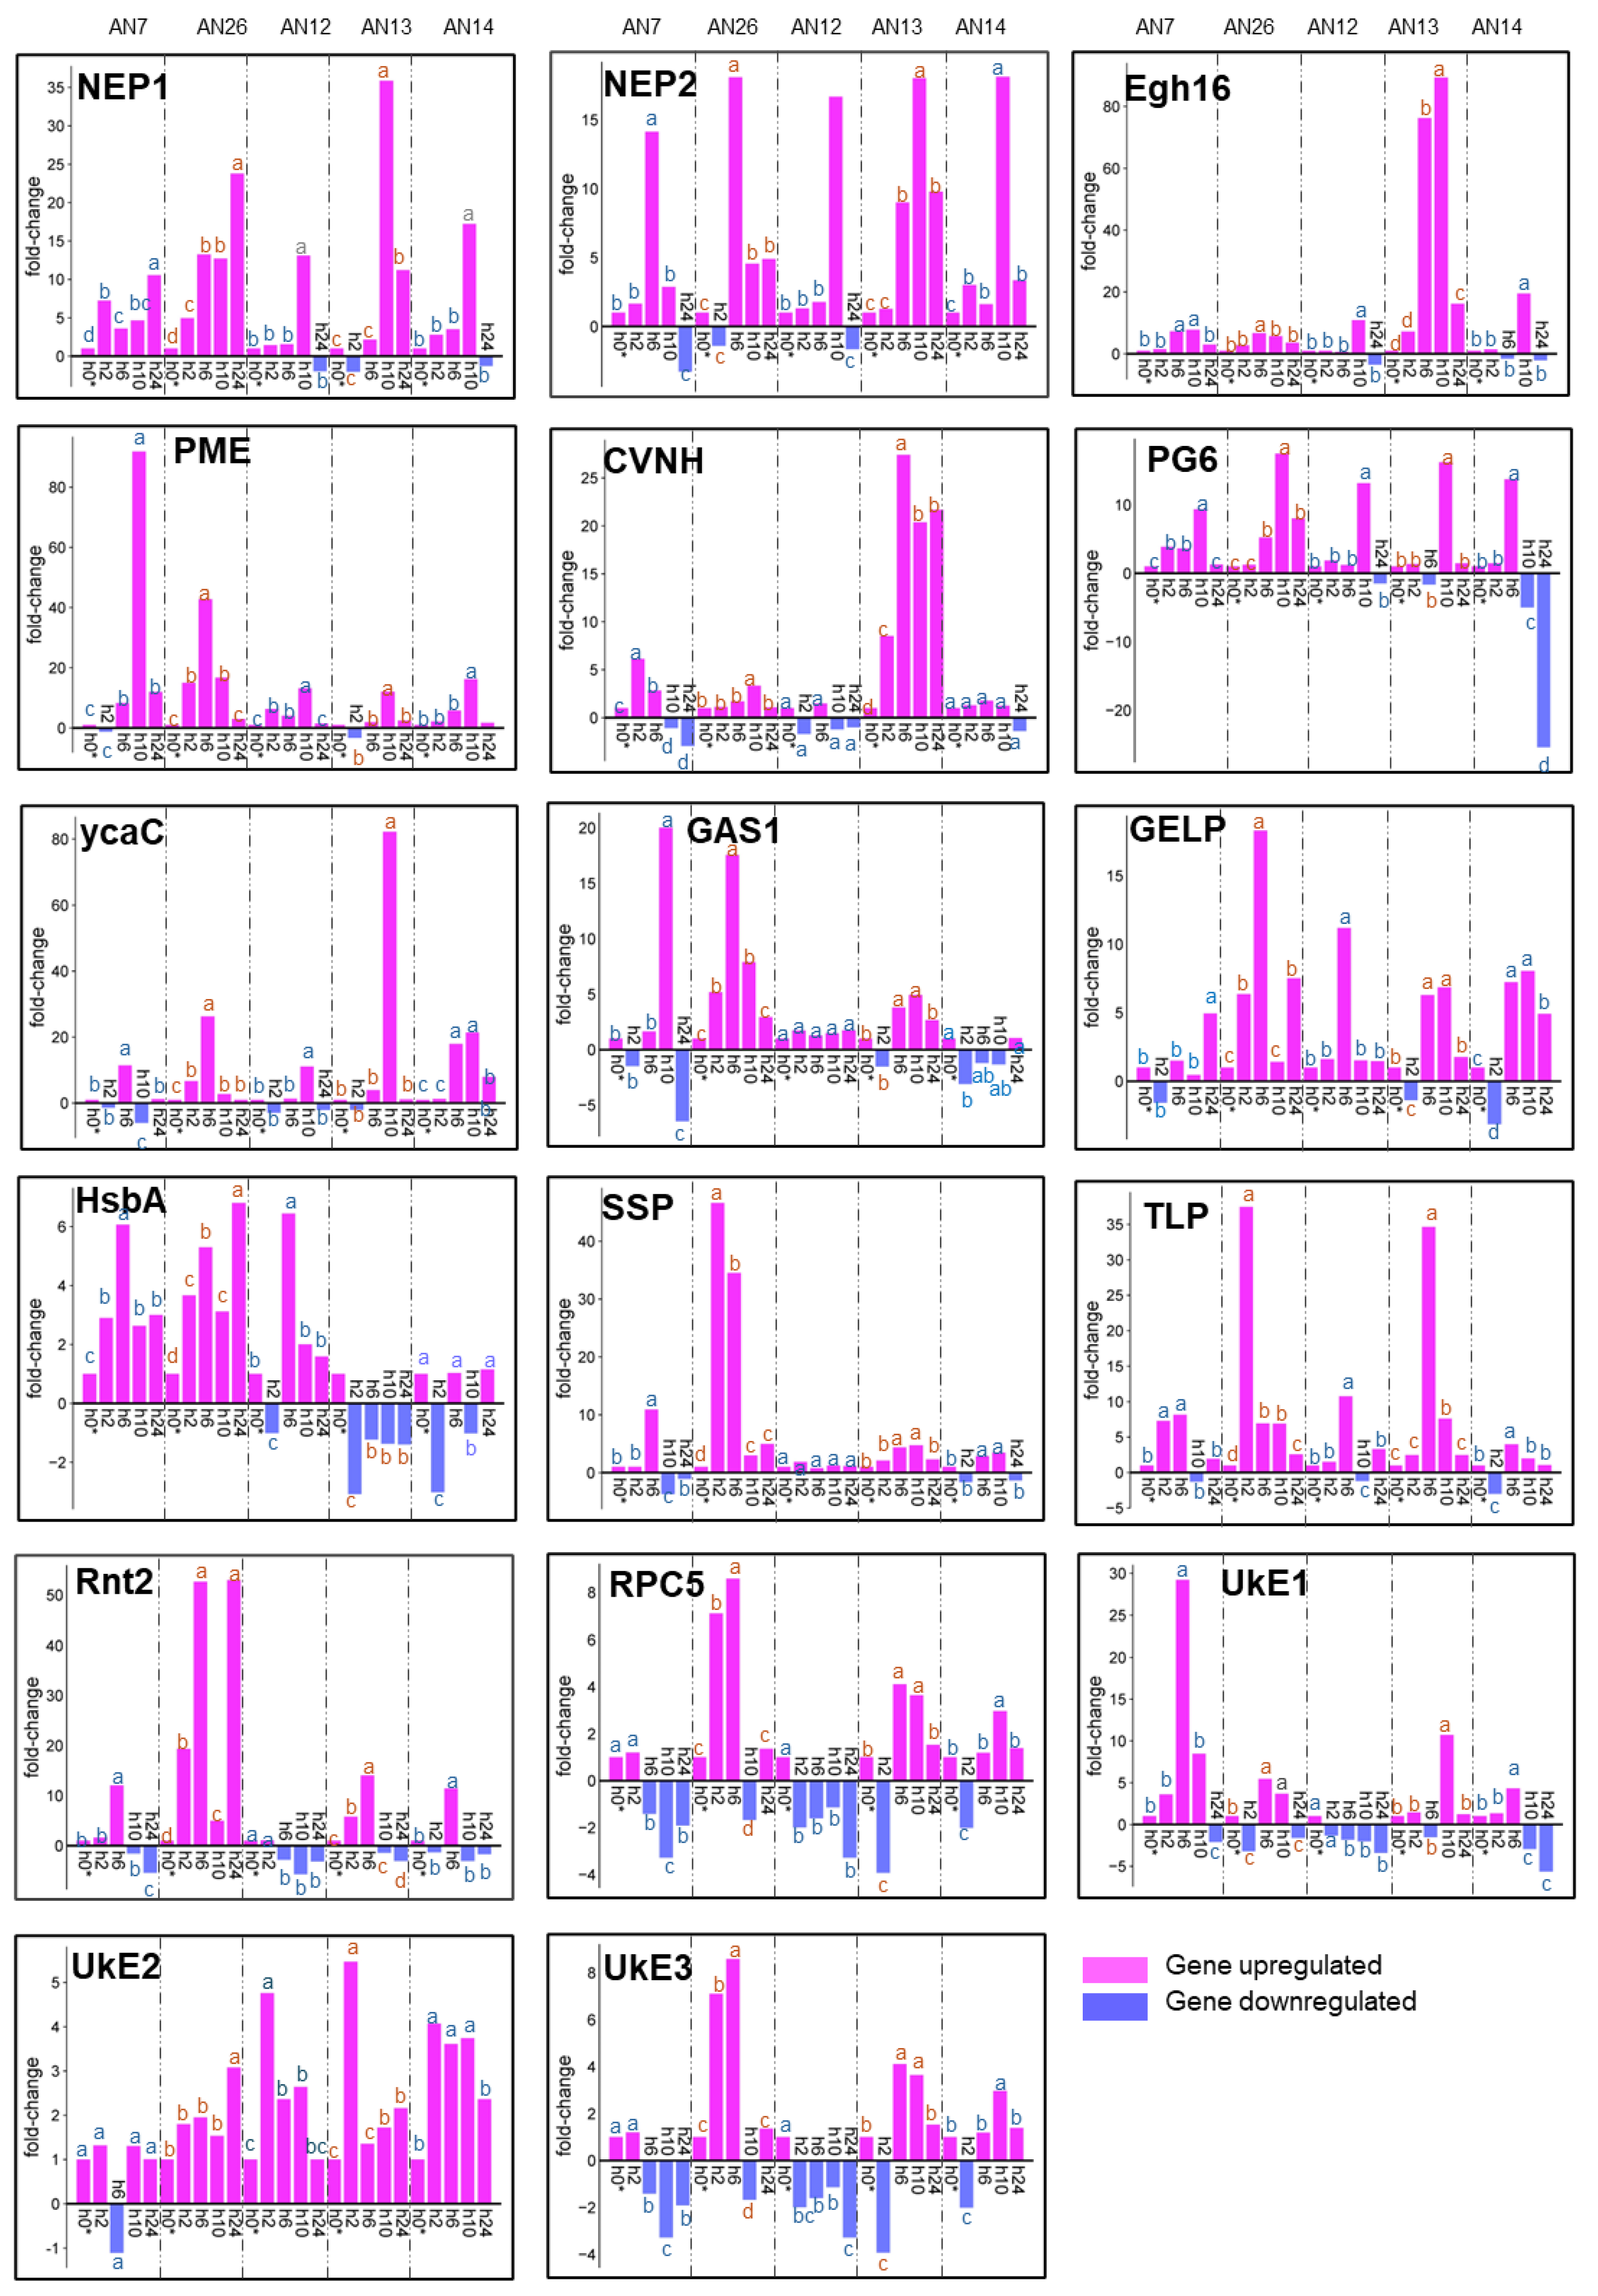
3.2.1. Expression of M. fructicola Putative Effectors Genes

When M. fructicola was inoculated on the cv. ‘Royal Summer’, the expression of effector genes changed according to both sampling time and fungal isolates. Overall, the fold-change values of putative effector genes of M. fructicola inoculated on ‘Royal Summer’ ranged from -112-fold (CyanoVirin-N, CVNH, gene, isolate AN14 at 2 hpi) to 97-fold [Small Secreted Protein (SSP) isolate AN14 at 10 hpi] (Figure 2).
The necrosis-and ethylene-inducing protein 1 precursor (NEP1) and necrosis-and ethylene-inducing protein 2 precursor (NEP2) genes modulated their expression over time. Interestingly, both were significantly upregulated only at 10 hpi (Figure 2). Other genes, including ribonuclease T2-like (Rnt2), isochorismatase /cysteine hydrolases, (ycaC) and hypothetical protein 3 (UkE3), showed maximum expression level at 10 hpi but were upregulated also in different time points. Pectin methylesterase (PME), glycophospholipid-anchored surface glycoprotein (GAS1), GDSL-type esterase/lipase proteins (GELP), osmotin/thaumatin-like superfamily/PR-5 (TLP), and SSP were mainly upregulated over time reaching maximum peaks of expression at different hpi based on the isolates. The genes hydrophobic surface binding protein A (HsbA), RPC5, and hypothetical protein 2 (UkE2) showed greater variability among isolates and over time. These genes are downregulated in some fungal isolates and upregulated in others. Finally, the Egh16-like virulence factor (Egh16), CVNH, polygalacturonase 6 (PG6), and hypothetical protein 1 (UkE1) showed a quick downregulation starting from 2 hpi, but large fold-change differences among isolates were observed (see Figure 2 for details).
The heatmap based on hierarchical clustering related to M. fructicola effector genes expressed when inoculated in the ‘Royal Summer’ cv. revealed that fungal isolate groups do not cluster together while specific expression trends of genes across the time were detected. The differentially expressed effector genes were clustered into three groups. Among the top genes across isolates, the PG6, Egh16, UkE2, HsbA, and UkE1 clustered together while another group was represented by PME, TLP, GAS1, RPC5, and SSP, then finally CVNH, GELP, NEP2, Rnt2, UkE3, NEP1, and ycaC (Figure 3a).
When inoculated on the ‘Messapia’ cv., the gene expression of putative effector genes changed depending on both hpi and fungal isolates. Overall, the fold-change values ranging from -25-fold (PG6 AN26 isolate at 24 hpi) and 91-fold (PME, AN7 isolate at 10 hpi) were recorded (Figure 4). However, the genes NEP1, NEP2, Egh16, PME, CVNH, PG6, ycaC, GAS1, GELP, SSP, TLP, and UkE2 were primarily upregulated but with differences among isolates, related to fold-change values and time point of maximum expression peak. Finally, the genes HsbA, Rnt2, RPC5, UkE1, and UkE3 were also downregulated in several isolates (see Figure 4 for details).
The heatmap based on hierarchical clustering related to M. fructicola inoculated on ‘Messapia’ showed that the effector gene expression profile from fungal isolates groups was not distinct, while specific expression trends of genes across hpi were detected. The effector genes clustered into three main groups. One included UKE2, CVNH, Egh16, NEP2, NEP1, UkE3, and ycaC, another group was related to UkE1, PG6, PME, and GAS1, and at the last was HsbA, Rnt2, GELP, TLP, SSP, and RPC5 genes (Figure 3b).

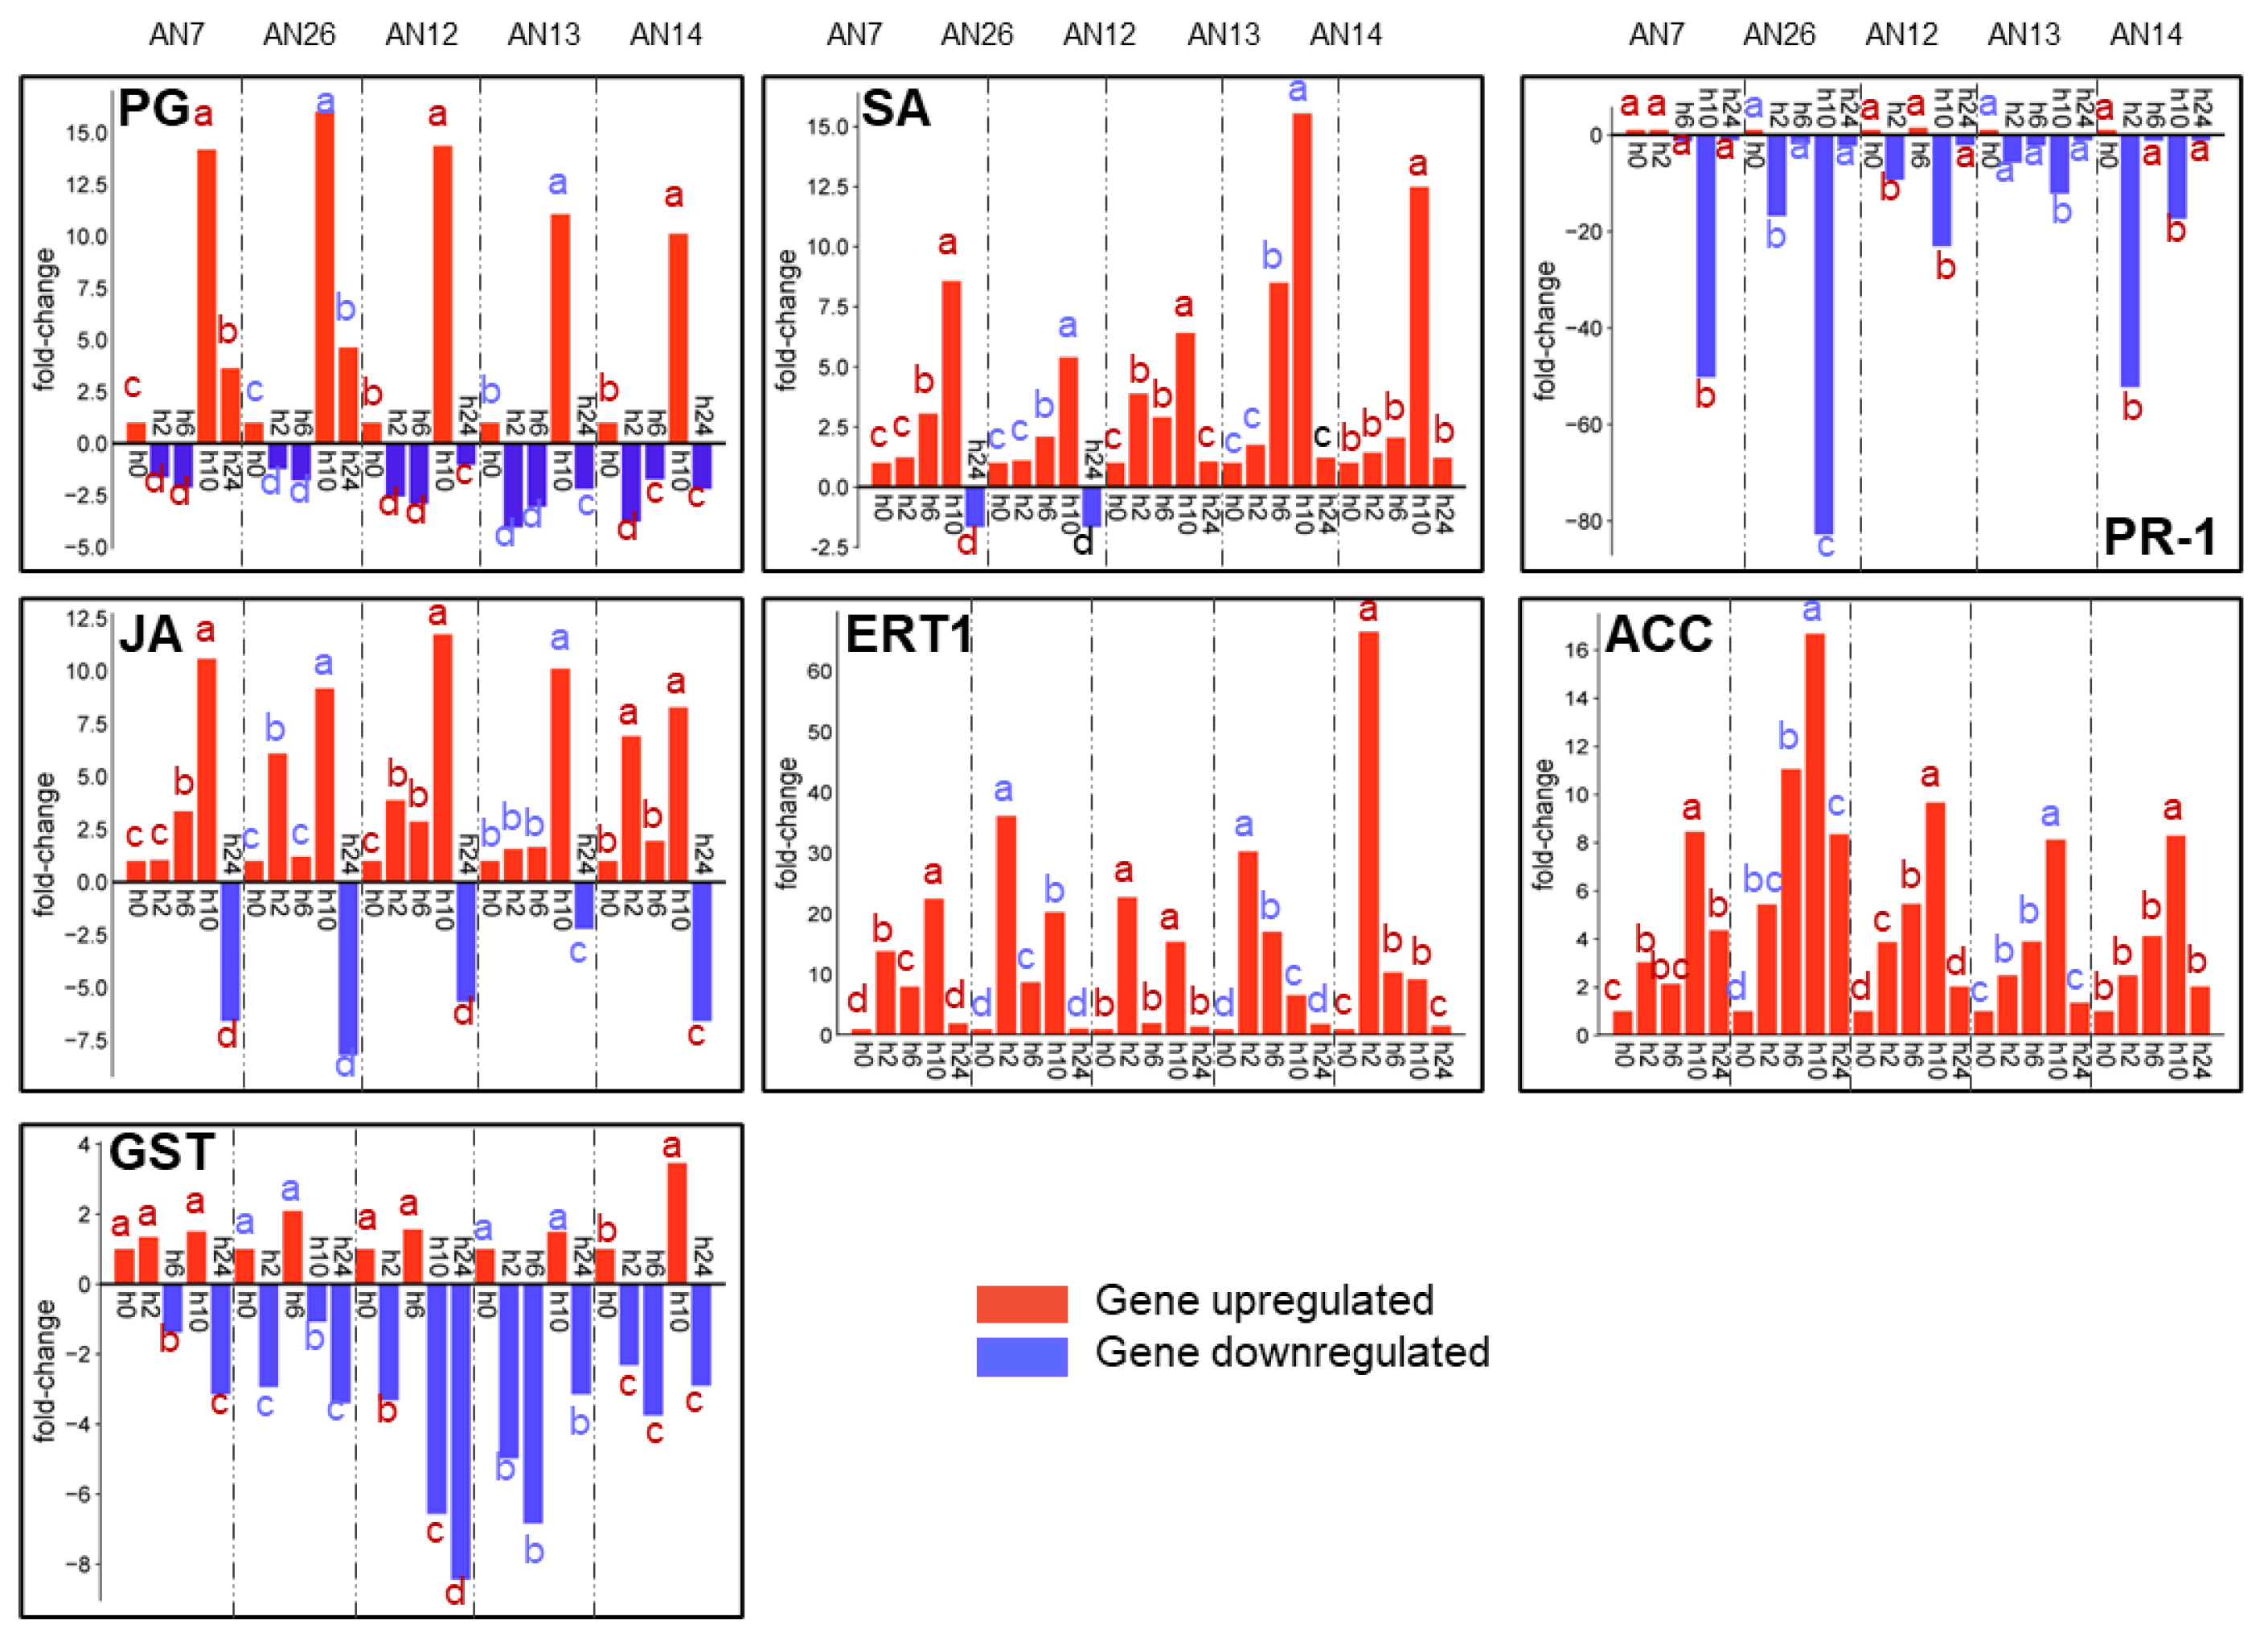
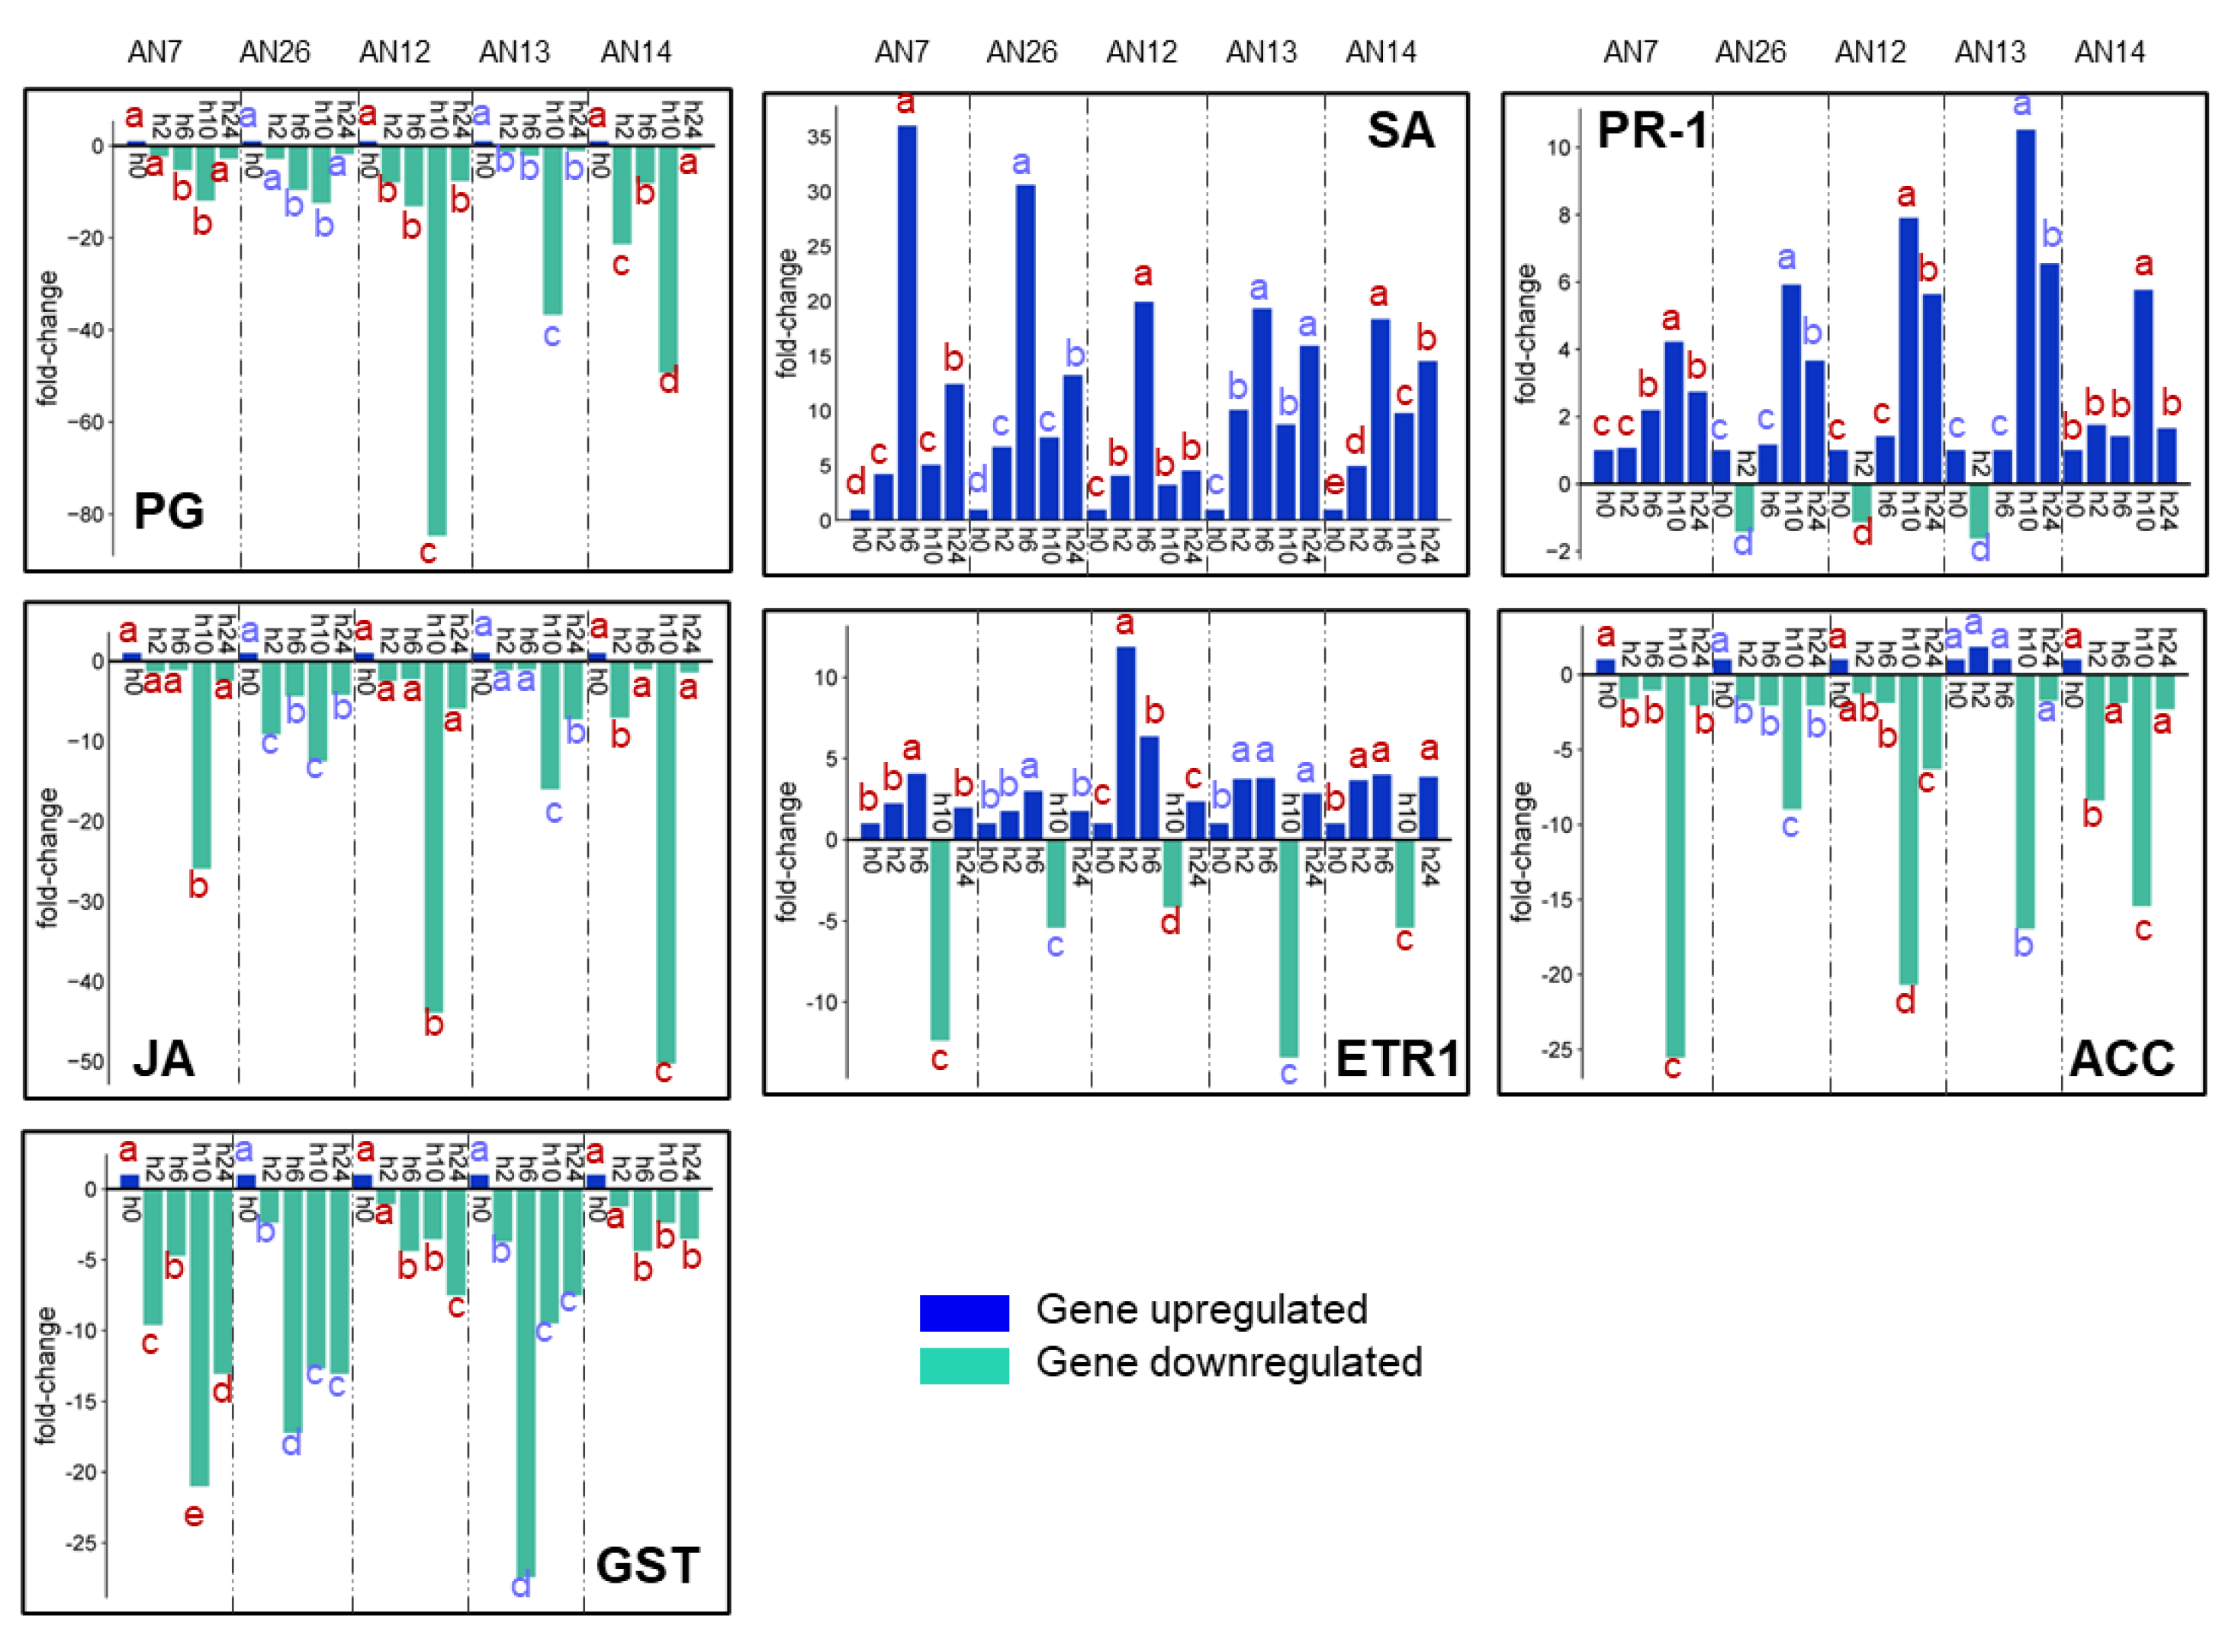
3.2.2. Expression of Peach Defense Genes

After the M. fructicola inoculation, the expression of several key genes involved in the major signaling pathways of plant defense mechanism showed differences between the peach cv.s, but with a similar trend and fold-change value according to the tested fungal isolates.
Concerning the cv. ‘Royal Summer’ the polygalacturonase (PG), salicylic acid-binding protein 2 (SA), jasmonic acid-amido synthetase (JA), and 1-aminocyclopropane-1-carboxylate oxidase (ACC) were mainly overexpressed with a maximum expression peek at 10 hpi. The fold-change values at 10 hpi based on the different inoculated fungal isolates were from 11 to 16-fold for PG, from 6 to 12-fold for SA, from 8 to 11-fold for JA, and from 8.5 to 16.5-fold for ACC. The ethylene receptor transcript ETR1 (ERT1) gene was mainly upregulated at 2 and 10 hpi. Interesting PG gene expression was downregulated at 2 and 6 hpi for all inoculated isolates by 2 to 4-fold compared to control. Inversely, the gene expression of pathogenesis-related protein 1 (PR-1) was mainly downregulated at 10 hpi from -10 to -83-fold. The expression profile detected for glutathione S-transferase (GST) gene was more variable but was always downregulated at 24 hpi from -3 to -8.5-fold (see Figure 5 for details).
The heatmap based on a hierarchical cluster related to the ‘Royal Summer’ cv. inoculated with M. fructicola isolates revealed that gene expression profiles from fungal isolate groups were not distinct, while specific expression trends of genes across hpi were detected. The different peach defense genes were clustered in two groups: PG and ACC clustered together, and SA and JA together. The other genes all joined these two gene clusters (Figure 6a).
A different pattern profile of gene expression was detected in the ‘Messapia’ cv. after M. fructicola inoculation compared to the ‘Royal Summer’ cv. The PG, JA, ACC, and GST were downregulated at the different time points and based on the different fungal isolates inoculated. The downregulation peak of PG was at 10 hpi in all peach samples regardless of the fungal inoculum tested (from 12 to 85-fold). Furthermore, the JA and ACC genes exhibited peak downregulation at 10 hpi from 12.5 to 50-fold and 9 to 25.5-fold, respectively. The GST gene was downregulated at all time points, especially at 6 hpi (27-fold after AN13 strain inoculation) and at 10 hpi (21-fold after AN7 inoculation). However, the SA and PR-1 genes were upregulated. The SA showed peak expression at 6 hpi (from 19 to 36-fold), and the PR-1 had a peak expression at 10 hpi (from 4 to 10.5-fold) (see Figure 7 for details).
The heatmap based on hierarchical cluster related to the ‘Messapia’ cv. inoculated with M. fructicola isolates revealed that gene expression profile from fungal isolate groups was not distinct; however, specific expression trends of genes across hpi were detected. The different peach defense genes were clustered in three groups: PG and JA clustered together, ETR1 and ACC joined by the SA gene, and the last group was related to PR-1 and GST (Figure 6b).
The dataset was analyzed using multivariate PCA to identify any structured variation contained in the dataset indicating an overall change of the gene expression pattern (i.e., gene expression data of 17 putative effector genes and 7 stress/defense genes for five M. fructicola isolates in two peach cv.s). The trait biplot analysis for the first two principal components, PC1 (Dim1) and PC2 (Dim2), accounted for 24.3% and 14.8% variability, respectively. Although no absolute distinct clustering was evident, limited overlap occurred in the gene expression according to the peach cv. based on the two orthogonal linear combinations of the features (Figure 8). While no separate clustering was observed in relation to the isolates or hpi (data not shown). The NEP1, UkE1, Egh16, CVNH fungal effector genes, and PG6, as well as SA and PR-1 peach defense genes, contribute to the variability in gene expression detected in the ‘Messapia’ cv. host, while RPC5, SSP, GELP, Rint2, GS1, TLP, and UkE2 effector genes with JA, ACC, PG, ETR-1, and GST host defense genes presented the highest contribution in the ‘Royal Summer’ cv. host. These two groups were mostly developed on PC1 but seem to be uncorrelated with each other (the angle between these vectors is approximately >90°). While the NEP2, ycaC, and UkR3 putative effectors exhibited large positive loadings on PC2 and overlapped for the cv.s. The UkE2, TLP, HsbA, and PME closer to 0 indicate that the variable had a weak influence on the PC1 and PC2 components (Figure 8).

4. Discussion

Effector genes encoding molecules involved in disease establishment are expressed throughout the lifecycle of plant-pathogenic fungi. However, little is known about how effector gene expression is regulated.
In this work, we verified if some putative effector genes identified in the M. fructicola genome [30] were modulated in the peach host in the early infection phase. Then we performed tests based upon artificial fruit inoculation of five different M. fructicola fungal isolates on two peach cv.s showing difference in ripening period, ‘Royal Summer’ and ‘Messapia’, with intermediate and very late ripening time, respectively. In addition, some key genes induced by M. fructicola linked to the first layer of plant immune system were analyzed in peach fruits. We highlighted that all fungal isolates showed a similar ability to induce lesions associated with brown rot. Despite the similar lesion diameters, more abundant fungal sporulation was observed on the cv. 'Royal Summer' regardless of the isolates tested, compared to the cv. 'Messapia', suggesting differences between the two host peaches rather than between the fungal isolates. Currently, data is available showing a difference in susceptibility among these cv. to Monilinia spp. in the orchard. Previous experiments have also highlighted their susceptibility to Monilinia spp. (CRA Project 2009; MACFRUT2016). During the infection monitoring stage, all effector genes were differentially expressed over time, depending on the fungal isolates and largely on the hosts, which suggested specialized functions for these effector activities. The overall expression of the genes analyzed was regulated mainly at 2, 6, and 10 hpi when disease symptoms started to appear on the fruit surface, confirming the involvement of effector genes in the early infection stage [62]. In each peach cv., the gene expression differs among fungal isolates primarily on activation times and fold-change values. The PCA investigation highlighted the distinct clustering evident in the gene expressions, mainly according to the peach cv. Research indicated that each peach cv. has unique characteristics linked to nutrients, proteins, minerals, vitamins, and carbohydrates [63]. Therefore, although no differences were detected in the brown rot severity in the peach cv., physiological characteristics of the peaches may have contributed differentially in activating and modulating the expression of putative virulence effectors identified in M. fructicola necrotrophic pathogen. In this regard, previous work established key differences in cultivars with different ripening periods involving a change of expression of the genes responsible for cell-wall modification, redox signaling, hormonal regulation, and reception [64].
Based on these results, most effector genes linked to cv. 'Royal Summer' have heterogenous functions with roles in both the host invasion and fungal life. We refer to GELP involved in lipid metabolism [46], highly expressed during B. cinerea plant interactions [65], GAS1, which plays an important role in the biosynthesis of the fungal cell wall that can affect plant defense response [43], and TLP with secretory and endo-β-1,3-glucanase activity [48]. In addition, Rnt2 and RPC5 are involved in RNA synthesis. The first contributes to the virulence of pathogen through the degradation of plant RNA [49], while RPC5, codify for a component DNA-directed RNA polymerase III affecting innate immune response in plants by synthesizing small RNAs act as fungal pathogen effector by that silence host target genes to promote infection, a virulence mechanism called cross-kingdom RNA interference (RNAi) [51,66].
On the other hand, the brown rot virulence factors that differentiate the cv. ‘Messapia’ from the cv. ‘Royal Summer’ act in the early infection stage of host affecting necrosis [44]. These factors include PG6 involved in pectin degradation to help penetration and colonization of the host [41]; Egh16 gene found in many pathogenic filamentous fungi and thought to play a role during the early infection stage [39]; as well as the NEP1 and CVNH genes linked to necrosis induction in the host [67]. These genes were upregulated in the cv. ‘Messapia’ but were primarily downregulated in cv. ’Royal Summer’. We hypothesize that the interaction with the host modulates their downregulation in the first 24 hours, while other genes contributed to the onset of the disease in ‘Royal Summer’.
Our work indicates that the host can modulate the expression of virulence effector genes. Focusing our discussion on the NEP putative effector genes previously investigated in different plant–pathogen interaction, in the cv. ‘Royal Summer’, NEP1, and NEP2 genes were primarily upregulated only at 10 hpi, while in ‘Messapia’, they were upregulated at different times with the highest variability among M. fructicola isolates. Previous work evidenced a different contribution in the different phases of host infection of NEP-like proteins [68]. NEPs are necrosis- and ethylene-inducing proteins typically present in necrotrophic fungi, including B. cinerea [69,70] and Sclerotinia sclerotiorum [71]. NEPs, detected as virulence factors in several fungi, probably function by permeabilizing the plasma membrane [72,73]. NEP1 was found to interact with a single plasma membrane receptor involved in both mediating virulence and triggering defense [74]. Infiltration of NEP1 into leaves of Arabidopsis thaliana plants resulted in transcript accumulation of pathogenesis-related (PR) genes, production of ROS and ethylene, callose apposition, and HR-like cell death [75]. However, in B. cinerea, single knockout mutants in NEP1 and NEP2 coding genes using Arabidopsis did not affect virulence [76]. Furthermore, leaf infiltration of NEPs from Botrytis squamosa showed that onion cultivars are differentially sensitive to NEPs [38], while M. fructicola ortholog to NEP1 proteins from Botrytis spp. was able to induce cell death in Nicotiana benthamiana, Solanum lycopersicum (non-hosts), and Prunus spp. (natural hosts) leaves [30]. However, among the NEPs, only NEP2 upregulation was confirmed by transcriptomic investigation in different P. persica cv. after M. fructicola inoculation on fruits [77]. These examples suggest the complex nature of effector genes. In M. fructicola, the roles of effectors could be diverse, either in suppressing host immune responses during the early, biotrophic phase of the infection or inducing plant cell death in the host [27]. In our work, the investigation about key genes associated with the plant’s defense and stress mechanisms on peach highlighted a different response between the two cv. but no link was found with the M. fructicola isolates inoculated. Despite the evident susceptibility to the pathogen, the host response was induced involving key enzymes of the immune response. In the cv. ‘Royal Summer’, the genes linked to jasmonic acid/ethylene pathway were primarily upregulated. The genes JA and ETR1 are involved in the early step of ethylene signal transduction pathway [78], ACC is responsible for the final step in ethylene biosynthesis, and PG plays a major role in both plant defense and controlling senescence [79]. Interestingly, these genes reached peak expression mainly at 10 hpi along with some effector genes (e.g., NEPs, Egh16, Rnt2, UkE1, and UkE2 genes). In the cv. ‘Royal Summer’, the SA was also upregulated mainly at 10 hpi; but contrary to what might be expected, PR-1 protein used to monitor SA and SAR activation [80] was downregulated at 10 hpi. Recent progress has revealed that plant PR-1 can activate an immune response. However, the activated pathway signaling can be blocked by pathogenic effectors to evade plant defense [81]. In addition, metabolome and transcriptome investigations on peach after M. fructicola inoculation indicated that the first peach response to infection occurred through the jasmonic acid signal molecule at 12 hpi, while the salicylic acid signal molecules were upregulated only after 48 hpi, emphasizing the plant response modulation to the pathogen [66]. In the ‘Messapia’ cv., both SA and PR1 were stimulated while the main genes linked to jasmonic acid, ethylene, and senescence (e.g., JA, ACC, and PG) were downregulated with maximum peak at 10 hpi and at which time the ETR1 was also downregulated. These results demonstrate that peach cultivars in the early stages of pathogen invasion can activate a different defense response. However, synchronization over the time of the host plant responses to pathogens can be suggested in both cultivars. Then, coordinated regulation of host gene expression could occur during fruit infection. Hence, we speculate that exactly at 10 hpi, some effector genes show more homogeneousness expression among the isolates because some effector genes upregulated (e.g., NEPs, Egh16, Rnt2, and UkE3 genes) or downregulated (e.g. PG6) mainly at 10 hpi in the ‘Royal Summer’ cv., while in the ‘Messapia’ cv., this trend was not detected.
Although transcriptome investigation is necessary to clarify the involvement of specific metabolic pathways, our work demonstrates that different peach cultivars can inversely modulate key genes associated with ethylene production upon M. fructicola infection. Notably, previous work suggests that Monilinia spp. can alter ethylene biosynthesis over time to benefit from the consequences of an ethylene burst likely on cell wall softening [82]. However, the same authors found the modulation of ethylene production linked to different Monilinia strains and stage of peach development.

5. Conclusions

In this work, we validated the involvement of putative effectors previously identified in the M. fructicola genome by assessing their expression in the host. We found that all the studied genes are involved, and despite the differences observed among the fungal isolates, they are modulated in relation to the host. Although the complexity of the host–pathogen interaction requires a holistic view of all associated proteins, our work indicates that in the battle between plant and pathogen, the host plant strategies against the pathogens are modulated over time. The plant–pathogen interaction mechanisms follow known models but involve different plant–pathogen molecular dialogue including molecules and different strategies in relation to peculiar characteristics of both the pathogen and the host. Therefore, the role of the host in eliciting the pathogen response should not be underestimated. In plants susceptible to brown root disease, we suggest the adaptation of the pathogen, which modulates its effector weapons based on the host’s physiology. This indicates that biotechnological genetic improvement programs will need to expand the number of target genes to effectively combat brown rot.

Supplementary Materials

The following supporting information can be downloaded at the website of this paper posted on Preprints.org, Table S1: Primers used in this study.

Author Contributions

Conceptualization, L.L and R.M.D.A.; methodology, L.L. and A.L.D.; software, L.L.; validation, L.L, G.R, and R.M.D.A.; formal analysis, L.L.; A.L.D, and S.M.M.; resources, L.L and G.R.; data curation, L.L.; writing—original draft preparation, L.L.; writing—review and editing, L.L, R.M.D.A.; G.R, A.L.D.; and S.M.M.; visualization, L.L. and R.M.D.A.; supervision, L.L, R.M.D.A.; and G.R.

Funding

ATENEO 2022 project: Identification of virulence factors genes in Monilinia fructicola, causal agent of brown rot on stone and pome fruit.

Institutional Review Board Statement

“Not applicable”.

Informed Consent Statement

“Not applicable.”.

Data Availability Statement

The data supporting this study’s findings are available from the author, Lucia Landi, upon reasonable request.

Acknowledgments

We thank Mancini Manuela (Department of Agricultural, Food and Environmental Sciences, Marche Polytechnic University) for supporting PCA investigation.

Conflicts of Interest

“The authors declare no conflicts of interest.”.

References

  1. Byrde, R.J.W.; Willetts, H.J. The Brown Rot Fungi of Fruit - Their Biology and Control. Pergamon Press: New York, NY. 1977.
  2. Casals, C.; Torres, R.; Teixidó, N.; De Cal, A.; Segarra, J.; Usall, J. Brown rot on stone fruit: From epidemiology studies to the development of effective control strategies. Sci. Hortic. 2022, 301, 111096. [Google Scholar] [CrossRef]
  3. Van Leeuwen, G.C.M.; Baayen, R.P.; Jeger, M.J. Pest risk assessment for the countries of the European Union (as PRA area) on Monilinia fructicola. EPPO Bull. 2001, 31, 481–487. [Google Scholar] [CrossRef]
  4. Usall, J.; Casals, C.; Sisquella, M.; Palou, L.; De Cal, A. Alternative technologies to control postharvest diseases of stone fruits. Stewart Postharvest Rev. 2015, 11, 1–6. [Google Scholar] [CrossRef]
  5. Mustafa, M.H.; Bassi, D.; Corre, M.N.; Lino, L.O.; Signoret, V.; Quilot-Turion, B.; Cirilli, M. Phenotyping brown rot susceptibility in stone fruit: A literature review with emphasis on peach. Horticulturae 2021, 7, 115. [Google Scholar] [CrossRef]
  6. Smith, I.M.; McNamara, D.G.; Scott, P.R.; Holderness, M. “Monilinia fructicola,” in Quarantine Pests for Europe, 2nd Edn, Wallingford, GB: CAB International, 1997.
  7. Lichou, J.; Mandrin, J.-F.; Breniaux, D.; Mercier, V.; Giauque, P.; Desbrus, D.; et al. (2002). Une nouvelle moniliose: Monilia fructicola s’attaque aux arbres fruitiers à noyaux. Phytoma 547, 22–25.
  8. Abate, D.; Pastore, C.; Gerin, D.; De Miccolis Angelini, R.M.; Rotolo, C.; Pollastro, S.; Faretra, F. Characterization of Monilinia spp. populations on stone fruit in South Italy. Plant Dis. 2018, 102, 1708–1717. [Google Scholar] [CrossRef]
  9. Landi, L.; Feliziani, E.; Romanazzi, G. Surveys for Monilinia spp. on stone fruit in central-eastern Italy. Acta Hortic. [CrossRef]
  10. Villarino, M.; Melgarejo, P.; De Cal, A. Growth and aggressiveness factors affecting Monilinia spp. survival peaches. Int. J. Food Microbiol. 2016, 227, 6–12. [Google Scholar] [CrossRef]
  11. Holb, I.J. Disease warning models for brown rot fungi of fruit crops. Int. J. Hortic. Sci. 2013, 9, 19–22. [Google Scholar] [CrossRef]
  12. Makau, S.M.; Moumni, M.; Landi, L.; Pirozzi, D.; Sannino, F.; Romanazzi, G. In vitro evaluation of chitosan hydrochloride and COS (Chito-Oligosaccharides)-OGA (Oligo-Galacturonides) on Phytopathogenic Fungi and Escherichia coli. Horticulturae 2023, 9, 1275. [Google Scholar] [CrossRef]
  13. Remolif, G.; Buonsenso, F.; Schiavon, G.; Garello, M.; Spadaro, D. Efficacy of Essential Oil Vapours in Reducing Postharvest Rots and Effect on the Fruit Mycobiome of Nectarines. J. Fungi, /: 341. https, 3390. [Google Scholar]
  14. Dangl, J.L.; Horvath, D.M.; Staskawicz, B.J. Pivoting the plant immune system from dissection to deployment. Science 2013, 341, 746–751. [Google Scholar] [CrossRef]
  15. Pascale, A.; Proietti, S.; Pantelides, I.S.; Stringlis, I.A. Modulation of the Root Microbiome by Plant Molecules: The Basis for Targeted Disease Suppression and Plant Growth Promotion. Front. Plant. Sci. 2020, 10, 1741. [Google Scholar] [CrossRef]
  16. Saijo, Y.; Loo, E.P.; Yasuda, S. Pattern recognition receptors and signaling in plant-microbe interactions. Plant J. 2018, 93, 592–613. [Google Scholar] [CrossRef] [PubMed]
  17. Huang, W.; Wang,Y. ; Li, X.; Zhang, Y. Biosynthesis and Regulation of Salicylic Acid and N-Hydroxypipecolic Acid in Plant Immunity. Mol. Plant. 2020, 13, 31–41. [Google Scholar] [CrossRef]
  18. Jarad, M.; Mariappan, K.; Almeida-Trapp, M.; Mette, M.F.; Mithofer, A.; Rayapuram, N.; Hirt, H. The Lamin-Like LITTLE NUCLEI 1 (LINC1) Regulates Pattern-Triggered Immunity and Jasmonic Acid Signaling. Front. Plant Sci. 2019, 10, 1639. [Google Scholar] [CrossRef] [PubMed]
  19. Rocafort, M.; Fudal, I.; Mesarich, C.H. Apoplastic effector proteins of plant-associated fungi and oomycetes. Curr. Opin. Plant Biol. 2020, 56, 9–19. [Google Scholar] [CrossRef] [PubMed]
  20. Toruño, T.Y.; Stergiopoulos, I.; Coaker, G. Plant-Pathogen Effectors: Cellular Probes Interfering with Plant Defenses in Spatial and Temporal Manners. Annu. Rev. Phytopathol. 2016, 54, 419–441. [Google Scholar] [CrossRef]
  21. Vleeshouwers, V.G.A.A.; Oliver, R.P. Effectors as Tools in Disease Resistance Breeding Against Biotrophic, Hemibiotrophic, and Necrotrophic Plant Pathogens. Mol. Plant-Microbe Interact. 2014, 27, 196–206. [Google Scholar] [CrossRef]
  22. Landi, L.; De Miccolis Angelini, R.M.; Pollastro, S.; Abate, D.; Faretra, F.; Romanazzi, G. Genome sequence of the brown rot fungal pathogen Monilinia fructigena. BMC Res. Notes 2018, 11, 1–3. [Google Scholar] [CrossRef]
  23. Naranjo-Ortiz, M.A.; Rodriguez-Pires, S.; Torres, R.; De Cal, A.; Usall, J.; Gabaldon, T. Genome sequence of the brown rot fungal pathogen Monilinia laxa. Genome Announc. 2018, 6, 10–1128. [Google Scholar] [CrossRef]
  24. Rivera, Y.; Zeller, K.; Srivastava, S.; Sutherland, J.; Galvez, M.; Nakhla, M.; Poniatowska, A.; Schnabel, G.; Sundin, G.; Gloria, Z.A. Draft genome resources for the phytopathogenic fungi Monilinia fructicola, M. fructigena, M. polystroma, and M. laxa, the causal agents of Brown rot. Phytopathology, 2018; 108, 1141–1142. [Google Scholar] [CrossRef]
  25. De Miccolis Angelini, R.M.; Romanazzi, G.; Pollastro, S.; Rotolo, C.; Faretra, F.; Landi, L. New high-quality draft genome of the brown rot fungal pathogen Monilinia fructicola. Genome Biol. Evol. 2019, 11, 2850–2855. [Google Scholar] [CrossRef]
  26. Landi, L.; Pollastro, S.; Rotolo, C.; Romanazzi, G.; Faretra, F.; De Miccolis Angelini, R.M. Draft genomic resources for the brown rot fungal pathogen Monilinia laxa. Mol. Plant-Microbe Interact. 2020, 33, 145–148. [Google Scholar] [CrossRef]
  27. Vilanova, L.; Valero-Jiménez, C.A.; Van Kan, J.A.L. Deciphering the Monilinia fructicola Genome to Discover Effector Genes Possibly Involved in Virulence. Genes 2021, 12, 568. [Google Scholar] [CrossRef] [PubMed]
  28. Marcet-Houben, M.; Villarino, M.; Vilanova, L.; De Cal, A.; Van Kan, J.A.L.; Usall, J.; Gabaldon, T.; Torres, R. Comparative genomics used to predict virulence factors and metabolic genes among Monilinia species. J. Fungi 2021, 7, 464. [Google Scholar] [CrossRef] [PubMed]
  29. López, A.; van Kan, J.A.L.; Beenen, H.G.; Dolcet-Sanjuan, R.; Teixidó, N.; Torres, R.; Vilanova, L. Evaluation of cell death-inducing activity of Monilinia spp. effectors in several plants using a modified TRV expression system. Front. Plant Sci. 2024, 15, 1428613. [Google Scholar] [CrossRef] [PubMed]
  30. De Miccolis Angelini, R.M.; Landi, L.; Raguseo, C.; Pollastro, S.; Faretra, F.; Romanazzi, G. Tracking of Diversity and Evolution in the Brown Rot Fungi Monilinia fructicola, Monilinia fructigena, and Monilinia laxa. Front. Microbiol. 2022, 13, 854852. [Google Scholar] [CrossRef] [PubMed]
  31. Côté, M.J.; Tardif, M.C.; Meldrum, A.J.; Identification of Monilinia fructigena, M. fructicola, M. laxa, and Monilia polystroma on Inoculated and Naturally Infected Fruit Using Multiplex PCR. Plant Dis. 2004; 88, 1219–1225. [Google Scholar] [CrossRef] [PubMed]
  32. Villarino, M.; Melgarejo, P.; De Cal, A. Growth and aggressiveness factors affecting Monilinia spp. survival peaches. Int J Food Microbiol. 2016; 224, 22–27. [Google Scholar] [CrossRef]
  33. Bustin, S.A.; Benes, V.; Garson, J.A.; Hellemans, J.; Huggett, J.; Kubista, M.; Mueller, R.; Nolan, T.; Pfaffl, M.W.; Shipley, G.L.; Vandesompele, S.J.; Wittwer, C.T. The MIQE guidelines: minimum information for publication of quantitative real-time PCR experiments. Clin. Chem. 2009, 55, 611–622. [Google Scholar] [CrossRef] [PubMed]
  34. Molina-Hernandez, J.B.; Landi, L.; Laika De Fraviis, R.; Romanazzi, G.; Chaves-López, C. Understanding the mechanisms of action of atmospheric cold plasma towards the mitigation of the stress induced in molds: The case of Aspergillus chevalieri. Innov. Food Sci. Emerg. Technol. 2023, 90, 103492. [Google Scholar] [CrossRef]
  35. Landi, L.; Peralta-Ruiz, Y.; Chaves-López, C.; Romanazzi, G. Chitosan Coating Enriched With Ruta graveolens L. Essential Oil Reduces Postharvest Anthracnose of Papaya (Carica papaya L.) and Modulates Defense-Related Gene Expression. Front. Plant Sci. 2021, 12, 765806. [Google Scholar] [CrossRef]
  36. Vandesompele, J.; De Preter, K.; Pattyn, F.; Poppe, B.; Van Roy, N.; De Paepe, A.; Speleman, F. Accurate normalization of real-time quantitative RT-PCR data by geometric averaging of multiple internal control genes. Genome Biol. 2002, 3, 1–12. [Google Scholar] [CrossRef]
  37. Xiang, J.; Cheng, J.; Wei, L.; Li, M.; Wu, J. Functional analysis of the Nep1-like proteins from Plasmopara viticola. Plant Signal Behav. 2022, 17, 2000791. [Google Scholar] [CrossRef] [PubMed] [PubMed Central]
  38. Steentjes, M.B.F.; Herrera Valderrama, A.L.; Fouillen, L.; Bahammou, D.; Leisen. T.; Albert, I.; Nürnberger, T.; Hahn, M.; Mongrand, S.; Scholten, O.E.; Van Kan, J.A.L. Cytotoxic activity of Nep1-like proteins on monocots. New Phytol. 2022, 235, 690–700. [Google Scholar] [CrossRef] [PubMed] [PubMed Central]
  39. Maurus, I.; Harting, R.; Herrfurth, C.; Starke, J.; Nagel, A.; Mohnike, L.; Chen, Y.Y.; Schmitt, K.; Bastakis, E.; Süß, M.T.; Leonard, M.; Heimel, K.; Valerius, O.; Feussner, I.; Kronstad, J.W.; Braus, G.H. Verticillium dahliae Vta3 promotes ELV1 virulence factor gene expression in xylem sap, but tame,s Mtf1-mediated late stages of fungus-plant interactions and microsclerotia formation. PLoS Pathog. 2023, 19, e1011100. [Google Scholar] [CrossRef] [PubMed] [PubMed Central]
  40. Zhu, W.; Wei, W.; Fu, Y.; Cheng, J.; Xie, J.; Li, G.; et al. A secretory protein of necrotrophic fungus Sclerotinia sclerotiorum that suppresses host resistance. PLoS ONE 2013, 8, e53901. [Google Scholar] [CrossRef] [PubMed]
  41. Chen, Y.; Zhang, S.; Lin, H.; Lu, W.; Wang, H.; Chen, Y. ; Lin, Yifen.; Fan, Z. The role of cell wall polysaccharides disassembly in Lasiodiplodia theobromae-induced disease occurrence and softening of fresh longan fruit. Food Chem. 2021; 351, 129294. [Google Scholar] [CrossRef]
  42. Kumar, R.; Meghwanshi, GK.; Marcianò, D.; Ullah, S.F.; Bulone, V.; Toffolatti, S.L.; Srivastava, V. Sequence, structure and functionality of pectin methylesterases and their use in sustainable carbohydrate bioproducts: A review. Int J Biol Macromol. 2023, 31. [Google Scholar] [CrossRef] [PubMed]
  43. Rafiei, V.; Vélëz, H.; Tzelepis, G. The Role of Glycoside Hydrolases in Phytopathogenic Fungi and Oomycetes Virulence. Int. J. Mol. Sci. 2021, 22, 9359. [Google Scholar] [CrossRef]
  44. Hassan, M.A.; España, J.D.A.; Hea-Reung, P.; Schwartze, V.U.; Schäuble, S.; Krüger, T.; Kniemeyer, O.; Brakhage, A.A.; Voigt, K. P343 Novel hydrophobic binding surface proteins are instrumental for phagocytosis of Lichtheimia corymbifera by macrophages. Med. Mycol. J. 2022, 60. [Google Scholar] [CrossRef]
  45. Feldman, D.; Yarden, O.; Hadar, Y. Seeking the roles for fungal small-secreted proteins in affecting saprophytic lifestyles. Front Microbiol. /: 11:455. https. [CrossRef]
  46. Shen, G.; Sun, W.; Chen, Z.; Shi, L.; Hong, J.; Shi, J. Plant GDSL Esterases/Lipases: Evolutionary, Physiological and Molecular Functions in Plant Development. Plants 2022, 11, 468. [Google Scholar] [CrossRef]
  47. Wang, L.; Xu, Z.; Yin, W.; Xu, K.; Wang, S.; Shang, Q.; Sa, W.; Liang, J.; Wang, L. Genome-wide analysis of the Thaumatin-like gene family in Qingke (Hordeum vulgare L. var. nudum) uncovers candidates involved in plant defense against biotic and abiotic stresses. Front. Plant Sci. 2022, 13, 912296. [Google Scholar] [CrossRef] [PubMed] [PubMed Central]
  48. Liu J, Feng S, Liu T, Mao Y, Shen S, Liu Y, Hao Z and Li Z (2024) Molecular characterization revealed the role of thaumatin-like proteins of Rhizoctonia solani AG4-JY in inducing maize disease resistance. Front. Microbiol. 15:1377726. [CrossRef]
  49. Qian, H.; Wang, L.; Wang, B.; Liang, W. The secreted ribonuclease T2 protein FoRnt2 contributes to Fusarium oxysporum virulence. Mol. Plant Pathol. 2022, 3, 1346–1360. [Google Scholar] [CrossRef]
  50. Liu T, Song T, Zhang X, Yuan H, Su L, Li W, Xu J, Liu S, Chen L, Chen T, Zhang M, Gu L, Zhang B, Dou D. Unconventionally secreted effectors of two filamentous pathogens target plant salicylate biosynthesis. Nat Commun. 2014 Aug 26;5:4686. [CrossRef] [PubMed]
  51. Vorlander, M.K.; Khatter, H.; Wetzel, R.; Hagen, W.J.H.; Muller, C.W. Molecular mechanism of promoter opening by RNA polymerase III. Nature, 2018; 553, 295–300. [Google Scholar] [CrossRef]
  52. Hadfield, K.A.; Rose, J.K.; Yaver, D.S.; Berka, R.M.; Bennett, A.B. Polygalacturonase gene expression in ripe melon fruit supports a role for polygalacturonase in ripening-associated pectin disassembly. Plant Physiol. 1998, 117, 363–373. [Google Scholar] [CrossRef] [PubMed] [PubMed Central]
  53. Schott-Verdugo, S.; Müller, L.; Classen, E.; Gohlke, H.; Groth, G. Structural Model of the ETR1 Ethylene Receptor Transmembrane Sensor Domain. Sci. Rep. 2019, 9, 8869. [Google Scholar] [CrossRef]
  54. Forouhar, F.; Yang, Y.; Kumar, D.; Chen, Y.; Fridman, E.; Park, S.W.; Chiang, Y.; Acton, T.B.; Montelione, G.T.; Pichersky, E.; Klessig, D.F.; Tong, L. Structural and biochemical studies identify tobacco SABP2 as a methyl salicylate esterase and implicate it in plant innate immunity. Proc. Natl. Acad. Sci. 2005, 102, 1773–1778. [Google Scholar] [CrossRef] [PubMed] [PubMed Central]
  55. Luo, X.; Tian, T.; Feng, L.; Yang, X.; Li, L.; Tan, X.; Wu, W.; Li, Z.; Treves, H.; Serneels, F.; Ng, IS.; Tanaka, K.; Ren, M. Pathogenesis-related protein 1 suppresses oomycete pathogen by targeting against AMPK kinase complex. J. Adv. Res. 2023, 43, 13–26. [Google Scholar] [CrossRef] [PubMed] [PubMed Central]
  56. Stroud, E.A.; Jayaraman, J.; Templeton, M.D.; Rikkerink, E.H.A. Comparison of the pathway structures influencing the temporal response of salicylate and jasmonate defence hormones in Arabidopsis thaliana. Front. Plant Sci. 2022, 13, 952301. [Google Scholar] [CrossRef]
  57. Houben, M.; Van de Poel, B. 1-Aminocyclopropane-1-Carboxylic Acid Oxidase (ACO): The Enzyme That Makes the Plant Hormone Ethylene. Front. Plant Sci. 2019, 10, 695. [Google Scholar] [CrossRef]
  58. Vaish, S.; Gupta, D.; Mehrotra, R.; Mehrotra, S.; Basantani, M.K. Glutathione S-transferase: a versatile protein family. 3 Biotech. 2020, 10, 1–19. [Google Scholar] [CrossRef] [PubMed] [PubMed Central]
  59. Livak, K.J.; Schmittgen, T.D. Analysis of relative gene expression data using real-time quantitative PCR and the 2−ΔΔCT method. Methods 2001, 25, 402–408. [Google Scholar] [CrossRef]
  60. Lê, S.; Josse, J.; Husson, F. FactoMineR: An R Package for Multivariate Analysis. J. Stat. Softw. 2008, 25, 1–18. [Google Scholar] [CrossRef]
  61. Wickham, H. (2009). ggplot2: Elegant Graphics for Data Analysis. Verlag New York:Springer. [CrossRef]
  62. Zhu, X.; Soliman, A.; Islam, M.R.; Adam, L.R.; Daayf, F. Verticillium dahliae's Isochorismatase Hydrolase Is a Virulence Factor That Contributes to Interference With Potato's Salicylate and Jasmonate Defense Signaling. Front. Plant Sci. 2017, 8, 399. [Google Scholar] [CrossRef] [PubMed] [PubMed Central]
  63. Mihaylova, D.; Popova, A.; Desseva, I.; Petkova, N.; Stoyanova, M.; Vrancheva, R.; Slavov, A.; Slavchev, A.; Lante, A. Comparative Study of Early- and Mid-Ripening Peach (Prunus persica L.) Varieties: Biological Activity, Macro-, and Micro- Nutrient Profile. Foods, 2021; 10, 164. [Google Scholar] [CrossRef]
  64. Gladysheva-Azgari, M.V. .; Slobodova, N.V.; Boulygina, E.S.; Sharko, F.S.; Rastorguev, S.M.; Smykov, A.V.; Mitrofanova, I.V.; Tsygankova, S.V. Trascriptomic Profiles of Three Peach (Prunus Persica (L.) Batsch) Cultivars with Different Ripening Periods at the Initial Fruiting Stages. Nanotechnol. Russia 2023, 18, 480–489. [Google Scholar] [CrossRef]
  65. Zhang, X.; Zhang, Z.; Chen, T.; Chen, Y.; Li, B.; Tian, S. Characterization of two SGNH family cell death-inducing proteins from the horticulturally important fungal pathogen Botrytis cinerea based on the optimized prokaryotic expression system. Mol. Hortic. 2024, 4, 9. [Google Scholar] [CrossRef] [PubMed] [PubMed Central]
  66. Cheng, A.P.; Lederer, B.; Oberkofler, L. ; Huang L, Johnson NR, Platten F, Dunker F, Tisserant C, Weiberg A. A fungal RNA-dependent RNA polymerase is a novel player in plant infection and cross-kingdom RNA interference. PLoS Pathog. 2023 Dec 20;19:e1011885. [CrossRef] [PubMed]
  67. Derbyshire, M.; Denton-Giles, M.; Hegedus, D.; Seifbarghy, S.; Rollins, J.; Van-Kan, J.; Seidl, M.F.; Faino, L.; Mbengue, M.; Navaud, O.; Raffaele, S.; Hammond-Kosack, K.; Heard, S.; Oliver, R. The complete genome sequence of the phytopathogenic fungus Sclerotinia sclerotiorum reveals insights into the genome architecture of broad host range pathogens. Genome Biol. Evol. 2017, 9, 593–618. [Google Scholar] [CrossRef] [PubMed] [PubMed Central]
  68. Kirsten, S.; Navarro-Quezada, A.; Penselin, D.; Wenzel, C. ; Matern. A.; Leitner, A.; Baum, T.; Seiffert, U.; Knogge, W. Necrosis-inducing proteins of Rhynchosporium commune, effectors in quantitative disease resistance. Mol. Plant-Microbe Interact, 2012; 25, 1314–1325. [Google Scholar] [CrossRef]
  69. Staats, M.; Van Baarlen, P.; Schouten, A.; Van Kan, J.A.L.; Bakker, F.T. Positive selection in phytotoxic protein-encoding genes of Botrytis species. Fungal Genet. Biol. 2007, 44, 52–63. [Google Scholar] [CrossRef] [PubMed]
  70. Plesken, C.; Pattar, P.; Reiss, B.; Noor, Z.N.; Zhang, L.; Klug, K.; Huettel, B.; Hahn, M. Genetic Diversity of Botrytis cinerea Revealed by Multilocus Sequencing, and Identification of B. cinerea Populations Showing Genetic Isolation and Distinct Host Adaptation. Front. Plant Sci. 2021, 12, 663027. [Google Scholar] [CrossRef] [PubMed] [PubMed Central]
  71. Guyon, K, Balagué, C. ; Roby, D.; Raffaele, S. Secretome analysis reveals effector candidates associated with broad host range necrotrophy in the fungal plant pathogen Sclerotinia sclerotiorum. BMC Genomics 2014, 15, 1–19. [Google Scholar] [CrossRef] [PubMed] [PubMed Central]
  72. Lenarčič, T.; Albert, I.; Böhm, H.; Hodnik, V.; Pirc, K.; Zavec, A.B.; Podobnik, M.; Pahovnik, D.; Žagar, E.; Pruitt, R.; et al. Eudicot plant-specific sphingolipids determine host selectivity of microbial NLP cytolysins. Science 2017, 358, 1431–1434. [Google Scholar] [CrossRef]
  73. Pascoal-Ferreira, P.; Chahed, A.; Costa, R.; Branco, I.; Choupina, A. Use of iRNA in the post-transcriptional gene silencing of necrosis-inducing Phytophthora protein 1(NPP1) in Phytophthora cinnamomi. Mol. Biol. Rep. 2023, 50, 6493–6504. [Google Scholar] [CrossRef]
  74. Schürch, S.; Linde, C.C.; Knogge, W.; Jackson, L.F.; McDonald, BA. Molecular Population Genetic Analysis Differentiates Two Virulence Mechanisms of the Fungal Avirulence Gene NIP1. Mol. plant-microb. interact. 2004, 17(10), 1114-1125. [Google Scholar] [CrossRef]
  75. Fellbrich, G.; Romanski, A.; Varet, A.; Blume, B.; Brunner, F.; Engelhardt, S.; Felix, G.; Kemmerling, B.; Krzymowska, M.; Nürnberger, T. NPP1, a Phytophthora-associated trigger of plant defense in parsley and Arabidopsis. Plant J. 2002, 32, 375–390. [Google Scholar] [CrossRef] [PubMed]
  76. Arenas, Y.C.; Kalkman, E.R.; Schouten, A.; Dieho, M.; Vredenbregt, P.; Uwumukiza, B.; Ruiz, M.O.; Van Kan, J.A. Functional analysis and mode of action of phytotoxic Nep1-like proteins of Botrytis cinerea. Physiol. Mol. Plant Pathol. 2010, 74, 376–386. [Google Scholar] [CrossRef]
  77. Tsalgatidou, P.C.; Boutsika, A.; Papageorgiou, A.G.; Dalianis, A.; Michaliou, M.; Chatzidimopoulos, M.; Delis, C.; Tsitsigiannis, D.I.; Paplomatas, E.; Zambounis, A. Global Transcriptome Analysis of the Peach (Prunus persica) in the Interaction System of Fruit-Chitosan-Monilinia fructicola. Plants 2024, 13, 567. [Google Scholar] [CrossRef] [PubMed] [PubMed Central]
  78. Han, Z.; Xiong, D.; Schneiter, R.; Tian, C. The function of plant PR1 and other members of the CAP protein superfamily in plant–pathogen interactions. Mol. Plant Pathol. 2023, 24, 651–668. [Google Scholar] [CrossRef]
  79. Chang, C.; Kwok, S.F.; Bleecker, A.B.; Meyerowitz, E.M. Arabidopsis ethylene-response gene ETR1: similarity of product to two-component regulators. Science 1993, 262, 539–544. [Google Scholar] [CrossRef] [PubMed]
  80. Vlot, A.C.; Dempsey, D.A.; Klessig, D.F. Salicylic acid, a multifaceted hormone to combat disease. Annu. Rev. Phytopathol. 2009, 47, 177–206. [Google Scholar] [CrossRef] [PubMed]
  81. Kim, J.; Chang, C.; Tucker, M.L. To grow old: regulatory role of ethylene and jasmonic acid in senescence. Front. Plant Sci. 2015, 6, 20. [Google Scholar] [CrossRef] [PubMed]
  82. Baró-Montel, N.; Vall-Llaura, N.; Giné-Bordonaba, J.; Usall, J.; Serrano-Prieto, S.; Teixidó, N.; Torres, R. Double-sided battle: The role of ethylene during Monilinia spp. infection in peach at different phenological stages. Plant Physiol. Biochem. 2019, 144, 324–333. [Google Scholar] [CrossRef] [PubMed]
Figure 1. - Disease assessment on wounded peach fruit cv. ‘Royal Summer´ ’ (a,b,c,d,e,) and cv. ‘Messapia’ (f,g,h,i,l) 24 h-post inoculation (hpi) with 30 μL conidia suspension (109 conidia/mL) of AN7 (a,f), AN26 (b,g), AN12 (c,h) AN13 (d,i), and AN14 (e,l) M. fructicola isolates. (m) Brown rot severity (cm) caused by M. fructicola isolates at 24 hpi after inoculation on peach fruit cv. ‘Royal Summer’ and cv. ‘Messapia’. Data represent the mean of two experiments with four inoculations per fruit and three fruits per isolate and experiment (n=24). Data were analyzed by analysis of variance. Means and standard deviation are not significantly different (P ≤ 0.05) according to the Tukey HSD post-hoc test.
Preprints 141973 g001
Figure 2. -Expression profiles of 17 putative effector genes assayed (see Table 1) by RT-qPCR. RNA was isolated from five M. fructicola isolates (AN7, AN26, AN12, AN13, and AN14) after inoculation on peach cv. ‘Royal Summer’ at 0, 2, 6, 10, and 24 hpi. The data were represented as fold change compared to 0 hpi (h0), which is given a value of 1. Means were determined with data from two biological replicates with three technical replicates each (n = 6). For each gene of each fungal isolate, columns with different letters are significantly different (P ≤ 0.05; Tukey HSD post-hoc test).
Preprints 141973 g002
Figure 3. Heatmap showing hierarchical cluster analysis of 17 M. fructicola putative effector genes (see Table 1) expressed across all samples (different fungal isolates AN7, AN26, AN12, AN13, and AN14 at 0, 2, 6, 10, and 24 hpi) on the two cv.s ‘Royal Summer’ (a) and ‘Messapia’ (b). The genes (rows) and samples (columns) are clustered using the Pearson Correlation distance and complete linkage hierarchical clustering. The gradient scale represents expression levels, with red showing the highest expression to blue with the lowest expression level.
Preprints 141973 g003
Figure 4. Expression profiles of 17 putative effector genes assayed (see Table 1) by RT-qPCR. RNA was isolated from five M. fructicola isolates (AN7, AN26, AN12, AN13, and AN14) after inoculation on cv. ‘Messapia’ peach at 0, 2, 6, 10, and 24 hpi. The data were represented as fold-change compared to 0 hpi (h0), which is given a value of 1. Means were determined with data from two biological replicates with three technical replicates each (n = 6). For each gene of each fungal isolate, columns with different letters are significantly different (P ≤ 0.05; Tukey HSD post-hoc test).
Preprints 141973 g004
Figure 5. Expression profiles of seven key peach defense genes (see Table 1) assayed by RT-qPCR detected in ‘Royal Summer’ after inoculation with AN7, AN26, AN12, AN13, and AN14 M. fructicola fungal isolates at 0, 2, 6, 10, and 24 hpi. The data were represented as fold change compared to 0 hpi (h0). Means were determined with data from two biological replicates with three technical replicates each (n = 6). For each gene of each fungal isolate, columns with different letters are significantly different (P ≤ 0.05; Tukey HSD post-hoc test).
Preprints 141973 g005
Figure 6. Heat map showing hierarchical cluster analysis of seven genes (see Table 1) expressed in peaches across all samples on the ‘Royal Summer’ cv. (a) and ‘Messapia’ cv. (b) after inoculation with AN7, AN26, AN12, AN13, and AN14 M. fructicola fungal isolates at 0, 2, 6, 10, and 24 hpi. The scale represents expression levels, with red showing the highest expression to blue with the lowest expression.
Preprints 141973 g006
Figure 7. Expression profiles of seven key peach defense genes (see Table 1) assayed by RT-qPCR detected in ‘Messapia’ after inoculation with M. fructicola fungal isolates AN7, AN26, AN12, AN13, and AN14 at 0, 2, 6, 10, and 24 hpi. The data were represented as fold-change compared to 0 hpi (h0). Means were determined with data from two biological replicates with three technical replicates each (n = 6). For each gene of each fungal isolate, columns with different letters are significantly different (P ≤ 0.05; Tukey HSD post-hoc test).
Preprints 141973 g007
Figure 8. Principal component analysis (PCA) of gene expression dataset. PCA biplot (score plot) visualizing projections onto the first two principal components. The biplot graph represents the relationship among the expression of 17 putative effector genes (see Table 1 for details) and 7 peach expression genes highlighted by a red circle (see Table 1 for details) used as vectors and the peach cv.s ‘Messapia’ and ‘Royal Summer' used as groups. The two main components (Dim1 and Dim2) explained 24.3% and 14.8% of the variance, respectively. Different colors and symbols represent the different cv.s: (• blue), ‘Messapia’ and (▲ -yellow), ‘Royal Summer’. Ellipses indicate a confidence interval of 50%. The direction and length of the arrows illustrate how each effector (vector) contributes to the first two components in the PCA. Aligned vectors indicate a strong positive correlation between the two effectors (< 30%). Vectors at right angles/opposites (>90%) indicate no correlation/negative correlation, respectively.
Preprints 141973 g008
Table 1. Genes selected for gene expression analysis in M. fructicola and P. persica. The main functions of the gene products are also given.
Locus tag Code Name Function
aEYC84_006718* NEP1 necrosis- and ethylene-inducing protein 1 This family consists of several NePs, including necrosis and ethylene-inducing proteins from oomycetes, fungi, and bacteria [37,38].
bEYC84_009186* NEP2 necrosis- and ethylene-inducing protein 2
bEYC84_007944* Egh16 Egh16-like virulence factor Egh16-like virulence factors are found in many pathogenic filamentous fungi and are thought to play a role in host interaction [39].
bEYC84_002620* CVNH CVNH - CyanoVirin-N homology CyanoVirin-N Homology domains are found in the sugar-binding antiviral protein cyanovirin-N (CVN) and filamentous ascomycetes. In S. sclerotiorum, CVNH was associated with plant infection and was proposed to suppress plant resistance hypersensitive response [40].
bEYC84_008853* PG6 polygalacturonase 6 Polygalacturonase (PG) is one of the main enzymes in fungal pathogens to degrade plant cell walls, facilitating penetration and colonization of the host [41].
bEYC84_010609* PME pectin methylesterase and related acyl-CoA thioesterases Pectin methylesterase is the first enzyme acting to modify pectins in plant cell walls [42].
EYC84_008964* GAS1 probable GAS1 Glycophospholipid-anchored surface glycoprotein GAS1 elongates the β-1,3-glucan chains and plays an important role in the biosynthesis of the fungal cell walls. GAS1 induces typical hypersensitive response and systemic acquired resistance (SAR) defense responses [43]
dEYC84_001420* HsbA hydrophobic surface binding protein A HsbA is a specific fungal spore-secreted protein that can bind to hydrophobic surfaces. These proteins can recruit lytic enzymes to the surface and promote their degradation [44].
bEYC84_008014* SSP small secreted protein Comprising 40–60% of the total fungal secretome, SSPs are defined as proteins that contain a signal peptide and a sequence of less than 300 amino acids [45].
aEYC84_003936* GELP GDSL-type esterase/lipase proteins (GELPs) GELPs represent a variety of lipolytic enzymes that hydrolyze diverse lipidic substrates, including thioesters, aryl esters, and phospholipids [46]
cEYC84_000899* TLP osmotin/thaumatin-like superfamily TLPs belong to the pathogenesis-related 5 protein family in plants, playing a significant role in host defense [47]. In fungi, the secretion activity and endo-β-1,3-glucanase activity of the TLP family members were detected [48].
cEYC84_005201* Rnt2 ribonuclease T2-like The Rnt2 family was identified during the plant infection and contributes to the virulence of the pathogen through the degradation of plant RNA [49].
bEYC84_002145* ycaC isochorismatase Isochorismatases involved in the cellular amino acid catabolic process have been found in the secretome of phytopathogens. They are a precursor of salicylic acid and many other distinct derivatives in plants, fungi, and bacteria [50].
aEYC84_004547* RPC5 RPC5 protein This family represents the RPC5 protein, which is part of the RNA polymerase III complex. It acts as a nuclear and cytosolic DNA sensor involved in innate immune response and can sense non-self dsDNA that serves as a template for transcription into dsRNA [51].
aEYC84_003395* UkE1 hypothetical protein Unknown
bEYC84_005228* UkE2 hypothetical protein
eEYC84_011230* UkE3 hypothetical protein
NM_001405051.1** PG polygalacturonase PGs are an important pectolytic glycanase, primarily implicated in the softening of fruit during ripening [52].
AF124527.1** ETR-1 ethylene receptor, transcript ETR1 ETR-1 is included in the ethylene receptor family [53].
XM_007203058.2** SA salicylic acid-binding protein 2 This protein is required to convert methyl salicylate to salicylic acid as part of the signal transduction pathways that activate SAR in systemic tissue [54].
JF694923.1** PR-1 pathogenesis-related protein 1 PR-1 constitutes a secretory peptide family. This protein plays important roles in plant metabolism in response to biotic and abiotic stresses, and its role in plant defense has been widely demonstrated [55].
XM_020560994.1** JA jasmonic acid-amido synthetase JA is involved in jasmonic acid defense biosynthesis [56].
XM_007215636.2** ACC 1-aminocyclopropane-1-carboxylate oxidase ACC catalyzes the final step in ethylene biosynthesis [57].
XM_007215891.2** GST glutathione S-transferase F12 GST has been implemented in diverse plant functions, such as detoxification of xenobiotic, secondary metabolism, growth and development, and especially against biotic and abiotic stresses [58].
Note: orthologs with: a = M. laxa, M. fructigena; b = M. laxa, M. fructigena, Botrytis cinerea, and Sclerotinia sclerotiorum; c = M. fructigena, Botrytis cinerea, and Sclerotinia sclerotiorum; d = M. laxa, M. fructigena, and Botrytis cinerea; e = M. laxa, Sclerotinia sclerotiorum, and Botrytis cinerea. * = genes of M. fructicola; ** = peach genes.
Disclaimer/Publisher’s Note: The statements, opinions and data contained in all publications are solely those of the individual author(s) and contributor(s) and not of MDPI and/or the editor(s). MDPI and/or the editor(s) disclaim responsibility for any injury to people or property resulting from any ideas, methods, instructions or products referred to in the content.
Copyright: This open access article is published under a Creative Commons CC BY 4.0 license, which permit the free download, distribution, and reuse, provided that the author and preprint are cited in any reuse.
Prerpints.org logo

Preprints.org is a free preprint server supported by MDPI in Basel, Switzerland.

Subscribe

Disclaimer

Terms of Use

Privacy Policy

Privacy Settings

© 2025 MDPI (Basel, Switzerland) unless otherwise stated