
Submitted:
04 December 2024
Posted:
05 December 2024
You are already at the latest version
Abstract
MicroRNA122 (miR-122) is a microRNA that is highly expressed in hepatocytes and becomes a prospective therapeutic target and biomarker for liver injury. An expanding body of research has demonstrated that miR-122 is a critical regulator in both the initiation and progression of a wide range of liver diseases. Traditional methods for detecting miR-122 mainly include northern blotting and qRT-PCR, but they are technically complex and cumbersome, requiring expensive instruments and high technical requirements. In this paper, we present a rapid testing method utilizing a lateral flow nucleic acid biosensor (LFNAB) for the sensitive and time-efficient detection of miR-122. This approach offers several advantages, including high specificity for miR-122, the ability to detect low concentrations of the target molecule, and a significantly reduced testing time compared to conventional detection methods. A thiol-modified single-stranded detection DNA probe (Det-DNA), a biotinylated single-stranded capture DNA probe (Cap-DNA) and a biotinylated single-stranded control DNA probe (Con-DNA) are used to construct the LFNAB. Gold nanoparticle (AuNP) is a colored tag, which is used to label the Det-DNA probe. Principal of detecting miR-122 is based on dual DNA-miRNA hybridization reactions on the LFNAB to form sandwich-type AuNP-Det-DNA-miR-122-Cap-DNA complexes, which are captured on the test area of LFNAB for visualization and quantification. After systematic optimization of conditions of experiment, the response of LFNAB was highly linear within the scope of 0 pM-100 pM miR-122, and the detection limit in 15 min is 3.90 pM. The use of LFNAB to detect miR-122 in serum and fingertip blood has yielded satisfactory results. This successful application indicates the effectiveness of LFNAB in detecting miR-122 in both serum and fingertip blood samples, showcasing its potential utility in clinical and research settings for assessing miR-122 levels in different biological samples.
Keywords:
miR-122
; lateral flow
; biosensors
; gold nanoparticles
; visual detection
1. Introduction
MicroRNAs (miRNAs) are a kind of small non-coding RNA molecules, typically around 22 nucleotides in length, known to modulate gene expression at the post-transcriptional level across a wide array of cell types [1]. Altered miRNA expression has been linked to specific liver conditions, including hepatitis, hepatocellular carcinoma, and cirrhosis [2]. MiRNA-122 exhibits high expression levels in the liver, representing approximately 70% of the total miRNA pool [3]. A growing body of research shows that miRNA-122 plays a significant part in the initiation and advancement of various liver diseases. Therefore, miRNA-122 can be used as a biomarker for liver injury. Traditional miRNA-122 detection methods include northern blotting, in situ hybridization, RT-qPCR, microarray, and next-generation sequencing, etc [4]. Northern blotting demands a substantial amount of test samples and utilizes radioactive probes, making it unsuitable for the detection of low-abundance samples [5]. In situ hybridization requires complex steps such as denaturation, long reaction times, and specific software or fluorescence imaging microscopy to detect the probe itself. RT-qPCR offers high sensitivity; however, the process of sample preparation is complex and, more importantly, constrained by the short length of miRNA sequences [6]. Expression profiling based on microarrays offers only a semi-quantitative evaluation of gene expression; it is constrained by the types of probes included in the platform and the limitations of their sensitivity and specificity [7]. For next-generation sequencing, each sequencing experiment generates a large amount of sequence data, the analysis of which is a major bioinformatics challenge [8]. The substantial experimental costs, time-intensive sample pre-treatment, and complex experimental procedures associated with traditional miRNA detection methods significantly hinder their practical applicability [9,10,11]. Hence, it is crucial to devise a practical, rapid, sensitive, and cost-effective technique for detecting miRNA-122.
In the last few years, nucleic acid biosensors (NABs) have received great attention in bioanalysis and clinical diagnosis because of their distinct advantages, including high sensitivity and short assay time. NABs including electrochemical and optical NABs have been applied to detect miRNAs [12]. However, electrochemical NABs require specialized operators and long time to prepare the electrodes [13,14,15]. Optical NABs require expensive instruments and strict reaction conditions [16,17]. The lateral flow nucleic acid biosensors (LFNABs), as a simple and rapid detection platform, overcome the drawbacks of traditional NABs and offer some advantages, including simple operation, no need for complex instrumentation, instant visibility of results, and low cost. Recently, LFNABs have been used to detect miR-155 [18,19], miR-21 [20,21,22] and miR-210 [22,23] in cell lyses and serum samples. In this paper, a LFNAB is developed for the detection of miR-122. The optimized device exhibited highly linear responses within the range of 0 pM to 100 pM miR-122, with a detection limit of 3.90 pM. The LFNAB was utilized for detecting miR-122 in serum and fingertip blood, yielding satisfactory results.
2. Materials and Methods
2.1. Instruments
XYZ Large Platform 3D Film Spraying Instrument, Microcomputer Automatic Chopper, CNC Strip Cutter and Colloidal Gold Analyzer were produced by Shanghai Gold Standard Biotechnology Co., Ltd; Nano Particle Size and Zeta Potential Analyzer was bought from Dandong Baxter Instrument Co., Ltd.; high temperature oven was purchased from Shanghai Qixin Scientific Instrument Co., Ltd.; UV spectrophotometer was bought from Shanghai Yuan Analytical Instrument Co..
2.2. Reagents and Materials
HAuCl4-3H2O (99.9%) was produced by Sigma-Aldrich, Inc. (St. Louis, MO, USA). N-butanol, Tween-20, polyethylene glycol, trisodium citrate (Na3Ct) and Triton X-100 were produced by Shanghai McLean Biochemistry Technology Co. (Shanghai, China). Glucose and sucrose were purchased from Sinopharm Chemical Reagent Co. (Shanghai, China). 5x TBE buffer, Bovine serum albumin (BSA), 20x SSC buffer (pH=7.0) and 10x PBS buffer (pH=7.4) were bought from Solepol. Absorbent paper was bought from Shanghai Gold Standard Biotechnology Co. Ltd (Shanghai, China). Glass fibers, and nitrocellulose membranes were bought from Shanghai Jenin Biotechnology Co. Ltd (Shanghai, China).
Table 1 lists the oligonucleotides involved in this experiment, all of which were produced by Sangon Biotech. Co, Ltd (Shanghai, China).
2.3. Preparation of Gold Nanoparticles (AuNPs)
AuNPs (average particle size of 28 nm) were prepared following previously reported methods with minor modifications [24]. 200 mL of 0.04% HAuCl4 was placed in a conical flask, marked at the liquid level of the container, and put on a magnetic stirrer and heated and stirred until boiling. To this solution, 4.7 mL of 2% trisodium citrate solution was put in, accompanied by continuous heating and stirring. The color then changed from yellow to grey-black and finally to translucent red, stopped heating and the solution was stirred at an appropriate low speed for a few minutes and cooled. After cooling to room temperature, replenish water to the mark, keep away from light for use.
2.4. Preparation of Det-DNA-AuNP Conjugates
Det-DNA-AuNP conjugates were prepared in a manner similar to previously reported methods, with slight adjustments [25]. The procedure involved taking 50 µL of a 6-fold concentrated AuNP solution, to which 2 µL of a 100 µmol/L Det-DNA probe was added and thoroughly mixed. The mixture was transferred into 1 mL of n-butanol, thoroughly mixed, and then 100 µL of 0.5x TBE was added and mixed well. Centrifuge the mixture at 2000 rpm for 20 seconds and discard the supernatant. The tiny black dot at the base of the centrifuge tube was preserved and then dispersed in 100 µL of distilled water (ddH2O). The above solution was centrifuged at 6000 rpm for 8 min. The liquid supernatant was removed and 100 µL of 1x PBS was added, set at 6000 rpm and centrifuged for 8 min to get rid of any residual impurities. Ultimately, the resulting Det-DNA-AuNP conjugate was dispersed in 50 µL of resuspension buffer.
2.5. Preparation of LFNAB
The LFNAB includes four elements: a sample pad, a conjugate pad, a nitrocellulose membrane, and an absorbent pad. All elements were placed on a PVC base plate. Among these components, the sample pad and conjugate pad were constructed from glass fiber. The sample pad was saturated with a solution comprising 0.5% Triton X-100, 2% glucose, 1% BSA, and 2% polyethylene glycol for a duration of 2 hours. Similarly, the conjugate pad was immersed in 1x PBS containing 2% glucose, 1% BSA, 0.5% Triton X-100, and 2% polyethylene glycol, followed by drying at 37 °C. The absorbent pad material was absorbent paper. Both glass fiber and absorbent paper were cut into long strips of different widths using a microcomputerized automatic chopper, and then formed into sample pads, conjugate pads and absorbent pads. The Det-DNA/AuNP coupling solution was sprayed onto the binding mat with a XYZ large-platform 3D film-sprayer and dried at 37 °C for 2 hours. To immobilize the biotinylated Cap-DNA and Con-DNA on the nitrocellulose membrane, streptavidin was used to bind with the biotinylated Cap-DNA and Con-DNA, creating streptavidin-biotinylated Cap-DNA and streptavidin-biotinylated Con-DNA complexes. These complexes were then applied onto the nitrocellulose membrane using an XYZ large-platform 3D film sprayer to create the test and control areas. The nitrocellulose membrane was dried at 37 °C for 2 hours. Subsequently, the sample pads, conjugate pads, nitrocellulose membranes, and absorbent pads were collected and cut using a CNC cutting machine to create the test strips.
2.6. Sample Analysis Procedure
For miR-122 standard testing, a range of sample solutions with different miR-122 concentrations were created using 4x SSC as the up-sampling buffer, with 75 µL utilized for each test. After applying the sample solution on the LFNAB and wait for 15 minutes, the test and control areas could be visually examined. Qualitative analysis was performed by simply observing the red bands located in the test and control areas. Besides, two red bands appeared on the both test area and control area indicate a positive (+) test; only one red band on the control area indicates a negative (-) test; No band on both the test area and control area, or a red band appearing only on the test area, indicates that the test is invalid. Quantitative analysis was performed by using a colloidal gold analyser to read the colour intensity data of the test and control lines. Finally, calibration curves were plotted using the ratios of the test line intensity to the control line intensity against miRNA-122 concentrations.
For real sample test, serum, fingertip blood, spiked serum and spiked fingertip blood were used as samples. First, we tested normal human serum and serum spiked with miR-122, plotted the standard curve and calculated its recovery. Normal human serum was diluted 10 times with 4x SSC. The spiked serum samples were prepared by spiking miR-122 in the diluted serum. 75 µL of the diluted serum (or the spiked serum) was used for the strip test. Then, for normal human fingertip blood and spiked fingertip blood, 10 µL of fingertip blood was added dropwise, followed by 65 µL of 4x SSC, and the color of the test area was observed.
3. Results
3.1. The Principle of Testing miR-122 on LFNAB
The miR-122 detection principle on LFNAB (Figure 1) relies on a dual DNA-RNA hybridization reaction. After the sample solution containing miR-122 is added to the sample pad, the solution will flow along the LFNAB due to capillary action. And when it flows through the conjugate pad, the miR-122 will undergo the DNA-RNA hybridization with AuNP/Det-DNA on the conjugate pad, generating the AuNP/Det-DNA-miR-122 complexes, and when flowing through the test area, the AuNP/Det-DNA-miR-122 complexes will be captured by the second DNA-RNA hybridization reactions between the miR-122 and the Cap-DNAs on the test line. This interaction will lead to the formation of AuNP/Det-DNA-miR-122-Cap-DNA complexes, where AuNPs are enriched and show a red band, i.e., the T line. Excess AuNP-Det-DNA conjugate flows through the control region and hybridizes with Con-DNA on the control line, generating the AuNP/Det-DNA-Con-DNA complexes, where AuNPs are enriched, showing the second red band, the C line. When the sample solution doesn’t contain miR-122, only the C line is shown. Total completed assay time is 15 min. For qualitative detection (Yes/No), one can observe the T line and C line on the tested strips. If both T line and C line are shown on the tested strip, it indicates the sample solution contains miR-122 (positive); If only C line is shown on the tested strip, it indicates the sample solution doesn’t contain miR-122 (negative); if only T line is shown on the tested strip or no line is shown on both T line and C line, it indicates the test is invalid. It is noted that the intensity of the T line increases with increasing miR-122 concentration. For quantitative detection, a colloidal gold analyzer is used to determine the concentration of miR-122. The tested strips will be inserted into the colloidal gold analyzer for imaging and determining the grey values of the T and C lines. Thus, the ratios of T/C are used to plot the calibration curve.
3.2. Optimization of Experimental Parameters
The experimental conditions have a great influence on the sensitivity of miR-122 analysis on the LFNAB. We optimized several experimental conditions including the sources of nitrocellulose membranes (a), the molar ratio of streptavidin (SA) to biotinylated DNA probe (b), the concentration of AuNPs used to prepare Det-DNA-AuNP conjugate (c), the amount of Det-DNA probe (d), the amount of AuNP-Det-DNA conjugate per strip (e), and the concentration of running buffer (f). Figure S2 in ESI provides the detailed experimental conditions and discussion. The optimized conditions were: (a) nitrocellulose membrane using CN140; (b) 3:1 ratio of biotin-modified probe immobilized on the TC line to streptavidin; (c) 6-fold concentration of AuNP solution; (d) 2 µL of Det-DNA probe; (e) 1.8 µL conjugate per strip; and (f) 4x SSC as running buffer.
3.3. Analytical Properties
Sample solutions with varying miR-122 concentrations were tested under the optimal conditions to evaluate the LFNAB's analytical performance. To minimize the error, six sets at each concentration level were prepared and each set of test was repeated three times. Quantitative analysis was performed with a colloidal gold analyzer, and the average of the three repetitions of tests was taken as a single set of data, and the average of the six sets was taken for plotting the calibration curve. Figure 2a presents the photographic images of the LFNABs following tests with varying concentrations of miR-122. It can be observed that the intensity of the T line increases as the concentration of miR-122 rises, and the intensity of C line keeps constant level at the concentration range from 0 to 1 nM, then decreases at higher concentration. The reduction in C line intensity is attributed to the consistent quantity of AuNP-Det-DNA dispensed on the conjugate pad of the LFNAB. With a greater capture of AuNP-Det-DNA conjugates on the T line and a diminished capture on the C line, the T/C ratio is consequently leveraged to establish the calibration curve. It is noted that there is no T line in the absence of miR-122 (control), indicating there is no nonspecific adsorption on the test area under the optimal experimental conditions. The lowest detectable miR-122 concentration is 10 pM, which is used as the limit of qualitative detection. Quantitative data was obtained by reading the gray values(intensities) of T and C lines with the colloidal gold analyzer. Figure 2b shows the corresponding responses of the LFNABs tested in Figure 2a. When miR-122 is present, there are two peaks, while in the absence of miR-122, there is only one peak. The peak area presents the intensities of T and C lines. Figure 2c shows the calibration curve for miR-122 detection, and the interpolation plot shows good linear dynamics in the 0 pM to 100 pM range. According to the standard deviation (SD) of 3, the quantitative detection limit is estimated to be around 3.90 pM.
3.4. Specificity Test
To assess the LFNAB's specificity for miR-122 detection, we set up six groups of experiments, namely (a) 50 pM miR-122; (b) 50 pM single-base mismatched miRNA; (c) 50 pM two-base mismatched miRNA; (d) 50 pM three-base mismatched miRNA; (e) 500 pM random miRNA; (f) 50 pM miR-122 + 500 pM random miRNA. As can be seen that negligible responses were obtained with two-base mismatch, three-base mismatch and non-complementary miRNA; the highest response was obtained with target miR-122 (Figure 3). It is worth noting that the LFNAB can detect a single mismatch in the target miR-122, the response of one-mismatch microRNA is around 50% of the response of miR-122. Furthermore, the response of miR-122 and random miRNA mixture is similar with that of miR-122, indicating that the random miRNA has no effect on the detection of miR-122.
3.5. Detection of miR-122 in Serum and Finger Blood
3.5.1. Detection of miR-122 in Serum
As shown in Figure 4, after spiking normal human serum we plotted the calibration curve with the equation T/C=0.00438 C(miR-122)/(pmol/L) + 0.000557 and the correlation coefficient is 0.9995, which is a little less linear than that of miR-122 without spiking serum. The sensitivity of miR-122 test in the spiked serum sample matrix is less than that in the pure buffer. According to the standard deviation (SD) of 3, the quantitative detection limit is estimated to be around 4.09 pM. Moreover, we calculated the recovery of miR-122 in serum (Table 2), which was good.
3.5.2. Detecting miR-122 in Fingertip Blood
We tested the fingertip blood samples from six healthy individuals. Figure 5a shows the photographs of LFNABs. One can see only the C line and no T line, indicating the concentration of miRNA-122 is below 10 pM. Afterwards, the fingertip blood samples were spiked with 50 pM and 100 pM miRNA-122 and tested (Figure 5b), which showed the T line, indicating that fingertip blood hardly interferes with miR-122 detection.
4. Discussion
This study successfully demonstrated the detection of microRNA-122 using a lateral flow biosensor with a visual detection limit of 10 pM. Comparatively, Gao et al. [26] reported a DNA-gold nanoparticle (DNA-GNP)-based lateral flow nucleic acid biosensor that, after systematic optimization, achieved a detection limit of 60 pM for miRNA-215. Our sensor demonstrated a six-fold improvement in sensitivity, which can be primarily attributed to the use of butanol dehydration in the preparation of the conjugate. Ding et al. [27] systematically compared five methods—salt aging, microwave-assisted dry heating, freezing and thawing, low pH treatment, and butanol dehydration—evaluating their effects on the analytical performance of lateral flow nucleic acid biosensors (LFNAB). The findings confirmed that the conjugates prepared using butanol dehydration achieved the lowest detection limits, further validating the superiority of this method.
Despite these advances in sensitivity, the application of lateral flow sensors for whole-blood testing remains challenging. Specifically, in fingertip blood testing, the need for buffer addition to dilute samples results in reduced microRNA concentrations, thereby limiting their practical applicability. Consequently, developing methods capable of achieving highly sensitive detection directly in whole blood has become a critical area of research.
To address this limitation, several advanced isothermal nucleic acid amplification technologies have shown significant potential. Recombinase polymerase amplification (RPA) is a rapid and highly sensitive isothermal amplification technique that facilitates efficient target nucleic acid amplification at low temperatures [28]. Loop-mediated isothermal amplification (LAMP) is recognized for its high specificity and rapid amplification, making it particularly suitable for detecting stable targets [29]. CRISPR systems, especially those utilizing Cas12 and Cas13 proteins, offer exceptional potential for the sensitive detection of short nucleic acids like microRNAs due to their highly specific target recognition and cleavage properties [30]. Similarly, exponential amplification reaction (EXPAR) is a highly efficient isothermal amplification technique that rapidly amplifies short nucleic acid sequences, making it especially effective for detecting microRNAs and other small-molecule targets [31].
In this context, integrating lateral flow sensors with advanced techniques such as RPA, LAMP, CRISPR, and EXPAR represents a pivotal strategy to enhance microRNA detection performance. Among these, EXPAR stands out for its comparable amplification efficiency to other isothermal techniques, such as rolling circle amplification (RCA), LAMP, and RPA, while eliminating the need for thermal cycling [32]. This characteristic significantly improves its suitability for both point-of-care and real-time applications. Consequently, combining lateral flow assays (LFA) with EXPAR to enable direct and rapid detection of microRNAs is anticipated to become a key focus and breakthrough direction in future research.
5. Conclusions
In this paper, we employed a lateral flow biosensor to detect microRNA-122 in human serum, and after system optimization, we could detect miR-122 at 4.09 pM. The successful utilization of the biosensor for detecting microRNA in spiked fingertip blood, with the potential to characterize the degree of liver injury in humans, marks a significant advancement. The next step is to improve the detection sensitivity and apply it to the clinic for the detection of microRNA in patients with different stages of hepatocellular carcinoma, so as to achieve early diagnosis, early detection and early treatment.
Supplementary Materials
The following supporting information can be downloaded at the website of this paper posted on Preprints.org.
Author Contributions
M.Z. and G.L. performed the experiments and wrote the paper; M.Z., M.M., Y.Z. and J.W. analyzed the data, X.Z. and G.L. conceived and designed the experiments. All authors have read and agreed to the published version of the manuscript.
Funding
This research was supported by the National Key Research and Development Program of the Ministry of Science and Technology, China (Grant number: 2022YFB3207200), and Startup Foundation for Advanced Talents of Linyi University, China (Grant number: Z6122047)
Data Availability Statement
Not applicable.
Conflicts of Interest
There are no conflicts to declare.
References
- Choi, Y.; Hwang, D.W.; Kim, M.Y.; Kim, J.Y.; Sun, W.; Lee, D.S. Transgenic mouse expressing optical microRNA reporter for monitoring microRNA-124 action during development. Front. Mol. 2016, 9, 52. [Google Scholar] [CrossRef]
- Wei, X.-y.; Ding, J.; Tian, W.-g.; Yu, Y.-C. MicroRNA-122 as a diagnostic biomarker for hepatocellular carcinoma related to hepatitis C virus: a meta-analysis and systematic review. J. Int. Med. Res. 2020, 8, 0300060520941634. [Google Scholar] [CrossRef]
- Jopling, C. Liver-specific microRNA-122: Biogenesis and function. RNA Biol. 2012, 2, 137–142. [Google Scholar] [CrossRef] [PubMed]
- Wang, H. A Review of Nanotechnology in microRNA Detection and Drug Delivery. Cells 2024, 13, 15. [Google Scholar] [CrossRef]
- Koscianska, E.; Starega-Roslan, J.; Sznajder, L.J.; Olejniczak, M.; Galka-Marciniak, P.; Krzyzosiak, W.J. Northern blotting analysis of microRNAs, their precursors and RNA interference triggers. BMC Mol. Biol. 2011, 12, 1–7. [Google Scholar] [CrossRef]
- Chen, C.; Tan, R.; Wong, L.; Fekete, R.; Halsey, J. Quantitation of microRNAs by real-time RT-qPCR. Methods Mol. Biol. 2010, 113–134. [Google Scholar]
- Reis-Filho, J.S. Next-generation sequencing. Breast Cancer Res. 2009, 3, 1–7. [Google Scholar] [CrossRef]
- Hackenberg, M.; Sturm, M.; Langenberger, D.; Falcon-Perez, J.M.; Aransay, A.M. miRanalyzer: a microRNA detection and analysis tool for next-generation sequencing experiments. Nucleic Acids Res. 2009, 37, suppl_2, W68-W76.
- Jia, H.; Li, Z.; Liu, C.; Cheng, Y. Ultrasensitive detection of microRNAs by exponential isothermal amplification. Angew. Chem., Int. Ed. 2010, 49, 32, 5498-5501.
- Lu, L.-M.; Zhang, X.-B.; Kong, R.-M.; Yang, B.; Tan, W. A ligation-triggered DNAzyme cascade for amplified fluorescence detection of biological small molecules with zero-background signal. J. Am. Chem. Soc. 2011, 30, 11686–11691. [Google Scholar] [CrossRef] [PubMed]
- Peng, Y.; Zhou, W.; Yuan, R.; Xiang, Y. Dual-input molecular logic circuits for sensitive and simultaneous sensing of multiple microRNAs from tumor cells. Sens. Actuators, B 2018, 264, 202-207.
- Parkhe, V.S.; Tiwari, A.P. Gold nanoparticles-based biosensors: pioneering solutions for bacterial and viral pathogen detection-a comprehensive review. World J. Microbiol. Biotechnol. 2024, 9, 269. [Google Scholar] [CrossRef]
- Tian, R.; Li, Y.; Bai, J. Hierarchical assembled nanomaterial paper based analytical devices for simultaneously electrochemical detection of microRNAs. Anal. Chim. Acta 2019, 1058, 89–96. [Google Scholar] [CrossRef]
- Wu, Y.; Fu, C.; Shi, W.; Chen, J. Recent advances in catalytic hairpin assembly signal amplification-based sensing strategies for microRNA detection. Talanta 2021, 235, 122735. [Google Scholar] [CrossRef]
- Wang, H.; Jian, Y.; Kong, Q.; Liu, H.; Lan, F.; Liang, L.; Ge, S.; Yu, J. Ultrasensitive electrochemical paper-based biosensor for microRNA via strand displacement reaction and metal-organic frameworks. Sens. Actuators, B 2018, 257, 561-569.
- Feng, S.; Mo, K.; Song, X. 3D printed microfluidic chip integrated with nanointerferometer for multiplex detection of foodborne pathogens. AIP Adv. 2024, 14, 6. [Google Scholar] [CrossRef]
- Zhao, Y.-L.; Chen, Q.; Lv, J.; Xu, M.-M.; Zhang, X.; Li, J.-R. Specific sensing of antibiotics with metal-organic frameworks based dual sensor system. Nano Res. 2022, 7, 6430–6437. [Google Scholar] [CrossRef]
- Lu, X.; Lu, W.; Hua, D. A novel SERS-lateral flow assay (LFA) tray for monitoring of miR-155-5p during pyroptosis in breast cancer cells. Anal. Methods 2024. [Google Scholar] [CrossRef] [PubMed]
- Javani, A.; Javadi-Zarnaghi, F.; Rasaee, M.J. A multiplex protein-free lateral flow assay for detection of microRNAs based on unmodified molecular beacons. Anal. Biochem. 2017, 537, 99–105. [Google Scholar] [CrossRef]
- Zhang, J.; Tang, L.; Yu, Q.; Qiu, W.; Li, K.; Cheng, L.; Zhang, T.; Qian, L.; Zhang, X.; Liu, G. Gold-platinum nanoflowers as colored and catalytic labels for ultrasensitive lateral flow MicroRNA-21 assay. Sens. Actuators, B 2021, 344, 130325.
- Dong, T.; Yin, R.; Yu, Q.; Qiu, W.; Li, K.; Qian, L.; Li, H.; Shen, B.; Liu, G. Sensitive detection of microRNA-21 in cancer cells and human serum with Au@ Si nanocomposite and lateral flow assay. Anal. Chim. Acta 2021, 1147, 56–63. [Google Scholar] [CrossRef]
- Wang, W.; Nie, A.; Lu, Z.; Li, J.; Shu, M.; Han, H. Catalytic hairpin assembly-assisted lateral flow assay for visual determination of microRNA-21 using gold nanoparticles. Microchim. Acta 2019, 186, 1–9. [Google Scholar] [CrossRef] [PubMed]
- Zhang, Y.; Liu, X.; Wang, L.; Yang, H.; Zhang, X.; Zhu, C.; Wang, W.; Yan, L.; Li, B. Improvement in detection limit for lateral flow assay of biomacromolecules by test-zone pre-enrichment. Sci. Rep. 2020, 1, 9604. [Google Scholar] [CrossRef]
- Storhoff, J.J.; Elghanian, R.; Mucic, R.C.; Mirkin, C.A.; Letsinger, R.L. One-pot colorimetric differentiation of polynucleotides with single base imperfections using gold nanoparticle probes. J. Am. Chem. Soc. 1998, 9, 1959–1964. [Google Scholar] [CrossRef]
- Hao, Y.; Li, Y.; Song, L.; Deng, Z. Flash synthesis of spherical nucleic acids with record DNA density. J. Am. Chem. Soc. 2021, 8, 3065–3069. [Google Scholar] [CrossRef]
- Gao, X.; Xu, H.; Baloda, M.; Gurung, A.S.; Xu, L.-P.; Wang, T.; Zhang, X.; Liu, G. Visual detection of microRNA with lateral flow nucleic acid biosensor. Biosens. Bioelectron. 2014, 54, 578–584. [Google Scholar] [CrossRef] [PubMed]
- Ding, Q.; Qiu, W.; Sun, C.; Ren, H.; Liu, G. Comparison of DNA-Gold Nanoparticle Conjugation Methods: Application in Lateral Flow Nucleic Acid Biosensors. Molecules 2023, 28, 11. [Google Scholar] [CrossRef]
- Wu, S.; Yu, W.; Fu, X.; Yu, X.; Ye, Z.; Zhang, M.; Qiu, Y.; Ma, B. Advances in Virus Detection Techniques Based on Recombinant Polymerase Amplification. Molecules 2024, 29, 20. [Google Scholar] [CrossRef] [PubMed]
- Hu, S.; Niu, L.; Luo, L.; Song, X.; Sun, J.; Liu, Q. Rapid, Sensitive Detection of Bartonella quintana by Loop-Mediated Isothermal Amplification of the groEL Gene. Int. J. Mol. Sci. 2016, 17, 12. [Google Scholar] [CrossRef]
- Mahfouz, M. Revolutionizing Point-of-Care Diagnostics via CRISPR Systems. ACS Synth. Biol. 2024, 2, 411–412. [Google Scholar] [CrossRef] [PubMed]
- Guo, H.; Chen, J.; Feng, Y.; Dai, Z. A Simple and Robust Exponential Amplification Reaction (EXPAR)-Based Hairpin Template (exp-Hairpin) for Highly Specific, Sensitive, and Universal MicroRNA Detection. Anal. Chem. 2024, 6, 2643–2650. [Google Scholar] [CrossRef]
- Reid, M.S.; Le, X.C.; Zhang, H. Exponential Isothermal Amplification of Nucleic Acids and Assays for Proteins, Cells, Small Molecules, and Enzyme Activities: An EXPAR Example. Angew. Chem., Int. Ed. Engl. 2018, 57, 37, 11856-11866.
Figure 1.
Schematic diagram of LFNAB for the miR-122 assay.
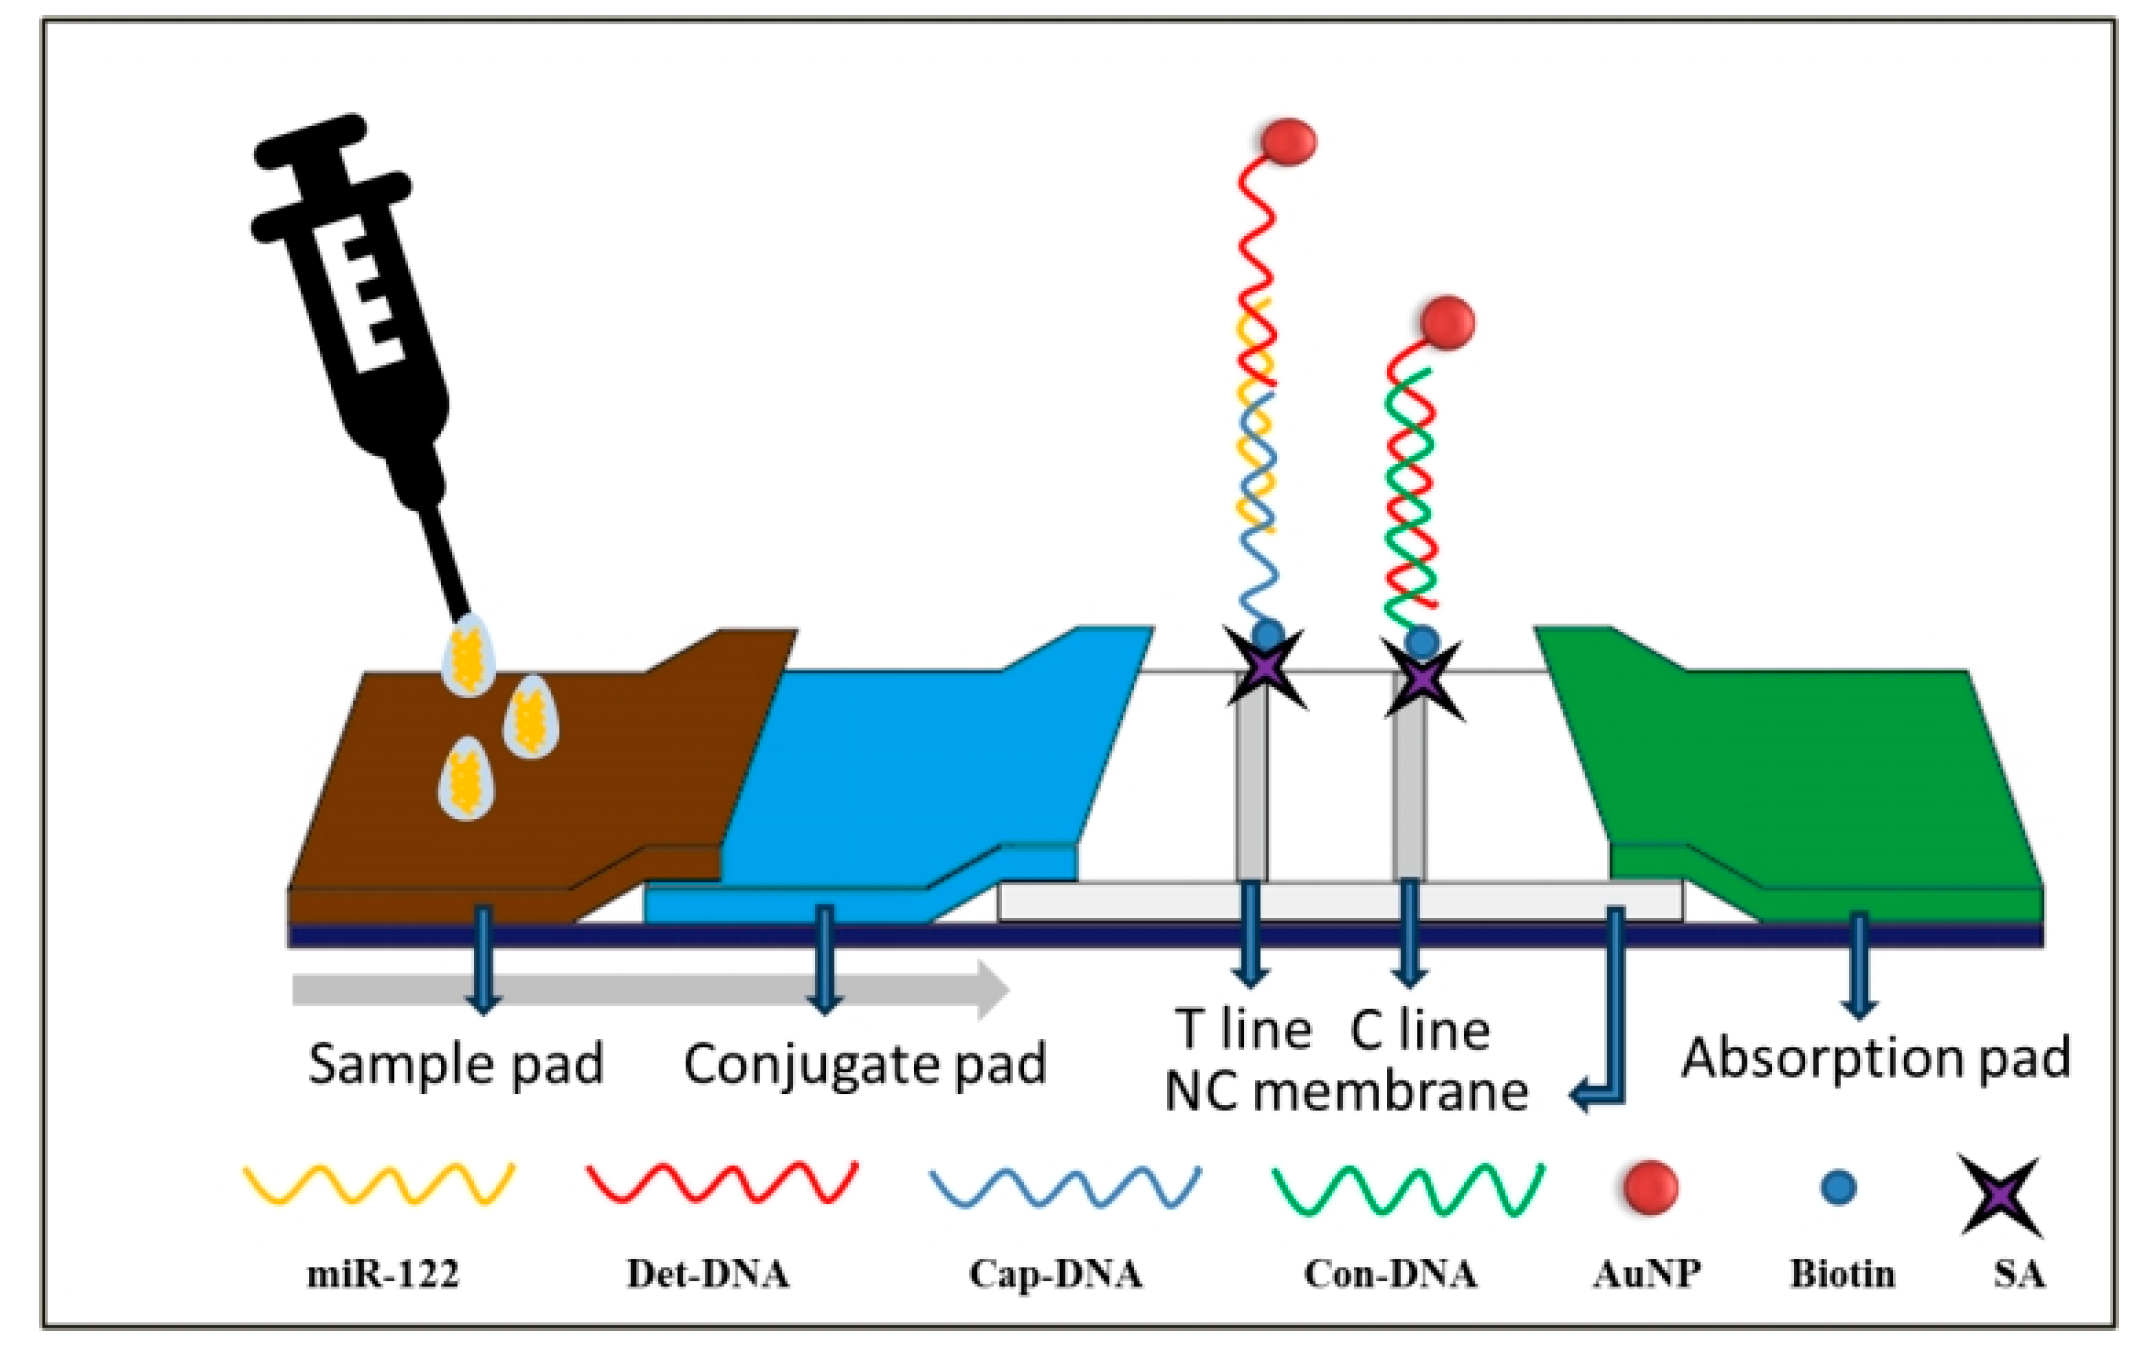
Figure 2.
(a) Photographs of LFNABs after testing various miR-122 concentrations; (b) Corresponding responses of LFNABs obtained from colloidal gold analyzer; (c) Calibration curve for miR-122 show in (b). Inset: the linear range region.
Figure 2.
(a) Photographs of LFNABs after testing various miR-122 concentrations; (b) Corresponding responses of LFNABs obtained from colloidal gold analyzer; (c) Calibration curve for miR-122 show in (b). Inset: the linear range region.
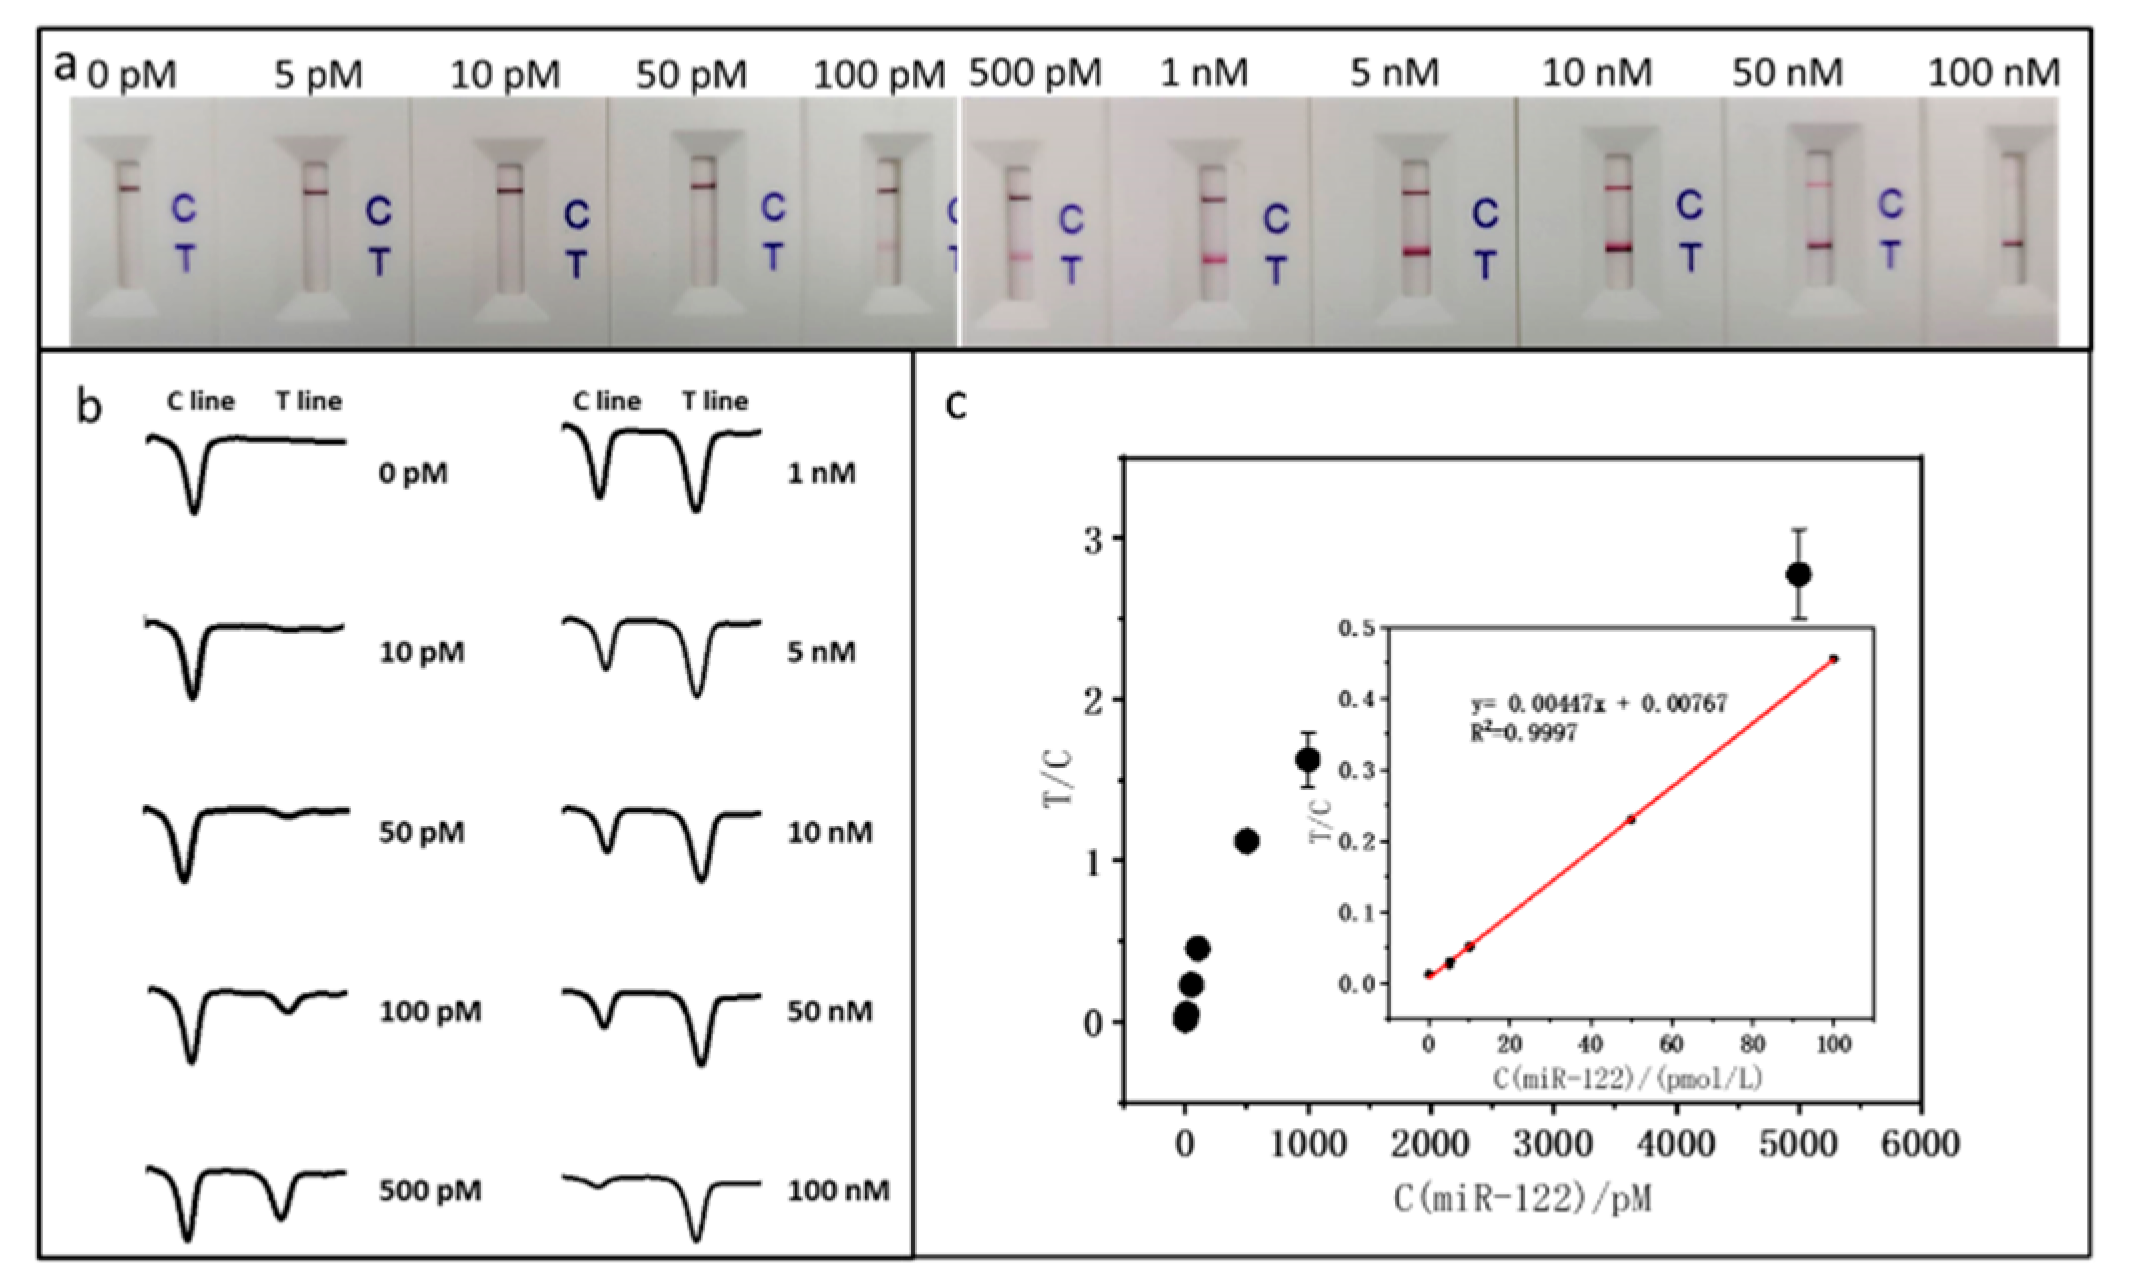
Figure 3.
MiR-122 specificity test. (a) 50 pM miR-122; (b) 50 pM single-base mismatched miRNA; (c) 50 pM double-base mismatched miRNA; (d) 50 pM triple-base mismatched miRNA; (e) 500 pM random miRNA; (f) 50 pM miR-122 + 500 pM random miRNA.
Figure 3.
MiR-122 specificity test. (a) 50 pM miR-122; (b) 50 pM single-base mismatched miRNA; (c) 50 pM double-base mismatched miRNA; (d) 50 pM triple-base mismatched miRNA; (e) 500 pM random miRNA; (f) 50 pM miR-122 + 500 pM random miRNA.
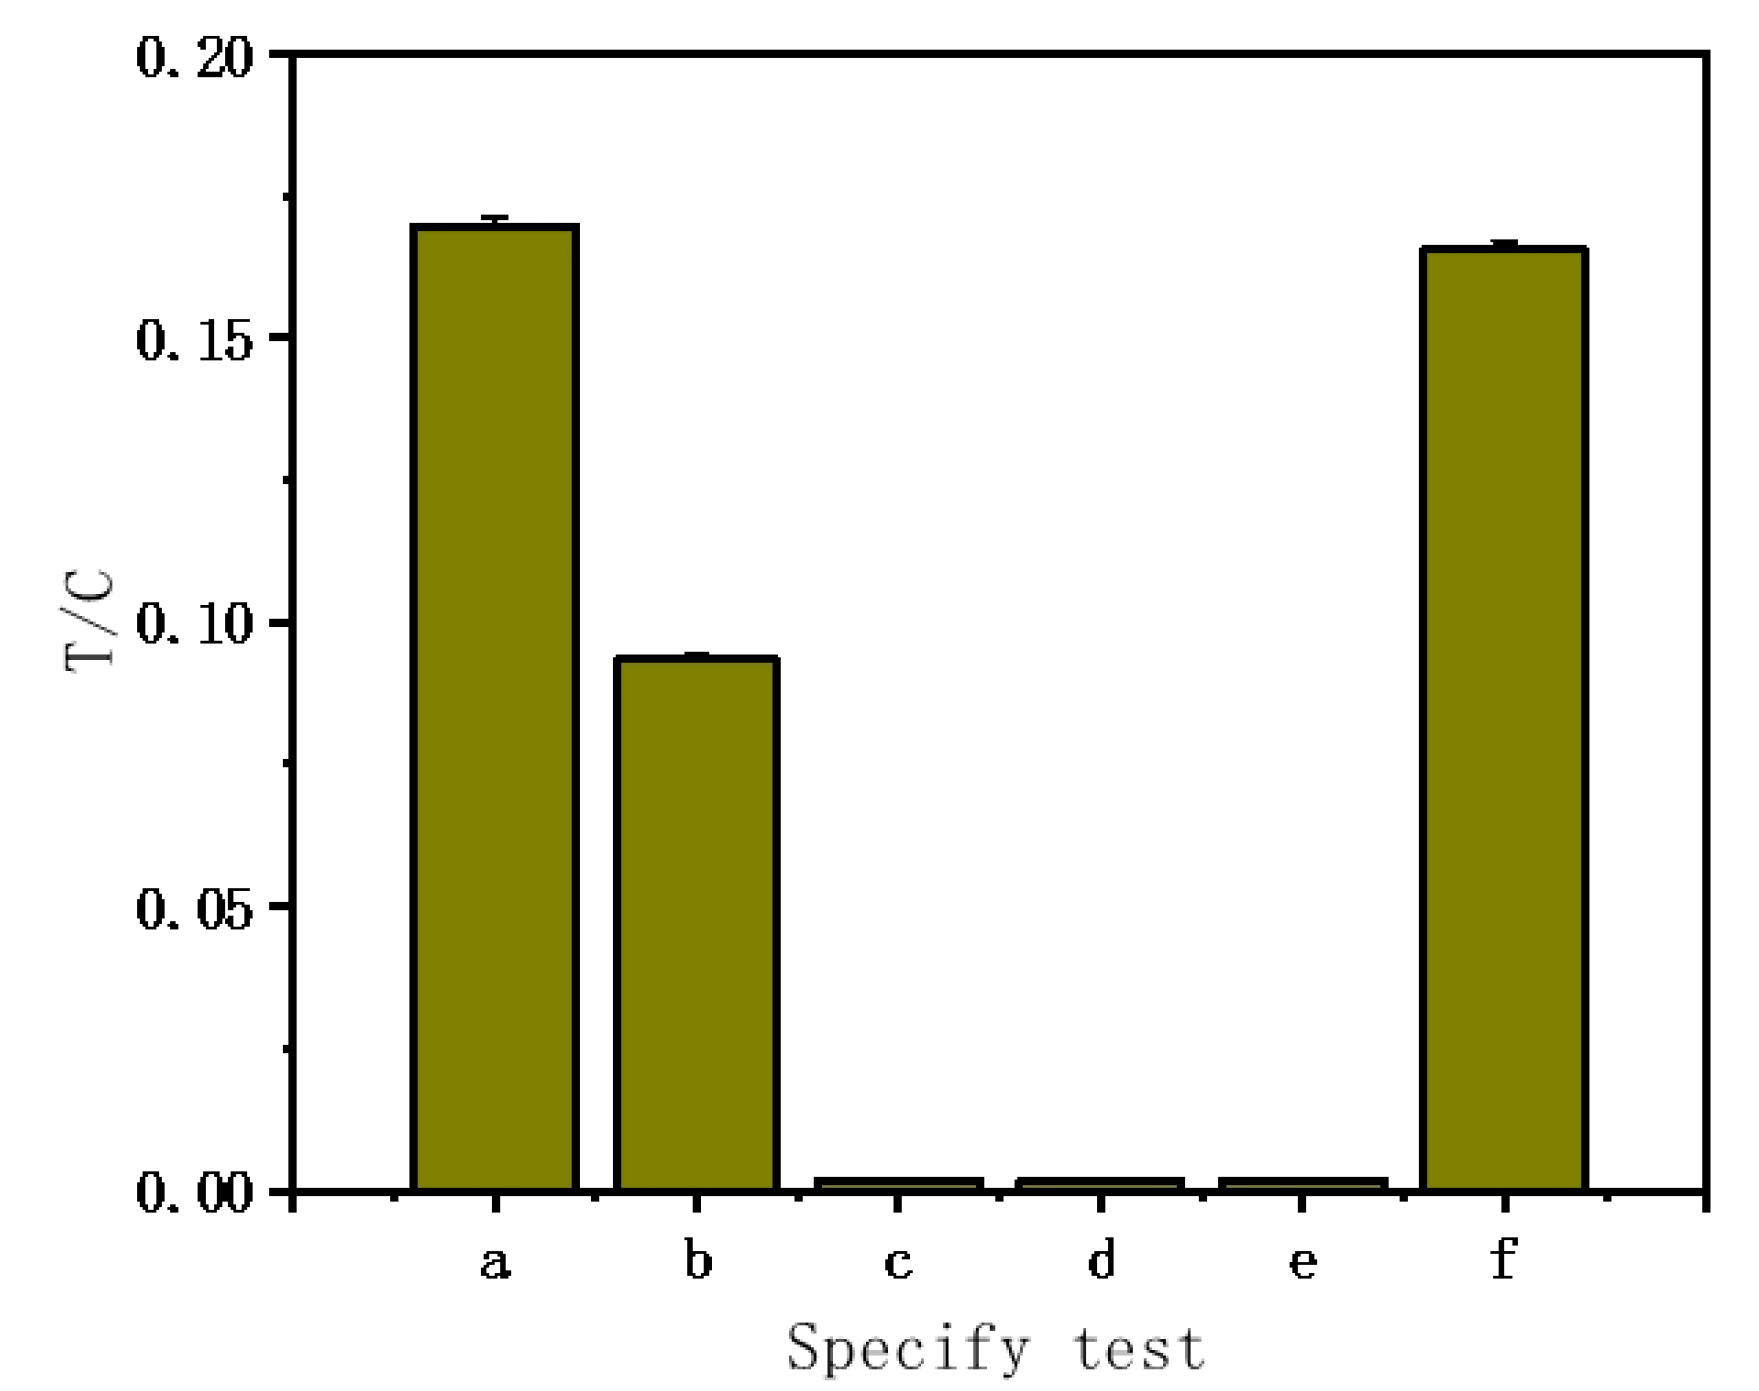
Figure 4.
Calibration curves and photographs of test strip assays for detecting varying concentrations of miR-122 in serum.
Figure 4.
Calibration curves and photographs of test strip assays for detecting varying concentrations of miR-122 in serum.
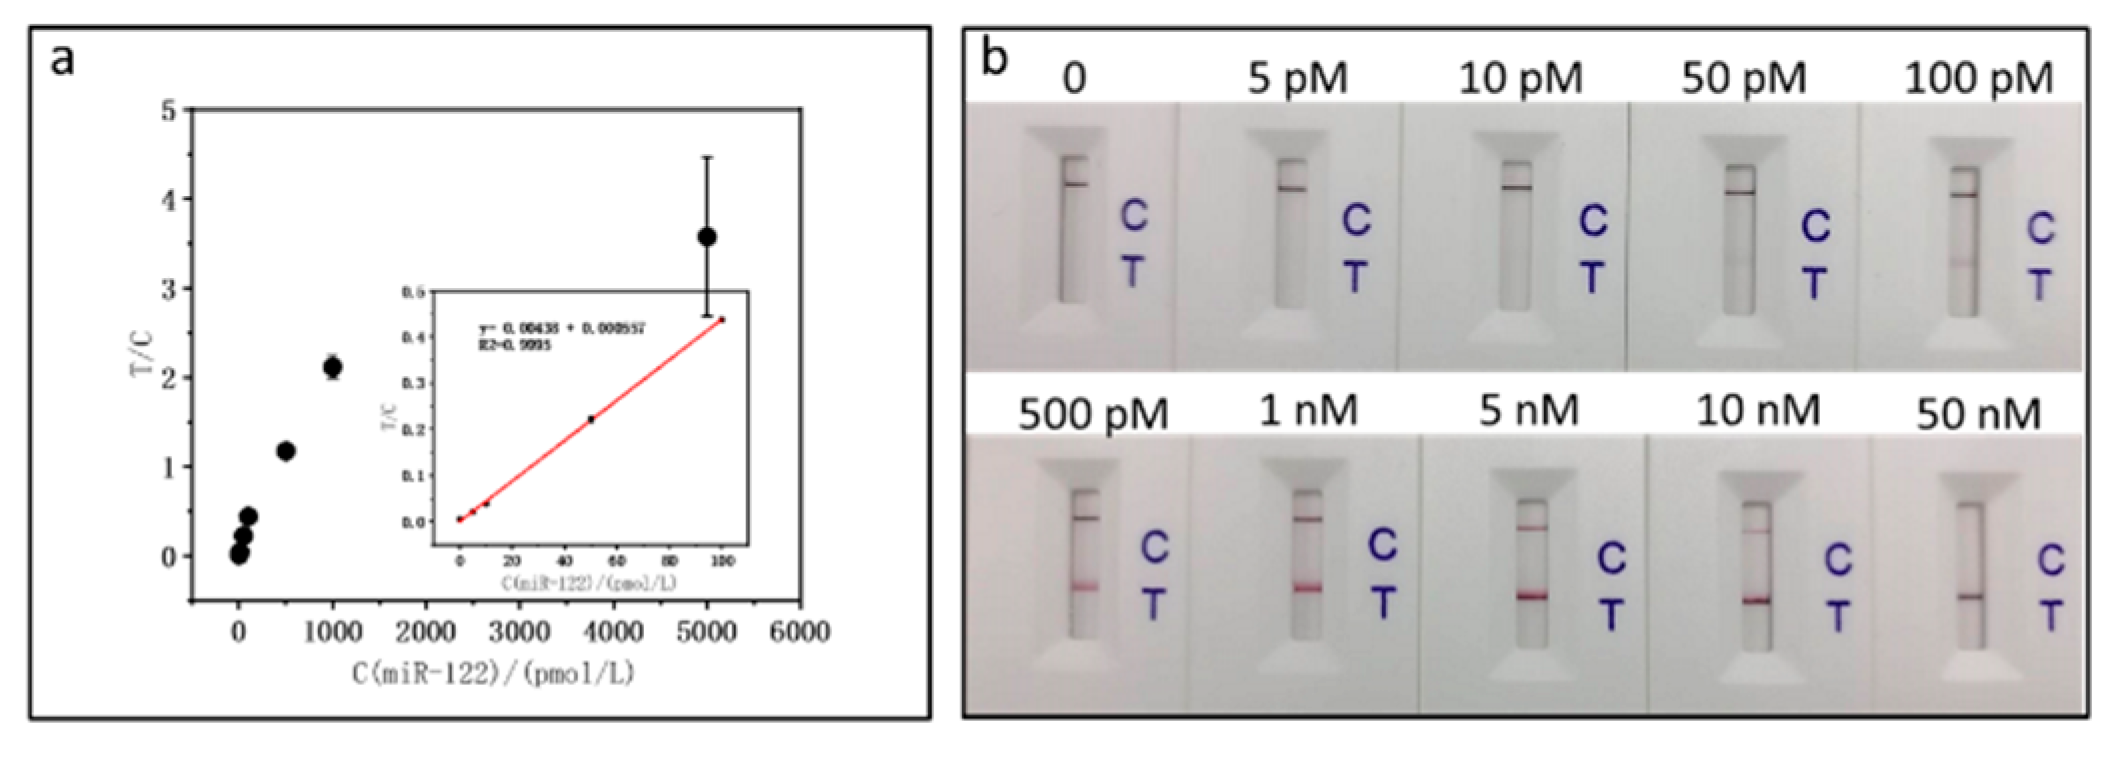
Figure 5.
(a) Photographs of LFNABS after testing fingertip blood samples from six healthy individuals; (b) Photographs of LFNABS after testing fingertip blood sample spiked 50 pM and 100 pM miRNA-122.
Figure 5.
(a) Photographs of LFNABS after testing fingertip blood samples from six healthy individuals; (b) Photographs of LFNABS after testing fingertip blood sample spiked 50 pM and 100 pM miRNA-122.
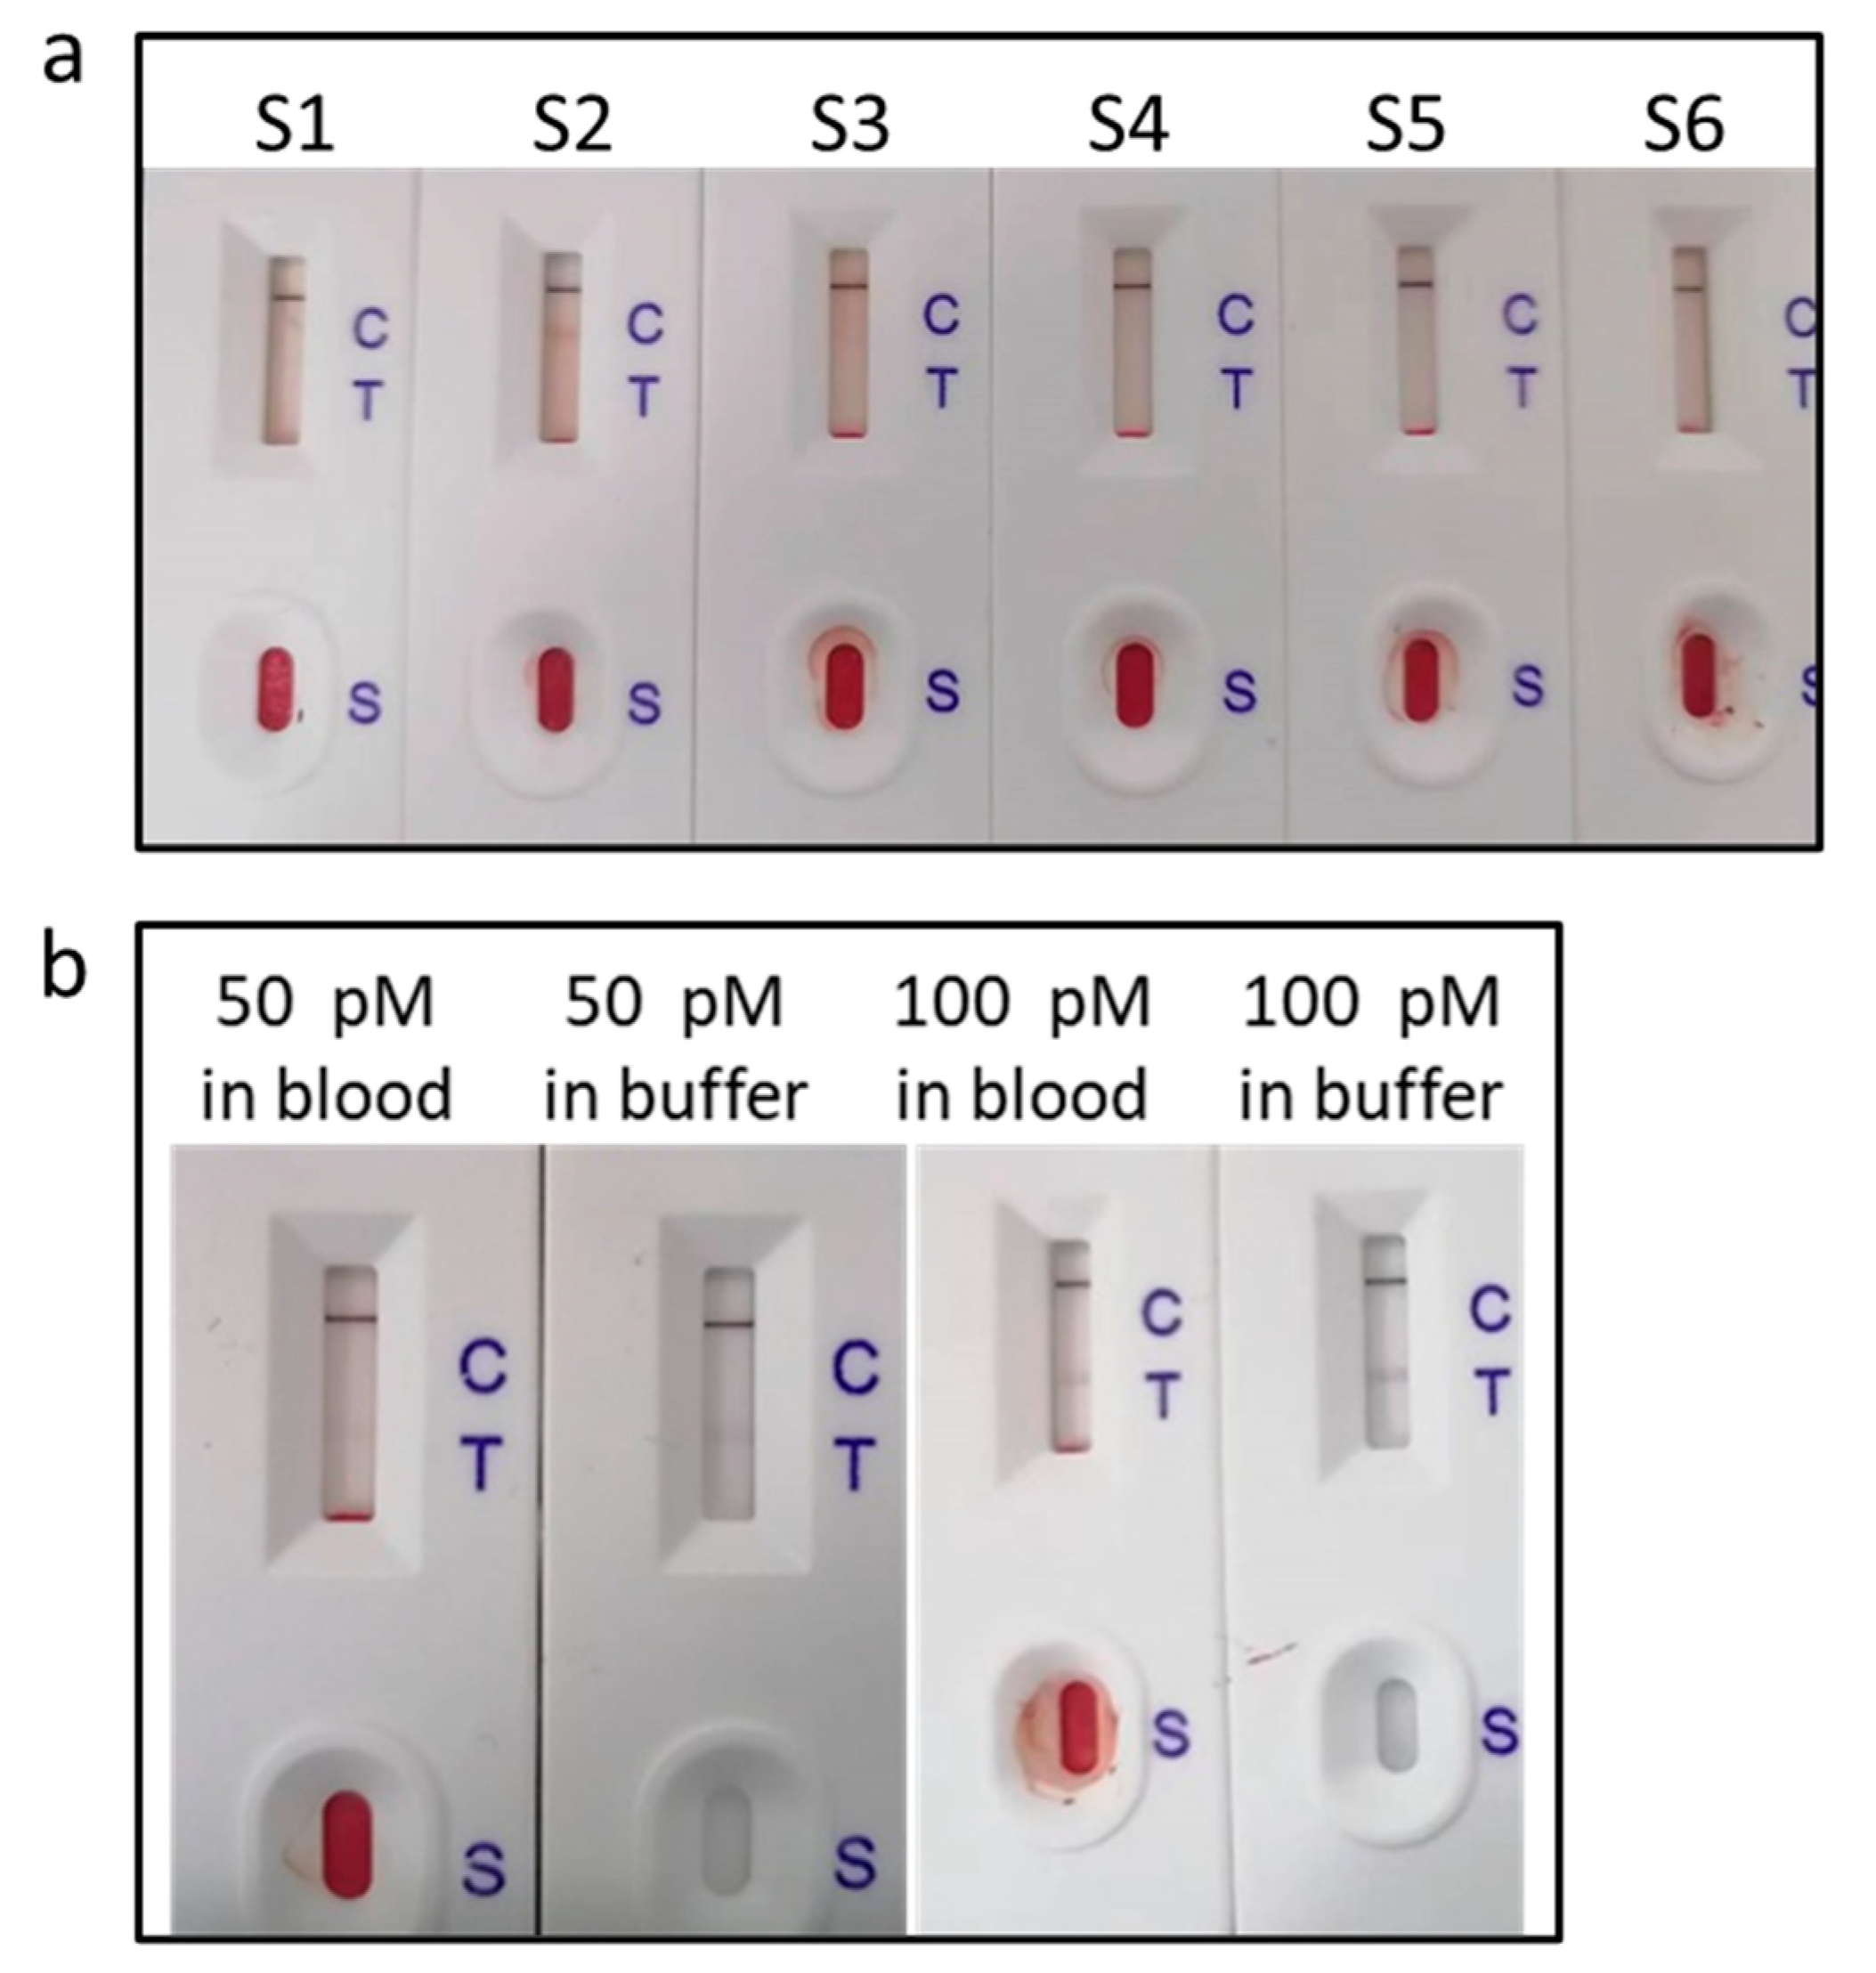

Table 1.
The oligonucleotide sequences used in this experiment.
| Name | Sequence (5'-3') | |
|---|---|---|
| miR-122 | UGGAGUGUGACAAUGGUGUUUG | |
| Thiolated detection DNA probe (Det-DNA) | thiol-CCCCCCAAACACCATT | |
| Biotinylated capture DNA probe (Cap-DNA) | GTCACACTCCACCCCC/Biotin | |
| Biotinylated control DNA probe (Con-DNA) | Biotin/AATGGTGTTTGGGGGG | |
| random miRNA | UUGUACUACACAAAAGUACUG | |
| Single-base mismatched miRNA | UGGAGCGUGACAAUGGUGUUUG | |
| Double-base mis-matched miRNA | UGGAGCGUGACAAUAGUGUUUG | |
| Triple-base mismatched miRNA | UGGAGCGUGACAAUAGUGUUCG |
Table 2.
Recovery of miR-122 in serum.
| Serum sample | Added(pM) | Found(pM) | Recovery(%) | RSD(1/43) |
|---|---|---|---|---|
| 1 | 5 | 4.76 | 95.2 | 0.98 |
| 2 | 50 | 50.79 | 101.6 | 0.05 |
| 3 | 100 | 99.83 | 99.8 | 0.08 |
Disclaimer/Publisher’s Note: The statements, opinions and data contained in all publications are solely those of the individual author(s) and contributor(s) and not of MDPI and/or the editor(s). MDPI and/or the editor(s) disclaim responsibility for any injury to people or property resulting from any ideas, methods, instructions or products referred to in the content. |
© 2024 by the authors. Licensee MDPI, Basel, Switzerland. This article is an open access article distributed under the terms and conditions of the Creative Commons Attribution (CC BY) license (http://creativecommons.org/licenses/by/4.0/).
Copyright: This open access article is published under a Creative Commons CC BY 4.0 license, which permit the free download, distribution, and reuse, provided that the author and preprint are cited in any reuse.


