Submitted:
17 April 2023
Posted:
18 April 2023
You are already at the latest version
Abstract
Malignancy is a fatal disease with an increasing incidence with each passing year, and the early diagnosis of malignancy can significantly improve the cure rate of patients, which has profound implications for saving patients' lives. The changes of miRNA are closely related to the occurrence of malignant tumors. The expression of miRNA in many malignant tumors is obviously different and unique from that in normal tissues. In this study, a strategy for amplifying microRNA (miRNA) signal was designed using duplex specific nuclease (DSN), which was then combined with Peptide nucleic acid (PNA) probe hybridization technology to prepare a sensitive and efficient paper-based lateral flow biosensor (LFB) for the detection of pancreatic cancer (PC) associated microRNA-10b. The performance evaluation results of the LFB showed that the detection limit of miR-NA-10b is 5 nM/mL, and carries demonstrated well specificity, stability, reproducibility. The biosensor prepared in this paper can provide accurate and rapid detection of miRNA-10b. The detection results play a guiding role in the early diagnosis of PC. Meeting the clinical need for largescale screening of individuals at high risk of PC. Providing new avenues to achieve early mass screening in individuals at high risk of PC.
Keywords:
Peptide nucleic acid
; microRNA detection
; duplex specific nuclease
; Early diagnosis of pancreatic cancer
; Lateral flow biosensor
1. Introduction
MicroRNA is an endogenous non-coding single-stranded RNA with a length of 19-23 bases[1]. It usually acts as a translation regulator and is involved in a variety of biological functions of the human body, such as differentiation, development, cell proliferation, oncogenesis, and cell apoptosis[2,3]. The changes of miRNA are closely related to the occurrence of malignant tumors[4]. The expression of miRNA in many malignant tumors is obviously different and unique from that in normal tissues[5,6]. As a tumor marker, miRNA has good development potential in the mechanism research, clinical diagnosis, early screening, prognostic monitoring, and other aspects of many tumors[7,8,9,10]. Studies have shown that miRNA-10b can achieve 95% sensitivity and 100% specificity in the early diagnosis of PC[11]. Therefore, miRNA-10b can be used as a target for the early diagnosis of PC. Now it’s necessary to construct a highly specific and sensitive miRNA detection method.
Modern detection technology has been in the direction of simpler, faster, lower cost development. Currently, paper-based detection methods emerge[12,13,14]. As a new type of carrier, paper can not only meet the basic requirements of traditional detection methods, but also has the advantages of convenience, low cost, short detection time, suitable for outdoor, etc. [12,15] Paper-based biosensor is a detection technology that emerged in the early 1980s and developed rapidly. It initially uses the antigen-antibody specific reaction, and then extends to the recognition reaction between aptamer and target molecule. The LFB is composed of sample pad, gold conjugate pad, nitrocellulose (NC) membrane, and absorbent pad in turn. Capillary action promotes liquid flow, so that molecules in the sample follow the fluid to the NC membrane for visual reaction.
In this study, a strategy for amplifying miRNA signal was designed using DSN, which was then combined with PNA probe hybridization technology to prepare a sensitive and efficient paper-based LFB for the detection of PC associated microRNA-10b. DSN has the property of selectively hydrolyzing the DNA fragment in DNA-RNA hybrid fragments[16,17]. Based on this property, we designed a miRNA recycling enzymatic cleavage strategy. In the hybridization environment where miRNA-10b exists, DSN enzyme can continuously hydrolyze the hairpin DNA of the hybridized part with miRNA-10b, so that many hairpin DNA fragments of the unhydrolyzed part gather, indirectly realizing the transformation and amplification of miRNA-10b signal. PNA is a kind of DNA analog that replaces the main chain of sugar phosphate with a polypeptide skeleton. PNA can recognize and bind DNA or RNA sequences in the form of Watson-Crick base pairing to form a stable double helix structure[18,19]. Since PNA don’t contain negative charge, there is no electrostatic repulsion between PNA and DNA or RNA, so the stability and sensitivity of hybridization are greatly improved, and it has good ability to recognize specific sequences. These properties make PNA one of the most effective tools for biomedical applications[20,21,22]. In this study, PNA probe was used to replace oligonucleotide probe for the preparation of the LFB. The biosensor had better specificity and stability than normal DNA biosensors.
2. Working principle of the lateral flow biosensor
2.1. PNA Probe preparetion
PNA is a DNA analogue, which replaces the pentose phosphodiester bond skeleton in DNA with a neutral peptide nucleic acid amide 2-aminoethyl glycine bond [23]. PNA has similar function to DNA, which have different biological characteristics by modifying PNA skeleton. In this study, one end of PNA was added with cysteine, the specific structure is shown in Figure 1. The free sulfhydryl group in cysteine made PNA active, so that PNA and AuNPs could be connected in salt ion environment to form AuNPs-PNA probe. The PNA sequence is 5 'SH-GCAACTTCTATGTAT-3'.
2.2. Principle of miRNA signal conversion and amplificatio
DSN has the property of selectively hydrolyzing the DNA fragment in DNA-RNA hybrid fragments [16,17]. Based on this property, we designed a miRNA enzymatic cleavage strategy. The miRNA-10b is partially complementary to the hairpin DNA. In the hybridization environment where miRNA-10b and DSN exist simultaneously, DSN can continuously hydrolyze DNA fragments hybridized with miRNA-10b, thus producing many DNA fragments that are not hydrolyzed. The conversion and amplification of miRNA-10b signal were achieved indirectly.The Principle of enzyme digestion amplification strategy of DSN is shown in Figure 2A.
2.3. Working principle of the lateral flow biosensor
The overall structure of the LFB is the same as the traditional immune test strip, which is composed of five parts: sample pad, gold conjugate pad, NC membrane and absorbent pad and adhesive plate. The structure of the LFB is shown in Figure 2B. The PNA probe was complementary to the looped portion of hairpin DNA. Probe 2 was complementary to miRNA-10b. Probe 3 was complementary to PNA probe. All nucleic acid sequences involved in this paper are shown in Table 1 below. The AuNPs-PNA probe conjugate was dripped onto the gold conjugate pad. The components of the test (T) line and control (C) line on the NC membrane were nucleic acid probe 2 and probe 3. When miRNA-10b exist in the detection solution, it could be hybridized on the hairpin DNA. After repeated enzyme digestion by DSN, many DNA fragments that could be used for detection were generated. The DNA fragments were dripped onto the sample pad and slowly migrated to the gold conjugate pad under the action of capillary. It could be hybridized with AuNPs-PNA probe to formed AuNPs-PNA-DNA complex and moved up to NC membrane along the strip.
When the detection DNA fragments in the complex were combined with probe 2 on the T line, AuNPs was adsorbed on the T line and presented a red band. Subsequently, the excess AuNPs-PNA probes continued to migrate upward to the C line, PNA probe could be combined with probe 3 on the C line and occurred chromogenic reaction. Finally, T line and C line appeared red bands. However, when miRNA-10b didn’t exist in the detection solution, there were no hybridization object for hairpin DNA. Therefore, there were no detectable DNA fragments produced. The LFB couldn’t captured AuNPs-PNA probes on the T line, so the T line didn’t show red bands. However, the AuNPs-PNA probe could bind to probe 3 on the C line, resulting in only the C line showing the red band. The LFB working principle is shown in Figure 2.
3. Construction of lateral flow biosensor
3.1. Preparation of AuNPs-PNA probe
3..1.1. Synthesis and characterization of AuNPs
AuNPs at 15 nm were synthesized by sodium citrate reduction method. The specific steps were as follows: 0.34 g of chloroauric acid (CA) was dissolved in 1 L water to prepare 1.0 mmol/L of CA solution; Weighed 8.7 g sodium citrate and dissolved in 1 L water to prepare 33.8 mmol/L sodium citrate solution. Took 100 mL of CA solution with a concentration of 1.0 mmol/L, poured it into a conical flask and heated it, stirred continuously until the CA solution boils; Then immediately added 10 mL sodium citrate solution with a concentration of 33.8 mmol/L and stirred continuously. When the color of the solution changed from light yellow to wine red, heated and stirred continuously for 20 min, and then stop heating. Placed the conical bottle at room temperature and wait for the solution to cool naturally. Transferred to the test tube, wrapped the test tube with tin foil and store in the refrigerator at 4 ℃ away from light. Finally, the AuNPs were characterized optically by ultraviolet (UV) -visible spectrophotometer and transmission electron microscope.
3.1.2. Connection of AuNPs-PNA probe
AuNPs solution 1 mL was centrifuged at 9800 r/min for 15 min, and 800 mL supernatant was discarded to obtain 200 µL The AuNPs solution was five-fold concentrated Then, 60 µL 10μmol/L PNA probe was added to the solution, mixed thoroughly, and store at 4 ° C in the dark for 16 hours. Added 60 μL mixture of 0.6 mol/L NaCl and 20 mmol/L PB (pH 7.0). Kept away from light for 24 hours at 4 ℃. Discarded precipitation, centrifuged at 4 ℃ for 20 min at 10000 r/min. The supernatant was discarded and resuspended with 800 µL mixture containing 10 mmol/L PB (pH 7.0) and 0.3 mol/L NaCl, centrifuged at 4 ℃ and 10000 r/min for 20 min. Discarded the supernatant. Finally, the deposition was suspended with a mixture of 200μL 0.3 mol/L NaCl and 10 mmol/L PB (pH 7.0).
3.1.3. AuNPs-PNA probe optimization of connection conditions
To achieve the best connection effect between AuNPs and PNA probes, the optimal pH and volume ratio of the connection reaction were investigated. To study the optimal pH conditions for connecting AuNPs with PNA probes, the pH values of AuNPs solution were adjusted to 6.6, 6.8, 7.0, 7.2, 7.4. To study the optimal Volume ratio for connecting AuNPs with PNA probes, 40, 30, 20, 10, 5, 1 μL of 10 μmol/L PNA probe were added into 100 μL AuNPs solution. Then the probes were connected separately.
3.2. miRNA signal conversion and amplification
The hairpin DNA was first denatured at high temperature. 5µL hairpin DNA was added to 15µL sterile water, heated at 95 ℃ for 5 min, and placed on ice immediately after heating. Then the sample was added according to Table 2.
After centrifugation, a drop of mineral oil was dropped on the test tube, and then centrifugation was performed. The test tube was incubated in a 65 ℃ thermal circulation heater for 15 min, and 5μl 2x DSN termination solution was added for 5 min at 65 ℃ to terminate the enzyme digestion reaction. Weighed and dissolved 1.6g agarose in 40 mL TBE. Then, microwaved for 1 min, and added 4µL Goldview. Finally, poured into the rubber plate, stranded for 20 min, sampled the enzyme digestion products, 120 V, electrophoresis for 40 min.
3.3. Preparation of the lateral flow biosensor
From left to right, the LFB was composed of sample pad, gold conjugate pad, NC membrane and absorbent pad in turn. The sample pad was composed of glass fiber with a size of 20 mm×5 mm. The sample pad should be soaked in the sample solution for 2 hours for activation. Then dried in a 37 ℃ and incubated for 2 hours before being taken out. The activated sample pad was stored at 4 ℃ away from light. A 20 μL AuNPs-PNA probe was dripped onto the gold conjugate pad, which was made of glass fiber with a size of 10 mm×5 mm. The AuNPs-PNA probe was dried in an incubator at 37 ℃ for 2 h and then stored in a drying container at 4 ℃. The reaction membrane is NC membrane, the size of which is 22 mm×5 mm. Before use, the NC membrane should be soaked in the mixture of 10 mmol/L PB (pH 7.0) and 0.3 mol/L NaCl, and dried for 2 h in a 37 ℃ incubator. Then, a marking tool was used to mark T line and C line with concentration of 10 μmol/L probe 2 and probe 3 on the NC membrane respectively. The distance between the T line and the C line was 5.0 mm. The NC membrane with the lines was irradiated under ultraviolet lamp for 2 hours for fixing. The absorbent pad is composed of absorbent paper with a size of 30 mm×5 mm. Before assembly, it is soaked in a mixture of 0.3 mol/L NaCl and 10 mmol/L PB (pH 7.0) for 2 h, and then dried in a 37 ℃ incubator for 2 h. The sample pad, gold conjugate pad, NC membrane and absorbent pad were pasted in sequence from left to right on the adhesive bottom plate with a size of 77 mm×5 mm, and the overlap between each part was maintained at about 3 mm. The assembled LFBs were pressed under heavy weight overnight, and then sealed and dried at 4 ℃.
3.4. Testing of lateral flow biosensor
Take 100 μL sample test solution (10 mmol/L PB, 0.3 mol/L NaCl), added 20 μL DSN cut products into the sample test solution, mixed well, and dropped on the sample pad of the LFB. Placed in a wet box at 37 ℃ for 20 min and the detection results were observed on the NC membrane. If the T line and the C line showed red bands, the detection result is positive. If only the C control line was red, the test result is negative. If only the T line was red or there was no color change between the two lines, the detection result was invalid. The sensitivity, specificity, repeatability, and stability of the prepared strips were tested according to the above methods.
4. Result and discussion
4.1. Preparation of AuNPs-PNA probe
4.1.1. Synthesis and characterization of AuNPs
The color of the dispersed phase substance determines the color of the solution. For the same substance, the particle size is different, so the color is different. The results of synthesized AuNPs solution are shown in Figure 3a. Under natural light, AuNPs solution prepared in this experiment showed wine red, clear and transparent, and no precipitation.
The maximum absorption peak of AuNPs solution between 5 and 20 nm was found at 520 nm. The scanning results of AuNPs solution UV- visible spectrophotometer is shown in Figure 3b. The AuNPs solution synthesized in this study showed an obvious maximum absorption peak at 520 nm, which proved the successful preparation of AuNPs. The results of transmission electron microscopy (TEM) are shown in Figure 2c,d. The results of TEM showed that AuNPs particles were spherical, about 15 nm in size, uniform in size, no clumping phenomenon, and good dispersion, which was suitable for the connection of PNA probe.
4.1.2. Connection of the PNA probe to AuNPs
UV-visible spectrophotometer was used to detect the preparation effect of the AuNPs-PNA probe. The results of AuNPs-PNA probe UV- visible spectrum showed in Figure 5. UV- visible spectrum showed that AuNPs solution had an obvious absorption peak at 520 nm and the AuNPs-PNA probe had the maximum absorption peak at 540 nm. This result proved the successful preparation of AuNPs-PNA probe.
4.1.3. AuNPs-PNA probe optimization of connection conditions
The results of optimal PH values are shown in Figure 6a below. When the pH of the solution was 6.6, the solution was colorless. When pH was 6.8, the solution appears light blue and a small number of sediments were precipitated. When pH was 7.0, although the solution was light red, there were a small number of sediments. When pH was 7.2, the solution appeared wine red without sediment. When the pH was 7.4. The solution turned dark purple, and a small number of sediments were produced. So, the optimal pH for AuNPs-PNA probe connection was 7.2.
The results of optimal volume ratio are shown in Figure 6b below. The color of solution changed from red to dark purple when 20, 30 and 40 μL were added, and sediments were produced. When 10 μL were added didn’t change the color but produced a lot of sediment; When 5 μL were added, there was no color change, no sediments; When 1 μL were added, the color of the solution became lighter. So, the optimal amount of PNA was determined to be 5 μL and the optimal ratio of PNA probe to AuNPs was 1:20.
4.2. miRNA signal conversion and amplification
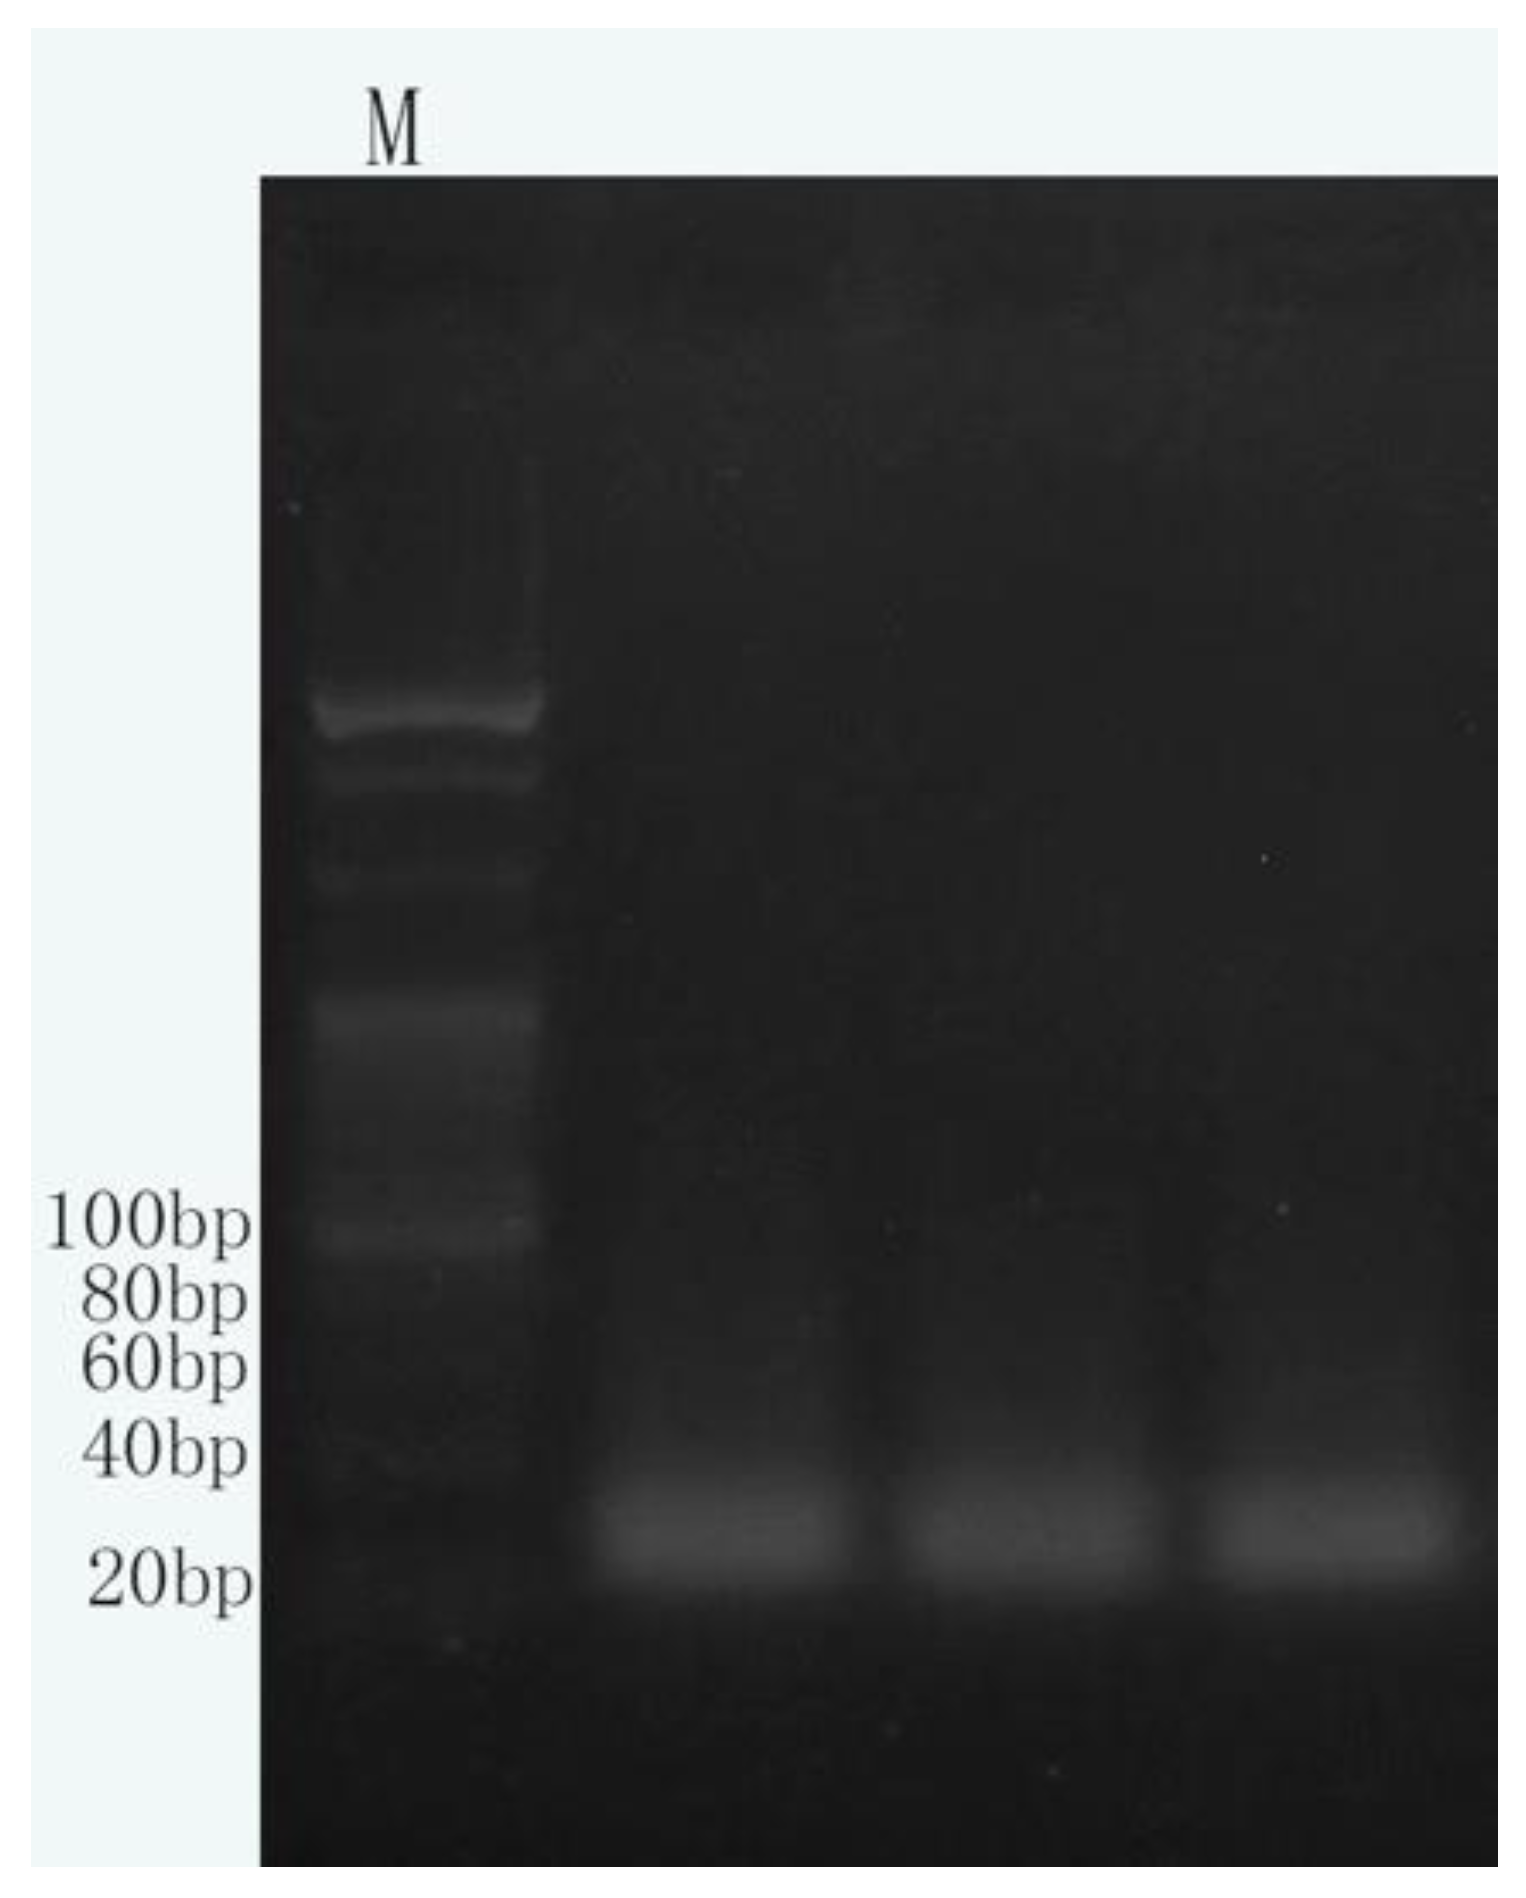
The length of hairpin DNA sequence was 55 bp, and the length of miRNA-10b sequence was 23 bp. After high temperature denaturation, hairpin DNA opened and complemented miRNA-10b. DSN could act on the single strand of DNA in the DNA-RNA complementary double strand, resulting in the hydrolysis of the DNA in the hybridized portion. After the hydrolysis of the hybridized part of DNA sequence, miRNA-10b came out. Hybridization with the next denatured hairpin DNA was continued, and DSN digestion was repeated to produce many DNA fragments of about 30 bp. The electrophoretic results of DSN enzyme digestion products are shown in Figure 6b below. Electrophoresis detection results showed that many DSN digestion products concentrated in 30 bp, which proved that miRNA signal cycle enzyme digestion amplification was successfully carried out. Trace miRNA-10b signals were transformed and amplified by DSN cyclic digestion.
Figure 7.
The electrophoretic results of DSN enzyme digestion products.
4.3. Optimization of preparation conditions for the lateral flow biosensor
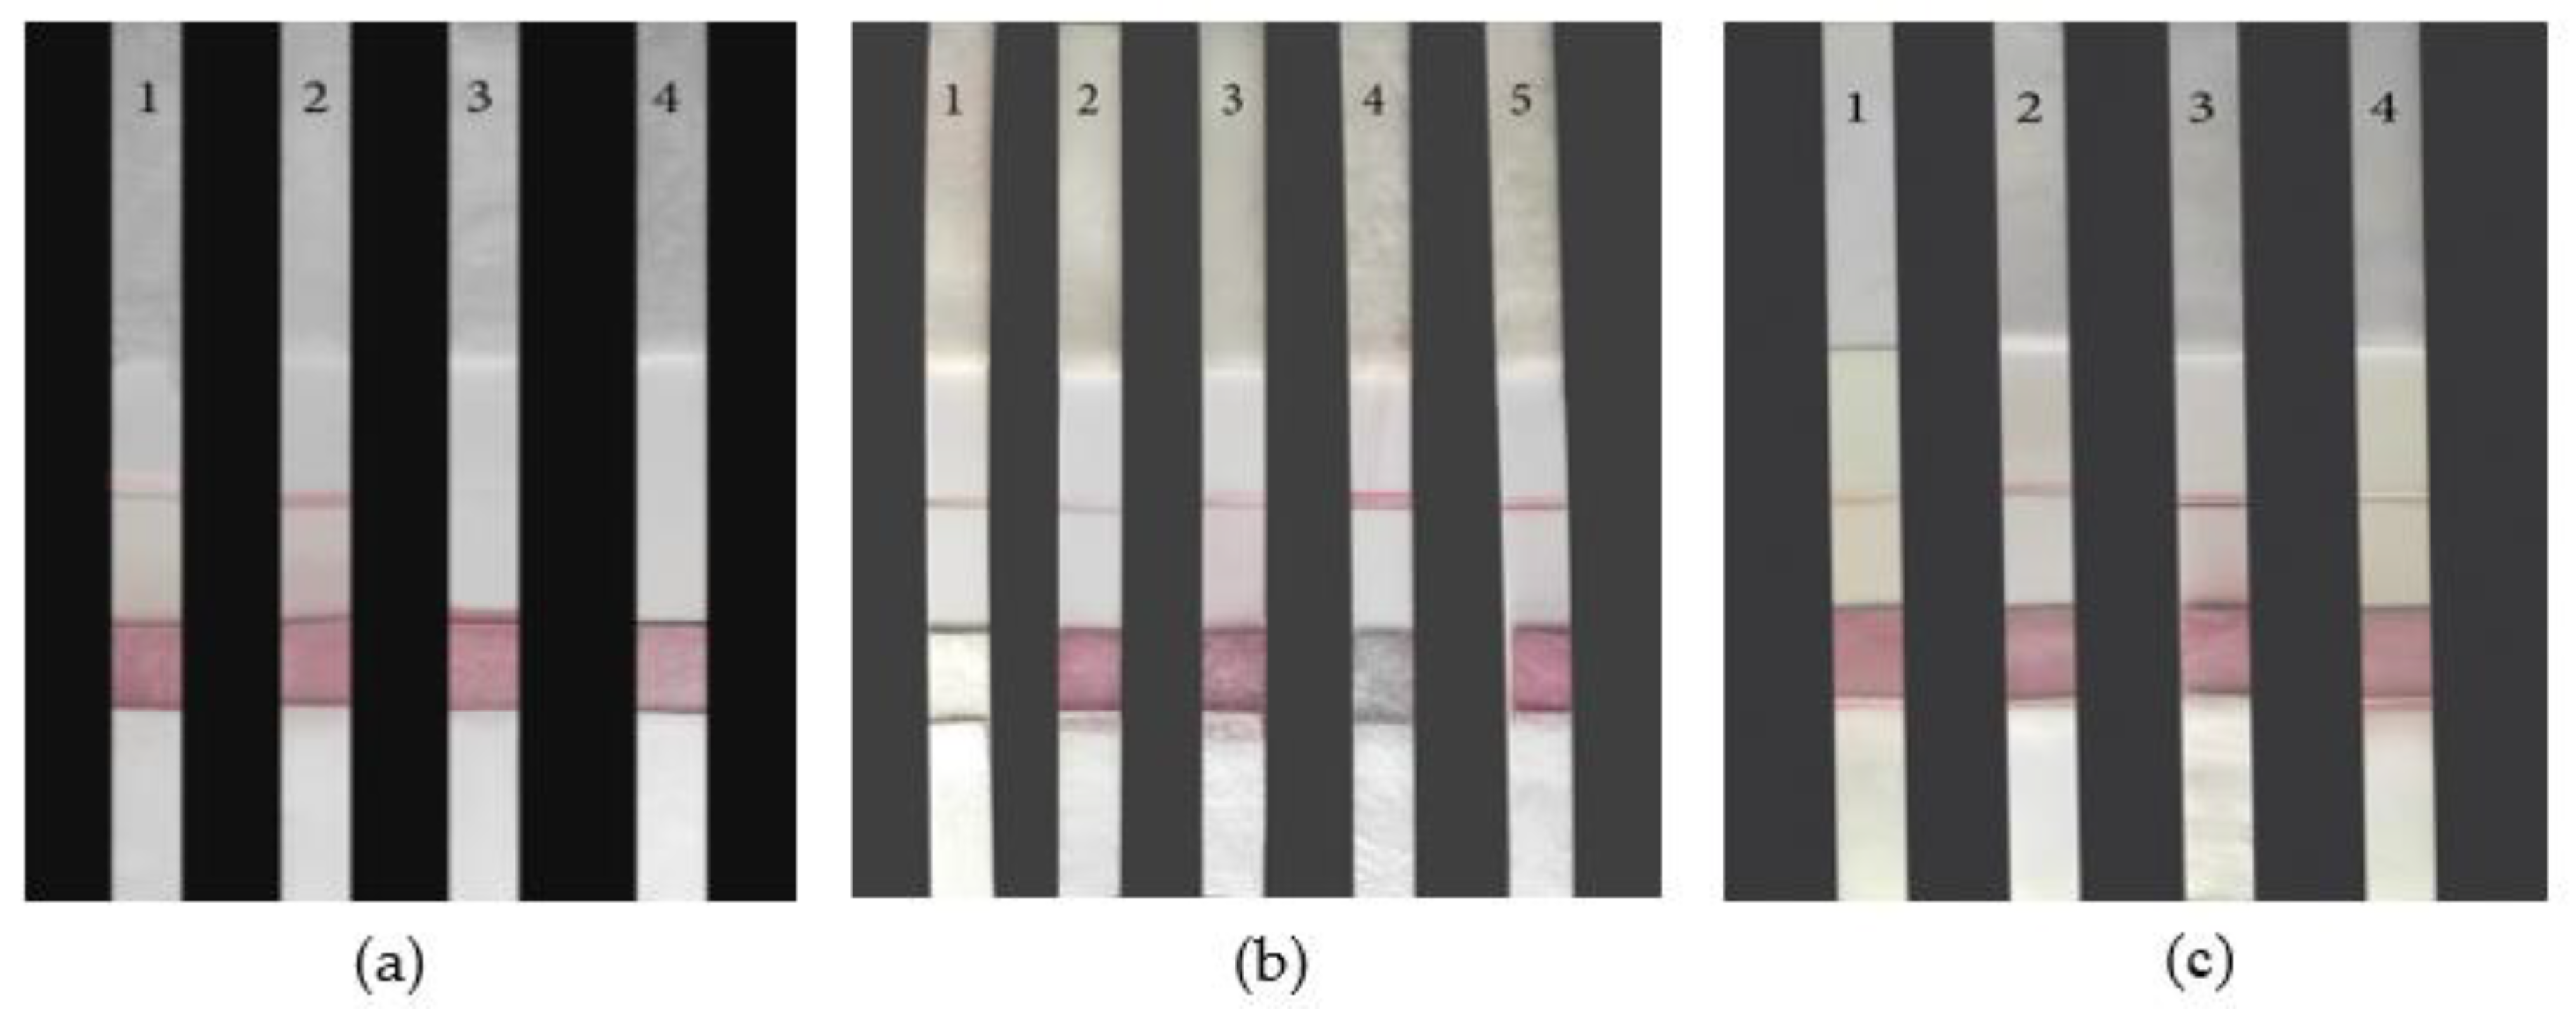
The screening results of NC membrane are shown in Figure 8a below. Four different types of NC membranes (pall vivid20, whatman prima 8, millipore 135 and millipore 85) were used for comparative experiments to observe the chromatographic speed and color development degree of the strip. No. 1-4 were pall vivid20, whatman prima 8, millipore 135, and millipore 85 respectively. The chromatographic speed of No.3 and No.4 strips were very fast, but the detection line didn’t show color; No. 1 LFB chromatography speed was moderate, detection line color was not clear and uneven; The color of No. 2 paper strip was clear and uniform, and the chromatographic speed was moderate. Therefore, whatman prima 8 could be used as the reaction membranes material in this experiment.
The screening results of sample pad are shown in Figure 8b below. Five types of glass fibers GL-b04, GL-061, fusion 1, fusion 3 and GF-K1 were selected as the sample pad. No. 1-5 were GL-b04, GL-061, fusion 1, fusion 3 and GF-K1 respectively. Observe the degree of sample absorption on the sample pad and whether there were red bands on the detection line; No. 2 LFB sample pad couldn’t completely absorb the sample solution added by drops. No. 1, 3, 4 and 5 LFB sample pads all had good absorbability and could completely absorb the drip-added sample liquid. The four sample pads didn’t show much difference in absorbability. 1, 3, 5 LFB detection line color was relatively light; No. 4 LFB detection line color is dark, and uniform color. Therefore, fusion 3 was selected as the sample pad material for the LFB.
The screening results of gold conjugate pad are shown in Figure 8b below. Five different types of glass fiber (JY-BX114, JY-J106, JY-BX115, JY-J101, Ahlstrom 8964) as the gold standard pad, No. 1-5 LFBs were JY-BX114, JY-J106, JY-BX115, JY-J101 and Ahlstrom 8964 respectively. There was almost no release of probes on the gold conjugate pad of No. 2, 3,5 LFBs, and many AuNPs probes remained. The detection lines were light. The probes of No. 1 and No. 4 LFBs were fully released. But the color development of No. 1 LFB wasn’t clear. The color development of No. 4 LFB was clear and even. Therefore, JY-J101 was selected as the LFB gold label pad material.
The screening results of absorbent pad are shown in Figure 8c below. Four different absorbent pads (H-5072, H-5015, H-5076 and H-5078) were selected, and the No. 1-4 LFBs were respectively H-5072, H-5015, H-5076 and H-5078. No. 1 LFB absorbent pad was thin. It couldn’t completely absorb the sample liquid, the detection line almost no color; No. 2, 3, and 4 sample pads could completely absorb the sample liquid within 10 min, but No. 4 LFB detection line almost no color, which may be due to the fast water absorption rate, the probe didn't have enough reaction time. No. 2 LFB color is light, No. 3 LFB detection line color is clear. Therefore, the absorption pad should be H-5076, which can fully absorb the sample test liquid, absorb water at a moderate speed and show obvious color in the sample test line.
Figure 8.
The selection of (a)NC membrane; (b)Sample pad and gold conjugate pad; (c)absorbent pad.
4.4. Optimization of experimental conditions for fixing the strip probe
The probe was fixed under three different conditions: 37 ℃ drying for 2 h, UV- visible irradiation for 2 h, and air drying at room temperature. The selection result of the probe fixation mode is shown in Figure 9a below. No. 1-3 were dried at 37 ℃ for 2 hours, irradiated by ultraviolet lamp for 2 hours, and dried at room temperature respectively. No. 1 detection line colored, but light color; No. 2 detection line clear and uniform colored; No. 3 didn’t show color, indicating that the probe is not fixed well at room temperature. Therefore, UV- visible lamp irradiation for 2 h was used as the probe fixation method.
The influence of probe scribing concentration on the LFB was investigated by using three scribing concentrations of 1μL /cm, 2μL /cm, and 4μL /cm. The selection result of probe concentration is shown in Figure 9b below. No. 1-3 were 1 μL/cm, 2 μL/cm, 4 μL/cm respectively. The color rendering degree of No.1 detection line was shallow, and the edge was fuzzy, indicating that the fixed amount of probe was too little, which affects the color rendering of the detection line. No. 2, 3 detection lines were clear color. But No. 3 detection line had clearer color rendering and neat edges. Therefore, 4μL /cm was selected as the best marking concentration of the probe.
4.5. Test of the lateral flow biosensor
To explore the sensitivity of the LFB, the synthetic miRNA-10b solution was diluted into different concentrations, so that the final concentration was 1000 nM/mL, 100 nM/mL, 10 nM/mL, 5 nM/mL, 1 nM/mL. The experimental results are shown in Figure 10a. The No. 1-5 LFB were 1000 nM/mL, 100 nM/mL, 10 nM/mL, 5 nM/mL, and 1 nM/mL successively. Among them,No 1, 2, 3 LFB T lines were clear, neat edges, uniform color, and the degree of color development decreases with the decrease of concentration; No. 4 LFB T line showed color, but the color was light, indicating that it was above the detection limit; The T line of No.5 LFB didn’t show color, indicating that the concentration of No.5 sample was below the detection limit. Therefore, the detection limit of the strip was 5 nM/mL.
To explore the specificity of the LFB, the identification ability of the LFB to miRNA-10b. RNA 1 and RNA 2 have 1 and 3 base errors with miRNA-10b, respectively. miRNA-21 and miRNA-429 are different miRNAs in the human body. LFB was used to detect the above five RNAs. The results are shown in Figure 10b. The No. 1-5 LFB were miRNA-10b, RNA 1, RNA 2, miRNA-21, and miRNA-429 respectively. Only the No. 1 LFB T line showed color, while No. 2, 3, 4, and 5 LFB T line showed no color. This proved that the LFB was specific to miRNA-10b.
The results were consistent in all groups in the repeatability experiment. The stability results showed that the storage condition and expiry date of the LFB were 4 ℃ for 40 days.
4.6. Serum sample detection
To explore the sensitivity of the LFB in the actual detection working environment, the freeze-dried miRNA-10b powder was dissolved in human serum, and the final concentrations were 1000 nM/mL, 100 nM/mL, 10 nM/mL, 5 nM/mL and 1 nM/mL, respectively. miRNA-10b was detected in simulated human body fluid environment. The experimental results are shown in Figure 11a. No 1 to 5 were 1000 nM/mL, 100 nM/mL, 10 nM/mL, 5 nM/mL, and 1 nM/mL respectively. The No. 1, 2 LFB were clear color, neat edge, uniform color, and the color degree decreases with the decrease of concentration; No. 3 T line showed color, but the color was light, indicating that it was above the detection limit; No. 4, 5 T line didn’t show color; It indicated that the concentration of samples 4 and 5 were below the detection limit. The detection limit of the LFB in body fluids was 10 nM/mL.
To further explore the specificity of the strip in the actual detection environment, miRNA-10b, RNA 1, RNA 2, miRNA-21 and miRNA-429 powder were dissolved into serum, respectively. The experimental results are shown in Figure 11b. The No. 1-5 are respectively miRNA-10b, RNA 1, RNA 2, miRNA-21 and miRNA-429. Only No. 1 LFB T line color, No. 2, 3, 4, 5 were not color. The above results proved that LFB had good specificity in the actual sample detection environment.
4.7. Discussion
miRNA plays an important role in the occurrence and development of various malignant tumors[23,24]. So far, there have been a large number of laboratory studies on miRNA detection[10,25,26], but most of them are limited to the laboratory stage and hadn’t been validated and used clinically. There is still a long way from laboratory results to clinical application to go. Take PC as an example. CA19-9 is the only biomarker for PC approved by the US Food and Drug Administration [27], but it can’t be used for the early diagnosis of PC. At present, LFB for miRNA detection is still in the laboratory stage. How to detect miRNA more sensitively and specifically, as well as the proof of miRNA's ability to be used in practical clinical applications, still needs further research to gain more clinical recognition.
LFB prepared in this study has high sensitivity and high specificity. The miRNA-10b signal was transformed and amplified by DSN, which greatly improved the detection sensitivity of the LFB. The probe designed specifically for miRNA-10b could accurately identify and capture the target DNA fragments, so the possibility of false positive results is low. In addition, LFB has many advantages, such as: low cost of sensor preparation, Convenient detection process, doesn’t require professional equipment and personnel, the detection results can be seen by the naked eye, the result interpretation is simple. The detection time is short, Safe and non-toxic and so on. This LFB provides a new method for miRNA detection and a new way for early mass screening of high-risk PC populations. It can improve the low sensitivity, complex operation and limited detection means of the existing miRNA detection methods. Provided a new method for the rapid and accurate detection of miRNA and a new impetus for the promotion of miRNA detection methods in clinical practice. Broaden new ideas for early diagnosis of tumor and also provides a new thinking direction for the diagnosis and treatment of other diseases in clinic.
5. Conclusions
In this study, we designed a new miRNA detection method, which can detect miRNA-10b quickly, conveniently and sensitively. The detection results have reference significance for the early diagnosis of PC. The following is a systematic summary of this paper.
A sensitive and efficient miRNA detection LFB was prepared based on the cyclic transformation and amplification of miRNA detection signals based on DSN, combined with stable and specific AuNPs-PNA probes. In this paper, 15 nm AuNPs solution and AuNPs-PNA probe were prepared. The experimental conditions of probe connection and fixation were optimized. The materials of the LFB were screened. The principle of miRNA signal amplification and LFB detection was explored. The performance of the prepared LFB was tested, including sensitivity, specificity, repeatability, and stability. The miRNA was detected under simulated human body fluid conditions. The experimental results are as follows:
- The synthesized AuNPs solution was characterized by UV- visible spectrophotometer and transmission electron microscopy. The UV-visible spectrum showed that AuNPs had a maximum absorption peak at 520 nm. The results of transmission electron microscopy showed that the particle size of AuNPs was about 15 nm, spherical, uniform and well dispersed.
- AuNPs-PNA was identified by UV-visible spectrophotometer. The results showed that the maximum absorption peak was red-shifted from 520 nm to 540 nm. The successful preparation of AuNPs-PNA probe was proved.
- The results of probe connection and fixation optimization experiments showed that the optimal pH for AuNPs-PNA probe ligation was 7.2, the optimal ratio of PNA and AuNPs was 1: 20, the optimal fixation method of the probe on the NC membrane was UV-visible light irradiation for 2 h, and the optimal concentration of the probe was 4 μL/cm.
- The screening results of the LFB preparation materials showed that what man prima 8 was selected as the reaction film material, fusion 3 as the sample pad material, JY-J101 as the gold standard pad material, and H-5076 as the absorption pad material to prepare the LFB.
- The 4% agarose gel electrophoresis was used to electrophoresis the DSN enzyme digestion products. The results of electrophoresis showed that DSN enzyme digestion products concentrated in 30 bp The DSN enzyme could continuously hydrolyze the hairpin DNA of the miRNA-10b hybridization part in the hybridization environment in the presence of miRNA-10b, so that the hairpin DNA fragments of the unhydrolyzed part were aggregated. The length of the hairpin DNA sequence was 55 bp, the length of the miRNA-10b sequence was 23 bp, and the length of the unhydrolyzed hairpin DNA fragment was about 30 bp. The electrophoresis results showed that the DSN digestion reaction was successfully carried out, and the trace miRNA-10b signal was amplified by DSN cycle digestion.
- The performance evaluation results of the LFB showed that the detection limit of miRNA-10b was 5 nM/mL under the optimal conditions. It could still be accurately detected in the case of only one nucleic acid error, which proved that the LFB had good specificity. The results of all groups in the repeatability experiment were consistent. The stability results showed that the storage conditions and validity of the LFB were 4°C and 40 days.
- The actual detection environment simulation experiment results showed that the detection limit of the LFB prepared by us is 10 nM/mL in the actual body fluid working environment, and it could still maintain good specificity with only one nucleic acid error.
The above experimental results showed that the LFB prepared in this study could accurately, efficiently, easily, and quickly detect miRNA-10b. The LFB can play a guiding role in the early diagnosis of PC and meet the clinical needs of large-scale screening of PC high-risk groups.
Author Contributions
Conceptualization, A.L. and K.L.; methodology, A.L. and K.L.; validation, A.L., J.W.; investigation, Y.H.; resources, Q.X.; data curation, H.L; writing—original draft preparation, A.L.; writing—review and editing, A.L. and J.W.; supervision, K.L; All authors have read and agreed to the published version of the manuscript.
Funding
This research was funded by Science and Technology Project of Sichuan Province, No.2020YFS0261.
Conflicts of Interest
The authors declare no conflict of interest.
References
- Mohr, A.M.; Mott, J.L. Overview of microRNA biology. Semin Liver Dis 2015, 35, 3–11. [Google Scholar] [CrossRef] [PubMed]
- Ha, M.; Kim, V.N. Regulation of microRNA biogenesis. Nat Rev Mol Cell Bio 2014, 15, 509–524. [Google Scholar] [CrossRef] [PubMed]
- Lu, T.X.; Rothenberg, M.E. MicroRNA. J Allergy Clin Immun 2018, 141, 1202–1207. [Google Scholar] [CrossRef] [PubMed]
- Sempere, L.F.; Preis, M.; Yezefski, T.; Ouyang, H.; Suriawinata, A.A.; Silahtaroglu, A.; Conejo-Garcia, J.R.; Kauppinen, S.; Wells, W.; Korc, M. Fluorescence-Based Codetection with Protein Markers Reveals Distinct Cellular Compartments for Altered MicroRNA Expression in Solid Tumors. Clin Cancer Res 2010, 16, 4246–4255. [Google Scholar] [CrossRef] [PubMed]
- Szafranska, A.E.; Doleshal, M.; Edmunds, H.S.; Gordon, S.; Luttges, J.; Munding, J.B.; Barth, R.J.; Gutmann, E.J.; Suriawinata, A.A.; Marc Pipas, J.; Tannapfel, A.; Korc, M.; Hahn, S.A.; Labourier, E.; Tsongalis, G.J. Analysis of MicroRNAs in Pancreatic Fine-Needle Aspirates Can Classify Benign and Malignant Tissues. Clin Chem 2008, 54, 1716–1724. [Google Scholar] [CrossRef]
- Dong, X.; Men, X.; Zhang, W.; Lei, P. Advances in tumor markers of ovarian cancer for early diagnosis. Indian J Cancer 2014, 51 Suppl 3, e72-6. [Google Scholar] [CrossRef]
- Yi, N.; Zhao, X.; Ji, J.; Xu, M.; Jiao, Y.; Qian, T.; Zhu, S.; Jiang, F.; Chen, J.; Xiao, M. Serum galectin-3 as a biomarker for screening, early diagnosis, prognosis and therapeutic effect evaluation of pancreatic cancer. J Cell Mol Med 2020. [Google Scholar] [CrossRef] [PubMed]
- Lee, J.U.; Kim, W.H.; Lee, H.S.; Park, K.H.; Sim, S.J. Quantitative and Specific Detection of Exosomal miRNAs for Accurate Diagnosis of Breast Cancer Using a Surface-Enhanced Raman Scattering Sensor Based on Plasmonic Head-Flocked Gold Nanopillars. Small 2019, 15, e1804968. [Google Scholar] [CrossRef]
- Takahashi, H.; Ohkawachi, M.; Horio, K.; Kobori, T.; Aki, T.; Matsumura, Y.; Nakashimada, Y.; Okamura, Y. RNase H-assisted RNA-primed rolling circle amplification for targeted RNA sequence detection. Sci Rep-Uk 2018, 8, 7770. [Google Scholar] [CrossRef]
- Liu, Y.; Zhang, J.; Tian, J.; Fan, X.; Geng, H.; Cheng, Y. Multiplex detection of microRNAs by combining molecular beacon probes with T7 exonuclease-assisted cyclic amplification reaction. Anal Bioanal Chem 2017, 409, 107–114. [Google Scholar] [CrossRef]
- PANCREAS AND BILIARY TRACT A Pilot Study to Develop a Diagnostic Test for Pancreatic Ductal Adenocarcinoma Based on Differential Expression of Select miRNA in Plasma and Bile .
- Moccia, M.; Caratelli, V.; Cinti, S.; Pede, B.; Avitabile, C.; Saviano, M.; Imbriani, A.L.; Moscone, D.; Arduini, F. Paper-based electrochemical peptide nucleic acid (PNA) biosensor for detection of miRNA-492: a pancreatic ductal adenocarcinoma biomarker. Biosens Bioelectron 2020, 165, 112371. [Google Scholar] [CrossRef] [PubMed]
- Munoz-San, M.C.; Pedrero, M.; Gamella, M.; Montero-Calle, A.; Barderas, R.; Campuzano, S.; Pingarron, J.M. A novel peptide-based electrochemical biosensor for the determination of a metastasis-linked protease in pancreatic cancer cells. Anal Bioanal Chem 2020, 412, 6177–6188. [Google Scholar] [CrossRef] [PubMed]
- Chen, S.L.; Chen, C.Y.; Hsieh, J.C.; Yu, Z.Y.; Cheng, S.J.; Hsieh, K.Y.; Yang, J.W.; Kumar, P.V.; Lin, S.F.; Chen, G.Y. Graphene Oxide-Based Biosensors for Liquid Biopsies in Cancer Diagnosis. Nanomaterials-Basel 2019, 9. [Google Scholar] [CrossRef] [PubMed]
- Teengam, P.; Siangproh, W.; Tuantranont, A.; Henry, C.S.; Vilaivan, T.; Chailapakul, O. Electrochemical paper-based peptide nucleic acid biosensor for detecting human papillomavirus. Anal Chim Acta 2017, 952, 32–40. [Google Scholar] [CrossRef] [PubMed]
- Anisimova, V.E.; Rebrikov, D.V.; Shagin, D.A.; Kozhemyako, V.B.; Menzorova, N.I.; Staroverov, D.B.; Ziganshin, R.; Vagner, L.L.; Rasskazov, V.A.; Lukyanov, S.A.; Shcheglov, A.S. Isolation, characterization and molecular cloning of duplex-specific nuclease from the hepatopancreas of the Kamchatka crab. Bmc Biochem 2008, 9, 14. [Google Scholar] [CrossRef] [PubMed]
- Shagin, D.A.; Rebrikov, D.V.; Kozhemyako, V.B.; Altshuler, I.M.; Shcheglov, A.S.; Zhulidov, P.A.; Bogdanova, E.A.; Staroverov, D.B.; Rasskazov, V.A.; Lukyanov, S. A novel method for SNP detection using a new duplex-specific nuclease from crab hepatopancreas. Genome Res 2002, 12, 1935–42. [Google Scholar] [CrossRef] [PubMed]
- Nielsen, P.E.; Egholm, M.; Berg, R.H.; Buchardt, O. Sequence-selective recognition of DNA by strand displacement with a thymine-substituted polyamide. Science 1991, 254, 1497–500. [Google Scholar] [CrossRef]
- D'Agata, R.; Giuffrida, M.C.; Spoto, G. Peptide Nucleic Acid-Based Biosensors for Cancer Diagnosis. Molecules 2017, 22. [Google Scholar] [CrossRef]
- Bender, M.; Holben, W.E.; Sorensen, S.J.; Jacobsen, C.S. Use of a PNA probe to block DNA-mediated PCR product formation in prokaryotic RT-PCR. Biotechniques 2007, 42, 609–614. [Google Scholar] [CrossRef]
- Meebungpraw, J.; Wiarachai, O.; Vilaivan, T.; Kiatkamjornwong, S.; Hoven, V.P. Quaternized chitosan particles as ion exchange supports for label-free DNA detection using PNA probe and MALDI-TOF mass spectrometry. Carbohyd Polym 2015, 131, 80–89. [Google Scholar] [CrossRef]
- Hwang, J.; Lee, S.; Kim, D.; Han, G.; Soung, N.K.; Cha-Molstad, H.; Lee, K.H.; Ryoo, I.J.; Ahn, M.J.; Kim, S.T.; Lee, M.J.; Yoo, Y.D.; Lee, H.G.; Hong, J.T.; Kim, H.; Choi, E.H.; Kim, S.C.; Kwon, Y.T.; Ahn, J.S.; Kim, B.Y. Peptide nucleic acid (PNA) probe-based analysis to detect filaggrin mutations in atopic dermatitis patients. Exp Dermatol 2018, 27, 1304–1308. [Google Scholar] [CrossRef]
- Wang, Z. Diagnostic performance for declined microRNA-133a in pancreatic cancer. J Cell Biochem 2019. [Google Scholar] [CrossRef]
- Vila-Casadesus, M.; Vila-Navarro, E.; Raimondi, G.; Fillat, C.; Castells, A.; Lozano, J.J.; Gironella, M. Deciphering microRNA targets in pancreatic cancer using miRComb R package. Oncotarget 2018, 9, 6499–6517. [Google Scholar] [CrossRef]
- Hunt, E.A.; Broyles, D.; Head, T.; Deo, S.K. MicroRNA Detection: Current Technology and Research Strategies. Annu Rev Anal Chem 2015, 8, 217–237. [Google Scholar] [CrossRef]
- Li, C.; Li, Z.; Jia, H.; Yan, J. One-step ultrasensitive detection of microRNAs with loop-mediated isothermal amplification (LAMP). Chem Commun 2011, 47, 2595–2597. [Google Scholar] [CrossRef]
- Robles-Díaz, G.; Díaz-Sánchez, V.; Fernández-del Castillo, C.; Morales, M.; Aceves, G.; Galván, E.; Altamirano, A. Serum testosterone:dihydrotestosterone ratio and CA 19-9 in the diagnosis of pancreatic cancer. The American journal of gastroenterology 1991, 86, 591. [Google Scholar]
Figure 1.
The modified PNA structure.
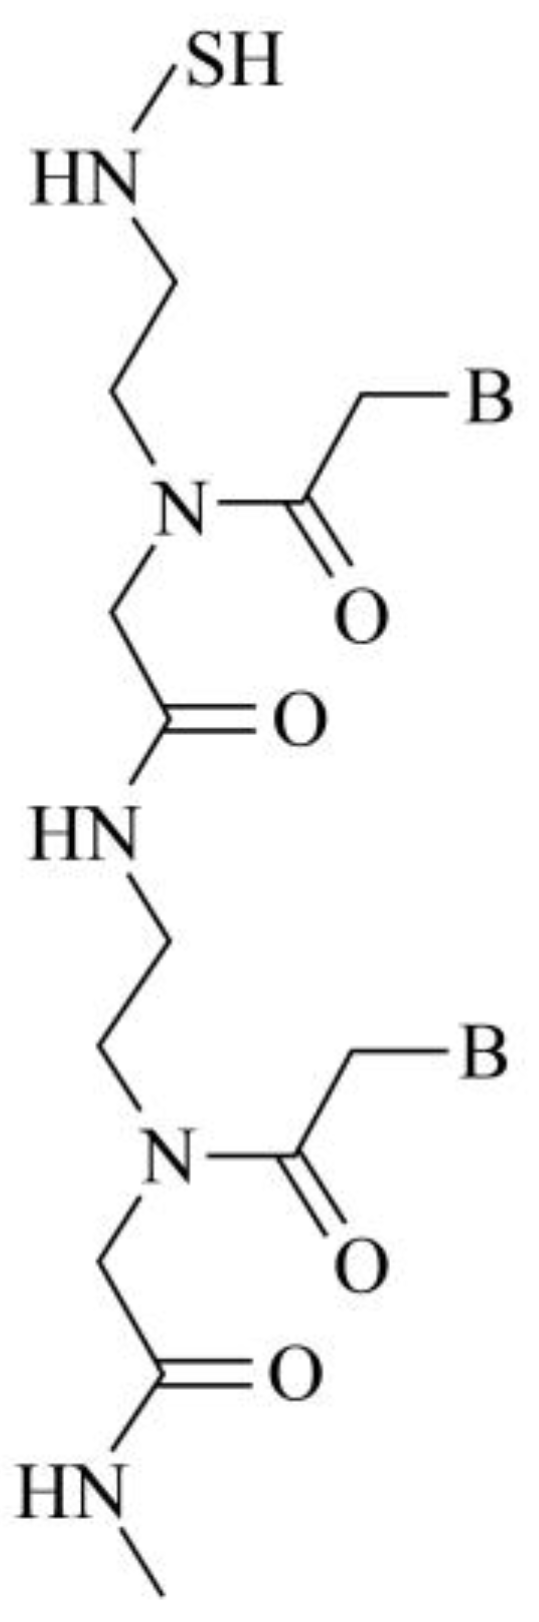
Figure 2.
Structure and detection principle of the LFB.
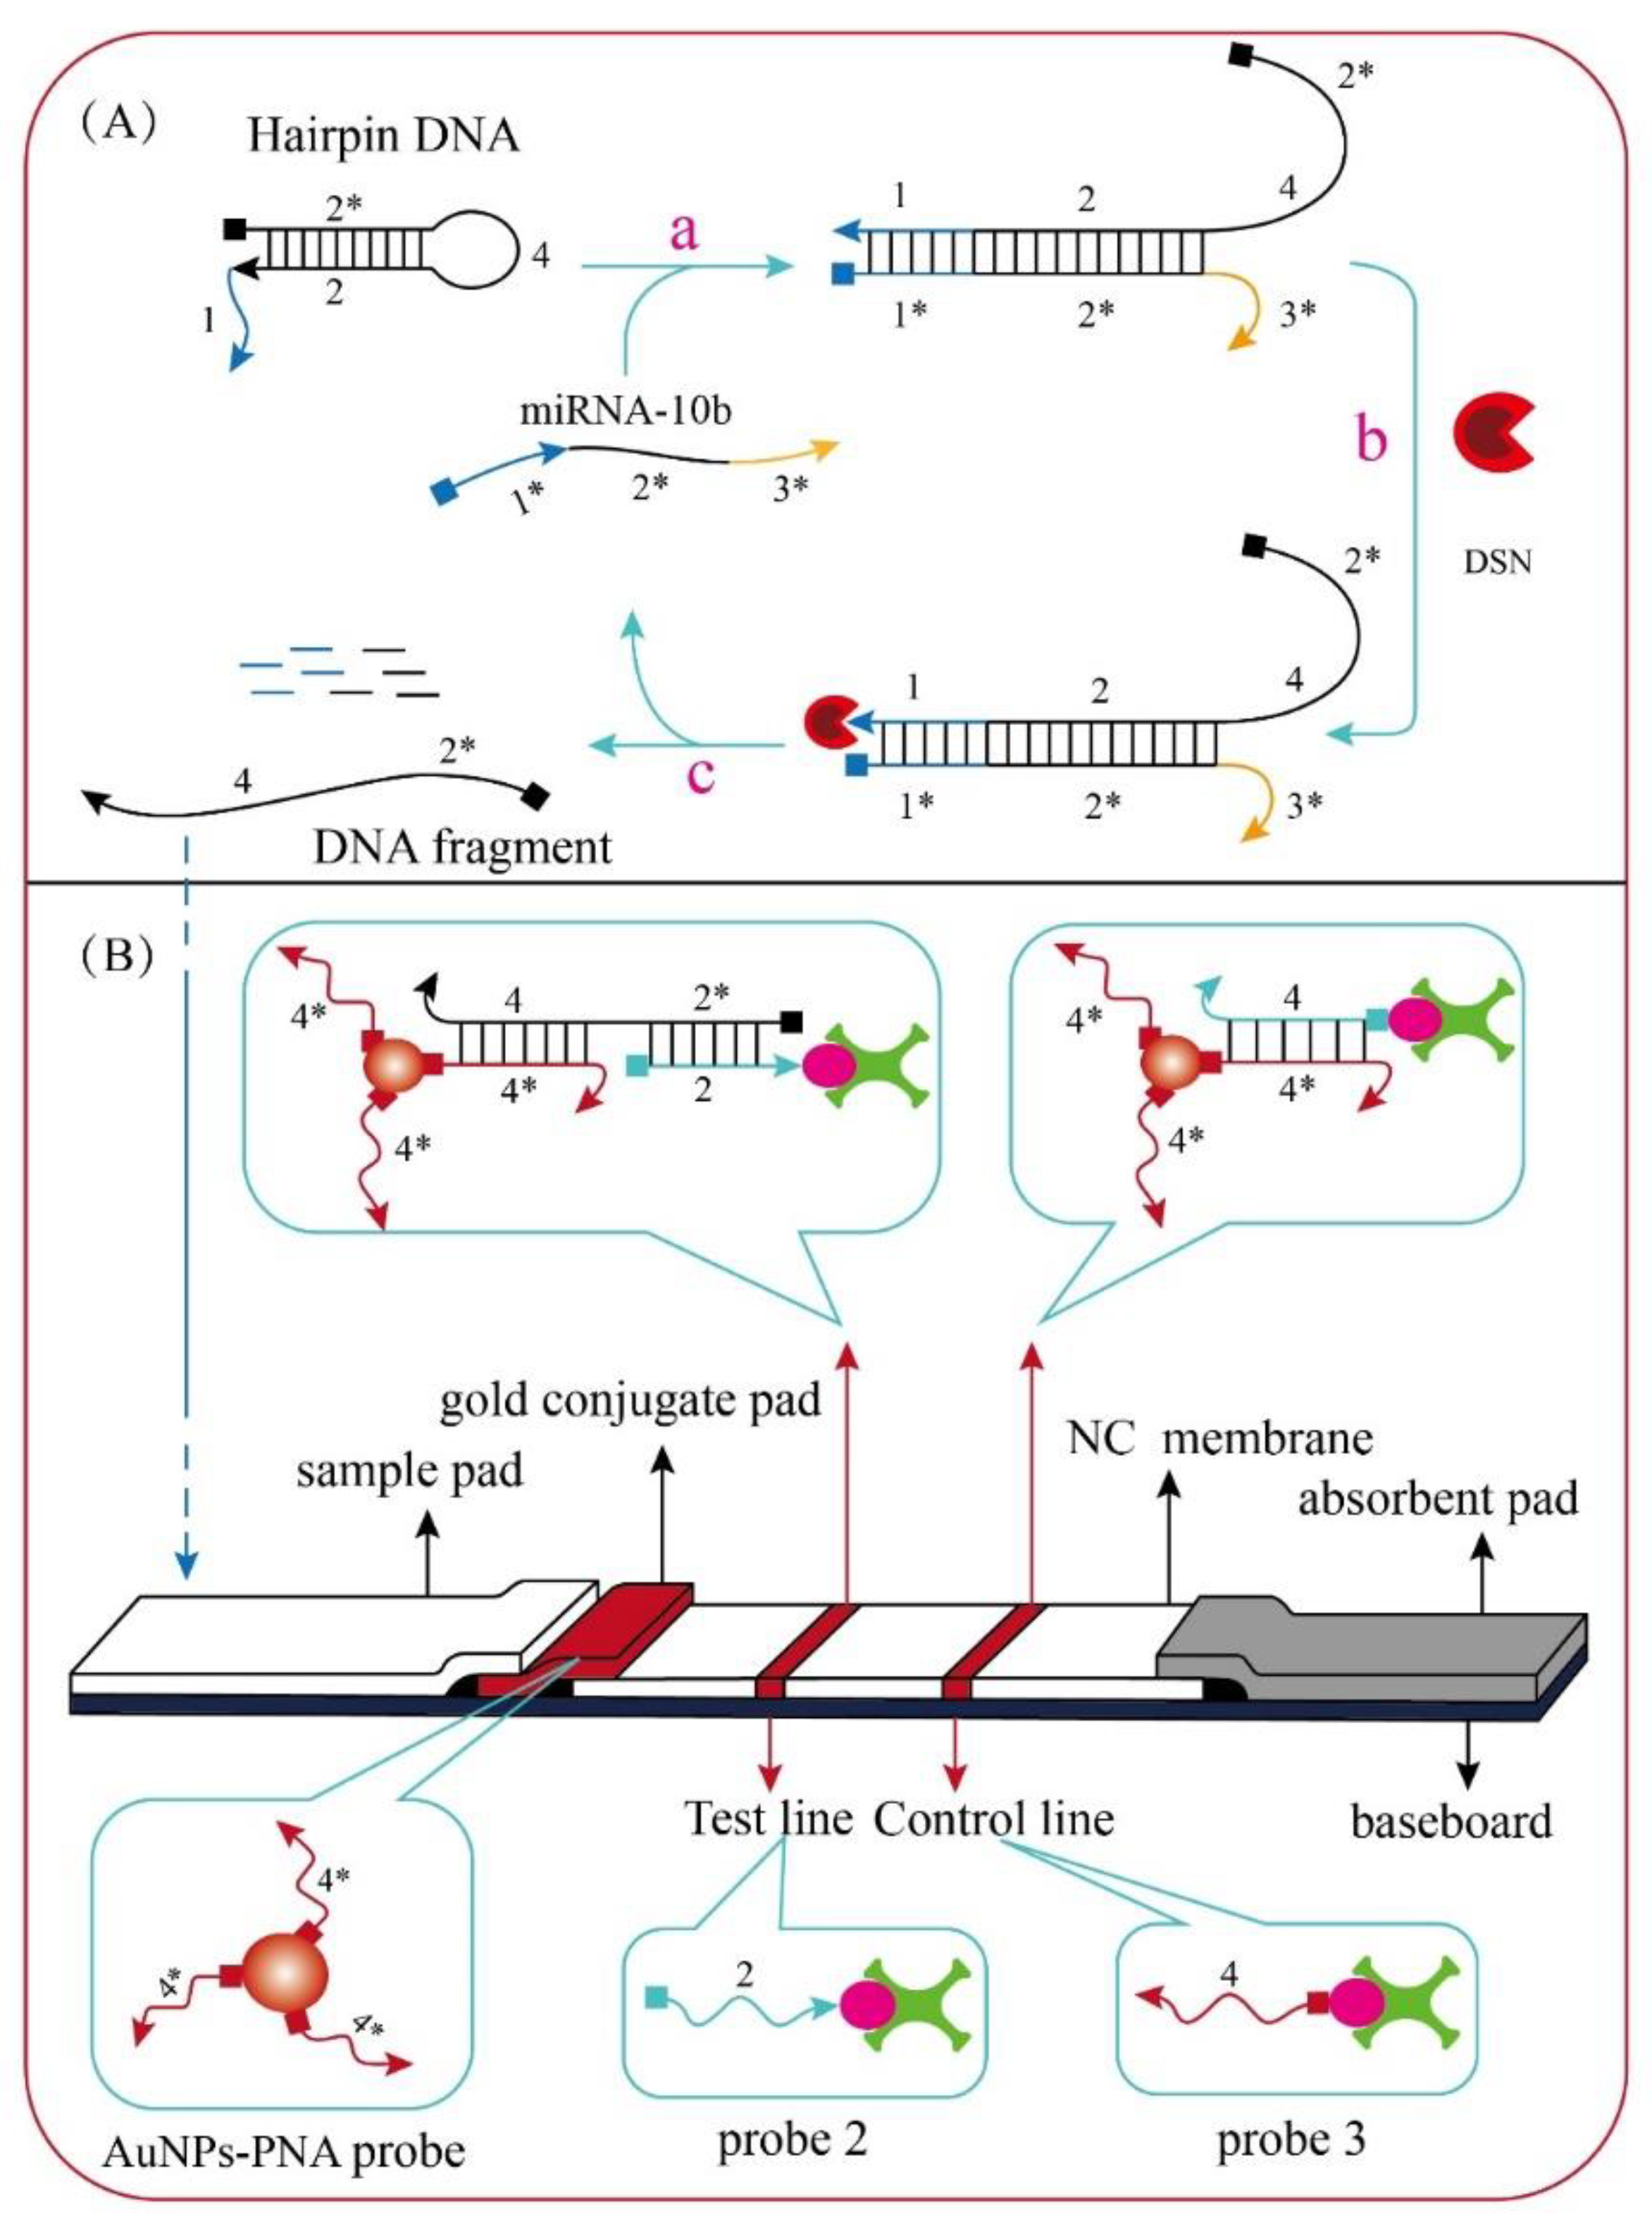
Figure 3.
(a) synthetic of AuNPs solution. (b) UV- visible spectrum of AuNPs solution.
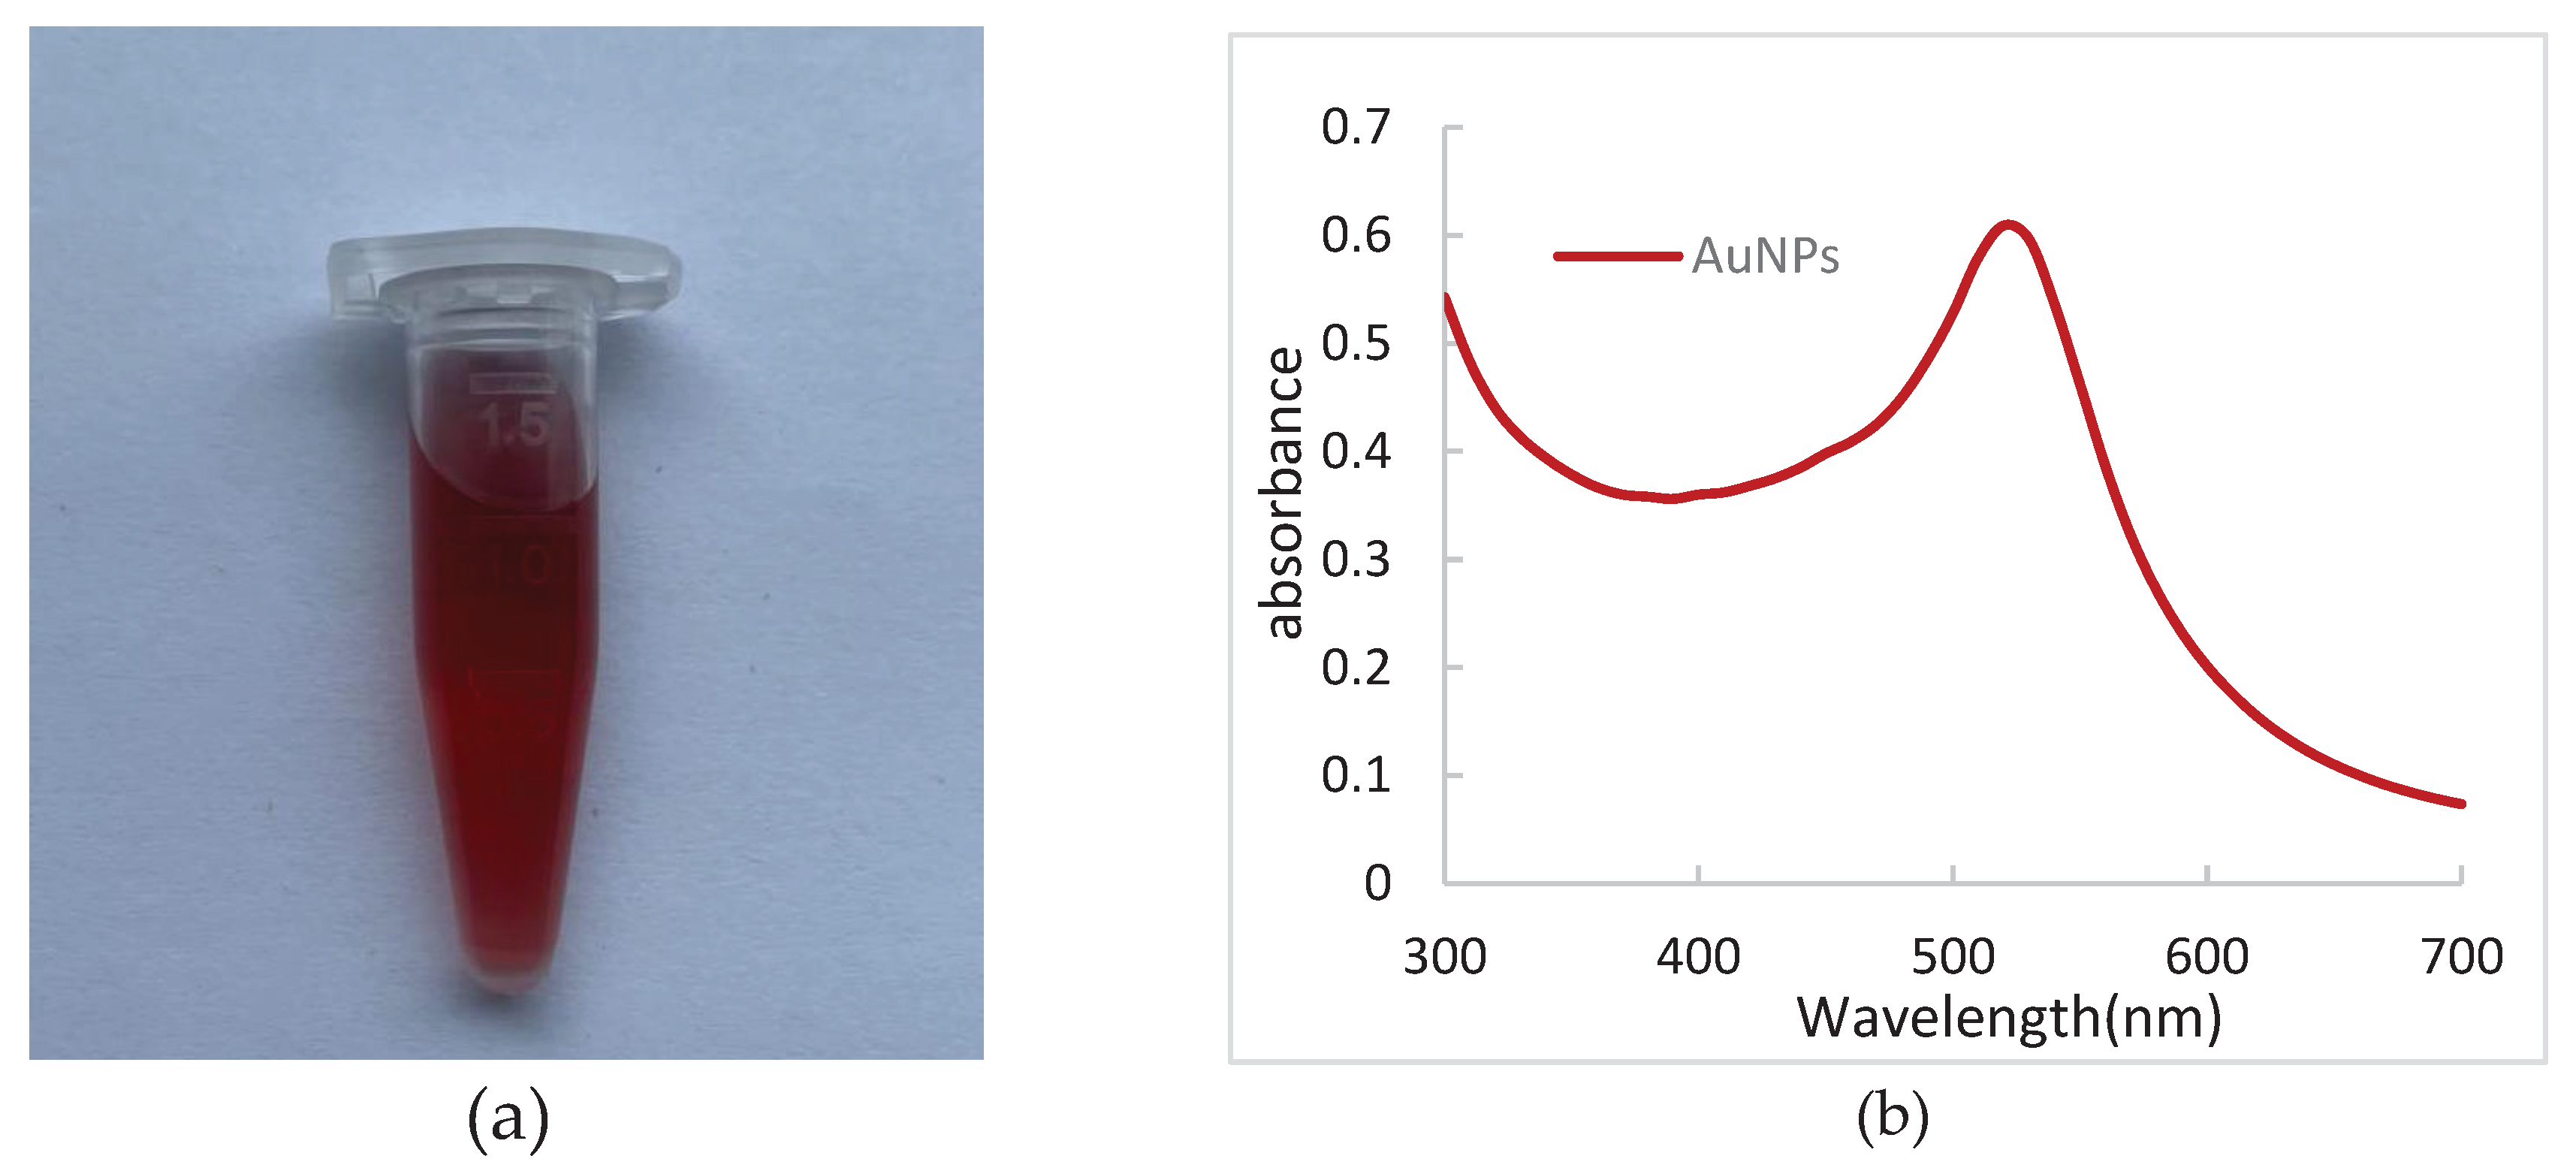
Figure 4.
TEM result of AuNPs solution.
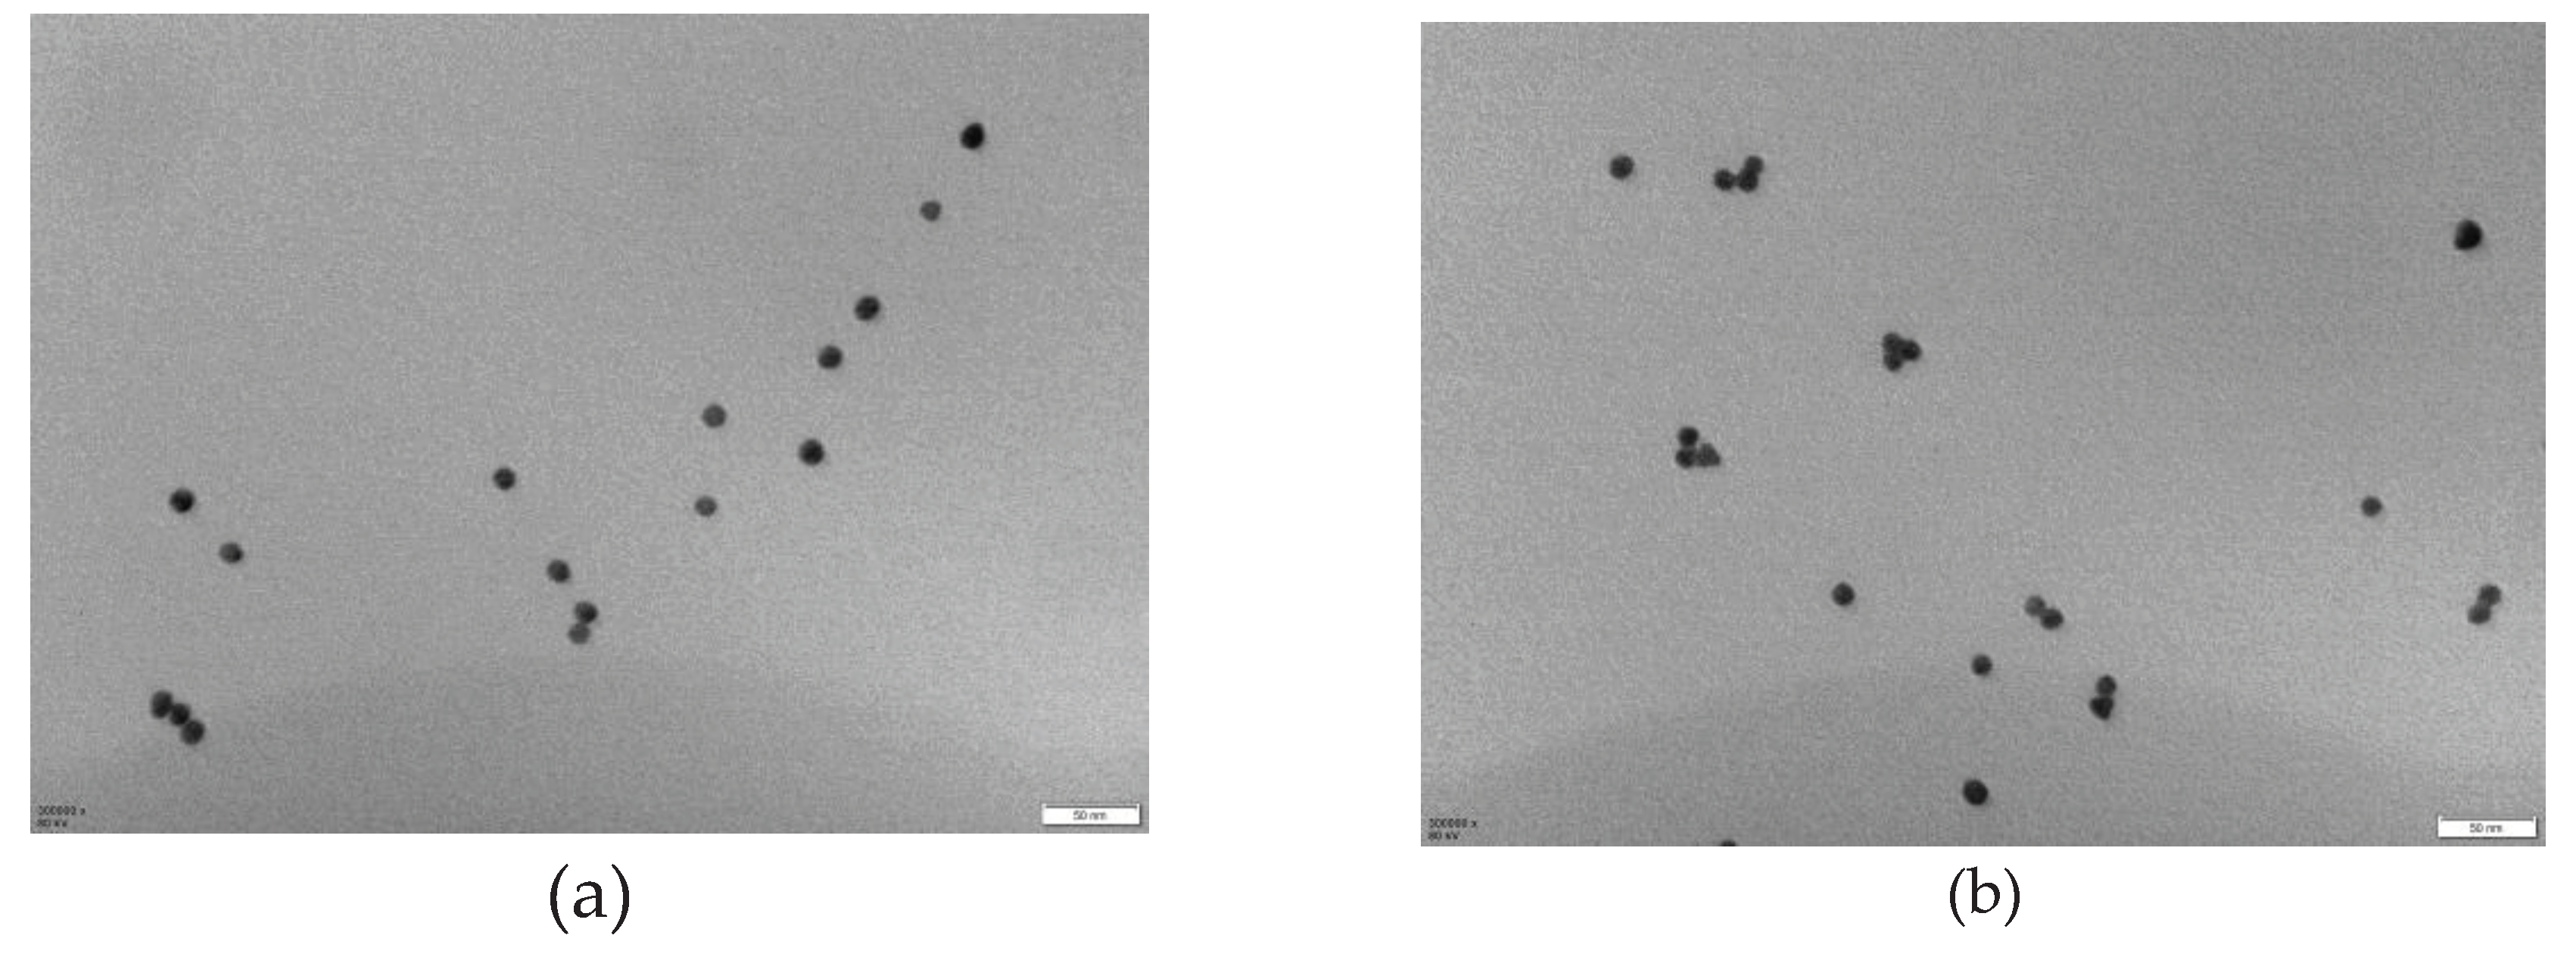
Figure 5.
The results of AuNPs-PNA probe UV-visible spectrum.
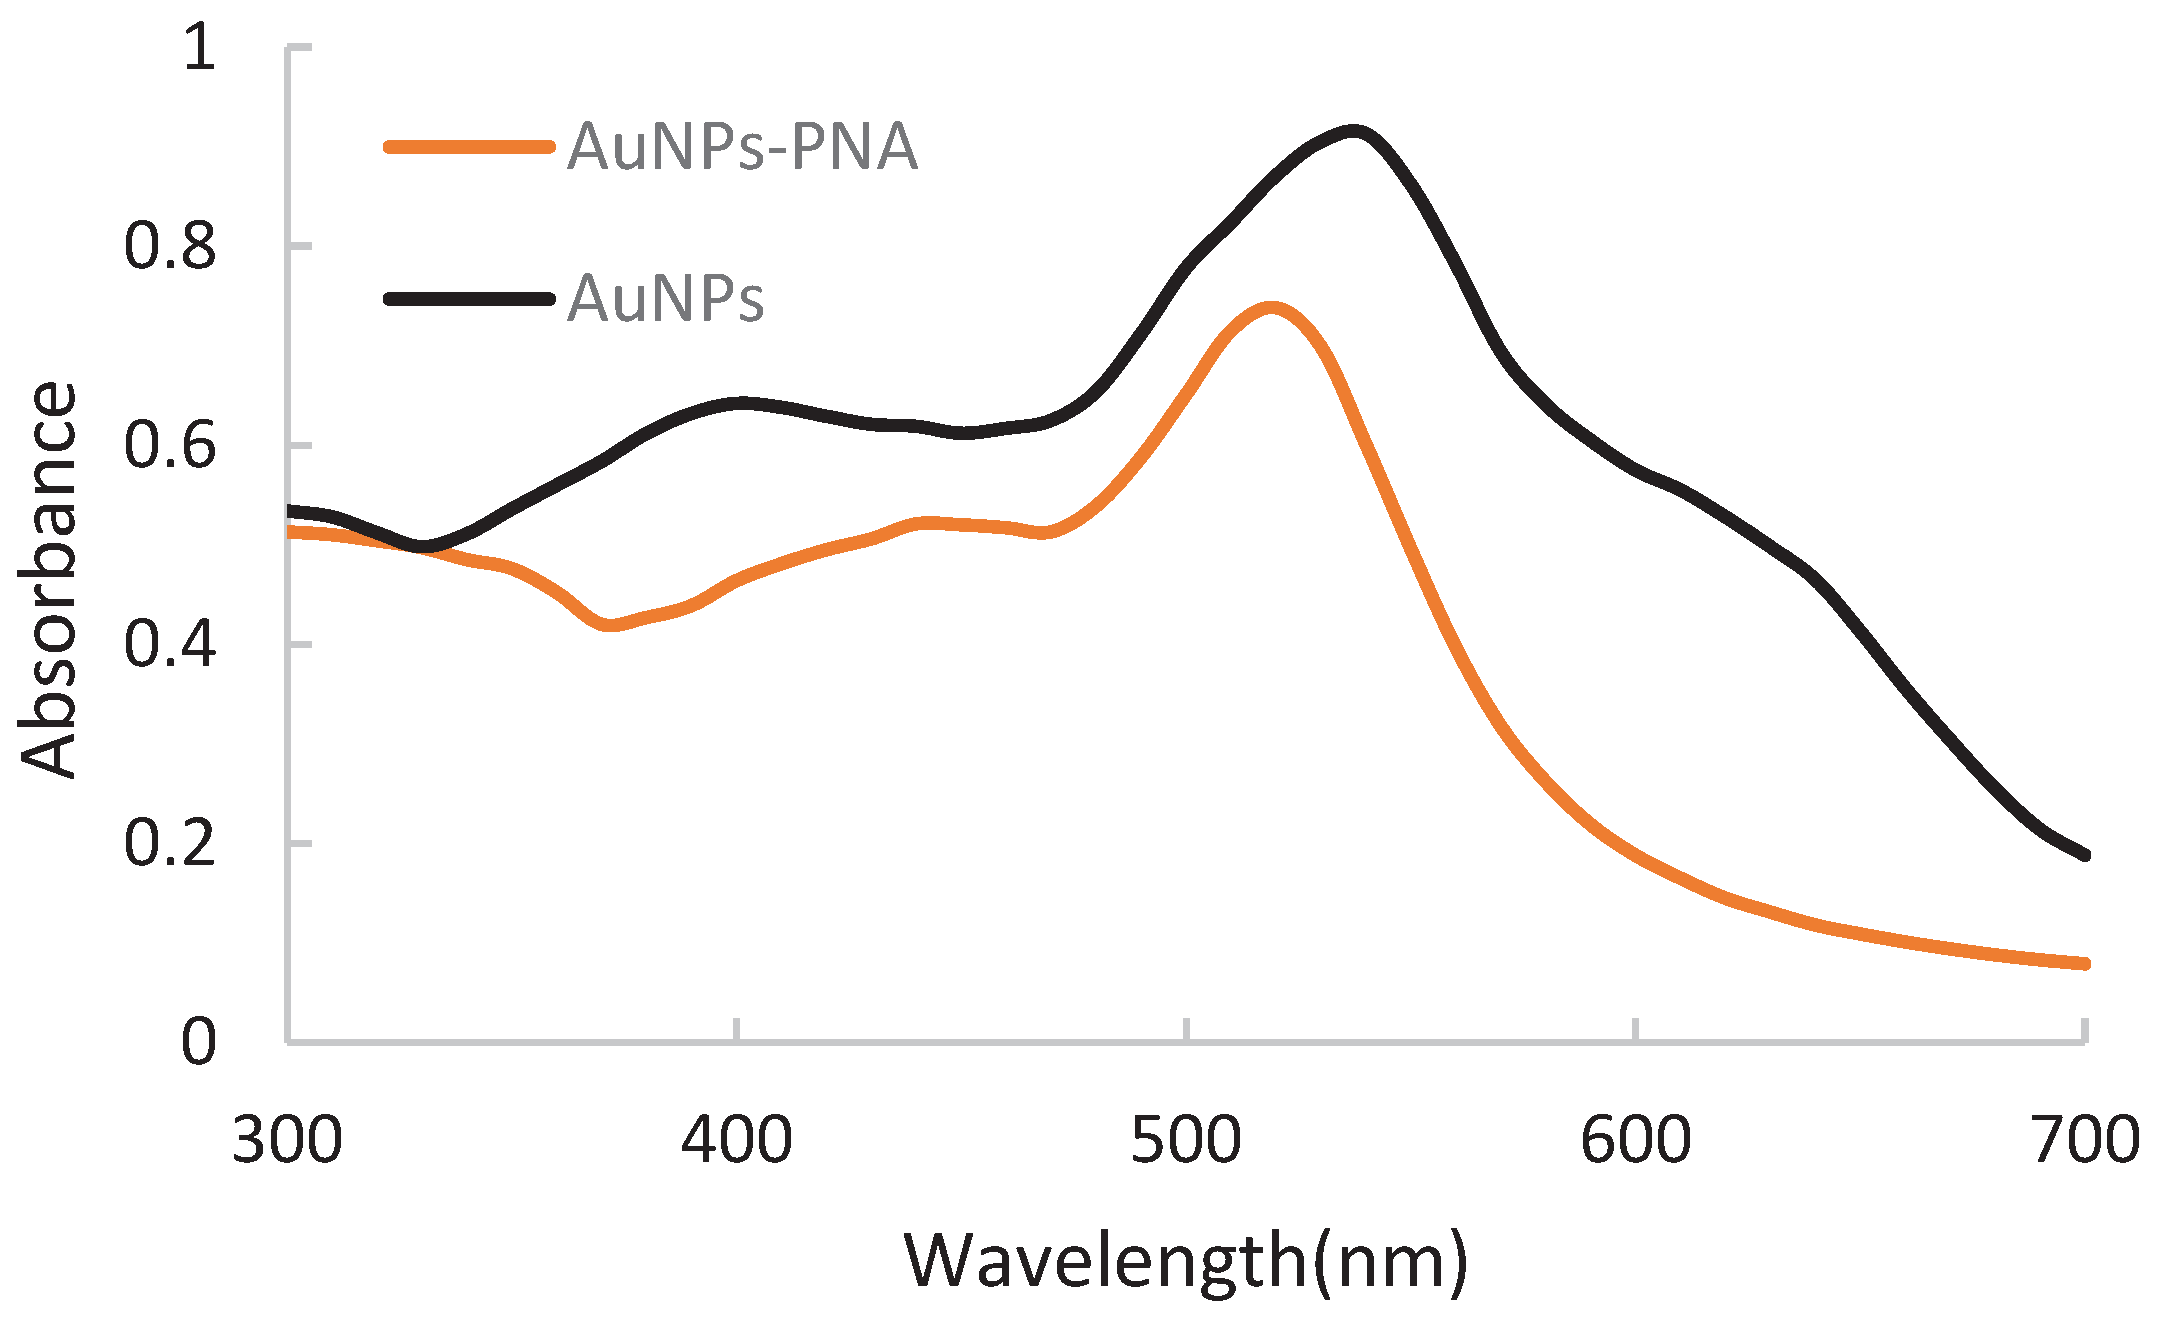
Figure 6.
(a)Effect of pH on probe bonding reaction; (b) Effect of probe volume ratio on probe bonding reaction.
Figure 6.
(a)Effect of pH on probe bonding reaction; (b) Effect of probe volume ratio on probe bonding reaction.
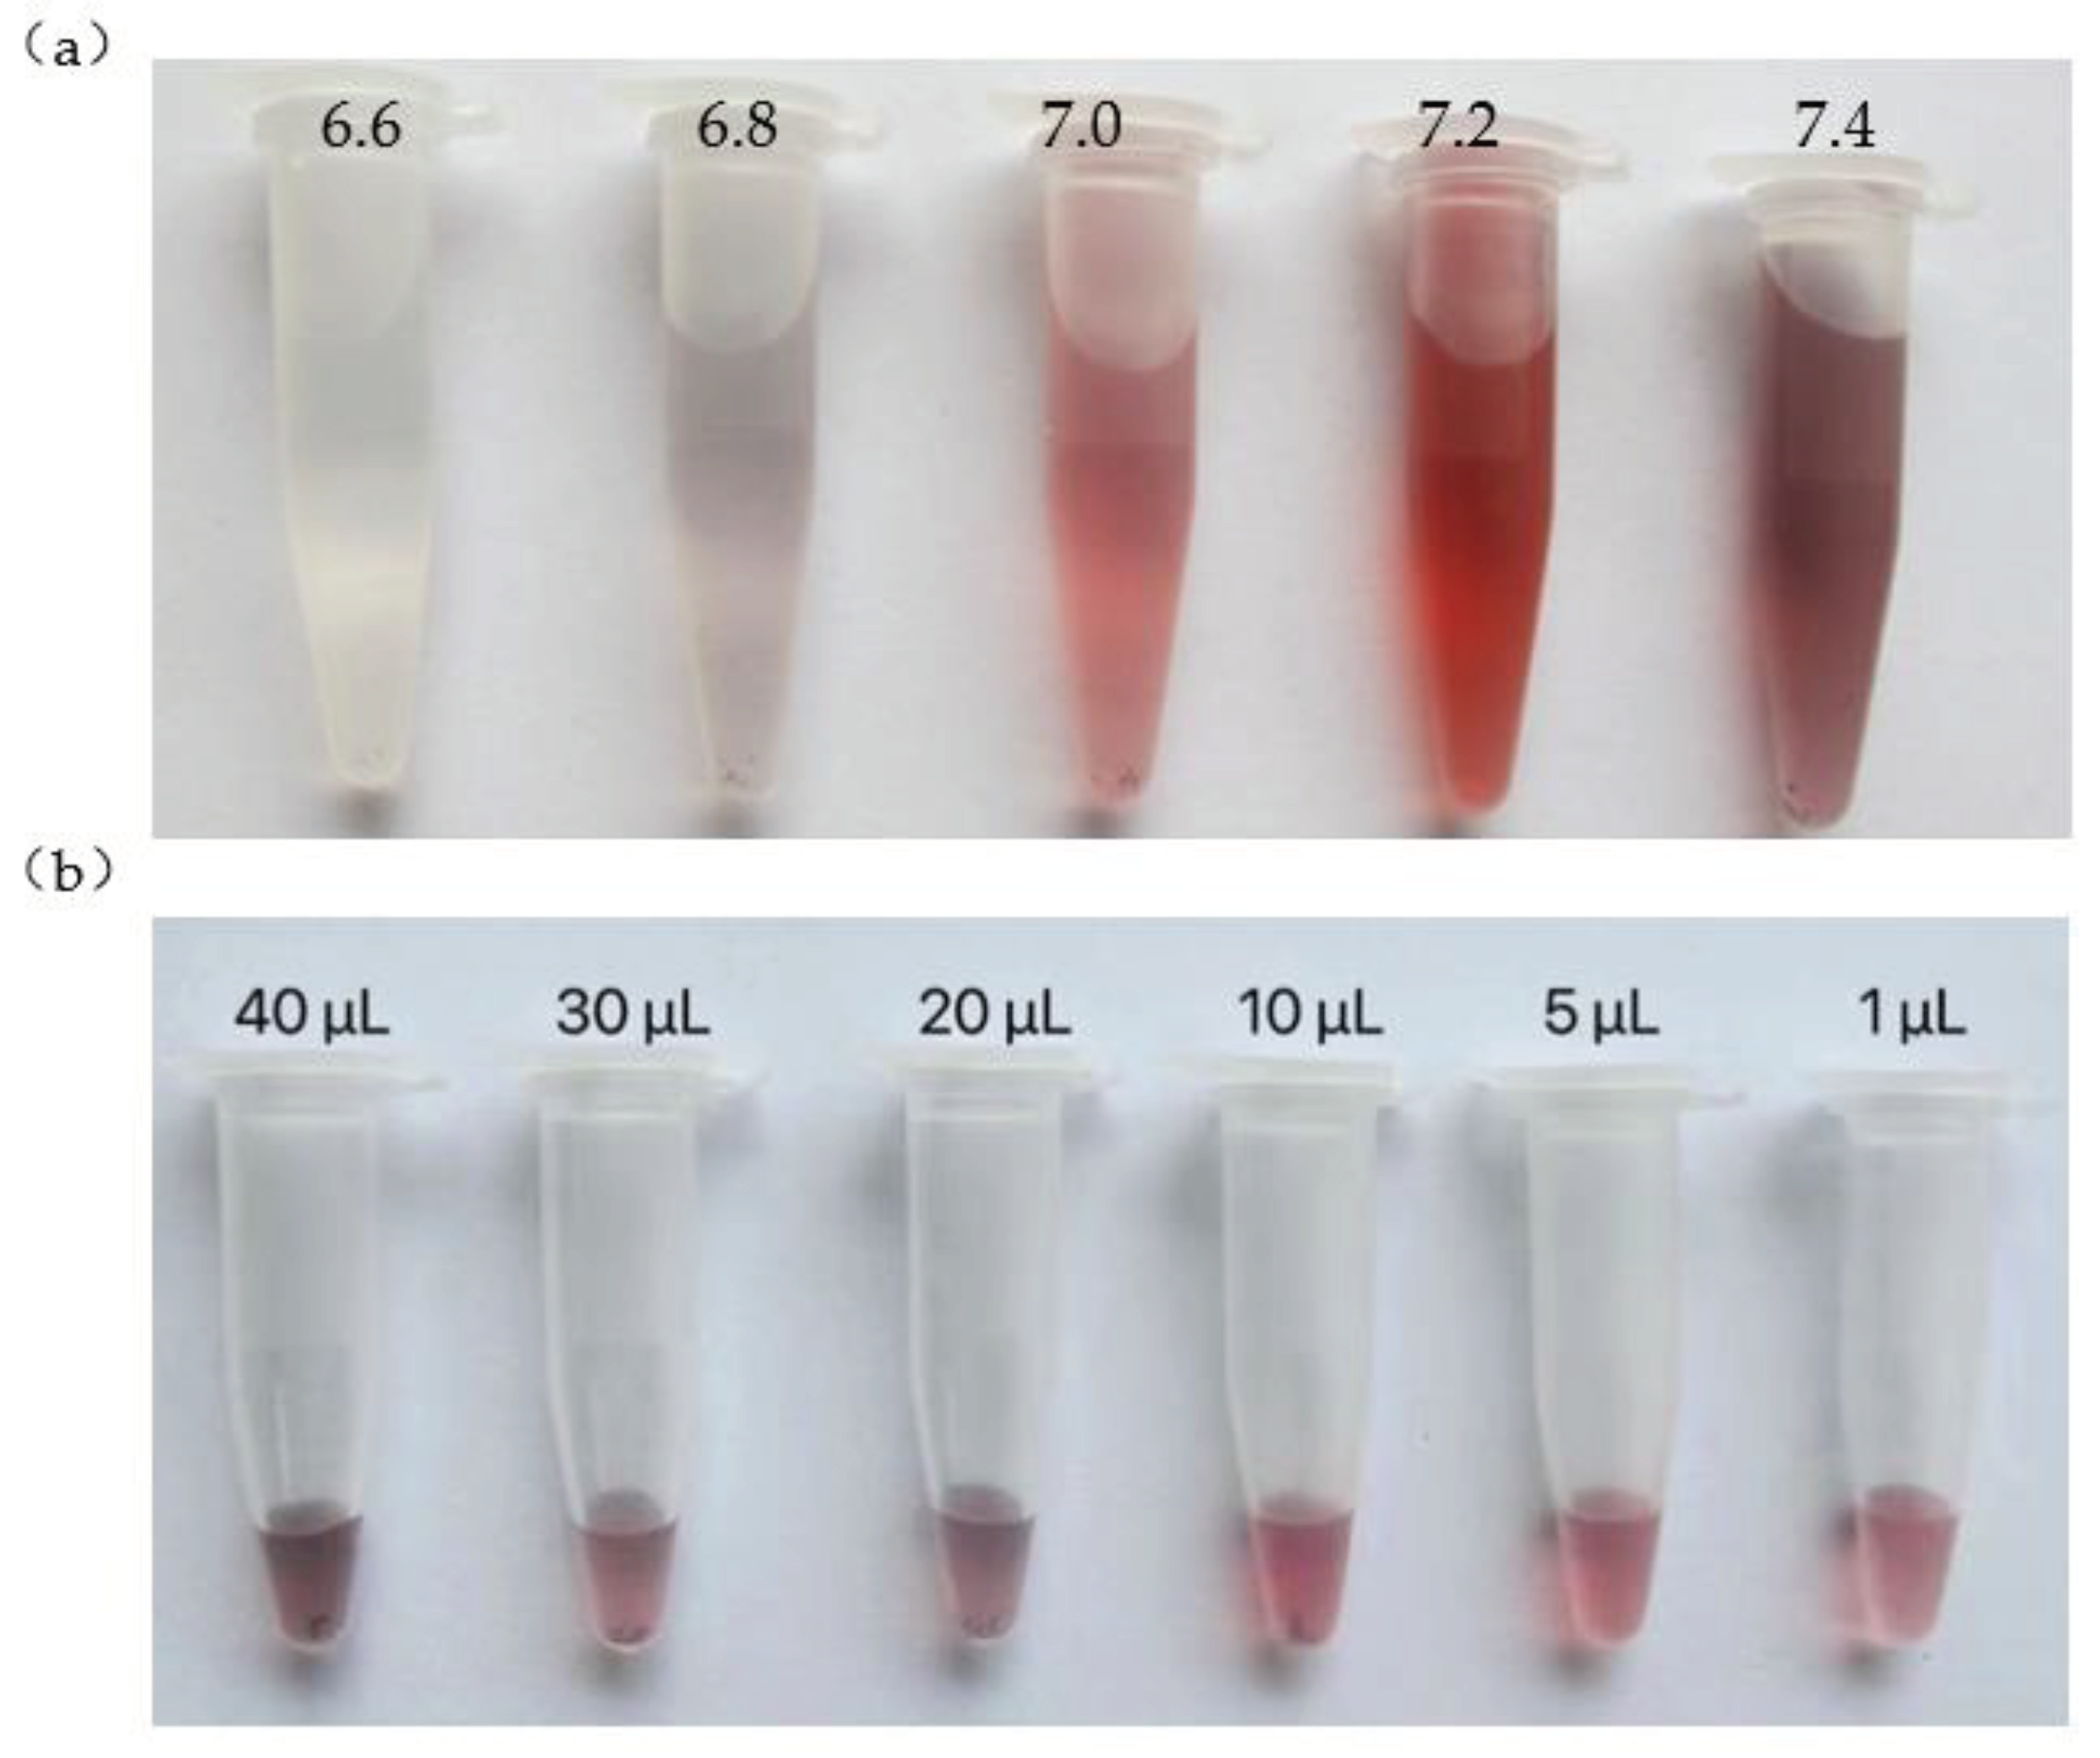
Figure 9.
(a) Probe fixation mode selection; (b) Probe concentration selection.
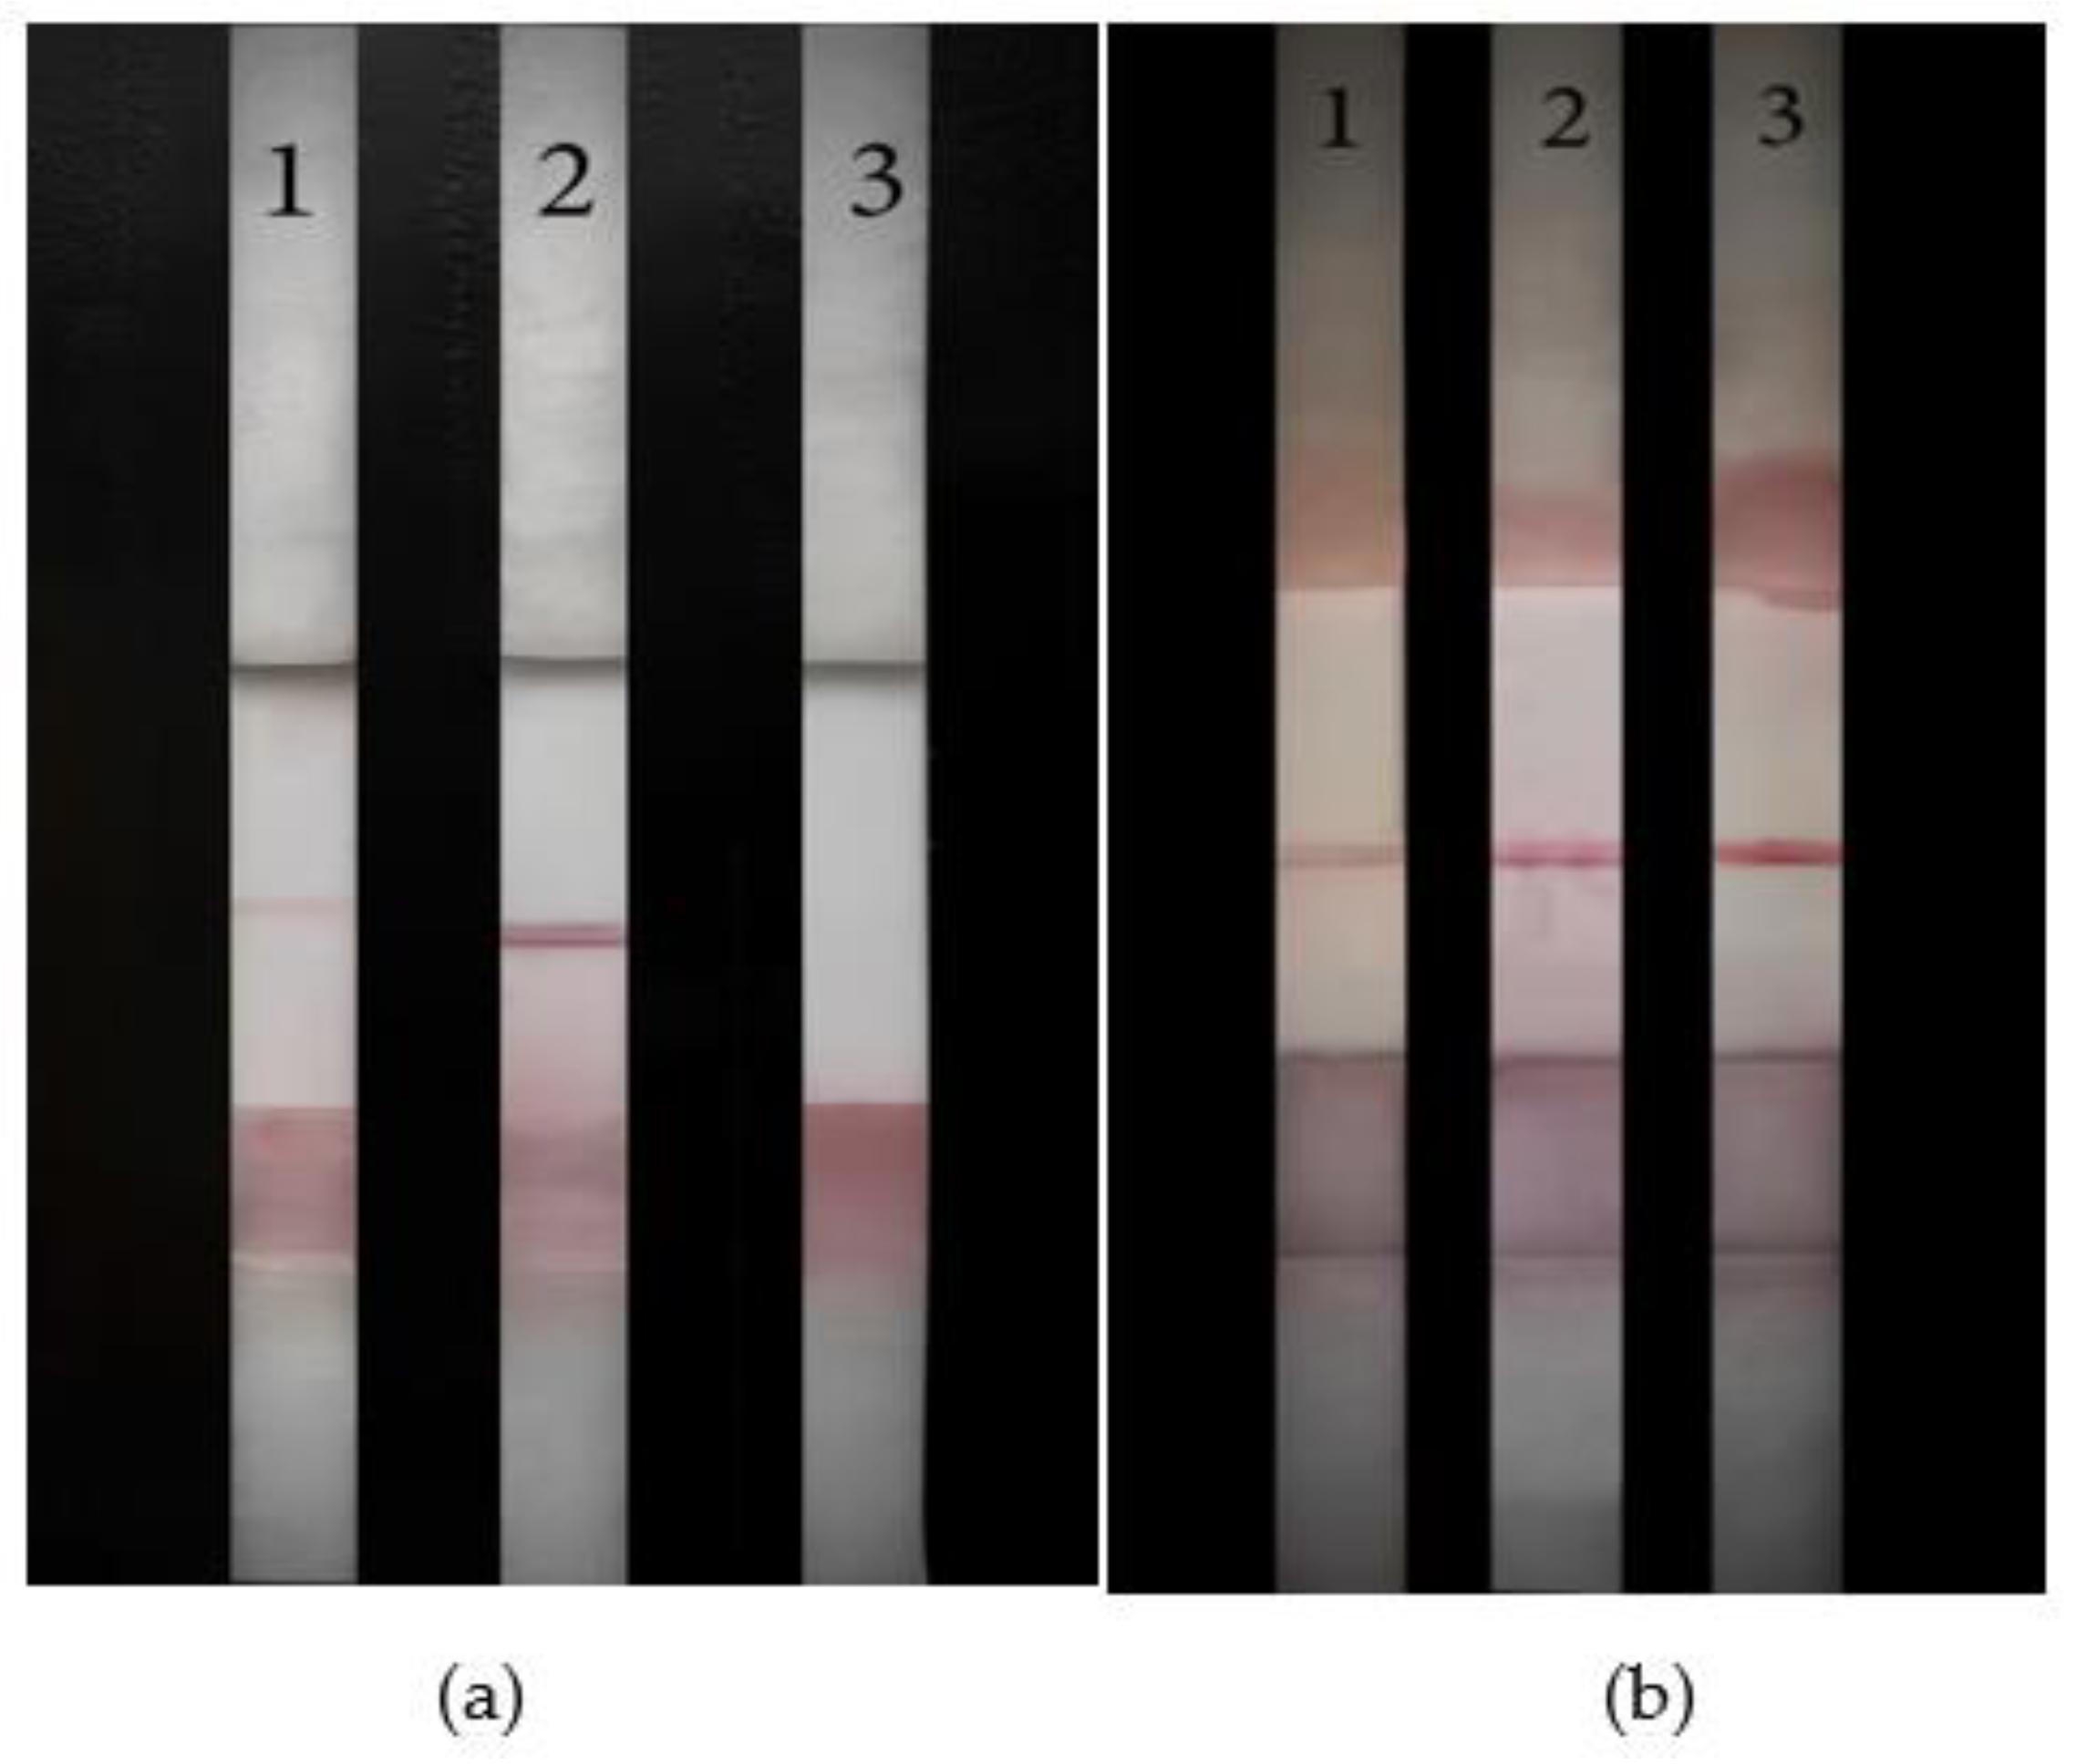
Figure 10.
LFB (a) sensitivity and (b) specificity test results.
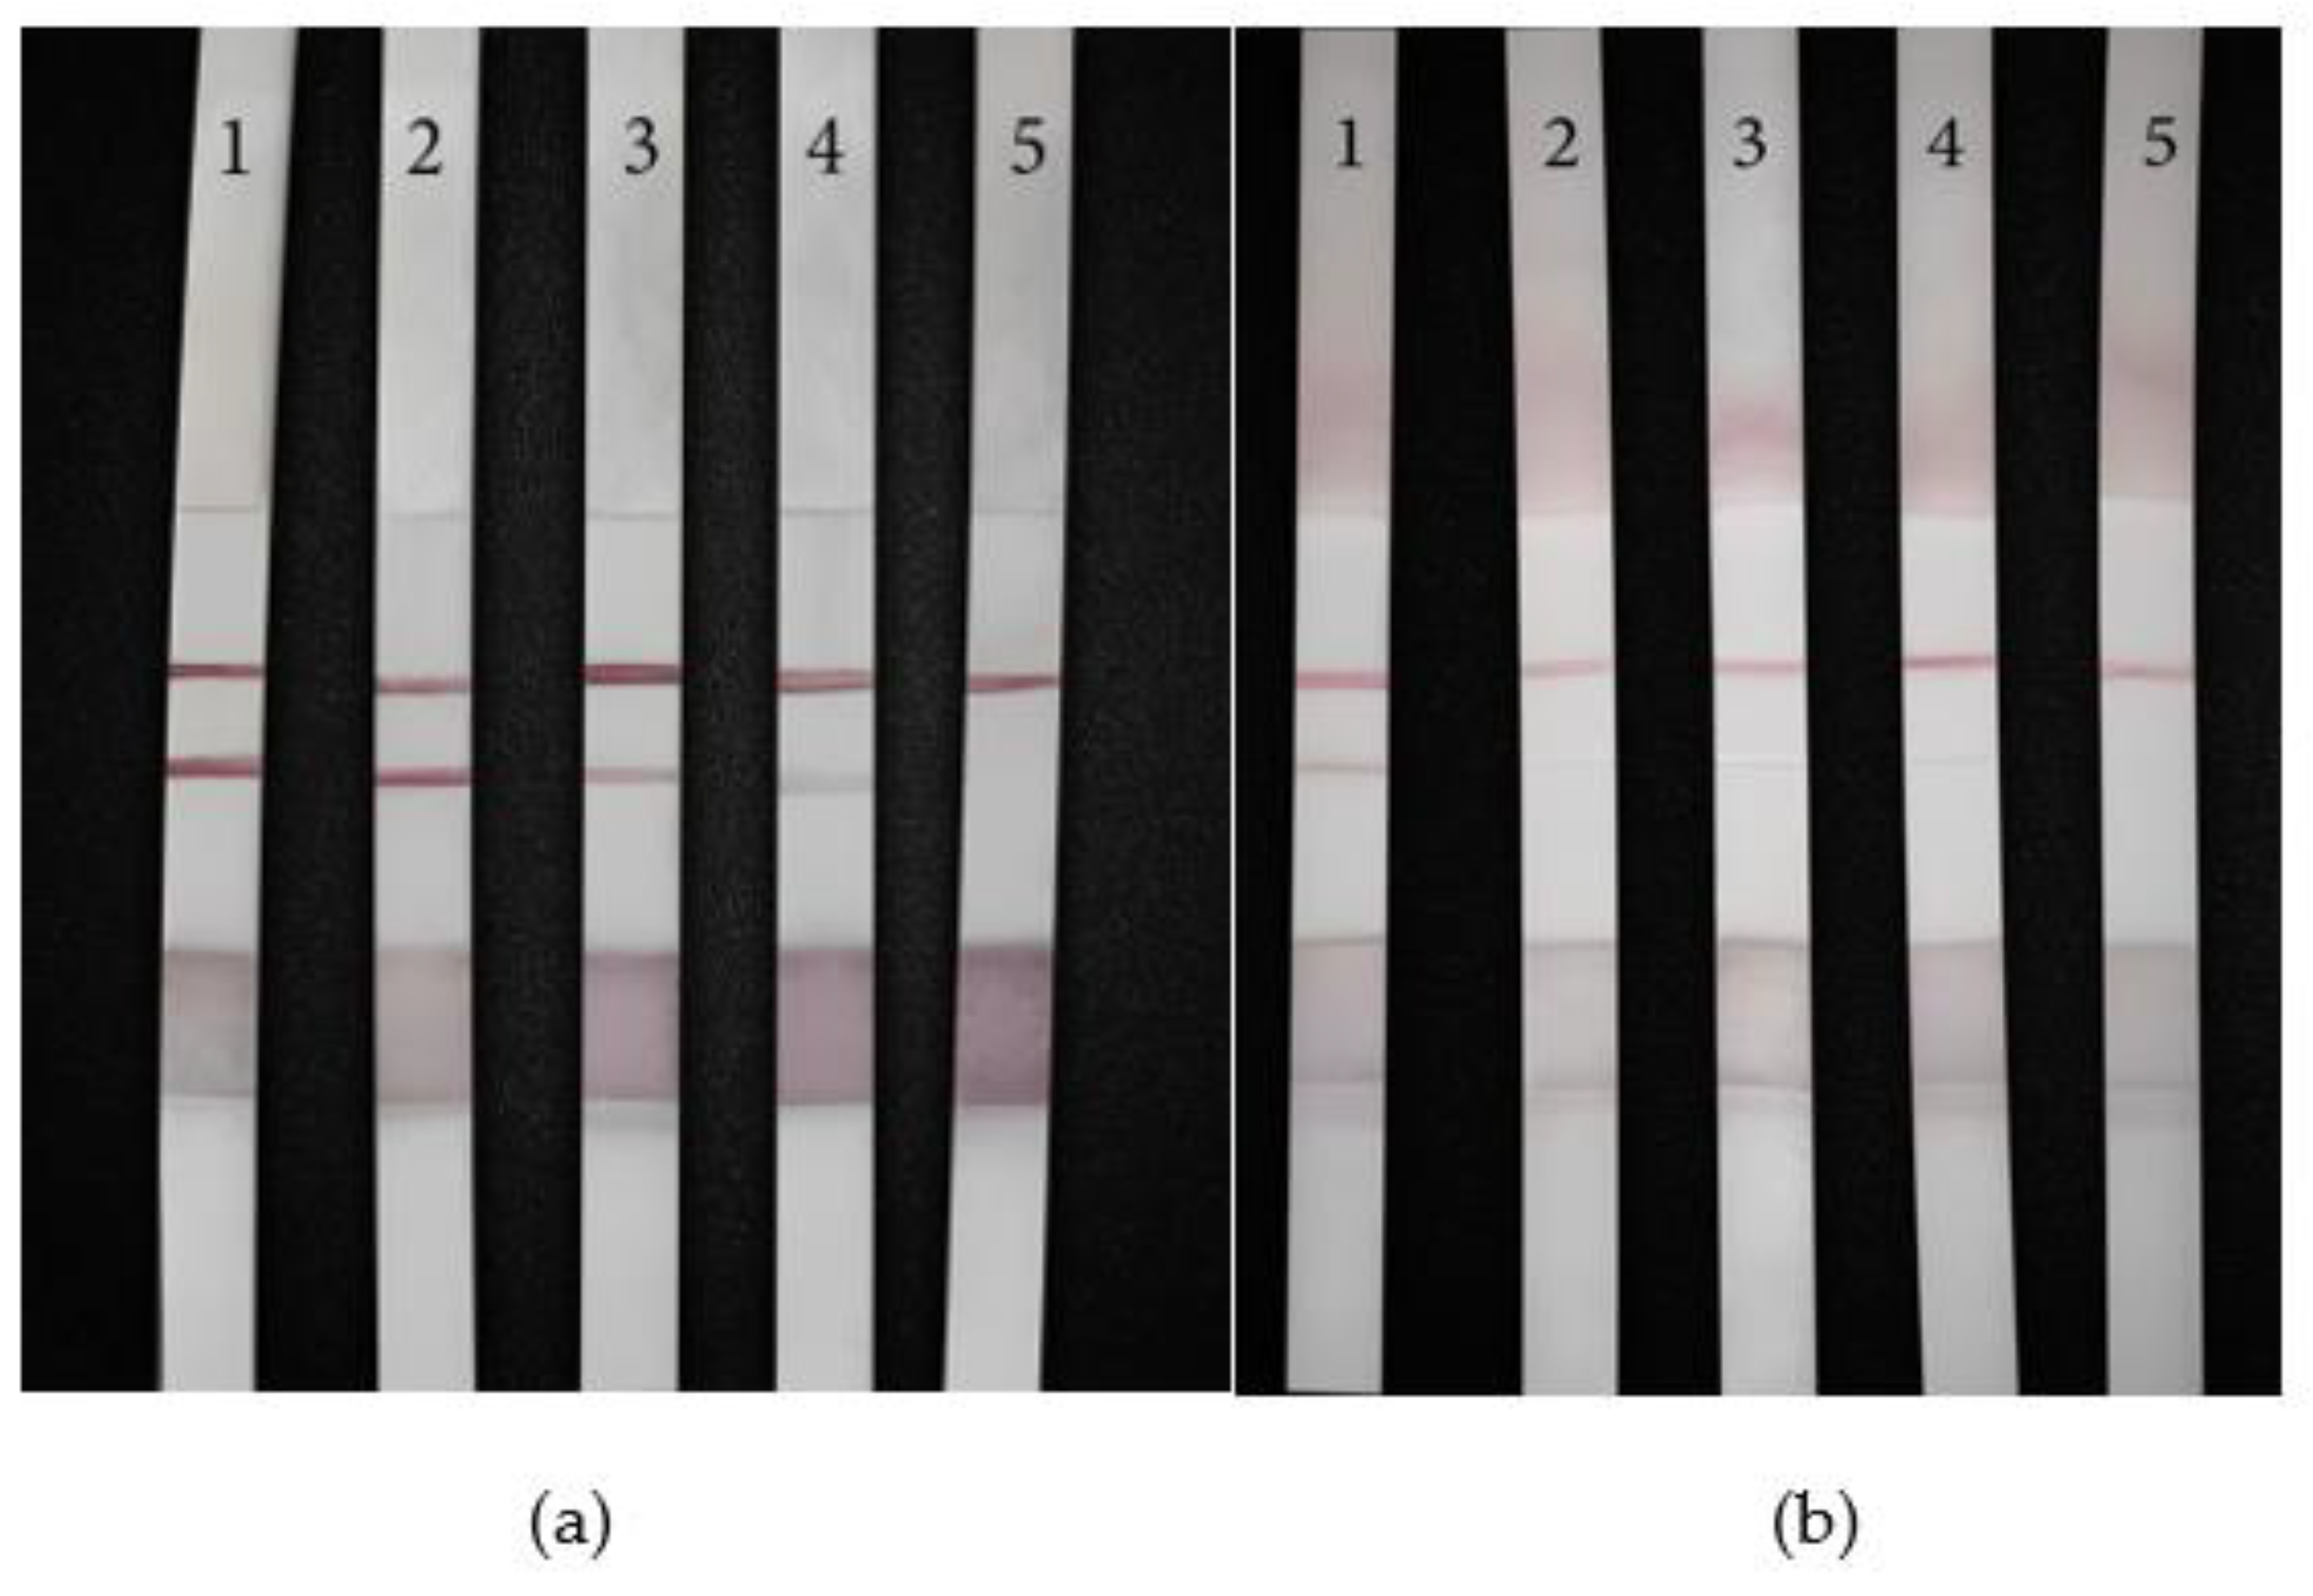
Figure 11.
Actual sample (a) sensitivity and (b) specificity test results.
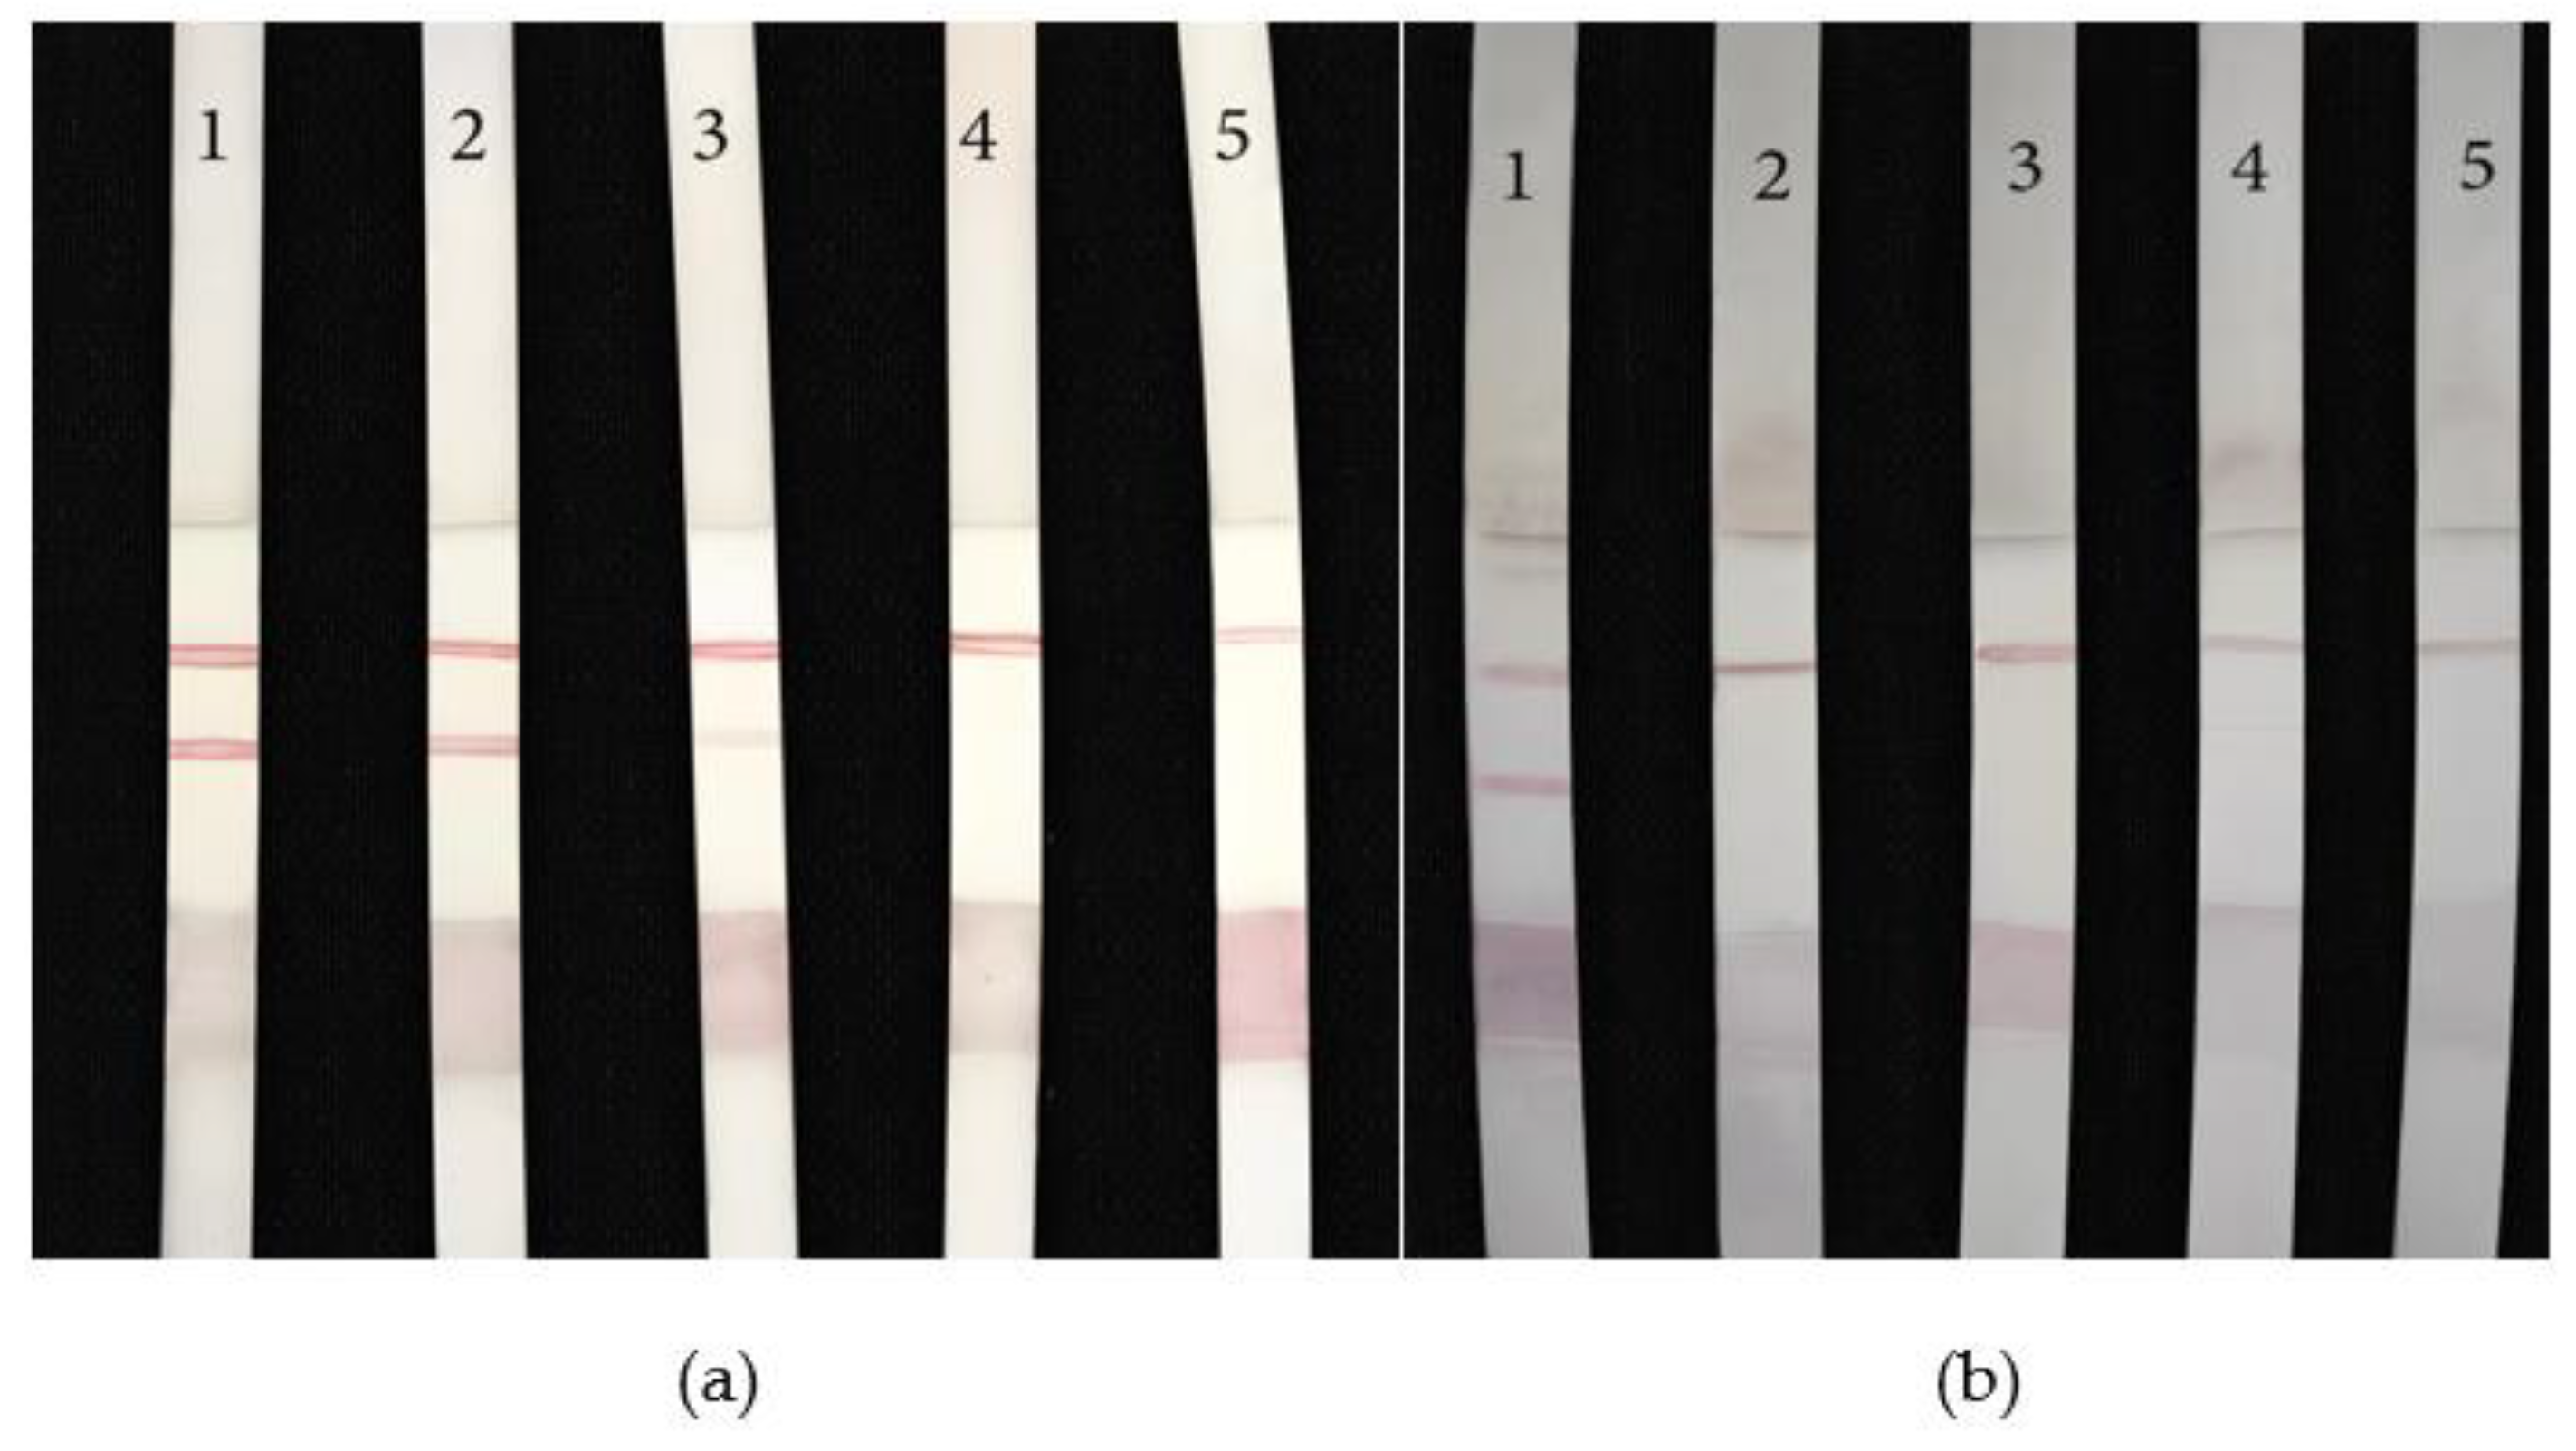

Table 1.
All nucleic acid sequences used in the experiment.
| Name | Sequence (5′-3′) |
|---|---|
| PNA probe | GCAACTTCTATGTAT |
| Probe 2 | AAATTCGGTTCTACAGGGTA |
| Probe 3 | ATACATAGAAGTTGC |
| RNA 1 | UACCCUGUAGAACCGAAAUUGUG |
| RNA 2 | UACCCUGUUAGACCGAAUUUGUG |
| miRNA-10b | UACCCUGUAGAACCGAAUUUGUG |
| miRNA-21 | TAGCTTATCAGACTGATGTTGA |
| miRNA-429 | TAATACTGTCTGGTAAAACCGT |
| Hairpin DNA | TACCCTGTAGAACCGAATTTATACATAGAAGTTGCAAATTCGGTTCTACAGGGTA |
Table 2.
The reagent required for the DSN digestion reaction.
| Reagent | Volume(µL) |
|---|---|
| DSN | 1 |
| Sterile water | 5 |
| Hairpin DNA | 1 |
| miRNA-10b | 2 |
| 10x DSN reactive solution | 1 |
Disclaimer/Publisher’s Note: The statements, opinions and data contained in all publications are solely those of the individual author(s) and contributor(s) and not of MDPI and/or the editor(s). MDPI and/or the editor(s) disclaim responsibility for any injury to people or property resulting from any ideas, methods, instructions or products referred to in the content. |
© 2023 by the authors. Licensee MDPI, Basel, Switzerland. This article is an open access article distributed under the terms and conditions of the Creative Commons Attribution (CC BY) license (http://creativecommons.org/licenses/by/4.0/).
Copyright: This open access article is published under a Creative Commons CC BY 4.0 license, which permit the free download, distribution, and reuse, provided that the author and preprint are cited in any reuse.


