
Submitted:
30 November 2024
Posted:
02 December 2024
You are already at the latest version
Abstract
As urban density increases and cities expand, urban livability decreases, closely linked to social, economic, and environmental crises. To address these negative impacts, Biophilic Urbanism (BU) promotes human-nature interactions and their associated benefits. However, knowledge gaps remain regarding its effectiveness across different scales. This study explores how BU contributes to improving livability in the built environment and renewing urban landscapes. Using Amsterdam as a case study, we first identify biophilic experiences by analyzing them through quantitative, qualitative, and spatial distribution metrics. We then investigate design opportunities to foster biophilia by applying BU tools aimed at enhancing interspecies connections and leveraging ecosystem services. In the form of maps, our findings provide evidence-based insights to benefit from nature in everyday life at both the micro- and macro-scales, along with design solutions to renew urban planning focused on human and environmental wellbeing, involving citizens in spatial transformation and maintenance processes. Finally, we advocate for BU as a holistic model that uses natural capital as a key strategy for making cities more equitable, sustainable, and resilient.
Keywords:
Urban nature
; Urban landscapes
; Biophilic Urbanism
; Biophilic benefits
; Design tools
; Leftover spaces
; Ecosystems services
; Citizen Science
1. Introduction
As urban density increases and cities expand, urban livability decreases, closely linked to social, economic, and environmental crises [1]. Modern indoor lifestyles have led to a progressive disconnect between humans and nature, with consequential adverse impacts on wellbeing [2], increasing the risk of diseases due to exposure to more polluted air [3], and mental disorders [4].
Comparative studies have highlighted significant canopy deficits in many cities worldwide when testing the 3-30-300 rule [5]. This insufficient urban canopy, driven by both anthropization and climate change, exacerbates nature inequity and negatively impacts both humans and cityscapes. In response, cities implement cost-effective interventions, thus perpetuating the unsustainable use of Earth’s resources [6], or invest in Green Urbanism, which promotes a zero-emission city model aimed at reducing ecological impact, rather than prioritizing vegetation for recreational opportunities and landscape quality [7]. Conversely, a biophilic city model places nature at the core of urban planning and management [8], recognizing the importance of experiencing biophilia – the inherent human affiliation with living beings [9] – in everyday life. By integrating nature into the built environment through design [10], Biophilic Urbanism (BU) fosters human-nature connections and their related benefits for physical health [11], mental wellbeing [12], society [13], the environment [14], and the economy [15]. BU is an applied research field that has recently emerged to address the negative impacts of urbanization on livability and climate challenges. Despite scientific evidence from several disciplines substantiate its multiple advantages [16], knowledge gaps remain regarding ways and places to benefit from nature at both the micro- and macro-scales.
As extensive literature have shown, blue-green infrastructures play a crucial role in providing ecosystem services and ensuring better living conditions for all species [16,17]. However, current urban policies underestimate the functional value of natural capital, often reducing it to an aesthetic complement of urban landscapes. This limited perspective not only damages citizens’ quality of life but also undermines each city’s potential to develop climate resilience. Urban policies struggle due to a lack of financial resources and inefficient use of natural ones, resulting in unequal management of city areas, where overestimated spaces driven by green gentrification alternate with leftover spaces. These are informal or underutilized areas, lacking a comprehensive strategy that prioritizes their function [19]. Although approached as fragmented green spaces, they contribute to promoting ecological connectivity, supporting wildlife, preserving biodiversity, and providing recreational areas for residents at both the local and metropolitan scales [19,20,21]. Most common trends in landscape design blend ecological perspectives with socio-cultural dimensions [23], but they primarily focus on bio-regions or territorial systems, neglecting small-scale systems and their dynamics. Limited policies supporting the participatory approaches or community engagement are adopted into the renewal of these spaces, undermining their potential as human-centric environments [24]. The aesthetic marginalization of urban nature, the absence of a unifying vision of the city as a living organism, and limited community engagement in its future developments represent the main deficits in the urban agenda, where BU principles are either excluded or understated.
To address these gaps, we advocate for a holistic approach that uses nature as a key strategy to achieve human and environmental benefits, involving citizens in spatial transformation processes. In pursuit of a paradigm shift in urban policies and practices, we apply BU principles to make cities more equitable, sustainable, and resilient. We aim to answer the following Research Questions (RQs):
RQ1: How can urban nature improve livability in the built environment?
RQ2: How can BU renew urban landscapes, restoring human-nature interactions and enhancing ecosystem services?
The paper is organized as follows. First, we outline the materials and methods used as livability criteria or design tools, following the structure of the related workshop that allowed us to collect firsthand data on the positive effects of biophilia in the urban context (Section 2). Second, we explore biophilic benefits through a real-time experience in a Living Lab setting. Third, we recall these benefits through memories, identify them with specific nature-based settings, and spatially pinpoint them within the Amsterdam case study. From the macro to the micro-scale, we then design leftover spaces by applying BU tools to enhance the benefits of human-nature interactions and leverage ecosystem services (Section 3). Finally, we discuss the results from each session to underline their potential advantages in urban planning, advancing the research field by filling the gaps and inspiring future insights (Section 4 and Section 5).
2. Materials and Methods
2.1. Study Area
The city of Amsterdam was selected as the case study area. The capital of the Netherlands spans approximately 220 km2 [25] and has a rapidly growing population, expected to reach one million residents by 2030 [26]. Although not yet included in the Biophilic City network [27], Amsterdam has great potential to be part of it, thanks to blue-green infrastructure and urban policies. More than 61% of public space in Amsterdam is green, with 39% of gardens consisting of greenery, 15% of the city covered by trees, and 35% of the area covered by waterways [28]. Despite these positive figures, recent studies indicate that the tree canopy in Amsterdam is still far from meeting the 30% canopy cover, a benchmark associated with significant health advantages [5]. This deficiency highlights the need for increased greening initiatives that adhere to higher quantitative and qualitative standards. In compliance with the EU Green New Deal, Amsterdam adopted a new environmental plan to become a climate-neutral city with a circular economy by 2050 [26]. With a special emphasis on natural capital, the new “Amsterdam Green Infrastructure Vision 2050” aims to make the city more livable for people, plants, and animals [29]. This biophilic-oriented plan recognizes the value of urban nature for individual health, social wellbeing, leisure, climate adaptation, and biodiversity. It establishes principles to ensure adequate presence of green spaces, equitable distribution, fair access, and management and conservation through collective effort. Moreover, it expands the existing green systems, providing a series of nature-based solutions to strengthen social, spatial, and ecological connections from the building to the metropolitan scale [30].
2.2. Research Design
This study combines different methods at the macro-to-micro scale, which structured the related 5-step workshop designed to raise awareness of the impact of nature on urban livability, test our approaches in real settings, and collect primary source data (Figure 1). (1) Experience: Adopting an empirical approach, we proposed a real-time experience of biophilia and its related benefits in Living Lab setting. Workshop participants were asked to engage in human-nature interactions using all five senses and to reflect on the positive effects they perceived on themselves, other forms of life, or the surrounding environment. To this end, we distinguished four main dimensions of biophilic benefits: Physical Health, Psychological Wellbeing, Social, and Environmental [16]. Such benefits can be simultaneously experienced in a single biophilic experience and amplified through multisensory interactions with nature [16]. Furthermore, the literature suggests that the positive impact of biophilia is maximized in urban landscapes with higher biodiversity or those encompassing multiple features within the same natural setting, such as blue-green infrastructures, various plant species, and both wet and dry wilderness [31]. To implement the field research, we selected the “Leftover Green Field Lab” in Marineterrein. It is the result of Luo’s project aimed at rehabilitating a neglected green parcel in a public space with minimal interventions, enhancing ecosystem services and fostering interspecies exchanges [32]. Using Living Lab methodology [33], this 250 m2 open-air laboratory serves as a testing ground for finding new ways to incorporate wilderness into the city of Amsterdam [34]. As an outdoor biophilic setting, it stimulates engagement with blue-green infrastructure, native plants, shrubs, trees, grasses, moist soil, earthen mounds, tree trunks, sunlight, shade, and hotspots for animal restoration and feeding (Figure 2). (2) Learn: The aforementioned hands-on activity is part of an overall learning process built on both theory and practice to disseminate biophilic culture. We focused on implementing the concept of ‘biophilic experience’ as a sense-based approach to reconnect humans with nature in the built environment and leverage its multiple advantages for cities and citizens, which can be reiterated afterward. (3) Map: To address RQ1, we applied the same experiential approach shifting from the micro-scale Living Lab to the macro-scale of Amsterdam. We explored biophilia through cognitive-associative processes by inviting attendees to recall memories of similar biophilic experiences and associate each with a single location in the city, how the experience occurred, and the positive effects they derived from it. Once biophilic locations were identified based on specific benefit dimensions, they were quantified, qualified, and mapped across Amsterdam (Figure 1, Figure S1). (4) Design: In response to RQ2, we carried out another practical session based on research by design and a Citizen Science approach (Figure 2). As BU application at the micro-scale, participants were introduced to design tools to revitalize leftover spaces with low-impact ecological interventions intended to enhance human-nature interactions and boost ecosystem services. We opted for a co-design process to overcome the limitations of the traditional user-centered approach [35], encourage proactive community engagement [36], and expand the range of relevant stakeholders [37]. Lessons learned from the previous theoretical and practical steps were planned to inform the Design process. (5) Discuss: Co-design outcomes were presented in a peer-to-peer interactive session, integrating feedback from both experts and non-experts (Figure 2). Building on previous activities, ideas were exchanged on how to maximize biophilic benefits in each design project. Finally, participants were provided with additional training resources to continue their engagement in BU.
2.3. Data Collection and Processing
Data for this study were gathered on three dates (July 3rd, July 12th, and September 20th, 2024), hosted by the Amsterdam Institute for Advanced Metropolitan Solutions (AMS) in Marineterrein. While the workshop structure, agenda, content, timing, and duration remained unchanged, we scheduled it in morning and afternoon sessions at the beginning and end of the same season (summer) to increase participation in terms of the number of participants and the diversity of their backgrounds.
The sampling process targeted a broad audience of residents or individuals living in Amsterdam, including both academic participants (students, scholars, lecturers, etc.) and non-academic groups (stakeholders, community members, citizens, etc.).
The dissemination campaign was conducted from May to September 2024 through physical and digital platforms. The related call was published on the dedicated webpage of the AMS website and spread via the official channels of the three main institutional partners supporting the research (TUD, AMS, WUR). Personal and public networks of the research team were also leveraged for this purpose. Paper flyers and posters were displayed at on-campus institutional facilities (TUD, AMS, WUR). Personal invitations were sent via email to urban designers, ecologists, architects, environmental scientists, and representatives of the City of Amsterdam (Gemeente Amsterdam). In addition, we reached out to citizens through local community platforms (e.g., Marineterrein). The call content included general information about the event (title, dates, location, etc.), details about the research project, including its structure, topic, goal, team, participating institutions, and a QR code for online registration via Google Form, which offered the option to select dates and time preferences.
The workshop was held in English. Participants were provided with a paper informed consent form. In addition to content similar to the call, the consent form addressed the voluntary nature of attendance, permission for data and image usage, data processing, protection measures, and data storage. The form complied with official models approved by the ethical boards of TUD and WUR. The dataset was stored on primary storage platforms provided by TUD for secure project data storage.
Data collection stemmed from the main workshop steps: Experience, Map, Design, and Discuss. Feedback from the last two sessions was jointly gathered and processed.
2.3.1. Experience Dataset
Data from participants’ real-time biophilic experiences in the ‘Leftover Green Field Lab’ were collected as individual feedback. Each participant was free to explore, interact with, and connect to the nature-based setting and its living elements, using their senses to perceive the resulting benefits within a 20-minute time frame (Figure 2). At the end, participants summarized their experience in a single keyword reflecting the most impactful feature or effect, which was shared in a common roundtable discussion.
Data was recorded as digital notes and processed using an integrated quantitative and qualitative approach. First, each keyword was categorized into the four biophilic benefit dimensions (Table S2). Then, a word frequency analysis was conducted to identify the predominant benefit dimension and its respective percentage value.
2.3.2. Biophilic Experience Cards (BEC) Dataset
To map individual biophilic experiences across Amsterdam, we gathered data by completing Biophilic Experience Cards (BEC) during a 30-minute map session (Figure 2). BECs are part of the supporting materials provided along with a demo before the Map session begins (Figure S1, Table S1). Different BEC were distributed to participants, with each card associated with one of the four biophilic benefit dimensions and identifiable by color: Physical Health (orange), Psychological Wellbeing (yellow), Social (blue), and Environmental (green). Before selecting a BEC to complete, participants are asked to recall a previous biophilic experience anywhere in Amsterdam, focusing on the benefit gained from it (Figure 1, Figure S1). Once the benefit was identified within the four dimensions according to the biophilic experience framework provided (Table S1), participants chose the corresponding colored BEC to fill out on the back. The biophilic experience framework is based on benefit-oriented literature [16]. The BEC back was designed with a fixed layout, including three sections (Where, What, How) to detail the individual biophilic experience (Figure S1). Each section is headed by a question: (a) Where did you experience biophilic benefits? (b) What kind of nature did you experience? (c) How did you experience biophilic benefits? (a) The first section requires specifying the location within Amsterdam (street, district, or city area), the setting (indoor or outdoor), and its relevant scale, flagging one of the following options: building, street, neighborhood, or city. (b) The second section refers to cityscape categories and features. Based on the predominant component, we distinguish four types of cityscape categories: Greenscape, where vegetation is predominant; Landscape, including non-green elements of the urban environment associated with the sky; Waterscape, related to blue infrastructure and water-based elements in the city; and Living Beings, encompassing people and animals. To identify the specific cityscape feature, participants can draw inspiration from sub-table (2) included in the biophilic experience framework (Table S1), which lists and groups features under the four cityscape categories. This classification results from the synthesis of several biophilic literature sources [38,39,40]. (c) To describe how the biophilic experience was implemented, participants indicate one or more senses involved and the way they experienced nature in the city by selecting one option from those listed in sub-table (3) of the biophilic experience framework (Table S1). These options are grouped into physical activities and psychological/cultural/social activities, as mentioned in the relevant literature [10,40,42]. A final comment is required to provide additional details on the benefit gained. Each participant was required to complete a minimum of three BECs, preferably including cards from different benefit dimensions, although groups encompassing the same BEC type were also permitted. To make the individual mapping activity more interactive, participants were invited to pin each completed BEC onto a board displaying a large map of Amsterdam (A1 format). This paper-based map provided a preliminary overview of the results by the end of the session.
In order to process the BEC dataset, we first digitized the paper-based cards and classified them by benefit dimension. The data was then analyzed using a 3-metric research approach that focused on quantity, quality, and spatial distribution. Building on the BEC layout, we began by identifying and quantifying the locations. Next, we screened each data point according to the three main content groups (Where, What, How). We then qualified the data by categorizing it based on locations, setting and scale (Where), cityscape category and feature (What), and sense, experience, and benefit (How). Finally, we mapped each location to visualize its spatial distribution across the city, its potential positional relationships with other locations, and the predominant benefit dimension associated with each. Although all data were equally explored (Table S3), we considered only the locations mentioned at least twice on the cards as the most significant results. Nevertheless, all locations identified by workshop participants were geolocated across Amsterdam to develop a benefit-oriented biophilic map of the city.
2.3.3. Design and Discuss Dataset
The Design process was structured in a 45-minute session. To foster co-creation and community engagement, we divided the participants into work teams, with an average of three members per group. Although the group composition was spontaneous, we ensured that each group included participants with varying levels of expertise, allowing each member to meaningfully contribute to the design outcomes according to their own pace, interests, and strengths (Figure 2). During this phase, we acted as advisors, providing information and practical tools to facilitate the work.
Before starting the co-design process, we gave a brief introduction by presenting the micro-scale study area, its location within the city (Bijlmermeer district, Amsterdam South), its geometric features (a rectangular lot bordered by drivable roads and a bike path, 6400 m2), territorial characteristics (flat terrain), strengths (grass, trees along the southern edge, an active local community), and weaknesses (vacant since 2015, with soil partially contaminated due to previous parking use). This case study area represents a typical underutilized green space, temporarily unused due to ongoing urban transformation. We also provided theoretical insights to clarify key concepts (leftover spaces) and their contextualization, instructions to smoothly address the co-design process, and supporting materials for drawing (maps, tracing paper, pre-filled sheets, markers, etc.), including an essential Design Toolbox to promote meaningful human-nature interactions within wilder areas. This toolbox consists of six design tools merging landscape architecture and BU, aiming to bridge the perceptual gap between structured spaces and leftover areas, enhance place perception, and integrate wilderness into urban environments. The design tools are divided into two stages: Invitation Stage – designed to overcome perception biases and introduce people to the urban wilderness; Interaction Stage – encourages creativity and deeper engagement with the space (Figure S2). The Invitation Stage includes three design tools: 1) Center and Enclosure: This tool defines the space by contrasting a central focal point with clear boundaries [43], helping visitors perceive the intended meaning and unique identity of the place. 2) Transition: It guides people through a sequence of spaces, marked by gates or entry points, supporting the shift from familiar surroundings to new and immersive interior sites [44]. 3) Landmark: it refers to symbolic elements that help capture interest, stimulate curiosity, orient visitors, and connect them with the place through deeper and more memorable experiences [45]. The Interaction Stage also contains three design tools: 4) Diverse Habitat Conditions: Built on Gilles Clément’s Third Landscape concept [46], this tool highlights the importance of biodiversity in sustaining flora and fauna [47], refining spatial perceptions [48], and promoting learning through natural ecosystem dynamics. 5) Appropriation: This refers to flexible-use facilities that encourage human-place interactions, allowing for customization and fostering personal connections, which deepen the sense of belonging [49]. 6) Cue for Care: Indicators of care actions, these visual signs foster a sense of shared stewardship and add cultural and ecological value to urban wilderness, inspiring visitors’ appreciation and respect [50].
The Design dataset was examined through a multi-step, systematic data processing framework driven by qualitative research. (1) Digitalization and Organization: The analysis began by digitizing all design sheets — one or two per work group — and uploading them into ATLAS.ti (version 24), a qualitative data analysis software primarily used for processing written interviews or literature research [51]. We employed Atlas.ti to facilitate data management through coding and categorization. (2) Initial Coding: We developed a codebook based on BU and landscape design principles. The codes represent core aspects of BU (biophilic benefit dimensions, biophilic categories and features, biophilic experiences; Table S1) and the Design Toolbox (Figure S2). (3) Refined Coding: We analyzed the data using qualitative content analysis to capture participants’ outputs. Through iterative refinement, we ensured the codes accurately represented their experiences, design preferences, and perceptual insights, aligning the code structure with the research objectives. (4) Thematic Coding: The resulting codes were organized into three overarching thematic classes of BU tools: features (covering biophilic cityscape categories; Table S1), benefits (encompassing the four benefit dimensions; Table S1), and design tools (including the six Toolbox elements; Figure S2). To ensure the reliability and validity of the analysis, we conducted independent coding and regular debriefing sessions. These sessions addressed potential biases, clarified coding decisions, and aligned interpretations, thus enhancing the robustness of the thematic findings (Table S4).
After qualifying and coding the Design dataset, we quantitatively evaluated the resulting outputs. Specifically, we assessed the application of design tools based on their frequency of occurrence in each team’s projects (Table 2). We performed a frequency analysis by counting thematic quotations related to features, benefits, and design tools (Table 3, Table S5). Lastly, we estimated their reciprocal correlation using co-occurrence analysis (Table 3).
Feedback from the Discuss session was collected as additional notes. This data, including project concepts, suggestions, and reflections on nature values, ecosystem services, and BU principles, complemented the Design dataset and helped establish mutual correlations between the main operative sessions (Explore, Map, Design). The Discuss dataset was processed according to qualitative and associative criteria. First, raw notes were digitalized, filtered for irrelevant or unessential terms, and organized by work team. Second, the data was categorized within a literature-based framework. Built on biophilic literature that guided the Experience and Map sessions (Table S1) [10,16,38,39,40,42], this framework includes categories derived from prior research, participants’ reflections, and implementation challenges. Lastly, the categorized data was synthesized to highlight recurring themes and patterns. This synthesis enabled us to identify key factors, limitations, and practical recommendations for advancing BU.
3. Results
3.1. Workshop Participants
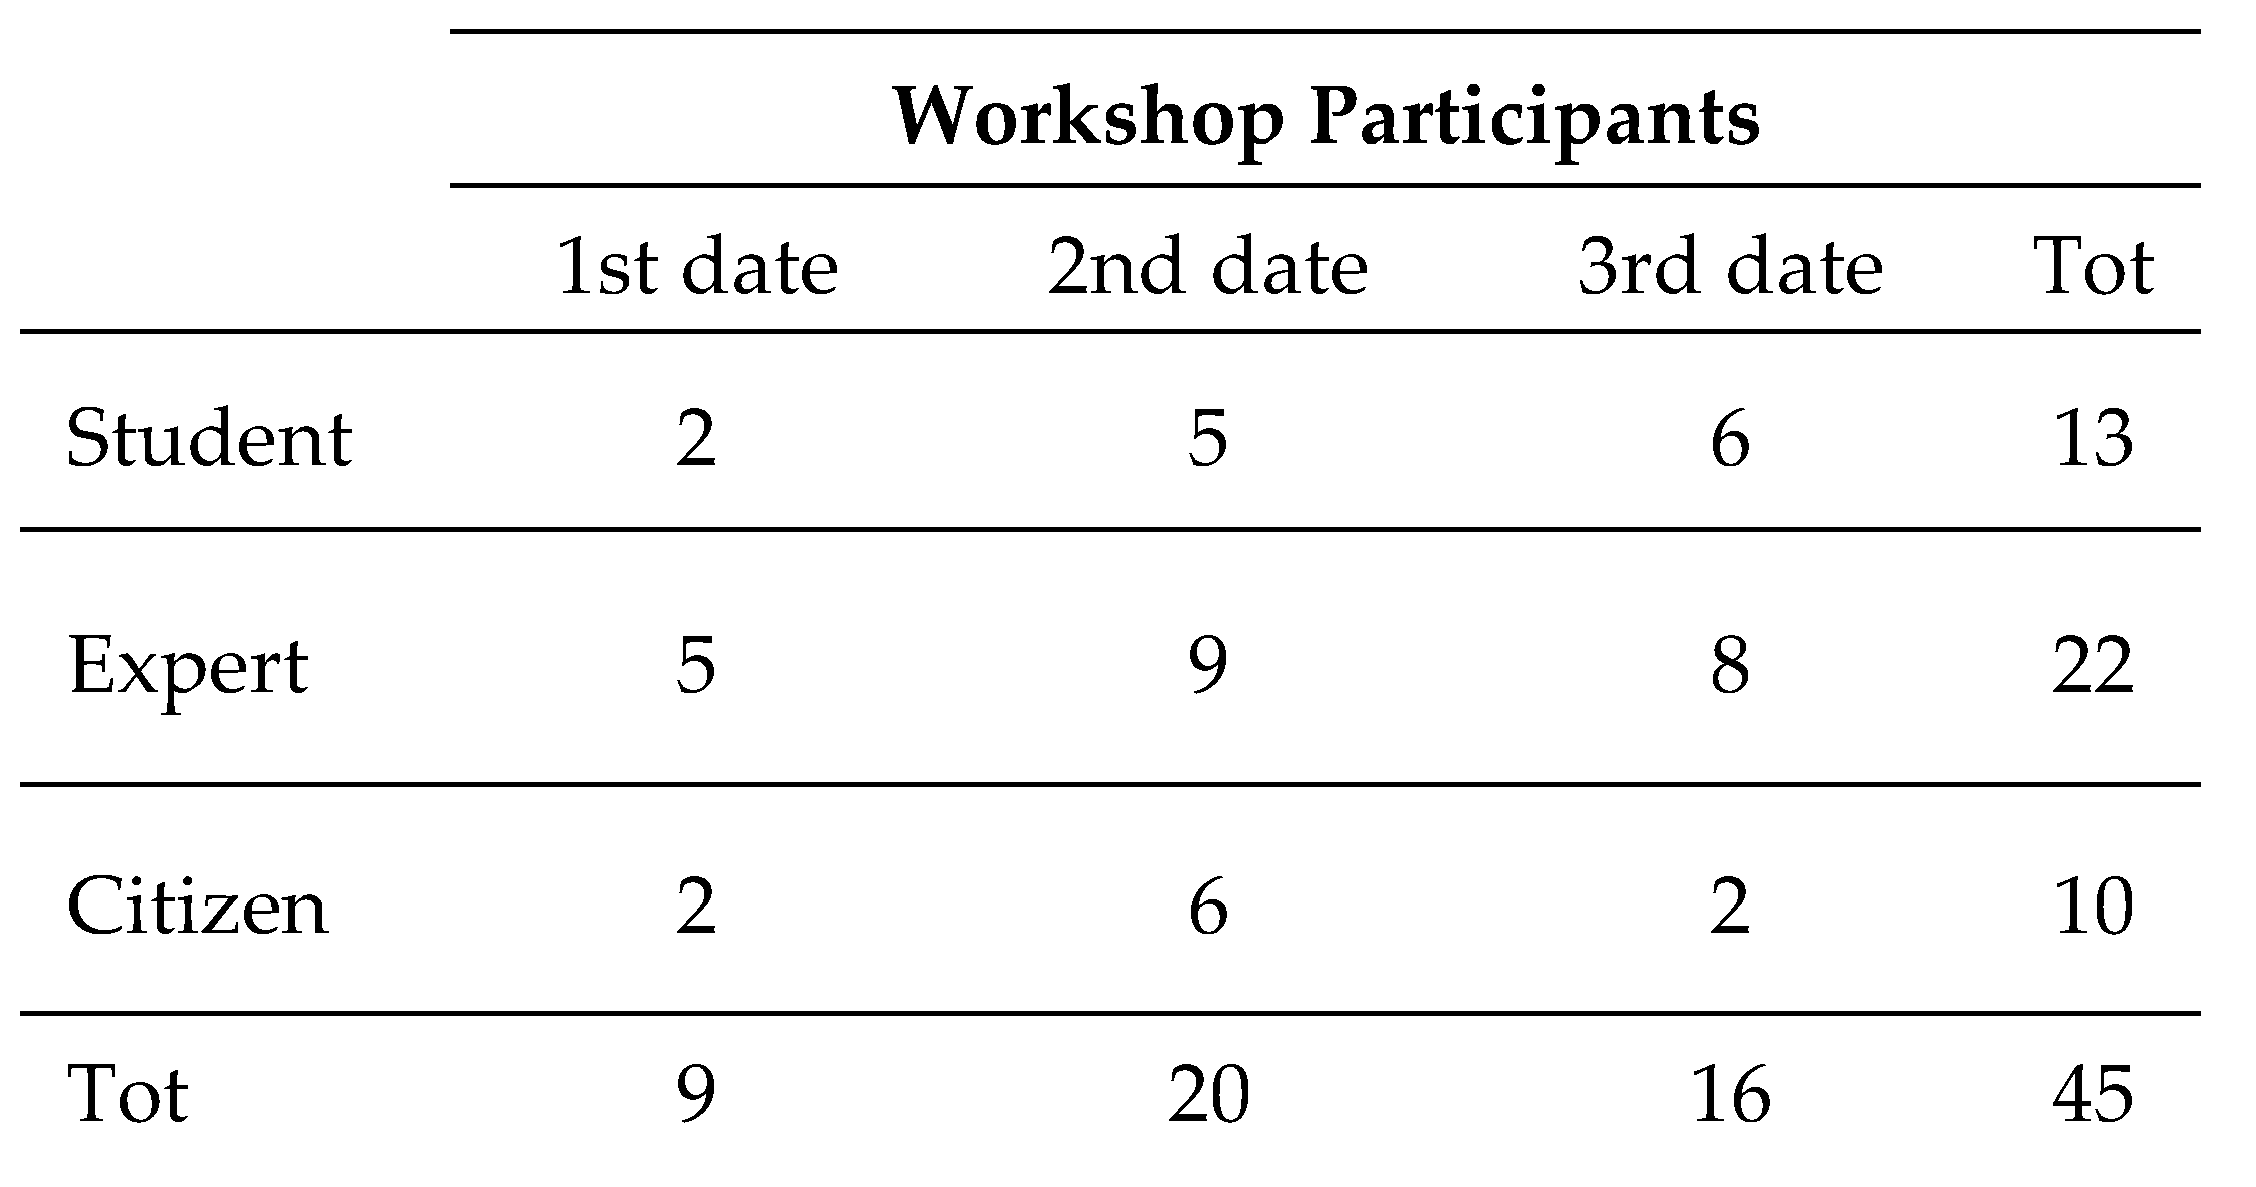
Despite receiving over 80 registrations for the workshop, the actual participants totaled 45 across the three scheduled dates. Based on their background and expertise, we distinguished them into three groups: Bachelor’s or Master’s students and professionals with knowledge in relevant disciplines (Architecture, Urban Design and Planning, Landscape Design, Urban Studies, Environmental Science, Biobased Sciences, Plant Science, Social Science), and citizens, including members of local communities engaged in urban issues. This distinction helped guide the formation of mixed work teams during the Design session. An overview of the workshop participants is presented in Table 1 below.
3.2. Biophilia in one Word
As shown in Figure 3, results from the biophilia experience in a real Living Lab setting showcase a notable predominance of Psychological Wellbeing (42%) among the four benefit dimensions, followed equally by Social and Environmental benefits (22% each), and lastly by Physical Health (14%).
Referring to specific benefit within each dimension (Table S1), keywords suggest that Psychological Wellbeing is associated with mental restoration (rest, relax), emotional recovery inspired by positive feelings (joy, peace, freedom), and attachment to place (natural colors, connection, pride). Social benefits are recognized through interpersonal interactions (caress, affection), membership (community bonds, art as a bridge), proactivity (engagement), and civic sense (permission, social norms). Environmental benefits are identified through natural elements or indicators (birds, insects, plants), natural dynamics (wild, organic, contrasting), biodiversity (vertical growth), and resilience (ecological balance). Finally, Physical Health is defined in terms of bodily wellbeing (health), sensory interaction (tactile, touching), and spatial appreciation (big space, spaciousness). A complete list of experience keywords can be found in the Supplementary Materials (Table S2).
3.3. Biophilic Amsterdam
Before understanding how urban livability can benefit from nature exposure, we must first determine which types of nature fulfill this role and where they can be found within the cityscape. These are exactly the contents of the BEC, which help us answer RQ1. To this end, a total of 152 cards were collected from participants across the three workshop dates, categorized by benefit dimension as follows: 52 Psychological Wellbeing, 37 Social, 35 Physical Health, and 28 Environmental (Table S3).
To localize biophilic experiences, participants identified up to 53 different biophilic settings, 17 of which were mentioned more than once, with the number of mentions ranging from 2 to 16, and the same site being associated with multiple benefits. Figure 4 shows the most biophilic settings identified across Amsterdam, ranked by preference and correlated to benefit dimensions. These include public parks, gardens, and well-known districts with city relevance. The most popular location is Westerpark, connected to the Social dimension as the predominant benefit experienced there, followed by Vondelpark (Psychological Wellbeing), Marineterrein (Physical Health), and Hortus Botanicus (Environmental). Four locations (Westerpark, Vondelpark, Marineterrein, Oosterpark) are linked to all four biophilic experience dimensions. Only 4 out of 152 biophilic experiences are tied to indoor settings. In terms of urban scale, most outdoor settings are correlated with the city (68%), followed by the neighborhood (19%), street (7%), and building (6%). Defining the type of nature experienced, the most cited cityscape category is Greenscape with 112 entries, followed by Living Beings with 44 mentions. Contrary to expectations, the Landscape category received the lowest share (30), despite being the most widespread concept and encompassing many elements of the urban scenario, including non-green or dry landscapes and the sky. With reference to specific biophilic features within each cityscape category, Greenscape is primarily recognized in the form of urban forests, parks, plants, and flowers. Under the Landscape category, the most appreciated feature is the natural landscape itself and the associated views or panoramas it offers, while water is the most prevalent feature within the Waterscape. As for interactions with Living Beings, a fundamental aspect of biophilic experiences, participants reported more interactions with people than with animals. As for interactions with Living Beings, a fundamental aspect of biophilic experiences, participants reported more interactions with people than with animals. Regarding the way of experience benefit from nature, vision is the sense more utilized sense (144 cites), followed by touch (66), while taste appears only 5 times. However, it is noteworthy that vision is almost always associated with other senses: the majority of documented experiences (64%) were multisensory activities, predominantly generating Social benefits and Psychological Wellbeing. Among these multisensory experiences, 87% are related to Greenscape.
Figure 5 illustrates the top ten ranked biophilic locations in order of preference, detailing the individual biophilic experiences conducted across Amsterdam and the benefit gained, as part of the provided biophilic experience framework (Table S1). Among the experiences mentioned in the entire sample, we highlighted the most recurring one within each benefit dimension. This allowed us to find the direct correlation between the most biophilic ‘experience-benefit-dimension.’ Based on this, Physical Health, specifically physical wellness, is primarily gained through workouts. Psychological Wellbeing is mainly the result of mental recovery experienced through an emotional connection with nature and place. Social benefit is linked to people-to-people interactions that occur during time spent outdoors, most often in public parks. Lastly, the Environmental benefit, expressed through nature-based cognition, offers a dual benefit for both humans and the environment: it helps humans understand nature through ecosystem services and biodiversity, thus fostering ecological awareness aimed at preserving them.
Figure 6 visualizes the results of the BEC data processing via spatial distribution. This biophilic map of Amsterdam provides an overview of all the benefit-driven locations identified by the workshop participants. It includes 53 sites at different scales, mostly concentrated in the city center. Each site is color-coded to represent the predominant benefit dimension it is associated with. The map displays the biophilic locations based on a frequency criterion, with Psychological Wellbeing being the most prevalent (21), followed by Social Benefits (14), Physical Health (10), and Environmental Benefits (8). However, if we consider surface area, the Social benefit dimension becomes the most relevant.
3.4. BU Tools: Application and Correlation
Based on the total number of participants divided into work teams, the Design session data resulted in 14 project entries. Our findings are organized into three groups, focusing on elements or strategies under BU (features, benefits, design tools) to be employed in urban design to foster human-nature interactions and elevate ecological values. First, we focus on design tools and their application in team’s projects as part of a theory-practice learning process aimed at demonstrating the impact of the newly delivered content, regardless of participants’ backgrounds. Second, we present the thematic coding results, expressed as the frequency of quotations for features, benefits, and design tools. In this case, we merged the Psychological and Social benefit dimensions, as they are treated as a single dimension within the framework of ways of experiencing nature in the city (Table S1). Finally, we explore the code co-occurrence between the three.
- Design Tools Application. On average, each team project incorporates most of the design tools suggested (Toolbox, Figure S2), with only four out of 14 projects utilizing all six design tools. Transition is the most frequently used tool, appearing in 13 out of 14 project entries. Center and Enclosure and Diverse Habitat Conditions also appear multiple times, each being used four times. Cue for Care is the least used tool, absent in seven out of 14 entries (Table 2). The analysis of the projects highlights how these design tools can enhance biophilic experiences in urban green spaces. While all six design tools were applied, some — particularly Appropriation, Cue for Care, and Diverse Habitat Conditions — were only partially employed in several entries. Diverse Habitat Conditions aims to sustain non-human life, while Appropriation and Cue for Care are designed to serve diverse social groups. This suggests a lack of alignment between the goals of supporting non-human life and accommodating human use when applying BU to renew leftover green spaces.
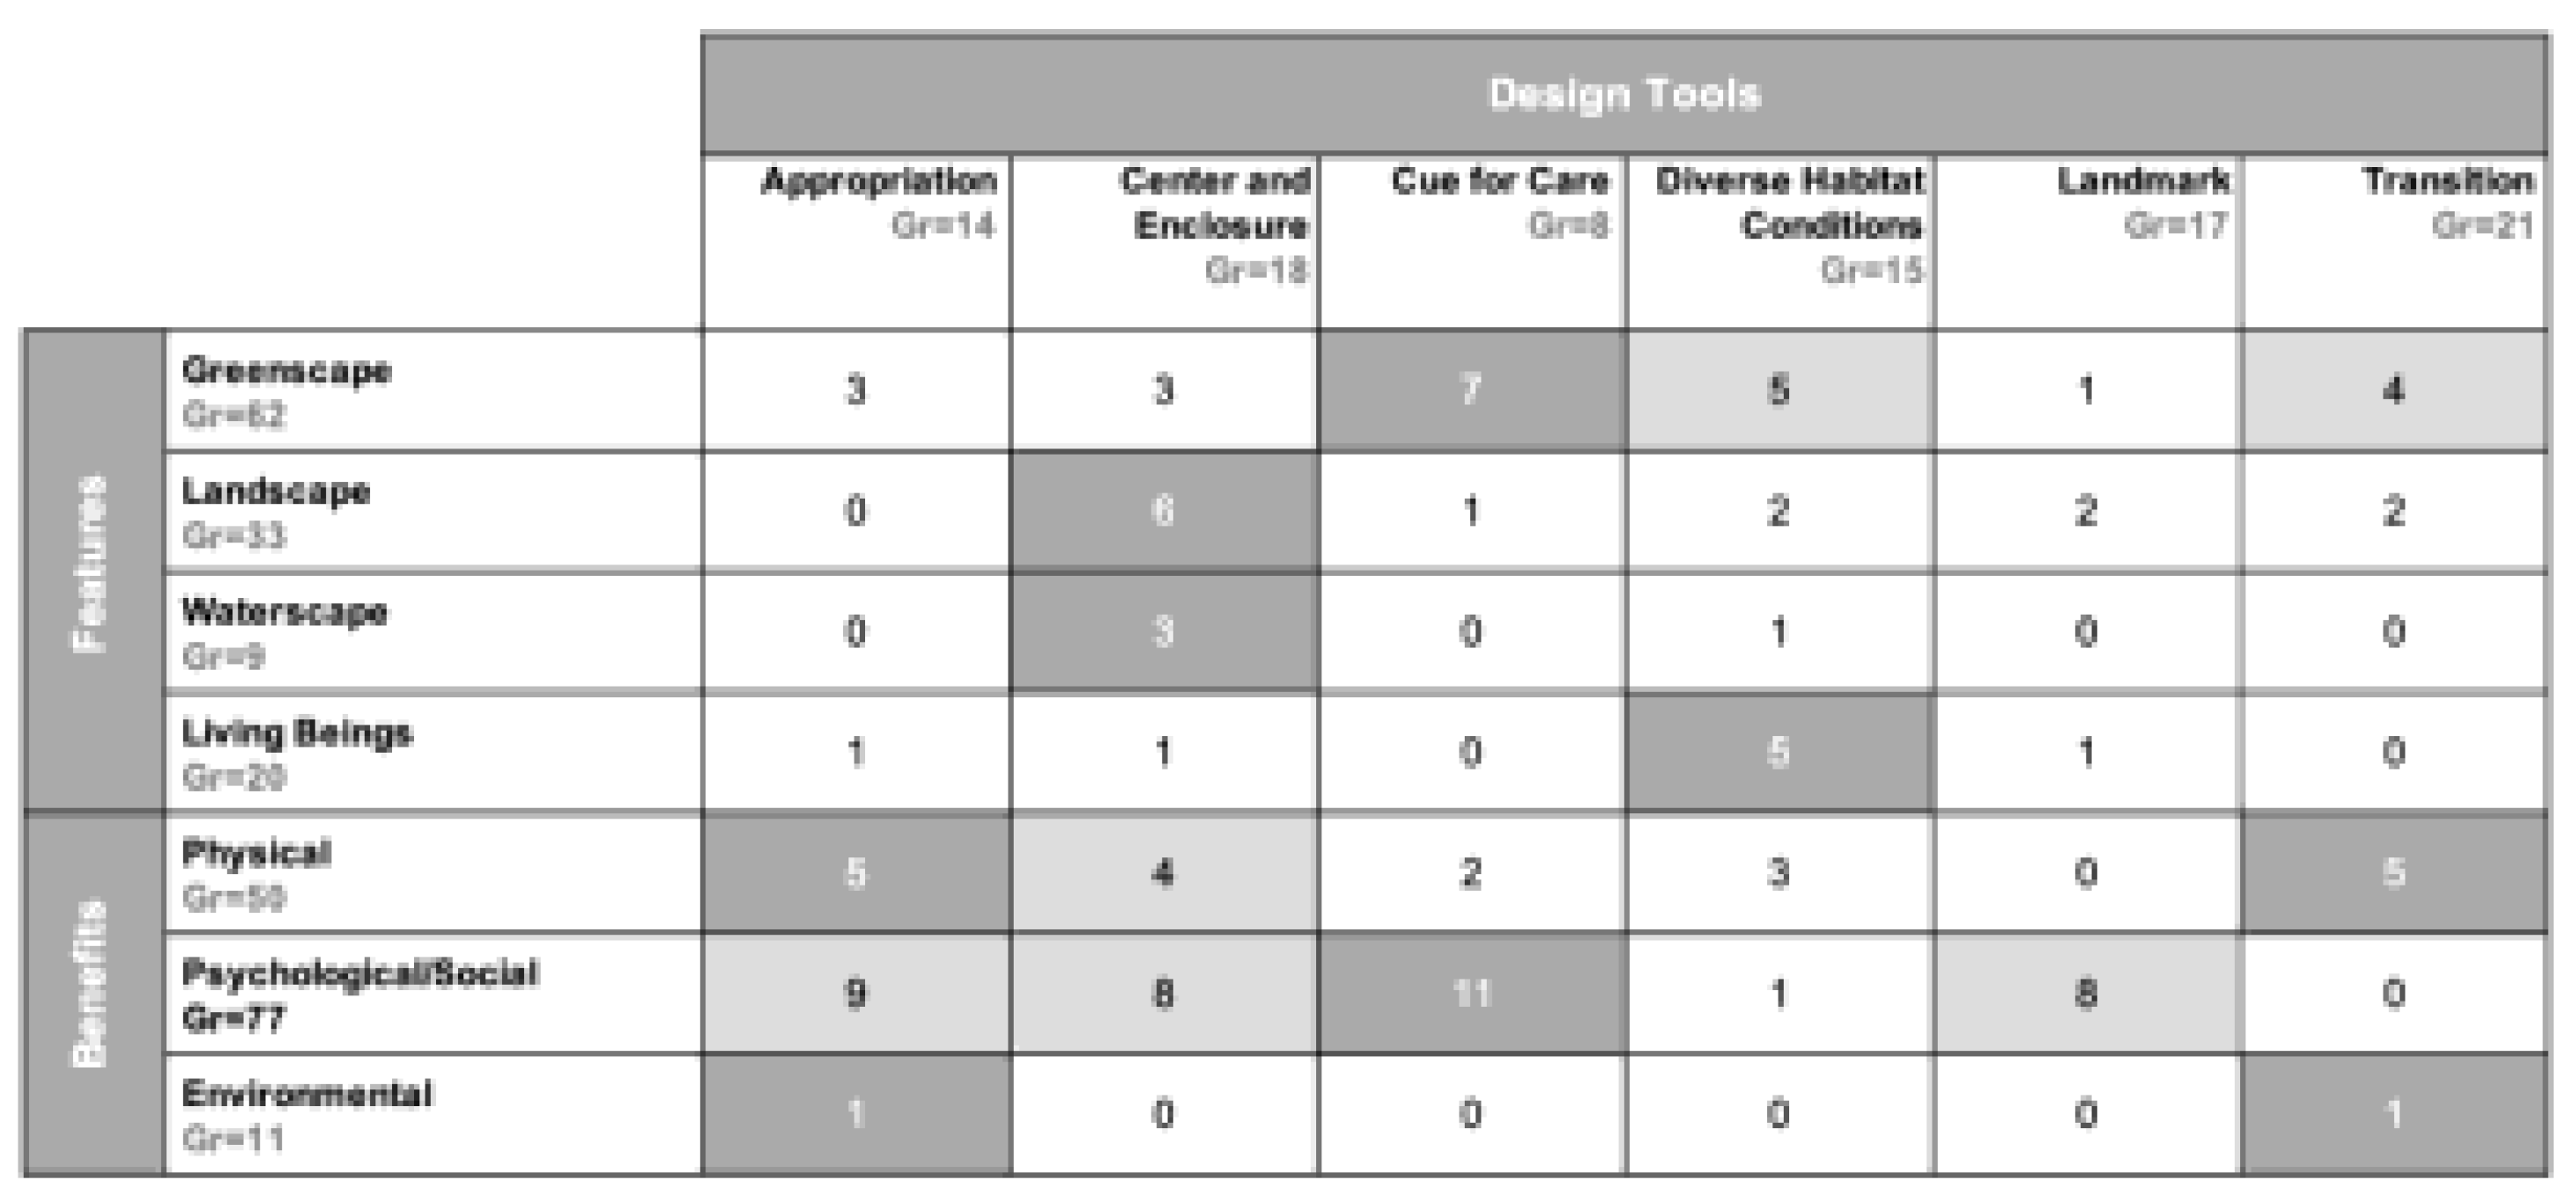
- Thematic Coding Quotation. The coding results reveal variation in the use of the six design tools across all 14 design entries. Among these, Transition is the most frequently applied tool, with 21 mentions, followed by Center and Enclosure (18) and Landmark (17). Diverse Habitat Conditions (15) and Appropriation (14) were also commonly used. The least used tool is Cue for Care, which appeared in only 8 quotations (Table S5). Among features, Greenspace was the most frequently addressed, with 62 quotations, followed by Landscape (33) and Living Beings (20). Waterscape was the least discussed feature, appearing in only 9 quotations. Regarding benefit dimension, Physical benefits were identified in 50 quotations across all project entries, while Psychological and Social benefits appeared more frequently, with 77 quotations. Environmental benefits were the least quoted biophilic dimension, with only 11 mentions (Table 3).
- Co-occurrence Analysis. Table 3 shows a strong correlation between features and design tools. Notably, Greenspace strongly co-occurs with design tools such as Cue for Care, Diverse Habitat Conditions, and Transition. Additionally, Landscape and Waterscape are more correlated with the design tool of Center and Enclosure. Living Beings show a notable correspondence only with Diverse Habitat Conditions. By matching benefits and design tools, we note an equal association between Physical benefits and the Appropriation and Transition tools. However, Psychological and Social benefits show a stronger co-occurrence with four design tools: Appropriation, Center and Enclosure, Cue for Care, and Landmark.

Table 2.
Results from Design Tools Application (ATLAS.ti): BU tools utilized in the co-design session and applied in each team’s project (Design_#). The frequency occurrence values are highlighted in gray.
Table 2.
Results from Design Tools Application (ATLAS.ti): BU tools utilized in the co-design session and applied in each team’s project (Design_#). The frequency occurrence values are highlighted in gray.
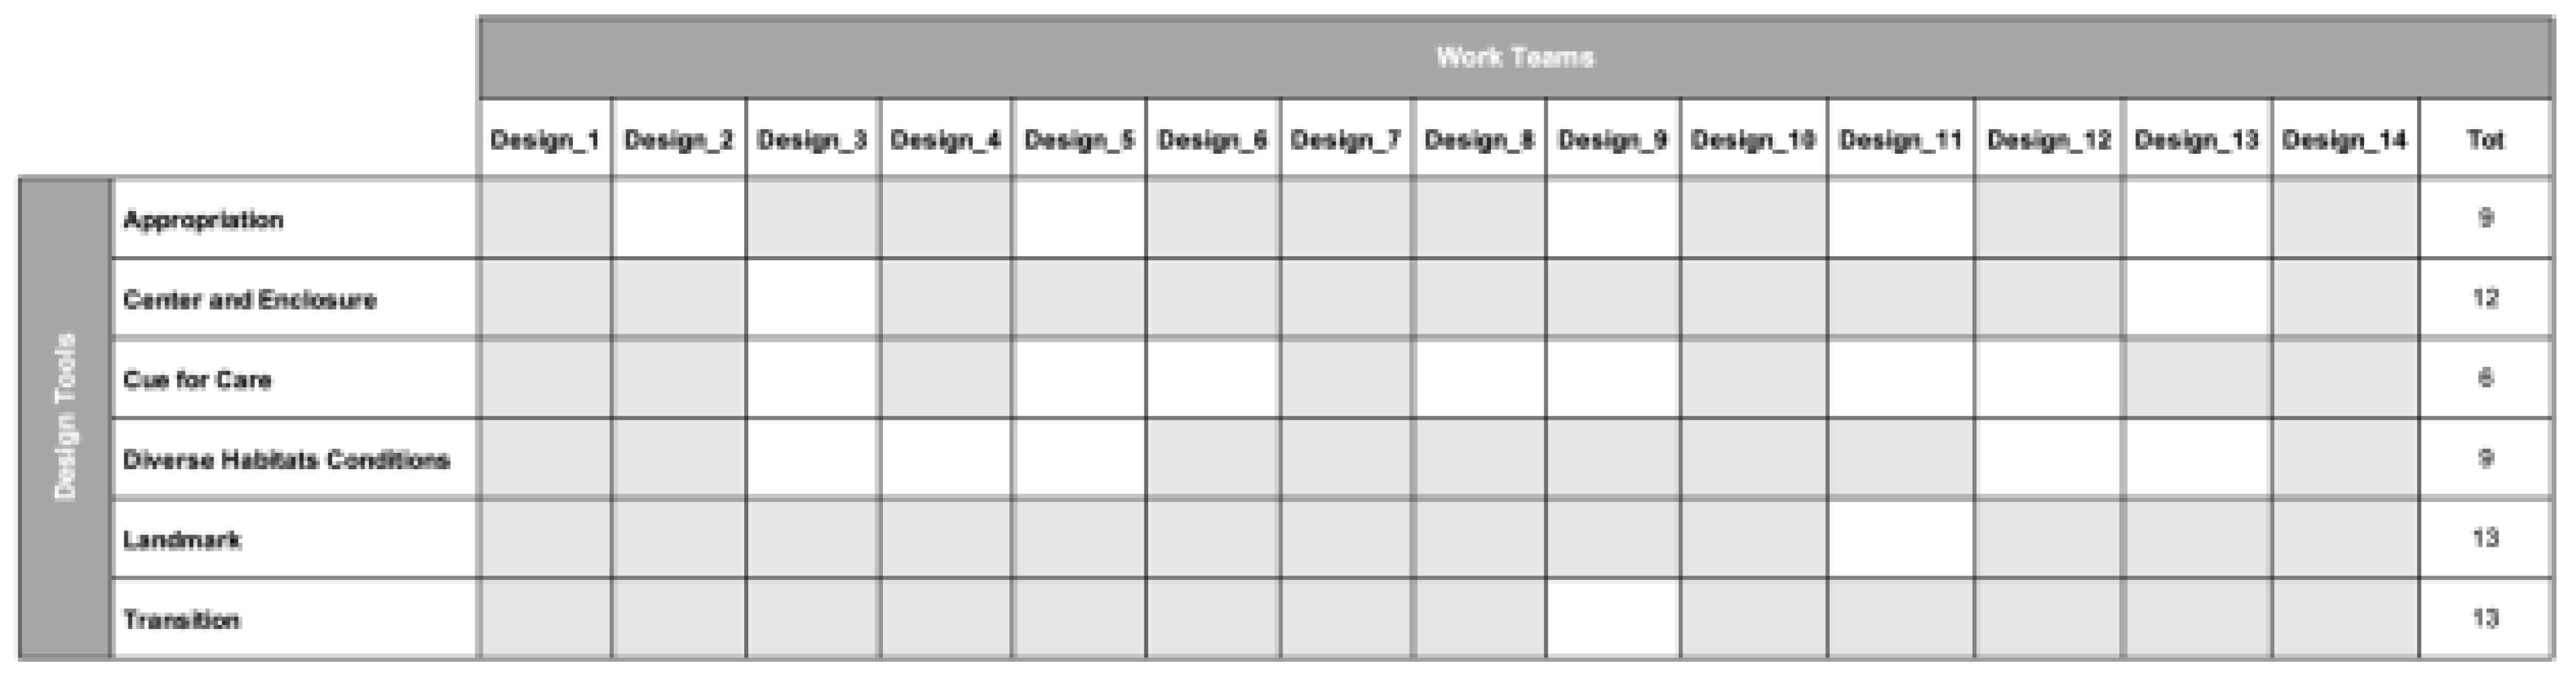
Table 3.
Outputs from co-occurrence analysis (ATLAS.ti), matching the six design tools (Figure S2) implemented in each team’s project with biophilic features and benefits (Table S1). The most significant values are highlighted in gray (Gr = Groundedness of a Code (number of quotations coded by a code).
4. Discussion
This study aims to explore the role of BU in renewing urban planning by using nature as an ecological, economic, and sustainable strategy. Although scientific literature offers extensive evidence of the multiple advantages of integrating nature into the built environment [10,16], we question the actual potential of BU to positively impact livability at different scales and its applicability in regenerating urban landscapes by ensuring both human and environmental thriving.
As prior studies have shown, experiencing nature in the city brings benefits across various domains [16]. Using an experience-based approach, we demonstrate that BU provides clear pathways to enhance urban livability. Specifically, our knowledge and graphic tools help identify where and how to achieve biophilic benefits in everyday life. Focusing on site, our findings suggest that the majority of biophilic experiences occur in outdoor settings, primarily well-known locations such as public parks or gardens, where Greenscape is dominant. Conversely, domestic spaces at the building scale are not recognized as the easiest and most accessible or effective settings for enjoying exposure to nature, either directly or indirectly. This emphasizes the importance of public green spaces as primary locations for fostering human-nature interactions. Additionally, the underrepresentation of indoor and street-scale biophilic settings reflects current limitations in public perception, indicates that biophilic culture is not yet widely recognized, and stresses the lack or limited presence of nature-based solutions in smaller, living spaces such as homes and streetscapes. To fill this gap, our benefit-driven map displays up to 53 biophilic locations across Amsterdam. It helps overcome nature inequity and its negative impacts by inspiring virtuous mobility trajectories to achieve greater benefits, even beyond one’s own neighborhood if it does not offer such opportunities [5]. Despite previous studies indicating an insufficient urban canopy in Amsterdam [5], our results show that within the highly appreciated cityscape category of Greenscape, urban forests are the most positively impactful green feature, primarily associated with Psychological Wellbeing, followed equally by Physical and Environmental benefits. Our quantitative, qualitative, and spatial results demonstrate that Amsterdam is a biophilic city, as confirmed by the special ‘site-experience-benefit’ perspective adopted. Its natural resources, along with ongoing urban policies aimed at climate neutrality, make it a viable candidate for inclusion in the Biophilic City network [27]. Encouraging multisensory human-nature interactions, given their most beneficial effects, our biophilic experience framework provides a wide range of nature-based solutions, features, experiences, and four-dimensional benefits to enhance urban livability at different scales. Regarding the site-benefit pairing, we found a strong correlation between public green spaces — the highest-ranked biophilic locations — and the short-term benefits associated with them. The most observed benefits, pertaining to Psychological Wellbeing, Physical Health, and Social dimensions, are easily perceivable and measurable. Conversely, Environmental benefits — the least ranked — have direct effects on space and indirect effects on humans, requiring more time to be fully appreciated. This may limit BU’s integration in urban planning, as stakeholders prioritize short-term, measurable outcomes [16]. During the workshop, three cross-scale biophilic experiences were proposed, each validating the efficiency of BU in different ways and locations
Through real-time field experience in a Living Lab at the micro-scale, positive effects on Psychological Wellbeing were noted as one-word immediate feedback. Shifting to the macro-scale, BEC completion broadened the perspective, while ‘contemplating a memory of a previous experience with nature’ served as a biophilic experience itself, generating specific benefits such as memory, positive mood, and emotional connection within the Psychological Wellbeing dimension. Returning to the micro-scale with the co-design process, participants experienced positive effects from BU while playing roles as urban planners or city-makers. This session also included diverse biophilic activities (nature training and research, ecological values, nature engagement, and resilient behaviors) as outlined in our biophilic experience framework (Table S1). Findings from each session demonstrate the cross-scale effectiveness of BU, providing a narrative that links macro-level urban planning with micro-level design interventions, and large-scale memories of experience with small-scale lived experiences. This also supports BU’s application in urban planning, addressing the current mismatch between urban policies and biophilic principles.
While traditional approaches in urban planning reveal significant limitations in valuing nature [7], our results from the Design session prove that such a gap can be bridged by BU. Specifically, the design tools application indicates that participants quickly and easily acquired new knowledge and were able to apply it in practice. Although participants initially struggled to identify Environmental benefits in the Experience and Map sessions, they actively engaged with this benefit dimension and explored ways to enhance it using appropriate features and criteria during the Design session. In this context, Greenscape emerges as the key element across all workshop sessions. It not only corresponds to higher rates in sites, experiences, and benefits but is also the most utilized design tool, even when designing urban green spaces with a high degree of wildness. This proves that nature, particularly vegetation and urban forests, is not antithetical to urban development but essential, as advocated by BU. While the high co-occurrence between Greenscape — as a biophilic feature —, Cue for Care, and Diverse Habitat Conditions was predictable, it is remarkable that the same correlation is absent in relation to the Environmental benefit dimension. In contrast, there is a significant co-occurrence between such design tools and Psychological and Social benefits. This suggests that design interventions may improve the social and cultural aspects of the biophilic experience.
Unlike most research focusing on large, prominent urban projects, we used leftover spaces as a micro-scale case study to value their urban, social, and ecological potential. This approach allowed participants to appreciate natural capital, even in its neglected forms, and apply BU tools to augment biophilic experiences, foster meaningful human-nature interactions, and enhance ecosystem services across all their ecological functions (supporting, provisioning, regulating, and cultural). Furthermore, focusing on leftover spaces enabled us to challenge the aesthetic marginalization of urban nature and its partial or profit-driven misuse [7], while empowering nature-based solutions to play a more functional role in planning and advancing a more organic vision of the city as a life-like process. Built on BU, our benefit-oriented design toolkit boosts human livability, uses ecosystem services as tools, and incorporates community engagement. As BU is still a recent research field, particularly as an applied science, it presents many knowledge and application gaps [8]. While the Map outputs reveal that biophilic culture is not widely known or implemented, outcomes from the Discuss session highlight a strong interest in raising citizens’ awareness of nature and its multiple beneficial effects on urban life. To achieve this, we combined empirical, practical, and theoretical approaches. Resulting from the mutual influences between the workshop sessions, our findings contribute to fostering an ongoing learning process that is crucial for promoting biophilic culture and lifestyles.
Despite advancements in the research field, this study has limitations. The number of workshop participants, their backgrounds, and the uneven distribution of expertise among groups may have influenced the results. As we employed an empirical approach, sample size was a key factor. While the total number of feedback entries was consistent, the number of unique biophilic locations identified across Amsterdam was relatively low, mainly due to data repetition and overlap. Additionally, there were very few entries for indoor settings or for both building and street scales. While efforts were made to extend participation opportunities, variations in workshop timing, weather, and seasons could have affected data collection and findings. In particular, the Experience session — planned as a real-time activity — could have been influenced by the time of day, with participants’ perceptions and experiences varying between morning and afternoon sessions due to differences in light, weather, or the growth stages of nature between the first and last workshop dates. Nevertheless, these variations are part of the biophilic experience itself, as it is rooted in life-like processes. When identifying the benefits of applying BU tools in the Design session, the assessment relied on subjective judgment, reflecting the author’s expertise in the field. There is a possibility that some benefits may have been misjudged or overestimated. A focused group discussion with workshop participants regarding the benefits delivered by BU tools could help enhance the validity of the analysis.
5. Conclusions
In an increasingly urbanized world, this study addresses the challenge of livability in urban areas. Focusing on BU, we explore its potential to provide physical, psychological, social, and environmental benefits across scales, using nature’s multiple values as an essential strategy for sustainability. Through experience and design, we demonstrate its ability to renew urban landscapes, reconnect humans to nature and all forms of life, and leverage ecosystem services.
In addition to addressing gaps identified in previous studies and through the RQs, this study contributes to the fields of biophilia and its applied areas (Biophilic Design, Biophilic Urbanism) with theoretical and methodological advancements. Theoretically, it explores the concepts of ‘biophilic experience’ and ‘biophilic benefit’, using quantitative, qualitative, and spatial perspectives to enhance understanding and facilitate human-nature connections in the built environment, thereby maximizing benefits for improved livability. Methodologically, we adopt an integrated approach that prioritizes empirical research and research by design. It is also ‘inter-scale’, shifting from macro to micro; and ‘inter-disciplinary’, merging various fields (design, planning, psychology, environmental science, etc.), crossing the traditional borders of BU as an applied science for building anthropic habitats. We propose targeted approaches for urban planning: a benefit-driven approach that directs policies and practices to emphasize individual, social, and environmental wellbeing, and evidence-based tools that encourage city-makers to implement strategies validated by science. Lastly, we couple biophilia with Citizen Science, a rare approach in this field that engages citizens in active roles throughout the participatory process, thereby amplifying the final impact, as proven by our design findings.
Due to the short lifespan of BU, further insights are not only desirable but necessary. The low share of biophilic experiences within the Environmental benefit dimension highlights the need for longitudinal studies investigating the short-, medium-, and long-term impacts of BU on natural settings in urban areas. Given the current climate crisis, pursuing this direction becomes a priority. Positive feedback from the application of design tools confirms that our toolkit has paved the way for integrating BU into urban planning. However, its potential can be expanded through upscaling and the development of guidelines covering mid- and macro-scales. Additionally, the limited application of water-based solutions underscores the need for specific guidelines on incorporating blue-green infrastructure into regenerative design processes to further enhance its ecological and social relevance. As our integrated, cross-scale methods are transferable and replicable, they offer opportunities for application in other cities, validating and refining biophilic design tools and inspiring cooperative or comparative research worldwide.
Supplementary Materials
The following supporting information can be downloaded at the website of this paper posted on Preprints.org, Figure S1: Biophilic Experience Cards (BEC); Figure S2: Design Toolbox; Table S1: Biophilic experience framework; Table S2: Experience data processing; Table S3: BEC data processing; Table S4: Thematic coding processing; Table S5: Thematic coding quotation.
Author Contributions
Conceptualization, D.C.L. and M.N.; Methodology, D.C.L., M.N. and S.L.; Software, D.C.L., M.N. and S.L.; Validation, D.C.L.; Formal Analysis, D.C.L., M.N. and S.L.; Investigation, D.C.L., M.N. and S.L.; Resources, D.C.L., M.N. and S.L; Data Collection, D.C.L., M.N. and S.L; Data Curation, D.C.L. and M.N.; Data Analysis, D.C.L., M.N. and S.L.; Writing – Original Draft Preparation, D.C.L., M.N. and S.L.; Writing – Review & Editing, D.C.L., M.N., S.L. and A.v.T.; Visualization, D.C.L.; Supplementary Materials, D.C.L.; Supervision, A.v.T.; Project Administration, D.C.L. and A.v.T.; Funding Acquisition, D.C.L. All authors have read and agreed to the published version of the manuscript.
Funding
This study has received funding from the European Union’s Horizon 2020 Research and Innovation programme under the Marie Skłodowska-Curie Grant Agreement No. 101026318. This article reflects only the author’s view. The Research Executive Agency (REA), under the powers delegated by the European Commission, is not responsible for any use that may be made of the information it contains.
Data Availability Statement
Data are available on request by contacting the corresponding author (D.C.L.).
Acknowledgments
We express our gratitude to all participants, both collectively and individually, who contributed to the three rounds of the Workshop “Biophilic Amsterdam: Living Nature through Experience and Design in Urban Environments”. Their input provided us with an original and firsthand dataset. We also thank the Amsterdam Institute for Advanced Metropolitan Solutions (AMS) for hosting and facilitating the research and related events. Special thanks go to Eveline van Leeuwen, AMS Scientific Director, for supporting our initiatives from the pilot ideation to implementation; to Gerben Mol, AMS expert and reference; to Juanita Devis Clavijo and Gina Gommer for sharing their expertise, particularly in the context of Urban Living Labs and Marineterrein connections; to AMS Communications for managing the dissemination and promotion of the workshop; and to AMS Office for their technical and logistical support during all workshop dates. Finally, we are grateful to the Communication Teams at Delft University of Technology and Wageningen University & Research for providing physical spaces and digital platforms to enable our workshop dissemination campaign.
Conflicts of Interest
The authors declare no conflict of interest.
References
- L. Hee, “Can Dense Cities Really Be Liveable?,” in Future City Architecture for Optimal Living, S. Th. Rassia and P. M. Pardalos, Eds., Cham: Springer International Publishing, 2015, pp. 81–104. [CrossRef]
- T. Beery, K. Jönsson, and J. Elmberg, “From Environmental Connectedness to Sustainable Futures: Topophilia and Human Affiliation with Nature,” Sustainability, vol. 7, pp. 8837–8854, 2015.
- A. Yasmin, I. Ahmed, M. Haider, M. K. Hossain, M. A. Motalib, and M. S. Hossain, “Characterizing indoor air quality and identifying factors influencing air quality at home microenvironment in Dhaka city,” Indoor Environ., vol. 1, no. 4, p. 100056, 2024. [CrossRef]
- T. B. Saheer, L. Lien, E. Hauff, and B. N. Kumar, “Ethnic differences in seasonal affective disorder and associated factors among five immigrant groups in Norway,” J. Affect. Disord., vol. 151, no. 1, pp. 237–242, 2013. [CrossRef]
- T. Croeser, R. Sharma, W. W. Weisser, and S. A. Bekessy, “Acute canopy deficits in global cities exposed by the 3-30-300 benchmark for urban nature,” Nat. Commun., vol. 15, no. 1, p. 9333, Nov. 2024. [CrossRef]
- T. Beatley, Canopy Cities: Protecting and Expanding Urban Forests. New York: Routledge, 2023.
- S. Lehmann, “Green Urbanism: Formulating a Series of Holistic Principles,” S.A.P.I.EN.S, vol. 3.2, 2010.
- T. Beatley, “Biophilic Urbanism: Inviting Nature Back to Our Communities and Into Our Lives,” Wm Mary Envtl Pol Rev, vol. 34, p. 209, 2009.
- E. Wilson, Biophilia. The Human Bond With Other Species. MA: Harvard University Press, 1984.
- T. Beatley, Handbook of Biophilic City Planning and Design. Washington DC: Island Press, 2016.
- M. White, I. Alcock, J. Grellier, B. Wheeler, and T. Hartig, “Spending at least 120 minutes a week in nature is associated with good health and wellbeing,” Sci. Rep., vol. 9, p. 7730, 2019.
- S. Sudimac, V. Sale, and S. Kühn, “How nature nurtures: Amygdala activity decreases as the result of a one-hour walk in nature,” Mol. Psychiatry, vol. 27, no. 11, pp. 4446–4452, Nov. 2022. [CrossRef]
- M. Soga, K. Gaston, Y. Yamaura, K. Kurisu, and K. Hanaki, “Both Direct and Vicarious Experiences of Nature Affect Children’s Willingness to Conserve Biodiversity,” Int. J. Environ. Res. Public. Health, vol. 13, p. 529, 2016.
- O. el-Baghdadi and C. Desha, “Conceptualising a biophilic services model for urban areas,” Urban For. Urban Green., vol. 27, pp. 399–408, 2017.
- B. Browning, C. Garvin, B. Fox, and Cook, The economics of biophilia why designing with nature in mind makes financial sense. NY: Terrapin Bright Green, 2012.
- D. Lefosse, A. van Timmeren, and C. Ratti, “Biophilia Upscaling: A Systematic Literature Review Based on a Three-Metric Approach,” Sustainability, vol. 15, no. 22, 2023. [CrossRef]
- E. Andersson, S. Barthel, and S. Borgström, “Reconnecting cities to the biosphere: stewardship of green infrastructure and urban ecosystem services,” Ambio, vol. 43(4), pp. 445–453, 2014.
- G. Thomson and P. Newman, “Green infrastructure and biophilic urbanism as tools for integrating resource efficient and ecological cities,” Urban Plan., vol. 6, pp. 75–88, 2021.
- M. Naghibi and M. Faizi, “Temporary reuse in leftover spaces through the preferences of the elderly,” Cities, vol. 127, p. 103769, 2022. [CrossRef]
- T. Beery, A. Stahl Olagsson, S. Gentin, M. Maurer, S. Stålhammar, and C. Albert, “Disconnection from nature: Expanding our understanding of human–nature relations,” People Nat., vol. 5, pp. 470–488, 2023.
- X. Fang, J. Li, and Q. Ma, “Integrating green infrastructure, ecosystem services and nature-based solutions for urban sustainability: A comprehensive literature review,” Sustain. Cities Soc., vol. 98, p. 104843, 2023. [CrossRef]
- D. Wang, P.-Y. Xu, B.-W. An, and Q.-P. Guo, “Urban green infrastructure: bridging biodiversity conservation and sustainable urban development through adaptive management approach,” Front Ecol Evol 12. [CrossRef]
- M. Whitten, “Engaging Resilience: Integrating Sociocultural Dimensions into Green Infrastructure Planning,” in Planning with Landscape: Green Infrastructure to Build Climate-Adapted Cities, C. Gomes Sant’Anna, I. Mell, and L. B. M. Schenk, Eds., Cham: Springer International Publishing, 2023, pp. 15–33. [CrossRef]
- G. Kim, G. Newman, and B. Jiang, “Urban regeneration: Community engagement process for vacant land in declining cities,” Cities, vol. 102, p. 102730, 2020. [CrossRef]
- Dienst Onderzoek en Statistiek, Gemeente Amsterdam, “Kerncijfers Amsterdam,” 2007.
- Space and Sustainability Cluster, Municipality of Amsterdam, “New Amsterdam Climate. Amsterdam Climate Neutral Roadmap 2050,” 2020.
- T. Beatley, “Biophilic Cities Network,” Encyclopedia of Sustainability Science and Technology. Springer, p. 284, 2020.
- Onderzoek en Statistiek, Gemeente Amsterdam, “Monitor Groen 2022,” 2023.
- Department of Planning and Sustainability, City of Amsterdam, “Amsterdam Green Infrastructure Vision 2050. A liveable city for people, plants, and animals,” 2020.
- M. Paulin, R. Remme, and T. de Nijs, “Amsterdam’s green infrastructure: Valuing nature’s contributions to people. National Institute for Public Health and the Environment (RIVM),” National Institute for Public Health and the Environment (RIVM), 2019.
- J. Methorst, A. Bonn, M. Marselle, K. Böhning-Gaese, and K. Rehdanz, “Species richness is positively related to mental health – A study for Germany,” Landsc. Urban Plan., vol. 211, p. 104084, 2021. [CrossRef]
- S. Luo, “Ontwerpen aan groene restruimte in steden,” Stadswerk, vol. 7, pp. 38–41, 2023.
- C. van Leeuwen, J. Devis Clavijo, I. Mariën, and A. Jacobs, “Invisible in the smart city: Using participatory design methods for age-friendly solutions,” Front. Sustain. Cities, vol. 4, 2022. [CrossRef]
- S. Luo, “Leftover Green Field Lab.” [Online]. Available: https://www.ams-institute.org/urban-challenges/resilient-cities/Leftover-Green-Field-Lab/.
- E. B.-N. Sanders and P. J. Stappers, “Co-creation and the new landscapes of design,” CoDesign, vol. 4, no. 1, pp. 5–18, 2008. [CrossRef]
- H. Fors, F. A. Hagemann, Å. O. Sang, and T. B. Randrup, “Striving for Inclusion—A Systematic Review of Long-Term Participation in Strategic Management of Urban Green Spaces,” Front. Sustain. Cities, vol. 3, 2021. [CrossRef]
- M. S. Reed et al., “Who’s in and why? A typology of stakeholder analysis methods for natural resource management,” J. Environ. Manage., vol. 90, no. 5, pp. 1933–1949, 2009. [CrossRef]
- T. Beatley, Biophilic Cities: Integrating Nature into Urban Design and Planning. Washington DC: Island Press, 2011.
- S. Kellert and E. Calabrese, The practice of biophilic design. 2015.
- Kellert, SR, Nature by Design: The Practice of Biophilic Design. Yale University Press, 2018.
- S. Kellert, J. Heerwagen, and M. Mador, Biophilic design: the theory, science and practice of bringing buildings to life. Hoboken, NJ: Wiley, 2008.
- W. Browning, C. Ryan, and J. Clancy, 14 Patterns of Biophilic Design. NY: Terrapin Bright Green, 2014.
- S. de Wit, “Hidden landscapes the metropolitan garden and the genius loci,” Delft University of Technology, Delft, 2014.
- L. B. Diedrich, “Translating Harbourscapes : Site-Specific Design Approaches in Contemporary European Harbour Transformation,” University of Copenhagen, Copenhagen, 2013.
- I. Kowarik, “Urban wilderness: Supply, demand, and access,” Urban For. Urban Green., vol. 29, pp. 336–347, 2018. [CrossRef]
- G. Clément, Manifeste du Tiers paysage Sujet/Obj. (2004), p. 6. Paris: Sens et Tonka, 2014.
- M. Dallimer et al., “Biodiversity and the Feel-Good Factor: Understanding Associations between Self-Reported Human Well-being and Species Richness,” BioScience, vol. 62, no. 1, pp. 47–55, Jan. 2012. [CrossRef]
- S. Bonthoux, S. Chollet, I. Balat, N. Legay, and L. Voisin, “Improving nature experience in cities: What are people’s preferences for vegetated streets?,” J. Environ. Manage., vol. 230, pp. 335–344, 2019. [CrossRef]
- A. Wagner, “Permitted Exceptions : Authorised Temporary Urban Spaces between Vision and Everyday,” University of Copenhagen, University of Copenhagen, 2016.
- J. I. Nassauer, “Care and stewardship: From home to planet,” Landsc. Urban Plan., vol. 100, no. 4, pp. 321–323, 2011. [CrossRef]
- B. Smit and V. Scherman, “Computer-Assisted Qualitative Data Analysis Software for Scoping Reviews: A Case of ATLAS.ti,” Int. J. Qual. Methods, vol. 20, p. 16094069211019140, 2021. [CrossRef]
Figure 1.
Workshop step-by-step design, with a focus on the four Biophilic Experience Cards (BEC) used during the Map session. These cards represent four dimensions of biophilic benefits. The back of each card is divided into three sections (Where, What, How) to be completed. Further details can be found in Supplementary Materials (Figure S1).
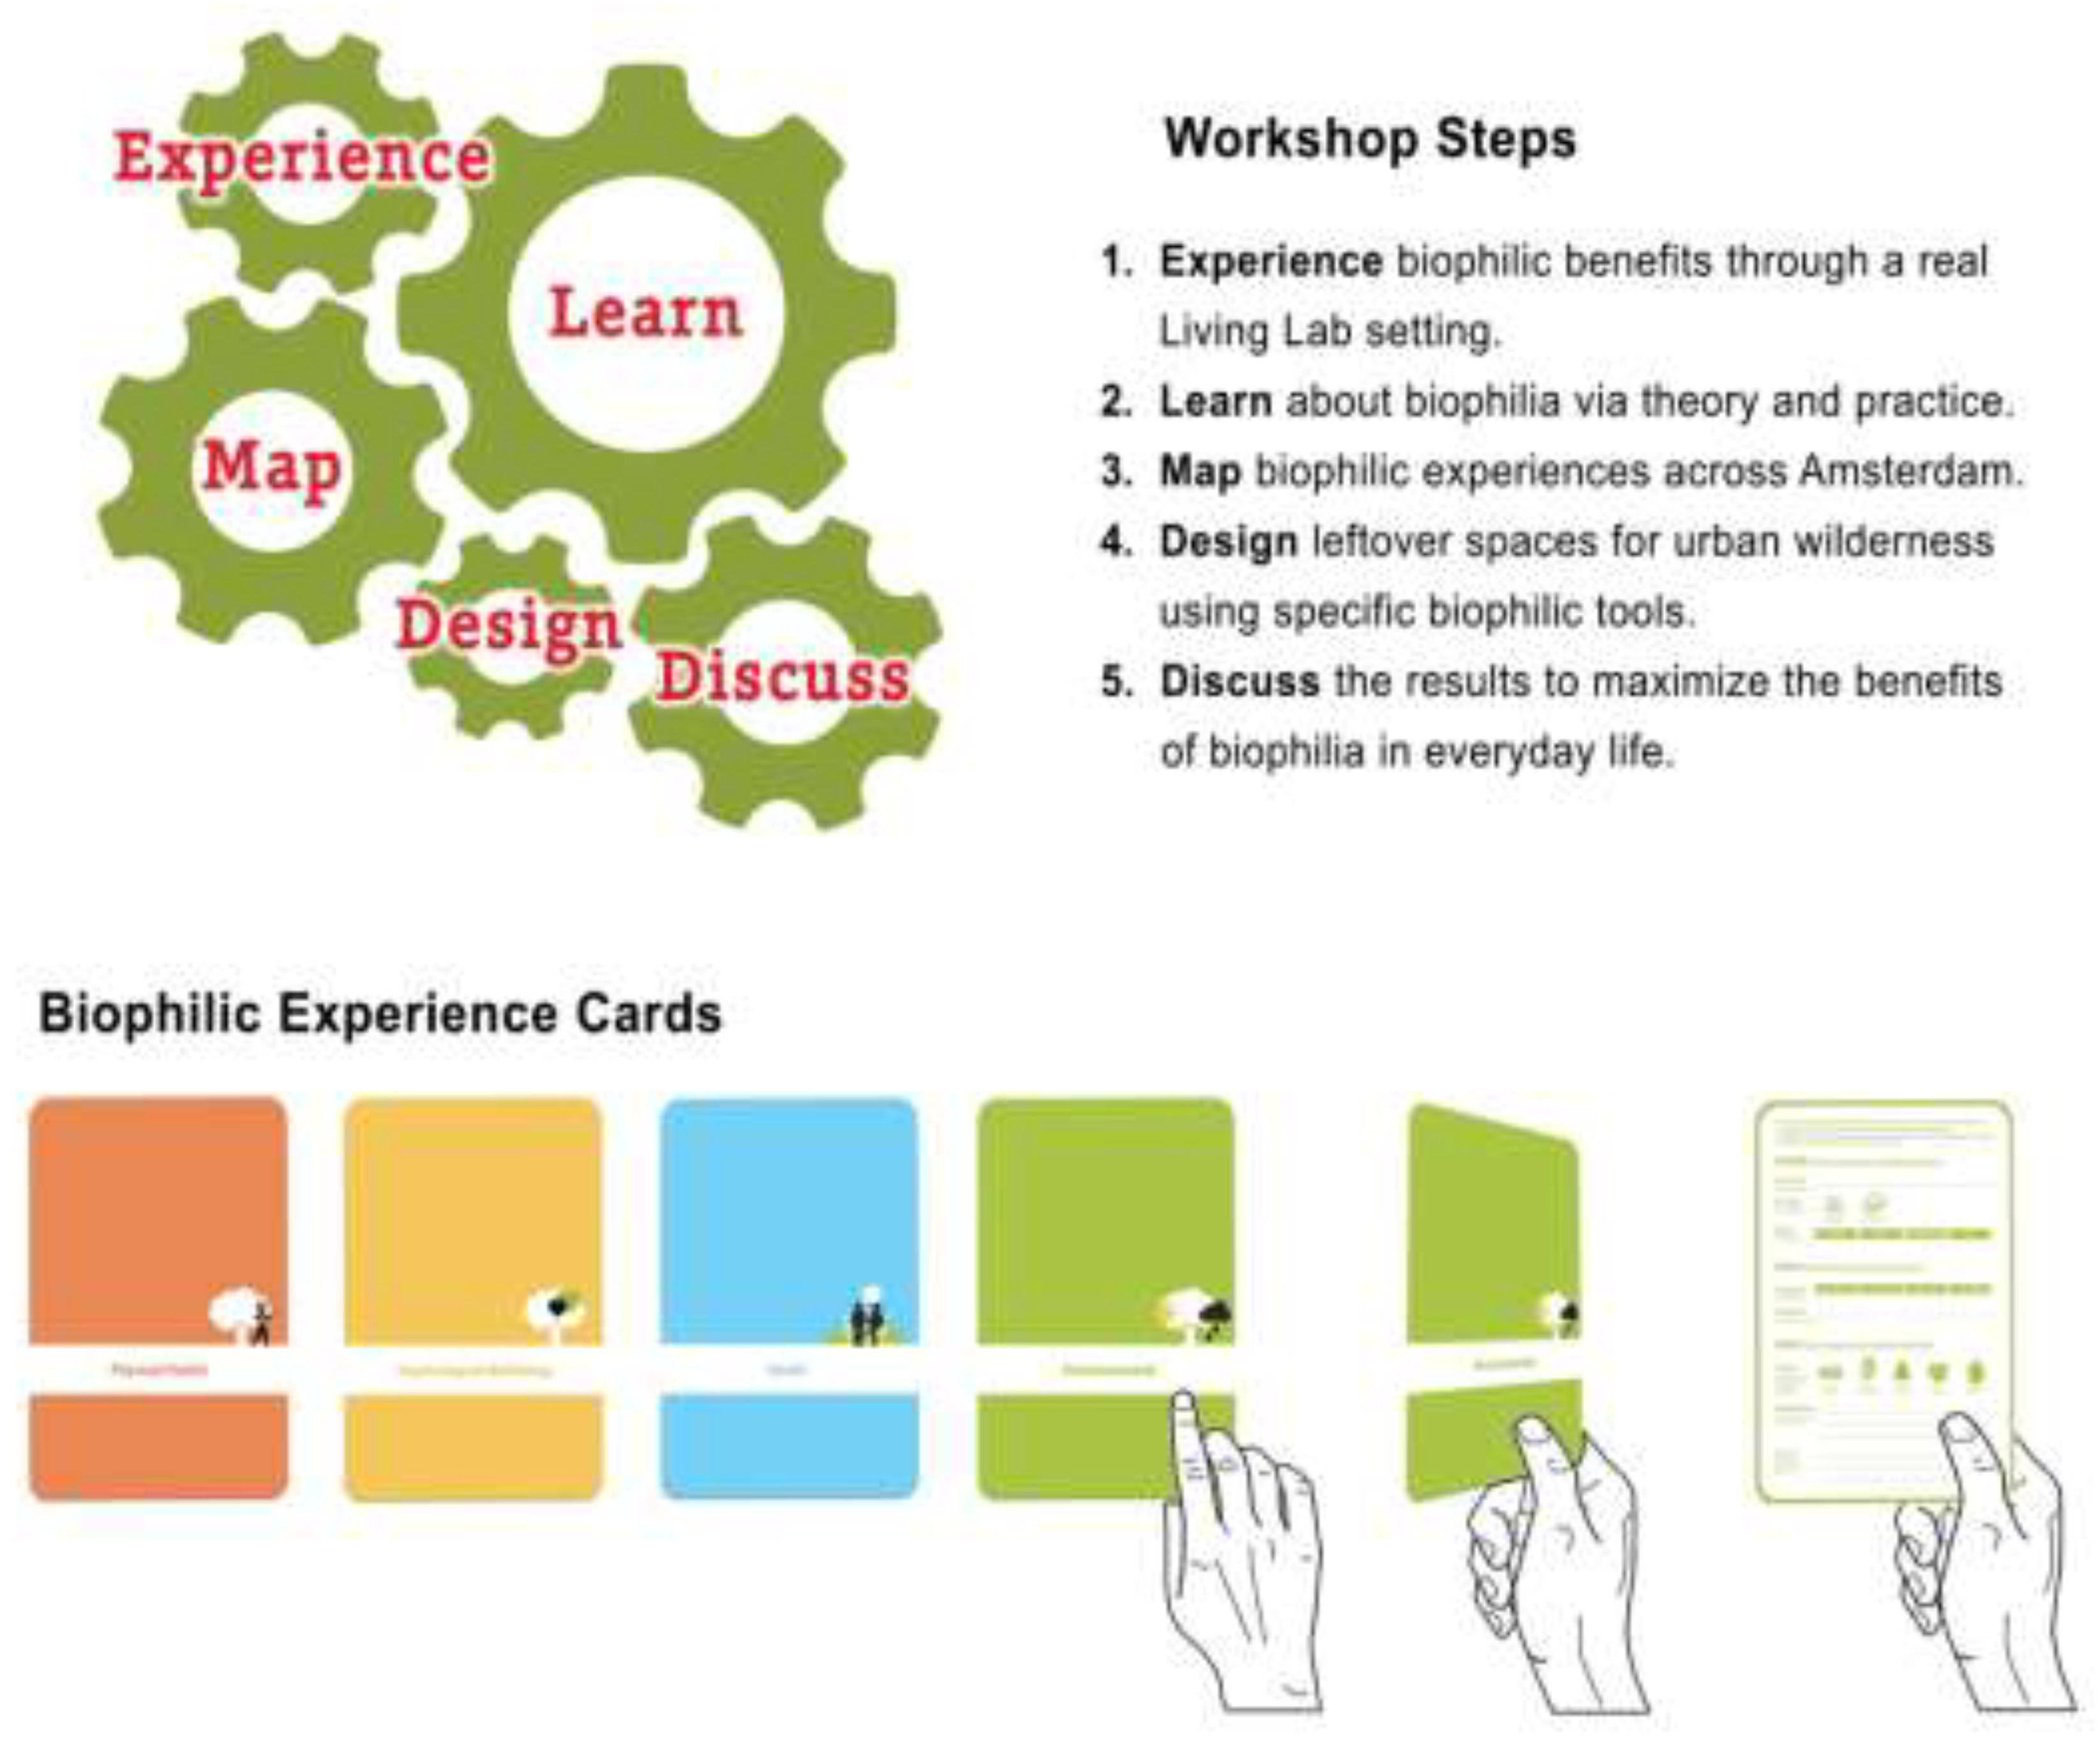
Figure 2.
Picture composition through the main workshop steps: (a) Walking through the “Leftover Green Field Lab” (Marineterrein, Amsterdam) for a multisensory biophilic experience in a real Living Lab setting; (b) Filling out the BEC; (c) Preliminary Map session results; (d) Cooperating during the Design session; (e) Discussing team-by-team design results.
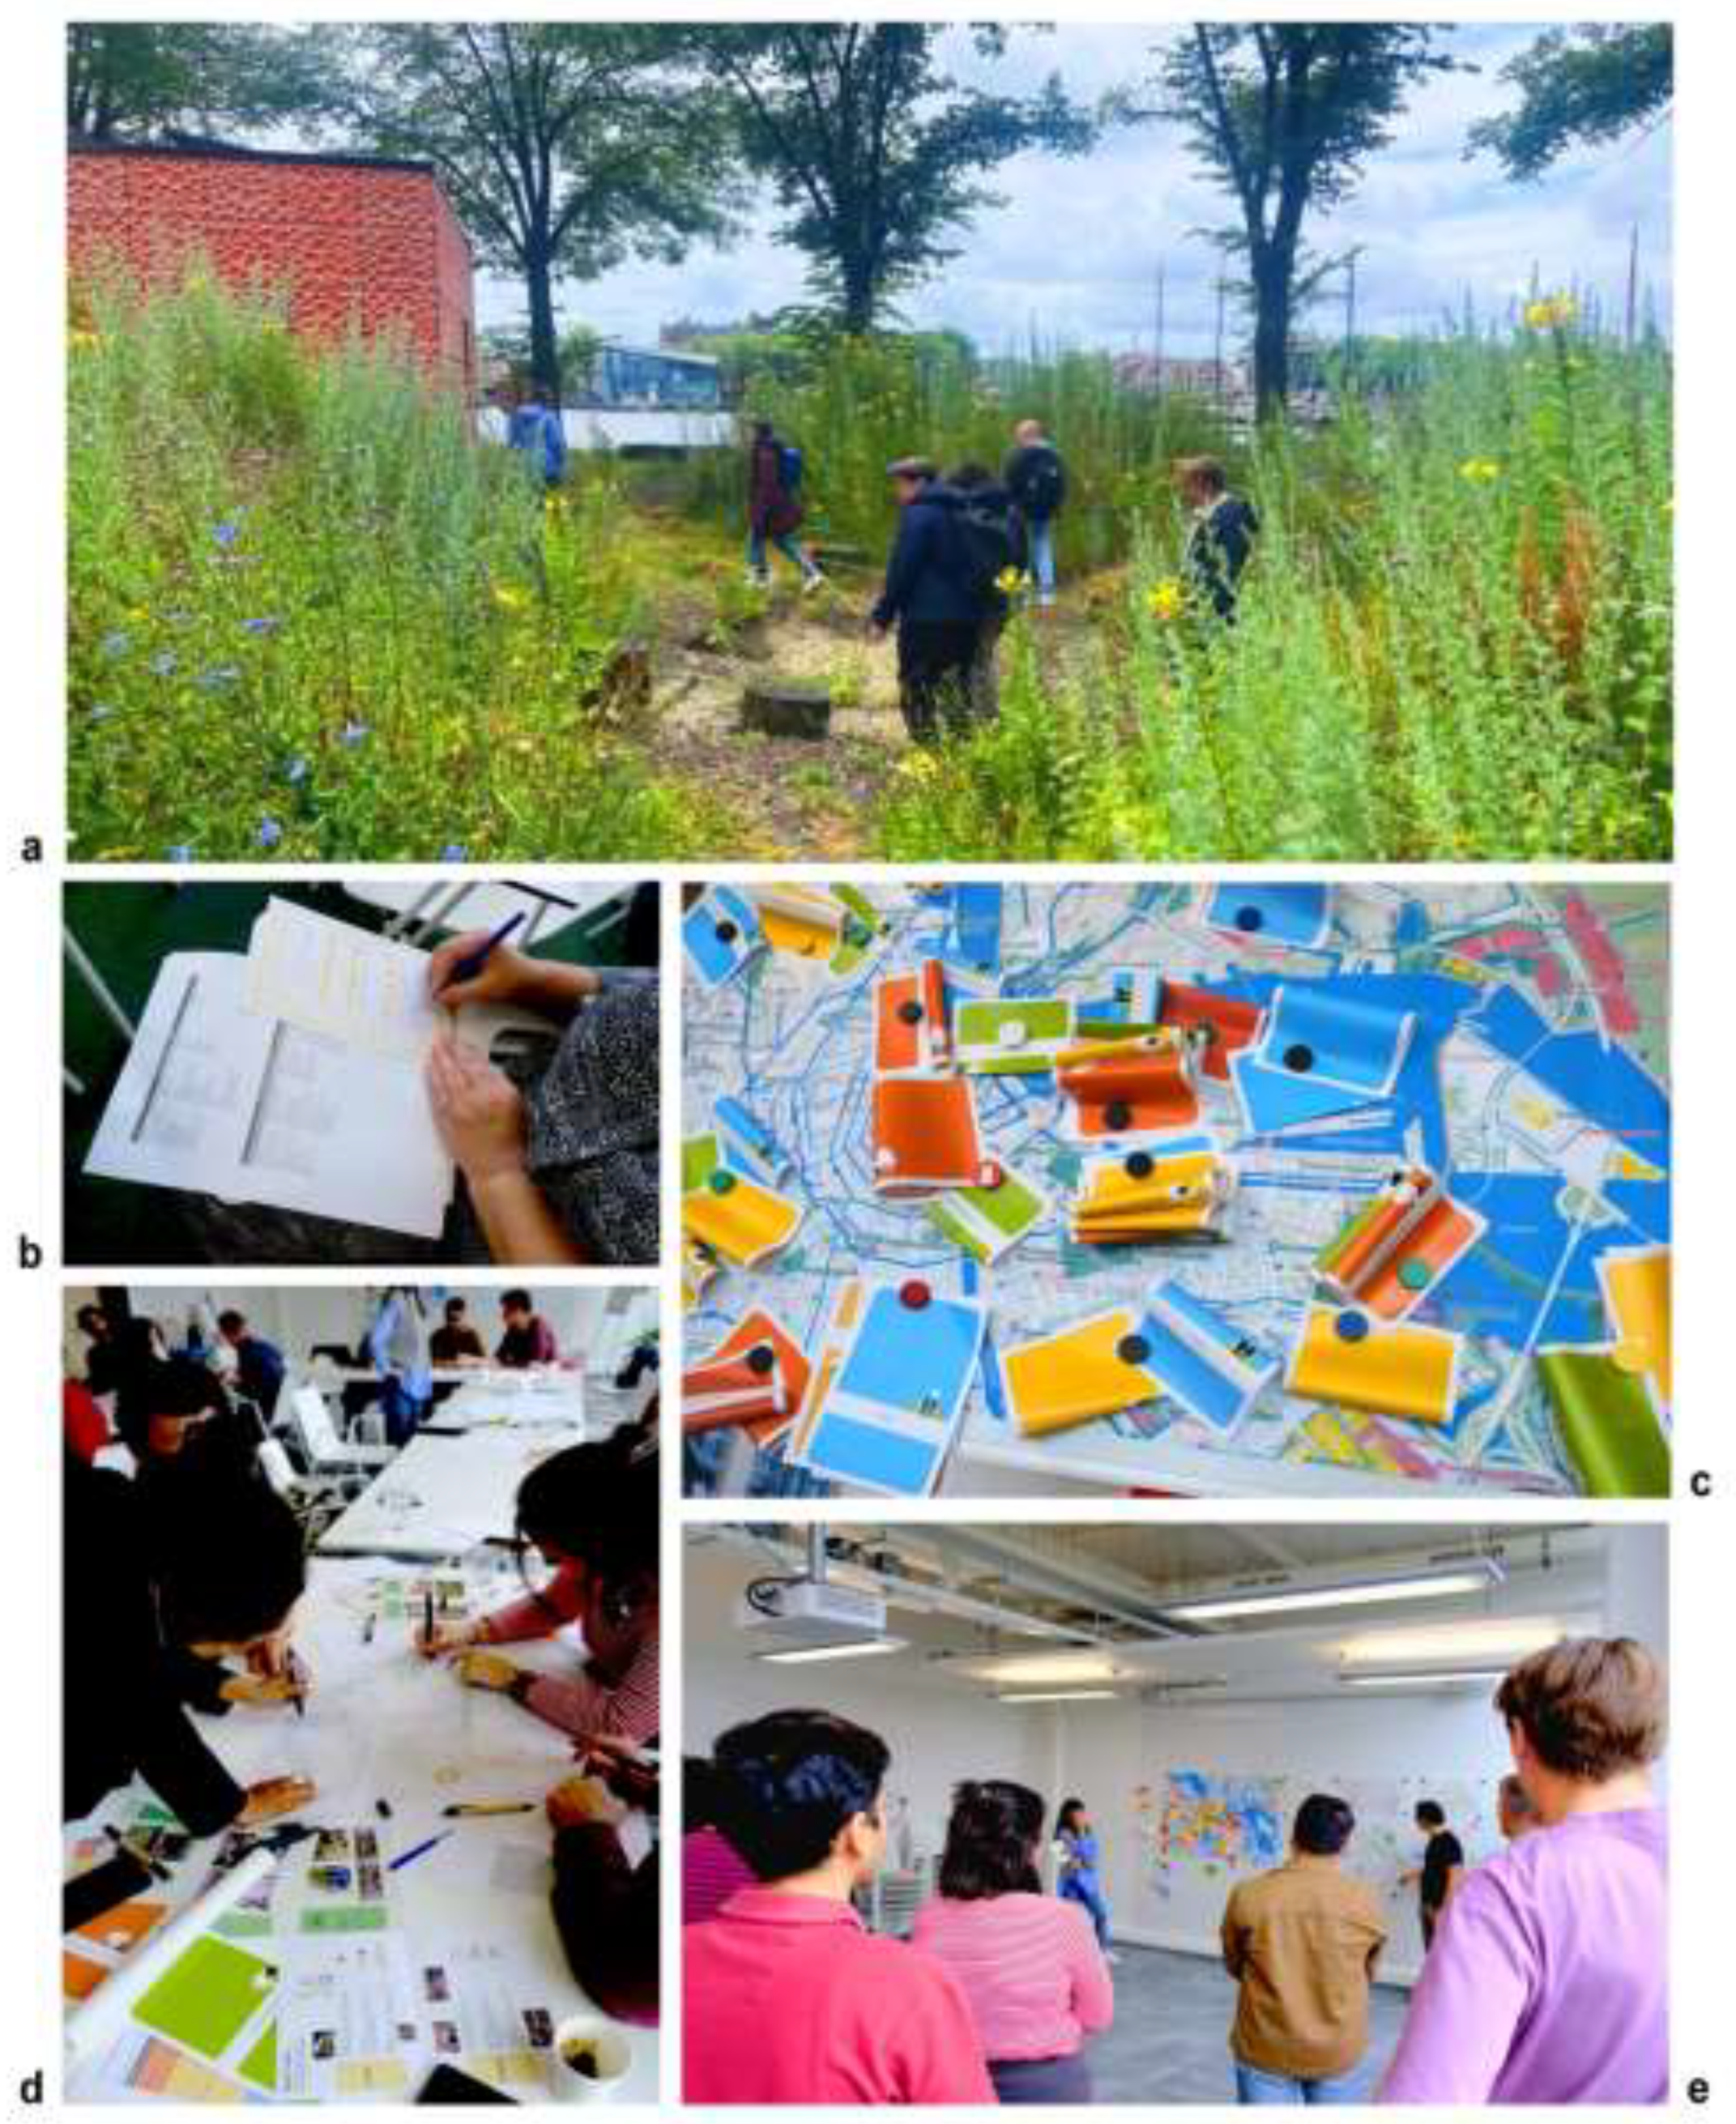
Figure 3.
Radiant bar chart showing the effects of experiencing biophilia in the nature-based setting ("Leftover Green Field" Living Lab) on workshop participants, expressed as percentages across four biophilic benefit dimensions.
Figure 3.
Radiant bar chart showing the effects of experiencing biophilia in the nature-based setting ("Leftover Green Field" Living Lab) on workshop participants, expressed as percentages across four biophilic benefit dimensions.
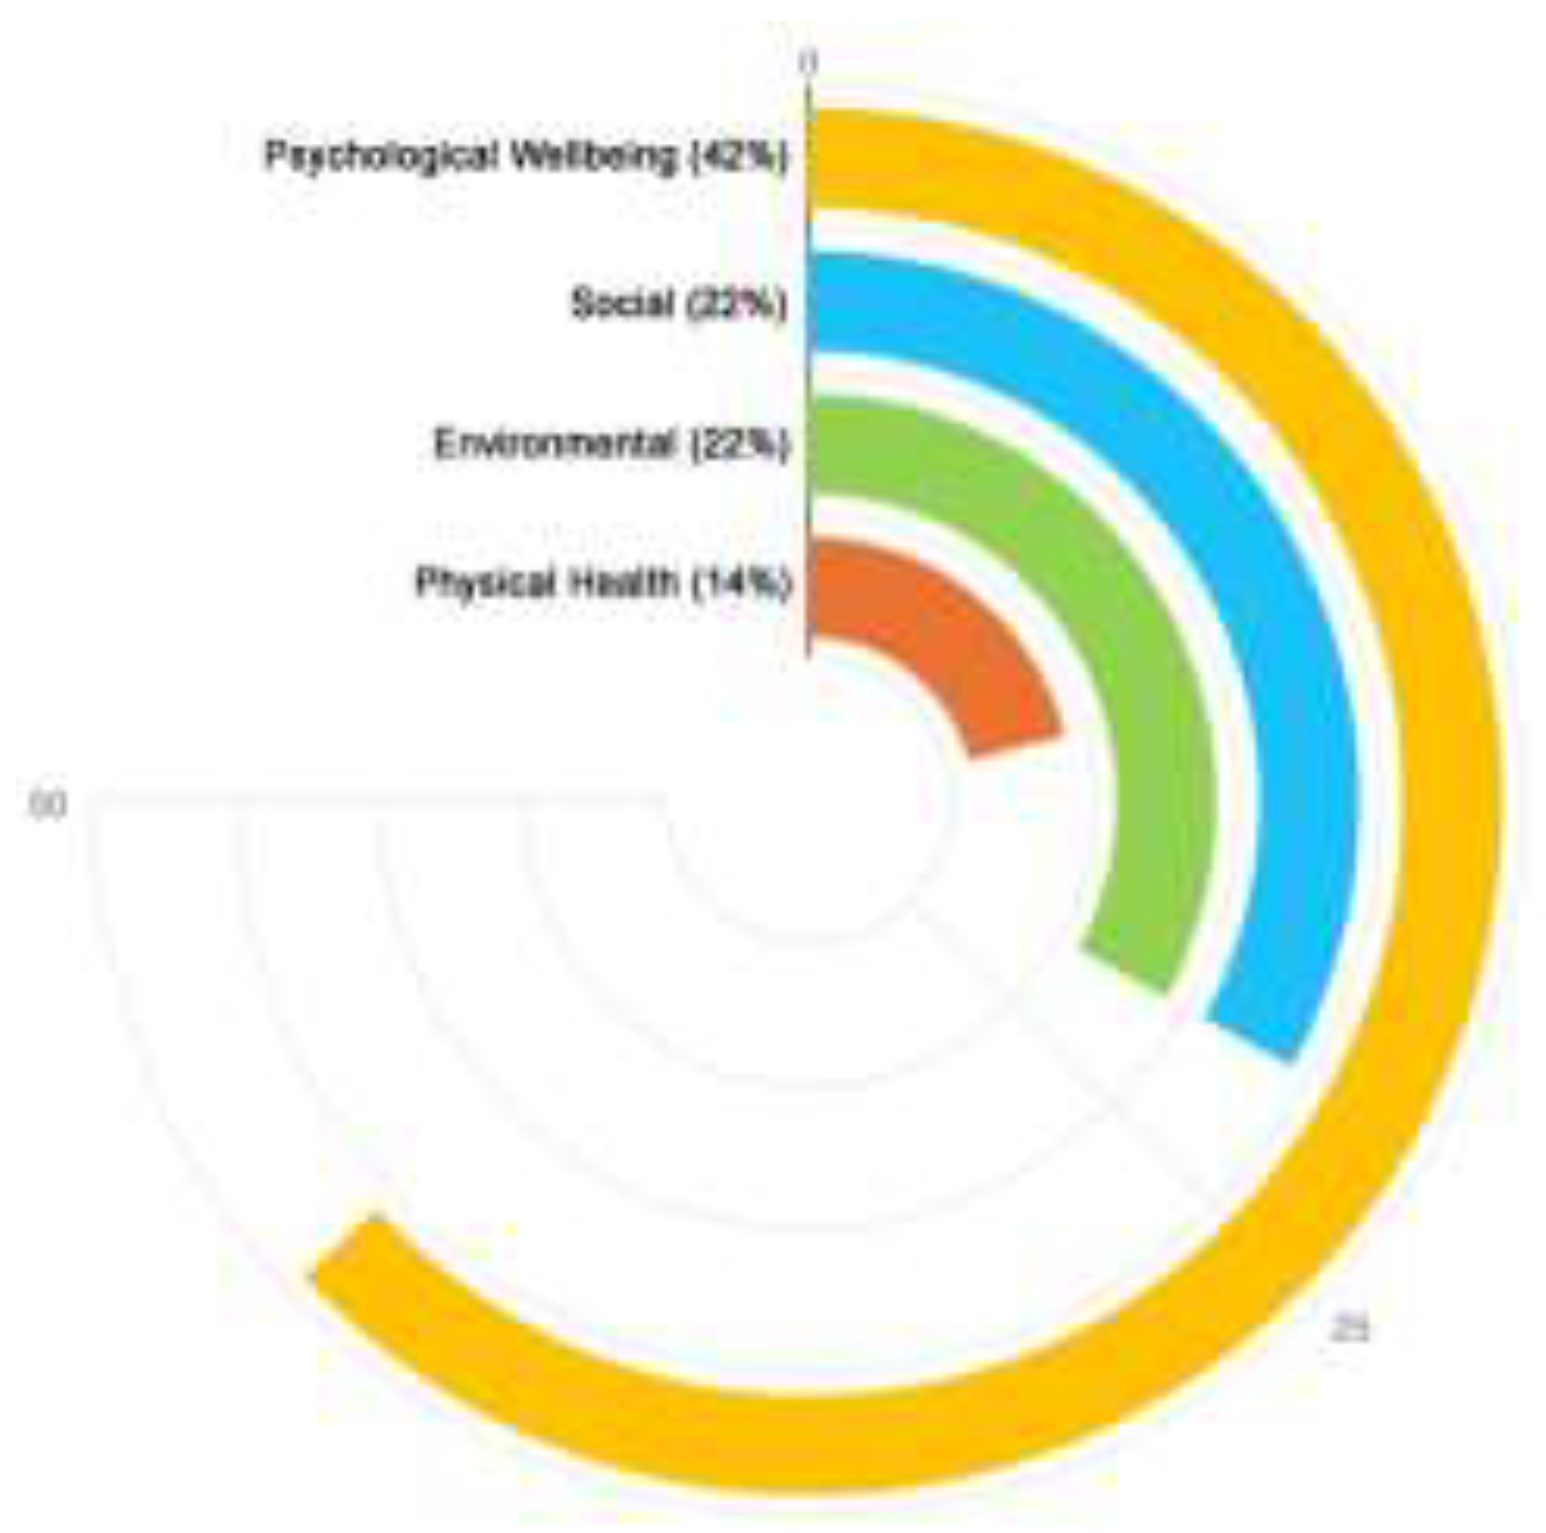
Figure 4.
Most biophilic locations identified across Amsterdam, ranked by preference. The top locations correspond to the predominant benefits: Social (Westerpark), Psychological Wellbeing (Vondelpark), Physical Health (Marineterrein), and Environmental (Hortus Botanicus).
Figure 4.
Most biophilic locations identified across Amsterdam, ranked by preference. The top locations correspond to the predominant benefits: Social (Westerpark), Psychological Wellbeing (Vondelpark), Physical Health (Marineterrein), and Environmental (Hortus Botanicus).
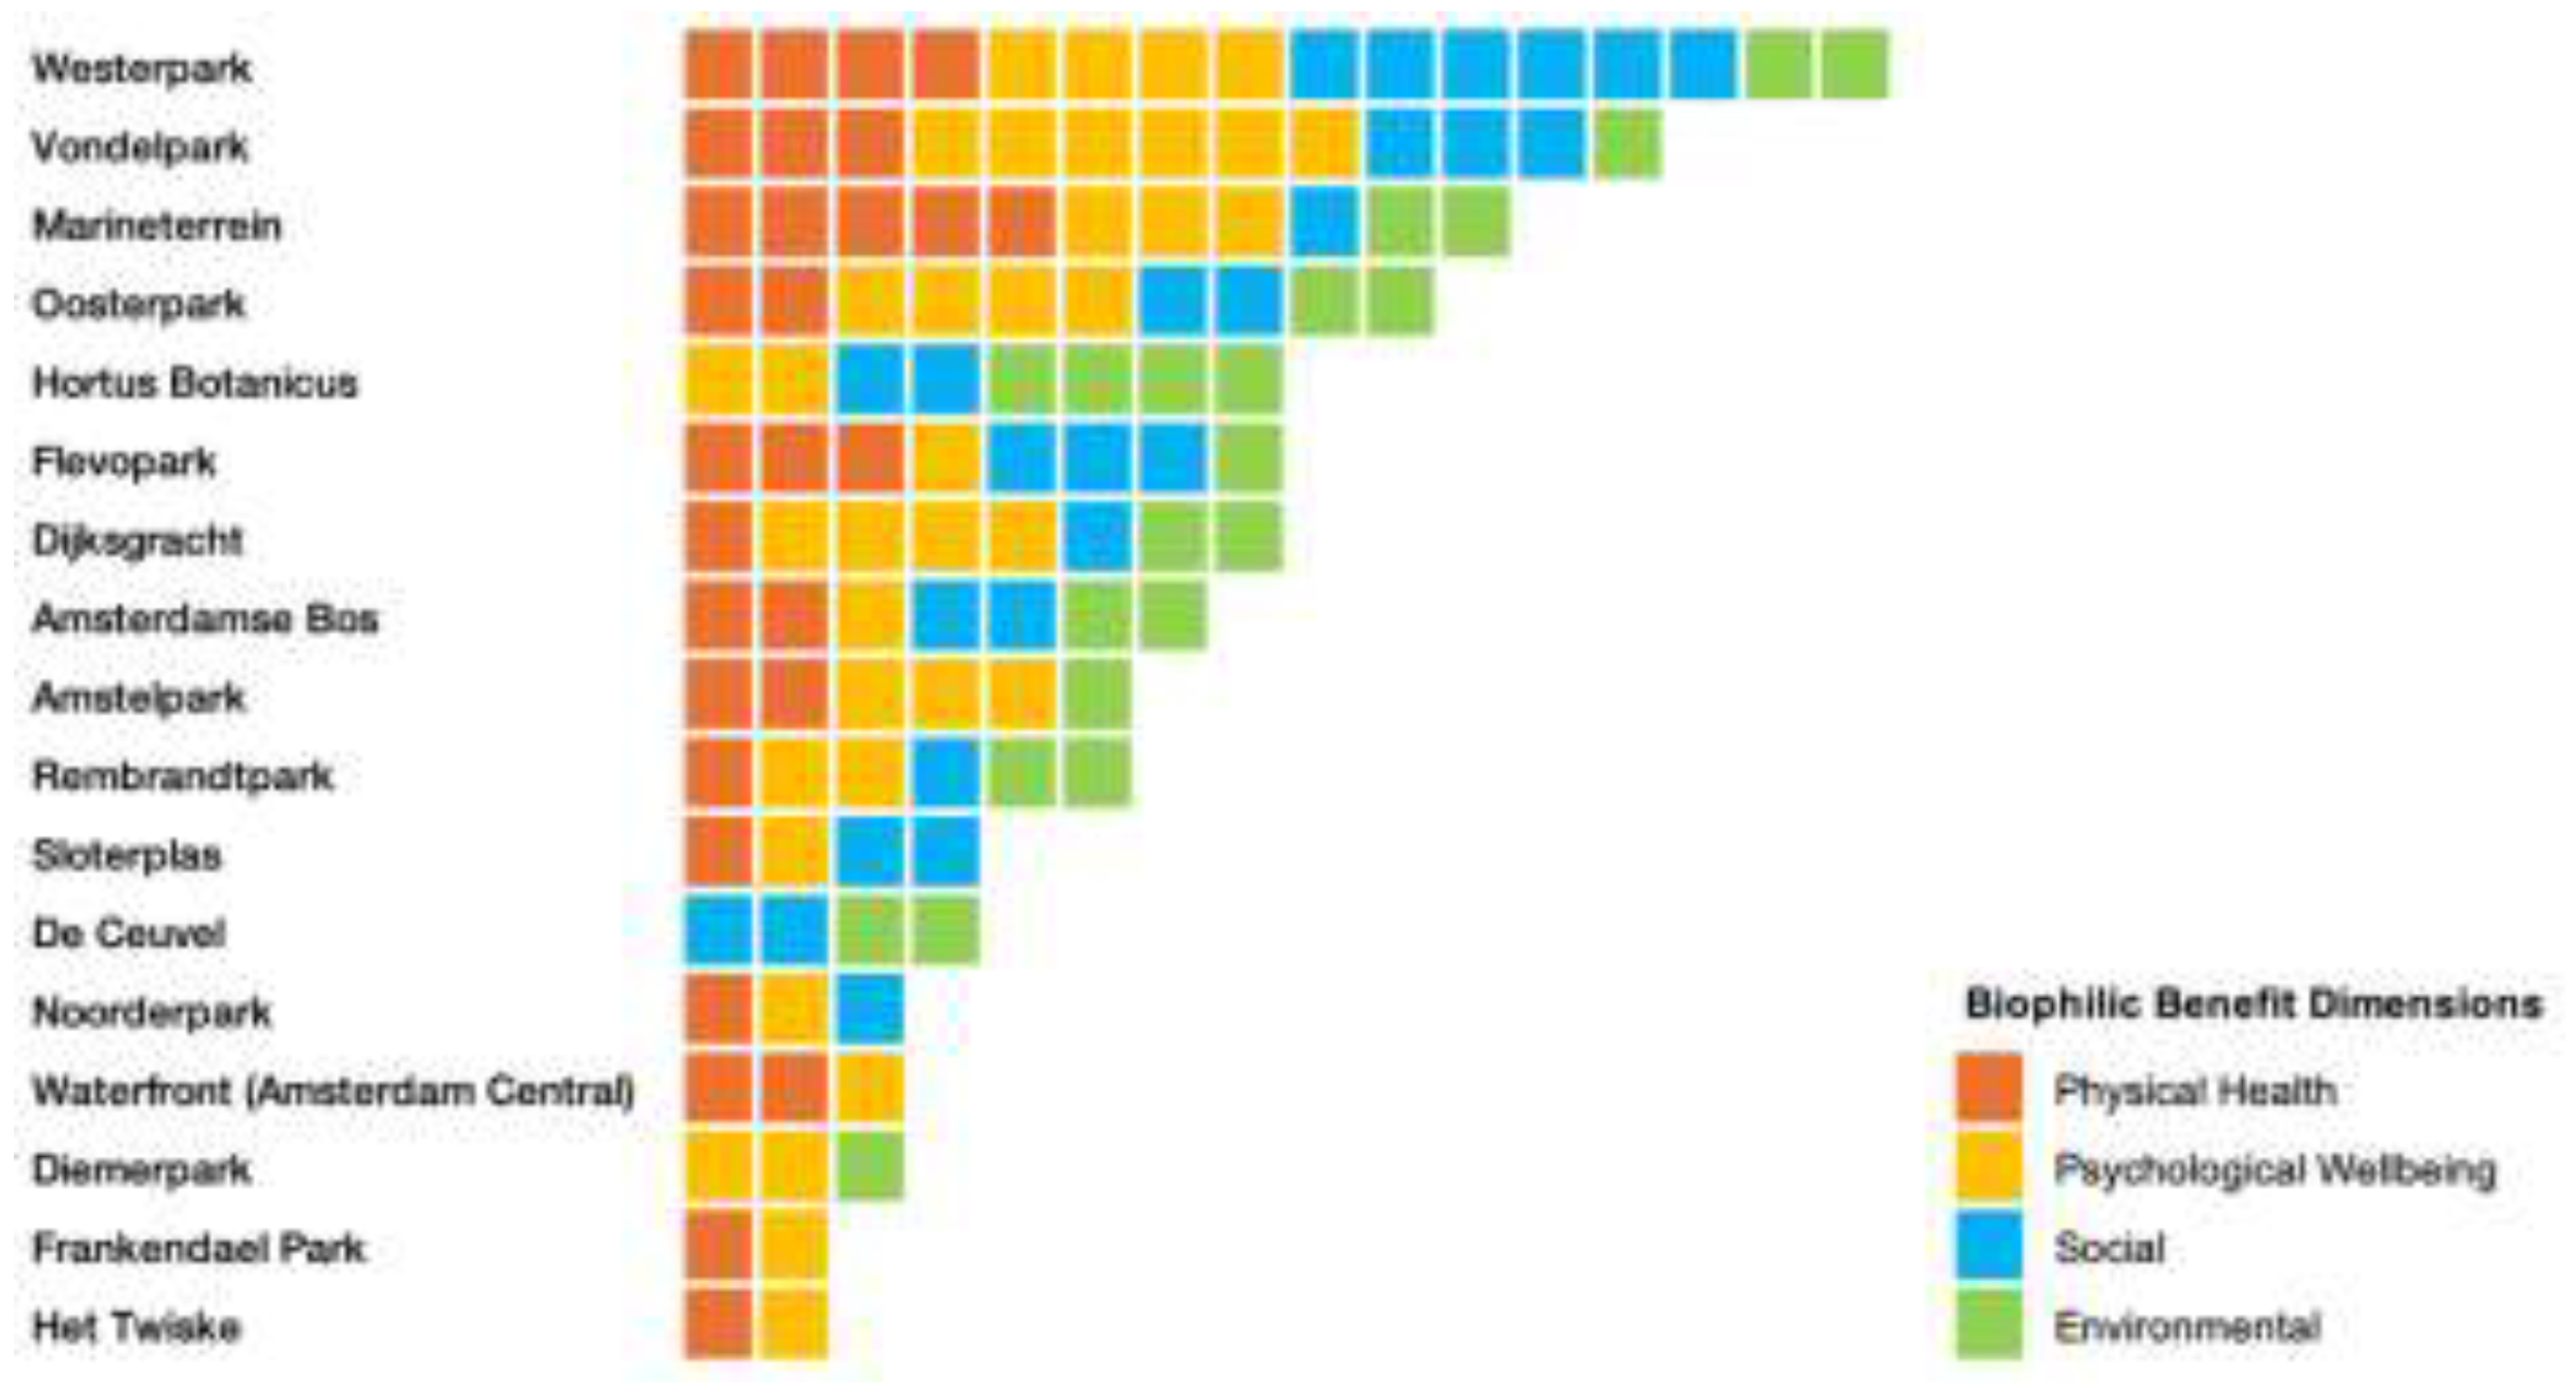
Figure 5.
Top ten ranked biophilic locations from BEC data processing (Figure 4). Each location(Y-axis) is linked to a cityscape category (Greenscape, Landscape, Waterscape, Living Beings), experience, and specific benefit (X-axis). Larger dots indicate multisensory experiences, while smaller dots represent single-sense experiences. The four labeled experiences and benefits are the most frequently mentioned in the BEC.
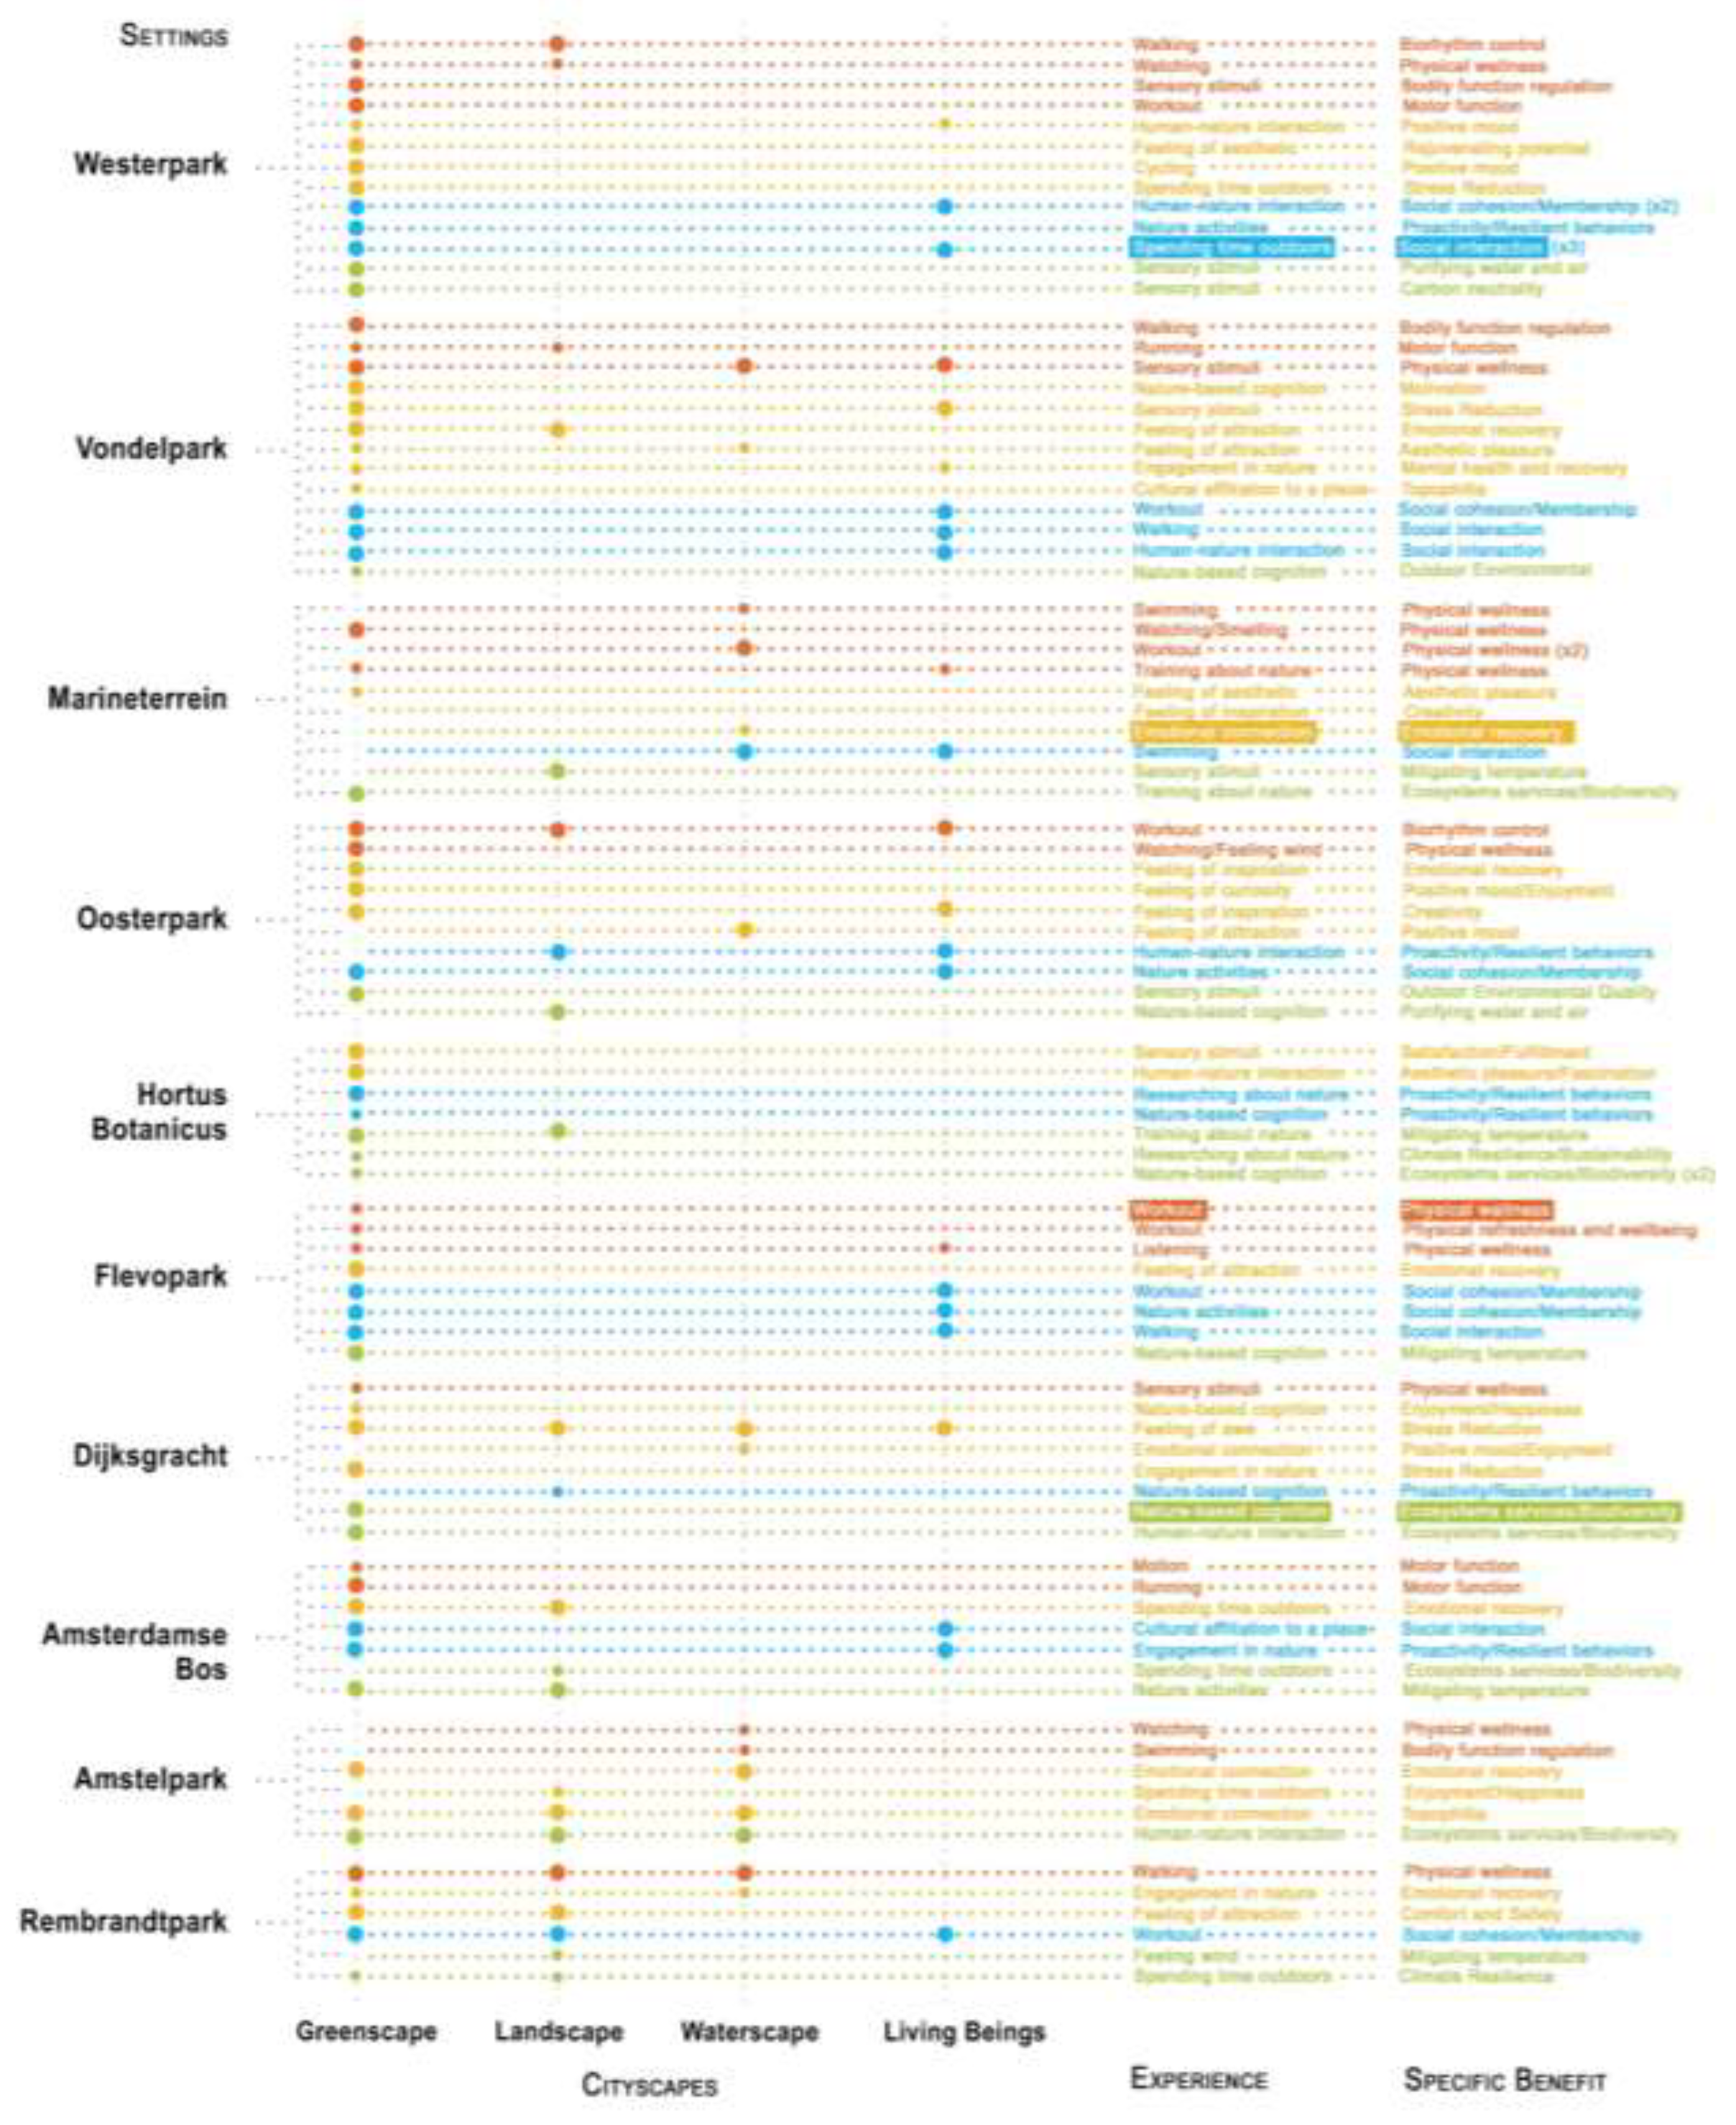
Figure 6.
Spatial distribution of biophilic locations across Amsterdam, including all locations cited by workshop participants and recorded in the BEC dataset. Sites are color-coded by the predominant benefit dimension and represented in real shapes and sizes based on their neighborhood or city scale, with triangles indicating streets or building scale.
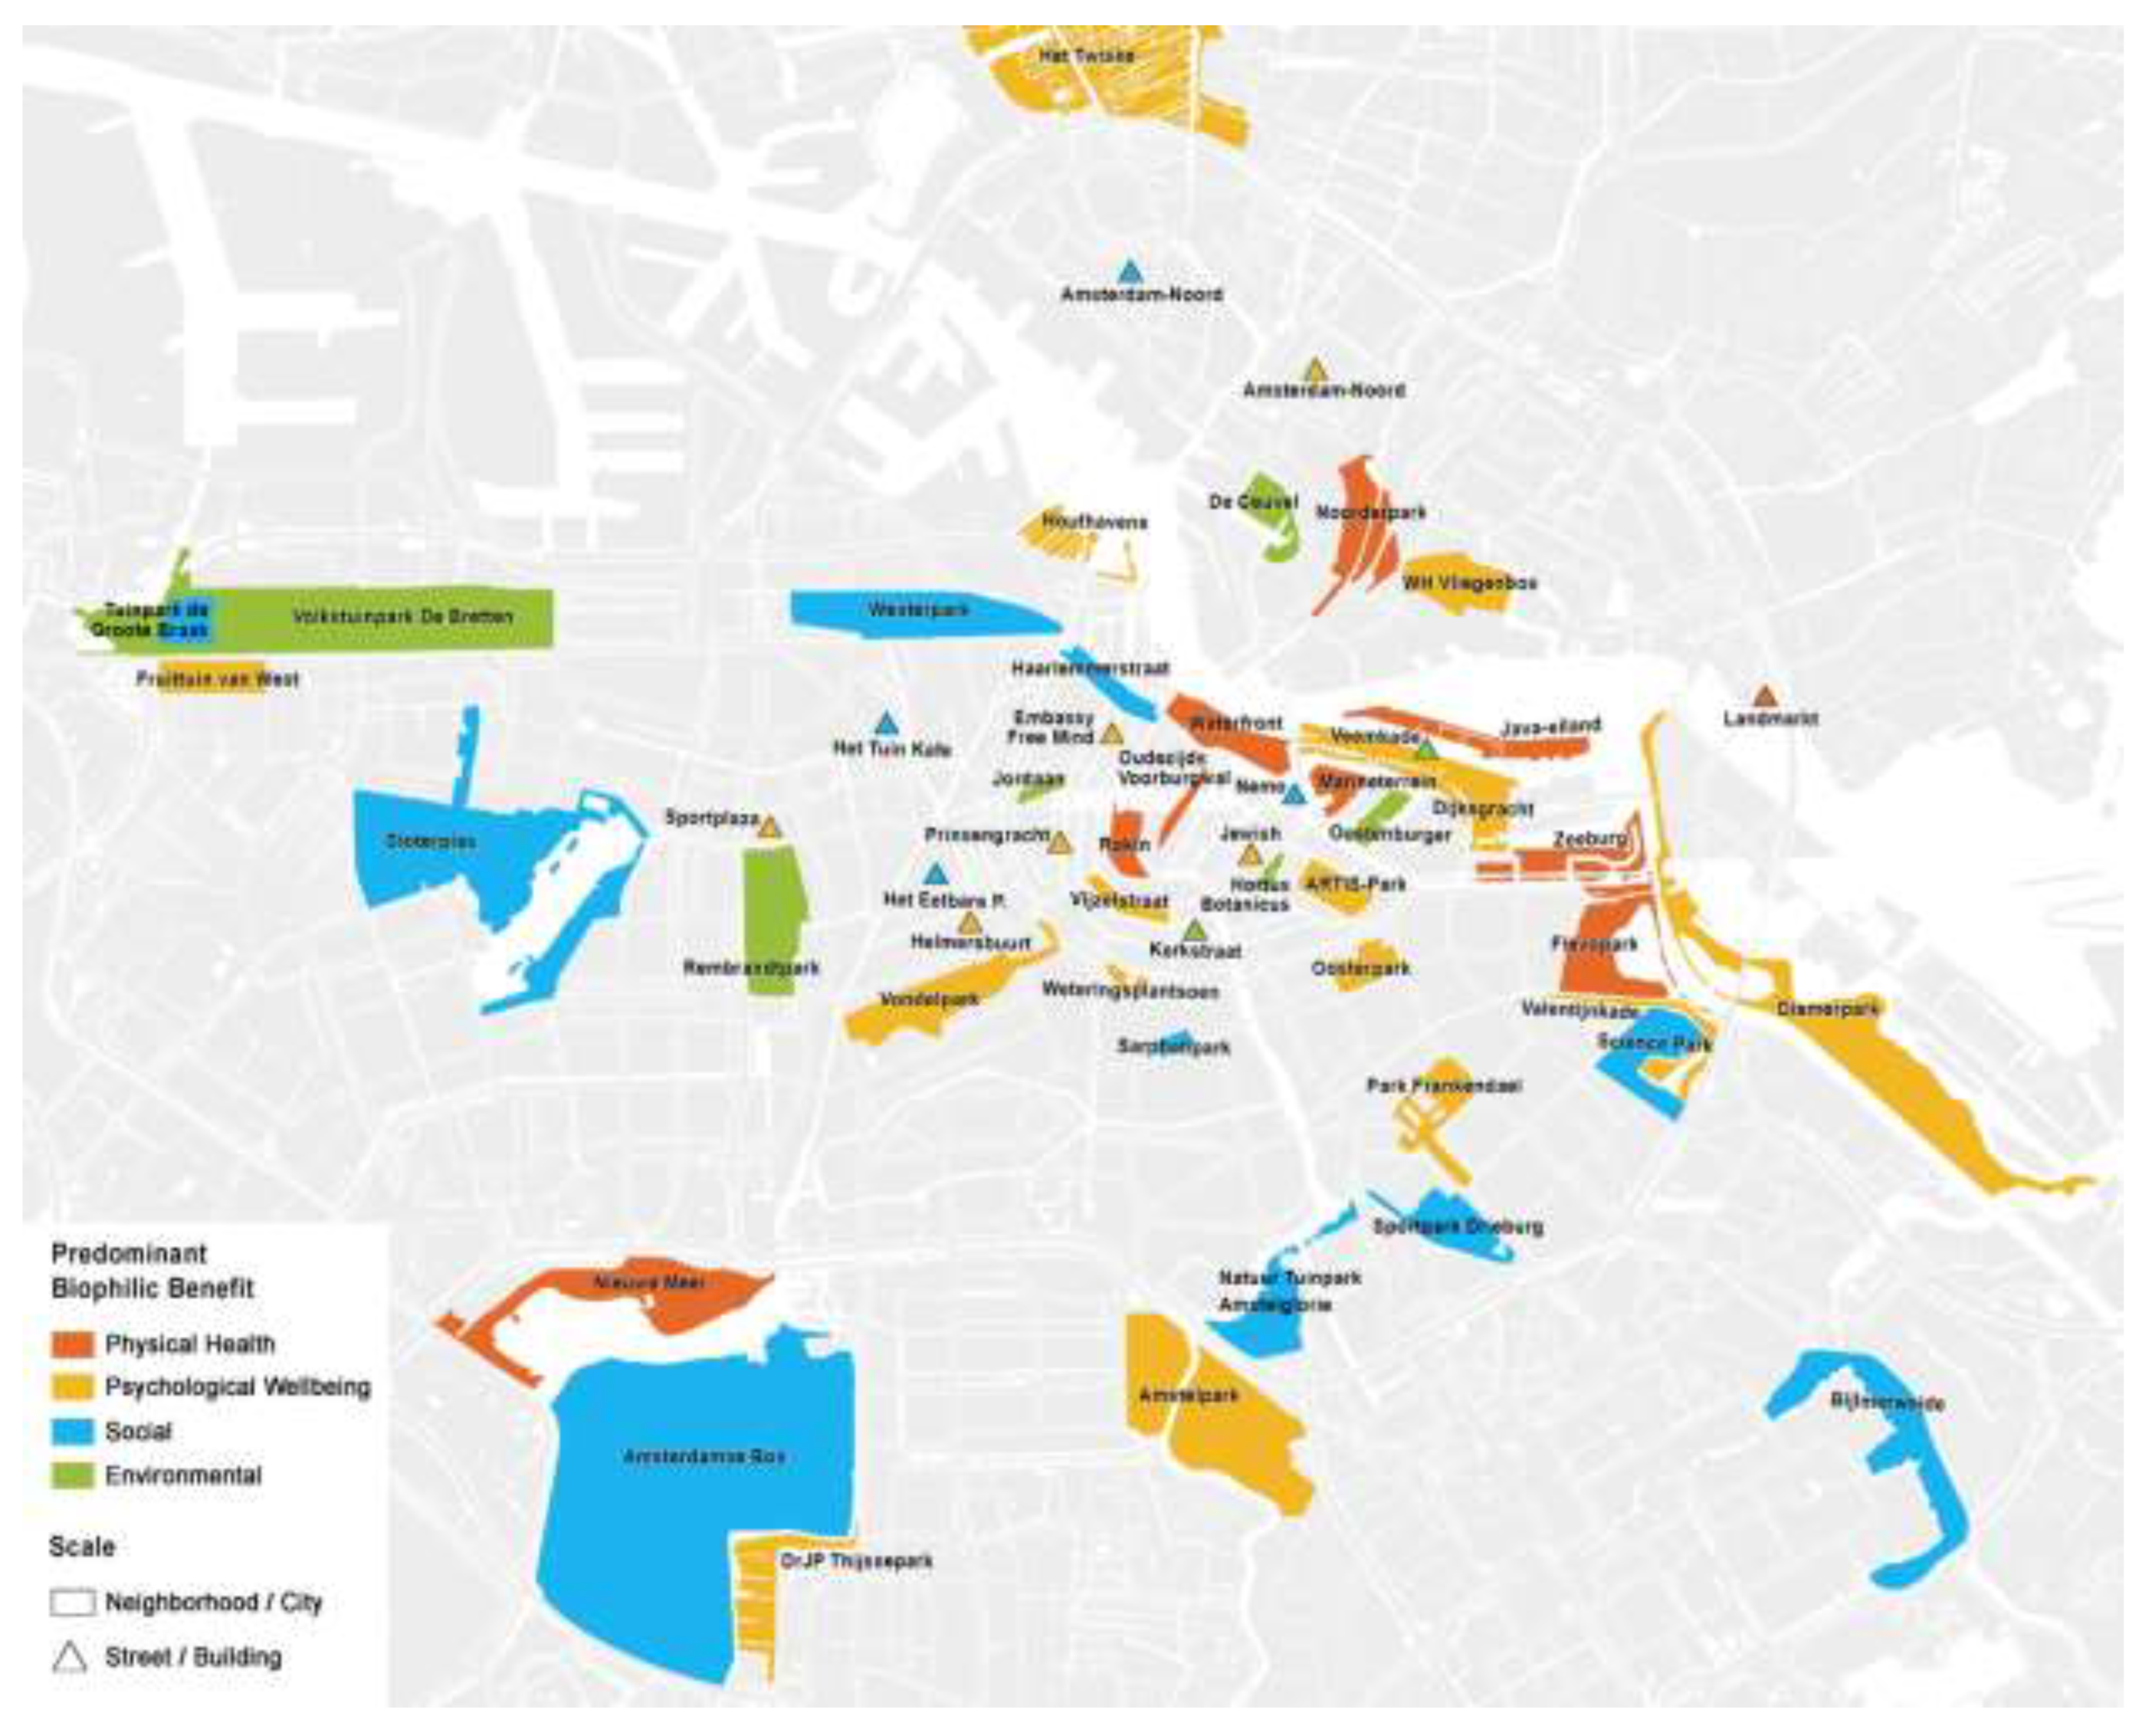
Table 1.
Workshop participant data sorted by date and expertise.
Disclaimer/Publisher’s Note: The statements, opinions and data contained in all publications are solely those of the individual author(s) and contributor(s) and not of MDPI and/or the editor(s). MDPI and/or the editor(s) disclaim responsibility for any injury to people or property resulting from any ideas, methods, instructions or products referred to in the content. |
© 2024 by the authors. Licensee MDPI, Basel, Switzerland. This article is an open access article distributed under the terms and conditions of the Creative Commons Attribution (CC BY) license (http://creativecommons.org/licenses/by/4.0/).
Copyright: This open access article is published under a Creative Commons CC BY 4.0 license, which permit the free download, distribution, and reuse, provided that the author and preprint are cited in any reuse.


