Submitted:
25 November 2024
Posted:
27 November 2024
You are already at the latest version
Abstract
Urban livability is becoming an increasingly significant concept in the field of urban planning and design, especially in rapidly urbanizing mid-sized cities of the Global South, where the unplanned growth raises concerns about living condition of city dwellers. This study aims to improve the understanding of how subjective perceptions and objective assessments of urban livability can coexist and foster effective planning and design of urban environments, in line with broader planning principles. With a focus on Khulna City, Bangladesh, the study examines the geographical dynamics of urban livability and assesses how well subjective judgments and empirical geographic evaluations coincide. By integrating local community input with expert evaluations and socio-technical analysis at the fine geographic granularity of urban districts, the study reveals a strong alignment between people’s lived experiences and empirical geographic data, but also significant discrepancies. The findings highlight the importance of inclusive urban planning that considers both human experiences and environmental factors, stressing the need for flexible planning tools that reflect the unique social and cultural contexts of mid-sized cities in addition to objective assessments. By expanding the understanding of livability beyond major cities, this research addresses a critical gap in urban studies, especially advocating for socially inclusive urban growth models like the 15-minute city concept, which can better serve the Global South’s unique challenges in rapidly urbanizing nations with controlled expansion. The findings underscore the importance to comprehend the factors that influence urban livability for promoting sustainable urban growth and adopting practical land-use plans. Moreover, this study offers valuable guidance for developing land-use strategies that enhance accessibility, equity, and sustainability in fast-growing urban areas.
Keywords:
urban livability
; inclusive urban planning
; community engagement
; mid-sized cities
; global south
1. Introduction
Urban livability has emerged as a crucial concept in the fields of urban studies, planning, and development, particularly in the context of mid-sized cities in the Global South [1,2,3]. As these cities face fast paced urbanization, concerns about equitable and sustainable livability have gained prominence [4,5]. Urban planning in mid-sized cities of the Global South routinely presents unique challenges and opportunities owing to their rapid growth and unplanned physical development [3,6]. The present study aims to critically examine urban livability dynamics empirically by assessing both subjective perceptions and objective indicators, a dual approach that acknowledges the complex and interrelated factors shaping urban environments. With increasing urbanization in mid-sized cities of the Global South, inclusive urban planning is crucial as it involves engaging local communities in shaping their environments, understanding their unique needs, and addressing contextual factors such as locational attributes and environmental conditions. Following this, there are two main objectives this study aims to accomplish. First, it examines the spatial dynamics of urban livability within the setting of Khulna City, Bangladesh, to enhance knowledge about the level of urban livability with the depth of nuances conducive to effective planning and design of urban environments. Second, it covers a significant research gap by seeking to determine the degree of concordance between the objective geographical livability ratings of neighborhoods and the subjective opinions of city dwellers and to highlight circumstances conducive to discrepancies. In this endeavor, this research espouses a broad community perspective, underscoring the vital role that both the experts’ opinions and local residents’ personal insights play in urban planning and design. This lens brings into focus the critical role of local communities besides the experts in visioning and shaping the urban environment, thus pointing to a broader commitment towards planning and designing more livable and more sustainable cities. This study underlines the need to adequately represent the variety of urban experiences and perspectives.
In recent years, the notion of "urban livability" has gained significant attention, leading to the emergence of research on the evolving development patterns in rapidly growing urban areas [7,8]. It has acquired various meanings, encompassing choices individuals make regarding their residential preferences, as well as the notion of preparing urban areas for better living conditions [9,10,11]. A livable urban setting refers to a location where the physical infrastructure and constructed surroundings are intentionally created to improve the residents' living conditions by satisfying their fundamental requirements. According to this viewpoint, livability may be defined as the degree to which locals engage with their living environment [12,13]. Due to its complexity and variety, the concept of livability lacks a precise or universally accepted definition [14,15]. Since "livability" is a relative concept, its significance may vary depending on the context of time and culture. The specific definition of livability depends on the context, chronology, and evaluation objective, as well as the valuing structure of the observer. Hence, there is no agreed-upon description of what makes something livable as its outcome. This would typically include a number of dimensions and several criteria and sub-criteria [16].
Over the last century, urbanization has accelerated significantly in most countries. Not only the rate of geographic extent of cities has soared [17,18], but urban areas are also expanding twice as quickly as their population [19,20] and by 2050, urban areas are expected to accommodate approximately 68% of the world population [3]. On the one hand, this expansion of urban areas has resulted in noticeable changes to urban landscapes; experts have noted that uncontrolled expansion and inadequate planning have a significant impact on the life expectancy of its residents, on the other hand [6,21,22,23]. Also, the lack of proper planning for emerging mid-size cities in developing countries in particular is hampering the living conditions of city dwellers [5,24]. The haphazard growth of cities in developing countries like India, Bangladesh, and others has resulted in a range of negative consequences [5,25] like traffic congestion [26], environmental pollution [27,28,29], and increasing pressure on urban ecology [30], among others. In these circumstances, researchers and policymakers have made strides to enhance the condition of urban life [31,32]. Although the idea of a livable city was first advanced to draw and retain multinational firms, it has now developed into a significant driver of the government's adoption of sustainable urban development policies [33]. This highlights the growing concern regarding effective strategies for overseeing sustainable urban development [34,35,36] and sustainable urban land-use policies to ensure the future well-being of city dwellers [37].
Livability assessment is gaining increasing importance as a driver for sustainable and livable urban development [38] and is considered crucial for enhancing urban livability in developing countries [31,39]. Tracking urban livability in cities supports efforts to mitigate the detrimental consequences of future urban settlements development [32,40,41]. In this context, it has been noted that livability studies are gaining significance in developing nations [8,42]. Urban planners and other practitioners of urban science pay close attention to urban livability as a balanced and harmonious approach to city development [43,44]. Many Chinese cities have already started to give heed to this concept and to incorporate it as one of the objectives for long-term sustainable urban development [8,39,45]. Also, the Indian government has recently made the decision to implement an urban livability index based on a variety of variables, including population, basic infrastructure, historic value, heritage preservation, tourism, crime rate, and public transit system [4]. Recommended by various organizations including the World Health Organization (WHO), this assessment system uses a four-dimensional framework that focuses on the concepts of convenience, amenity, health, and safety. It can be applied to evaluate the livability potential of any city [7]. Based on this evaluation approach, this study examines the spatial dynamics of livability in Khulna City, Bangladesh, by using the Analytic Hierarchy Process (AHP) grounded in expert opinions to conduct an explicitly spatial fine-grain analysis. A suite of variables has been selected by the experts to measure livability, which encompasses the recommended dimensions of livability assessment by WHO. We validate this approach by assessing how closely the objective geographical livability aligns with the subjective perceptions of city dwellers based on their lived experiences with a survey of city dwellers. Thus, this twofold approach provides valuable insights into how residents perceive a place as more livable and underscores the role of bottom-up visions that should frame future urban design and developments.
Research on urban livability has often relied on social statistics or surveys [32,46], overlooking the fine-grain geographic information and the sensitivity of community specific factors, which points to a critical research gap [3,7]. Indeed, relying solely on subjective measures may not provide urban planners with the precise findings needed for effective planning, given the substantial needs of fast growing Global South cities. While few studies have combined the subjective perception of geographic data at the community level [47], extending this approach for entire cities, especially in developing countries with unplanned urban growth, remains understudied. Additionally, the exclusion of mid-sized cities from comparative livability assessments neglects their significant role in sustainable city planning, as most studies have focused predominantly on megacities [48,49]. Deeply comprehending urban livability and its application in mid-size cities is crucial for supporting sustainable land-use policies and motivating governments to adopt sustainable urban development strategies that mitigate the negative impacts of unplanned development on urban settlements [32,33,45]. Therefore, determining the status of urban livability for mid-sized cities in Bangladesh is fundamental to guiding urban governments in addressing the adverse consequences of unplanned development and fostering sustainable urban growth.
This study offers significant contributions to sustainable urban planning and design in the Global South, emphasizing the importance of integrating both expert insights and local community engagement and their complementarity. No prior studies have systematically examined the coexistence of objective indicators and subjective perceptions of urban livability within the context of mid-sized cities in the Global South, where rapid urbanization and unique socio-environmental challenges demand localized and context-specific solutions. By highlighting the coexistence of subjective perceptions and objective livability indicators, this research acknowledges the intrinsic value of resident’s experiences alongside professional urban assessments. The duality effect strongly aligns with Jane Jacob’s foundational principles of local community engagement [50] by integrating the perspectives of local citizens into the planning process. It also resonates with the contemporary 15-minute city concept, which emphasizes accessibility and inclusivity in urban design, making it particularly relevant to the challenges faced by mid-sized cities like Khulna. For cities across the Global South, this study also underscores the importance for land-use strategies that prioritize proximity to services and amenities, ensuring that urban planning is both socially inclusive and environmentally sustainable. This approach not only offers a practical framework for policymakers to initiate informed decisions but also serves as a potential model to address the unique needs of mid-sized cities for establishing socially inclusive, environmentally responsible, and high-quality urban living environment, while preserving diversity. Moreover, by advocating for inclusive and planned urban development to city development authorities, this study provides a strategic model to manage and control future development in a planned manner for achieving UN sustainable development goals (SDGs) [48].
2. Materials and Methods
2.1. Study Area
Located in the Southwestern part of the country, Khulna is one of the largest cities of Bangladesh. It has a geographic area of 51 km2 with a population close to 0.6 million [29]. The land-use pattern of Khulna City has evident spatial differentiation marked by a highly heterogeneous living environment with land uses across 31 municipal wards [27]. Khulna City [Figure 1] has been selected for its standing in the country’s urban system and for its future growth potential coming on the heels of remarkable growth during the past several decades [51]. The scattered growth of cities such as Khulna City affects the overall quality of life of the residents and degrades the urban ecology of the area [30]. The city is also gradually suffering from a series of urban problems, including traffic congestion [26], environmental pollution [27,28,29], and increasing pressure on its infrastructure.
2.2. Overview of Research Framework
A schematic overview of the methodology to study urban livability in Khulna City is presented in Figure 2. In the first step, several criteria of urban livability have been screened out from literature. From the list of indicators, appropriate ones have been selected based on expert opinions for Khulna City. After finalizing the assessment criteria, the next step involved the implementation of AHP to measure the weights of every single indicator. Next, an urban livability map has been produced following the Multi-criteria Decision Making (MCDM) approach applied to multisource data layers in a geospatial platform. Finally, subjective perceptions on livability have been collected from a random sample of city dwellers across locations within the city.
2.3. Dimensions, Indicators and Datasets
Livability is a complex concept that includes different aspects of how good it is to live in a place. Researchers have looked at these aspects in slightly different ways in different studies. In this study, major dimensions and indicators have been selected for assessing urban livability based on a comprehensive literature review. See Table 1 for a synopsis of it. Relevant articles have been reviewed to understand appropriate data requirements and then identify reliable sources [3,6,7,39,52,53]. When we think about it broadly, there are usually four main aspects that researchers talk about: the degree of convenience, the overall pleasantness of the area, its state of healthiness, and its safety. The convenience aspect emphasizes the importance of making sure that city residents can easily reach various facilities and services, making their lives more convenient. The amenity aspect highlights the necessity for the city and its residential areas to have the right infrastructure and spaces to offer comfort and enjoyment to its inhabitants. The health aspect prioritizes the creation of a living environment within cities that encourages the health and overall well-being of their residents. The safety dimension is centered on making sure that people in a city or its residential areas can go about their lives without worrying about harm or danger. The WHO came up with a way to think about livability that embodies these four dimensions. They said it is about how easy things are, how nice the place is, how healthy it is, and how safe it is [3,7]. In our research, we want to measure livability and its variability inside the city, and also consider what people think about it. So, we are using the same four aspects that the WHO suggested: convenience, amenity, health, and safety. Next, a total of 22 indicators that align with them have been identified for livability assessment.
In the interest of consistency of the analysis and to enable the calculation of weighted scores of livability for specific geographical locations within the study area, all 22 indicators have been computed for the same set of geographic locations, taken to be the geometric centers of 15meter x 15meter grid cells. Data for this study have been gathered from a diverse array of sources to ensure a robust and comprehensive dataset. All data are compiled from secondary sources [Table 1] in raster data format. These sources encompass satellite imagery, such as MODIS-A2, MODIS-Q1, Landsat 8, Sentinel-2 and Sentinel-5P, which has been processed through the Google Earth Engine Platform. Additionally, we have obtained pertinent data in vector format from local organizations, including local government entities e.g., Khulna Development Authority (KDA) and selected published documents. Also, whenever possible, point data collected through field surveys and via Google Earth Pro have been integrated to produce a dataset current as of 2022. For the effective visualization, processing and analysis of the data, we have employed geospatial techniques, resulting in a comprehensive and informative map of livability for our study area.
The processing of satellite imagery has primarily involved classification tasks following fairly well-established procedures used in other studies (see references cited in Table 1). The drinking water quality indicator has been computed from original point data [54]; these data have been interpolated through an IDW process in ArcGIS, and finally translated to a 5-class ordinal index based on equal intervals. Distance indicators measure the straight-line distance from each grid cell centroid to the closest feature in its class. This processing was done in ArcGIS.
2.4. Criteria Weighing Through Analytic Hierarchy Process (AHP) Technique
The AHP is regarded as a powerful deterministic method for weighing and ranking criteria based on expert opinions. AHP gained wide application in various domains such as site selection, suitability analysis, regional planning, and landslide susceptibility analysis [58,59]. It accepts and weighs the opinions of experts for multi-criteria decision making. It uses pairwise comparisons to measure the relative importance of the criteria in each level and/or calculate the alternatives in order to prioritize options at the lowest level of the hierarchy [60,61,62,63,64]. In this study, the AHP method serves to weigh and rank the factors of urban livability, based on the opinions of five local experts who are highly experienced and knowledgeable in the practice and education of urban planning.
In this process, we have followed a sequence of five consecutive steps. Initially, a pairwise comparison table is constructed for each dimension based on the assessments of each expert, which are scored on a nine-point Likert scale [62]. Here, the score of 1 refers to equal importance between two compared criteria, while the score 9 indicates an extreme importance of one criterion over another. Second, the scores of experts are averaged into a set of pooled pairwise comparison tables. Third, these pooled tables are converted to square comparison matrices. Fourth, the marginal total within each column of the pairwise comparison matrices are calculated, and subsequently, each value in a column is divided by the marginal total of that particular column, yielding a normalized matrix:
where mij refers to the unnormalized value in i-th row and j-th column and n represents the number of influential parameters in the pairwise comparison matrix. Following normalization, the sum of entries in each column in the matrix equals 1. Lastly, the internal consistency of expert opinions is assessed using the Consistency Ratio (CR), as calculated by equations (2) and (3).
Here, λmax represents the largest eigenvalue of the normalized pairwise comparison matrix, and RI is the random consistency index [65], a predefined constant based on the size of assessment parameters (N). A CR value exceeding 0.10 indicates inconsistency in the comparison matrix, with the implication that the result is unreliable. Hence, the pairwise comparison process needs to be repeated until achieving acceptable consistency below 0.1 (CR < 0.1). Pooled pairwise comparison tables and matrices are shown in Appendix B.
2.5. Urban Livability Assessment and Map Generation
The 22 indicators listed in Table 1 are processed in several steps to generate Khulna City’s livability map. We start with transforming the disparate measurement scales of the indicators to a consistent 5-point scale linked to the spatial thematic layer [Appendix A]. As indicated earlier, to ensure uniformity in spatial data resolutions, we set the spatial resolution of the output to 15m × 15m. The processing and preparation of these spatial criteria layers were accomplished using the ArcGIS 10.8 software.
After finalizing the spatial criteria layers and calculating their weights with the AHP method, we proceeded to generate digital maps of the dimensions in a common georeferencing system. Subsequently, these spatial thematic layers were merged through cartographic modeling [66] using a weighted overlay operation. To conclude, we classified the resulting map into five distinct ordinal categories of livability status for Khulna City, based on equal intervals [Table 3].
2.6. Synthesizing the Insights of City Dwellers
To gain insights into people's understanding of urban livability as mediated by the experiences of their daily lives, a semi-structured survey instrument was developed. The aim of this survey is to assemble primary data to gauge the perspective of local residents on better livability across Khulna City. Primarily, it focuses on addressing the reliability of the findings from the AHP and MCDM analysis. It also analyzes the respondents' opinions through their scoring of the studied indicators that would reveal the degree of concern they have regarding a more livable setting. By distributing this survey to 100 city dwellers who were randomly selected at the household level across various locations within the city, this diverse cross-section of respondents provides a comprehensive and representative understanding about their subjective views on the city's livability. In addition, the respondents were asked to identify in order of preference the top three Khulna City locations they considered the most livable. Then, they were encouraged to provide detailed reasons behind their choices to rank them in the top three. Moreover, the respondents who were not currently residing in any of the places ranked among the top three were also asked to elaborate on the reasons for such choices. This provides valuable insights into the dynamics of urban livability in the city.
3. Results
3.1. Objective Livability Assessment
3.1.1. Priorities in Urban Livability
The consensus prioritization achieved through the AHP exercise [Table 2] indicates that urban convenience is the most important dimension (60%), followed by health considerations (23%), safety (12%), and finally amenities (6%). The contribution towards each dimension of livability is also found to be quite focused on a small number of indicators: only 8 of 22 indicators have a priority score over 20%. Specifically, distance to the city center and to a major road are key determinants of convenience (51% taken together), drinking water quality and distance to a hospital determine health quality (62%), distance to a major road intersection and to a police station identify safe places (82%), and vegetation cover and distance to a recreational facility are the foremost amenities (78%). Each of the four dimensions is further discussed hereunder.
3.1.2. Convenience Dimension
Easy access to facilities and services offers a hassle-free life for city residents. It is a necessity that directly impacts their daily lives. Areas closer to the city center offer easy access to a variety of facilities, like transportation, education, shopping, entertainment, employment opportunities, and so on. Thus, areas closer to the city center stand out as more accessible, and highly livable, whereas peripheral areas exhibit lower livability due to the greater distance to reach the city center. When categorized into different livability tiers [Table 3], the map of the convenience dimension of urban livability [Figure 3a] displays a distinctive spatial pattern that departs from a random geography (Moran’s I = 0.28, p-value < 0.001). It is marked by large clusters of high to very high convenience along the mid-sections of the city (wards no. 6, 7, 10, 14, 16, 17, 18, 19, 20, 21 and 23), surrounded by lower convenience towards the periphery, especially the northern and southern reaches of the city. This distribution highlights that a significant portion of the city falls into the low and moderate livability categories, indicating a considerable scope for enhancing convenience-related aspects.
3.1.3. Amenity Dimension
The amenity aspect emphasizes adequate infrastructures and spaces, which provide residents with comfort and enjoyment. Areas with sufficient infrastructures and spaces indicate higher livability compared to the areas that lack or are distant from this essential urban asset. Breaking down livability levels, the city can be segmented into distinct livability tiers [Table 3]. While overall, the city has a lower livability through the lens of amenities, the map in [Figure 3b] indicates a strongly clustered spatial pattern (Moran’s I = 0.91, p-value < 0.001). Especially, the city center (wards no. 5, 6, 7, 18, 19, 20, 21, 26, 27, 28, 29, 30 and 31) is suffering from a severe lack of essential amenities, including vegetation cover, open spaces, water areas, and recreational facilities. The distribution reveals that a large portion of the city needs significant improvement in amenities, especially its central areas.

Table 3.
Land area and percentages under each livability status by considered dimension.
| Livability Status | Convenience | Amenity | Health | Safety | ||||
|---|---|---|---|---|---|---|---|---|
| (%) | Area (Sq.km) | (%) | Area (Sq.km) | (%) | Area (Sq.km) | (%) | Area (Sq.km) | |
| Very Low | 9.08 | 4.63 | 1.3 | 0.66 | 0.39 | 0.20 | 0.75 | 0.38 |
| Low | 30.69 | 15.65 | 36.63 | 18.68 | 8.98 | 4.27 | 9.58 | 4.89 |
| Moderate | 32.00 | 16.32 | 57.39 | 29.27 | 26.98 | 13.76 | 41.66 | 21.24 |
| High | 23.48 | 11.98 | 4.65 | 2.37 | 60.59 | 30.90 | 39.81 | 20.30 |
| Very High | 4.75 | 2.42 | 0.03 | 0.02 | 3.66 | 1.87 | 8.21 | 4.18 |
3.1.4. Health Dimension
Access to healthcare services, such as hospitals or clinics, safe drinking water, proper distance from manufacturing districts, better air quality, and so on, prioritizes health and promotes overall well-being. Areas having these characteristics reveal a higher livability status compared to those that do not. From a health perspective, the city's overall livability is quite high [Table 3]. However, the urban livability map of health dimension [Figure 3c] presents a geographic pattern that is strongly clustered and contrasted (Moran’s I = 0.97, p-value < 0.001). In the southern part of the city, particularly in wards no. 30 and 31, livability significantly declines because of saline drinking water. Addressing the issue of saline water is crucial to improve livability in these areas.
3.1.5. Safety Dimension
The safety dimension allows people to live without worrying about threats or being harmed. Living in areas close to police and fire stations enhances safety and livability. Moreover, areas far from major road intersections or gas station, have also better livability status as it has lower accident and fire incident risks. Through the lens of safety, Khulna City’s livability is good overall [Table 3], but the livability map of safety dimension [Figure 3d] indicates heterogeneity that follows a clustered spatial pattern (Moran’s I = 0.99, p-value < 0.001). A few of the central areas (wards no. 6, 9, 14, 16, 18, 20, 21 and 26) exhibit lower livability due to the proximity to major road intersections, which occasionally leads to serious traffic accidents as well as increased noise and air pollution. Considering this, urban traffic management and pollution control measures can be an effective way to improve livability.
3.1.6. Overall Urban Livability Status
The overall livability scenario in Khulna City, as depicted by the map in Figure 4, reveals that local disparities are consistent with a significantly clustered geographic pattern as a whole (Moran’s I = 0.97, p-value < 0.001). The central areas of the city boast a high livability status, offering residents easy access to essential amenities and services in particular. Notably, wards 5, 6, 7, 10, 14, 16, 17, 18, 19, 20, 21, and 23 are strategically situated close to these high livability zones, benefiting from a better quality of life. On the other hand, living away from these central areas towards the peripheries of the city, a noticeable decline in livability becomes evident. While the city as a whole exhibit a moderate level of livability, there are striking disparities. The upper northern and lower southern parts of the city face challenge in terms of livability status. These areas are distant from the city's center, resulting in reduced connectivity, a lack of essential services, limited access to drinkable water, and the presence of manufacturing activities, which pose health risks to residents. Urgent attention is required for wards 2, 3, 4, 8, 13, 30, and 31, as they face significant livability challenges. Improvements in these regions are imperative to provide residents with a healthier and more conducive living environment. By addressing these concerns, urban planners and policymakers can work towards creating a more balanced and inclusive livability landscape for residents of Khulna City.
3.2. Insights from City Dwellers
3.2.1. Determinants of Urban Livability from People’s Perspectives
Valuable insights into how residents of Khulna City conceive urban livability on the basis of their own lived experiences can be gained from simple distributional properties of a standard set of livability indicators such as those discussed earlier in this article [Figure 5]. The average score of each indicator reveals the importance residents show towards these factors when making decisions about where to live, and therefore their degree of concern regarding a more livable place from each perspective. The scores have been assessed using a five-point Likert scale. This permits us to assess the convergence of views held by the local citizens and those expressed by the urban planning experts.
When considering the convenience dimension, people have prioritized proximity to the city center and to major roads as the two most influential factors (3.95 and 4.01, respectively), as these aspects enable connectivity to essential facilities located in central areas of the city and ensure getting other services with easy access. Also, proximity to educational institutions has emerged as another significant advantage (3.27 to 3.29), as people think that being close to schools provides more safety and accessibility for their children. However, the library, bus station, train station and post office hold less draw in people’s residential preferences and therefore in shaping their vision of the livable city (3.16, 2.95, 2.61 respectively).
With regards to the amenity dimension, respondents have shown their desire to a similar degree towards all four factors. People think that recreational facilities, greeneries, open space and water areas collectively play a significant towards a more satisfying and high-quality living experience (all are above 3.5).
From the health perspective, people have expressed their strong consideration for drinking water quality and air quality (scores of 4.28 and 4.12, respectively). Being situated along the Rupsha River, a nearby section of the city is plagued by saline water, which is commonly considered unhealthy. Additionally, high levels of dust and pollutants downgrade air quality in the core commercial urban areas; as a result, people rate these factors as a major concern. Also, people place a premium on having a health care facility readily accessible (3.93). Conversely, other health related factors are comparatively less of a concern to local residents (less than 3.25).
When it comes to safety considerations, people have shown similarly high levels of liking for the proximity to fire station and police station (3.41 and 3.22 respectively), perceiving that this closeness mitigates the potential harm or risks. Moreover, they have also prioritized the distance from major road intersections for a noise free and less polluted environment (3.28). Gas stations hold the least importance of the safety considerations (2.68).
To sum up, residents have a clear sense of what livability conditions may be in Khulna City. Average scores exhibit a broad range across indicators, from a minimum of 2.29 for the distance to manufacturing districts to a maximum of 4.28 for drinking water quality. Also, it is clear that Khulna City residents have diverse views on what livability may entail and what conditions bundle together to create more livable places and geographic environments. Standard deviations across the sample [Figure 5] are pretty consistently high, which underscores the role of people’s personal experiences in filtering their perspectives on urban livability, a point that will be brought up again later in the article. Altogether, these findings can serve as a reliable source of information for city planners and policymakers, helping them to prioritize their efforts towards improving the factors that have importance to residents. Furthermore, it is noteworthy that the average subjective scores on the 22 indicators are largely in line with the opinions expressed by the urban planning experts who informed us during the AHP implementation reported earlier in this paper. Therefore, this concordance lends credence to the objective assessment of urban livability in Khulna City that was conducted on the basis of AHP analysis. Yet, the broad variance of scorings intimates that objective assessment of livability is not sufficient to convey the state of conditions across the urban space and that personal experiences rooted in social and economic circumstances as well as spatially grounded contexts matter to a considerable extent. This is now further studied.
3.2.2. Subjective Livability in Khulna City
Survey respondents were prompted to name the three neighborhoods they consider as having the highest degree of livability in Khulna City at the present time. Overall, the three locations that garner the greatest numbers of endorsements are Sonadanga, Nirala, and Gollamari, with response rates of 43%, 39%, and 33%, respectively [Figure 6]. Forming a second tier, the areas of Moylapota, South Central Road, and Boyra garnered moderate responses at 29%, 26%, and 23%, respectively, while other areas received significantly fewer responses. The fifteen locations that received non-trivial endorsement (over 5) are all situated in rather close proximity to each other. The geography of living preferences along with the spatial pattern of urban livability from objective findings indicate that the central sections of the city are more livable than peripheral areas [Figure 6]. Hence, the living preferences of city dwellers align well with the observed pattern of livability found in the objective findings of our analysis. From the opinions expressed by residents, the preferred locations demonstrate that, on the whole, the central parts of the city are highly preferable to live, which also supports the outcome of the AHP and MCDM analysis. Even though two of the highly desired neighborhoods identified by city dwellers, Nirala and Gollamari, somewhat depart from the objective findings, they stand out as emerging areas that have seen significant improvements in their service and facility offerings towards a better quality of life. Notwithstanding these cases, the preferences of livable areas by city dwellers are in agreement with the spatial pattern of urban livability identified from the objective findings of urban livability mapping for Khulna City.
The reasons behind these preferences are multifaceted [Figure 7]. A significant number of individuals cited the presence of a wide range of services, the convenient proximity to the city center, and easily accessible transportation facilities as the driving factors behind their choices. Moreover, the top-ranked areas were perceived as well-planned with better infrastructure systems, standard road widths, and a serene and clean environment, making them attractive to potential residents. Enhanced security measures, ample green spaces, improved sanitation, and efficient waste management systems were also highlighted as contributing factors to the favorable disposition towards these areas. These data illustrate a clear trend towards urban planning and infrastructure quality influencing the residential choices of Khulna City's inhabitants. The findings emphasize the importance of considering these factors in future urban development and city planning initiatives to create more livable and attractive areas for residents.
3.2.3. Reasons for Not Relocating to Favorite Living Areas
However, it is crucial to understand why certain individuals may decide not to relocate to their favorite living areas. While their endorsement of Sonadanga, Nirala, and Gollamari as ideal places to live is quite overwhelming, they have mentioned a few reasons that prevent them from residing in these areas. According to the respondents, several common factors deter individuals from relocating to their highly regarded areas [Figure 8].
One of the most prevalent reasons is the cost of living. While these preferred places are considered highly desirable, the elevated living expenses, encompassing housing, utilities, and other amenities, often exceed the budgetary constraints of many; this may lead them to seek alternative options.
A respondent from the Rupsha slum stated it as follows:
“Although we aspire to reside in those areas, the cost of living there is beyond our means. As low-income individuals, it becomes exceedingly challenging to sustain our households amidst the rising expenses, making it unattainable for us to afford a decent place to live.”
Another significant reason that discourages people from relocating is their attachment to their own homes or ancestral properties. The presence of a homestead or ancestral home often binds them to their current location, even if they express a desire to move elsewhere.
A respondent from Religate stated it as follows:
"As this is my ancestral home where I grew up and have been living here for a long time, I don't feel any problem, everything is fine with facilities and I have some business of my own, due to which I do not want to relocate to the area.”
Social connections play a significant role in relocation decisions, fostering a sense of familiarity and belonging. This connection and sense of belonging make it challenging for individuals to relocate to a different place where a new social network would need to be weaved. Individuals who have spent a substantial amount of time in their current area find it challenging to sever the bonds they have forged with the community. This sense of connection and belonging becomes a powerful deterrent to moving to a different place.
A respondent from Dawlaatpur stated the following:
“We have been living in this area for almost 14 years and have developed a special relationship and bonding with the people of the area. Everyone knows each other and behaves like family because of this I don't want to leave the familiar area and go to another area.”
Considering the distance to one’s workplace is another essential factor. A lengthy commute can be both time-consuming and costly, leading many individuals to opt for living closer to their current workplace, even if living conditions are less attractive. The added time and expenses associated with a longer commute often discourage individuals from relocating to their better regarded locations.
A respondent from Rupsha stated it as follows:
“I am an employee of Caritas and have been living in Rupsha for four long years as my workplace is nearer to here. As moving home away from the workplace will increase both my travel time and cost. That's why I choose this location to live in.”
For some families, the proximity to their children's school becomes a significant consideration. Many individuals prioritize living in areas near school to ensure their children can safely and confidently commute to and from school.
A respondent from Boyra stated the following:
“The only reason we live here is because my daughter's school is very close. Since she is young, it is convenient for us to bring her to school and pick her up, especially since her father is often at work. Additionally, having a nearby residence allows flexibility for my daughter to come and go to school safely or fearlessly.”
In conclusion, the reasons for not relocating to areas with high livability are diverse and deeply rooted in personal, financial, and social considerations. These factors highlight the importance of personal attachments, financial constraints, and practicality in making decisions about where to reside.
4. Discussion
4.1. Coexistence of Subjective – Objective Measures: Embracing Broader Planning Principles
The study highlights the intricate interplay between subjective perception and objective livability indicators in assessing urban livability, which is complex and often not as straightforward as one might expect. It has been found that the objective indicators are often rooted in the subjective experiences and preferences of city dwellers, underscoring the critical role of local community input in shaping urban living environments. As highlighted by previous research [2], the livability concept encompasses a broad range of considerations including both subjective experiences and objective realities, which establish a connection between individual well-being, livable communities, and a sustainable environment. This dual essence of livability highlights the necessity for more balanced urban planning. Such interconnections reaffirm the vital role of community engagement in the urban planning process, reflecting the fundamental principles of Jane Jacobs [50], to consider the bottom-up insights from local populations alongside the traditional top-down planning practice. This is echoed by our findings, which highlight the fact that livability cannot be completely grasped by using just objective measures.
Our findings align with studies in Dhaka, Bangladesh, which show that subjective perceptions of safety, accessibility to basic services, and environmental health significantly shape residents’ experiences of livability in dense neighborhoods [67]. This concurrence suggests a more holistic strategy to incorporate localized community feedback and subjective experiences to actually improve the quality of life for all citizens when developing urban landscapes [2]. However, in Dhaka, challenges such as noise pollution and traffic congestion further exacerbate subjective dissatisfaction, a factor less pronounced in Khulna's urban environment. This comparison illustrates the relative advantages and challenges unique to mid-sized cities like Khulna versus larger megacities like Dhaka. Another recent research [68] has also emphasized the significance of the participatory approach in local level urban planning by illustrating how the integrated feedbacks from community people can effectively address the multiple social, economic and environmental aspects in developing strategies at local level. This points to the importance of capturing local values and needs comprehensively. Researchers argued that incorporating the needs and preferences of the population in the city planning and neighborhood design leads to more sustainable and satisfactory outcomes [69]. This participatory approach strongly aligns with the findings of our study, highlighting that community driven insights are crucial for improving the objective factors in an effective manner to guide the urban growth sustainably.
The locational factors and the agglomeration of facilities play a crucial role in shaping urban livability, as evidenced by recent study [70], which emphasize that locations with better pedestrian accessibility tend to attract a higher concentration of community facilities, including retail centers, parks, and other amenities. Recent research in Barishal highlights the importance of urban open spaces in fostering livability, with residents expressing dissatisfaction due to insufficient maintenance and accessibility [71]. This contrasts with our findings, where Khulna city dwellers prioritized proximity to workspaces and schools over recreational spaces. These differences underscore how city-specific priorities shape perceptions of urban livability. In comparison to studies in Raiganj, India, where spatial livability assessments showed declining livability in peripheral regions due to inadequate access to infrastructure [3], our study similarly found peripheral areas of Khulna to exhibit lower livability scores. However, the incorporation of subjective preferences, such as proximity to educational facilities and markets, offers a more nuanced understanding of this dynamic in Khulna. Continuing this perspective, our findings also reveal that while the objective analysis of urban livability identifies the central districts as boasting a significantly higher degree of livability compared to the outlying regions, the subjective perceptions of city dwellers also illuminate their desire for accessibility and convenience. This finding is echoed in research conducted in small cities like Mongla and Noapara, where rapid urbanization and insufficient infrastructure development created disparities in accessibility, emphasizing the role of social processes and local governance in shaping urban livability [72]. The objective assessment validates these subjective preferences, indicating that areas closer to service amenities are perceived as more livable. This resonates with other findings, where the visual space indicators on resident’s subjective perceptions have been demonstrated [73]; hence, the significance of considering both subjective and objective perception together in shaping urban livability. Researchers also found that most livable areas identified by geographic model overlapped with individuals preferred living environment [6]. Residents emphasize the importance of living close to their workplace, urban centers, schools, major roads etc., which are markers of a preference for areas that offer more convenience and accessibility. This clustering effect of services and facilities is driven not only by proximity but also by individual preferences for multiple facilities in close proximity with reduced need for travel. The high density and centrality of these locations contribute significantly to the vibrancy and livability of urban neighborhoods [70]. This observation aligns with earlier works which posited that livability tends to progressively decrease as one moves away from the city's central business district towards its periphery [56,74]. Residents prioritize the proximity to convenience service areas over environmental concerns, strongly aligning with the 15-minute city concept, that aims for allocating essential goods and services accessible within 15 minutes of travel. So, this study underscores the importance of carefully planned urban form and community facility distribution in enhancing accessibility and promoting a livable urban environment.
Furthermore, it is impossible to ignore the influence that the physical environment plays in making cities livable. According to previous research [1], vegetation cover, water areas and other natural environmental elements are important for raising urban comfort levels and making cities more livable overall. The study also suggests that while human thermal sensation is an important aspect of livability, relying solely on subjective measures may not provide urban planners with the precise findings needed for effective planning. Our results support this, highlighting the necessity of a well-rounded strategy that combines objective environmental measurements with subjective human experiences in order to attain sustainable urban livability.
4.2. Barriers to Relocation in Preferred Living Areas: Insights of City Dwellers
The findings reveal several underlying reasons for individuals to opt not to relocate to their preferred living locations, despite the universal desire for highly livable settings. In effect, this identifies the premises for dissonance between goals and aspirations on the one hand, actions and behaviors on the other hand. For instance, the cost of living and affordability often create inner conflicts between personal desires and practical circumstances. In New York City, despite being reputed for better living, the high living cost has been found to lead to mixed feelings among the residents [75]. Additionally, individuals' emotions are significantly influenced by their social connections and familiarity with their surroundings. A few studies have stated that strong social connections may contribute to an individual's own happiness [76]. Factors like birthplace and ancestral home further limit individual’s choices.
4.3. Limitations
Assessing urban livability status in Khulna City revealed significant challenges. The lack of universally accepted definition of livability underscores its complex nature, which may vary by geographic location and cultural norms. However, this research explored the connections between objective geographic indicators and residents’ subjective perceptions, highlighting the importance of both perspectives in urban planning and policy making to enhance the overall livability of the city. Further investigation is needed to understand the relationship between livability and residents’ satisfaction, considering variables such as age, gender, occupation and income. While this study does not encompass these aspects, they warrant future exploration. Also, given the fast pace of socio-physical changes in mid-size cities such as Khulna City, cross-sectional studies represent only a snapshot entry point in understanding the causal chains of evolutionary dynamics in the complex geographies of human capital and livability. Longitudinal observatories are needed to channel energies and policies towards more sustainable urban futures.
5. Conclusions
This study has explored the correspondence between subjective perceptions and objective assessment of urban livability at fine spatial granularity in Khulna city, Bangladesh by integrating residents’ experiences with geospatial analysis. The objective analysis revealed a distinct pattern of livability, with central areas having higher livability status, while the peripheral areas show a declining nature. In addition, the research has confirmed that subjective preferences, such as proximity to workplaces, schools, and urban centers are also reflected and strongly aligned with the objective analysis, which reveals high communalities between the subjective and objective perspectives in livability assessments. The findings support the broader planning principle, especially advocating for socially inclusive urban growth models like the 15-minute city concept, which can better serve the Global South’s unique challenges in rapidly urbanizing nations with uncontrolled expansion. Given the notable points of departure in subjective perceptions of livability and other environment interactions with objectives assessments, the study also offers valuable insights for fostering more inclusive, accessible, and sustainable urban environments by emphasizing community engagement and physical factors in urban planning process that can guide more balanced and equitable urban growth, given the unique social and geographic dynamics of these regions of Global South.
Author Contributions
Conceptualization, P.K.J. and M.Z.H.; methodology, P.K.J.; software, P.K.J.; validation, P.K.J., M.Z.H. and J.C.T; formal analysis, P.K.J.; investigation and data curation, P.K.J.; writing—original draft preparation, P.K.J..; writing—review and editing, P.K.J., M.Z.H. and J.C.T; visualization, P.K.J; supervision, M.Z.H. and J.C.T; project administration, M.Z.H. and J.C.T.; funding acquisition, M.Z.H. and J.C.T.
Funding
The research project did not receive any funding.
Institutional Review Board Statement
Not applicable.
Informed Consent Statement
All participants were comprehensively briefed on the assurance of their anonymity, the purpose behind the research, and the potential utilization of the data in case of publication. As is standard in all research involving human subjects, ethical approval from the relevant ethics committee was secured.
Data Availability Statement
The data presented in this study are available on request.
Acknowledgments
We extend our sincere gratitude to the experts for generously sharing their invaluable insights, and to all individuals who contributed their perspectives in our study.
Conflicts of Interest
The authors declare no conflicts of interest.
Appendix A. Rescaling of Indicators
|
Indicator (Numerical Measurement Scale) |
Ordinal Scale of Livability | ||||
| Very Low (1) | Low (2) | Moderate (3) | High (4) | Very High (5) | |
| Distance to city center | Over 1400 | 1200-1400 | 1000-1200 | 800-1000 | Under 800 |
| Distance to major road | Over 400 | 300-400 | 200-300 | 100-200 | Under 100 |
| Distance to bus terminal | Over 1400 | 1200-1400 | 1000-1200 | 800-1000 | Under 800 |
| Distance to train station | Over 1400 | 1200-1400 | 1000-1200 | 800-1000 | Under 800 |
| Distance to post office | Over 2000 | 1500-2000 | 1000-1500 | 500-1000 | Under 500 |
| Distance to library | Over 2000 | 1500-2000 | 1000-1500 | 500-1000 | Under 500 |
| Distance to secondary school | Over 900 | 700-900 | 500-700 | 300-500 | Under 300 |
| Distance to primary school | Over 500 | 400-500 | 300-400 | 200-300 | Under 200 |
| Vegetation coverage | Under -0.6 | -0.6- -0.2 | -0.2-0.2 | 0.2-0.6 | Over 0.6 |
| Availability of open space | 0 | -- | -- | -- | 1 |
| Availability of water areas | Under -0.6 | -0.6- -0.2 | -0.2-0.2 | 0.2-0.6 | Over 0.6 |
| Distance to recreation facility | Over 800 | 700-800 | 600-700 | 500-600 | Under 500 |
| Distance to hospital | Over 800 | 700-800 | 600-700 | 500-600 | Under 500 |
| Distance to manufacturing district | Under 300 | 300-500 | 500-700 | 700-900 | Over 900 |
| Air quality | Under 4.376 | 4.376-4.422 | 4.422-4.468 | 4.468-4.514 | Over 4.514 |
| Drinking water quality | Under 113.75 | 113.75-179.00 | 179.00-244.25 | 244.25-309-50 | Over 309.50 |
| Soil salinity | Over 0.6 | 0.2-0.6 | -0.2-0.2 | -0.6- -0.2 | Under -0.6 |
| Urban heat island | Over 15268.3 | 15216.1-15268.3 | 15163.8-15216.1 | 15111.6-15163.8 | Under 15111.6 |
| Distance to major road intersection | Under 200 | 200-300 | 300-400 | 400-500 | Over 500 |
| Distance to police station | Over 2000 | 1500-2000 | 1000-1500 | 500-1000 | Under 500 |
| Distance to fire station | Over 1700 | 1400-1700 | 1100-1400 | 800-1100 | Under 800 |
| Distance to gas station | Under 200 | 200-300 | 300-400 | 400-500 | Over 500 |
Appendix B. Pairwise Comparison Matrix and Weight Values
Table B.1.
Pairwise comparison matrix for the dimensions.
| Dimensions | Convenience | Amenity | Health | Safety |
|---|---|---|---|---|
| Convenience | 1.00 | 7.00 | 5.00 | 5.00 |
| Amenity | 0.14 | 1.00 | 0.20 | 0.33 |
| Health | 0.20 | 5.00 | 1.00 | 3.00 |
| Safety | 0.20 | 3.00 | 0.33 | 1.00 |
Table B.2.
Normalized pairwise comparison and weight value for the dimensions.
| Dimensions | Convenience | Amenity | Health | Safety | Criterion Weight |
|---|---|---|---|---|---|
| Convenience | 0.65 | 0.44 | 0.77 | 0.54 | 0.60 |
| Amenity | 0.09 | 0.06 | 0.03 | 0.04 | 0.06 |
| Health | 0.13 | 0.31 | 0.15 | 0.32 | 0.23 |
| Safety | 0.13 | 0.19 | 0.05 | 0.11 | 0.12 |
| Sum | 1.00 | ||||
Table B.3.
Pairwise comparison matrix for the convenience dimension.
| Convenience | DUC | DMR | DBT | DTS | DPO | DL | DSS | DPS |
|---|---|---|---|---|---|---|---|---|
| DUC | 1.00 | 3.00 | 3.00 | 3.00 | 9.00 | 9.00 | 3.00 | 3.00 |
| DMR | 0.33 | 1.00 | 3.00 | 7.00 | 9.00 | 7.00 | 3.00 | 3.00 |
| DBT | 0.33 | 0.33 | 1.00 | 3.00 | 7.00 | 7.00 | 5.00 | 0.33 |
| DTS | 0.33 | 0.14 | 0.33 | 1.00 | 5.00 | 5.00 | 0.33 | 0.33 |
| DPO | 0.11 | 0.11 | 0.14 | 0.20 | 1.00 | 0.14 | 0.14 | 0.14 |
| DL | 0.11 | 0.14 | 0.14 | 0.20 | 7.00 | 1.00 | 0.20 | 0.20 |
| DSS | 0.33 | 0.33 | 0.20 | 3.00 | 7.00 | 5.00 | 1.00 | 1.00 |
| DPS | 0.33 | 0.33 | 3.00 | 3.00 | 7.00 | 5.00 | 1.00 | 1.00 |
| Distance to city center = DUC, Distance to major road = DMR, Distance to bus terminal = DBT, Distance to train station = DTS, Distance to post office = DPO, Distance to library = DL, Distance to secondary school = DSS, Distance to primary school = DPS | ||||||||
Table B.4.
Normalized pairwise comparison and weight for convenience dimension.
| Convenience | DUC | DMR | DBT | DTS | DPO | DL | DSS | DPS | Criterion Weight |
|---|---|---|---|---|---|---|---|---|---|
| DUC | 0.35 | 0.56 | 0.28 | 0.15 | 0.17 | 0.23 | 0.22 | 0.33 | 0.29 |
| DMR | 0.12 | 0.19 | 0.28 | 0.34 | 0.17 | 0.18 | 0.22 | 0.33 | 0.23 |
| DBT | 0.12 | 0.06 | 0.09 | 0.15 | 0.13 | 0.18 | 0.37 | 0.04 | 0.14 |
| DTS | 0.12 | 0.03 | 0.03 | 0.05 | 0.10 | 0.13 | 0.02 | 0.04 | 0.06 |
| DPO | 0.04 | 0.02 | 0.01 | 0.01 | 0.02 | 0.00 | 0.01 | 0.02 | 0.02 |
| DL | 0.04 | 0.03 | 0.01 | 0.01 | 0.13 | 0.03 | 0.01 | 0.02 | 0.04 |
| DSS | 0.12 | 0.06 | 0.02 | 0.15 | 0.13 | 0.13 | 0.07 | 0.11 | 0.10 |
| DPS | 0.12 | 0.06 | 0.28 | 0.15 | 0.13 | 0.13 | 0.07 | 0.11 | 0.13 |
| Sum | 1.00 | ||||||||
Table B.5.
Pairwise comparison matrix for the amenity dimension.
| Amenity | VC | AOS | AWA | DRF |
|---|---|---|---|---|
| VC | 1.00 | 5.00 | 5.00 | 3.00 |
| AOS | 0.20 | 1.00 | 5.00 | 0.33 |
| AWA | 0.20 | 0.20 | 1.00 | 0.20 |
| DRF | 0.33 | 3.00 | 5.00 | 1.00 |
| Vegetation coverage = VC, Availability of open space = AOS, Availability of water areas = AWA, Distance to recreation facilities = DRF | ||||
Table B.6.
Normalized pairwise comparison and weight for the amenity dimension.
| Amenity | VC | AOS | AWA | DRF | Criterion Weight |
|---|---|---|---|---|---|
| VC | 0.58 | 0.54 | 0.31 | 0.66 | 0.52 |
| AOS | 0.12 | 0.11 | 0.31 | 0.07 | 0.15 |
| AWA | 0.12 | 0.02 | 0.06 | 0.04 | 0.06 |
| DRF | 0.19 | 0.33 | 0.31 | 0.22 | 0.26 |
| Sum | 1.00 | ||||
Table B.7.
Pairwise comparison matrix for the health dimension.
| Health | DTH | DMC | AQ | DWQ | SS | UHI |
|---|---|---|---|---|---|---|
| DTH | 1.00 | 3.00 | 5.00 | 0.33 | 5.00 | 3.00 |
| DMC | 0.33 | 1.00 | 5.00 | 0.33 | 5.00 | 3.00 |
| AQ | 0.20 | 0.20 | 1.00 | 0.20 | 0.33 | 0.33 |
| DWQ | 3.00 | 3.00 | 5.00 | 1.00 | 5.00 | 5.00 |
| SS | 0.20 | 0.20 | 3.00 | 0.20 | 1.00 | 3.00 |
| UHI | 0.33 | 0.33 | 3.00 | 0.20 | 0.33 | 1.00 |
| Distance to hospital = DTH, Distance to manufacture centers = DMC, Air quality = AQ, Drinking water quality = DWQ, Soil salinity = SS, Urban heat island = UHI | ||||||
Table B.8.
Normalized pairwise comparison and weight for the health dimension.
| Health | DTH | DMC | AQ | DWQ | SS | UHI | Criterion Weight |
|---|---|---|---|---|---|---|---|
| DTH | 0.20 | 0.39 | 0.23 | 0.15 | 0.30 | 0.20 | 0.24 |
| DMC | 0.07 | 0.13 | 0.23 | 0.15 | 0.30 | 0.20 | 0.18 |
| AQ | 0.04 | 0.03 | 0.05 | 0.09 | 0.02 | 0.02 | 0.04 |
| DWQ | 0.59 | 0.39 | 0.23 | 0.44 | 0.30 | 0.33 | 0.38 |
| SS | 0.04 | 0.03 | 0.14 | 0.09 | 0.06 | 0.20 | 0.09 |
| UHI | 0.07 | 0.04 | 0.14 | 0.09 | 0.02 | 0.07 | 0.07 |
| Sum | 1.00 | ||||||
Table B.9.
Pairwise comparison matrix for the safety dimension.
| Safety | DMRI | DPS | DFS | DPP |
|---|---|---|---|---|
| DMRI | 1.00 | 3.00 | 5.00 | 5.00 |
| DPS | 0.33 | 1.00 | 5.00 | 5.00 |
| DFS | 0.20 | 0.20 | 1.00 | 3.00 |
| DPP | 0.20 | 0.20 | 0.33 | 1.00 |
| Distance to major road intersections = DMRI, Distance to police station = DPS, Distance to fire station = DFS, Distance to petrol pump = DPP | ||||
Table B.10.
Normalized pairwise comparison and weight for the safety dimension.
| Safety | DMRI | DPS | DFS | DPP | Criterion Weight |
|---|---|---|---|---|---|
| DMRI | 0.58 | 0.68 | 0.44 | 0.36 | 0.51 |
| DPS | 0.19 | 0.23 | 0.44 | 0.36 | 0.30 |
| DFS | 0.12 | 0.05 | 0.09 | 0.21 | 0.12 |
| DPP | 0.12 | 0.05 | 0.03 | 0.07 | 0.07 |
| Sum | 1.00 | ||||
References
- Alijani, S.; Pourahmad, A.; Hatami Nejad, H.; Ziari, K.; Sodoudi, S. A New Approach of Urban Livability in Tehran: Thermal Comfort as a Primitive Indicator. Case Study, District 22. Urban Clim. 2020, 33, 100656. [Google Scholar] [CrossRef]
- Ahmed, N.O.; El-Halafawy, A.M.; Amin, A.M. A Critical Review of Urban Livability. Eur. J. Sustain. Dev. 2019, 8. [Google Scholar] [CrossRef]
- Basu, T.; Das, A.; Pereira, P. Urban Livability Index Assessment Based on Land-Use Changes in an Indian Medium-Sized City (Raiganj). Geocarto Int. 2021, 37(25), 8495–8519. [Google Scholar] [CrossRef]
- Sharma, N. India Will Soon Have Its Own Liveability Index. Available online: https://economictimes.indiatimes.com/news/politics-and-nation/india-will-soon-have-its-own-liveability-index/articleshow/57382470.cms (accessed on 21 June 2023).
- Ogle, J.A.; Delparte, D.A.; Sanger, H. Quantifying the Sustainability of Urban Growth and Form through Time: An Algorithmic Analysis of a City’s Development. Appl. Geogr. 2017, 88, 1–14. [Google Scholar] [CrossRef]
- Onnom, W.; Tripathi, N.; Nitivattananon, V.; Ninsawat, S. Development of a Liveable City Index (LCI) Using Multi Criteria Geospatial Modelling for Medium Class Cities in Developing Countries. Sustainability 2018, 10. [Google Scholar] [CrossRef]
- Fu, B.; Yu, D.; Zhang, Y. The Livable Urban Landscape: GIS and Remote Sensing Extracted Land Use Assessment for Urban Livability in Changchun Proper, China. Land use policy 2019, 87. [Google Scholar] [CrossRef]
- Ferreira, C.; Kalantari, Z.; Pereira, P. Liveable Cities: Current Environmental Challenges and Paths to Urban Sustainability. J. Environ. Manage. 2021, 277. [Google Scholar] [CrossRef]
- Adam, M.; Ab Ghafar, N.; Ahmed, A.; Nila, K. A Systematic Review on City Liveability Global Research in the Built Environment: Publication and Citation Matrix. J. Des. Built Environ. 2017, 17, 62–72. [Google Scholar] [CrossRef]
- Badland, H.; Whitzman, C.; Lowe, M.; Davern, M.; Aye, L.; Butterworth, I.; Hes, D.; Giles-Corti, B. Urban Liveability: Emerging Lessons from Australia for Exploring the Potential for Indicators to Measure the Social Determinants of Health. Soc. Sci. Med. 2014, 111, 64–73. [Google Scholar] [CrossRef]
- Chazal, J. de A Systems Approach to Livability and Sustainability: Defining Terms and Mapping Relationships to Link Desires with Ecological Opportunities and Constraints. Syst. Res. Behav. Sci. 2010, 27, 585–597. [Google Scholar] [CrossRef]
- Pacione, M. Quality-of-Life Research in Urban Geography. 2013, 24, 314–339. [Google Scholar] [CrossRef]
- WHO Social Determinants of Health. Available online: https://www.who.int/social_determinants/B_132_14-en.pdf?ua=1 (accessed on 3 April 2023).
- Farber, S.; Neutens, T.; Miller, H.J.; Li, X. The Social Interaction Potential of Metropolitan Regions: A Time-Geographic Measurement Approach Using Joint Accessibility. Ann. Assoc. Am. Geogr. 2013, 103, 483–504. [Google Scholar] [CrossRef]
- Paul, A.; Civil, J. Sen Identifying Factors for Evaluating Livability Potential within a Metropolis: A Case of Kolkata. Int. J. Civil, Environ. Struct. Constr. Archit. Eng. 2017, 11, 50–55. [Google Scholar]
- Ghasemi, K.; Hamzenejad, M.; Meshkini, A. The Spatial Analysis of the Livability of 22 Districts of Tehran Metropolis Using Multi-Criteria Decision Making Approaches. Sustain. Cities Soc. 2018, 38, 382–404. [Google Scholar] [CrossRef]
- Seto, K.C.; Sánchez-Rodríguez, R.; Fragkias, M. The New Geography of Contemporary Urbanization and the Environment. Annu. Rev. Environ. Resour. 2010, 35, 167–194. [Google Scholar] [CrossRef]
- Li, G.; Weng, Q. Measuring the Quality of Life in City of Indianapolis by Integration of Remote Sensing and Census Data. Int. J. Remote Sens. 2007, 28, 249–267. [Google Scholar] [CrossRef]
- Angel, S.; Parent, J.; Civco, D.L.; Blei, A.; Potere, D. The Dimensions of Global Urban Expansion: Estimates and Projections for All Countries, 2000–2050. Prog. Plann. 2011, 75, 53–107. [Google Scholar] [CrossRef]
- Seto, K.C.; Fragkias, M.; Güneralp, B.; Reilly, M.K. A Meta-Analysis of Global Urban Land Expansion. PLoS One 2011, 6. [Google Scholar] [CrossRef]
- Bai, X.; McPhearson, T.; Cleugh, H.; Nagendra, H.; Tong, X.; Zhu, T.; Zhu, Y.G. Linking Urbanization and the Environment: Conceptual and Empirical Advances. Annu. Rev. Environ. Resour. 2017, 42, 215–240. [Google Scholar] [CrossRef]
- Zhu, L.; Guo, Y.; Zhang, C.; Meng, J.; Ju, L.; Zhang, Y.; Tang, W. Assessing Community-Level Livability Using Combined Remote Sensing and Internet-Based Big Geospatial Data. Remote Sens. 2020, 12. [Google Scholar] [CrossRef]
- Grimm, N.B.; Faeth, S.H.; Golubiewski, N.E.; Redman, C.L.; Wu, J.; Bai, X.; Grimm, J.M.B.; Faeth, S.H.; Redman, C.L.; Wu, J.; et al. Global Change and the Ecology of Cities. Science (80-. ). 2008, 319, 756–760. [Google Scholar] [CrossRef] [PubMed]
- Terzi, F.; Bolen, F. Urban Sprawl Measurement of Istanbul. Eur. Plan. Stud. 2009, 17, 1559–1570. [Google Scholar] [CrossRef]
- Porio, E. Sustainable Development Goals and Quality of Life Targets: Insights from Metro Manila. Curr. Sociol. 2014, 63, 244–260. [Google Scholar] [CrossRef]
- Noor, M.A.; Ashrafi, S.; Fattah, M.A.; Morshed, S.R.; Rahman, S. Assessment of Traffic Congestion Scenario at the CBD Areas in a Developing City: In the Context of Khulna City, Bangladesh. Transp. Res. Interdiscip. Perspect. 2021, 11. [Google Scholar] [CrossRef]
- Jodder, P.K.; Leya, R.S.; Rahaman, K.R.; Kafy, A. Al; Rahaman, Z.A.; Almulhim, A.I. Modeling the Impacts of Residential, Commercial, and Industrial Land Use on Carbon Footprints Using Kernel Density Function in an Urban Setting. Earth Syst. Environ. 2023, 7, 237–254. [Google Scholar] [CrossRef]
- Jodder, P.K.; Leya, R.S.; Rana, M.S.; Sarkar, B. Generation and Characteristics of Households Solid Waste in Khulna City, Bangladesh. Khulna Univ. Stud. 2022, 19, 105–115. [Google Scholar] [CrossRef]
- Leya, R.S.; Jodder, P.K.; Rahaman, K.R.; Chowdhury, M.A.; Parida, D.; Islam, M.S. Spatial Variations of Urban Heat Island Development in Khulna City, Bangladesh: Implications for Urban Planning and Development. Earth Syst. Environ. 2022, 6, 865–884. [Google Scholar] [CrossRef]
- Haque, M.N.; Saroar, M.; Fattah, M.A.; Morshed, S.R. Public-Private Partnership for Achieving Sustainable Development Goals: A Case Study of Khulna, Bangladesh. Public Adm. Policy 2020, 23, 283–298. [Google Scholar] [CrossRef]
- Fang, C.; Yu, D. China’s New Urbanization. In; Springer Geography; Springer: Berlin, Heidelberg, 2016; pp. 179–232. ISBN 978-3-662-49446-2. [Google Scholar]
- Zhan, D.; Kwan, M.P.; Zhang, W.; Fan, J.; Yu, J.; Dang, Y. Assessment and Determinants of Satisfaction with Urban Livability in China. Cities 2018, 79, 92–101. [Google Scholar] [CrossRef]
- Beames, A.; Broekx, S.; Schneidewind, U.; Landuyt, D.; van der Meulen, M.; Heijungs, R.; Seuntjens, P. Amenity Proximity Analysis for Sustainable Brownfield Redevelopment Planning. Landsc. Urban Plan. 2018, 171, 68–79. [Google Scholar] [CrossRef]
- Islam, T.; Merrell, W.; Seitz, W. Galveston Futures: Developing a Disaster Resilient Community. J. Geogr. Reg. Plan. 2010, 3, 001–007. [Google Scholar] [CrossRef]
- Mastura, A.; Ab Ghafar, N.; Mustapha, T. An Investigation of the Significant Criteria of Vegetation Selection and Planting Arrangement in Designing Urban Nodes. J. Des. Built Environ. 2016, 16, 1–14. [Google Scholar] [CrossRef]
- Newton, P.W. Liveable and Sustainable? Socio-Technical Challenges for Twenty-First-Century Cities. 2012, 19, 81–102. [Google Scholar] [CrossRef]
- Keith, M.; O’Clery, N.; Parnell, S.; Revi, A. The Future of the Future City? The New Urban Sciences and a PEAK Urban Interdisciplinary Disposition. Cities 2020, 105. [Google Scholar] [CrossRef]
- Fabre, E.A. Local Implication of the SDGs & the New Urban Agenda. Available online: https://www.local2030.org/library/384/Local-implementation-of-the-SDGs-the-New-Urban-Agenda-towards-a-Swedish-national-urban-policy.pdf (accessed on 8 March 2023).
- Liu, J.; Nijkamp, P.; Huang, X.; Lin, D. Urban Livability and Tourism Development in China: Analysis of Sustainable Development by Means of Spatial Panel Data. Habitat Int. 2017, 68, 99–107. [Google Scholar] [CrossRef]
- Gong, P.; Liang, S.; Carlton, E.J.; Jiang, Q.; Wu, J.; Wang, L.; Remais, J. V. Urbanisation and Health in China. Lancet 2012, 379, 843–852. [Google Scholar] [CrossRef]
- Paul, A.; Sen, J. A Critical Review of Liveability Approaches and Their Dimensions. Geoforum 2020, 117, 90–92. [Google Scholar] [CrossRef]
- Wang, J.; Su, M.; Chen, B.; Chen, S.; Liang, C. A Comparative Study of Beijing and Three Global Cities: A Perspective on Urban Livability. Front. Earth Sci. 2011, 5, 323–329. [Google Scholar] [CrossRef]
- Kazemi, F.; Abolhassani, L.; Rahmati, E.A.; Sayyad-Amin, P. Strategic Planning for Cultivation of Fruit Trees and Shrubs in Urban Landscapes Using the SWOT Method: A Case Study for the City of Mashhad, Iran. Land use policy 2018, 70, 1–9. [Google Scholar] [CrossRef]
- Liu, Y.; Fang, F.; Li, Y. Key Issues of Land Use in China and Implications for Policy Making. Land use policy 2014, 40, 6–12. [Google Scholar] [CrossRef]
- Fu, B. Evaluation of Environmental Livability of Changchun Based on GIS and RS. Adv. Mater. Res. 2013, 610, 3642–3645. [Google Scholar] [CrossRef]
- Wang, Y.; Zhu, Y.; Yu, M. Evaluation and Determinants of Satisfaction with Rural Livability in China’s Less-Developed Eastern Areas: A Case Study of Xianju County in Zhejiang Province. Ecol. Indic. 2019, 104, 711–722. [Google Scholar] [CrossRef]
- Liu, J.; Shi, W.; Chen, P. Exploring Travel Patterns during the Holiday Season—a Case Study of Shenzhen Metro System during the Chinese Spring Festival. ISPRS Int. J. Geo-Information 2020, 9. [Google Scholar] [CrossRef]
- UN-Habitat Urbanization and Development: Emerging Futures. Available online: https://unhabitat.org/world-cities-report-2016 (accessed on 20 August 2023).
- SHLC Liveable Regional Cities in Bangladesh. Available online: http://www.centreforsustainablecities.ac.uk/research/liveable-regional-cities-in-bangladesh/ (accessed on 26 September 2023).
- Stockard, J. Jane Jacobs and Citizen Participation. In The Urban Wisdom of Jane Jacobs; 2012; pp. 49–59 ISBN ISBN 9781138828889.
- Hassan, M.M. Monitoring Land Use/Land Cover Change, Urban Growth Dynamics and Landscape Pattern Analysis in Five Fastest Urbanized Cities in Bangladesh. Remote Sens. Appl. Soc. Environ. 2017, 7, 69–83. [Google Scholar] [CrossRef]
- Zolfani, S.H.; Sedaghat, M.; Zavadskas, E.K. Performance Evaluating of Rural ICT Centers (Telecenters), Applying Fuzzy AHP, SAW-G and TOPSIS Grey, a Case Study in Iran. Vilnius Gedim. Tech. Univ. 2012, 18, 364–387. [Google Scholar] [CrossRef]
- Yin, Z.; Wu, Y.; Jin, Z.; Zhang, X. Research on Livable Community Evaluation Based on GIS. IOP Conf. Ser. Earth Environ. Sci. 2018, 108. [Google Scholar] [CrossRef]
- Mahmud, A.; Sikder, S.; Joardar, J.C. Assessment of Groundwater Quality in Khulna City of Bangladesh in Terms of Water Quality Index for Drinking Purpose. Appl. Water Sci. 2020, 10, 1–14. [Google Scholar] [CrossRef]
- Tao, L.; Hui, E.C.M.; Wong, F.K.W.; Chen, T. Housing Choices of Migrant Workers in China: Beyond the Hukou Perspective. Habitat Int. 2015, 49, 474–483. [Google Scholar] [CrossRef]
- Liu, J.; Bi, H.; Wang, M. Using Multi-Source Data to Assess Livability in Hong Kong at the Community-Based Level: A Combined Subjective-Objective Approach. Geogr. Sustain. 2020, 1, 284–294. [Google Scholar] [CrossRef]
- Paul, A.; Sen, J. Livability Assessment within a Metropolis Based on the Impact of Integrated Urban Geographic Factors (IUGFs) on Clustering Urban Centers of Kolkata. Cities 2018, 74, 142–150. [Google Scholar] [CrossRef]
- Achour, Y.; Boumezbeur, A.; Hadji, R.; Chouabbi, A.; Cavaleiro, V.; Bendaoud, E.A. Landslide Susceptibility Mapping Using Analytic Hierarchy Process and Information Value Methods along a Highway Road Section in Constantine, Algeria. Arab. J. Geosci. 2017, 10, 1–16. [Google Scholar] [CrossRef]
- Yalcin, A.; Reis, S.; Aydinoglu, A.C.; Yomralioglu, T. A GIS-Based Comparative Study of Frequency Ratio, Analytical Hierarchy Process, Bivariate Statistics and Logistics Regression Methods for Landslide Susceptibility Mapping in Trabzon, Turkey. Catena 2011, 85, 274–287. [Google Scholar] [CrossRef]
- Garg, R.; Rahman, Z.; Qureshi, M.N.; Kumar, I. Identifying and Ranking Critical Success Factors of Customer Experience in Banks: An Analytic Hierarchy Process (AHP) Approach. J. Model. Manag. 2012, 7, 201–220. [Google Scholar] [CrossRef]
- Ramanathan, R. A Note on the Use of the Analytic Hierarchy Process for Environmental Impact Assessment. J. Environ. Manage. 2001, 63, 27–35. [Google Scholar] [CrossRef]
- Saaty, T.L. How to Make a Decision: The Analytic Hierarchy Process. Eur. J. Oper. Res. 1990, 48, 9–26. [Google Scholar] [CrossRef]
- Sang, S.; Wang, Z.; Yu, C. Evaluation of Health Care System Reform in Hubei Province, China. Int. J. Environ. Res. Public Health 2014, 11, 2262–2277. [Google Scholar] [CrossRef]
- Sundharam, V.N.; Sharma, V.; Stephan Thangaiah, I.S. An Integration of BSC and AHP for Sustainable Growth of Manufacturing Industries. Int. J. Bus. Excell. 2013, 6, 77–92. [Google Scholar] [CrossRef]
- Ha-Mim, N.M.; Rahman, M.A.; Hossain, M.Z.; Fariha, J.N.; Rahaman, K.R. Employing Multi-Criteria Decision Analysis and Geospatial Techniques to Assess Flood Risks: A Study of Barguna District in Bangladesh. Int. J. Disaster Risk Reduct. 2022, 77. [Google Scholar] [CrossRef]
- Ehrgott, M.; Figueira, J.R.; Grego, S. Trends in Multiple Criteria Decision Analysis. In Springer; 2010; Vol. 142, pp. 10–34 ISBN 9781441959034.
- Sultana, R.; Asad, A. Evaluation of Urbanites’ Perception About Livable City Using Analytic Hierarchy Process (AHP): A Case Study of Dhaka City. Adv. 21st Century Hum. Settlements 2021, 367–381. [Google Scholar] [CrossRef]
- Newell, R.; Picketts, I. Spaces, Places and Possibilities: A Participatory Approach for Developing and Using Integrated Models for Community Planning. City Environ. Interact. 2020, 6, 100040. [Google Scholar] [CrossRef]
- Khalil, H.A.E.E. Enhancing Quality of Life through Strategic Urban Planning. Sustain. Cities Soc. 2012, 5, 77–86. [Google Scholar] [CrossRef]
- Lang, W.; Chen, T.; Chan, E.H.W.; Yung, E.H.K.; Lee, T.C.F. Understanding Livable Dense Urban Form for Shaping the Landscape of Community Facilities in Hong Kong Using Fine-Scale Measurements. Cities 2019, 84, 34–45. [Google Scholar] [CrossRef]
- Islam, M.; Sarker, D.; Hasan, J.; Momtaz, Z. Public Perceptions on Urban Open Space and City Livability in Barishal, Bangladesh. Geol. Ecol. Landscapes 2023, 00, 1–10. [Google Scholar] [CrossRef]
- Ruszczyk, H.A.; Halligey, A.; Rahman, M.F.; Ahmed, I. Liveability and Vitality: An Exploration of Small Cities in Bangladesh. Cities 2023, 133, 104150. [Google Scholar] [CrossRef]
- Dai, L.; Zheng, C.; Dong, Z.; Yao, Y.; Wang, R.; Zhang, X.; Ren, S.; Zhang, J.; Song, X.; Guan, Q. Analyzing the Correlation between Visual Space and Residents’ Psychology in Wuhan, China Using Street-View Images and Deep-Learning Technique. City Environ. Interact. 2021, 11, 100069. [Google Scholar] [CrossRef]
- Saitluanga, B.L. Spatial Pattern of Urban Livability in Himalayan Region: A Case of Aizawl City, India. Soc. Indic. Res. 2014, 117, 541–559. [Google Scholar] [CrossRef]
- Balducci, A.; Checchi, D. Happiness and Quality of City Life: The Case of Milan, the Richest Italian City. Int. Plan. Stud. 2009, 14, 25–64. [Google Scholar] [CrossRef]
- Fowler, J.H.; Christakis, N.A. Dynamic Spread of Happiness in a Large Social Network: Longitudinal Analysis over 20 Years in the Framingham Heart Study. BMJ 2009, 338, 23–26. [Google Scholar] [CrossRef]
Figure 1.
Map of study area.
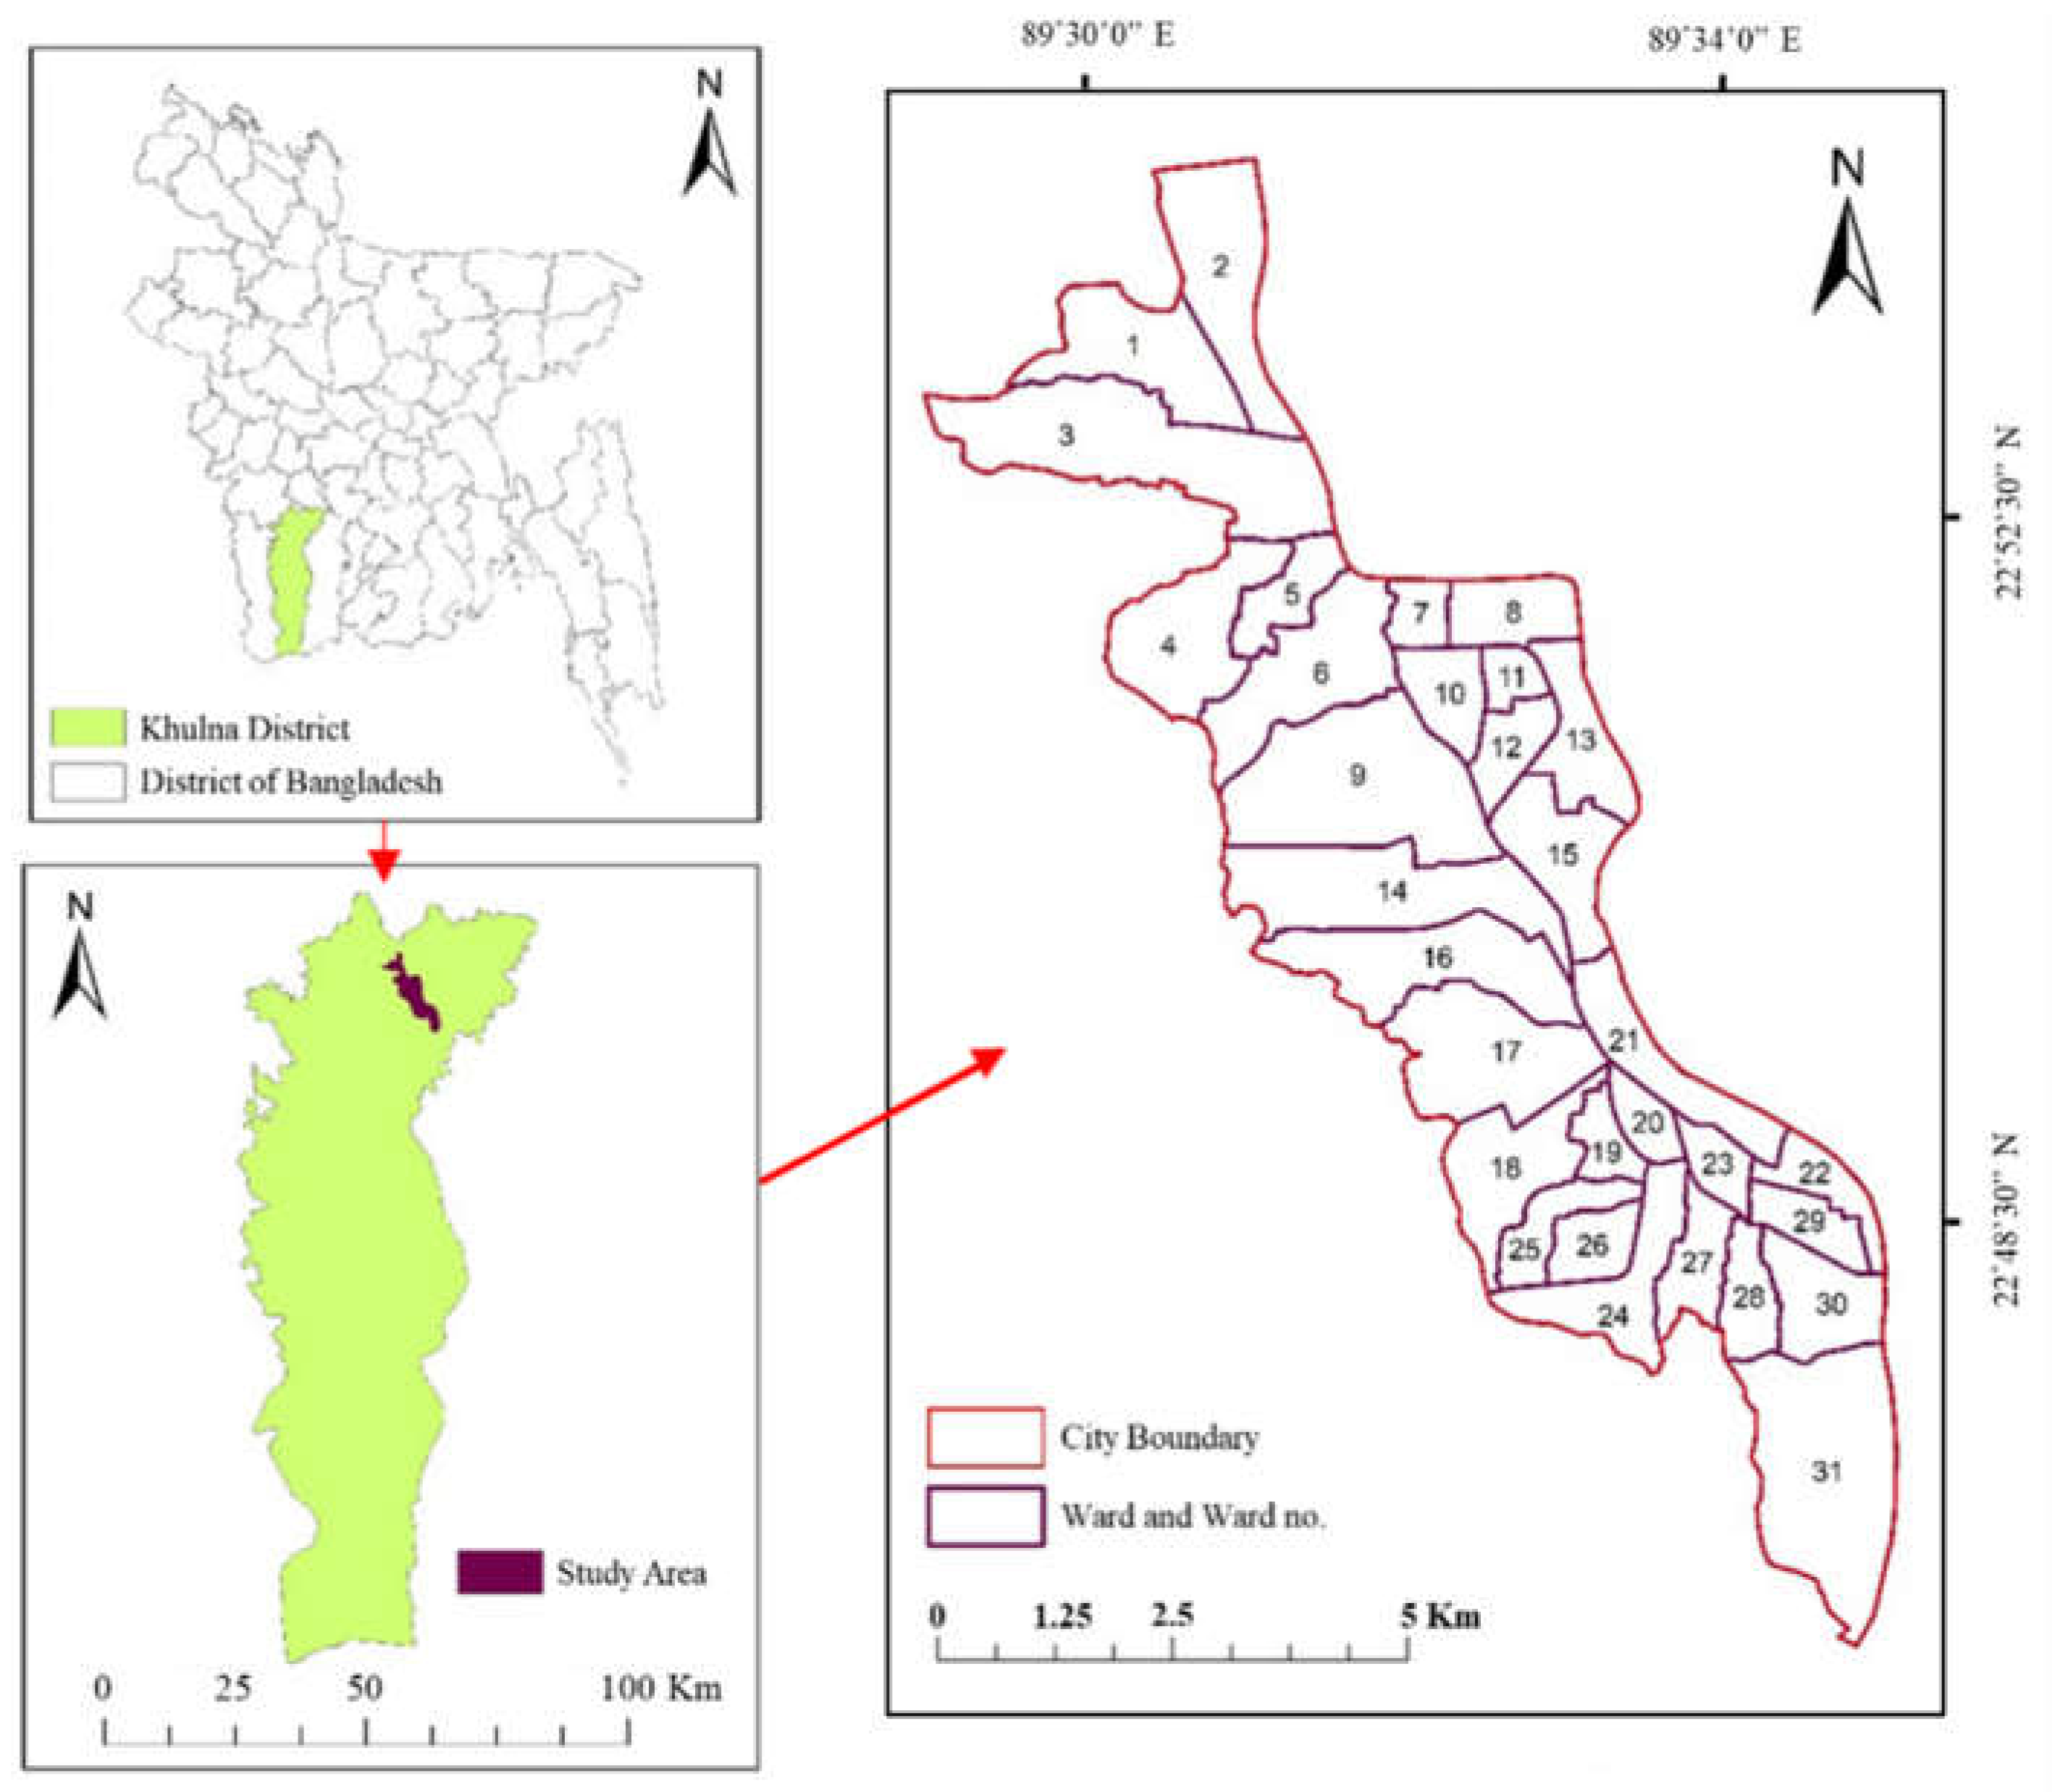
Figure 2.
Schematic diagram of research.
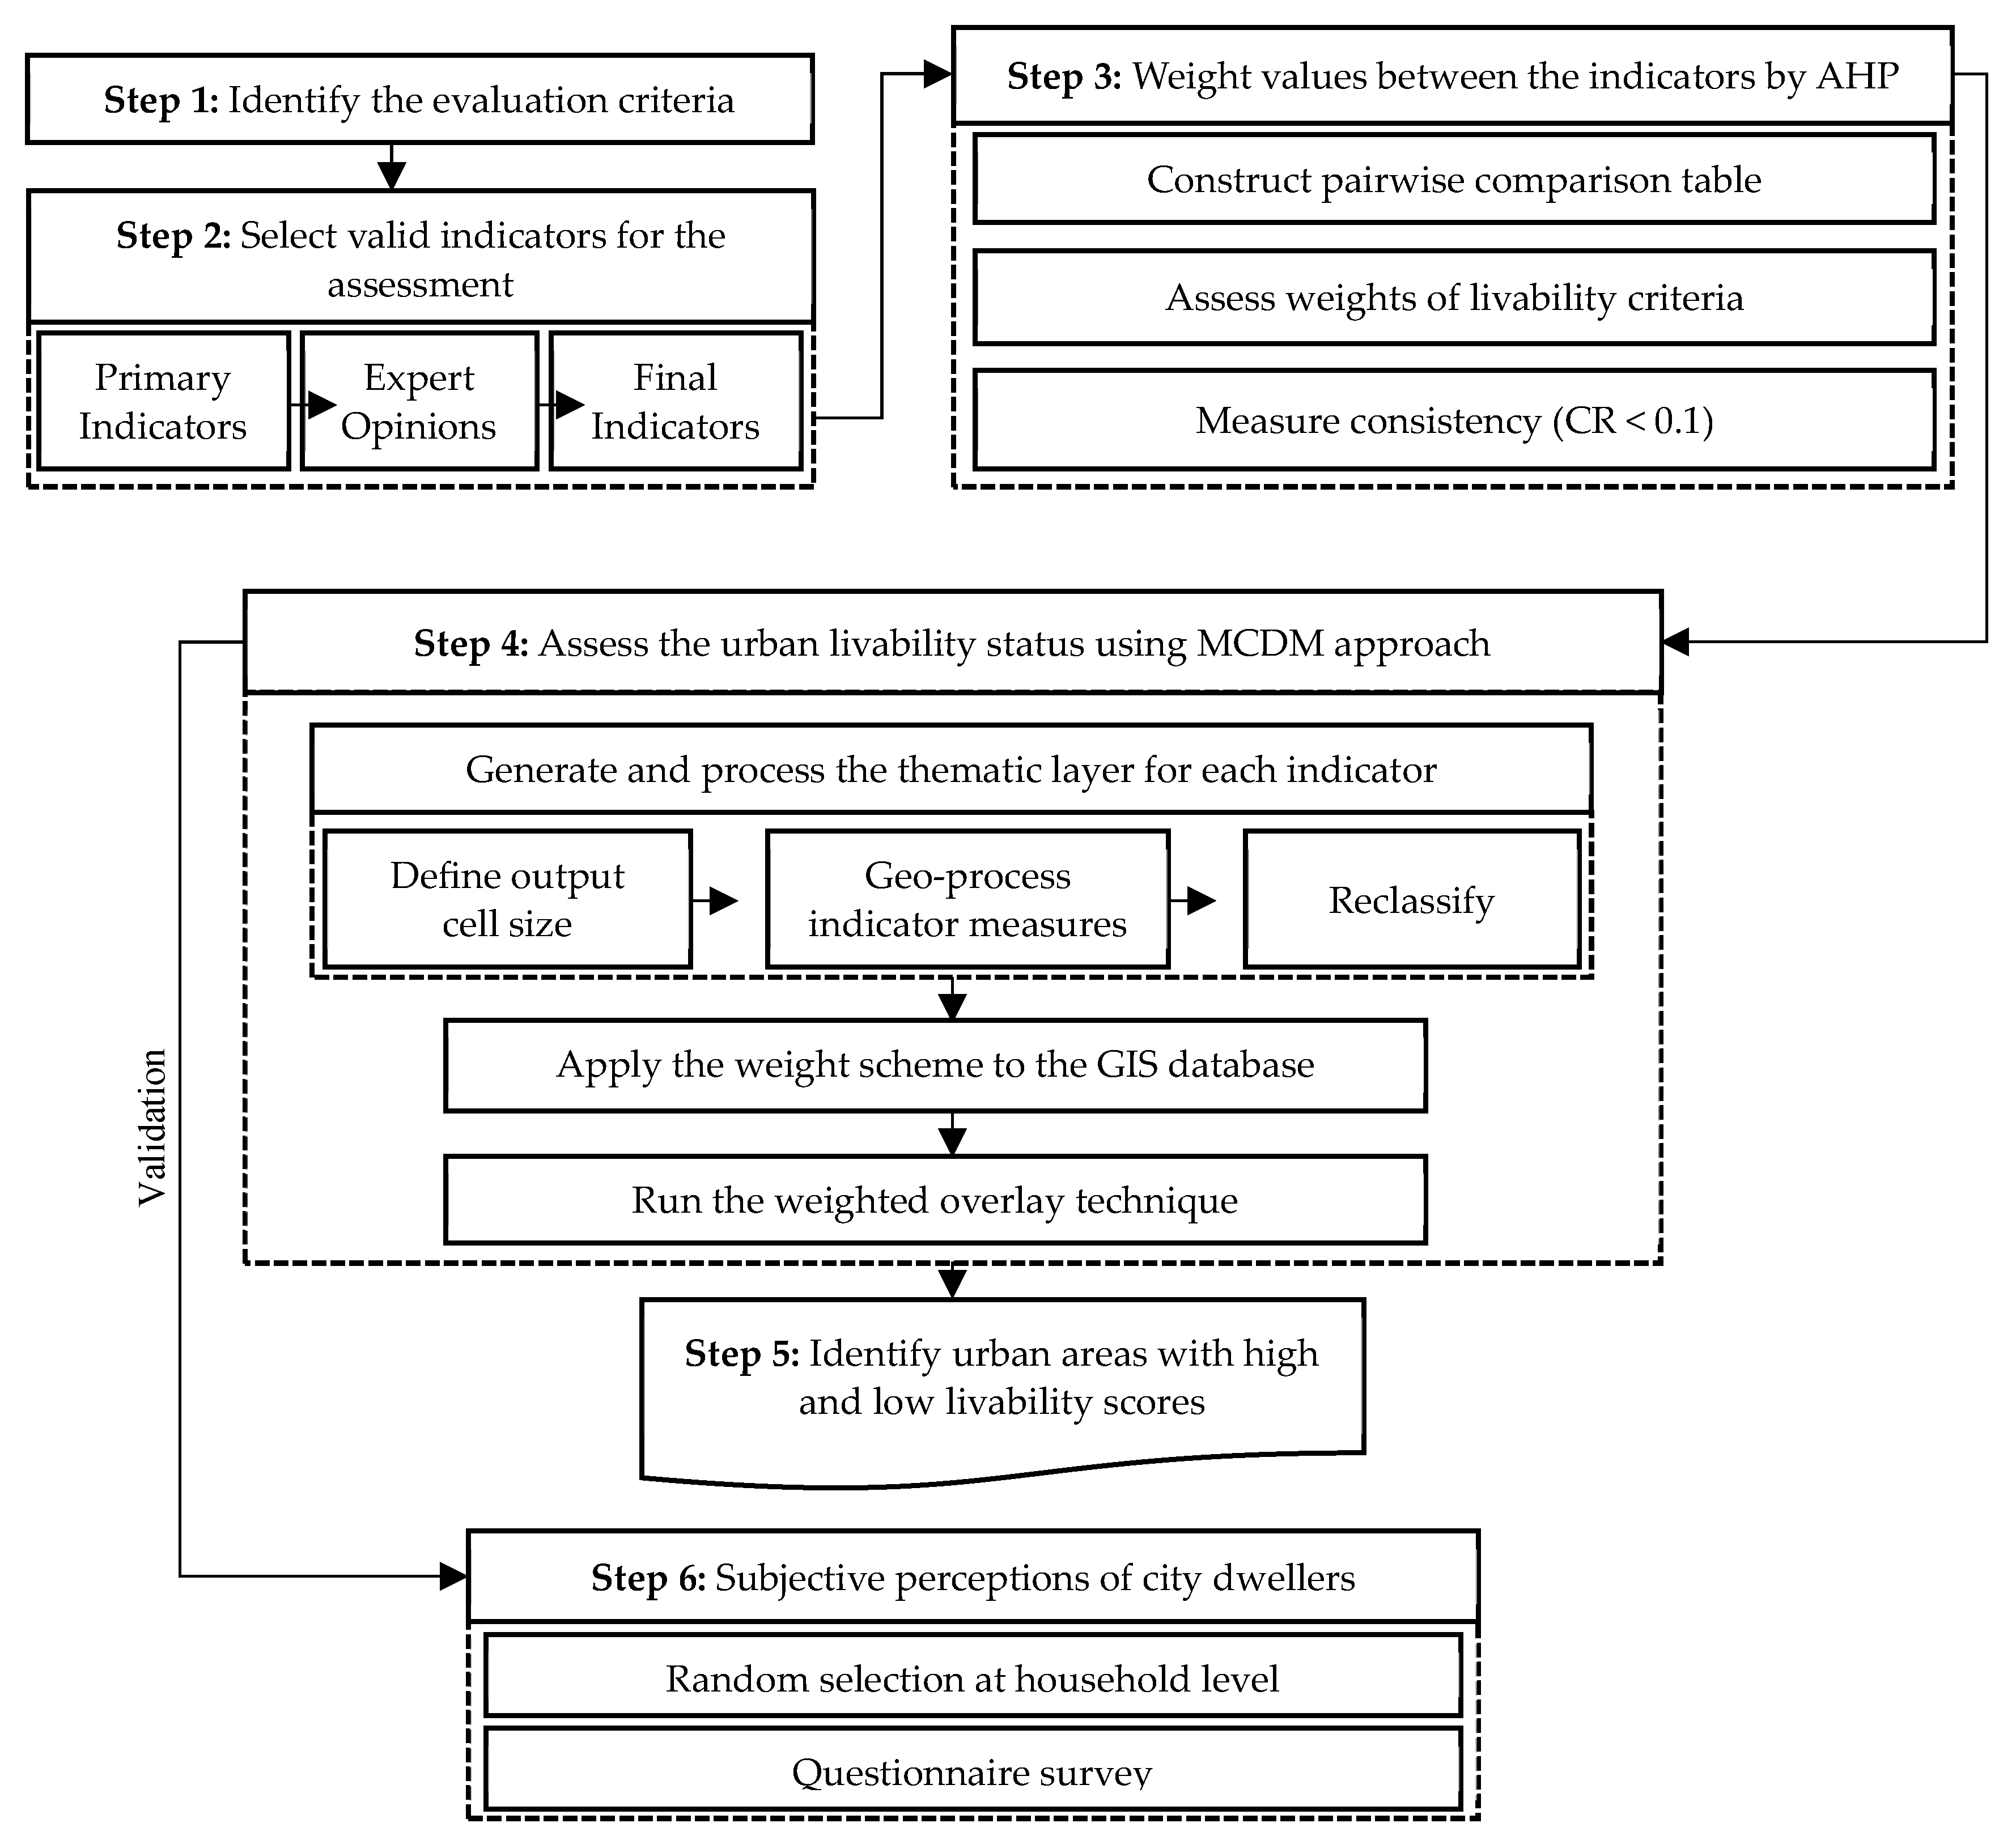
Figure 3.
Livability status of Khulna City in terms of (a) Convenience, (b) Amenity, (c) Health and (d) Safety.
Figure 3.
Livability status of Khulna City in terms of (a) Convenience, (b) Amenity, (c) Health and (d) Safety.
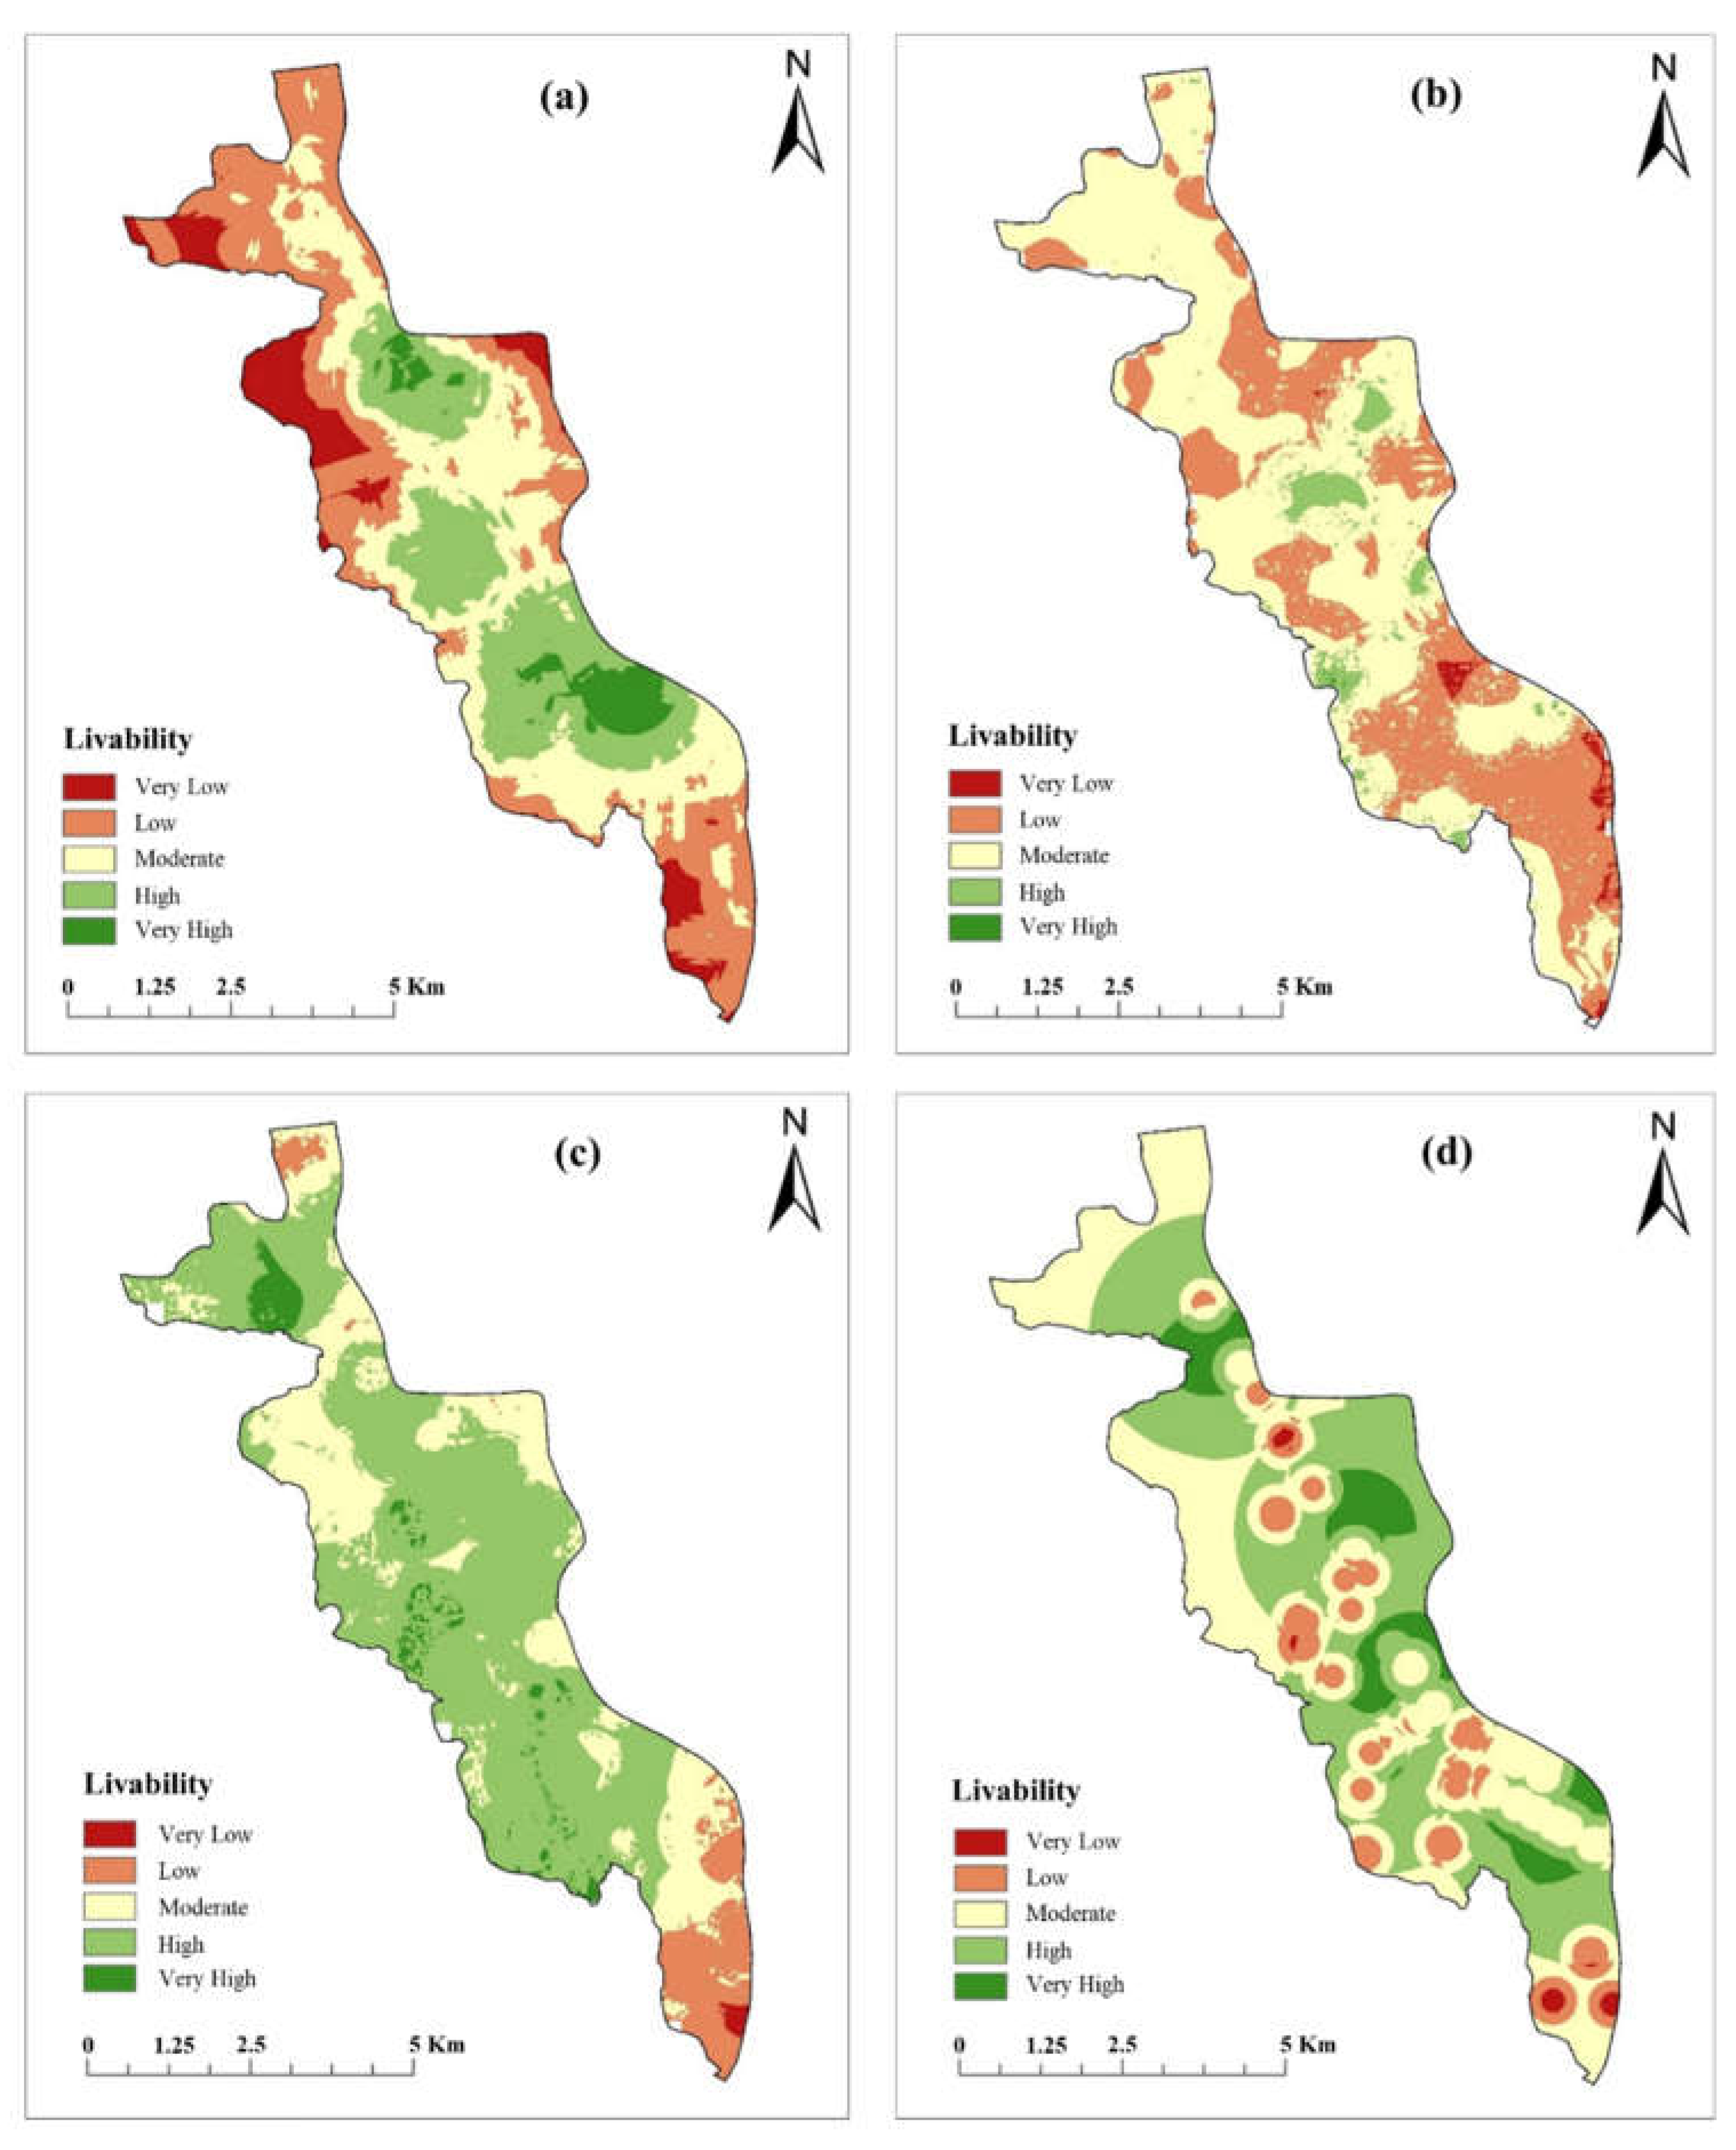
Figure 4.
Urban livability mapping for Khulna City.
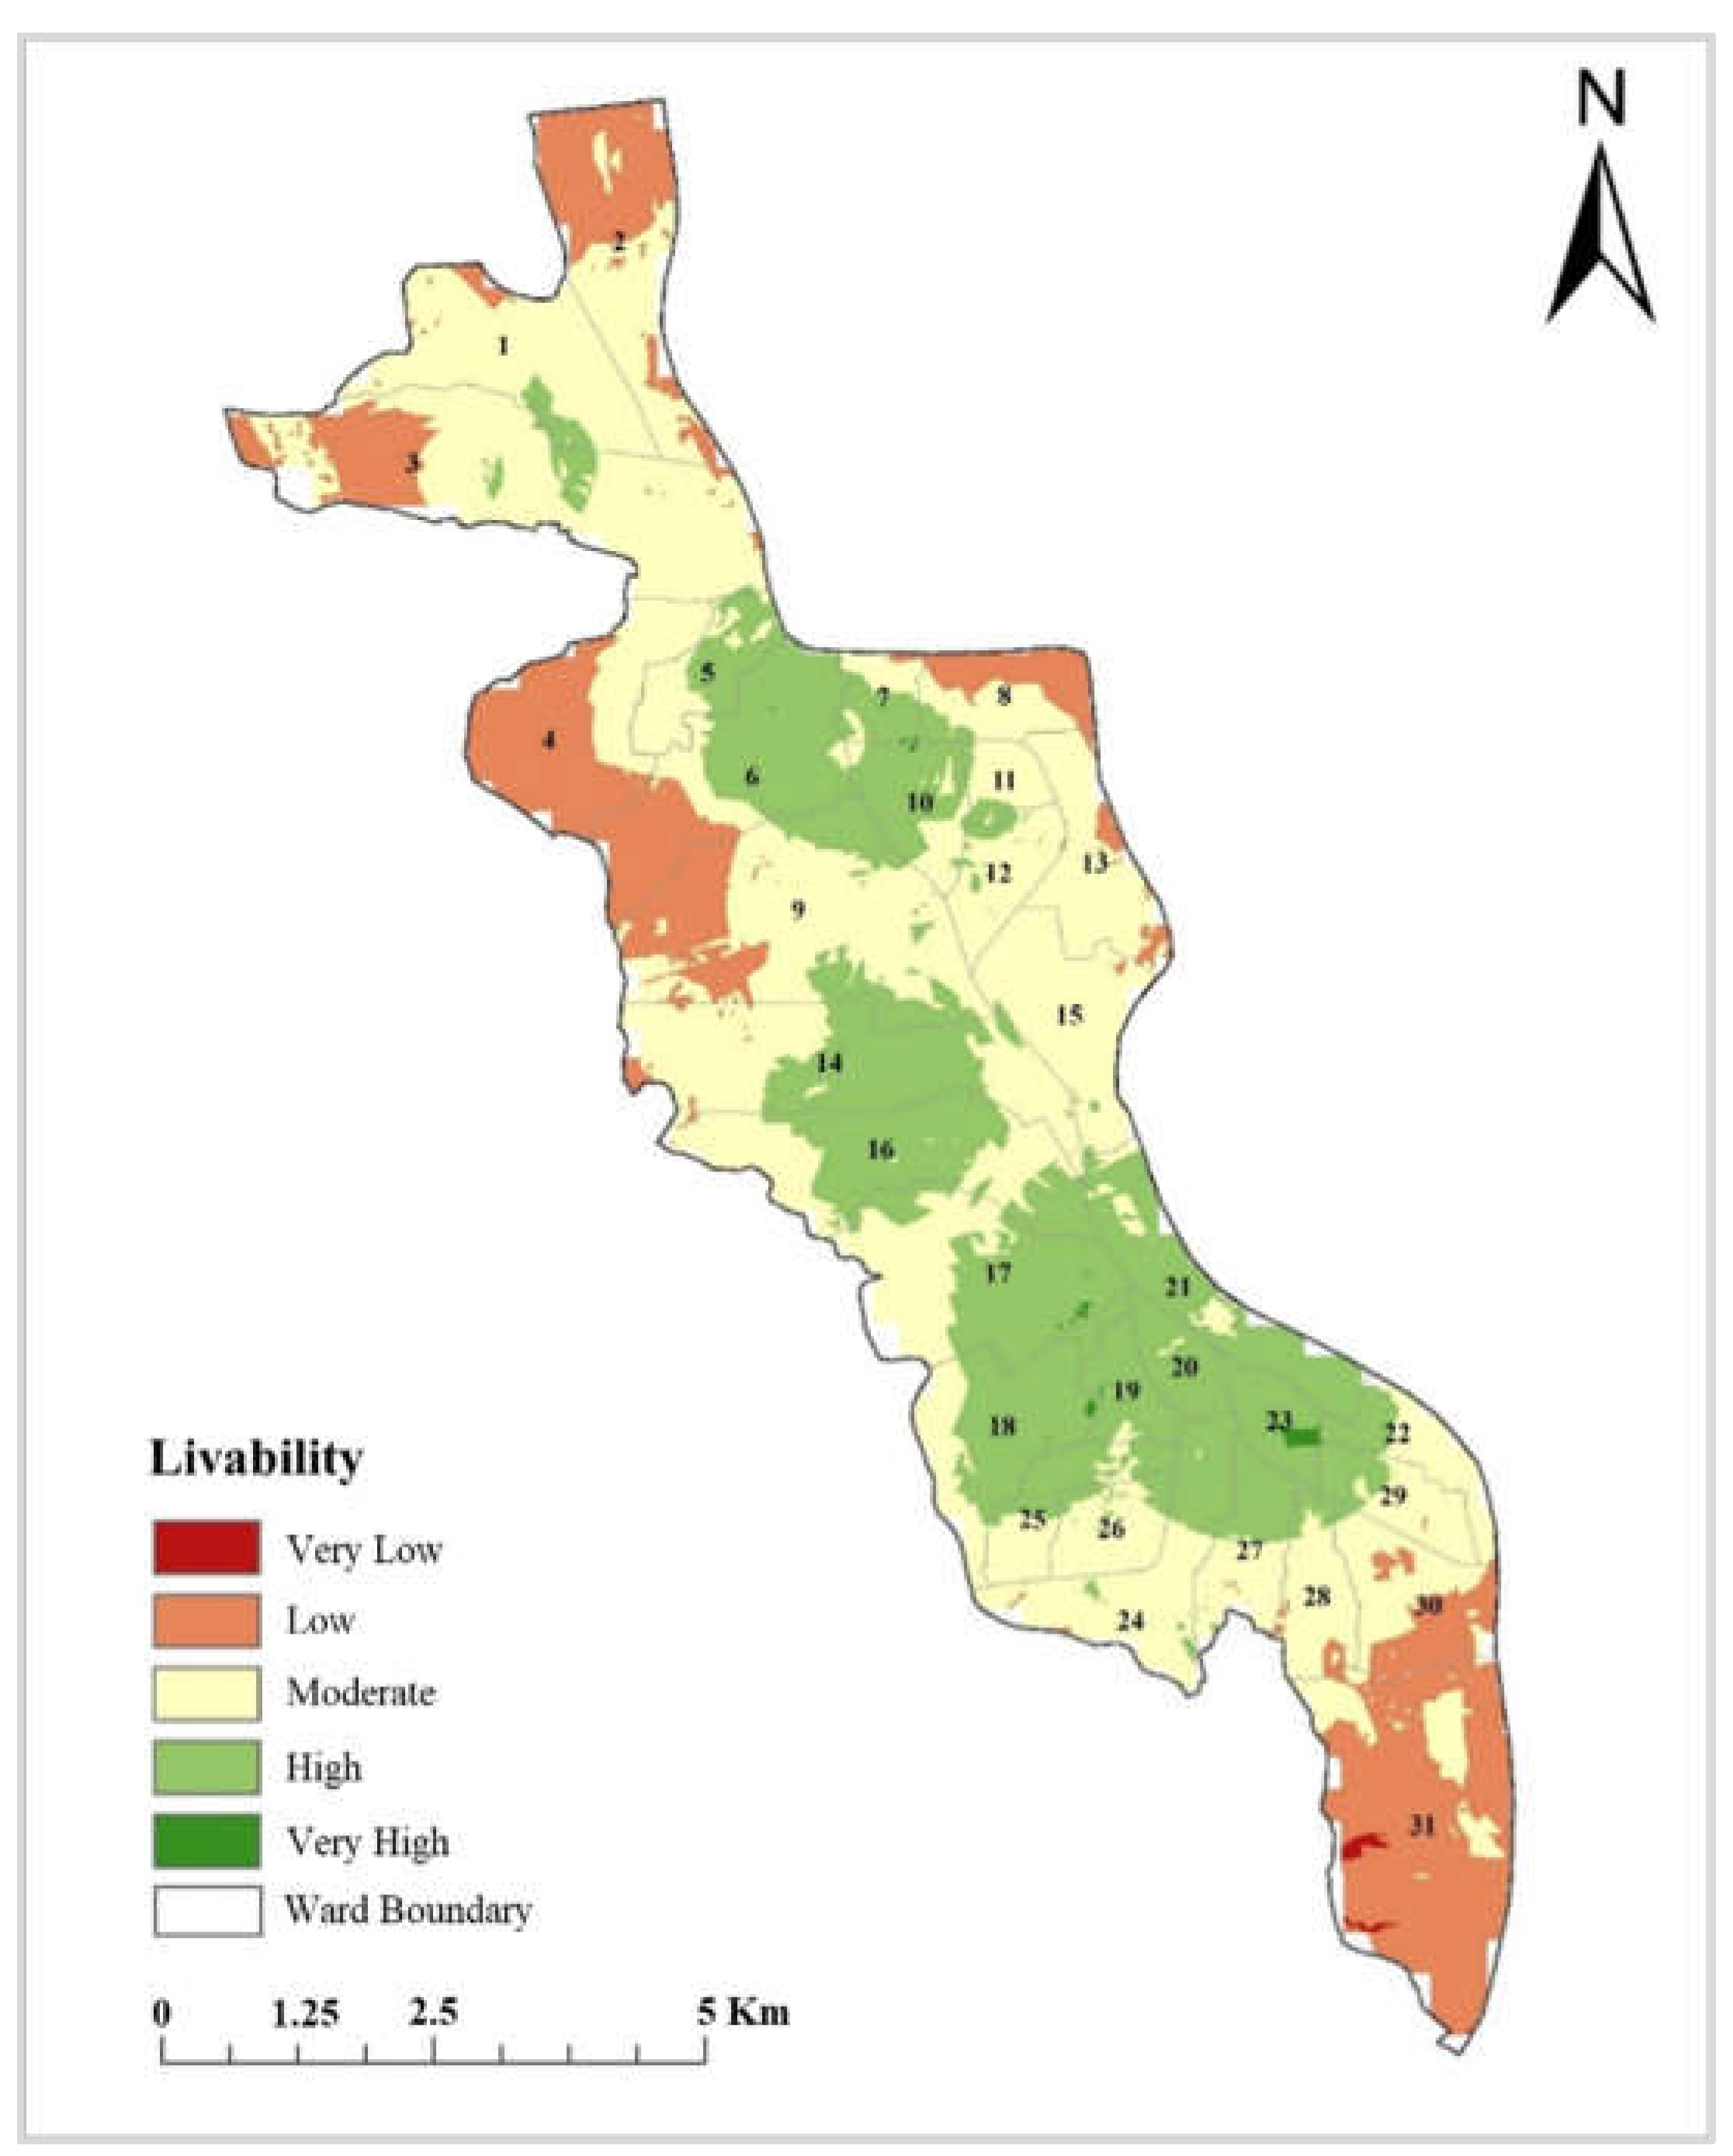
Figure 5.
Average subjective scoring on the indicators of urban livability and their standard deviation: (C1) Distance to city center, (C2) Distance to major road, (C3) Distance to bus terminal, (C4) Distance to train station, (C5) Distance to post office, (C6) Distance to library, (C7) Distance to secondary school, (C8) Distance to primary school, (A1) Vegetation coverage, (A2) Availability of open space, (A3) Availability of water areas, (A4) Distance to recreation facilities, (H1) Distance to hospital, (H2) Distance to manufacturing district, (H3) Air quality, (H4) Drinking water quality, (H5) Soil salinity, (H6) Urban heat island, (S1) Distance to major road intersections, (S2) Distance to police station, (S3) Distance to fire station, (S4) Distance to gas station.
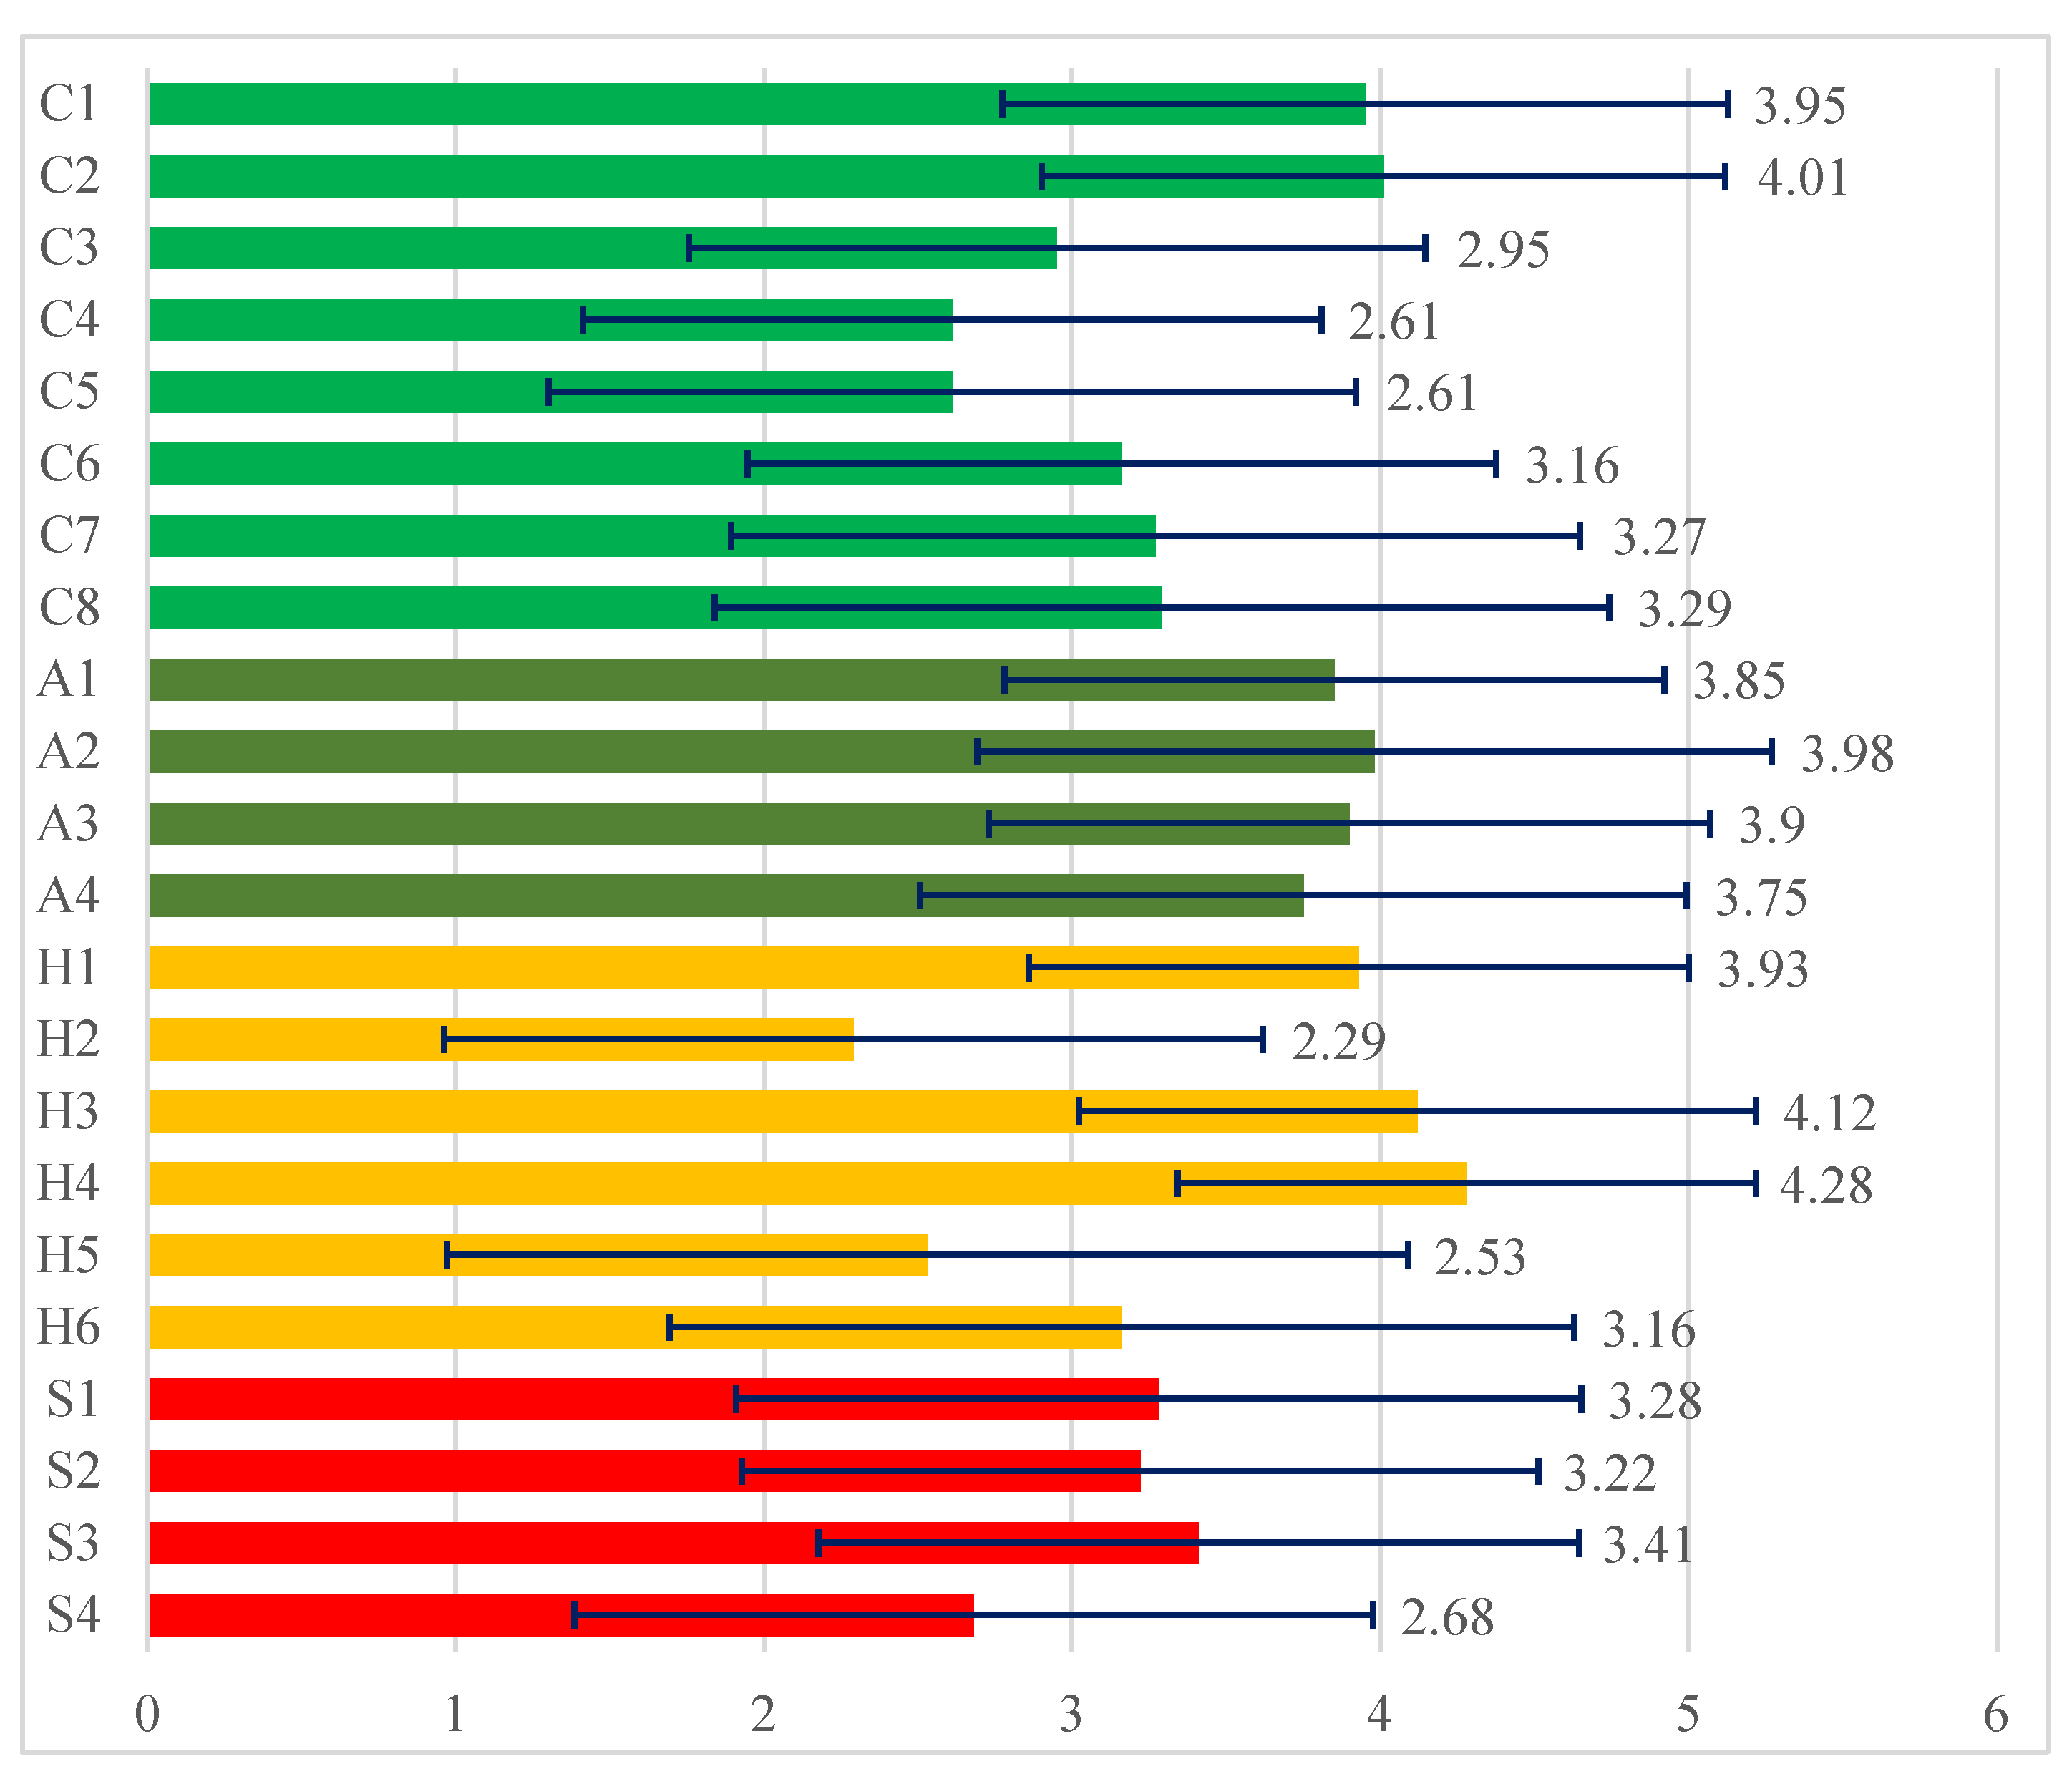
Figure 6.
Aggregated preferences expressed by residents for most livable places to live (endorsement percentages) and geographic distribution of objective livability index.
Figure 6.
Aggregated preferences expressed by residents for most livable places to live (endorsement percentages) and geographic distribution of objective livability index.
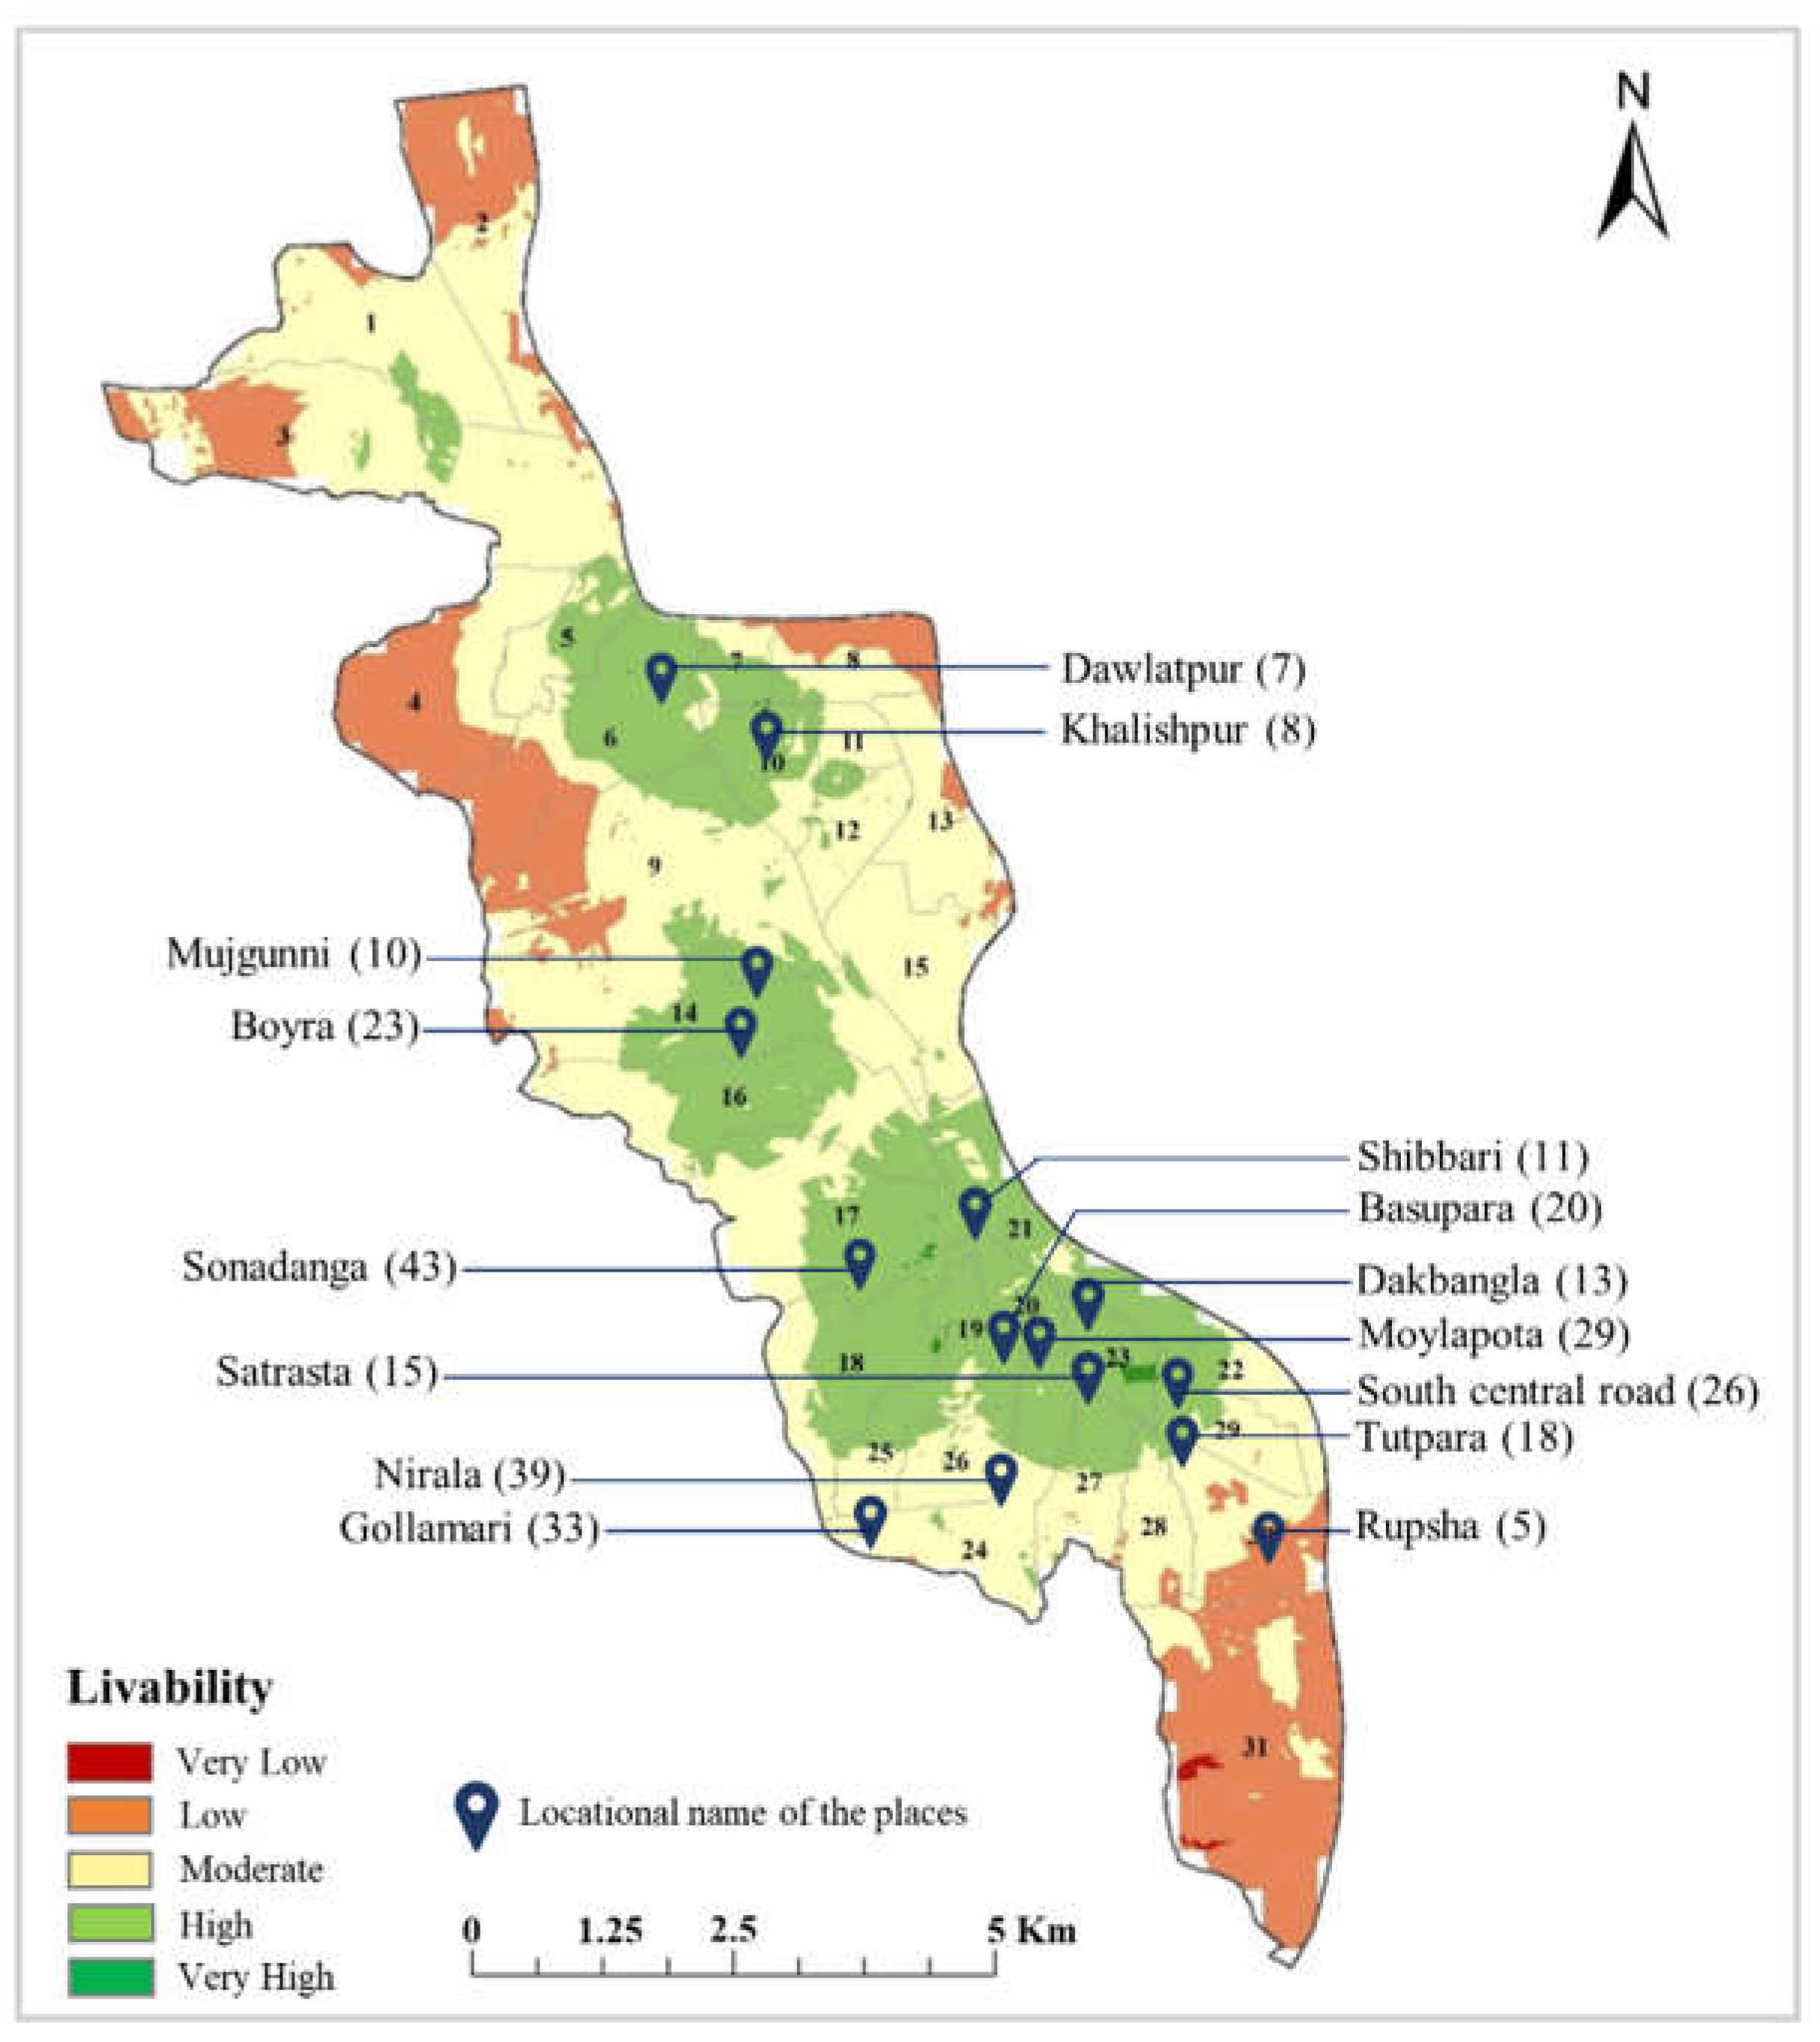
Figure 7.
Word cloud of reasons supporting living preferences.
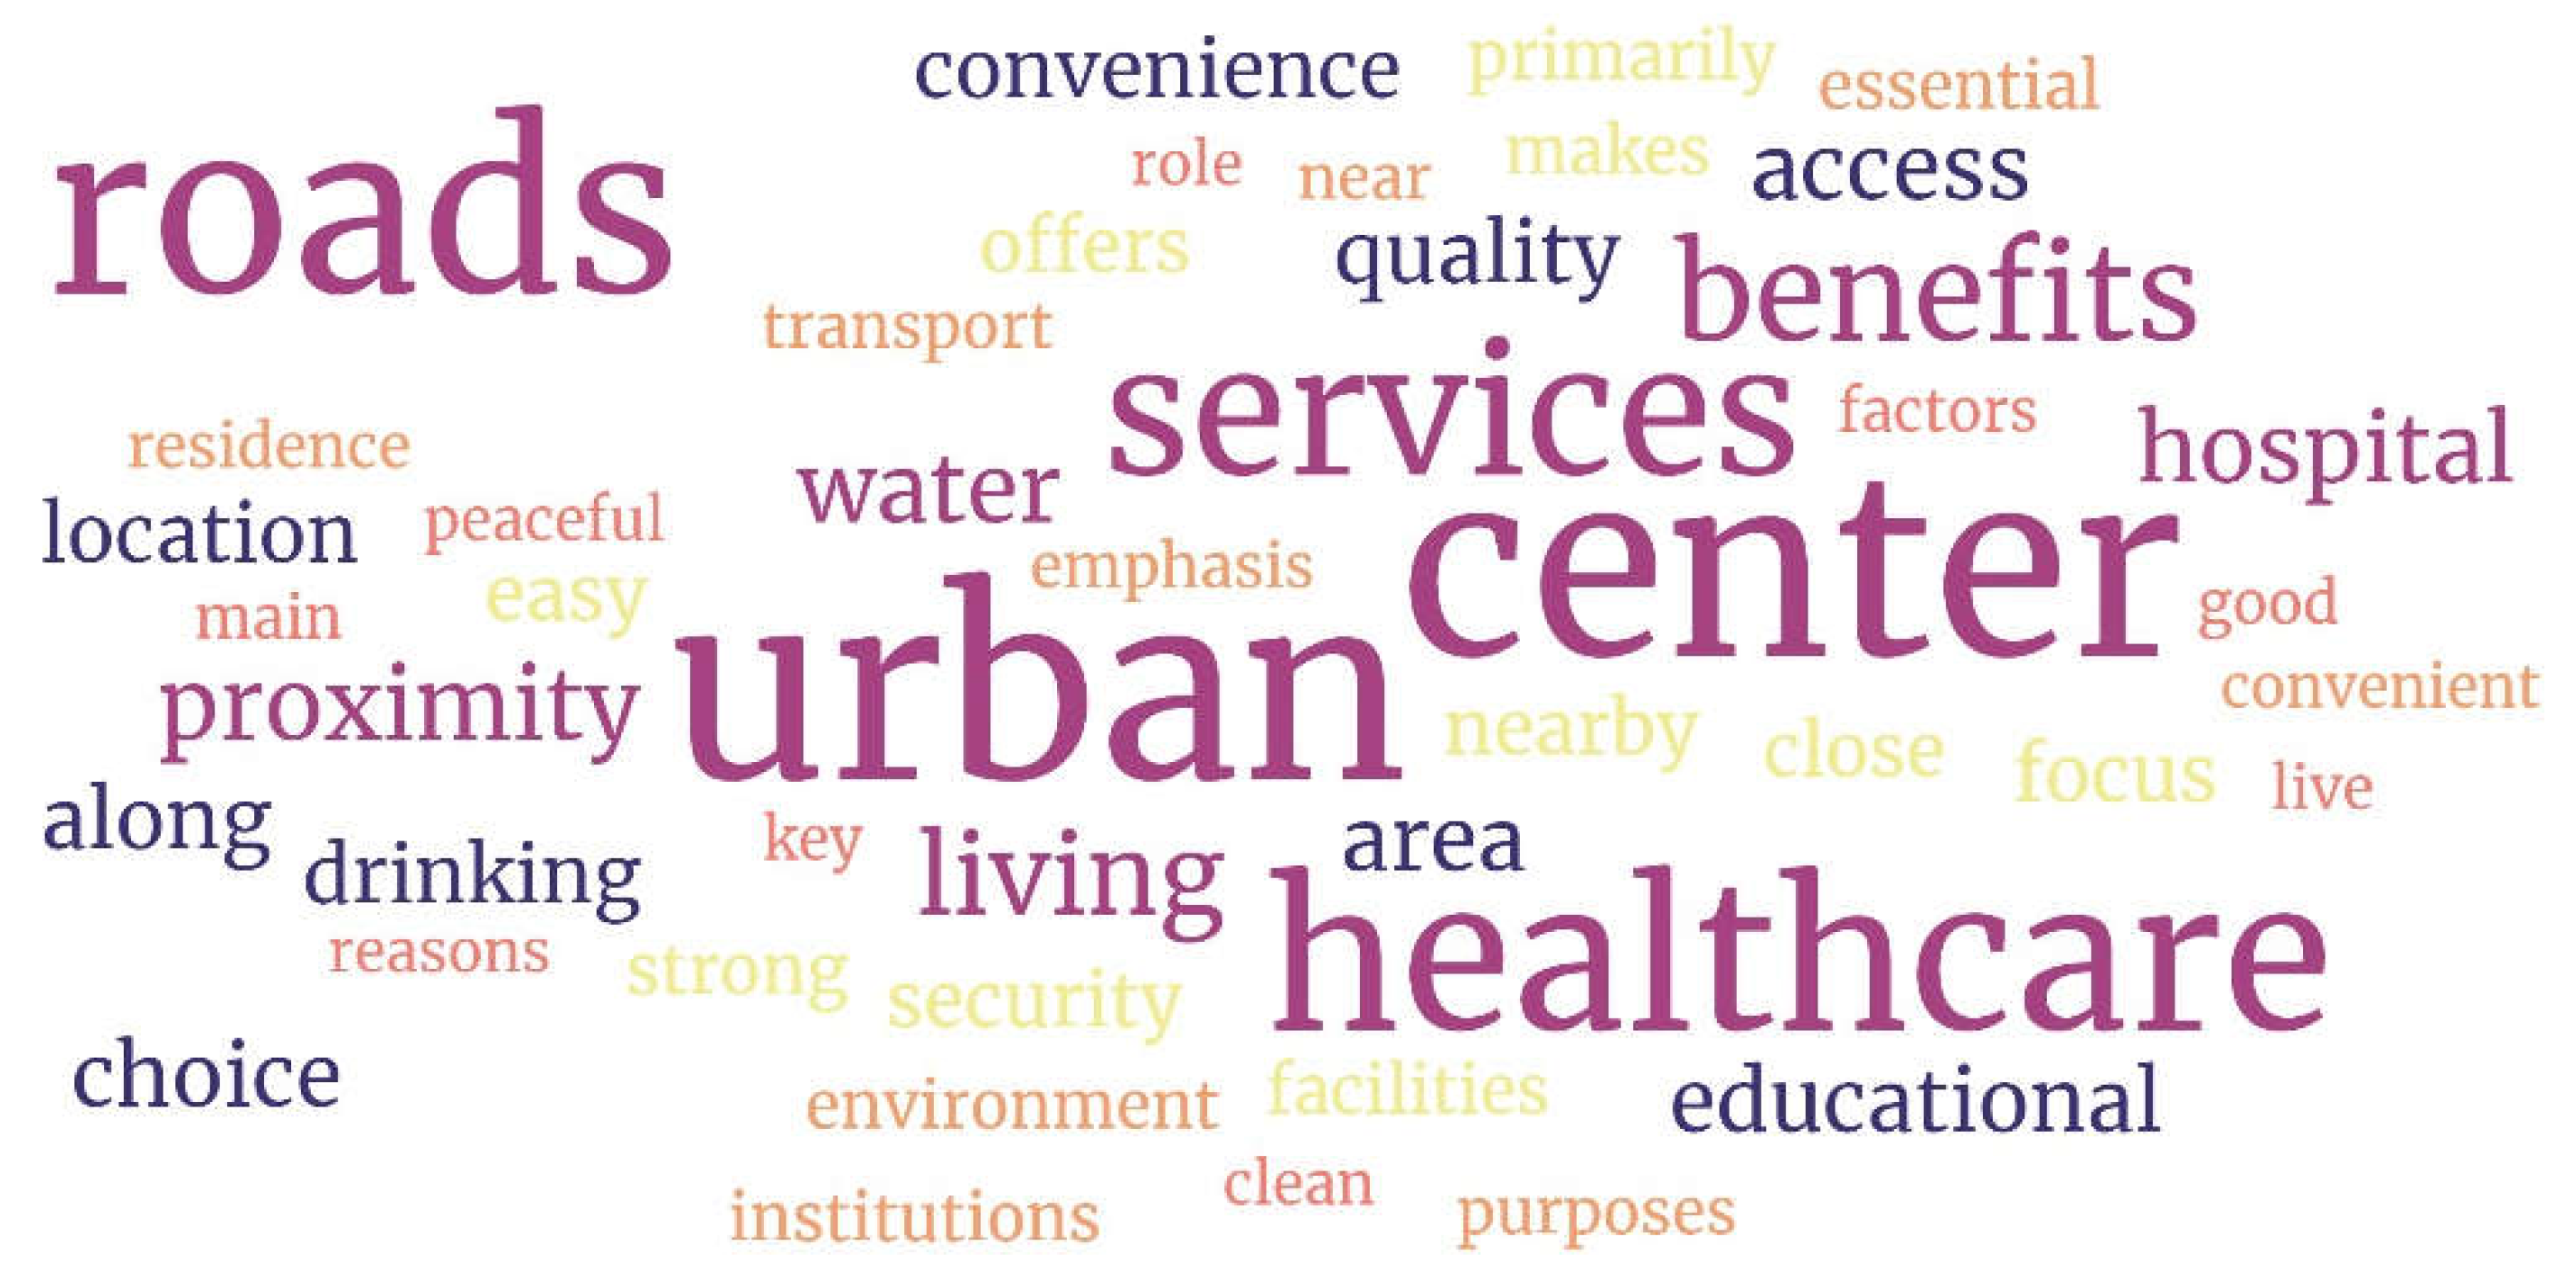
Figure 8.
Word cloud of reasons for not relocating to favorite living areas.
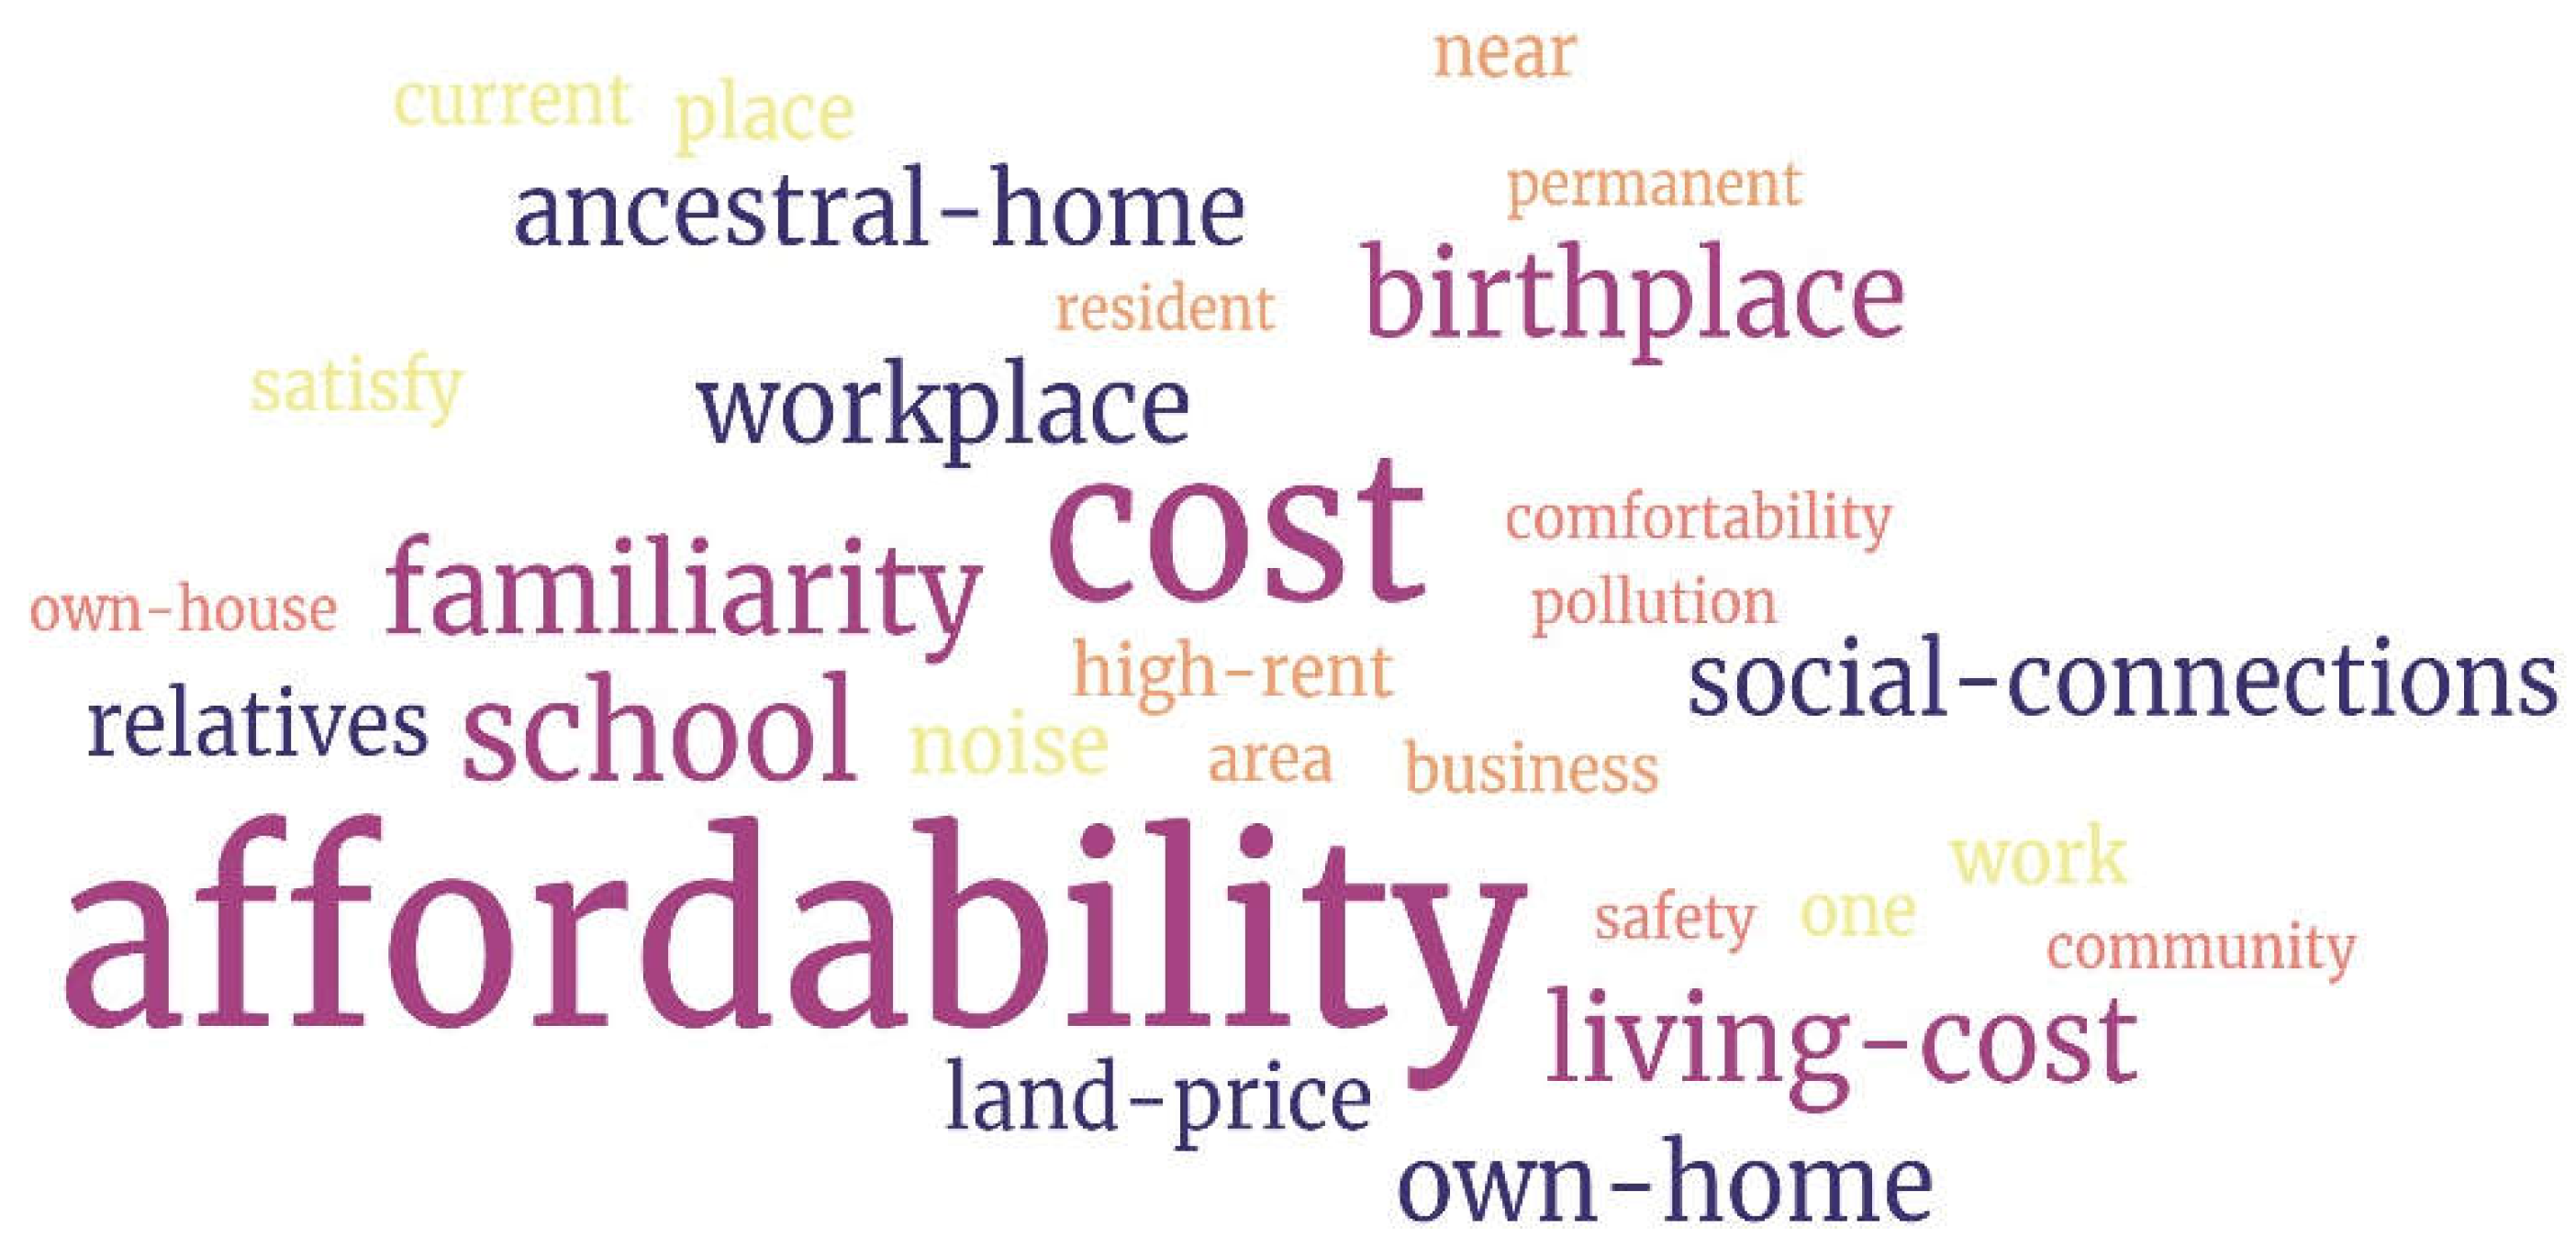
Table 1.
Dimensions and indicators, relevant literature, and data sources.
| Dimension | Indicator | Measurement Unit | Data Source | Note | Functional Relationship | Citations |
|---|---|---|---|---|---|---|
| Convenience | Distance to city center | Meter | KDA | - | Negative | [3,6,7] |
| Distance to major road | Meter | KDA | - | Negative | [32,55] | |
| Distance to bus terminal | Meter | KDA | - | Negative | [56] | |
| Distance to train station | Meter | KDA | - | Negative | [56] | |
| Distance to post office | Meter | KDA | - | Negative | [56] | |
| Distance to library | Meter | KDA | - | Negative | [6,56] | |
| Distance to secondary school | Meter | KDA | - | Negative | [6,7,56] | |
| Distance to primary school | Meter | KDA | - | Negative | [6,7,56] | |
| Amenity | Vegetation coverage | Index [-1, 1] | MODIS-Q1 imagery | Normalized Difference Vegetation Index (NDVI) | Positive | [7] |
| Availability of open space | 0/1 | Landsat 8 imagery | - | Positive | [32,57] | |
| Availability of water areas | Index [-1, 1] | Sentinel-2 imagery | Normalized Difference Water Index (NDWI) | Positive | [32] | |
| Distance to recreation facility | Meter | KDA | - | Negative | [3,7] | |
| Health | Distance to hospital | Meter | KDA | - | Negative | [3,6,7] |
| Distance to manufacturing district | Meter | KDA | - | Positive | [3,6,7] | |
| Air quality | Micromoles per 100 m² (µmol/100m²) | Sentinel-5P imagery | - | Positive | [42,54] | |
| Drinking water quality | Index | Water Quality Index Data | Water Quality Index (WQI) | Positive | [42,54] | |
| Soil salinity | Index [-1, 1] | Landsat 8 imagery | Normalized Difference Salinity Index (NDSI) | Negative | [52] | |
| Urban heat island | Degree Celsius | MODIS-A2 imagery | Land Surface Temperature | Negative | [29] | |
| Safety | Distance to major road intersection | Meter | KDA | - | Positive | [3,6,7] |
| Distance to police station | Meter | KDA | - | Negative | [7,56,57] | |
| Distance to fire station | Meter | KDA | - | Negative | [56] | |
| Distance to gas station | Meter | KDA | - | Positive | [3] |
Table 2.
Prioritization of dimensions and indicators.
| Dimension | Indicator | Priority (% in Dimension) |
Rank | Overall Rank |
|---|---|---|---|---|
| Convenience (60%) | Distance to city center | 28.52 | 1 | 1 |
| Distance to major road | 22.82 | 2 | ||
| Distance to bus terminal | 14.16 | 3 | ||
| Distance to train station | 6.34 | 6 | ||
| Distance to post office | 1.64 | 8 | ||
| Distance to library | 3.56 | 7 | ||
| Distance to secondary school | 9.86 | 5 | ||
| Distance to primary school | 13.10 | 4 | ||
| Amenity (6%) |
Vegetation coverage | 52.37 | 1 | 4 |
| Availability of open space | 15.25 | 3 | ||
| Availability of water areas | 6.09 | 4 | ||
| Distance to recreation facility | 26.29 | 2 | ||
| Health (23%) |
Distance to hospital | 24.25 | 2 | 2 |
| Distance to manufacturing district | 17.75 | 3 | ||
| Air quality | 4.01 | 6 | ||
| Drinking water quality | 37.91 | 1 | ||
| Soil salinity | 9.09 | 4 | ||
| Urban heat island | 6.98 | 5 | ||
| Safety (12%) |
Distance to major road intersection | 51.43 | 1 | 3 |
| Distance to police station | 30.45 | 2 | ||
| Distance to fire station | 11.58 | 3 | ||
| Distance to gas station | 6.54 | 4 | ||
| Overall Consistency Test: λ max = 4.24; CI = 0.08; RI = 0.9; CR = 0.087 | ||||
Disclaimer/Publisher’s Note: The statements, opinions and data contained in all publications are solely those of the individual author(s) and contributor(s) and not of MDPI and/or the editor(s). MDPI and/or the editor(s) disclaim responsibility for any injury to people or property resulting from any ideas, methods, instructions or products referred to in the content. |
© 2024 by the authors. Licensee MDPI, Basel, Switzerland. This article is an open access article distributed under the terms and conditions of the Creative Commons Attribution (CC BY) license (http://creativecommons.org/licenses/by/4.0/).
Copyright: This open access article is published under a Creative Commons CC BY 4.0 license, which permit the free download, distribution, and reuse, provided that the author and preprint are cited in any reuse.


