
Submitted:
27 November 2024
Posted:
28 November 2024
You are already at the latest version
Abstract
CO2 injection is considered as an alternative method for recovering shale gas and storing CO2 permanently into the geological trap. To better understand this field, an experimental study was carried out using shale samples from the Middle Magdalena Valley Basin in Colombia to investigate the adsorption mechanism of CO2 on shales. The effect of mineral composition, total organic carbon (TOC) content and thermal maturity on CO2 adsorption capacity has been discussed. The exper-iments were carried out using the manometric method to measure the excess sorption isotherms of CO2 at 50°C and pressures up to 3.5 MPa. The results indicate that the effect of clay minerals is not very significant in the adsorption of CO2; TOC has a major contribution to the adsorption uptake. In addition, a conclusive effect of maturity needs further measurements.
Keywords:
Gas adsorption
; shale gas
; CO2 storage
; manometric method
1. Introduction
The global demand for gas is constantly growing, which has generated the need to produce natural gas from source rock reservoirs, due to their large reserves and the difficulty of meeting this need solely with conventional resources. This unconventional hydrocarbon system is abundant throughout the world and has important technically recoverable resources, which are estimated at 7,576.6 TPC (tera cubic feet) in 46 countries around the world [1]. Colombia has about 54.7 TPC of recoverable reserves of this gas, which is a considerable sum when compared to conventional gas reserves, which are 3 TPC, according to BP's Statistical Review of World Energy [2].
These reservoirs are made up of fine-grained sedimentary rocks composed of mud, a mixture of traces of clay minerals and small fragments of other minerals, mainly quartz and calcite. These rocks may be high in organic matter, also known as kerogen. Theirs absolute porosities and permeabilities are significantly lower than those of a conventional gas reservoir, having ultralow permeabilities of a few hundred nano-darcies to a few milli-darcies [3] and porosities of 6 to 10% [4]. In these reservoirs, natural gas is present in three different forms: a) as gas adsorbed on the internal surface of the nanopores/micropores of the organic and inorganic components, b) as free gas in pores and microcracks and c) as gas in solution in the fluids present [5]. The latter can be considered negligible. Consequently, the total gas content is considered as the sum of the adsorbed gas and the free gas; where the adsorbed gas can represent 20 to 80% of the total reserves [6].
Technological improvements in horizontal drilling and hydraulic fracturing have enabled the production and development of these fields. These technologies have allowed to increase the recovery factor, while increasing daily production rates. However, only 5% to 10% of original gas in place (OGIP) is expected to be economically recoverable [7], leaving great potential for extraction with enhanced recovery methods. Considering that the amount of adsorbed gas represents a high percentage of the reserves and that this gas is not contributing substantially to production, because the gas molecules are trapped in the walls of the nanopores of the matrix during production, the need arises to delve deeper into the search for alternatives to desorb this large percentage of gas, in order to extract it, to increase the recovery factor of the field. Desorption occurs due to a decrease in pressure and/or the presence of another gas that is favorably adsorbed. As a result, CO2 injection techniques are being studied as an option to extract gas from these rocks and permanently sequester CO2 in the geological traps [8,9].
Several studies have evaluated the adsorption of CO2 and methane in source rock samples [10,11,12,13,14,15,16,17,18,19]. The first investigation of CO2 and methane adsorption on the same source rock material was carried out by Nuttal et al. [20]. The results have shown that shales have a higher adsorption affinity for CO2 than for CH4, and the adsorption of CO2 is estimated to be 2 to 10 times greater than that of CH4. This is due to different properties, including molecular size. The dynamic diameter of CO2 is about 0.33 nm and the dynamic diameter of CH4 is about 0.38 nm [21]. Therefore, the effective size of CO2 is smaller and it can access narrower pores in the rock matrix and come into contact with a larger volume of the shale system [11].
Only a few experimental papers have studied the adsorption capacity of Colombian shales, for example, [22,23]. The purpose of this research is to expand the available data, for this reason CO2 adsorption data are reported for samples of Colombian source rocks, selected from the Middle Magdalena Valley. CO2 adsorption isotherms were measured at 50 °C for pressures up to 3.5 MPa using a homemade gauge setup. These measurements were performed on dry core samples from two different wells.
2. Materials and Methods
During exploratory drilling in the Middle Magdalena Valley basin of Colombia, three core samples were obtained from two stratigraphic wells. The samples are named S2A, S2B, and S3 according to previous research [23].
This basin, whose extension is approximately 33,670 km2 (83.2 e5 acres), is located between the Central Cordillera and the Eastern Cordillera, 241 kilometers from Bogotá. The Middle Magdalena Valley basin is limited to the north by the Espíritu Santo fault system, to the northeast by the Bucaramanga-Santa Marta fault system, to the southeast by the Bituima and La Salina fault system, to the south by the Girardot, and to the east with the Neogene basin [24]. The Middle Magdalena Valley Basin is a mature basin in terms of hydrocarbon exploration and production. Its activity has focused mainly on conventional hydrocarbon deposits from the Tertiary [25].
The Paja, Tablazo, La Luna and Rosa Blanca formations are the source rock formations of the Middle Magdalena Valley Basin. The samples analyzed were extracted from the Tablazo formation.
2.1. Sample Characterization
2.1.1. Rock-Eval Analysis
Espitalié et al. [26] established a standard for Rock-Eval pyrolysis, which is applied worldwide. In the present study, Rock-Eval pyrolysis was carried out with a Rock-Eval-VI pyrolyzer. Parameters were calculated such as the content of volatile hydrocarbons (S1), expressed as mg HC/g rock, the generative potential of remaining hydrocarbons (S2), expressed as mg HC/g rock, the content of volatile carbon dioxide (S3), expressed as mg HC/g rock, the maximum pyrolysis performance temperature (Tmax), expressed as °C and the total organic carbon (TOC) expressed as percentage by weight of the crushed shale core samples. Other parameters such as hydrogen index (HI), oxygen index (OI), and production index (PI) were calculated. The most important measurements are shown in Table 1.
2.1.2. X-ray Diffraction (XRD)
X-ray diffraction (XRD) is a basic tool in the mineralogical analysis of source rocks. X-ray powder diffraction is the best technique available to identify and quantify all minerals present in a clay-rich rock. The XRD analysis was carried out using a Siemens D-5000 equipment with Cu Kα radiation (40 kV, 20 mA) in the angular range of 2°–65° (2θ) at a speed of 1°/min. The measured parameters are shown in Table 2.
2.2. CO2 Adsorption Experiments
2.2.1. Experimental Set up
Gas adsorption into the source rock matrix can be assessed in the laboratory by constructing adsorption isotherms. With this objective, the method used in the present study is the manometric method, which uses the principle of mass balance [27,28]. The equipment is a home-made high-pressure (HP) manometric device. The main elements of this device are the dosing cell (33.57 cm3), the sample or measurement cell (16.56 cm3) in which the adsorbent is placed and the pressure transducer (MKS Baratron type 121 A, with an uncertainty of 0.01% at full scale ranging from vacuum to 3.5 (MPa)). The entire system must be maintained under constant temperature conditions [29]. Three 2 ways valves allow to separate the dosing cell from the adsorption cell. Isothermal conditions are ensured by a PID regulator (Eurotherm 3208) monitored through the use of two thermocouples placed on each of the cells. This equipment can operate over broad ranges of pressure [0 – 3, 3 (MPa)] and temperature [303, 15 (K)-423,15 (K)].
The amount of gas is measured by monitoring the pressure drop of a fixed, known volume containing the adsorbent sample. For the manometric method, the measuring device consists of a dosing cell and an adsorption cell with calibrated volumes, equipped with a high-precision pressure transducer.
A general scheme of this method is shown in Figure 1.
2.2.2. Experimental Procedure
The amount of gas is measured by monitoring the pressure drop of a fixed, known volume containing the adsorbent sample. For the manometric method, the measuring device consists of a dosing cell and an adsorption cell with calibrated volumes, equipped with a high-precision pressure transducer.
The measurement is performed by successively transferring gas through the reference cell to the sample cell, which contains the adsorbent sample [30]. Therefore, the amount of adsorbed gas is calculated as follows:
Where ntotal is the number of moles originally in the reference cell and nfree is the number of moles in the free phase at equilibrium.
The procedure comprises the following five sequential steps: (1) The adsorbent sample is placed in the cell and its mass is measured with high precision (the mass is measured before gas extraction). The sample is chosen in such a way that it has an adequate adsorption area; the minimum area required is around 30 m2. (2) The adsorbent is first dried at 100 °C for about 24 hours to remove moisture. (3) The accessible pore volume in the measurement vessel is determined through successive expansions of a gas whose adsorption is negligible, such as Helium [31]. The value of the accessible volume is independent of the pressure in the study range, which is between 0 and 3 MPa. (4) Additional drying is carried out for 8 to 10 hours (5) Once the accessible volume is known, an amount of CO2 is sent to the reference cell at known pressure and temperature. Subsequently, this volume of gas (Vd) is taken to the measurement cell (Vm), which contains the sample under isothermal conditions. When adsorption equilibrium is reached, the amount of gas that was adsorbed can be calculated by the mass balance before and after adsorption. In this investigation, thermodynamic equilibrium was reached in a range of 45 to 60 min. The number of moles adsorbed, during the first step it can be calculated as follows:
This adsorbed amount is the first point of the adsorption isotherm. The other steps are calculated using a cumulative process, described as:
Each measurement is repeated twice. The claimed uncertainty is better than 3%.[32].
3. Results
3.1. Rock-Eval Analysis
The parameters obtained through the Rock-Eval analysis are shown in Table 1. Based on the results, the samples from the Middle Magdalena Valley Basin have a variable TOC content, in the range of 3.12–8.77% wt, which which indicates that the rock has good to very good hydrocarbon generation potential.
A source rock is defined as mature when it reaches the level of hydrocarbon generation. A rock that does not reach the level of hydrocarbon generation is defined as an immature source, and one that has passed the generation and expulsion time is considered an over-mature rock [33]. The parameter commonly used to monitor the maturity level is the temperature (Tmax) corresponding to the maximum generation and production index (PI) [34]. The samples studied have Tmax values in the range of 471°C – 487°C. Tmax values below 435 °C are considered immature organic matter, between 435 °C and 455 °C indicate "oil window" conditions (mature organic matter), and values above 455 °C are considered post-mature. There are two subcategories within the latter; between 455 and 470 °C are considered transient, and values above 470 °C represent the wet gas zone [35]. According to the Tmax-HI graph (Figure 2), all samples are within the post-mature stage.
The samples studied have low concentrations of free hydrocarbons (S1), with values in the range of 0.35 to 2.47 mg HC/g rock. The amount of hydrocarbon production (S2) expelled during Rock-Eval pyrolysis is a useful parameter to evaluate the hydrocarbon generation potential of source rocks [36,37]. The analyzed samples have S2 values in the range of 0.7 to 4.96 mg HC/g rock. The TOC content and the S2 peak (Figure 3) indicate that the rock samples have poor to good hydrocarbon generation potential, according to the classification of Peters and Cassa [38]. Parameter S3 indicates the CO2 released from thermal cracking during pyrolysis, reaching the highest value in sample S2B (0.42 mg CO2/g of rock) and the lowest value in sample S2A (0.18 mg of CO2/g rock).
The hydrogen indices (HI) are derived from the ratio (S2/TOC) × 100 and values of 22 were obtained in samples S2A and S2B, and 87 in sample S3. Oxygen indices (OI) are derived from the ratio (S3/TOC) × 100, and values ranging from 4.37 (sample S3) to 5.76 (sample S2A) were obtained.
According to the Tmax-HI graph (Figure 2), the organic matter of the samples is characterized by having type II-III kerogen in sample S3, and type III kerogen in samples S2A and S2B.
The production index (PI) is derived from the relationship S1/(S1+S2), is defined as the relation between the amount of hydrocarbons generated and the total amount of organic matter. The PI values are 0.33 in samples S2A and S3, and 0.17 in sample S2B.
3.2. Ray Diffraction (XRD)
The fact that each mineral has its own fingerprints makes it possible to recognize the minerals present in the samples [39]. Using XRD, clay and non-clay minerals were identified; among the clay minerals, kaolinite and illite were obtained, and among the non-clay minerals, quartz was obtained.
The XRD results (Table 2) indicate that the samples are mainly composed of clay minerals (28−30%), quartz (11−32%), and calcite (28−50%). Other minerals identified are pyrite (4-9%), apatite (<2%) and traces of gypsum. It is observed that the clay content of the samples is very similar and that it is characterized by a higher content of kaolinite (15-22%) compared to illite (7-13%). Sample S3 shows a higher content of kaolinite (22%) and quartz (23%), while calcite can reach 50% in S2B. These results as the previous one obtained by rock-eval analysis were already detailed [23]. We only recall here the fundamentals elements of this study essentials to the comprehensive study of the CO2 adsorption.
3.3. Adsorption
In this section, the original results of the CO2 adsorption experiments are presented. Three experiments were performed at a temperature of 50 °C and pressures up to 3.5 MPa. Each isotherm was repeated twice and the reproducibility was always found lower than the claimed uncertainty. Excess adsorption versus pressure is plotted in Figure 4. It is identified that sample S2B has the highest CO2 adsorption capacity among all the samples analyzed, and the maximum value of CO2 adsorbed amounts to 0.33 mol/kg. Samples S2A and S3 have similar CO2 adsorption capacities, with values of 0.093 mol/kg and 0.099 mol/kg respectively.
Experimental data of CO2 adsorption were correlated using the three-parameter Langmuir model described by Gensterblum et al. [40] and applied by Gasparik et al. [41], which is given as:
Where is the adsorbed amount of gas (mol/kg) at pressure (MPa), is the Langmuir pressure (the pressure at which half of the Langmuir volume is adsorbed), is the amount adsorbed (mol/kg) when the monolayer is completely filled (Langmuir maximum capacity), is the gas density (kg/m3) to a and , and is the adsorbed phase density, which was assumed as a fixed value of 1028 kg/m3 for the adsorbed phase density [15].
The standard deviation was calculated according to Pozo et al. [19] as follows:
Where N is the number of data points; is the experimental adsorption value; and is the setting value at each adsorption pressure. Table 3 shows the parameters of the Langmuir model for gas adsorption on shale samples. The fitting results show that the values of Δn range from 0.00024 to 0.0033, indicating that the Langmuir model fits well.
4. Discussion
4.1. Influence of Mineralogical Composition on CO2 Adsorption
The adsorption capacities and mineral content of all samples were plotted (Figure 5) to investigate the influence of mineralogical composition on the adsorption of pure CO2. Mineral components, particularly clay minerals, have been widely considered as a significant factor affecting the adsorption capacity of source rock samples as they contribute to the micropore volume of the rock [42,43]. However, a discrepancy between this and the results obtained can be observed, since the three samples have a similar content of clay minerals but the adsorption capacity of sample S2B is much higher. A possible explanation for this can be determined if the two clay minerals present in the samples are analyzed separately; the illite content is higher in sample S2B, so we can conclude that illite has a greater adsorption capacity compared to kaolinite. Another explanation for the discrepancy is due to the high TOC content. Studies have reported that the specific influence of clay on gas adsorption is less evident in source rocks with high TOC content [44,45,46,47].
There is no clear connection between quartz content and CO2 adsorption capacity, and quartz appears to play a minor role in the sorption capacity of these shales.
4.2. Influence of Organic Matter on CO2 Adsorption
The effect of organic matter on the adsorption of CO2 in the samples of this study is shown in Figure 6, at pressures of 0.1 MPa, 0.3 MPa, 1 MPa and 3 MPa. Organic matter is mainly responsible for the microporous nature of the rock and also the main contributor to the surface area and total pore volume [48,49]. The reviewed literature confirms that the adsorption capacity on source rocks is strongly correlated with TOC. With the results of this research, a moderate positive correlation can be seen between CO2 adsorption and TOC; however, a linear relationship is not shown. It is also observed that the correlation is better at low pressures.
4.3. Influence of Thermal Maturity on CO2 Adsorption
The effect of thermal maturity on the adsorption of CO2 in the samples under study at pressures of 0.3 MPa and 3 MPa is shown in Figure 7. In shales, the thermal maturity of organic matter can generate additional micropores [50,51], and the generation of more micropores increases the adsorption capacity. In this study, although it is observed that sample S2B is the most mature and has the highest adsorption capacity, a conclusive effect of maturity cannot be determined due to the limitation of the number of samples.
5. Conclusions
The effect of mineral composition, total organic carbon (TOC) content and thermal maturity on CO2 adsorption capacity has been discussed. CO2 adsorption storage capacity has a moderate positive correlation with total organic carbon; however, a linear relationship was not clearly identified. This relationship between adsorption storage capacity of CO2 and Total Organic Carbon was more significant at low pressures. A conclusive effect of maturity has not been determined due to the limitation of the number of samples in the present study.
Author Contributions
Conceptualization, Olga Ortiz, David Bessieres; Data Curation, Valentina Acevedo, Olga Ortiz; Formal Analysis, Valentina Acevedo; Investigation, Olga Ortiz, David Bessieres; Methodology, David Bessieres, Valentina Acevedo; Project Administration, Olga Ortiz; Resources, David Bessieres; Supervision, Olga Ortiz, David Bessieres; Validation, Olga Ortiz, David Bessieres; Visualization, Valentina Acevedo; Writing-Original draft, Valentina Acevedo; Writing-review & editing, Olga Ortiz, David Bessieres
Funding
This research received no external funding.
Data Availability Statement
The data that has been used is confidential.
Acknowledgments
The authors thank to Colombian Institute of Petroleum and Transition Energies (ICPET) for the support to this work.
Conflicts of Interest
The authors declare no conflicts of interest.
References
- EIA, “World Shale Resource Assessments”, 2015 [PDF]. Available: https://www.ieee.es/Galerias/fichero/OtrasPublicaciones/Internacional/2015/EIA_World_Shale_Resource_Assessments_24sept2015.pdf.
- BP, “Statistical Review of World Energy”, 2021 [PDF]. Available. https://www.bp.com/content/dam/bp/business-sites/en/global/corporate/pdfs/energy-economics/statistical-review/bp-stats-review-2021-full-report.pdf.
- EIA, “Technically Recoverable Shale Oil and Shale Gas Resources: An Assessment of 137 Shale Formations in 41 Countries outside the United States”, 2013 [PDF]. Available:https://www.eia.gov/analysis/studies/worldshalegas/pdf/overview.pdf.
- Y. Jiang, Y. Luo, Y. Lu, C. Qin, and H. Liu, “Effects of supercritical CO2 treatment time, pressure, and temperature on microstructure of shale”, Energy, vol. 97, pp. 173–181, Feb. 2016. [Online]. [CrossRef]
- R. M. Bustin, A. M. M. Bustin, A. Cui, D. Ross, and V. M. Pathi, “Impact of shale properties on pore structure and storage characteristics”, in SPE Shale Gas Production Conference, Fort Worth, Texas, USA. Society of Petroleum Engineers, 2008. [Online]. [CrossRef]
- C. A. Murillo Martínez, O. A. Gómez Rodríguez, O. P. Ortiz Cancino, and S. F. Muñoz Navarro, “Application of models for the generation of the methane adsorption isotherm in a shale sample and its impact on the calculation of reserves”, Fuentes Magazine the Energy Reventón, vol. 13, no. 2, pp. 131–140, Jul. 2015. [Online]. [CrossRef]
- S. Rassenfoss, “Shale EOR works, but will it make a difference?”, Journal of Petroleum Technology, vol. 69, no. 10, pp. 34–40, Oct. 2017. [Online]. [CrossRef]
- R. Iddphonce, J. Wang, and L. Zhao, “Review of CO2 injection techniques for enhanced shale gas recovery: Prospect and challenges”, Journal of Natural Gas Science and Engineering, vol. 77, p. 103240, May. 2020. [Online]. [CrossRef]
- S.M. MousaviMirkalaei, L. Santos, A. Khanifar, M. D. Edmondson. "Coupled Geochemistry Modelling of Underground CO2 Storage from Lab to Field Scale." Paper presented at the APOGCE 2024, Perth, Australia, October 2024. doi: https://doi-org.bibliotecavirtual.uis.edu.co/10.2118/221328-MS.
- P. Weniger, W. Kalkreuth, A. Busch, and B. M. Krooss, “High-pressure methane and carbon dioxide sorption on coal and shale samples from the Paraná Basin, Brazil”, International Journal of Coal Geology, vol. 84, no. 3-4, pp. 190–205, Dec. 2010. [Online]. [CrossRef]
- S. M. Kang, E. Fathi, R. J. Ambrose, I. Y. Akkutlu, and R. F. Sigal, “Carbon dioxide storage capacity of organic-rich shales”, SPE Journal, vol. 16, no. 04, pp. 842–855, Apr. 2011. [Online]. [CrossRef]
- P. Chareonsuppanimit, S. A. Mohammad, R. L. Robinson, and K. A. M. Gasem, “High-pressure adsorption of gases on shales: Measurements and modeling”, International Journal of Coal Geology, vol. 95, pp. 34–46, Jun. 2012. [Online]. [CrossRef]
- H. Aljamaan, “Petrophysical investigation on gas transport properties of the Barnett”, in SPE Annual Technical Conference and Exhibition, New Orleans, Louisiana, USA. Society of Petroleum Engineers, 2013. [Online]. [CrossRef]
- R. Heller and M. Zoback, “Adsorption of methane and carbon dioxide on gas shale and pure mineral samples”, Journal of Unconventional Oil and Gas Resources, vol. 8, pp. 14–24, Dec. 2014. [Online]. [CrossRef]
- X. Luoet al., “Adsorption of methane, carbon dioxide and their binary mixtures on Jurassic shale from the Qaidam Basin in China”, International Journal of Coal Geology, vol. 150-151, pp. 210–223, Oct. 2015. [Online]. [CrossRef]
- P. Charoensuppanimit, S. A. Mohammad, and K. A. M. Gasem, "Measurements and modeling of gas adsorption on shales", Energy & Fuels, vol. 30, no. 3, pp. 2309–2319, Feb. 2016. [Online]. [CrossRef]
- L. Hong et al., “An investigation of factors affecting the interaction of CO2 and CH4 on shale in Appalachian Basin”, Journal of Unconventional Oil and Gas Resources, vol. 14, pp. 99–112, Jun. 2016. [Online]. [CrossRef]
- O. P. Ortiz Cancino, D. Pino Pérez, M. Pozo, and D. Bessieres, “Adsorption of pure CO2 and a CO2/CH4 mixture on a black shale sample: Manometry and microcalorimetry measurements”, Journal of Petroleum Science and Engineering, vol. 159, pp. 307–313, Nov. 2017. [Online]. [CrossRef]
- M. Pozo, D. Pino, and D. Bessieres, “Effect of thermal events on maturation and methane adsorption of Silurian black shales (Checa, Spain)”, Applied Clay Science, vol. 136, pp. 208–218, Feb. 2017. [Online]. [CrossRef]
- B. Nuttal, C. Eble, R. Bustin, and J. Drahovzal, “Analysis of Devonian black shales in Kentucky for potential carbon dioxide sequestration and enhanced natural gas production”, in Greenhouse Gas Control Technologies 7. Elsevier, 2005, pp. 2225–2228. [Online]. [CrossRef]
- S. Duan, M. Gu, X. Du, and X. Xian, “Adsorption equilibrium of CO2 and CH4 and their mixture on Sichuan Basin Shale”, Energy & Fuels, vol. 30, no. 3, pp. 2248–2256, Feb. 2016. [Online]. [CrossRef]
- P. A. Pacheco Sintura, A. Cardona Molina, and F. B. Cortés, “Compositional characterization and storage capacity of shale samples from La Luna and Conejo Formations (Middle Magdalena basin and the Eastern Cordillera): Implications for evaluation of cretaceous shale gas in Colombia”, Earth Sciences Bulletin, no. 37, pp. 45–53, Jan. 2015. [Online]. [CrossRef]
- O. P. Ortiz Cancino, D. Peredo Mancilla, M. Pozo, E. Pérez, and D. Bessieres, “Effect of organic matter and thermal maturity on methane adsorption capacity on shales from the Middle Magdalena Valley basin in Colombia”, Energy & Fuels, vol. 31, no. 11, pp. 11698–11709, Oct. 2017. [Online]. [CrossRef]
- E. Lozano and N. Zamora, “Annex N Compilation of the Middle Magdalena Valley Basin”, Dec-2014. [On-line]. Available: https://recordcenter.sgc.gov.co/B20/23008100024725/Documento/Pdf/2105247251114000.pdf. [Accessed: 03-May-2022].
- H. A. Galvis-Portilla et al., “Regional sequence stratigraphy of the Upper Cretaceous La Luna Formation in the Magdalena Valley Basin, Colombia.”, in Unconventional Resources Technology Conference, Denver, Colorado, USA, Aug. 25–27, 2014. Tulsa, OK, USA: American Association of Petroleum Geologists, 2014. [Online]. [CrossRef]
- J. Hospital et al., “Rapid method for characterizing rocks, their petroleum potential and their degree of evolution”, Review of the French Petroleum Institute, vol. 32, no. 1, pp. 23–42, Jan. 1977. [Online]. [CrossRef]
- R. Khosrokhavar, K.H. Wolf, and H. Bruining, “Sorption of CH4 and CO2 on a carboniferous shale from Belgium using a manometric setup”, International Journal of Coal Geology, vol. 128-129, pp. 153–161, Aug. 2014. [Online]. [CrossRef]
- Y. Belmabkhout, M. Frère, and G. D. Weireld, “High-pressure adsorption measurements. A comparative study of the volumetric and gravimetric methods”, Measurement Science and Technology, vol. 15, no. 5, pp. 848–858, Mar. 2004. [Online]. [CrossRef]
- J. Rouquerol, F. Rouquerol, and K. S. W. Sing, Adsorption by powders and porous solids: Principles, methodology and applications. Academic Press, 1999.
- M. Gasparik et al., “First international inter-laboratory comparison of high-pressure CH 4 , CO 2 and C 2 H 6 sorption isotherms on carbonaceous shales”, International Journal of Coal Geology, vol. 132, pp. 131–146, Oct. 2014. [Online]. [CrossRef]
- J. M. Santos and I. Y. Akkutlu, “Laboratory measurement of sorption isotherm under confining stress with pore-volume effects”, SPE Journal, vol. 18, no. 05, pp. 924–931, Aug. 2013. [Online]. [CrossRef]
- D. Pino, F. Plantier, D. Bessieres, “Experimental determination of the adsorption isotherms in gas mixtures under extended pressure and temperature range”, J Therm Anal Calorim, Vol 117, pp.1469-1477, 2014. [Online]. [CrossRef]
- N. M. Al-Areeq, “Petroleum source rocks characterization and hydrocarbon generation”, in Recent Insights in Petroleum Science and Engineering. InTech, 2018. [Online]. [CrossRef]
- S. Brunauer, P. H. Emmett, and E. Teller, “Adsorption of gases in multimolecular layers”, Journal of the American Chemical Society, vol. 60, no. 2, pp. 309–319, Feb. 1938. [Online]. [CrossRef]
- K. E. Peters, “Guidelines for Evaluating Petroleum Source Rock Using Programmed Pyrolysis”, AAPG Bulletin, vol. 70, 1986. [Online]. [CrossRef]
- M. L. Bordenave, Applied Petroleum Geochemistry. Paris: Editions Technip, 1993.
- F. Langford and M. Blanc-Valleron, “Interpreting rock-eval pyrolysis data using graphs of pyrolizable hydrocarbons vs. total organic carbon (1)”, AAPG Bulletin, vol. 74, 1990. [Online]. [CrossRef]
- K. E. Peters and M. R. Cassa, “Applied Source Rock Geochemistry”, in The Petroleum System—From Source to Trap. American Association of Petroleum Geologists, 1994, pp. 93–120. [Online]. [CrossRef]
- A. S. Butt, “Shale characterization using X-Ray diffraction”, Submitted in partial fulfillment of the requirements for the degree of Master of Engineering. Nova Scotia: Dalhousie University Halifax, August, 2012.
- Y. Gensterblum et al., “European inter-laboratory comparison of high pressure CO2 sorption isotherms. I: Activated carbon”, Carbon, vol. 47, no. 13, pp. 2958–2969, Nov. 2009. [Online]. [CrossRef]
- M. Gasparik, A. Ghanizadeh, P. Bertier, Y. Gensterblum, S. Bouw, and B. M. Krooss, “High-Pressure methane sorption isotherms of black shales from the Netherlands”, Energy & Fuels, vol. 26, no. 8, pp. 4995–5004, Jul. 2012. [Online]. [CrossRef]
- R. M. Slatt and N. R. O'Brien, “Pore types in the Barnett and Woodford gas shales: Contribution to understanding gas storage and migration pathways in fine-grained rocks”, AAPG Bulletin, vol. 95, no. 12, pp. 2017–2030, Dec. 2011. [Online]. [CrossRef]
- K. L. Milliken, M. Rudnicki, D. N. Awwiller, and T. Zhang, “Organic matter-hosted pore system, Marcellus Formation (Devonian), Pennsylvania”, AAPG Bulletin, vol. 97, no. 2, pp. 177–200, Feb. 2013. [Online]. [CrossRef]
- S. Wang, Z. Song, T. Cao, and X. Song, “The methane sorption capacity of Paleozoic shales from the Sichuan Basin, China”, Marine and Petroleum Geology, vol. 44, pp. 112–119, Jun. 2013. [Online]. [CrossRef]
- M. Gasparik, P. Bertier, Y. Gensterblum, A. Ghanizadeh, B. M. Krooss, and R. Littke, “Geological controls on the methane storage capacity in organic-rich shales”, International Journal of Coal Geology, vol. 123, pp. 34–51, Mar. 2014. [Online]. [CrossRef]
- J. Tan et al., “Shale gas potential of the major marine shale formations in the Upper Yangtze Platform, South China, Part II: Methane sorption capacity”, Fuel, vol. 129, pp. 204–218, Aug. 2014. [Online]. [CrossRef]
- H. Bi et al., “The Ono–Kondo model and an experimental study on supercritical adsorption of shale gas: A case study on Longmaxi shale in southeastern Chongqing, China”, Journal of Natural Gas Science and Engineering, vol. 35, pp. 114–121, Sep. 2016. [Online]. [CrossRef]
- T. Cao, Z. Song, S. Wang, X. Cao, Y. Li, and J. Xia, “Characterizing the pore structure in the Silurian and Permian shales of the Sichuan Basin, China”, Marine and Petroleum Geology, vol. 61, pp. 140–150, Mar. 2015. [Online]. [CrossRef]
- S. Zhou, H. Xue, Y. Ning, W. Guo, and Q. Zhang, “Experimental study of supercritical methane adsorption in Longmaxi shale: Insights into the density of adsorbed methane”, Fuel, vol. 211, pp. 140–148, Jan. 2018. [Online]. [CrossRef]
- J.-S. Bae and S. K. Bhatia, “High-Pressure adsorption of methane and carbon dioxide on coal”, Energy & Fuels, vol. 20, no. 6, pp. 2599–2607, Nov. 2006. [Online]. [CrossRef]
- C. Delle Piane et al., “Organic matter network in post-mature Marcellus Shale: Effects on petrophysical properties”, AAPG Bulletin, vol. 102, no. 11, pp. 2305–2332, Nov. 2018. [Online]. [CrossRef]
Figure 1.
General scheme of the manometric method. Source: own elaboration.
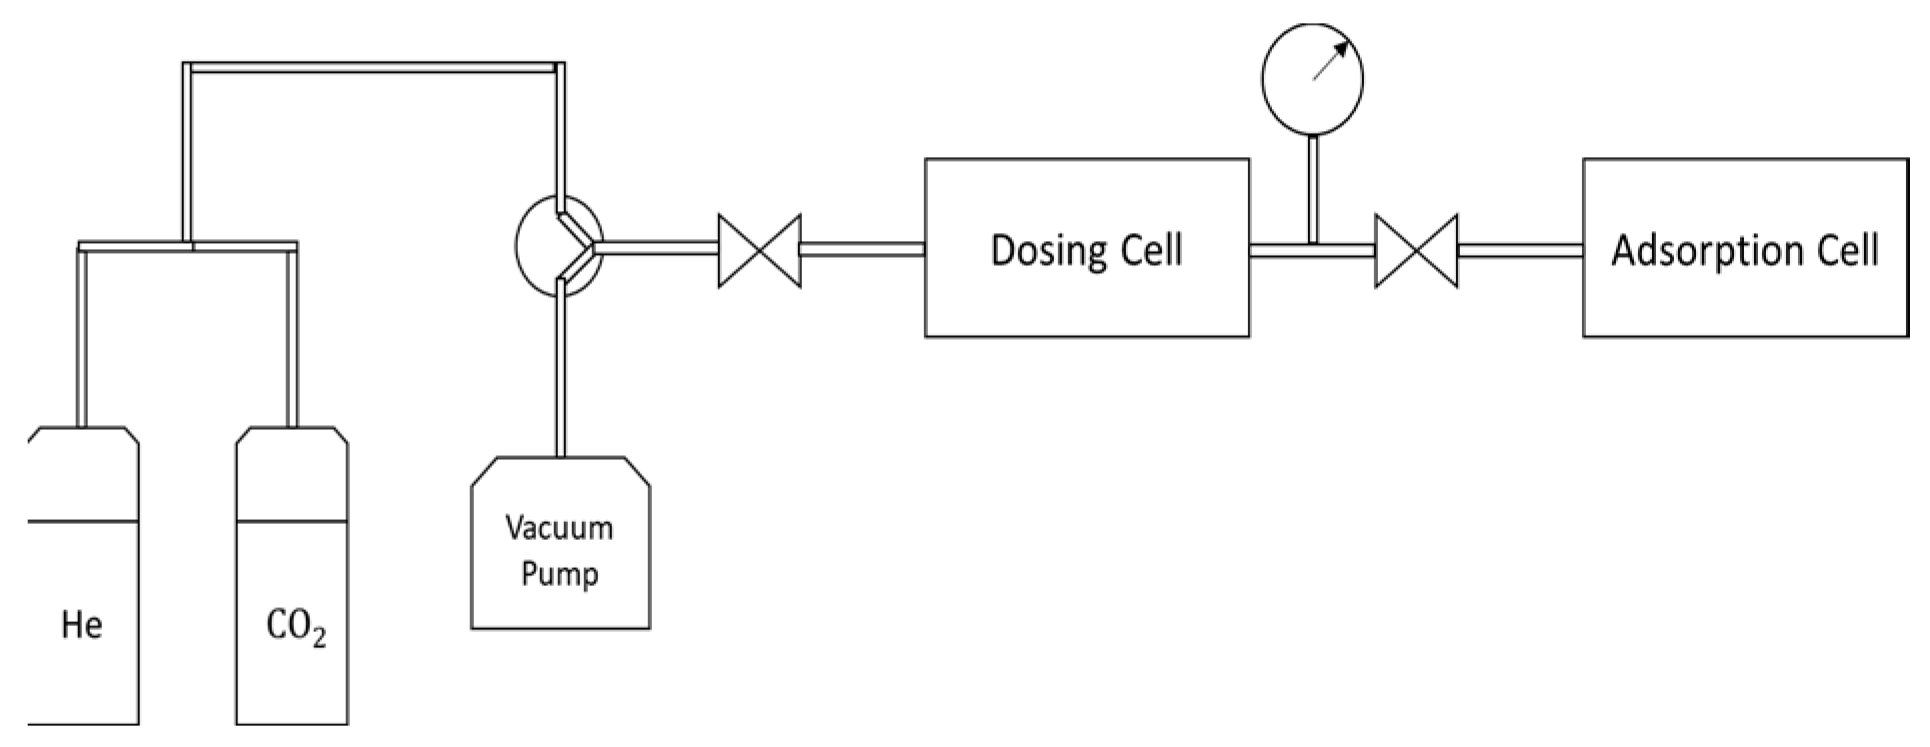
Figure 2.
Tmax−HI graph. Source: own elaboration.
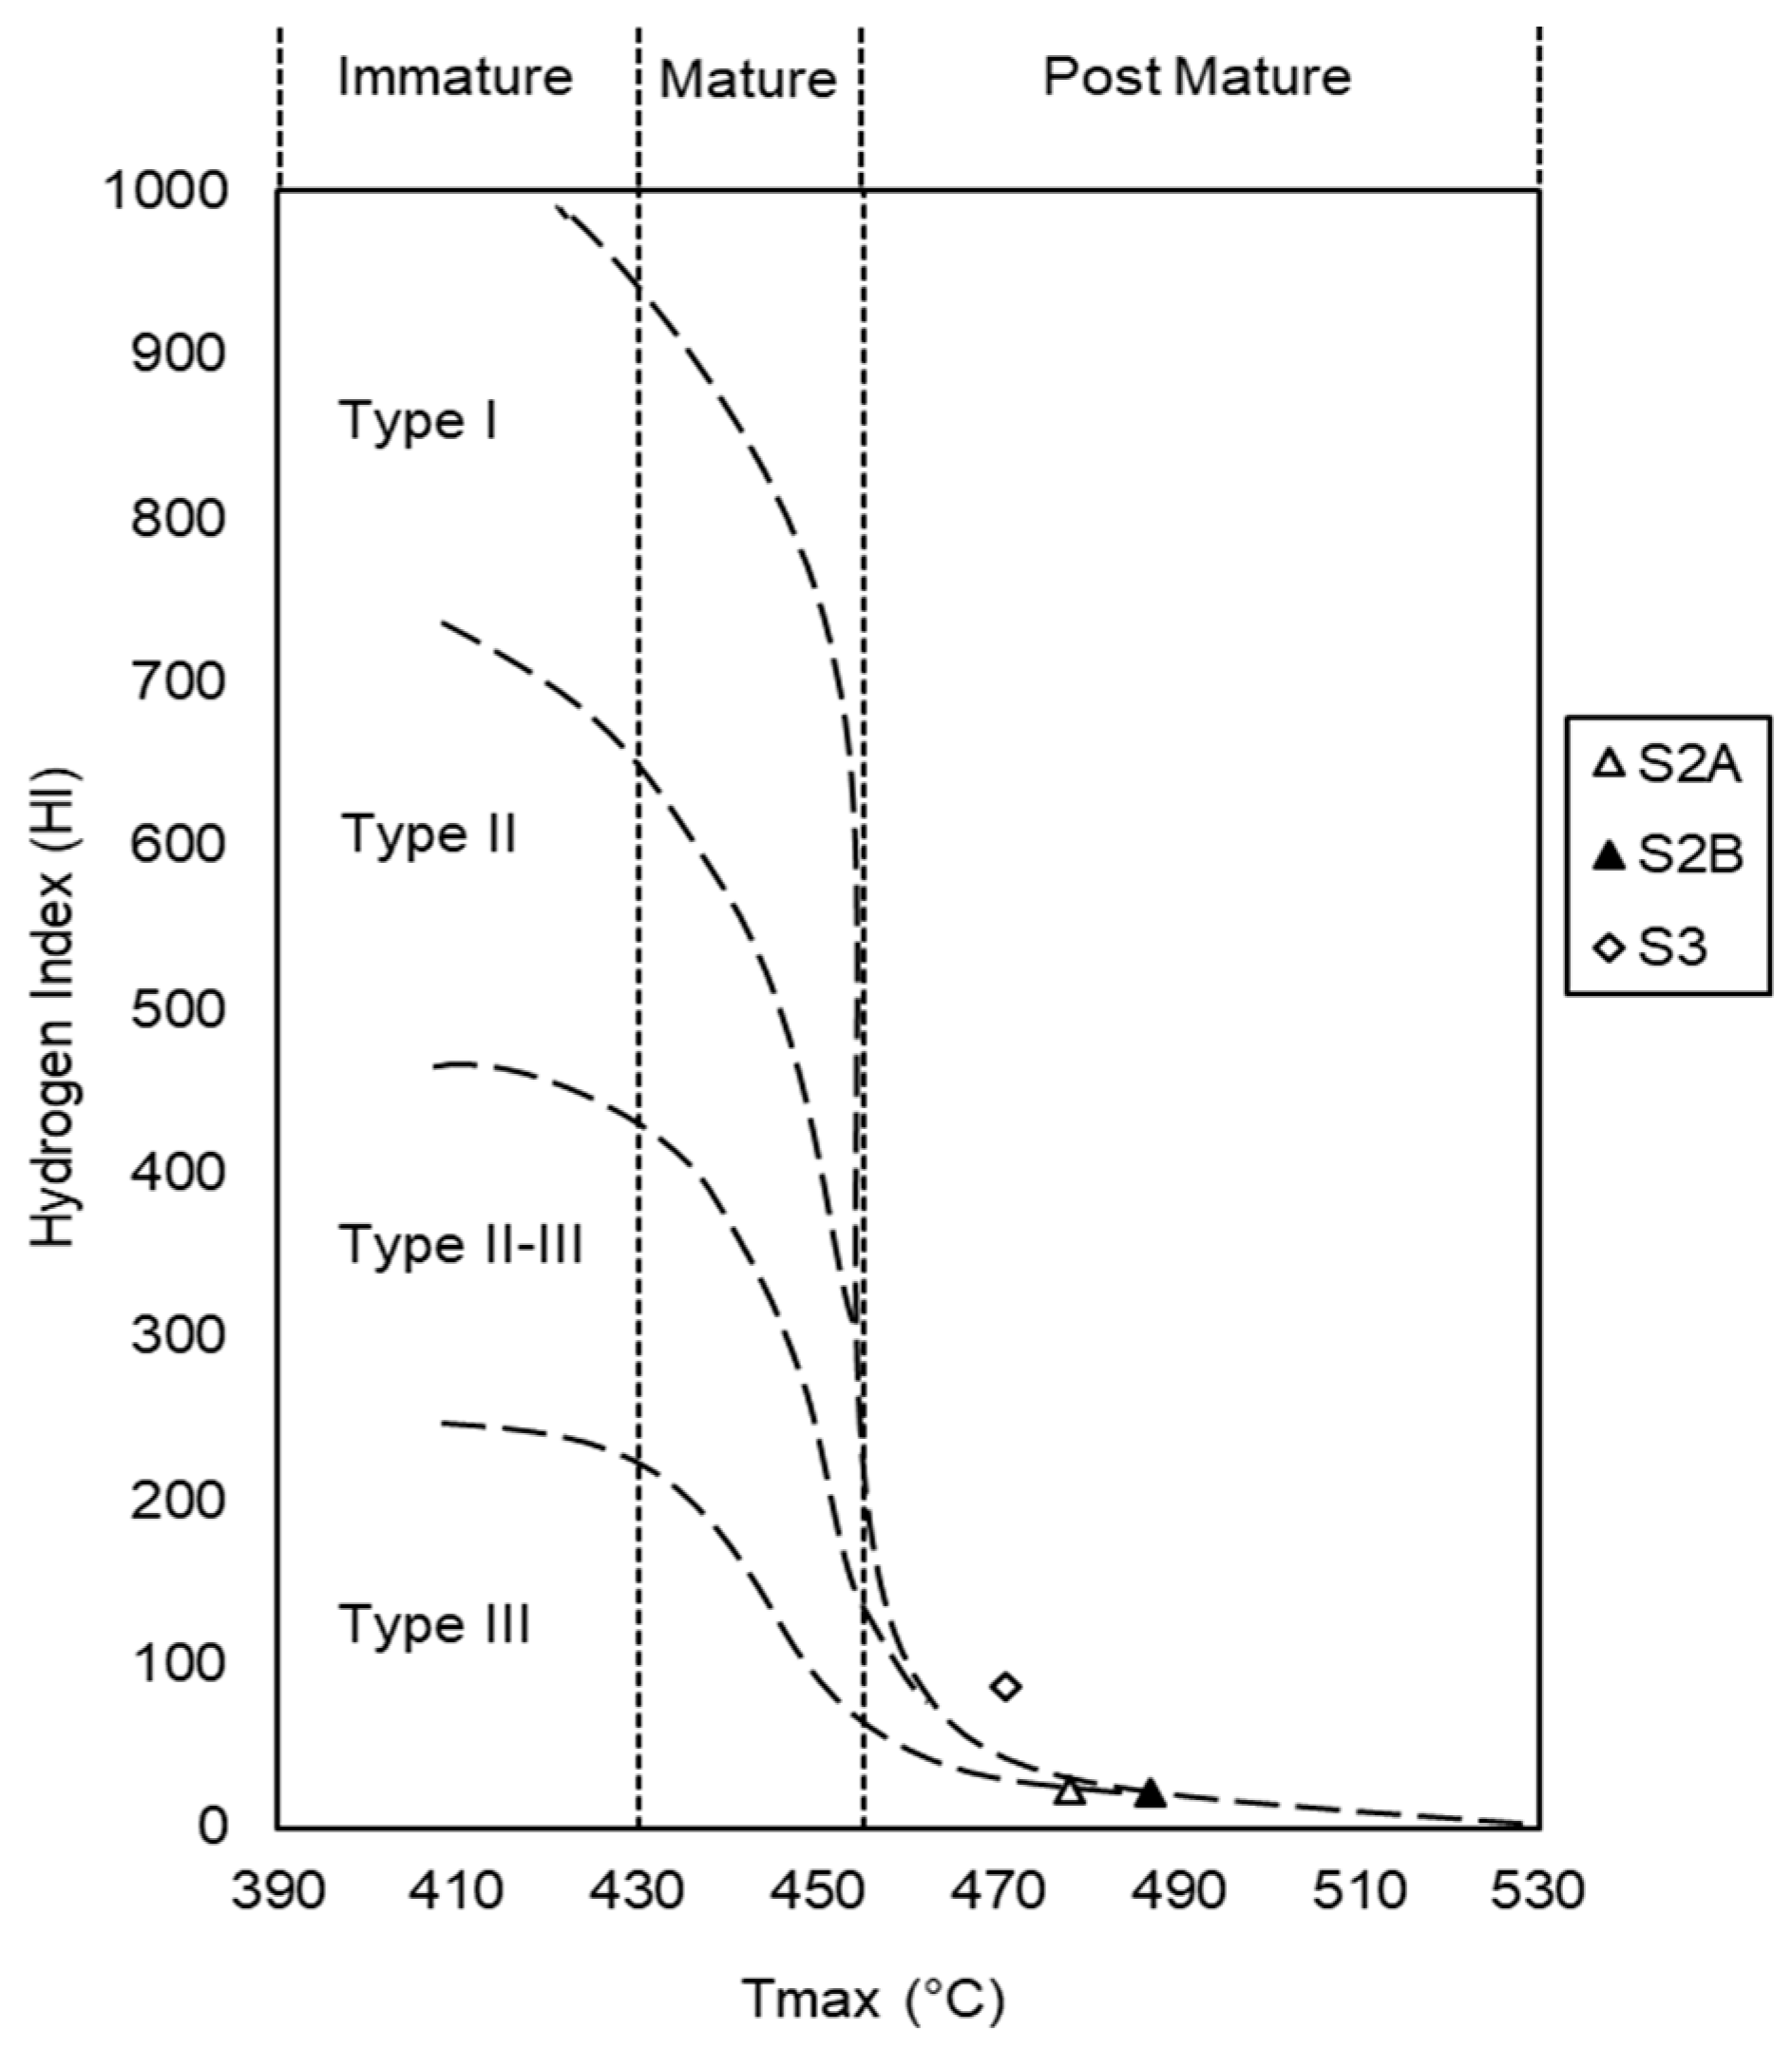
Figure 3.
Graph S2-TOC. Source: own elaboration.
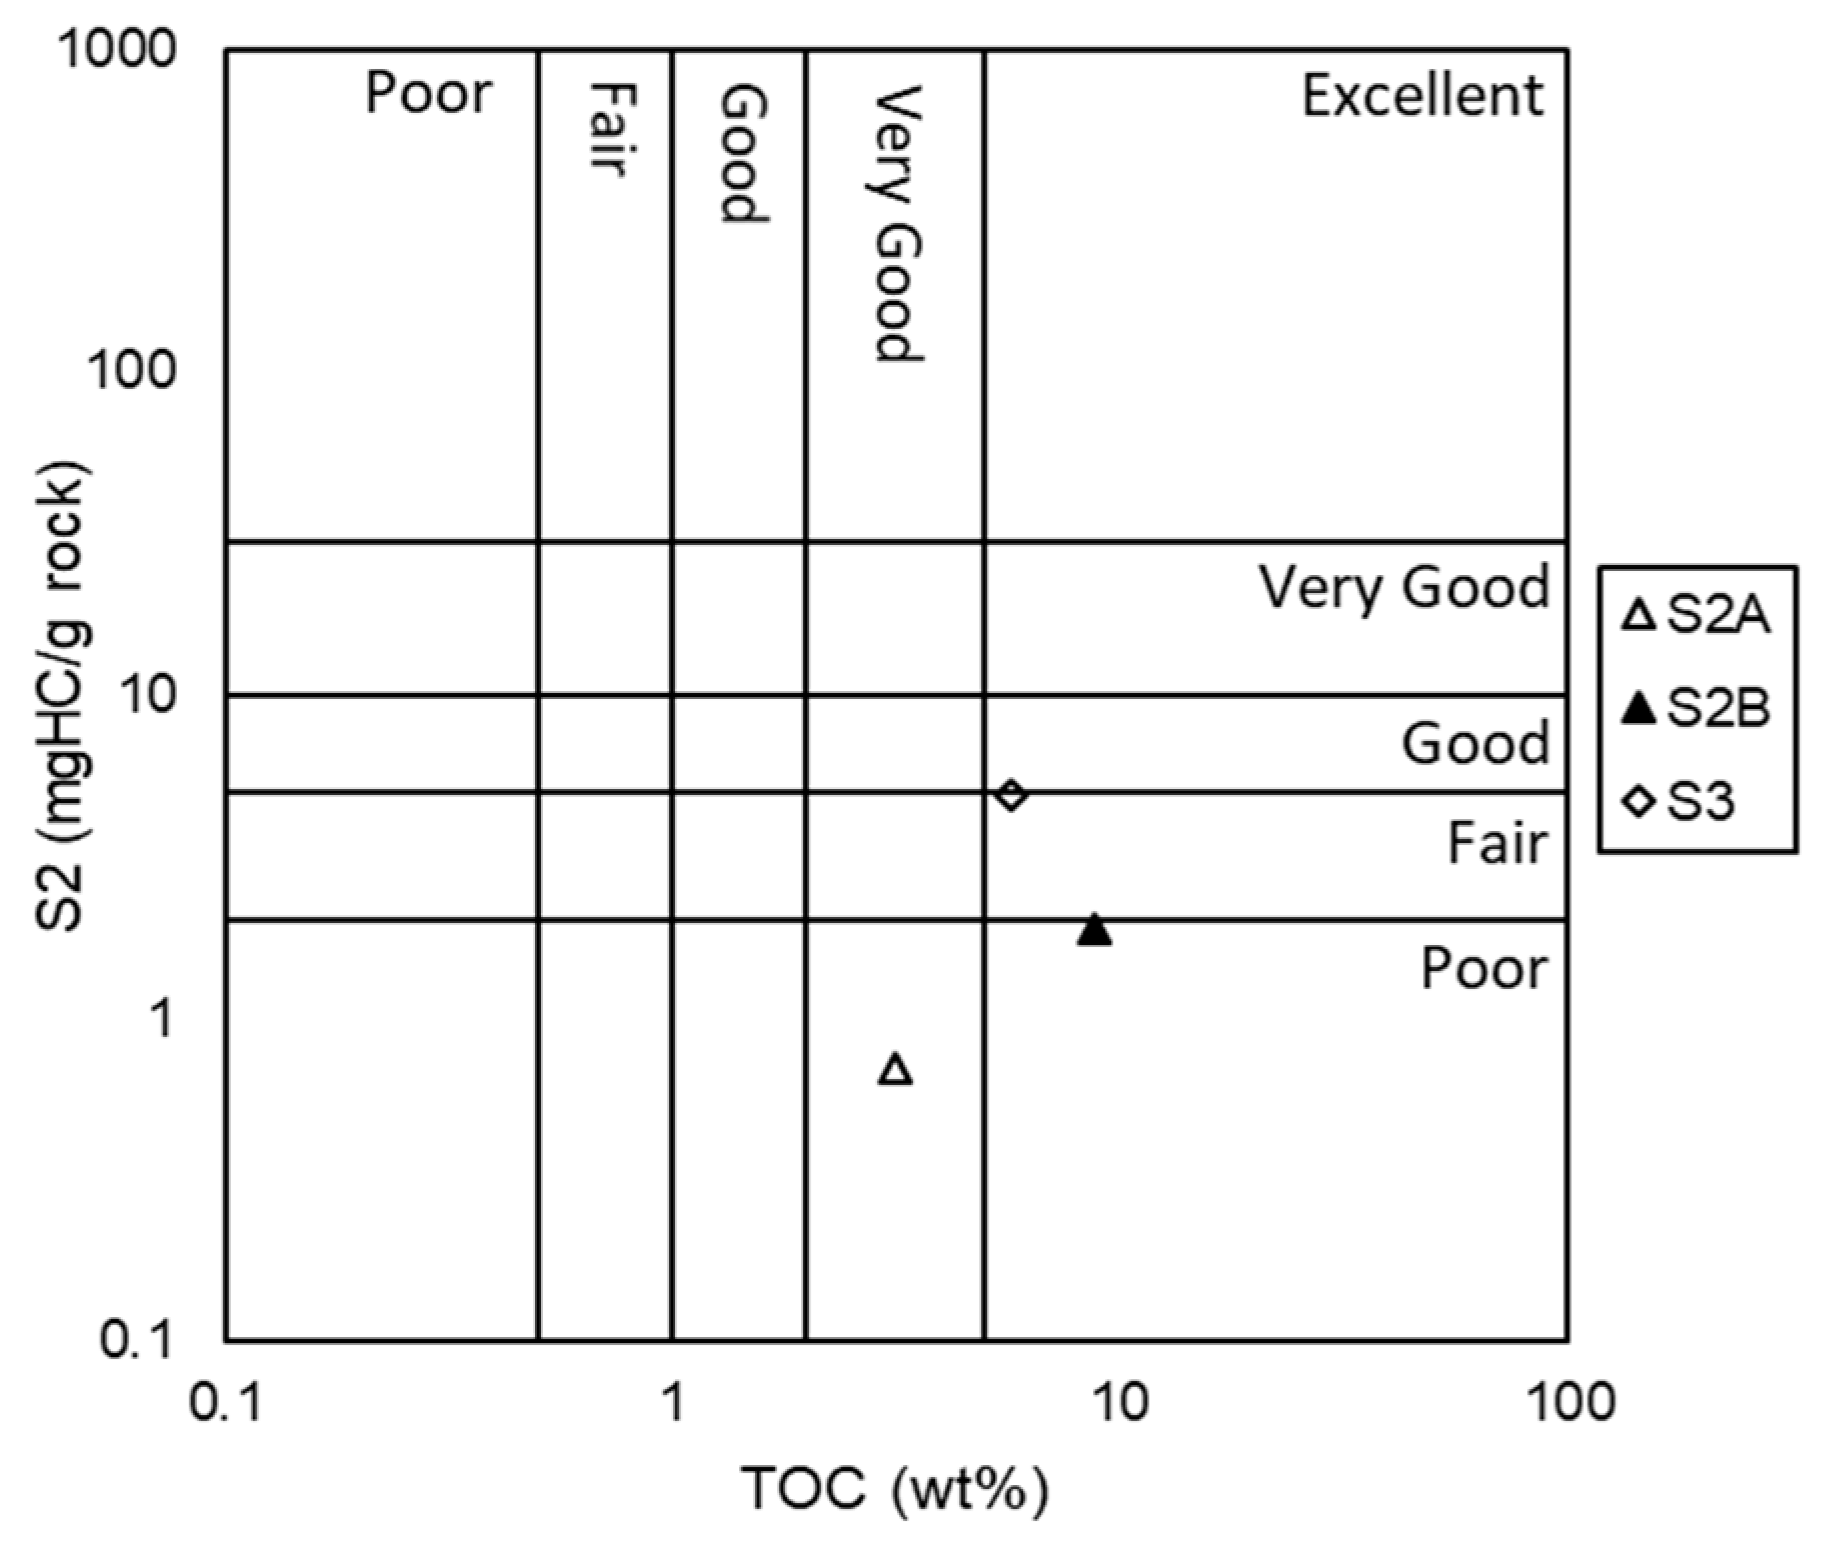
Figure 4.
CO2 adsorption capacity at 50°C. Source: own elaboration.
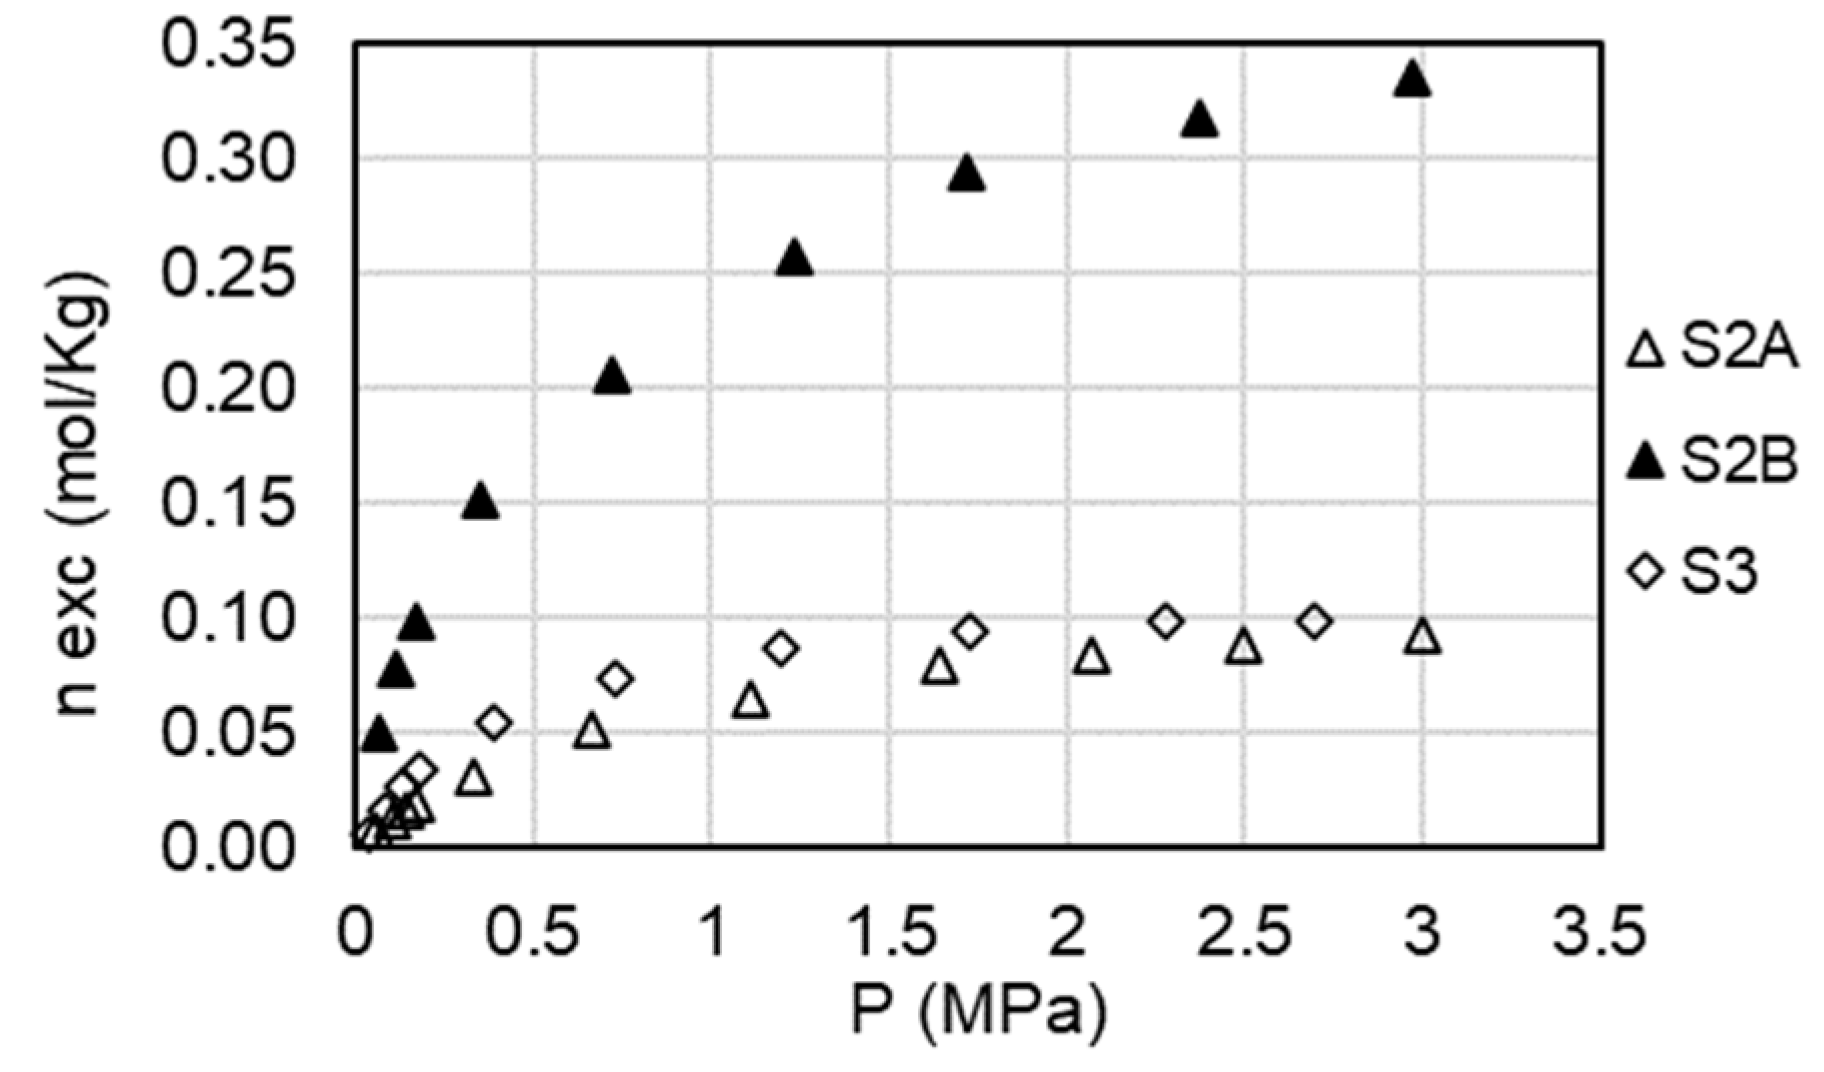
Figure 5.
Influence of mineralogical composition. Source: Own elaboration.
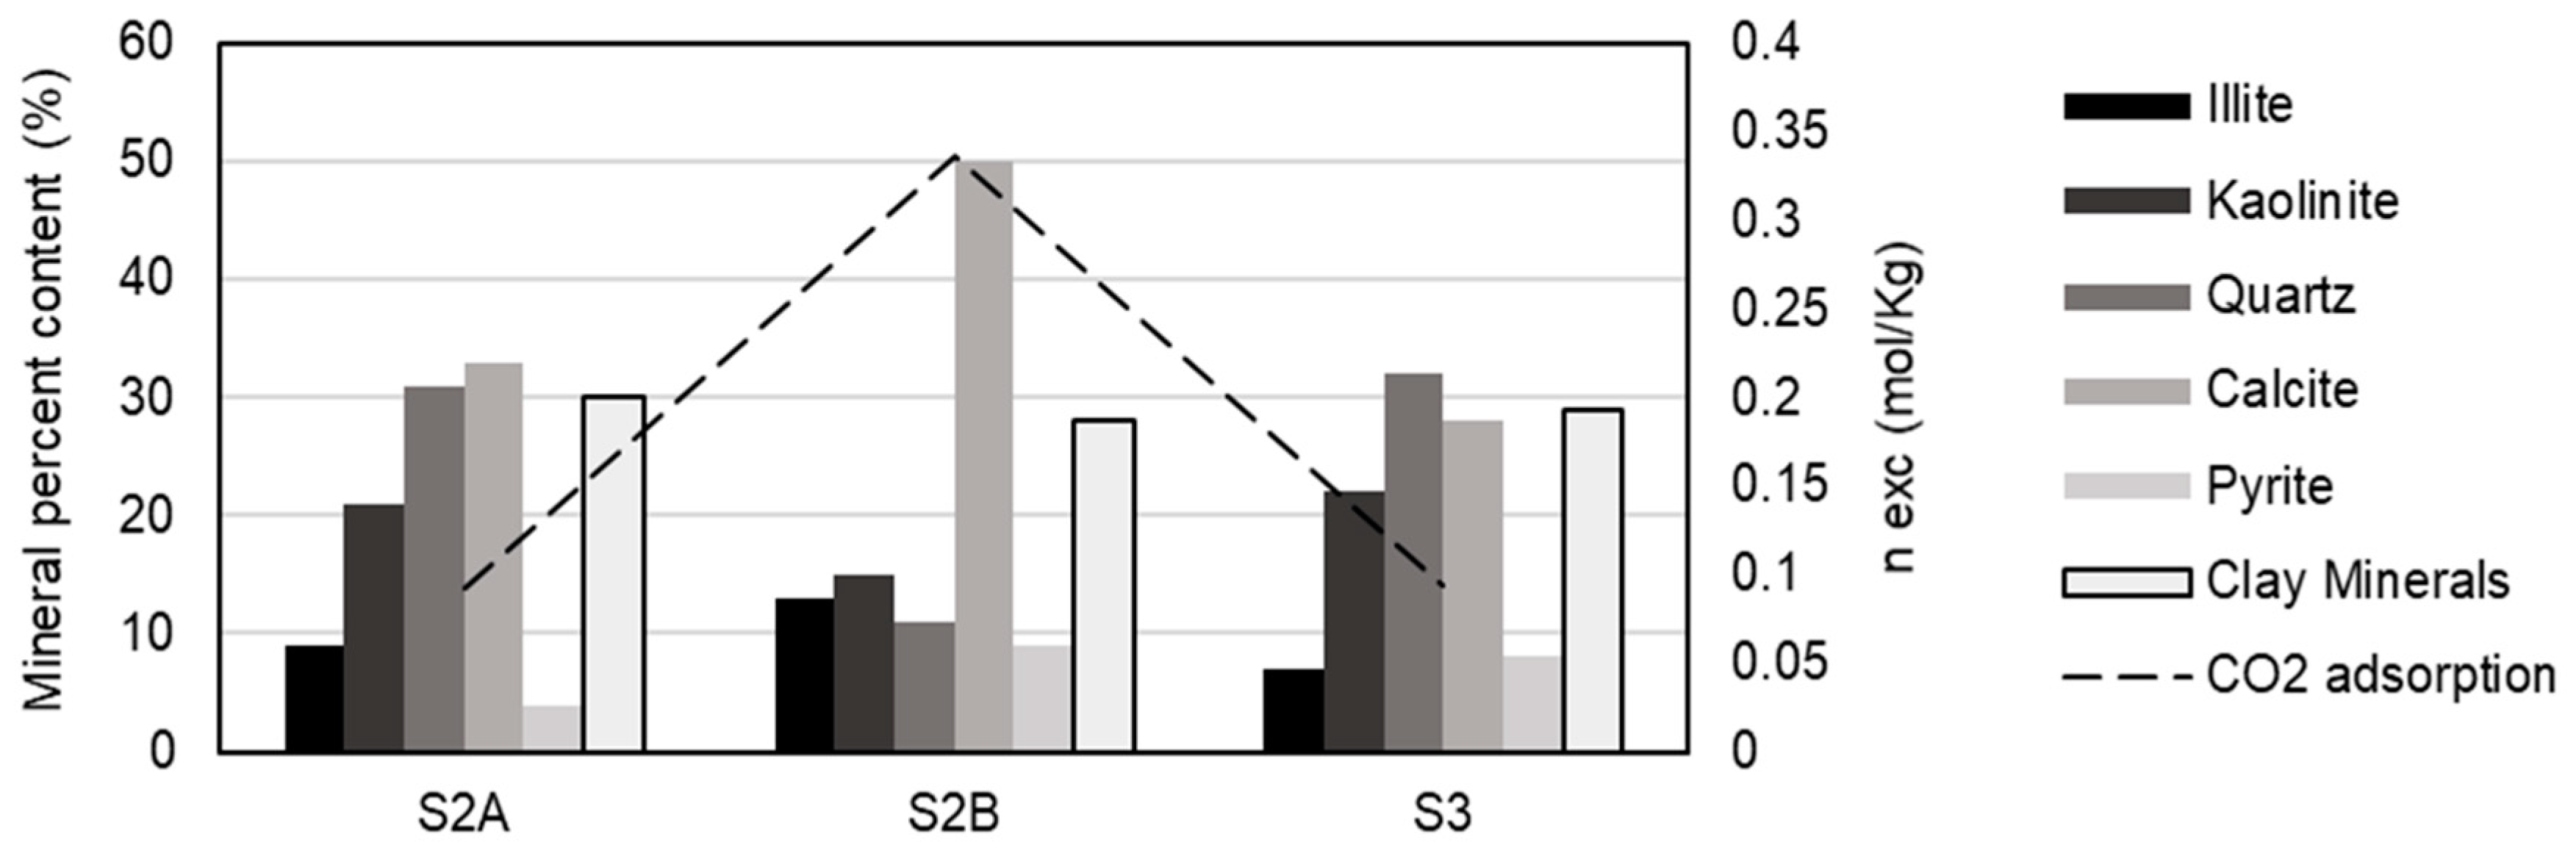
Figure 6.
CO2 adsorption capacity2 as a function of TOC at (a) 0.1 MPa, (b) 0.3 MPa, (c) 1 MPa and (d) 3 MPa. Source: Own elaboration.
Figure 6.
CO2 adsorption capacity2 as a function of TOC at (a) 0.1 MPa, (b) 0.3 MPa, (c) 1 MPa and (d) 3 MPa. Source: Own elaboration.
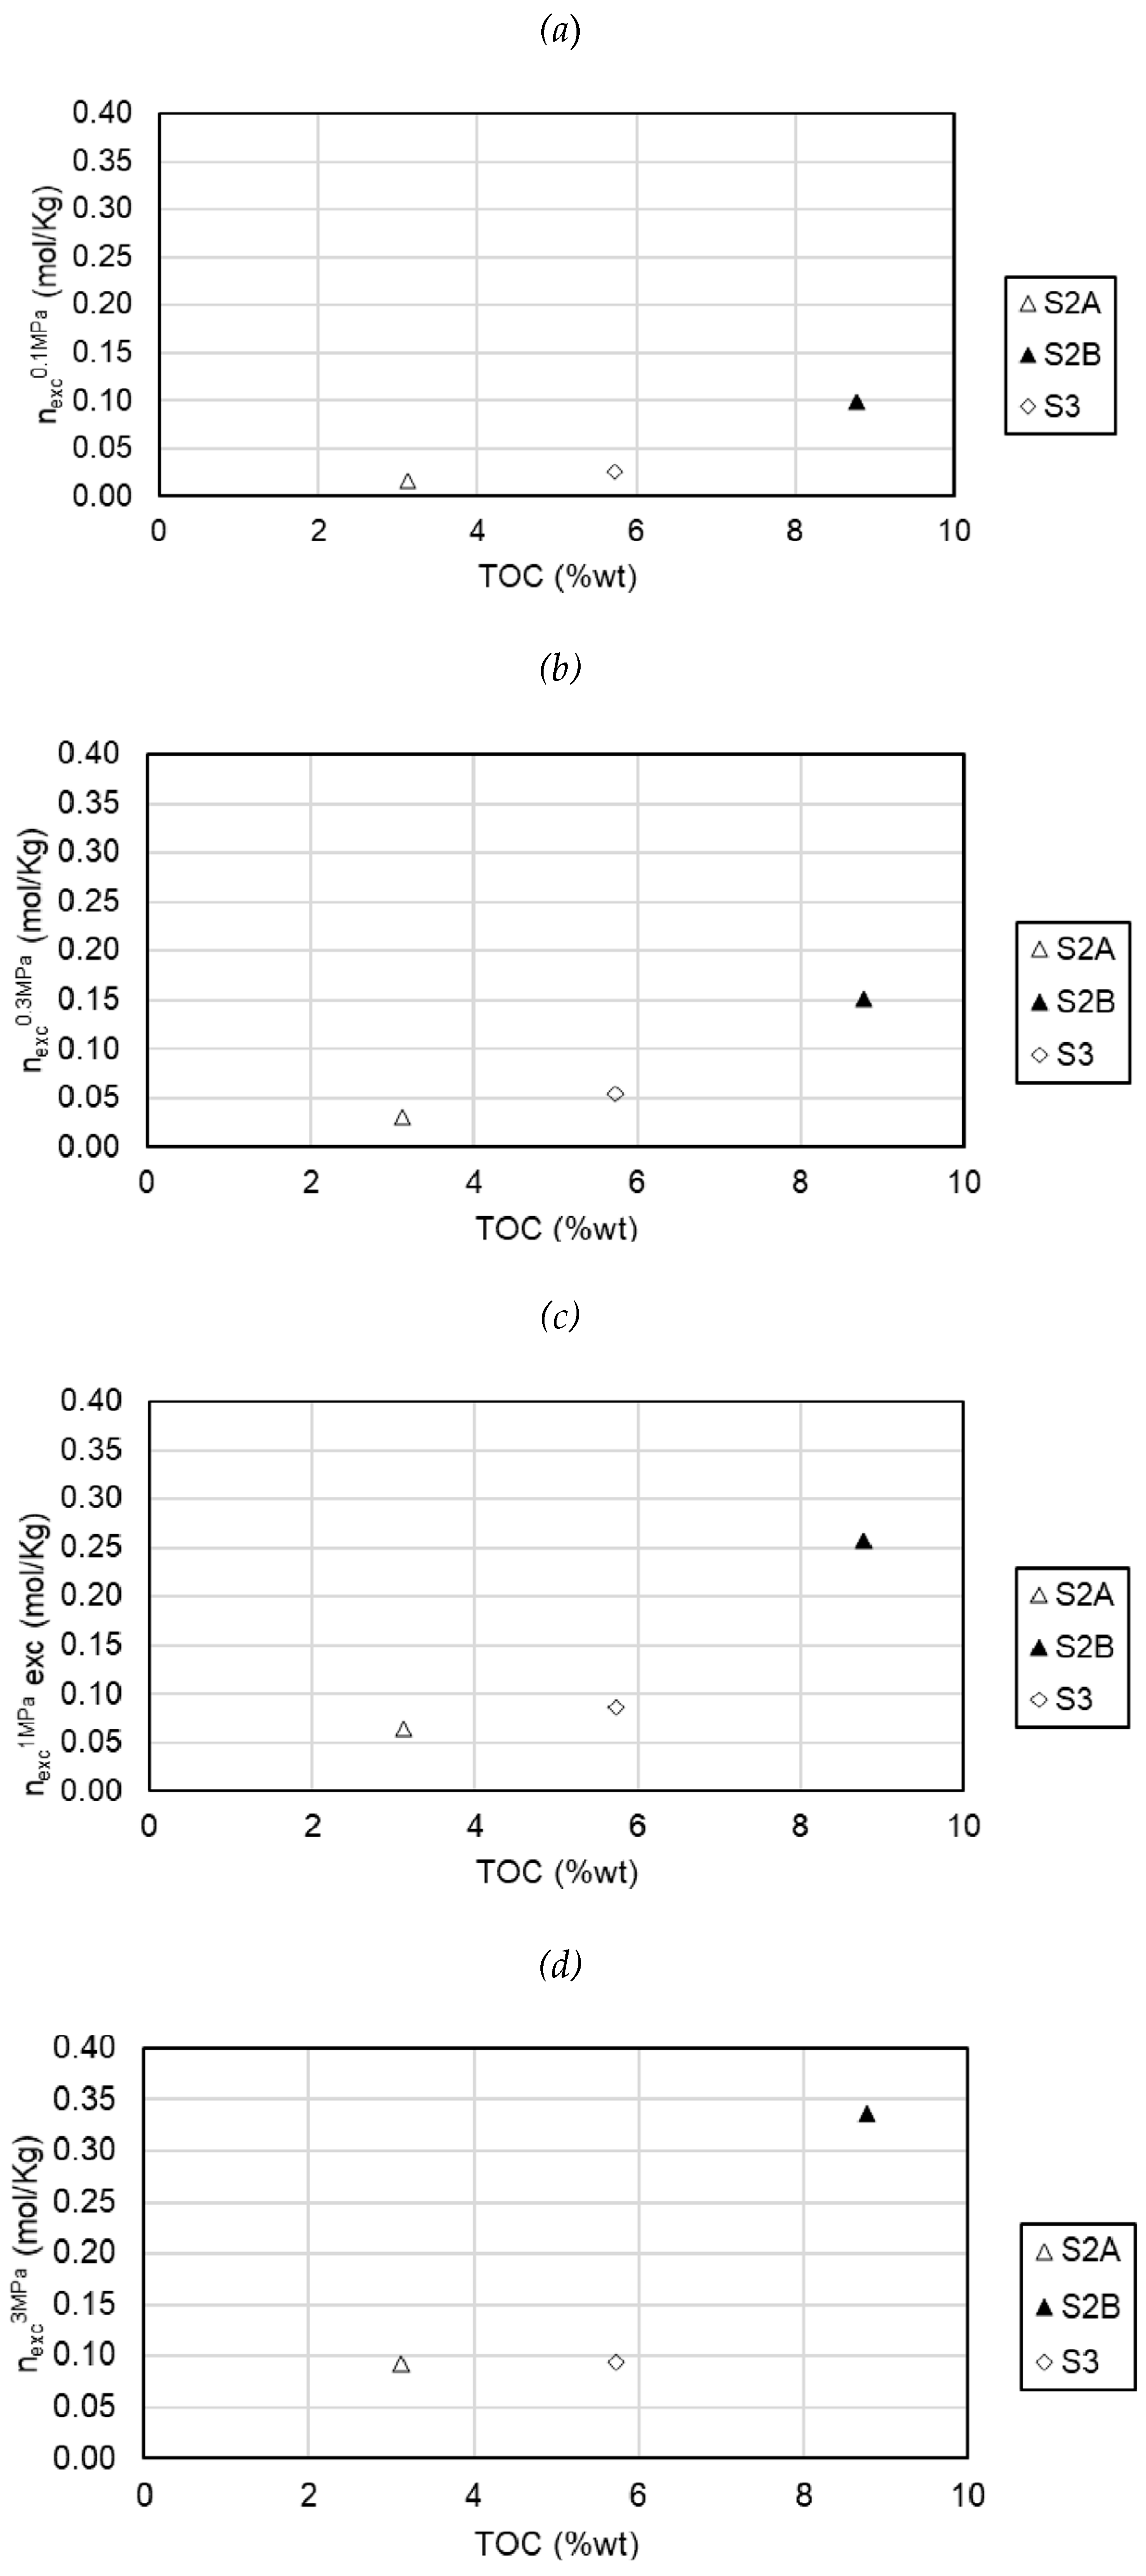
Figure 7.
CO2 adsorption capacity as a function of Tmax (maturity) at (a) 0.3 MPa and (b) 3 MPa. Source: Own.
Figure 7.
CO2 adsorption capacity as a function of Tmax (maturity) at (a) 0.3 MPa and (b) 3 MPa. Source: Own.
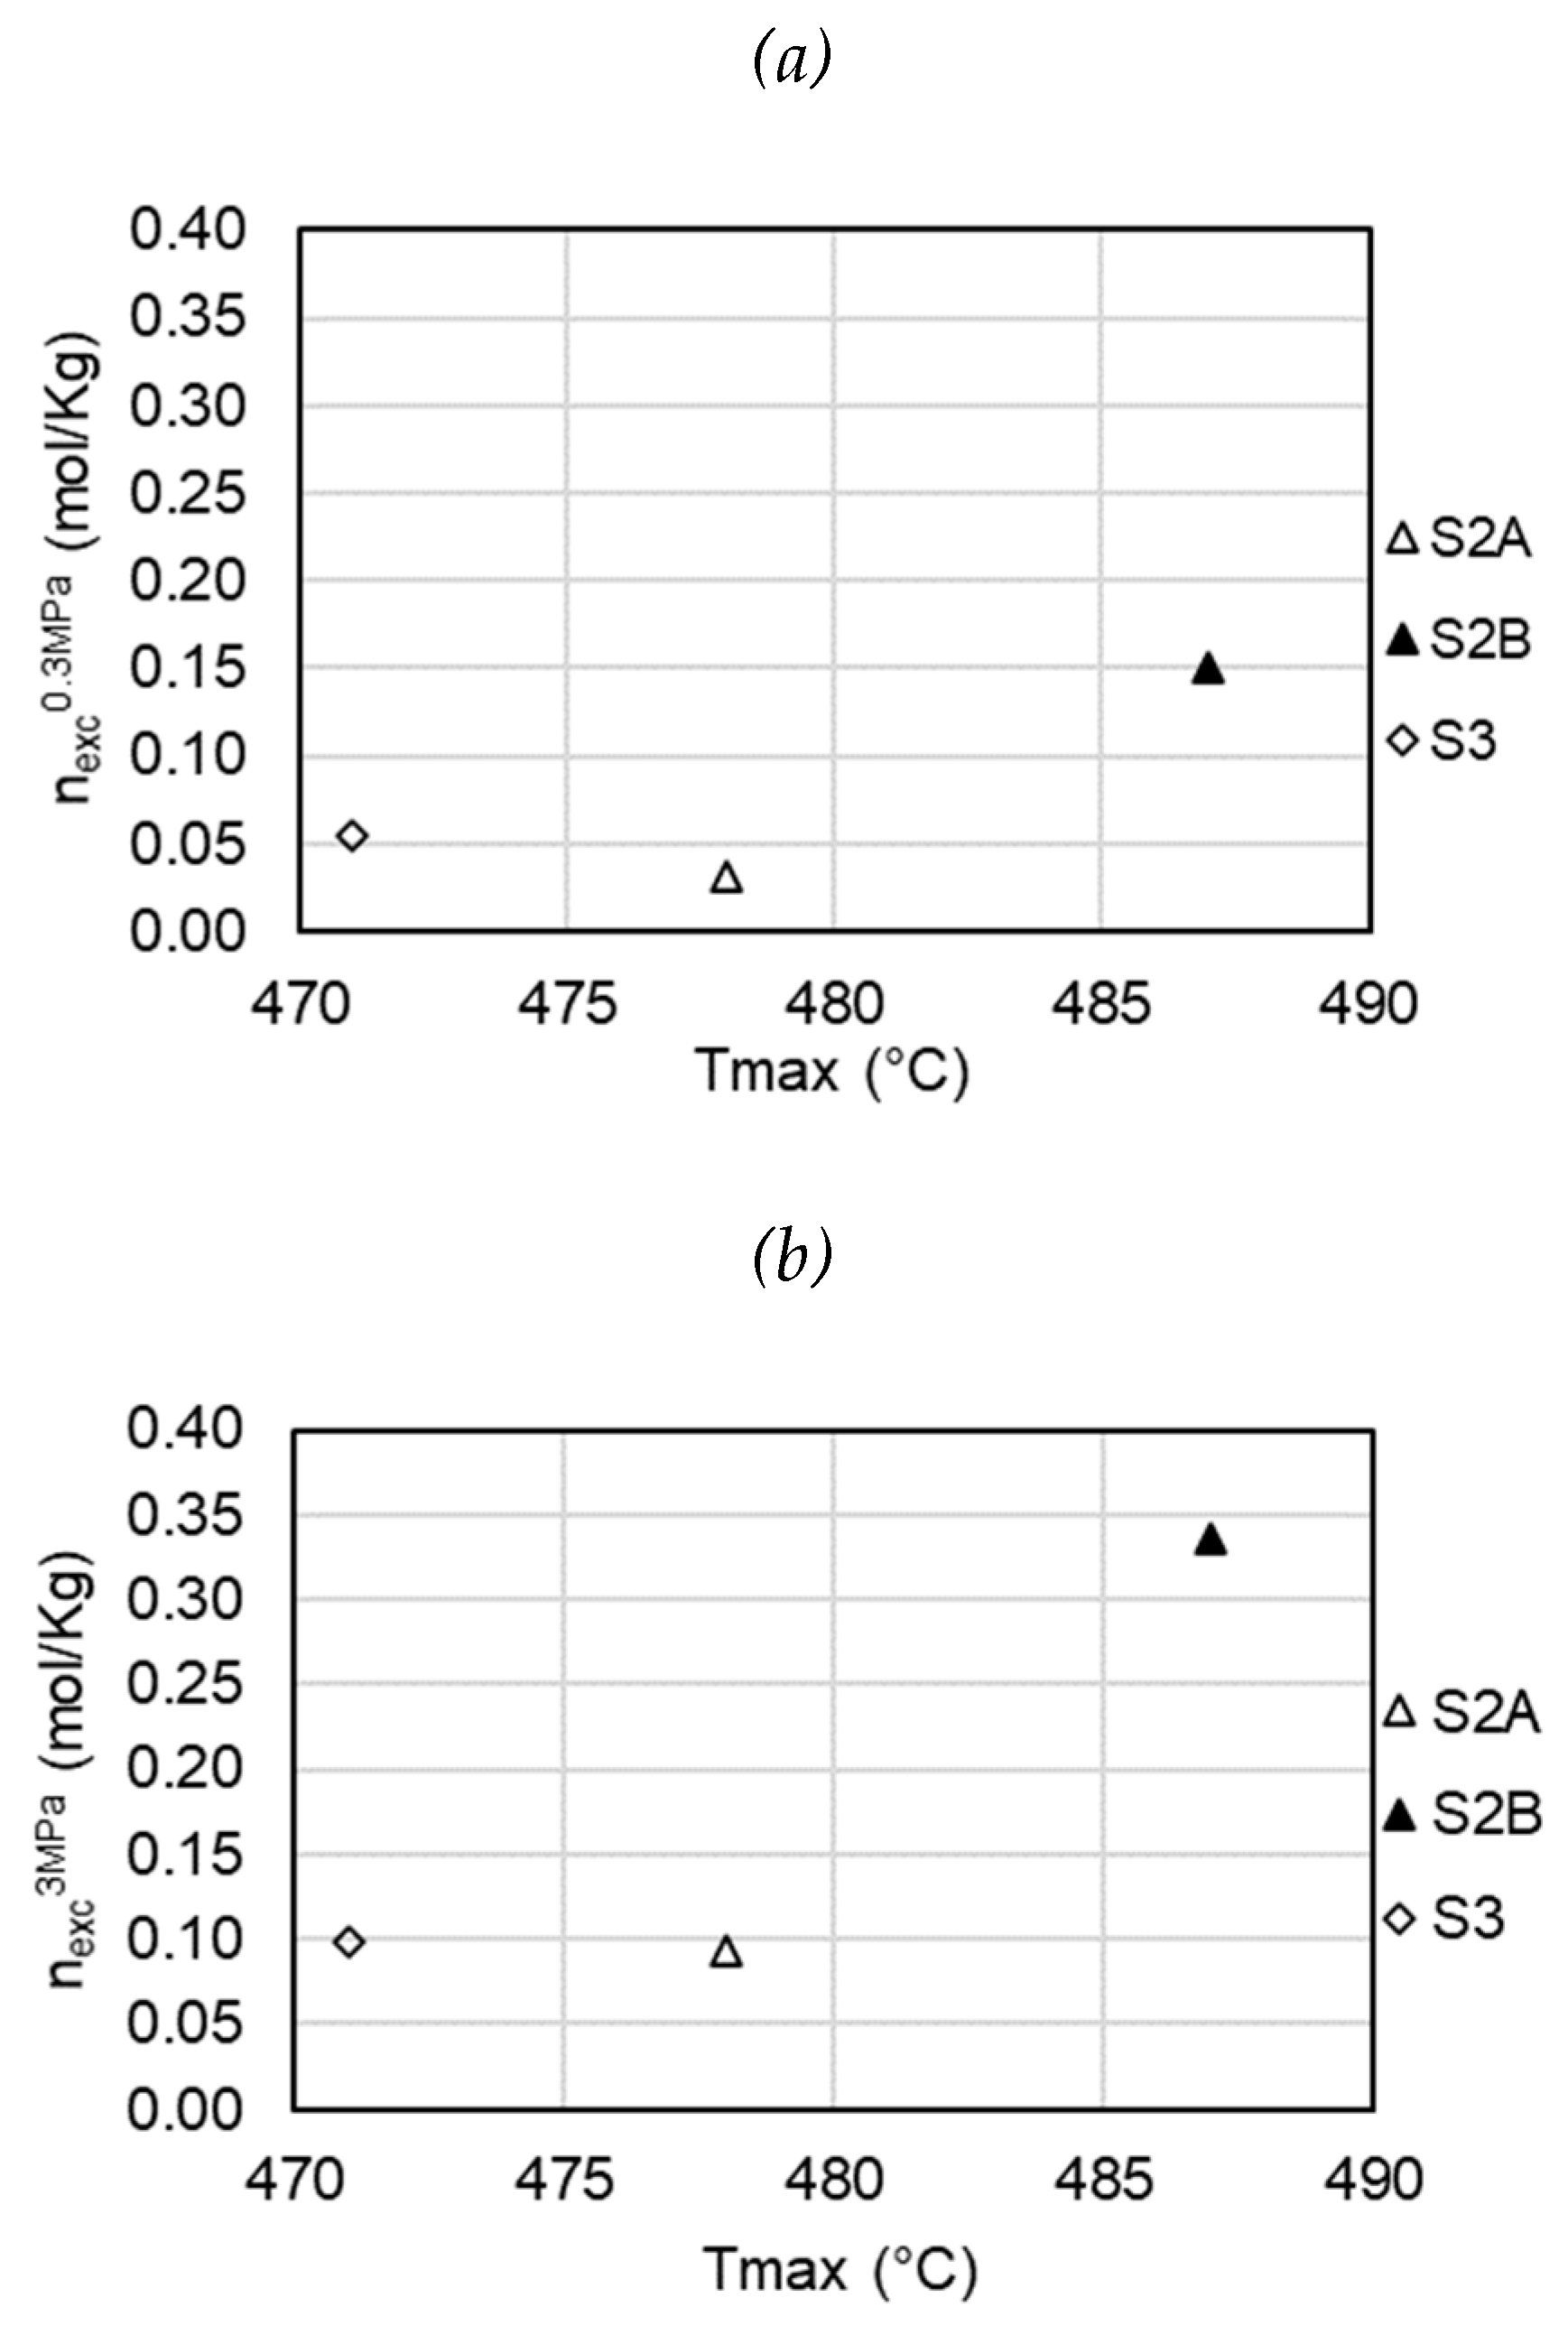

Table 1.
Rock-Eval analysis.
| Sample | TOC (% Wt) | Tmax (°C) | S1 | S2 | S3 | HI | OI | PI | |
|---|---|---|---|---|---|---|---|---|---|
| S2A | 3.12 | 478 | 0.35 | 0.70 | 0.18 | 22 | 5.76 | 0.33 | |
| S2B | 8.78 | 487 | 0.39 | 1.90 | 0.42 | 22 | 4.79 | 0.17 | |
| S3 | 5.73 | 471 | 2.47 | 4.96 | 0.25 | 87 | 4.37 | 0.33 |
Source: Ortiz et al. [23].
Table 2.
Mineralogical analysis of the samples.
| Sample | Illite (%) | Kaolinite (%) | Quartz (%) | Calcite (%) | Pyrite (%) | Gypsum (%) | Apatite (%) | |
|---|---|---|---|---|---|---|---|---|
| S2A | 9 | 21 | 31 | 33 | 4 | Id | <2 | |
| S2B | 13 | 15 | 11 | 50 | 9 | Id | <2 | |
| S3 | 7 | 22 | 32 | 28 | 8 | Id | <2 |
Source: Ortiz et al. [23].
Table 3.
Langmuir Model Fitting Parameters
| Sample | (mol/kg) | (MPa) | ||
|---|---|---|---|---|
| S2A | 0.1320 | 1.0489 | 0.00024 | |
| S2B | 0.4135 | 0.6106 | 0.00333 | |
| S3 | 0.1249 | 0.5034 | 0.00037 |
Disclaimer/Publisher’s Note: The statements, opinions and data contained in all publications are solely those of the individual author(s) and contributor(s) and not of MDPI and/or the editor(s). MDPI and/or the editor(s) disclaim responsibility for any injury to people or property resulting from any ideas, methods, instructions or products referred to in the content. |
© 2024 by the authors. Licensee MDPI, Basel, Switzerland. This article is an open access article distributed under the terms and conditions of the Creative Commons Attribution (CC BY) license (http://creativecommons.org/licenses/by/4.0/).
Copyright: This open access article is published under a Creative Commons CC BY 4.0 license, which permit the free download, distribution, and reuse, provided that the author and preprint are cited in any reuse.


