
Submitted:
28 April 2025
Posted:
07 May 2025
You are already at the latest version
Abstract
This work presents an experimental study of CH₄ and CO₂ adsorption behavior on two shale rock samples from ANH-Cañaboba1 Well in the Cesar-Ranchería Basin, Colombia. Gas adsorption and desorption experiments were conducted at 50°C and 80°C across a broad pressure range (0,1 – 3 MPa) using a high-pressure manometric system. The resulting isotherms were satisfactorily fitted to the Langmuir model. Results indicate higher adsorption capacity for CO₂ at both temperatures. Notably, no hysteresis was observed, suggesting reversible physisorption dominated by accessible mesopores which the typical behavior observed in shales samples. The results highlight the key role of organic matter in gas storage and underscore the formation’s potential for CO₂ sequestration and enhanced gas recovery. This study provides an improved understanding of evaluating gas-in-place and potential for long-term gas storage and provides an experimental framework and valuable data for future research and field applications related to gas behavior in porous media.
Keywords:
desorption
; carbon dioxide
; methane
; adsorption reversibility
1. Introduction
The increasing global emphasis on energy sustainability and greenhouse gas mitigation has intensified research into the behavior of gases within subsurface formations. Methane (CH₄) and carbon dioxide (CO₂) are two key gases in this context, relevant both as energy sources and as candidates for geological storage. Understanding their desorption behavior in reservoir rocks is essential to improving recovery processes and evaluating storage potential [1,2].
The organic fraction in shales constitutes a key control on gas storage capacity, as typically evidenced by positive correlations between total organic carbon (TOC) content and the amount of sorbed gas. In source rocks that have reached sufficient thermal maturity to generate hydrocarbons, kerogen generally accounts for no more than approximately 5% of the total rock mass. Nevertheless, it is within the kerogen nodules, embedded and disseminated in the mineral matrix, where the majority of the gas in place (GIP) is stored due to adsorption [3,6].
While adsorption mechanisms have been widely investigated, especially in the context of shale gas and coal seam reservoirs, the study of gas desorption—particularly under controlled laboratory conditions using pure components—remains comparatively limited [7,8,9]. Desorption dynamics directly influence gas recovery efficiency and seems to be governed pore structure, mineral composition and physicochemical interactions at the rock–gas interface [10,11,12]. These interactions vary widely depending on the lithology and diagenetic history of the reservoir rock. Mineralogical composition, in particular, has been shown to exert an al influence on gas–solid interactions. Clay minerals, quartz, and carbonates exhibit distinct affinities for CO₂ and CH₄ due to differences in surface energy and porosity development [13,14]. Studies using X-ray diffraction (XRD) and Brunauer–Emmett–Teller (BET) surface area analysis have provided insight into how these mineral phases contribute to adsorption and desorption capacities [15,16,17]. However, comprehensive experimental investigations linking mineralogy and desorption kinetics under reservoir-like conditions are still scarce.
Recent research also points to the higher affinity of CO₂ for reservoir rocks compared to CH₄, resulting in stronger retention and slower desorption rates [18,19]. This differential behavior is often attributed to CO₂'s quadrupole moment and greater polarizability, which enhance its interaction with mineral surfaces [20]. However, much of this understanding arises from theoretical or mixed-gas modeling studies, which may obscure the intrinsic behavior of each gas species under pure-component conditions [21].
Additionally, reservoir heterogeneities, such as variations in pore size distribution and surface chemistry, significantly alter desorption characteristics. Gas release is typically delayed in microporous or mineralogically complex systems, underscoring the need for integrated approaches that include both structural and chemical analysis of the rock matrix [22,23,24]. Geochemical parameters, such as total organic carbon (TOC), maturity, and mineralogical maturity, further complicate gas retention and mobility, and require systematic characterization to elucidate their effects.
In this study, we present an experimental investigation of CO₂ and CH₄ adsorption-desorption from reservoir rocks obtained from ANH-Cañaboba1 Well, used here as a case study. A multidisciplinary methodology was adopted, incorporating gas desorption experiments under controlled conditions with pure gases, surface area characterization via BET, mineralogical profiling using XRD, and complementary geochemical analysis. This approach enables a detailed understanding of the parameters influencing gas retention and release, free from the confounding effects of gas mixtures or modeling assumptions.
This work provides a comprehensive dataset on gas-shale interactions in the Cesar-Ranchería Basin, bridging laboratory insights with practical applications for energy and environmental issues.
2. Materials and Methods
In this study two core samples (S1 and S2) were used for obtain original experimental data for CH4 and CO2 adsorption/desorption, from the ANH-Cañaboba1 well located in Cesar-Ranchería Basin (CRB).
CRB is located in northeastern Colombia, in the southern part of the department of La Guajira and northeastern portion of department of Cesar. The basin is bounded to the northwest by the pre-Cretaceous rocks of the Sierra Nevada de Santa Marta; to the north by the Oca Fault; to the southeast by the pre-Cretaceous rocks of the Serranía de Perijá; and to the southwest by the Bucaramanga Fault (Figure 1), its extension being approximately 11,668 km2. It forms part of the northern Andean foreland system and has undergone a multi-phase tectonic evolution, beginning with Mesozoic extensional events followed by significant compressional deformation during the Andean orogeny [25,26,27].
Geologically, the CRB is subdivided into the Cesar Sub-Basin to the south and the Ranchería Sub-Basin to the north. Its stratigraphic succession spans from the Paleozoic to the Cenozoic, with sedimentary deposits characterized by marine and continental clastics. The Upper Cretaceous and Paleogene units are of particular interest due to their organic-rich shales and coal-bearing sequences, which present favorable conditions for both conventional and unconventional hydrocarbon systems [28,29,30].
The basin's structural configuration is defined by a series of thrusts and strike-slip faults, which have compartmentalized the basin into localized depocenters. These features, combined with variable thermal histories and burial depths, have created heterogeneous conditions for gas generation, migration, and retention [31,32]. Furthermore, the CRB has been recognized as one of Colombia’s most promising areas for coalbed methane and CO₂ storage projects due to its extensive coal seams and gas-prone shales [33,34].
2.1. Sample Characterization
2.1.1. Geochemical Analysis
In this study, geochemical properties were obtained in the Petroleum Geochemical Laboratory at Universidad Industrial de Santander. We determine the content of volatile hydrocarbons (S1), expressed as mg HC/g rock, the generative potential of remaining hydrocarbons (S2), expressed as mg HC/g rock, the content of volatile carbon dioxide (S3), expressed as mg CO2/g rock, the maximum pyrolysis performance temperature (Tmax), expressed as °C, the total organic carbon (TOC) expressed as percentage by weight and vitrinite reflectance (Ro) expressed as percentage of the crushed shale core samples. Other parameters such as hydrogen index (HI), oxygen index (OI), production index (PI) and genetic potential (PG) were also calculated. The most significative measurements are plotted in Table 1.
2.1.2. X-Ray Diffraction (XRD)
X-ray diffraction (XRD) is a basic tool in the mineralogical analysis of source rocks. X-ray powder diffraction permits to identify and quantify minerals present in a clay-rich rock. The XRD analysis was carried out using a Bruker D8 Advance equipment with Cu Kα1 radiation (40 kV, 40 mA) in the angular range of 2°–70° (2θ) in the DRX Laboratory of Universidad Industrial de Santander. The measured parameters are shown in Table 2.
2.1.3. BET Specific Surface Area
The specific surface area was determined using the Brunauer-Emmett-Teller (BET) method. Samples were weighed in 9 mm diameter borosilicate glass cells (Micromeritics) and degassed at 100 °C and 6 Pa for 8 h using a Micromeritics Vac Prep 061 system. Nitrogen adsorption isotherms were measured at 77 K (-196 °C) in a Micromeritics 3FLEX™ surface characterization analyzer, within a relative pressure (P/P0) range of 0.0025 - 0.9999. Data acquisition and analysis were carried out using the 3FLEX V.4.03 software package provided by the manufacturer. Measurements were conducted at the CICAT Laboratory of Universidad Industrial de Santander. The BET surface area values obtained were 20 m2/g for sample S1 and 40 m2/g for sample S2.
The measured specific surface areas are consistent with values typically reported for organic-rich shales, where BET surface areas generally range from 2 to 100 m²/g, depending on the organic content, mineralogy, and thermal maturity of the samples [36,37]. Comparative studies have shown that shales from formations such as the Barnett Shale (USA) exhibit surface areas between 10 and 50 m²/g [38], while the Marcellus Shale (USA) reports slightly broader ranges, from 20 to 80 m²/g [39]. The microporous structure of kerogen is recognized as the dominant contributor to the specific surface area in shales, particularly in samples with high total organic carbon (TOC) content [40,41]. Kerogen hosts extensive microporosity developed during early stages of thermal evolution, providing abundant surface area for gas adsorption processes [42]. Moreover, the contribution of mineral phases, such as clays and pyrite, is often secondary compared to the effect of the organic fraction [43]. The observed BET values in this study thus highlight the significant role of kerogen microporosity in gas storage capacity.
2.2. Adsorption Experiments
2.2.1. Experimental Set Up
To quantify gas adsorption uptake onto the rock matrix, adsorption isotherms were determined using a manometric set-up, which uses the principle of mass balance [44, 45]. The experimental apparatus consists of home made high-pressure manometric system, featuring two primary cells: a dosing cell (27.63 cm³) and a measurement cell (15.23 cm³), in which the sample is placed. A high-precision pressure transducer (MKS Baratron, model 121 A) is used to monitor pressure variations, offering an accuracy of 0.01% full scale within a range from vacuum up to 3.5 MPa.
To ensure experimental conditions, the entire system is maintained at a constant temperature using a PID controller (Eurotherm 3208), which operates in conjunction with thermocouples located on each cell. The setup includes three two-way valves to isolate the dosing and adsorption chambers during the experimental cycle. This configuration supports a wide range of pressures (0–3.5 MPa) and temperatures (30°C –150 °C).
2.2.2. Experimental Procedure
Gas uptake is quantified by measuring the pressure drop in a known volume of gas in contact with the sample. The measurement process involves the successive transfer of gas doses from the reference (dosing) cell to the measurement cell containing the studied sample under isothermal conditions. The excess amount of gas adsorbed is determined using the following relationship:
where ntotal is the number of moles originally in the dosing cell and nfree is the number of moles in the free phase at equilibrium.
The procedure comprises the following steps: (1) the adsorbent material is precisely weighed before its introduction into the measurement cell. (2) The sample is previously desorbed under vacuum at 100 °C for approximately 24 hours to remove moisture. (3) The accessible pore volume is determined by helium expansion, as helium exhibits negligible adsorption. This volume is considered constant within the studied pressure range (0–3 MPa). (4) Additional drying is carried out for 8 to 10 hours (5) Once the accessible volume is known, an amount of gas (CO2 or CH4) is sent to the reference cell at known pressure and temperature. Subsequently, this volume of gas (Vd) is taken to the measurement cell (Vm), which contains the sample under isothermal conditions. When adsorption equilibrium is reached, the amount of gas that was adsorbed can be calculated by the mass balance before and after adsorption. In this investigation, thermodynamic equilibrium was reached in a range of 45 to 60 min. The number of moles adsorbed, during the first step it can be calculated as follows:
This adsorbed amount is the first point of the adsorption isotherm. The other steps are calculated using a cumulative process, described as:
Each measurement is repeated twice. The claimed uncertainty is better than 3%.[46].
3. Results
3.1. Geochemical Data
The parameters obtained through the Rock-Eval analysis are presented in Table 1. The TOC contents of 4.94% and 5.8% suggest that the rock exhibit very good potential for hydrocarbon generation [47].
A source rock is defined as mature when it reaches the level of hydrocarbon generation. A rock that does not reach the level of hydrocarbon generation is defined as an immature source, and one that has passed the generation and expulsion time is considered an over-mature rock [48]. The parameter commonly used to monitor the maturity level is the temperature (Tmax); in this study, the Tmax value was 433°C for both S1 and S2. According to the Tmax-HI graph (Figure 2), the sample is in mature stage and corresponds to a Kerogen type II-III [49].
The geochemical characterization of the samples indicates a good to very good hydrocarbon generation potential based on TOC and S2 peak values. Sample S1 exhibits a TOC content of 4.94 wt% and a high S2 peak of 10.66 mg HC/g rock, suggesting excellent generative potential. In contrast, sample S2 has a slightly higher TOC of 5.18 wt% but a lower S2 peak of 6.7 mg HC/g rock, which still falls within the range of good hydrocarbon potential. according to the classification by Peters et al. [50].
The Production Index (PI), calculated as S1/(S1 + S2), represents the proportion of hydrocarbons already generated relative to the total hydrocarbon potential. In this study, both samples S1 and S2 exhibit a PI value of 0.01, indicating minimal transformation of organic matter. Tmax and PI values suggest that the samples are approaching the onset of hydrocarbon generation [50].
3.2. Ray Diffraction (XRD)
Using XRD, clay and non-clay minerals were identified; among the clay minerals, kaolinite-1A, Ferric Muscovite and Chlorite were obtained, and among the non-clay minerals quartz was predominant.
The XRD results (Table 2) indicate that the samples are primarily composed of clay minerals (58.16% in S1 and 57% in S2) and quartz (42.24% in S1 and 40.58% in S2), which are the dominant mineral phases
3.3. Adsorption-Desorption Measurements
In this section, original data from the CH₄ and CO₂ adsorption/desorption experiments are presented. The experiments were conducted at two temperatures (50 and 80 °C), with pressures up to 2 MPa for sample S1 and up to 3 MPa for sample S2. No additional pressure data were collected for S1, as saturation was reached. Each isotherm was repeated twice, and the results showed excellent reproducibility, with variations consistently below the stated measurement uncertainty. Excess adsorption as a function of pressure for S1 is shown in Figure 3, Figure 4, Figure 5 and Figure 6. A summary of all adsorption data for S1 is presented in Figure 7.
For sample S2, only adsorption data are reported; however, desorption experiments were also conducted. As with sample S1, no hysteresis was observed during the desorption process, indicating reversible adsorption behavior in both cases. A summary of adsorption data for S2 is presented in Figure 8.
Experimental adsorption data were correlated using the three-parameter Langmuir model described by Gensterblum et al. [51] and applied by Gasparik et al. [5], which is given as:
where is the adsorbed amount of gas (mol/kg) at pressure (MPa), is the Langmuir pressure (the pressure at which half of the Langmuir volume is adsorbed), is the amount adsorbed (mol/kg) when the monolayer is completely filled (Langmuir maximum capacity), is the gas density (kg/m3) to a and , and is the adsorbed phase density, which was assumed as a fixed value of 421 Kg/m3 for CH4. [52] And 1027 kg/m3 por CO2 [53].
The standard deviation was calculated according to Pozo et al. [39] as follows:
where N is the number of data points; is the experimental adsorption value; and is the setting value at each adsorption pressure. Table 3 shows the parameters of the Langmuir model for gas adsorption experimental data for sample S1, and Table 4 for S2. The fitting results indicates that the Langmuir model fits well.
4. Discussion
The adsorption and desorption behaviors observed in samples S1 and S2 reflect a complex interplay of geochemical and structural characteristics that influence gas storage and mobility in shale formations. Despite both samples exhibiting similar Tmax values (433 °C) and low Production Index (PI = 0.01), indicative of early thermal maturity, they differ in surface area, organic content, and adsorption capacity.
Sample S2, with a higher BET surface area (40 m²/g) compared to S1 (20 m²/g), demonstrated significantly greater adsorption capacity for both CH₄ and CO₂. At 50 °C, CO₂ adsorption in S2 reached 0.508 mol/kg (PL = 2.067 MPa), while CH₄ reached 0.462 mol/kg (PL = 6.231 MPa), in contrast to S1’s CO₂ and CH₄ capacities of 0.215 mol/kg and 0.125 mol/kg, respectively. This difference aligns with previous studies reporting a direct correlation between specific surface area and adsorption potential in organic-rich shales [3-6;54]. The Langmuir model effectively describes the adsorption isotherms obtained in this study, capturing the monolayer adsorption behavior of both gases across the examined temperature range. The model's applicability is further supported by its widespread use in characterizing gas adsorption in shale formations with similar mineralogical and organic compositions [55]. The Langmuir maximum adsorption capacities (nL) obtained in this work are consistent with previous studies conducted on organic-rich shales, where nL values for methane typically range from 0.1 to 1.2 mol/kg and for carbon dioxide from 0.2 to 2.0 mol/kg at similar temperature and pressure conditions [3, 36, 56].
Interestingly, despite the higher TOC in S2 (5.18 wt%) compared to S1 (4.94 wt%), its S2 peak (6.7 mg HC/g rock) was lower than that of S1 (10.66 mg HC/g rock), suggesting differences in the quality or type of organic matter. These differences may explain the distinct Langmuir behavior observed at both temperatures. The higher PL values in S2 at 50 °C suggest weaker gas affinity at lower pressure ranges, whereas the retention of CO₂ remains substantial—highlighting its preferential sorption behavior due to its higher polarizability and quadrupole moment [57].
While the organic matter represents the main contribution to the adsorption, the mineralogical composition can also play a role in adsorption behavior [3]. Quartz, being non-porous and non-polar, contributes minimally to gas adsorption. In contrast, clay minerals such as kaolinite and chlorite provide active sites for gas adsorption through their layered structures and surface functional groups. Kaolinite, despite its relatively low surface area, can adsorb CO₂ via interactions with surface hydroxyl groups [58]. Chlorite, with its higher cation exchange capacity and surface polarity, enhances adsorption of polarizable molecules like CO₂ [42]. Ferruginous muscovite may also contribute to adsorption due to its layered morphology and interlayer sites, although its role is generally secondary compared to other clays [59].
As expected, the adsorption-desorption isotherms for both CH₄ and CO₂ showed no hysteresis, indicating fully reversible adsorption processes. This behavior suggests that the gas molecules interact with the surface through physical adsorption mechanisms, without significant structural changes or pore trapping effects during gas uptake and release. The absence of hysteresis was commonly observed in shales samples where adsorption occurs in mesopores and macropores with well-connected and accessible pore structures [60]. Additionally, the non-swelling nature of kaolinite and chlorite contributes to the reversibility of the adsorption process, as these minerals do not exhibit interlayer expansion that can lead to hysteresis [61].
In the context of CO₂ sequestration and enhanced gas recovery, the preferential adsorption of CO₂ over CH₄ and the reversibility of the adsorption process are advantageous. They imply that CO₂ can be efficiently injected and cycled in and out of the rock matrix without loss due to irreversibility or structural changes, thereby improving storage predictability and recovery efficiency [62].
5. Conclusions
The experimental results demonstrate that the rock samples from ANH-Cañaboba1 Well in the Cesar-Ranchería Basin has a significantly greater affinity for CO₂ compared to CH₄ at both 50 °C and 80 °C, as reflected in higher Langmuir adsorption capacities (nL). This preferential adsorption is consistent with the known physicochemical properties of CO₂, including its higher polarizability and quadrupole moment.
Adsorption capacity decreases with increasing temperature for both gases, confirming the exothermic nature of the adsorption process. The reduction in nL values for CH₄ and CO₂ between 50 °C and 80 °C illustrates the thermal sensitivity of gas uptake.
Organic matter is the main factor that controls the adsorption and a direct correlation is observed between the adsorption capacity and the BET. Sample S2 demonstrates superior adsorption capacity for both CH₄ and CO₂, particularly at 50 °C, due to its higher BET surface area (40 m²/g vs. 20 m²/g for S1) and favorable mineralogical framework. CO₂ adsorption reached 0.508 mol/kg in S2, compared to 0.215 mol/kg in S1.
The absence of hysteresis in the adsorption-desorption isotherms for both CH₄ and CO₂ indicates a reversible physisorption mechanism. This suggests favorable pore connectivity and structural stability of the rock matrix, making it a viable candidate for applications such as CO₂ sequestration and enhanced gas recovery.
The samples favorable adsorption behavior, particularly toward CO₂, along with its reversibility and thermal stability, supports its potential for use in carbon storage and methane displacement technologies. These findings contribute valuable data for assessing shale formations in the Cesar-Ranchería Basin as future reservoirs for unconventional gas and CO₂ injection strategies.
Author Contributions
Conceptualization, Olga Ortiz, David Bessieres; Data Curation, Olga Ortiz; Formal Analysis, Olga Ortiz; Investigation, Olga Ortiz, David Bessieres; Methodology, David Bessieres; Project Administration, Olga Ortiz; Resources, Olga Ortiz, David Bessieres; Supervision, David Bessieres; Validation, Olga Ortiz, David Bessieres; Visualization, Olga Ortiz; Writing-Original draft, Olga Ortiz; Writing-review & editing, Olga Ortiz, David Bessieres.
Funding
This research was funded by AGENCIA NACIONAL DE HIDROCARBUROS (ANH)-MINCIENCIAS-UNIVERSIDAD INDUSTRIAL DE SANTANDER, grant number FP44842-454-2017.
Data Availability Statement
The data that has been used is confidential.
Acknowledgments
Authors acknowledge to LFCR of UPPA and GIT of Universidad Industrial de Santander for the support to this work.
Conflicts of Interest
The authors declare no conflicts of interest. The funders had no role in the design of the study; in the collection, analyses, or interpretation of data; or in the writing of the manuscript.
References
- Chi, Y., Zhao, C., Lv, J., Zhao, J., & Zhang, Y. (2019). Thermodynamics and Kinetics of CO₂/CH₄ Adsorption on Shale from China: Measurements and Modeling. Energies, 12(6), 978. [CrossRef]
- Guo, X., & Liu, Y. (2020). A review of gas transport and adsorption mechanisms in two-component methane–carbon dioxide system. International Journal of Energy Research, 44(2), 1131–1150. [CrossRef]
- Ross D.J.K., Bustin R.M. The importance of shale composition and pore structure upon gas storage potential of shale gas reservoirs. Mar Pet Geol, 26 (2009), 916-927.
- Heller R., Zoback M. [Adsorption of methane and carbone dioxide on gas shale and pure mineral samples J Unconv Oil Gas Resour, 8 (2014), 14-24.
- Gasparik M., Ghanizadeh A., Bertier P., Gensterblum Y., Bouw S., and Krooss B.M., “High-Pressure methane sorption isotherms of black shales from the Netherlands”, Energy & Fuels, vol. 26, no. 8, pp. 4995–5004, Jul. 2012. [Online]. Available: . [CrossRef]
- Huang L., Ning Z., Wang Q., Zhang W., Cheng Z., Wu X., Qin H. Effect of organic type and moisture on competitive adsorption in kerogen with implications for sequestration and enhanced recovery Appl Energy, 210 (2018), pp. 28-43.
- Du, X., Gu, M., Hou, Z., Liu, Z., & Wu, T. (2019). Experimental Study on the Kinetics of Adsorption of CO₂ and CH₄ in Gas-Bearing Shale Reservoirs. Energy & Fuels, 33(12), 12587–12600. [CrossRef]
- Wang, J., Samara, H., Jaeger, P., Ko, V., Rodgers, D., & Ryan, D. (2022). Investigation for CO₂ Adsorption and Wettability of Reservoir Rocks. Energy & Fuels, 36(3), 1626–1634. [CrossRef]
- Liu, J., Xie, L.Z., He, B., Zhang, J., Tang, X., & Fan, X. (2021). Performance of free gases during the recovery enhancement of shale gas by CO₂ injection: A case study on the depleted Wufeng–Longmaxi shale in northeastern Sichuan Basin, China. Petroleum Science, 18(2), 530–545. [CrossRef]
- Wang, J., Mangano, E., Brandani, S., & Ruthven, D. M. (2021). A review of common practices in gravimetric and volumetric adsorption kinetic experiments. Adsorption, 27(3), 295–318. [CrossRef]
- Zhang, Y., Liu, S., & Wang, K. (2018). Microscale Research on Effective Geosequestration of CO₂ in Coal Reservoir: A Natural Analogue Study in Haishiwan Coalfield, China. Geofluids, 2018, 3015038. [CrossRef]
- Shi, J.Q., Mazumder, S., Wolf, K.H., & Durucan, S. (2008). Competitive Methane Desorption by Supercritical CO₂ Injection in Coal. Transport in Porous Media, 75(1), 35–54. [CrossRef]
- Yang, N., Xue, R., Huang, G., Ma, Y., & Wang, J. (2021). CO₂ Adsorption Performance and Kinetics of Ionic Liquid-Modified Calcined Magnesite. Nanomaterials, 11(10), 2614. [CrossRef]
- Huo, B., Jing, X., & Fan, C. (2019). Numerical investigation of flue gas injection enhanced underground coal seam gas drainage. Energy Science & Engineering, 7(6), 3204–3219. [CrossRef]
- Wang, Y., Dai, Z., Chen, L., Shen, X., & Soltanian, M.R. (2023). An integrated multi-scale model for CO₂ transport and storage in shale reservoirs. Applied Energy, 331, 120444. [CrossRef]
- Zhang, T., Ellis, G.S., Ruppel, S.C., Milliken, K., & Yang, R. (2012). Effect of Organic-Matter Type and Thermal Maturity on Methane Adsorption in Shale-Gas Systems. Organic Geochemistry, 47, 120–131. [CrossRef]
- Long, H., Lin, H.F., Yan, M., Bai, Y., Tong, X., Kong, X.G., & Li, S.G. (2021). Adsorption and diffusion characteristics of CH₄, CO₂, and N₂ in micropores and mesopores of bituminous coal: Molecular dynamics. Fuel, 292, 120268. [CrossRef]
- Yang, H., Guo, Y., Wang, X., Zhang, Y., & Chen, S. (2023). Desorption–diffusion behavior of CH₄/CO₂ mixtures in shale: Insights from experiments and modeling. Journal of Natural Gas Science and Engineering, 110, 105066. [CrossRef]
- Rodríguez, J.A., Ramos, A., García, B., & Martínez, J. (2021). Carbon dioxide retention in sandstones: Experimental and modelling insights. International Journal of Greenhouse Gas Control, 112, 103517. [CrossRef]
- Xu, T., Wang, M., & Liu, G. (2020). CO₂ sequestration in shales: Insights from core-flooding experiments and pore-scale modeling. Journal of CO₂ Utilization, 36, 79–90. [CrossRef]
- Wang, Y., Gao, X., Sun, X., & Liu, H. (2021). Desorption and recovery of CH₄ and CO₂ in different rank coals: Experimental and simulation study. Energy Reports, 7, 7122–7131. [CrossRef]
- Rezaee, R. (2015). Fundamentals of Gas Shale Reservoirs. John Wiley & Sons. ISBN: 978-1-118-65120-1.
- Raza, A., Rezaee, R., Gholami, R., & Rasouli, V. (2017). Injectivity and flowback analysis of supercritical CO₂ in tight formations: An experimental approach. Energy & Fuels, 31(1), 1–15. [CrossRef]
- Pan, Z., & Connell, L.D. (2012). Modelling of anisotropic coal swelling and its impact on permeability behaviour for primary and enhanced methane recovery. Fuel, 97, 439–447. [CrossRef]
- Mora, A., et al. (2010). Inversion tectonics under increasing lithospheric rigidity during Cenozoic mountain building in the northern Andes: Constraints from the Cesar–Ranchería Basin, Colombia. Tectonics, 29(6), TC6012. [CrossRef]
- Cediel, F., Shaw, R.P., & Cáceres, C. (2003). Tectonic Assembly of the Northern Andean Block. AAPG Memoir, 79, 815–848.
- Velandia, F., et al. (2005). The Cesar-Ranchería Basin: Structural evolution and implications for petroleum systems. Boletín de Geología, 27(1), 55–74.
- Ojeda, G.Y., & Mora, A. (2015). Petroleum systems and geodynamic framework of the Cesar-Ranchería Basin. AAPG Search and Discovery, Article #110218.
- ANH – Agencia Nacional de Hidrocarburos (2010). Ronda Colombia 2010 - Tipo 3: Cuenca Cesar-Ranchería. https://www.anh.gov.co.
- Olivella, M.A. (2005). Stratigraphic and structural characterization of the Ranchería Basin. Geología Colombiana, 30, 27–45.
- Sánchez, H. (2008). Palinspastic reconstruction of the Cesar–Ranchería Basin. Boletín de Geología, 30(2), 25–40.
- Espitia, A. (2008). Estudio estructural y sedimentológico del área norte de la Cuenca Cesar-Ranchería. Tesis MSc, Universidad Nacional de Colombia.
- Ruiz, M. (2006). Coalbed methane exploration potential in the Cesar Sub-Basin. Revista Geología Colombiana, 31, 45–63.
- Rodríguez, G.I., et al. (2013). Gas adsorption potential of Colombian coal seams: Implications for CO₂ sequestration. International Journal of Coal Geology, 116–117, 39–51. [CrossRef]
- Montes, C., Guzmán, G., Bayona, G., Cardona, A., Ramírez, V., & Jaramillo, C. (2010). Clockwise rotation of the Santa Marta Massif and simultaneous Paleogene to Neogene deformation of the Plato-San Jorge and Cesar-Ranchería Basins. Journal of South American Earth Sciences, 29(4), 832–848. [CrossRef]
- Chalmers, G.R.L.; Bustin, R.M. Lower Cretaceous Gas Shales in Northeastern British Columbia, Canada: Evaluation of Gas Storage Mechanisms. AAPG Bull. 2008, 92, 589–622. [CrossRef]
- Ross, D.J.K.; Bustin, R.M. Characterizing the Shale Gas Resource Potential of Devonian–Mississippian Shales, Western Canada Sedimentary Basin: Application of an Integrated Formation Evaluation. AAPG Bull. 2008, 92, 87–125. [CrossRef]
- Curtis, J.B. Fractured Shale-Gas Systems. AAPG Bull. 2002, 86, 1921–1938. [CrossRef]
- Loucks, R.G.; Reed, R.M.; Ruppel, S.C.; Jarvie, D.M. Morphology, Genesis, and Distribution of Nanometer-Scale Pores in Siliceous Mudstones of the Mississippian Barnett Shale. J. Sediment. Res. 2009, 79, 848–861. [CrossRef]
- Bernard, S.; Horsfield, B.; Schulz, H.-M.; Wirth, R.; Schreiber, A.; Sherwood, N. Geochemical and Microstructural Characterization of Gas Shale Organic Matter: A Review. Mar. Pet. Geol. 2012, 31, 7–29. [CrossRef]
- Chen, J.; Jiang, Z.; Pu, R.; Jin, Z.; Li, X.; Bai, J. Characterization of Organic Pore Development and Pore Size Distribution in the Lower Cambrian Shales of Southern China. Mar. Pet. Geol. 2015, 59, 320–332. [CrossRef]
- Kuila, U.; Prasad, M. Specific Surface Area and Pore-Size Distribution in Clays and Shales. Int. J. Coal Geol. 2013, 113, 43–53. [CrossRef]
- Clarkson, C.R.; Bustin, R.M. Variation in Permeability with Lithotype and Pore Structure in Gas Shales: Examples from the Barnett, Woodford, Haynesville, Marcellus, and Doig/Phosphate Shales. SPE Unconventional Gas Conference, Pittsburgh, Pennsylvania, USA, 23–25 February 2010. [CrossRef]
- R. Khosrokhavar, K.H. Wolf, and H. Bruining, “Sorption of CH4 and CO2 on a carboniferous shale from Belgium using a manometric setup”, International Journal of Coal Geology, vol. 128-129, pp. 153–161, Aug. 2014. [Online]. Available: . [CrossRef]
- Y. Belmabkhout, M. Frère, and G. D. Weireld, “High-pressure adsorption measurements. A comparative study of the volumetric and gravimetric methods”, Measurement Science and Technology, vol. 15, no. 5, pp. 848–858, Mar. 2004.
- D. Pino, F. Plantier, D. Bessieres, “Experimental determination of the adsorption isotherms in gas mixtures under extended pressure and temperature range”, J Therm Anal Calorim, Vol 117, pp.1469-1477, 2014. [Online]. Available: . [CrossRef]
- M. Pozo, D. Pino, and D. Bessieres, “Effect of thermal events on maturation and methane adsorption of Silurian black shales (Checa, Spain)”, Applied Clay Science, vol. 136, pp. 208–218, Feb. 2017. [Online]. Available: . [CrossRef]
- N. M. Al-Areeq, “Petroleum source rocks characterization and hydrocarbon generation”, in Recent Insights in Petroleum Science and Engineering. InTech, 2018. [Online]. Available: . [CrossRef]
- K. E. Peters, “Guidelines for Evaluating Petroleum Source Rock Using Programmed Pyrolysis”, AAPG Bulletin, vol. 70, 1986. [Online]. Available: . [CrossRef]
- K. E. Peters and M. R. Cassa, “Applied Source Rock Geochemistry”, in The Petroleum System—From Source to Trap. American Association of Petroleum Geologists, 1994, pp. 93–120. [Online]. Available: . [CrossRef]
- Y. Gensterblum et al., “European inter-laboratory comparison of high pressure CO2 sorption isotherms. I: Activated carbon”, Carbon, vol. 47, no. 13, pp. 2958–2969, Nov. 2009. [Online]. Available: . [CrossRef]
- Weniger, P.; Kalkreuth, W.; Busch, A.; Krooss, B. M. High pressure methane and carbon dioxide sorption on coal and shale samples from the Parana Basin, Brazil. Int. J. Coal Geol. 2010, 84, 190205.
- Gensterblum, Y., Merkel, A., Busch, A., Krooss, B.M., 2013. High-pressure CH4 and CO2 sorption isotherms as a function of coal maturity and the influence of moisture. Int. J. Coal Geol. 118, 45-57.
- Guochang Wang et al., "Estimation of shale gas adsorption capacity of the Longmaxi Formation in the Sichuan Basin, China," Journal of Natural Gas Science and Engineering, vol. 37, pp. 1–9, 2017.
- Yu, W., Sepehrnoori, K., & Patzek, T. W. (2016). Modeling gas adsorption in shale gas reservoirs with Langmuir and BET isotherms. Journal of Natural Gas Science and Engineering, 31, 526–533. [CrossRef]
- Liu, S.; Xiao, X.; Jiang, Z.; Zhang, S.; Shao, D.; Wang, Y. CO₂ Adsorption Capacity of Organic-Rich Shales from the Sichuan Basin, China. Int. J. Greenh. Gas Control 2013, 17, 107–120. [CrossRef]
- Yang et al., "Selective adsorption of CO₂/CH₄ mixture on clay-rich shale using molecular simulations," Journal of Natural Gas Science and Engineering, vol. 68, pp. 1–10, 2019.
- Dwivedi, A., & Gupta, S. (2023). CO₂ Adsorption of Materials Synthesized from Clay Minerals: A Review. Minerals, 9(9), 514. [CrossRef]
- Ross, D. J. K., & Bustin, R. M. (2009). The Importance of Shale Composition and Pore Structure upon Gas Storage Potential of Shale Gas Reservoirs. Marine and Petroleum Geology, 26(6), 916–927. [CrossRef]
- Zhang, R.; Liu, S.M. Experimental and Theoretical Characterization of Methane and CO₂ Sorption Hysteresis in Coals Based on Langmuir Desorption. Int. J. Coal Geol. 2017, 171, 49–60. [CrossRef]
- Wang, G.; Liu, S.; Li, Z.; Wang, Y.; Wang, Y. Methane and CO₂ Sorption Hysteresis on Coal: A Critical Review. Int. J. Coal Geol. 2014, 132, 60–80. [CrossRef]
- Zhou, F.; Hussain, F.; Guo, Z.; Cinar, Y. Adsorption/Desorption Characteristics for Methane, Nitrogen and Carbon Dioxide of Coal Samples from Southeast Qinshui Basin, China. Energy Explor. Exploit. 2013, 31, 1–17. [CrossRef]
Figure 1.
CRB location [35].
Figure 1.
CRB location [35].
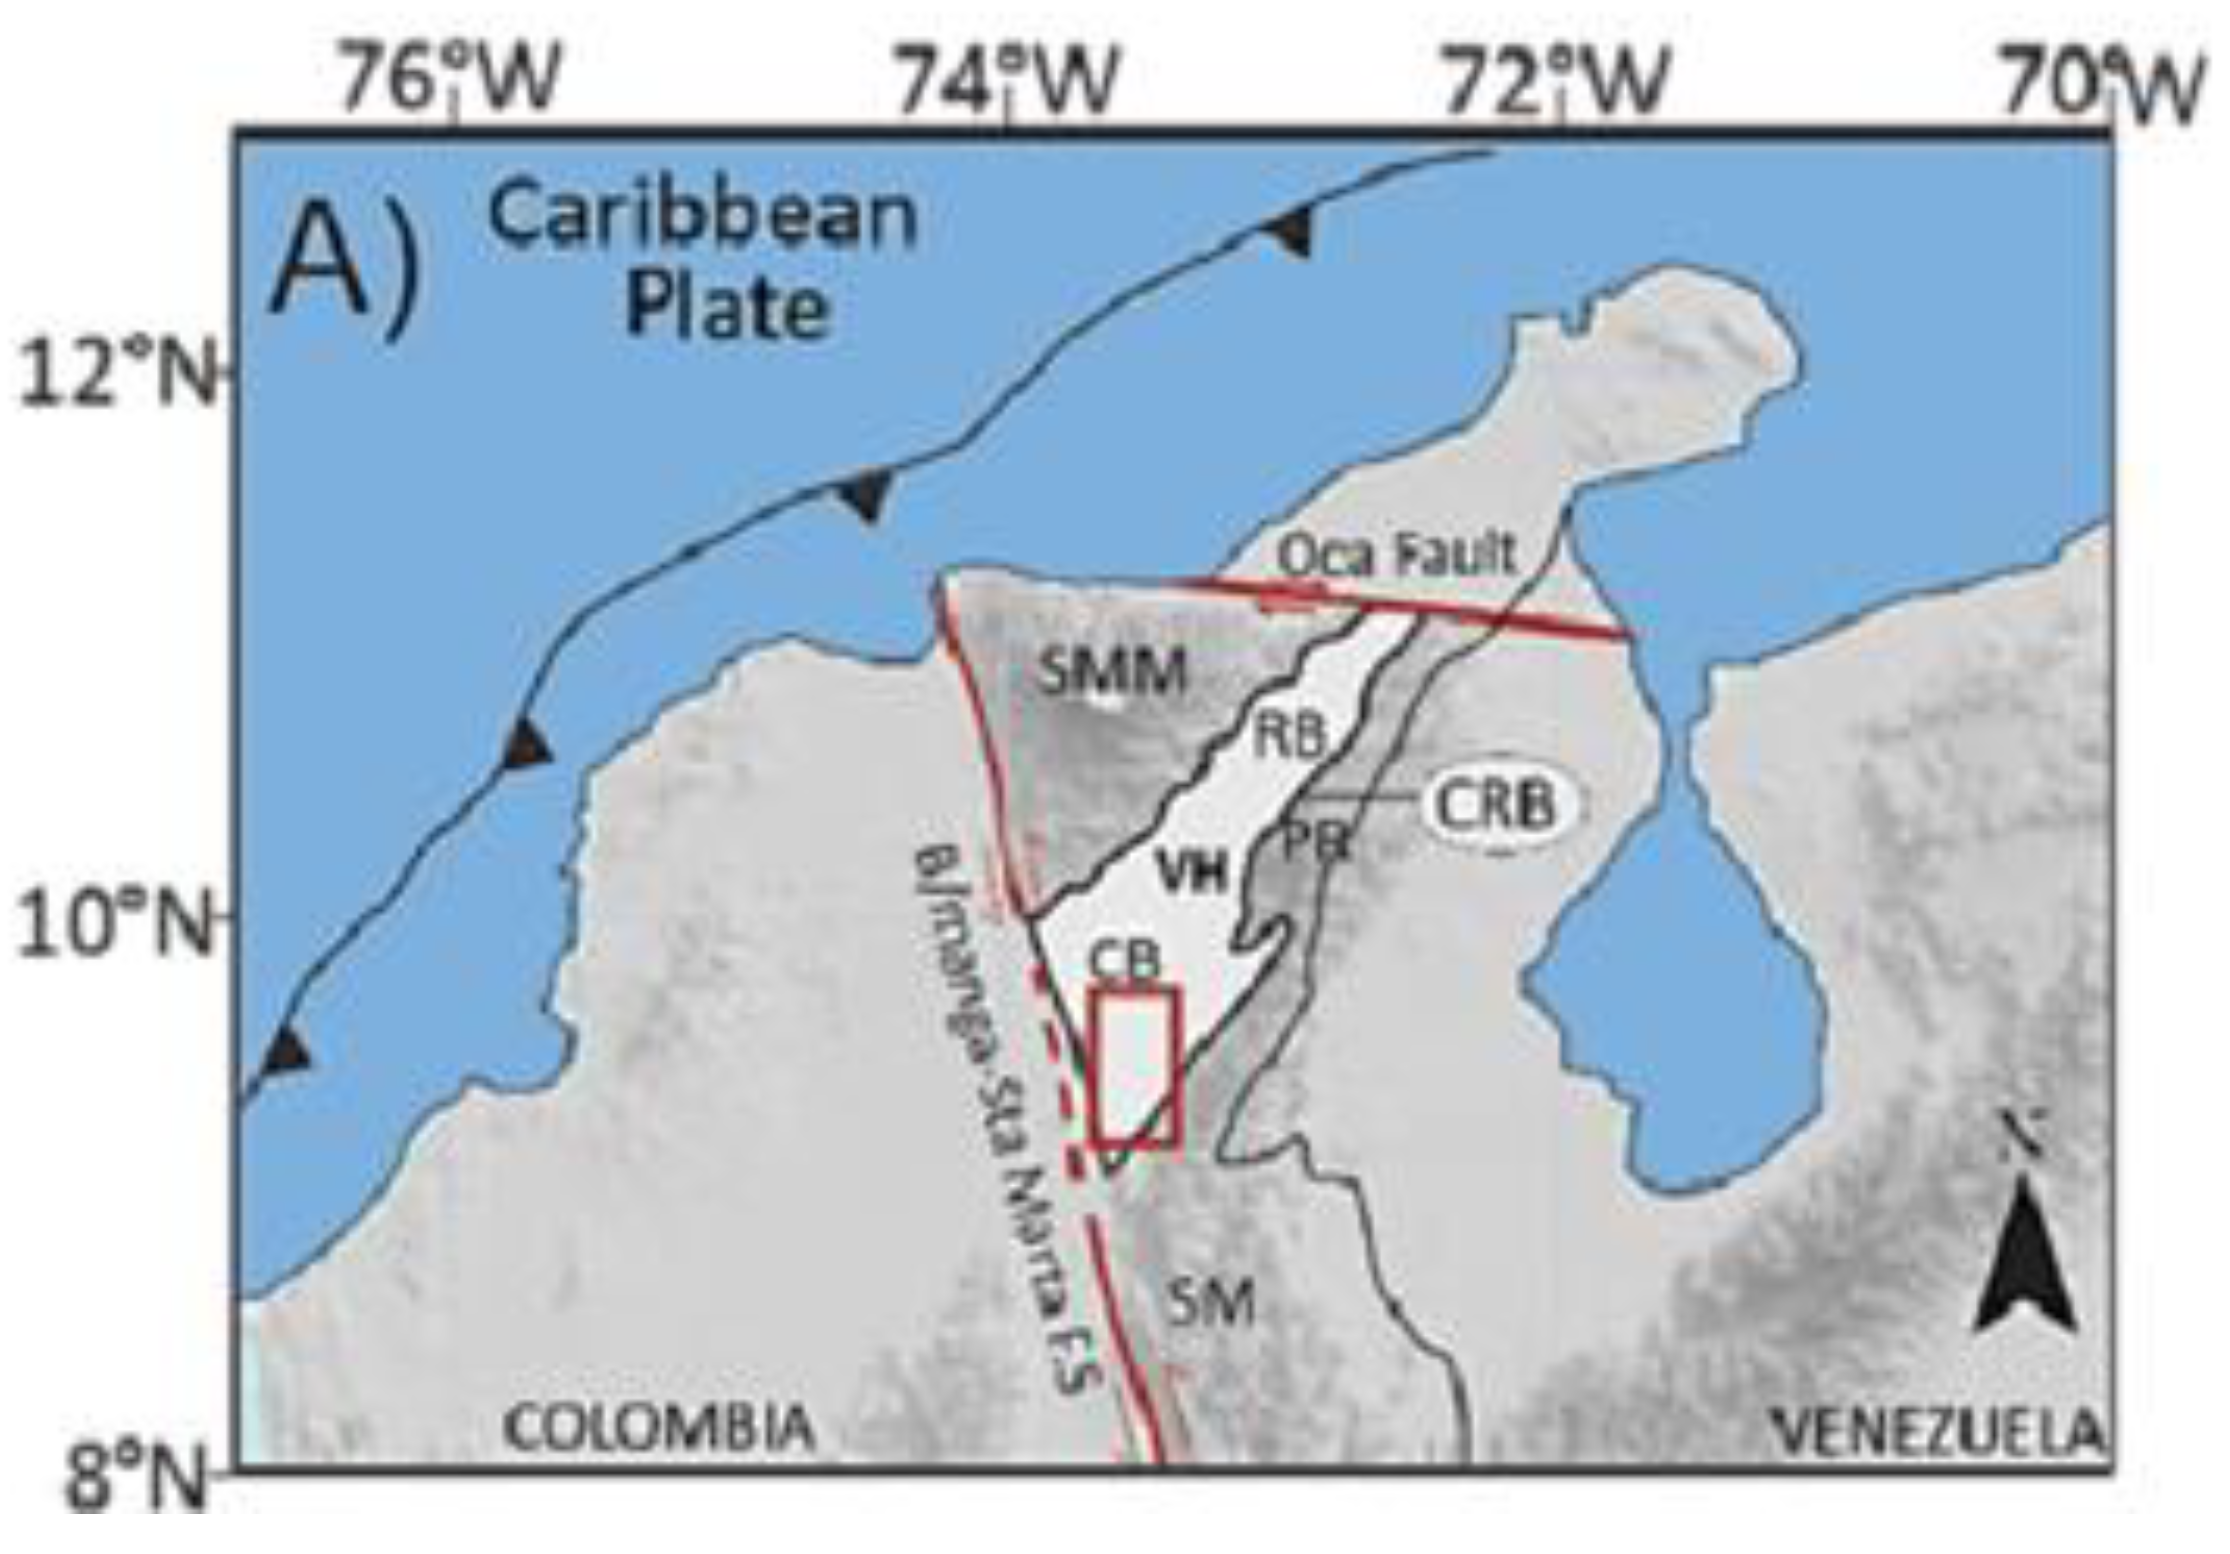
Figure 2.
Tmax−HI graph. Source: own elaboration. Red for S1 and Blue for S2.

Figure 3.
S1 CH4 adsorption/desorption at 50°C. Source: own elaboration.
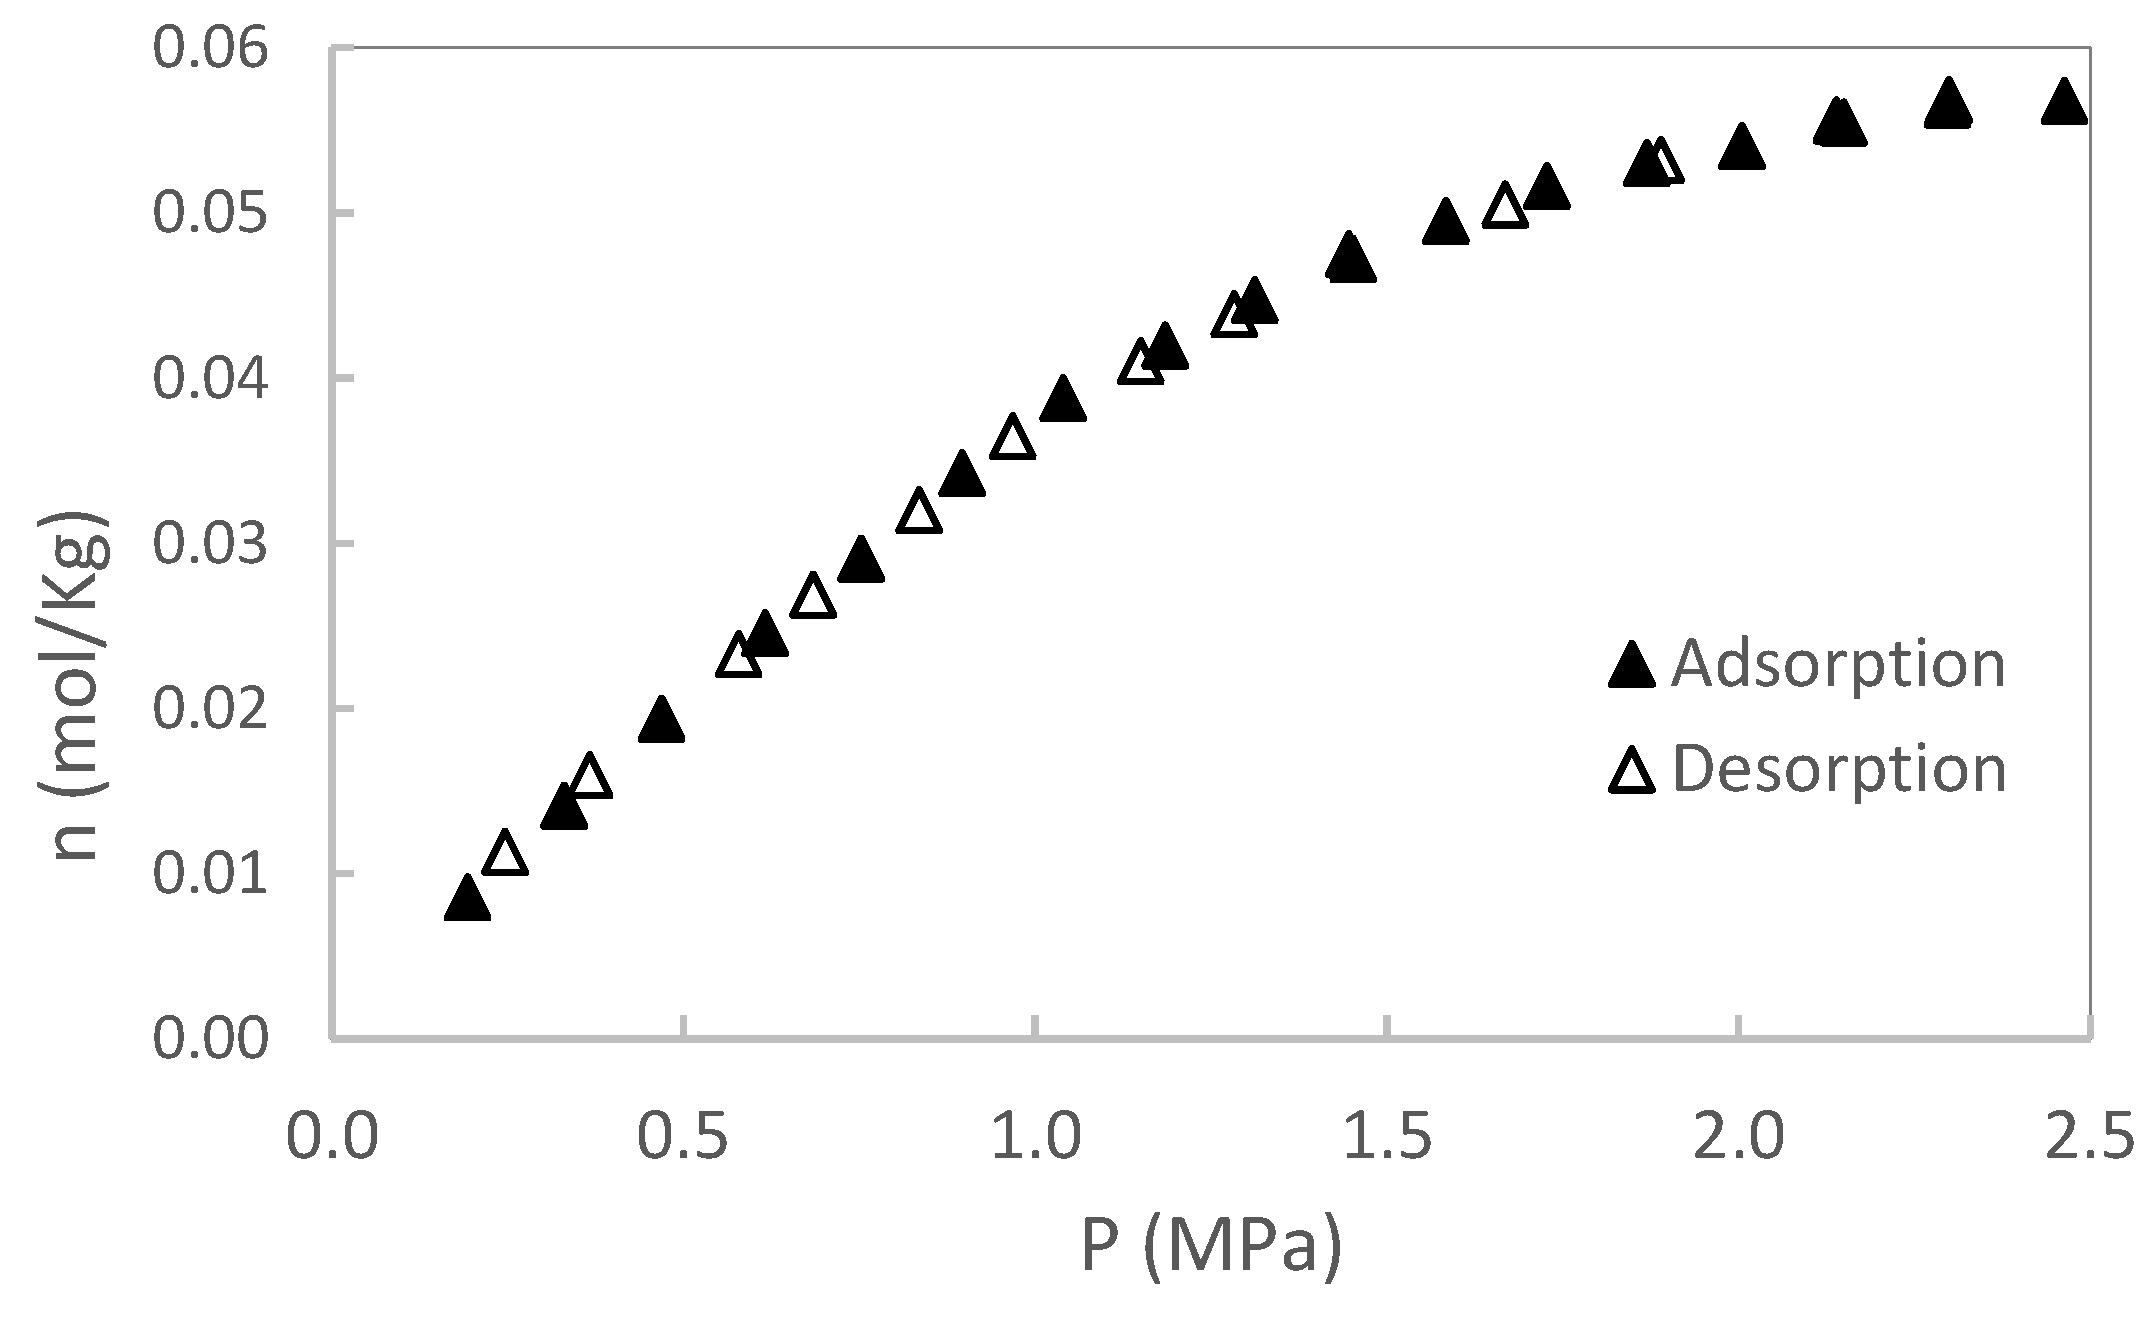
Figure 4.
S1 CH4 adsorption/desorption at 80°C. Source: own elaboration.
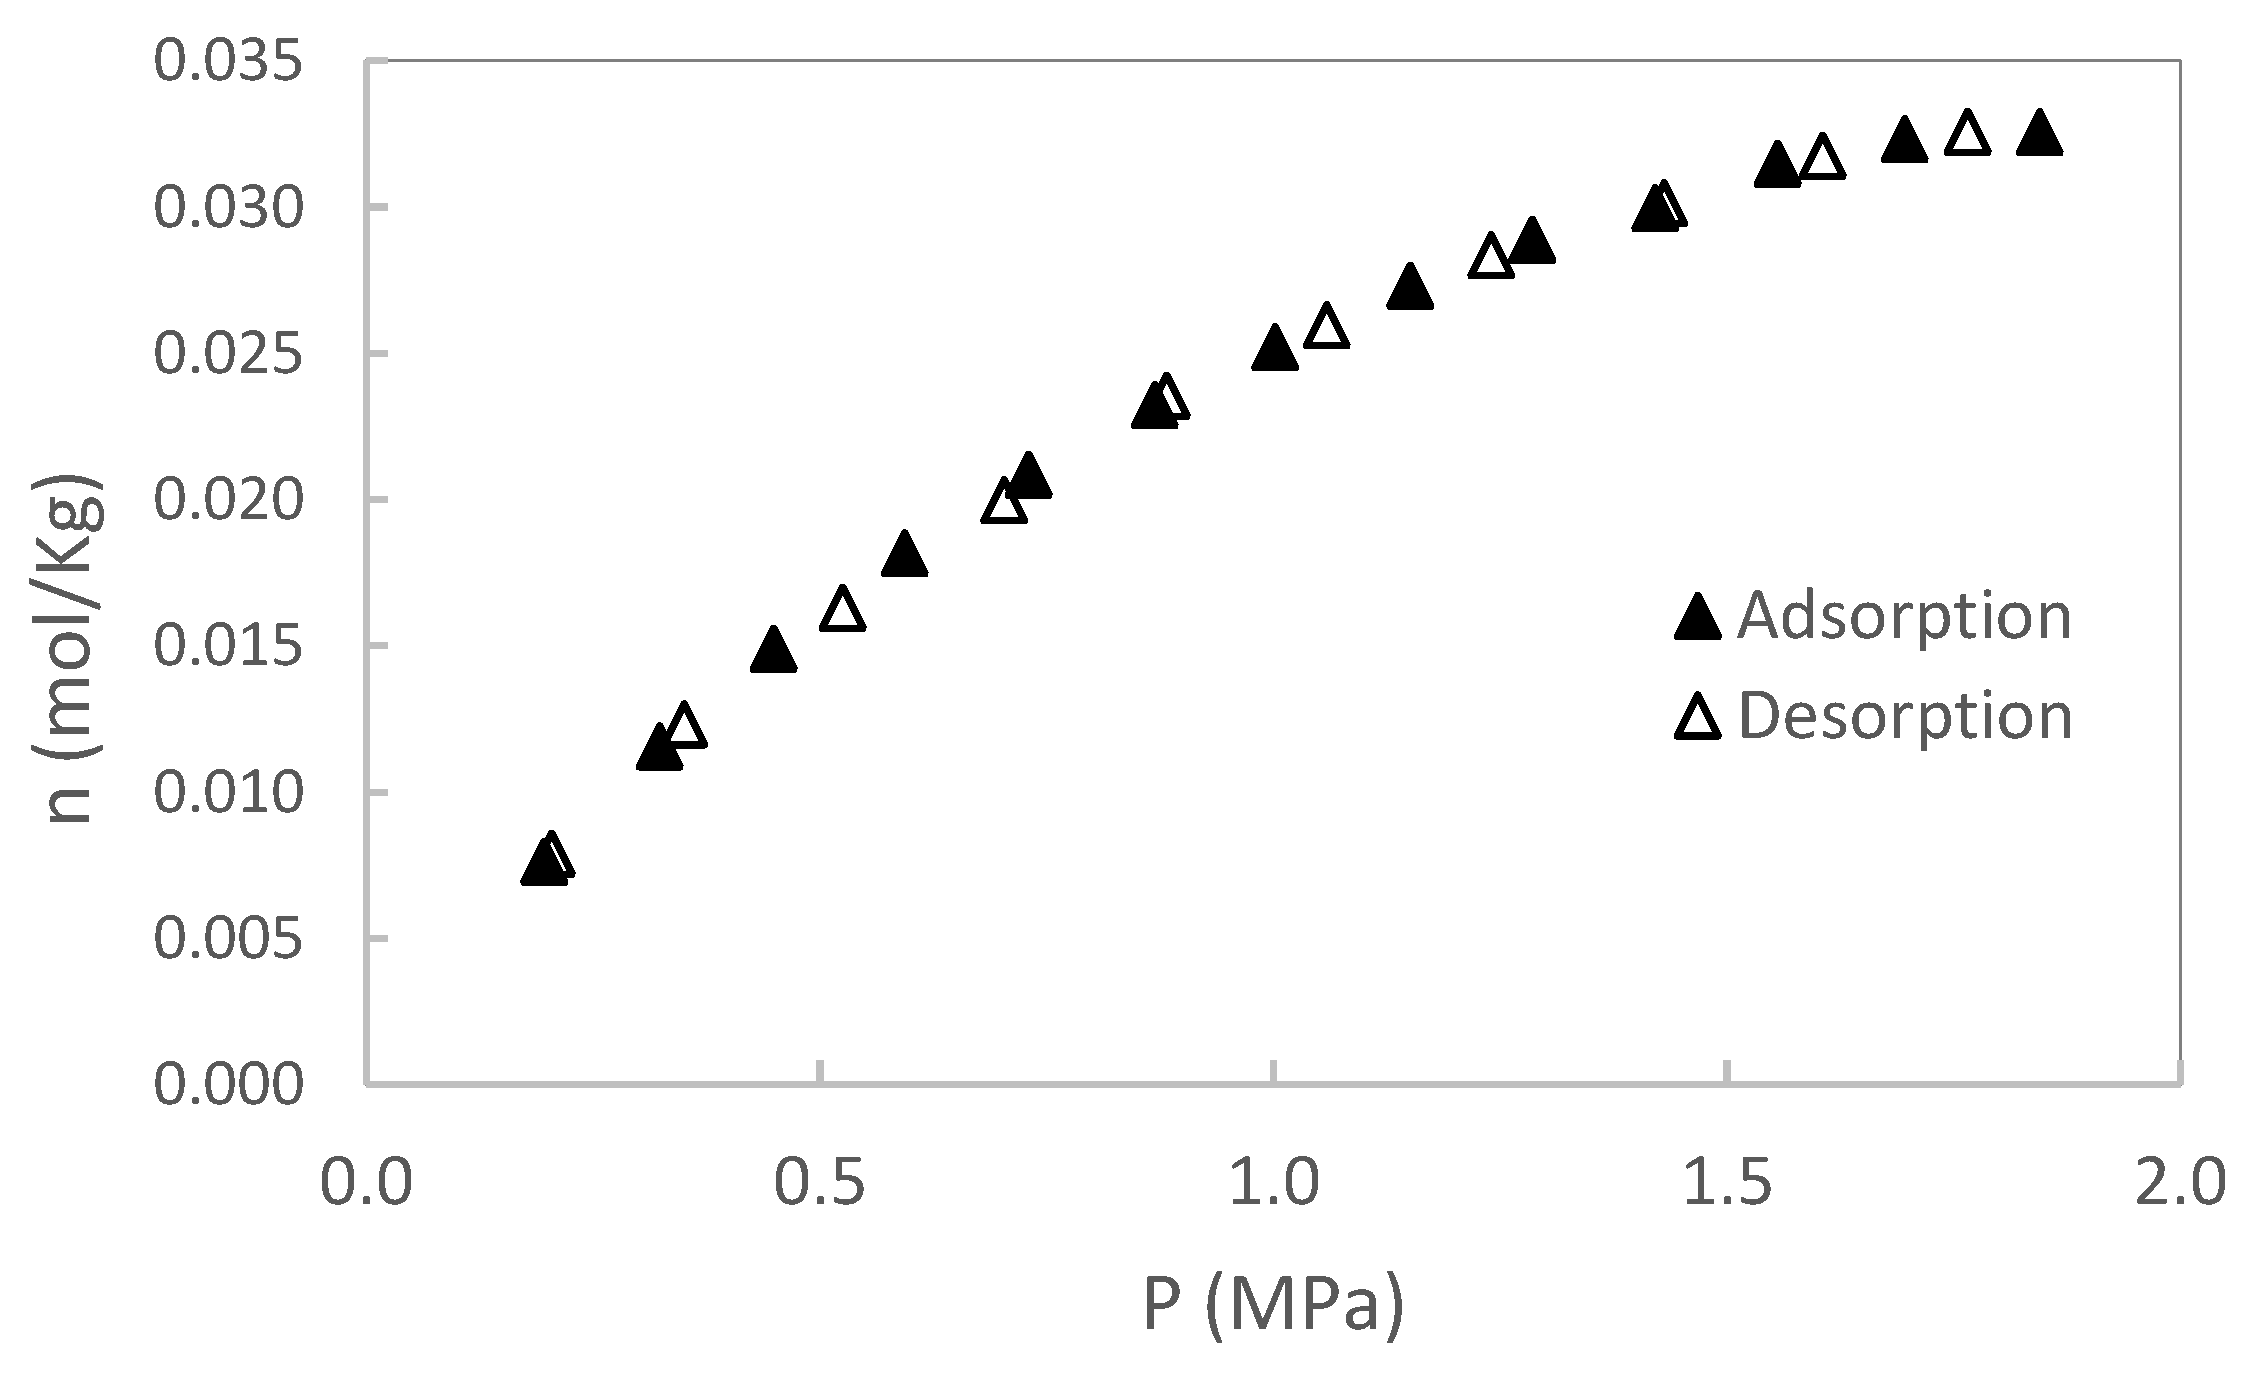
Figure 5.
S1 CO2 adsorption/desorption at 50°C. Source: own elaboration.
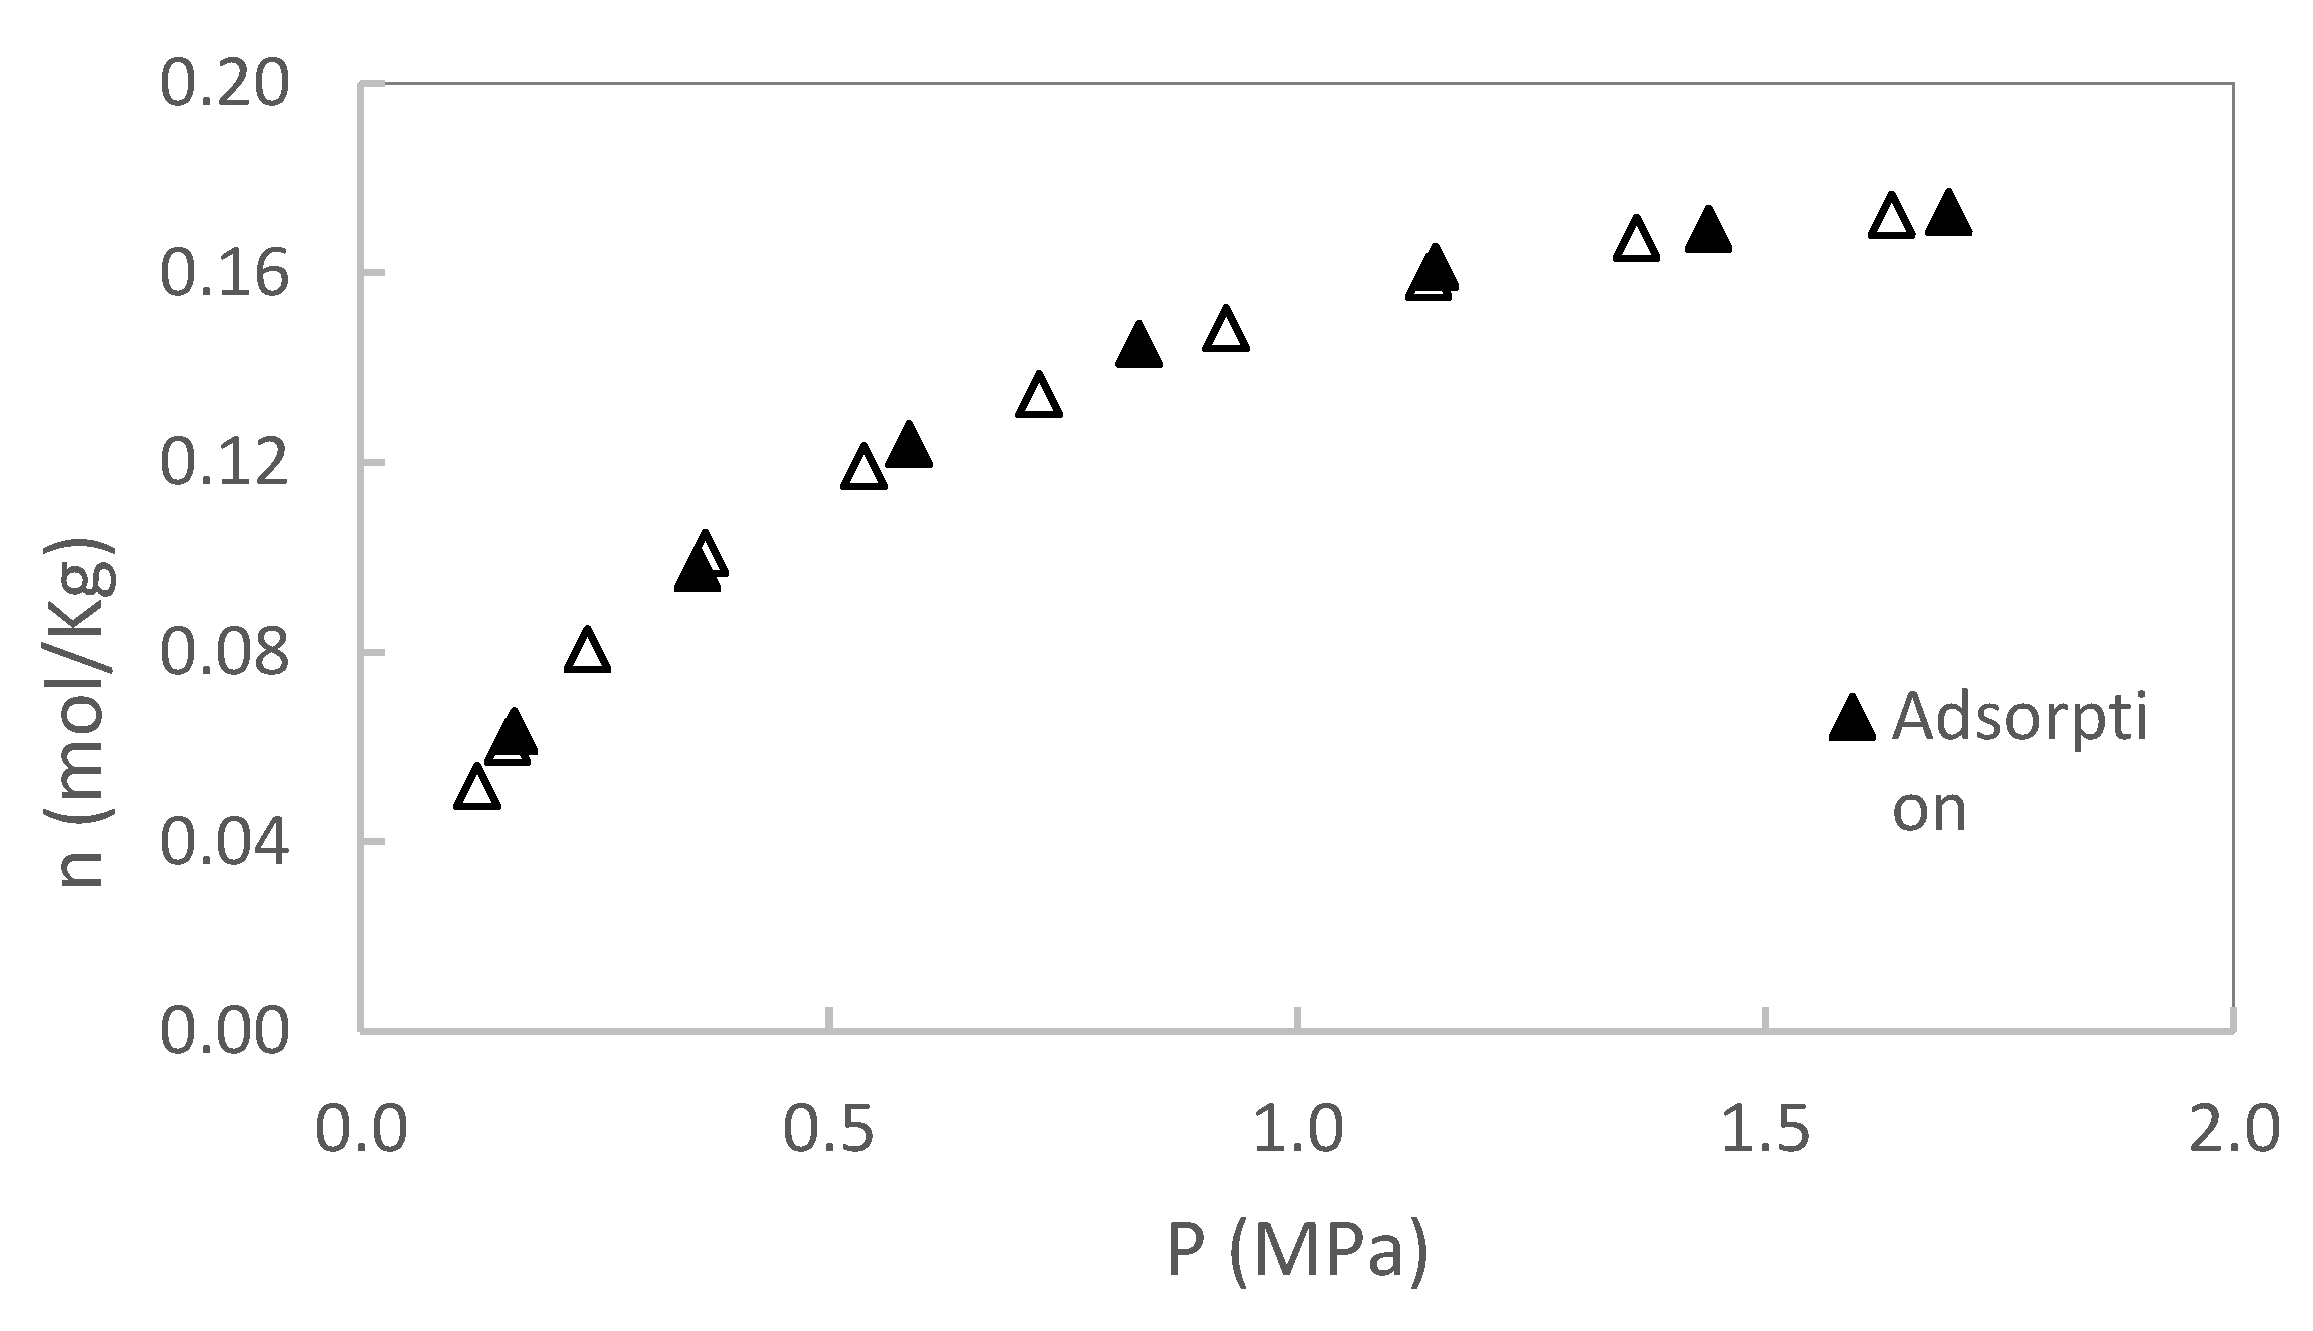
Figure 6.
S1 CO2 adsorption/desorption at 80°C. Source: own elaboration.
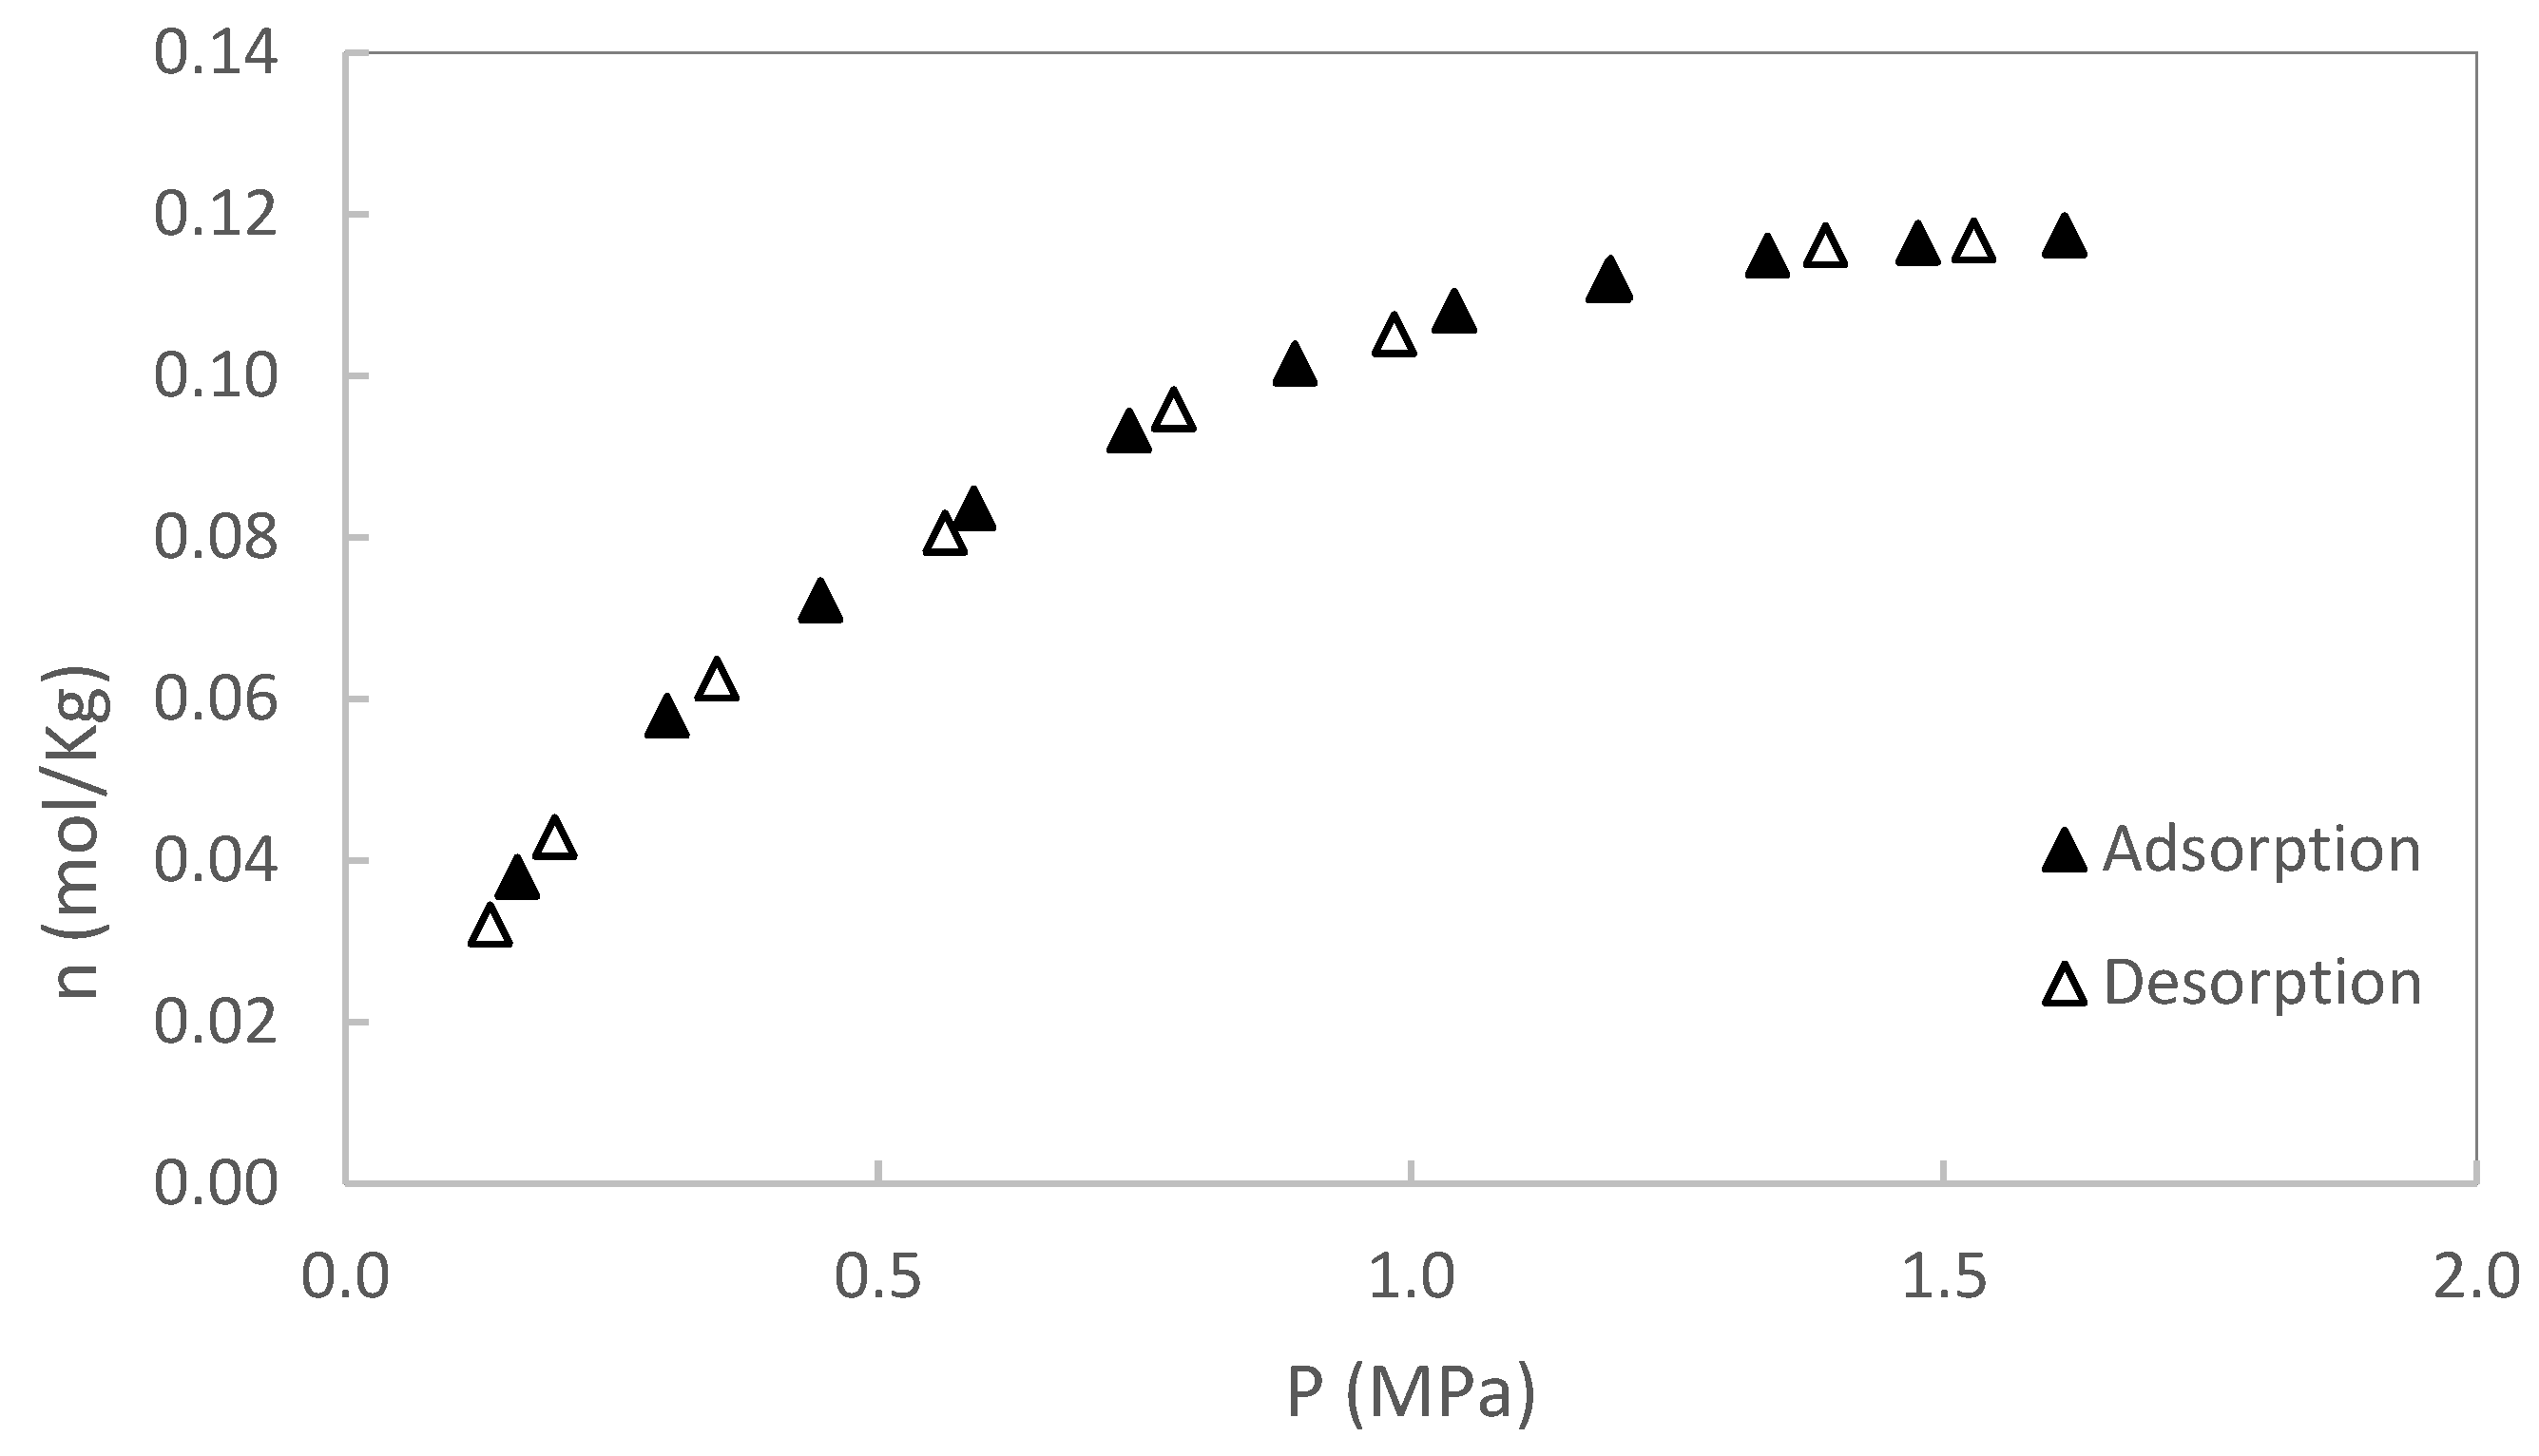
Figure 7.
S1 Comparative adsorption data. Source: own elaboration.
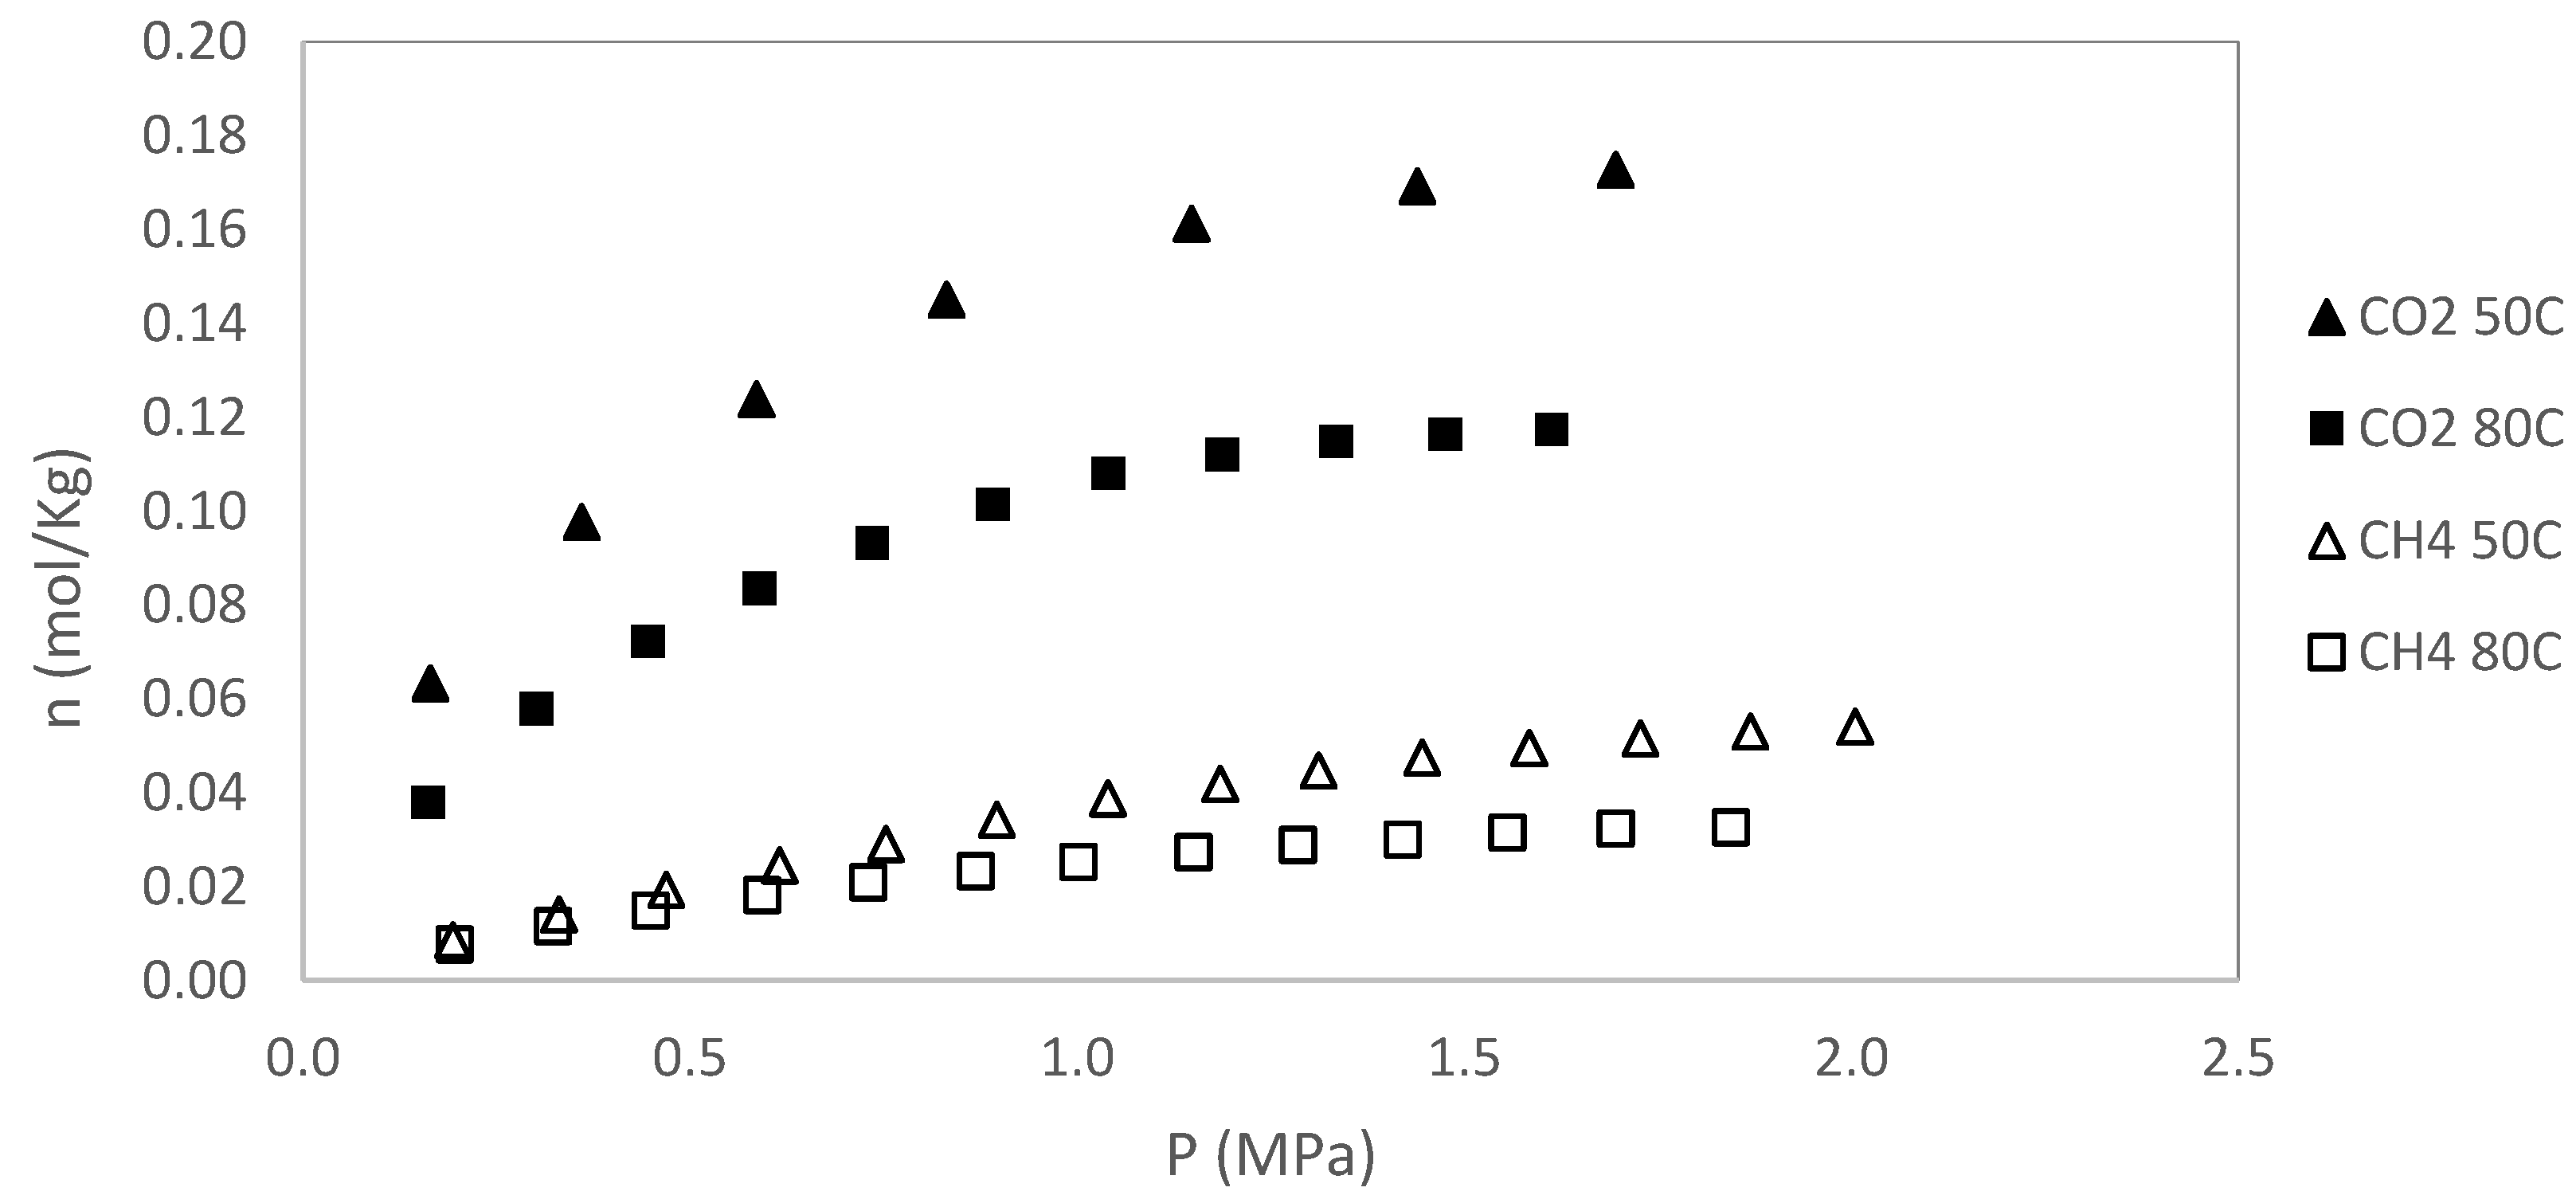
Figure 8.
S2 Comparative adsorption data. Source: own elaboration.
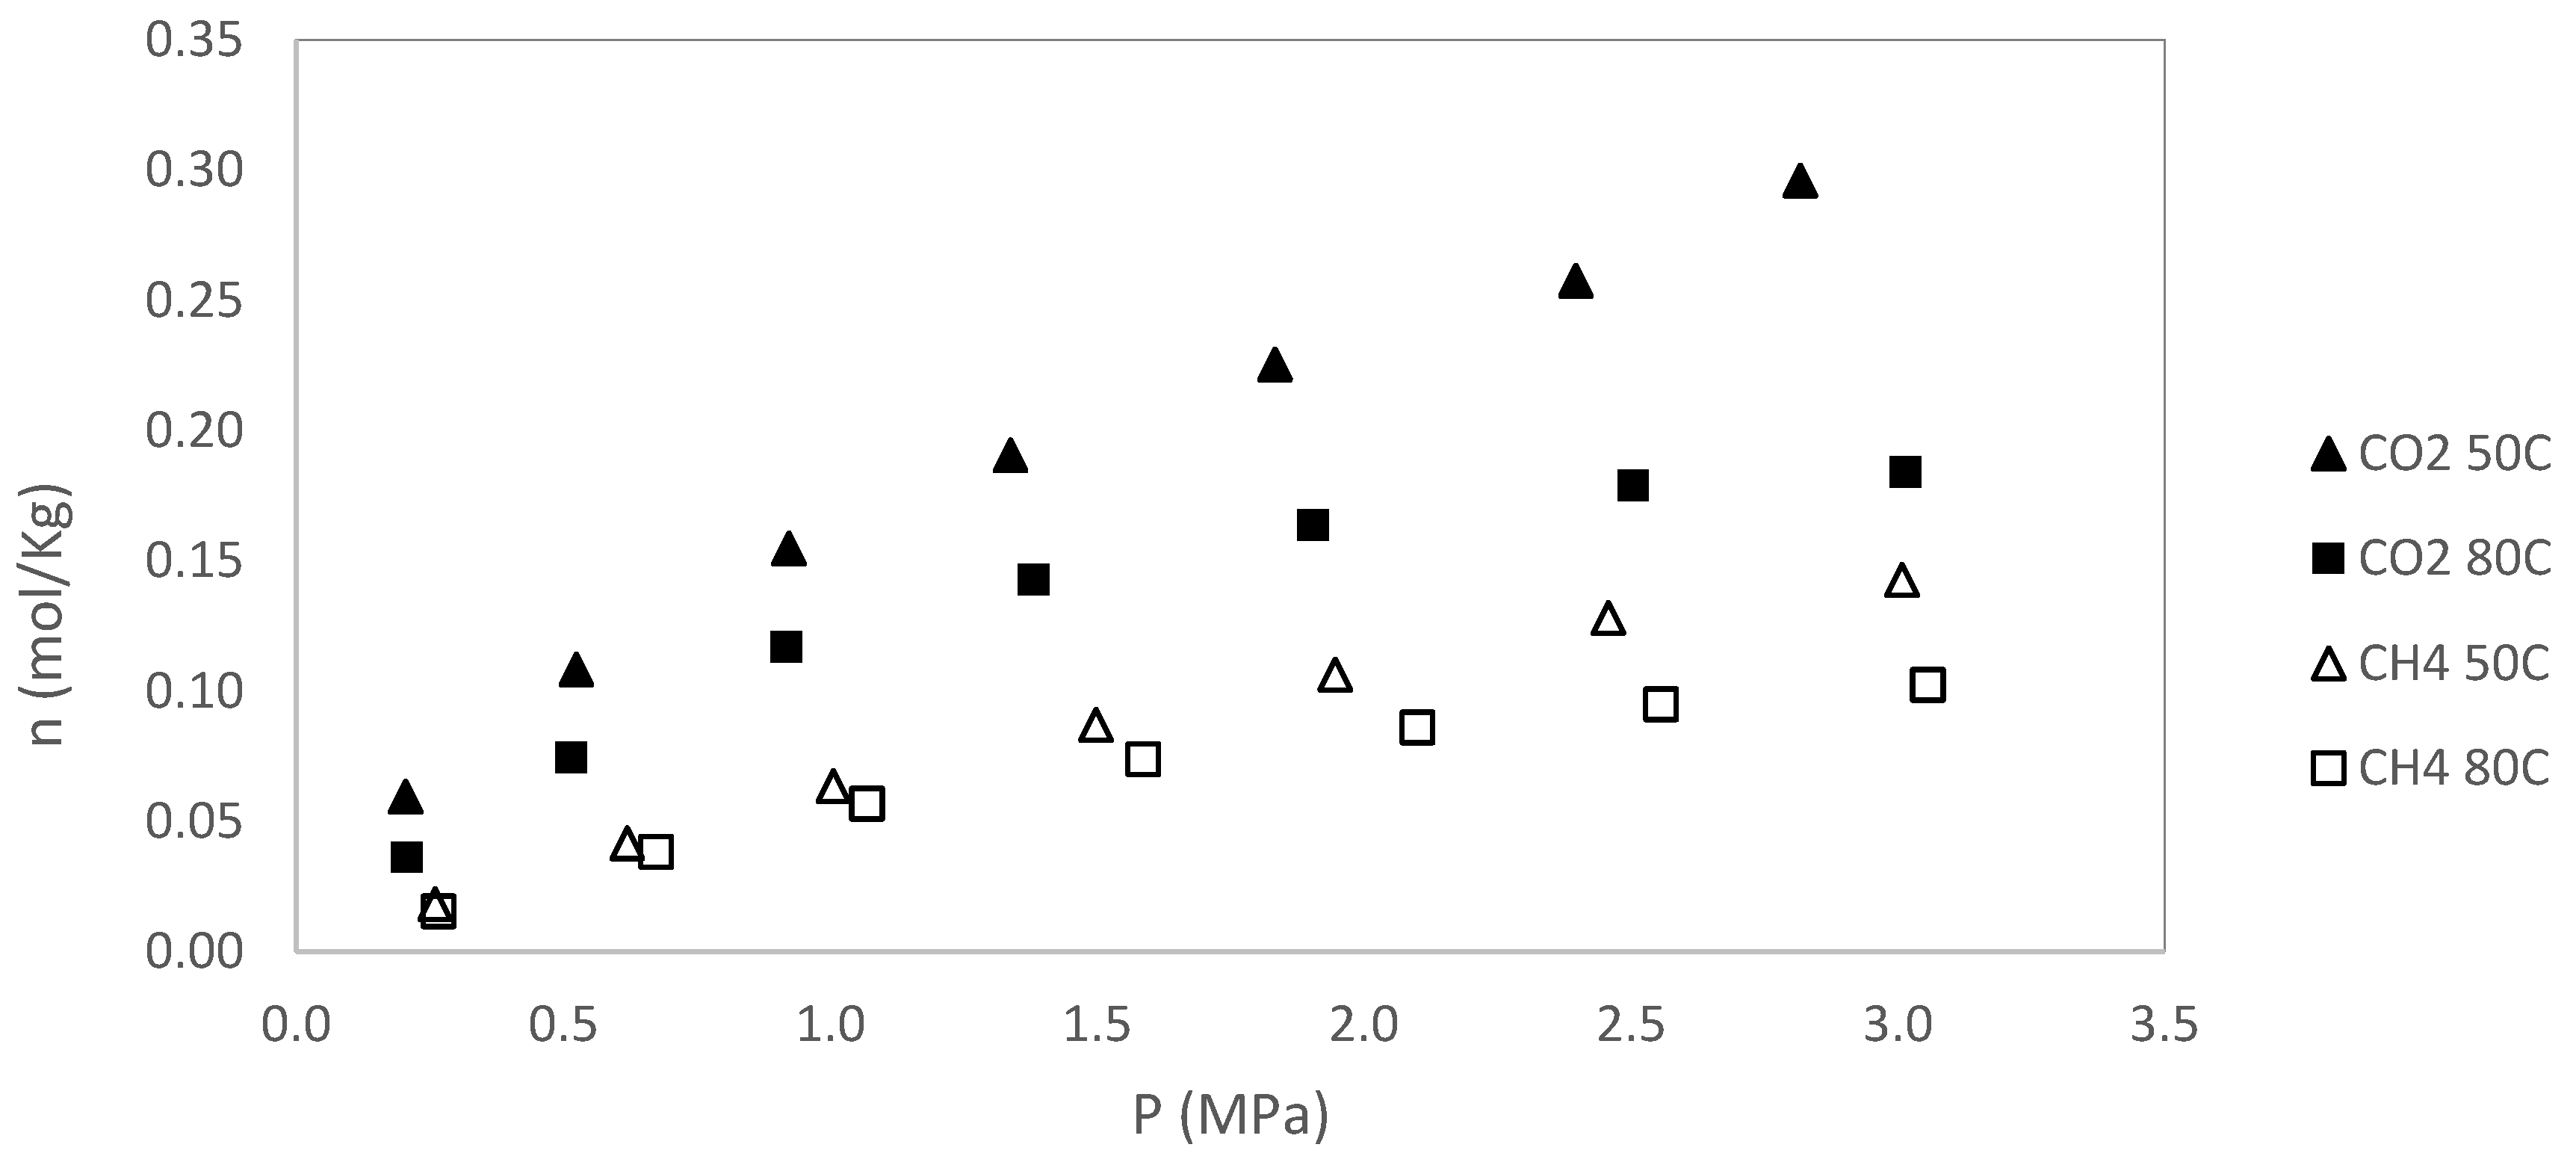

Table 1.
Geochemical properties.
| Sample ID | TOC (% Wt) | Tmax (°C) | S1 | S2 | S3 | HI | OI | PI | PG | Ro (%) |
|---|---|---|---|---|---|---|---|---|---|---|
| S1 | 4,94 | 433 | 0.11 | 10.66 | 1.08 | 215.96 | 21.88 | 0.01 | 10.77 | 0.43 |
| S2 | 5.18 | 433 | 0.07 | 6.74 | 1.91 | 130.2 | 36.9 | 0.01 | 6.81 | 0.40 |
Table 2.
Mineralogical analysis.
| Sample ID | Quartz (%) | Anatase (%) | Antigorite (%) | Albite (%) | Rutile (%) | Ferruginous Muscovite (%) | Kaolinite (%) | Chlorite (%) |
|---|---|---|---|---|---|---|---|---|
| S1 | 40.58 | 1.32 | <1.00 | 24.47 | 22.97 | 9.80 | ||
| S2 | 42.24 | 1.50 | 4.41 | 2.74 | <1.00 | 24.20 | 27.90 | 6.06 |
Table 3.
Langmuir Model Fitting Parameters for S1.
| Experiment | (mol/kg) | (MPa) | ||
|---|---|---|---|---|
| CH4 at 50°C | 0.125 | 2.401 | 0.00018 | |
| CH4 at 80°C | 0.059 | 1.320 | 0.00003 | |
| CO2 at 50°C | 0.215 | 0.4404 | 0.00013 | |
| CO2 at 80°C | 0.164 | 0.544 | 0.00037 |
Table 4.
Langmuir Model Fitting Parameters for S2.
| Experiment | (mol/kg) | (MPa) | ||
|---|---|---|---|---|
| CH4 at 50°C | 0.462 | 6,231 | 0.00035 | |
| CH4 at 80°C | 0,210 | 2,918 | 0.00044 | |
| CO2 at 50°C | 0.508 | 2,067 | 0.00023 | |
| CO2 at 80°C | 0,284 | 1.338 | 0.00094 |
Disclaimer/Publisher’s Note: The statements, opinions and data contained in all publications are solely those of the individual author(s) and contributor(s) and not of MDPI and/or the editor(s). MDPI and/or the editor(s) disclaim responsibility for any injury to people or property resulting from any ideas, methods, instructions or products referred to in the content. |
© 2025 by the authors. Licensee MDPI, Basel, Switzerland. This article is an open access article distributed under the terms and conditions of the Creative Commons Attribution (CC BY) license (http://creativecommons.org/licenses/by/4.0/).
Copyright: This open access article is published under a Creative Commons CC BY 4.0 license, which permit the free download, distribution, and reuse, provided that the author and preprint are cited in any reuse.


