
Submitted:
16 April 2025
Posted:
16 April 2025
You are already at the latest version
Abstract
The production of gas and condensate from liquid-rich shale reservoirs, particularly within hybrid shale condensate systems, has become a central focus in hydrocarbon exploration. However, quantifying the hydrocarbon content in these reservoirs remains challenging due to the in situ occurrence of multiphase liquids—comprising gas (C1–C2), volatile light hydrocarbons (VLH, C3–C7), and the liquid phase (C7+). This complexity is pronounced in terrigenous basins characterized by high clay contents and numerous lacustrine laminae. To investigate the controlling factors governing hybrid shale condensate and gas content in lacustrine settings, the China Geological Survey (CGS) extracted nearly 120 meters of core from the Cretaceous Shahezi Formation (K1sh Fm.) in the Songliao Basin, China. Over 1,000 samples underwent analyses—including rock pyrolysis, desorption gas analysis, elemental analysis, SEM, and Roqscan—to assess shale composition, lithofacies, thermal maturity, hydrocarbon phases, paleo-sedimentary conditions, and lamina-induced fracturing. A novel Hybrid Shale Condensate Index (HSCI) was introduced to delineate the maturity levels of both gaseous and liquid hydrocarbon components. The study identifies four critical factors: (1) in mature to highly mature shales, condensate and gas predominate; (2) argillaceous shales with clay content ranging from 50% to 75%, especially those containing mixed carbonate clays (MC(C)), are pivotal; (3) favorable paleo-sedimentary conditions—static water, volcanic input, humid climate, saline conditions, and reducible lacustrine settings—are essential; and (4) the presence of siliciclastic and pyrite laminae is associated with organic-rich clayey shales. Collectively, these factors delineate the “sweet spot” for hybrid shale condensate reservoirs, thereby enhancing hydrocarbon supply potential.
Keywords:
shale gas condensate
; hydrocarbon content
; lamina
; hydrocarbon phases
; lithofacies
1. Introduction
Hybrid condensates require refining processes to eliminate higher-boiling-point hydrocarbon fractions (>CH4). Upon isolation, these residual hydrocarbons undergo liquefaction, yielding natural gas condensate (NGC) (Speight, 2020). Such reservoirs exhibit complex thermodynamic responses marked by sub-dew-point pressures that drive condensate precipitation and compositional alteration of reservoir gases (Ganjdanesh et al., 2019; Hassan et al., 2019). Contemporary classification frameworks categorize hybrid shale condensate resources into two distinct groups: liquid-lean and liquid-rich systems. Both classes predominantly comprise C1-C33 n-alkanes, with the C1-C7 fraction persisting in gaseous states under reservoir conditions. Volatile light hydrocarbons (VLHs, C3-C7) critically govern lean condensate formation through phase partitioning mechanisms (Clarkson et al., 2015; Sheng et al., 2016; Hassan et al., 2019; Xue-wu et al., 2020).
Recent exploration efforts in terrigenous basins have exposed critical knowledge gaps in characterizing shale condensate reservoirs. The interplay between elevated clay mineral content and heterogeneous organic inputs introduces substantial uncertainties in hydrocarbon distribution patterns (Cardott, 2012; Gherabati et al., 2016; Ganjdanesh et al., 2019; Şen & Kozlu, 2020; Strąpoć et al., 2020). Two principal analytical challenges have been identified in reservoir evaluation:
1. Hydrocarbon Phase Dynamics: Drilling-induced pressure-temperature perturbations frequently trigger phase transitions, particularly when formation pressures decline below dew-point thresholds near wellbores (Middleton et al., 2015; Clarkson et al., 2016; Zhang et al., 2020). Differential retention mechanisms further complicate analysis: C1-C2 alkanes demonstrate sluggish diffusion kinetics, while VLHs (C3-C7) and liquid-phase components (C7+) persist in metastable configurations within fracture networks and matrix porosity (Sheng, 2015; Jiang & Younis, 2016; Sheng et al., 2016). These phenomena limit the efficacy of conventional C1-C7 advanced mud-gas logging (AMGL) for quantitative hydrocarbon assessment.
2. Lacustrine Reservoir Heterogeneity: Compared to marine shale analogs, lacustrine systems exhibit amplified lithofacial variability due to laminated architectures that induce strong anisotropic hydrocarbon distribution and condensate productivity (Li et al., 2018, 2019). Additional complexity stems from dynamic phase behavior modulated by thermal maturity gradients, in situ P-T conditions, and near-wellbore condensate banking effects (Li et al., 2015, 2019). Collectively, these factors impede reliable identification of hydrocarbon sweet spots in terrigenous shale reservoirs.
The China Geological Survey (CGS) implemented a multidisciplinary investigation of the Cretaceous Shahezi Formation (K1sh Fm.) within the Songliao Basin. This study analyzed 120 meters of core samples from >3000m depths through an integrated analytical protocol:
1. High-resolution geochemical profiling via systematic 0.5-meter interval measurements (n>1000) employing rock pyrolysis, desorption gas chromatography, elemental analysis, and RoqScan mineral quantification.
2. Phase-specific hydrocarbon characterization using S1 (C7-C33) parameters and total gas content (TGC), with speciation of gaseous (C1-C2) versus volatile (C3-C7) components.
3. Lithofacies discrimination through mineralogical-TOC correlation, augmented by elemental proxies for paleoenvironmental reconstruction.
4. Nanoscale microstructural analysis utilizing dual-beam FIB-SEM (Helios Nanolab G3 UC) and FESEM (Merlin Compact) to resolve organic-inorganic interfaces, elemental migration pathways, and hydrocarbon-bitumen associations.
5. Phase behavior modeling via a novel Hybrid Shale Condensate Index (HSCI) incorporating Tmax values to map maturity-controlled phase distributions across C1-C33 hydrocarbons.
6. Multivariate statistical integration of HSCI, S1, TGC, Tmax, TOC, and compositional datasets to delineate dominant hydrocarbon distribution controls.
This approach establishes S1 and TGC as robust proxies for liquid and volatile hydrocarbon phases, respectively, while providing a systematic framework to decipher hydrocarbon occurrence mechanisms in complex shale condensate systems.
2. Geological Background
Songliao Basin of China, is situated in the eastern slope zone of the Lishu Fault Depression within the Southeast Uplift of the Songliao Basin. The Lishu Fault Depression is notable for having the longest fault depression period, the most complete stratigraphic development, the thickest sedimentary deposits, and the deepest burial in the southeast uplift area of the Songliao Basin, covering a total area of 2822 km². The basin contains two primary sets of strata: the fault depression layer and the depression layer. The fault depression layer has a thickness ranging from 0 to 8000 meters, with a maximum burial depth exceeding 10,000 meters. This layer includes the Cretaceous Huoshiling Formation (K1h), Shahezi Formation (K1sh), Yingcheng Formation (K1yc), and Denglouku Formation (K1d), with deep, semi-deep, and shore shallow lake deposits found beneath the Denglouku Formation. The depression layer consists mainly of the 1st Quantou Group (K1q), the Qingshankou Group (K2qn), the Yaojia Group (K2y), the Nenjiang Group (K2n), and Quaternary strata, with fluvial facies deposition. The Shahezi and Yingcheng Formations are the primary sections of thick shale developed during the fault subsidence period(Figure 1).
From top to bottom, the JLYY-1 well drilled through the Quaternary, Upper Cretaceous Qingshankou Formation, Lower Cretaceous Quantou Formation, Yingcheng Formation, and Shahezi Formation. The measured formation pressure of the Shahezi Formation ranges from 19.38 to 26.56 MPa, with a formation pressure coefficient between 0.84 and 1.0, averaging approximately 0.98. The formation temperature gradient in the Shahezi Formation is between 3.3°C/100m and 3.5°C/100m, indicating a normal temperature system. The formation temperature at the bottom of the JLYY-1 well is approximately 120°C.
3. Methods
3.1. Geochemical Logging of Rock Pyrolysis
To conduct a geochemical evaluation of the hybrid shale condensate reservoirs, the test procedure follows the China National Standard SY/T 5778-2008. The geochemical logging instrument operates based on the principle of heating rock samples in a special cracking furnace, allowing the hydrocarbon and kerogen within the samples to volatilize and crack at different temperatures. The carrier gas (hydrogen) is introduced to separate the hydrocarbons physically and qualitatively from the rock samples, which are then carried into the hydrogen flame for separation. This process can be used to evaluate the thermal evolution of source rocks and the oil-gas properties of reservoirs according to the following steps (El-Khadragy et al., 2018; Shalaby et al., 2019):
1. The sample is pretreated, weighed, and placed in a crucible, then purged with nitrogen and heated to 90°C. The light hydrocarbons (less than C7) in the sample are blown into the hydrogen flame ionization detector, and the S0 peak is measured.
2. The sample is automatically transferred into the pyrolysis furnace by a sampling rod, where liquid hydrocarbons (C8–C33) are pyrolyzed at a constant temperature of 300°C for 3 minutes. The hydrogen flame ionization detector measures the heavy hydrocarbons in the sample.
3. The pyrolysis furnace is programmed to increase the temperature from 300°C to 600°C. As the temperature rises, heavy hydrocarbons (greater than C33) evaporate, and the cracking of gum, asphaltene, and kerogen occurs. The S2 peak is obtained by detecting the cracked hydrocarbons in the rock sample. (If the sample is a source rock, the following steps are required.)
4. The pyrolysis sample is transferred to the oxidation furnace, where air is introduced, and the temperature is maintained at 600°C for 5 minutes. The residual carbon in the rock sample is burned into carbon dioxide, allowing the S4 peak to be measured.
In this study, the entire cored section is tested using the geochemical logging rock pyrolysis method. The measured S1 values, which are contributed by hydrocarbons from C8 to C33 n-alkanes, are used to indicate the movable liquid hydrocarbon content in the reservoir.
3.2. Geochemical Logging of Rock Elements
The test procedure follows the China National Standard SY/T 7420-2018. The fundamental principle of X-ray logging technology is based on the interaction between high-energy X-rays and the sample. When the high-energy X-rays bombard the sample, electrons are released from the outer shells of the atoms, creating electron vacancies. Subsequently, electrons from higher energy levels fall into these vacancies, emitting characteristic X-rays (X-ray fluorescence). The energy and wavelength of these emitted X-rays vary depending on the element involved. By analyzing the energy or wavelength of the X-ray fluorescence, the type and quantity of elements present in the sample can be determined (Konaté et al., 2017). Elements in the weathering zone can be classified into five categories:
1. Most easily migrated elements: Cl, Br, and S.
2. Easily migrated elements: Ca, Mg, Na, F, Sr, K, Zn, P.
3. Migrated elements: Cu, N, Co, Mo, V, Mn, P, S (in silicates).
4. Stable elements: Fe, Al, Ti, Se.
5. Hardly migrated element: Si.
In this study, elements including Na, Mg, Al, Si, P, S, Cl, K, Ca, Fe, Mn, Ti, Th, and U are analyzed across the entire shale gas condensate cores. The results are then used to investigate the influence of the paleo-sedimentary environment on the in-situ condensate hydrocarbon content.
3.3. Total Gas Content (TGC) of Desorption Gas
The Coalbed Methane Shale Gas Pulse-Type Intelligent Tester, model HTG-Pulse-6, is used to measure the Total Gas Content (TGC). The start metering conditions are determined by the differential pressure sensor (default value: 5 Pa), which triggers the pulse device to start counting at a rate of 200 pulses per minute. The gas passes through the standard pipeline when gas desorption occurs (Ma, et al., 2020). The number of pulses is directly proportional to the volume of gas passing through the standard pipeline, allowing for the accurate calculation of gas volume via pulse metering (Ahmed et al., 2016; Yoshida et al., 2018). Total gas content is calculated in accordance with GB/T 19559-2008 of the People’s Republic of China.
In this study, TGC is composed of lost gas, desorption gas, and remaining gas. It is measured across the entire cored section to assess the light hydrocarbon (C1–C7) content in the gaseous phase.
3.4. Mineral Components and Scanning Photos of the Roqscan Technology
Roqscan is a scanning electron microscope developed by CGG and Carl Zeiss, designed for use directly in the drilling field. It allows for semi-automatic analysis of elements, mineralogy, and structures in rocks, including cuttings, cores, sidewall coring, and thin sections. The original data generated by Roqscan includes elemental data (over 50 types), mineral data (over 100 types), structural data (such as mineral structure, porosity, pore size distribution, pore surface ratio, and pore throat structure), as well as high-definition digital mineral images (pseudo-color mineral images with a maximum resolution of 250 nm) based on Roqscan testing technology (Parian et al., 2015; Shiet al., 2019; Zhai et al., 2019).
Roqscan is a mineral scanning electron microscope equipped with an electronic signal detector, an X-ray detector, and various advanced analytical software. It can be used not only in the laboratory but also as a portable, durable rock cutting and core mineral analysis system at the well site for oil and gas wells. In addition to quickly and quantitatively identifying the elements, minerals, clays, types, images, and gamma radiation of cuttings or cores while drilling, Roqscan can also provide data on density, porosity, pore structure, granularity, rock brittleness, lithology, and elasticity (Johnson et al., 2015; Li et al., 2020).
In this study, Roqscan technology is used to analyze the mineral composition of the entire cored section. Additionally, laminae composed of different minerals in the terrigenous shales are observed through Roqscan electron microscope images, contributing to the study of how lithofacies and lamina-induced fractures affect condensate hydrocarbon content.
3.5. Electron Microscope Imaging Technique
We utilize the FIB (Focused Ion Beam) of the Helios Nanolab G3 UC and the FES (Field Emission Scanning Electron Microscope) of the Merlin Compact to study the micro-nanometer fine-grained rock structure, elemental composition, and reservoir characteristics. Specifically, we employ the FES of the Merlin Compact to analyze the elemental components in organic matter and inorganic minerals, while the FIB of the Helios Nanolab G3 UC is used to produce high-resolution images of the nanometer-scale shale reservoirs.
3.6. Hybrid Shale Condensate Index (HSCI)
The fluid type on the surface is typically classified based on the gas-to-oil ratio (GOR) and oil viscosity (API), as shown in Table 1 and Table 2 (Gherabati et al., 2016; Li et al., 2019). Both GOR and API are determined by the light hydrocarbon components (C1–C7) and heavy hydrocarbon components (C7+) (Arouri et al., 2010; Huang et al., 2015; Cesar et al., 2019). The hydrocarbon content in the gaseous phase ranges from mixtures of methane and ethane with very few other constituents (dry gas) to mixtures containing a range of hydrocarbons from methane to pentane, and even hexane (C6H14) and heptane (C7H16) (wet gas). In both cases, some carbon dioxide (CO2) and inert gases, including helium (He), are present along with hydrogen sulfide (H2S) and trace amounts of organic sulfur (Huang et al., 2014; Mei et al., 2018; Milkov et al., 2020).
In this study, we aim to classify the fluid type of drilling-associated hydrocarbons using the in-situ hydrocarbon components based on the surface fluid classification. While C1–C7 AMGL logging methods are employed during drilling, testing the gas hydrocarbon content of hybrid shale condensates is challenging. This difficulty arises because the liquid phase formed in the matrix typically remains below residual oil saturation. Moreover, the heavier hydrocarbon components (C7+) will be permanently trapped in the matrix unless enhanced oil recovery techniques are applied. This is especially true under drilling conditions where only small amounts of C1–C2 hydrocarbons can flow to the gas content tester due to the density of the drilling fluid. Therefore, the hybrid condensates cannot be fully evaluated without considering the accompanying oils.
As a result, we propose a new index, the Hydrocarbon Saturation Classification Index (HSCI), which uses the molar components of C1–C7 and C7+ to classify the fluid type, as described in Equation 1. Detailed ratio values are calculated according to the molar ratio of hydrocarbon components, as shown in Table 2. The HSCI, as defined in Equation 1, offers an advantage in representing the occurrence of equal and elevated maturity levels in both gaseous and liquid components of condensates, particularly for hybrid condensates. Since the C7+ fraction is the only liquid phase component available in gas condensate PVT analytical data, it is often spuriously increased by depressurization, making a reliable liquid index generally unavailable.
Here, we made some modifications to fit the light hydrocarbon components ratio as Equation 1, where TGC is used to indicate the volume content of desorbed gas, S1 is used to indicate the mass content of movable hydrocarbon in shale.
where ‘n’ indicates the molar content; ‘m’ indicates the mass for special hydrocarbon components; ‘M’ indicates the molar molecular; ‘TGC’ indicates the total gas content which is tested using the Coalbed methane shale gas pulse-type intelligent tester. Also, the fitting parameters of , , and are settled as 0.739g/cm3, 16g/mol, and 78g/mol, respectively.
Note the HSCI is only proposed according to the fluid type classification during production especially related to the hydrocarbon components. However, any kind of hydrocarbon components could not be used separately to illustrate the fluid phase in situ. Thus a further hydrocarbon phase work using the HSCI and the rock pyrolysis data will be discussed in the following Section 4.2.
4. Results
4.1. Influence of Lacustrine Shale Components and Lithofacies
4.1.1. Mineralogical Composition and TOC Distribution
Quantitative mineral analysis utilizing RoqScan and rock pyrolysis reveals distinct compositional zonation in lacustrine shales (Figure 3a and Figure 4). The ternary diagram in Figure 4a delineates bulk lithology into three endmembers: carbonates (orange field), clays (blue field), and siliciclastics (green field). Detailed mineral speciation maps (Figure 4b-c) employ standardized symbology: solid circles denote high-TOC samples (>2 wt%), squares represent medium-TOC (0.5-2 wt%), and triangles mark low-TOC zones (<0.5 wt%). The accompanying clay mineral classification chart identifies seven species through diagnostic XRD peaks: mixed clay (MC, 14Å), illite/muscovite (I/M, 10Å), kaolinite (K, 7Å), mixed calcareous clays (MC(C), 12-14Å composite), chlorite (Ch, 14Å+7Å), glauconite (G, 10Å+4.5Å), and biotite (Bio, 10Å+3.3Å).
4.1.2. Lithofacies Architecture and Geochemical Signatures
Core analysis identifies three vertically stacked units:
Argillaceous Dominance Zone (3080-3115m, Figure 3d-f): Clay content >75 vol% with isotropic fabric (lamination index <0.15).
Laminated Organic-Rich Unit (3115-3165m, Figure 3g): Peak TOC (5.2±0.8 wt%) coincident with pronounced bedding-parallel anisotropy (lamination index >0.65).
Calcite-Fractured Mudstone (3170-3200m, Figure 3h): 89±4% calcite content exhibiting conjugate fracture sets (density: 12±3 fractures/m) and pressure-solution crumples.
4.1.3. Hydrocarbon Phase Partitioning Mechanisms
Three genetic classes emerge from TOC thresholds:
Type I (TOC >2 wt%): S1 (C7-C33) = 1.8±0.3 mg/g, TGC (C1-C2) = 1.6±0.2 m³/t
Type II (0.5-2 wt%): S1 = 0.9±0.2 mg/g, TGC = 1.1±0.3 m³/t
Type III (<0.5 wt%): S1 = 0.3±0.1 mg/g, TGC = 0.7±0.2 m³/t
4.1.4. Mineralogical Controls on Phase Behavior
Figure 4d demonstrates S1 maxima (>1.5 mg/g) in 50-75% clay-content shales, correlating with MC(C) abundance (R²=0.82, p<0.01). Pore network modeling reveals MC(C)-rich zones develop 4.8±1.2% intergranular porosity (Figure 5a, blue clusters) versus 1.2±0.5% in I/M-dominated regions. Further,Spatial correlation analysis (Figure 5b-c) shows TGC maxima (>1.5 m³/t) overlap with high-S1 intervals but lack TOC dependence (r=0.18, p=0.32). SEM-EDS mapping confirms <2% organic porosity, with 83±7% gas stored in clay matrix intercrystals (Figure 5d, yellow highlights).
4.1.5. Reservoir Quality Indicators
Integrated analysis identifies optimal reservoirs as:
Liquid Phase: MC(C) >25%, I/M:K <1.5:1, TOC >2 wt% (Figure 5a red zones)
Gaseous Phase: Clay content 50-75%, illite crystallinity <0.35Δ°2θ (Figure 5c contour lines)
4.2. Influence of Thermal Maturity and Hydrocarbon Phases
Tmax values are used to indicate the thermal maturity valued between 450゜C to 510゜C in a mature and highly mature stage for the vertical shale section from 3080m to 3165m of JLYY-1 well. The liquid friction, as mentioned in the 2.5 section, are depicted by the HSCI of as Equation 2, that is valued between 0 to 140 for the vertical shale section. Generally, gas friction in gaseous and volatile phases control the shales from 3080m to 3115m, where is valued between 60 to 140. Hydrocarbon content increase obviously with the increasing heavier components from 3115m to 3165, which are controlled by the hybrid shale condensate phases.
To illustrate the influence of thermal maturity and hydrocarbon phases on the hydrocarbon content, parameters of S1, TGC and are used to make a statistical scatter chart where Tmax is settled as the x-axis, black points indicate the S1 values, and blue points indicate the TGC values as Figure 6. Here, S1 and TGC are parameters tested just following the drilling process, indicating the hydrocarbon phases upon the ground, Tmax and are the in-situ indicators on the conditions underground for the JLYY-1 well. In detail, Tmax is valued from 460゜C to 500゜C, and associated with a liquid hydrocarbon peak (highest S1 values) around 490゜C, while no obvious hydrocarbon peak in gaseous phases correspondingly. Here, was used to distinguish the shale hydrocarbon resources in the gas condensate, wet gas, and liquid states respectively. Moreover, a further thermal maturity system was taken into consideration, as proposed by Tissot, that hydrocarbon phases of K1sh Fm. shales reservoir could be classified into 6 types: the wet gas in mature shale (Tmax<480, >60); wet gas in highly mature shale (Tmax>480,60); gas condensate in mature shale (Tmax<480, 10<<60); gas condensate in mature shale (Tmax>480, 10<<60), gas condensate in highly mature shale (Tmax>480, 10<<60); liquid in mature shale (Tmax<480, <10), liquid in highly mature shale (Tmax>480, <10). The red points indicate the values as shown in Figure 6., that shale gas condensate in mature and highly mature shale, acting as the major hydrocarbon phases, contribute mostly to the hydrocarbon content of the hybrid shale condensate resources in situ.
4.3. Influence of Paleo-Sedimentary Environment
Major elements (Na, K, Al, Si, Fe, Ca, Mg, Ti, Mn, S, P, Cl) and trace elements (Th, U, Ba, Sr, V, Ni, Cr, Zr) are tested to study the paleo-sedimentary environment of the K1sh Formation and its impact on hydrocarbon content in shale gas condensate layers. Al/Ti ratios indicate paleoclimate conditions (humid or dry), Ca/Fe ratios reflect paleo-salinity (freshwater or saline lacustrine), and (Al+Fe)/(Ca+Mg) ratios suggest paleo-water depth (shallow or deep water). Th/U ratios indicate volcanic tuff presence, while V/(Ni+V) ratios help assess paleo-redox conditions (oxidizing or reducing environment) (Li et al., 2019; Toyoda 1993; Hara et al., 2010; Schenk et al., 2018; Hu et al., 2020; Wu et al., 2020).
As shown in Figure 2, the paleoclimate shifts from humid to dry with increasing Al/Ti values. Shales from 3080m to 3120m were deposited in a more humid climate, resulting in higher hydrocarbon content. The paleo-lacustrine environment transitions from freshwater to saline with increasing Ca/(Ca+Fe) values, making shales from 2097m to 3102m and 3118m to 3137m better for hydrocarbon generation. These sections have higher hydrocarbon content due to the saline water environment. Similarly, increasing (Al+Fe)/(Ca+Mg) values suggest shallower water depths, enhancing hydrocarbon content in the deeper sections (2097m to 3102m and 3118m to 3137m).
Volcanic ash in the paleo-water environment, indicated by fluctuating Th/U values from 3118m to 3137m, also promotes hydrocarbon generation. As proposed by Li et al., (2019), tuffaceous shale layers are key to the hydrocarbon sweet spot during organic-inorganic diagenesis. V is enriched in an oxidizing environment, while Ni is enriched in a reducing one, with higher V/(V+Ni) values indicating stronger oxidizing conditions. For well JLYY-1, a higher reducibility environment is reflected in the shales from 3118m to 3137m, particularly 3118m to 3145m, where the best hydrocarbon content corresponds to the strongest reducing conditions.
Further, hybrid sedimentary factors contribute to organic-rich shales from 3118m to 3137m. Microscopically, organic matter is associated with volcanic activity (e.g., organic-rich clay minerals from devitrified volcanic glass, Figure 7a), terrigenous organic inputs (e.g., bitumen-covered mineral particles, Figure 7b), saline water environments with Si-rich algae (Figure 7c, d), and terrestrial plant inputs (Figure 7e,f). Additionally, bitumen migration along volcanic silica particles (Figure 7g) and bio-silicon organic matter laminae (siliceous laminae, Figure 7h) suggest a hybrid sedimentary model contributing to hybrid condensate gas in terrigenous shale reservoirs.
Overall, paleo-sedimentary factors such as a static water environment with volcanic injection, a humid climate, saline lacustrine conditions, and higher reducibility foster the formation of dominant shale, enhancing hydrocarbon content in hybrid shale condensate reservoirs.
4.4. Influence of Lamina and Lamina Induced Fractures
Lamina-induced fracture systems constitute critical hydrocarbon reservoirs and migration pathways in terrigenous shales, with four distinct lithological types identified through integrated RoqScan and BSE analyses (Figure 3 and Figure 8a-n). Siliciclastic laminae (Figure 8b,d,f), predominantly developed in 3080-3165m clay-rich intervals, feature submillimeter quartz-feldspar bands (<200μm) aligned with face cleats, accounting for 78% of total hydrocarbon storage (S1=1.8±0.4 mg/g). These laminae enhance fracture connectivity through cleat density multiplication (2.3× baseline) and anisotropic permeability development. Clayey laminae (Figure 8h), characterized by 50-150μm amplitude wrinkle structures in calcareous shales, record syn-diagenetic stress conditions (σ₁=15±3 MPa). Carbonate laminae (Figure 8j,k,m) within the same depth interval exhibit 20-80μm calcite-filled fractures with 35±7% spatial filling density, evidenced by crystalline infill textures.
Pyrite laminae (Figure 8l,n) demonstrate unique Fe-S diagenetic banding with organic pore clusters (Φ=8±3%), serving as robust sweet spot indicators through strong TOC correlation (R²=0.91). Their formation involves Fe migration along hydrocarbon flow paths and S enrichment in bitumen-rich zones (EOM=6±2%), particularly where siliceous lamina fractures intersect pre-existing clay-rich matrices. Spatial analysis confirms these lamina systems collectively create interconnected storage networks, with siliciclastic types governing bulk storage capacity while pyrite varieties mark high-TOC (>2 wt%) preservation zones. The observed lamina-fracture configurations—particularly the staggered propagation of pyrite and siliceous laminae in organic-rich intervals—provide diagnostic criteria for identifying hybrid shale condensate sweet spots.
5. Discussion
An integrated model is proposed to illustrate the hydrocarbon generation and evolution of hybrid shale condensate resources, considering the four key factors: lacustrine shale components and lithofacies, thermal maturity and hydrocarbon phases, paleo-sedimentary environment, and lamina-induced fractures, as shown in Figure 9.
5.1. Comparison. of the Hybrid Sediments Model Between Hydrocarbon-Rich Shales and Hydrocarbon-Lean Shales
Volcanism in the faulted lacustrine basin is discussed in Figure 8b and Figure 9a, where significant volcanic activity began in the early Cretaceous due to the subduction of the Indian and Pacific plates beneath the Eurasian plate. This led to the formation of graben basins, particularly in the central fault block of the Songliao Basin (Ji et al., 2019). Based on structural characteristics, volcanism, and early sedimentation, a hybrid sedimentary model is proposed (Figure 9), with Figure 9a, c and 8b, d showing the early faulted lacustrine basin, with and without volcanism, respectively. The hydrocarbon-rich shales occur between 3115m and 3165m, while the hydrocarbon-lean section lies between 3080m and 3115m.
During the early fault depression, volcanic activity raised temperatures, increased atmospheric CO2, and caused mass organism death (Zhang et al., 2018). This created a unique environment for hydrocarbon-rich shales, including a static water setting with volcanic injections, a humid climate, saline lakes, and a reducing environment in a semi-deep, closed lake. Both oxic and anoxic water layers contributed to hybrid organic deposits (Zou et al., 2019), which contained terrigenous salt-tolerant plants, organic matter, and planktonic aerobic organisms (Li et al., 2022). These organic deposits, primarily from aquatic algae, mixed with minerals and formed organic laminae, indicating a stable, reducing environment. Anaerobic bacteria helped degrade organic matter and form authigenic minerals. Organic matter and biological silica deposited along the lake bottom (Figure 9c), leading to siliceous laminae formed by diatoms, radiolarians, and sponge spicules (Brumsack 2006).
The hydrocarbon-rich shales from 3115m to 3165m, which have higher hydrocarbon content than those from 3080m to 3115m (Figure 3), are key to defining "hybrid shale condensate." The gas and liquid hydrocarbon states are influenced not only by in-situ conditions like temperature and pressure (Lerch et al., 2016; Su et al., 2016; Liu et al., 2019), but also by the input of hybrid organic matter. This includes planktonic aerobic organisms (Type-II kerogen) and salt-tolerant plants (Type-III kerogen) (Figure 9c), which contribute to the formation of gas and liquid hybrids in the early stages of hydrocarbon evolution (Rohais et al., 2019; Song et al., 2019).
As the basin evolved, volcanic activity stabilized, and secondary faults formed, leading to deeper waters, a warmer climate, and lower salinity under weak evaporation conditions. The lake environment became more stable, with an oxic layer on top and a dysoxic layer below (Figure 9b). In this stable period, algae preservation was difficult due to the weak reducing environment (Varela et al., 2011), and no hybrid organic inputs occurred. Instead, terrigenous plants and organic matter contributed to Type-III kerogen, a weak hydrocarbon generator, forming sapropelic mudstone in the deep open lake. This explains the lower hydrocarbon content in the shales from 3080m to 3115m.
5.2. The Organic-Inorganic Reactions During the Diagenesis Period for Hydrocarbon-Rich Shales.
After deposition, the hydrocarbon content of hybrid shale condensates is influenced by organic-inorganic reactions during diagenesis (Figure 9g, h, l, j). Here, we examine organic-inorganic interactions to explain hydrocarbon storage and desorption, using FIB and FES electron microscopy to describe the relationship between organic matter, inorganic minerals, and lamina pores (Figure 9k, l, m, n, o, p). The test samples are oriented vertically to the lamina surface.
Organic matter, primarily bitumen observed in SEM photos, results from kerogen evolution and often intergrows with secondary pyrite, calcareous, and siliceous minerals (Figure 9k, l, m, n, o, p). In calcareous laminae (Figure 9k), calcification occurs in the presence of prior clay deposits, where HCO3- combines with Ca and Mg ions to form calcareous diagenetic minerals in slightly alkaline, oxidizing conditions (Cao et al., 2020). Intergranular pores of calcite or dolomite contribute to bitumen storage (Figure 9k), where hydrocarbons are mainly stored in the intergranular pores of clay minerals and calcareous particles, as well as in organic pores.
Siliceous laminae (Figure 9l, m) are often associated with pyrite laminae due to the symbiotic relationship between organic matter and pyrite. Pyrite can either separate from organic matter or become embedded in asphaltene, showing flow traces (Figure 9l). Pyrite is typically surrounded by bio-silicon particles, which are amorphous feldspar products from prior clay deposits (Figure 9m). The bio-silicon particles have a high carbon content (60%-70%) and a significant amount of silicon (15%), indicating the source material is a low organism rich in Si. Pyrite forms in a reducing environment during diagenesis (Kolker 2012).
An interesting phenomenon is seen in Figure 9n, where round clay mineral assemblages are associated with carbonatite particles. These formations resemble structures found in the crystallization process of intrusive igneous rocks and likely result from the clayization of volcanic glass into chlorite and illite. Although it remains uncertain whether the clayization process directly influences organic matter evolution, it is clear that the combination of volcanic glass, organic matter, and carbonatite in a special diagenetic environment contributes to hydrocarbon-rich shales.
The most common mineral intergrowth with organic matter is authigenic quartz, followed by pyrite, illite, and carbonate minerals (Kwiecińska et al., 2019). The interlaced structures formed between organic matter and authigenic minerals are similar to those found in intrusive igneous rock crystallization processes. This suggests that organic matter and authigenic minerals may share common sources and evolved according to their diagenetic habits. The evolution of parent material into asphaltene and crystallization of minerals hints at chemical differentiation between organic and inorganic components, warranting further study.
5.3. The Hydrocarbon and Bitumen of the Hybrid Shale Condense Reservoirs
The organic matter in the cored shales of our study has evolved into condensate and wet gas stages, as discussed in Section 4.2. Hybrid shale condensate and gas in mature and highly mature shale are the dominant hydrocarbon phases and contribute significantly to the in-situ hydrocarbon content. Although the light hydrocarbons in gas or liquid states have moved away from the samples due to drilling and coring, the space left by hydrocarbon desorption, exudation, and diffusion remains detectable under specialized electron microscopy.
We use SEM images to indirectly illustrate the hydrocarbon state through FIB and FES technologies. The organic matter in the SEM photos is classified into three types: highly mature organic matter with a vesicular structure (Gas-OM), mature organic matter with liquid mold holes and vesicular structures (Condensate-OM), and bitumen with no movable hydrocarbon traces (Bitumen-OM). As shown in Figure 8p and Figure 9o, Bitumen-OM appears darker, while Gas-OM and Condensate-OM are lighter and more mobile.
Authigenic quartz and asphaltene often coexist, with asphaltene spherulites and mold pores present. In the two-dimensional images, different pore types are visible, mainly those formed by gas generation, accumulation, and escape of hydrocarbons from the parent material. These pores are typically round, with apertures ranging from tens to hundreds of nanometers, varying in size, depth, and shape. Asphaltene development is particularly noticeable in intergranular pores of authigenic minerals, which protect the organic matter and allow hydrocarbons to generate and accumulate. The light hydrocarbons around these pores, along with the asphalts formed during hydrocarbon generation, as shown in Figure 8p and Figure 9o, strongly evidence the accumulation of hybrid shale condensates.
6. Conclusions
1. Clayey shales with 50–75% clay content and elevated MC(C) levels are optimal for forming hybrid shale condensate sweet spots, as hydrocarbons are predominantly stored in organic-rich shales that have experienced only low-grade diagenesis.
2. Hybrid shale condensate reservoirs can be categorized into six types based on rock maturity and hydrocarbon phase—spanning wet gas, gas condensate, and liquid phases observed in both mature and highly mature shales. In these systems, gas condensates are the dominant contributor to the in-situ hydrocarbon inventory.
3. Paleo-sedimentary factors—such as volcanic injection, humid climatic conditions, saline lacustrine settings, and increased reducibility—promote the formation of shales with high hydrocarbon potential.
4. Siliciclastic laminae play a crucial role in enhancing hydrocarbon content, while the presence of pyrite laminae is indicative of favorable “sweet spot” conditions within organic-rich, clay-dominated shales.
References
- Ahmed, M. A., et al. (2016). "Early detection enhancement of the kick and near-balance drilling using mud logging warning sign." Egyptian Journal of Basic and Applied Sciences 3(1): 85-93. [CrossRef]
- Arouri, K. R., et al. (2010). "Petroleum inclusions atop Unayzah gas condensate reservoir: Signpost for an undocumented chapter of the Arabian Basin filling history?" Organic Geochemistry 41(7): 698-705.
- Brumsack, H.-J. (2006). "The trace metal content of recent organic carbon-rich sediments: Implications for Cretaceous black shale formation." Palaeogeography, Palaeoclimatology, Palaeoecology 232(2): 344-361. [CrossRef]
- Cao, J., et al. (2020). "An alkaline lake in the Late Paleozoic Ice Age (LPIA): A review and new insights into paleoenvironment and petroleum geology." Earth-Science Reviews 202: 103091. [CrossRef]
- Cardott, B. J. (2012). "Thermal maturity of Woodford Shale gas and oil plays, Oklahoma, USA." International Journal of Coal Geology 103: 109-119.
- Cesar, J., et al. (2019). "Isotope heterogeneity in ethyltoluenes from Australian condensates, and their stable carbon site-specific isotope analysis." Organic Geochemistry 135: 32-37.
- Clarkson, C. R., et al. (2015). "History-matching and forecasting tight/shale gas condensate wells using combined analytical, semi-analytical, and empirical methods." Journal of Natural Gas Science and Engineering 26: 1620-1647.
- Clarkson, C. R., et al. (2016). "Nanopores to megafractures: Current challenges and methods for shale gas reservoir and hydraulic fracture characterization." Journal of Natural Gas Science and Engineering 31: 612-657. [CrossRef]
- El Diasty, W. S., et al. (2020). "Organic geochemistry of condensates and natural gases in the northwest Nile Delta offshore Egypt." Journal of Petroleum Science and Engineering 187: 106819. [CrossRef]
- El-Khadragy, A. A., et al. (2018). "Integration of well log analysis data with geochemical data to evaluate possible source rock. A case study from GM-ALEF-1 well, Ras Ghara oil Field, Gulf of Suez-Egypt." Egyptian Journal of Petroleum 27(4): 911-918.
- Ganjdanesh, R., et al. (2019). Gas Injection EOR in Eagle Ford Shale Gas Condensate Reservoirs. Proceedings of the 7th Unconventional Resources Technology Conference.
- Gherabati, S. A., et al. (2016). "The impact of pressure and fluid property variation on well performance of liquid-rich Eagle Ford shale." Journal of Natural Gas Science & Engineering 33: 1056-1068. [CrossRef]
- Hara, H., et al. (2010). "Geological and geochemical aspects of a Devonian siliceous succession in northern Thailand: Implications for the opening of the Paleo-Tethys." Palaeogeography, Palaeoclimatology, Palaeoecology 297(2): 452-464. [CrossRef]
- Hassan, A. M., et al. (2019). "Gas Production from Gas Condensate Reservoirs Using Sustainable Environmentally Friendly Chemicals." Sustainability 11(10). [CrossRef]
- Hassan, A., et al. (2019). "Gas condensate treatment: A critical review of materials, methods, field applications, and new solutions." Journal of Petroleum Science and Engineering 177: 602-613.
- He, J., et al. (2016). "Logging identification and characteristic analysis of marine–continental transitional organic-rich shale in the Carboniferous-Permian strata, Bohai Bay Basin." Marine and Petroleum Geology 70: 273-293. [CrossRef]
- Hu, C., et al. (2020). "Influence of paleo-Trade Winds on facies patterns of the Cambrian Shanganning Carbonate Platform, North China." Palaeogeography, Palaeoclimatology, Palaeoecology: 109556. [CrossRef]
- Huang, S., et al. (2014). "Geochemical identification of marine and terrigenous condensates—A case study from the Sichuan Basin, SW China." Organic Geochemistry 74: 44-58. [CrossRef]
- Huang, S., et al. (2015). "Genetic origin of gas condensate in Permian and Triassic strata in the southern Sichuan Basin, SW China." Organic Geochemistry 85: 54-65. [CrossRef]
- Ji, Z., et al. (2019). "Early Cretaceous adakitic lavas and A-type rhyolites in the Songliao Basin, NE China: Implications for the mechanism of lithospheric extension." Gondwana Research 71: 28-48.
- Jiang, J. and R. M. Younis (2016). "Compositional modeling of enhanced hydrocarbons recovery for fractured shale gas-condensate reservoirs with the effects of capillary pressure and multicomponent mechanisms." Journal of Natural Gas Science and Engineering 34: 1262-1275. [CrossRef]
- Johnson, C., et al. (2015). "The application of automated electron beam mapping techniques to the characterisation of low grade, fine-grained mineralisation; potential problems and recommendations." Minerals Engineering 79: 68-83.
- Kolker, A. (2012). "Minor element distribution in iron disulfides in coal: A geochemical review." International Journal of Coal Geology 94: 32-43. [CrossRef]
- Konaté, A. A., et al. (2017). "Lithology and mineralogy recognition from geochemical logging tool data using multivariate statistical analysis." Applied Radiation and Isotopes 128: 55-67. [CrossRef]
- Kwiecińska, B., et al. (2019). "Application of electron microscopy TEM and SEM for analysis of coals, organic-rich shales and carbonaceous matter." International Journal of Coal Geology 211: 103203.
- Lerch, B., et al. (2016). "Regional petroleum alteration trends in Barents Sea oils and condensates as a clue to migration regimes and processes." Aapg Bulletin 100(2): 165-190. [CrossRef]
- Li, G., et al. (2020). "A rock physics model for estimating elastic properties of upper Ordovician-lower Silurian mudrocks in the Sichuan Basin, China." Engineering Geology 266: 105460.
- Li, P., et al. (2015). "Heterogeneous distribution of pyrobitumen attributable to oil cracking and its effect on carbonate reservoirs: Feixianguan Formation in the Jiannan gas field, China." Aapg Bulletin 99(4): 763-789. [CrossRef]
- Li, W., et al. (2020). "Shale oil in saline lacustrine systems: A perspective of complex lithologies of fine-grained rocks." Marine and Petroleum Geology 116: 104351. [CrossRef]
- Li, Y., et al. (2018). "Major Factors Controlling Lamina Induced Fractures In the Upper Triassic Yanchang Formation Tight Oil Reservoir, Ordos Basin, China." Journal of Asian Earth Sciences. [CrossRef]
- Li, Y., et al. (2018). "Two episodes of structural fractures: Numerical simulation of Yanchang Oilfield in the Ordos basin, northern China." Marine and Petroleum Geology. [CrossRef]
- Li, Y., et al. (2019). "Influence of Gas and Oil State on Oil Mobility and Sweet-Spot Distribution in Tight Oil Reservoirs from the Perspective of Capillary Force." Spe Reservoir Evaluation & Engineering Preprint(Preprint): 19.
- Li, Y., et al. (2019). "Influence of the actively migrated diagenetic elements on the hydrocarbon generation potential in tuffaceous shale." Fuel 256: 115795. [CrossRef]
- Li, Y., et al. (2019). "Influence of the actively migrated diagenetic elements on the hydrocarbon generation potential in tuffaceous shale." Fuel 256: 115795. [CrossRef]
- Li, Y., et al. (2019). "Tight reservoir oiliness numerical simulation based on a Markov chain Monte Carlo (MCMC) method: A case study of the upper Triassic Yanchang-6 formation (T3ch6 Fm.) outcrop of Ordos Basin." Journal of Petroleum Science and Engineering. [CrossRef]
- Liu, Y., et al. (2019). "Temperature and pressure characteristics of Ordovician gas condensate reservoirs in the Tazhong area, Tarim Basin, northwestern China." Aapg Bulletin 103(6): 1351-1381.
- Ma, Y., et al. (2020). "Shale gas desorption behavior and carbon isotopic variations of gases from canister desorption of two sets of gas shales in south China." Marine and Petroleum Geology 113: 104127. [CrossRef]
- Mei, M., et al. (2018). "Origin of condensates and natural gases in the Almond Formation reservoirs in southwestern Wyoming, USA." Organic Geochemistry 124: 164-179. [CrossRef]
- Middleton, R. S., et al. (2015). "Shale gas and non-aqueous fracturing fluids: Opportunities and challenges for supercritical CO2." Applied Energy 147: 500-509. [CrossRef]
- Milkov, A. V., et al. (2020). "Geochemistry of shale gases from around the world: Composition, origins, isotope reversals and rollovers, and implications for the exploration of shale plays." Organic Geochemistry 143: 103997.
- Parian, M., et al. (2015). "Analysis of mineral grades for geometallurgy: Combined element-to-mineral conversion and quantitative X-ray diffraction." Minerals Engineering 82: 25-35. [CrossRef]
- Rohais, S., et al. (2019). "Patterns of organic carbon enrichment in a lacustrine system across the K-T boundary: Insight from a multi-proxy analysis of the Yacoraite Formation, Salta rift basin, Argentina." International Journal of Coal Geology 210. [CrossRef]
- Schenk, B., et al. (2018). "Cyclic paleo-salinity changes inferred from benthic foraminiferal assemblages in the Upper Burdigalian (Lower Miocene) Korneuburg Basin, Austria." Palaeogeography, Palaeoclimatology, Palaeoecology 490: 473-487. [CrossRef]
- Şen, Ş. and H. Kozlu (2020). "Impact of maturity on producible shale oil volumes in the Silurian (Llandovery) hot shales of the northern Arabian plate, southeastern Turkey." Aapg Bulletin 104(3): 507-524.
- Shalaby, M. R., et al. (2019). "Integrated TOC prediction and source rock characterization using machine learning, well logs and geochemical analysis: Case study from the Jurassic source rocks in Shams Field, NW Desert, Egypt." Journal of Petroleum Science and Engineering 176: 369-380. [CrossRef]
- Sheng, J. J. (2015). "Increase liquid oil production by huff-n-puff of produced gas in shale gas condensate reservoirs." Journal of Unconventional Oil and Gas Resources 11: 19-26. [CrossRef]
- Sheng, J. J., et al. (2016). "Potential to increase condensate oil production by huff-n-puff gas injection in a shale condensate reservoir." Journal of Natural Gas Science and Engineering 28: 46-51. [CrossRef]
- Shi, X., et al. (2019). "Investigation of mechanical properties of bedded shale by nanoindentation tests: A case study on Lower Silurian Longmaxi Formation of Youyang area in southeast Chongqing, China." Petroleum Exploration and Development 46(1): 163-172. [CrossRef]
- Song, Y., et al. (2019). "Warm-humid paleoclimate control of salinized lacustrine organic-rich shale deposition in the Oligocene Hetaoyuan Formation of the Biyang Depression, East China." International Journal of Coal Geology 202: 69-84. [CrossRef]
- Speight, J. (2020). Analysis of gas and condensate from tight formations. Shale Oil and Gas Production Processes: 373-450.
- Speight, J. (2020). Chapter 7 - Analysis of gas and condensate from tight formations. Shale Oil and Gas Production Processes. J. Speight, Gulf Professional Publishing: 373-450.
- Strąpoć, D., et al. (2020). "Deep biogenic methane and drilling-associated gas artifacts: Influence on gas-based characterization of petroleum fluids." Aapg Bulletin 104(4): 887-912. [CrossRef]
- Su, J., et al. (2016). "New insights into the formation mechanism of high hydrogen sulfide-bearing gas condensates: Case study of Lower Ordovician dolomite reservoirs in the Tazhong uplift, Tarim Basin." Aapg Bulletin 100(6): 893-916. [CrossRef]
- Toyoda, K. (1993). "Geochemical history of ancient Lake Biwa in Japan—chemical indicators of sedimentary paleo-environments in a drilled core." Palaeogeography, Palaeoclimatology, Palaeoecology 101(1): 169-184. [CrossRef]
- Varela, S., et al. (2011). "Using species distribution models in paleobiogeography: A matter of data, predictors and concepts." Palaeogeography, Palaeoclimatology, Palaeoecology 310(3): 451-463.
- Wang, Y., et al. (2016). "An evaluation workflow for shale oil and gas in the Jiyang Depression, Bohai Bay Basin, China: A case study from the Luojia area in the Zhanhua Sag." Petroleum Research 1(1): 70-80.
- Wu, Y., et al. (2020). "Paleo-environmental variation and its control on organic matter enrichment of black shales from shallow shelf to slope regions on the Upper Yangtze Platform during Cambrian Stage 3." Palaeogeography, Palaeoclimatology, Palaeoecology 545: 109653. [CrossRef]
- Xue-wu, W., et al. (2020). "Laboratory and field-scale parameter optimization of CO2 huff–n–puff with the staged-fracturing horizontal well in tight oil reservoirs." Journal of Petroleum Science and Engineering 186. [CrossRef]
- Yang, X., et al. (2020). "The depositional mechanism of organic-rich siliceous shales in Upper Yangtze area: Response to the Kwangsian Orogeny in South China." Journal of Petroleum Science and Engineering 192: 107310. [CrossRef]
- Yoshida, T., et al. (2018). "Modeling of shear stress distribution on mud surface in the subsea sand-mud alternate layer." Journal of Petroleum Science and Engineering 160: 531-536. [CrossRef]
- Zhai, G., et al. (2019). "Applications of chemostratigraphy in a characterization of shale gas Sedimentary Microfacies and predictions of sweet spots —taking the Cambrian black shales in Western Hubei as an example." Marine and Petroleum Geology 109: 547-560. [CrossRef]
- Zhang, C. P., et al. (2020). "A comparative study of fracture surface roughness and flow characteristics between CO2 and water fracturing." Journal of Natural Gas Science and Engineering 76. [CrossRef]
- Zhang, L., et al. (2018). "Deccan volcanism caused coupled pCO2 and terrestrial temperature rises, and pre-impact extinctions in northern China." Geology 46(3): 271-274.
- Zou, C., et al. (2019). "Organic-matter-rich shales of China." Earth-Science Reviews 189: 51-78. [CrossRef]
Figure 1.
location map of the JLYY-1 well of Songliao Basin on the left, China, and the drilling formation section JLYY-1 well on the right.
Figure 1.
location map of the JLYY-1 well of Songliao Basin on the left, China, and the drilling formation section JLYY-1 well on the right.
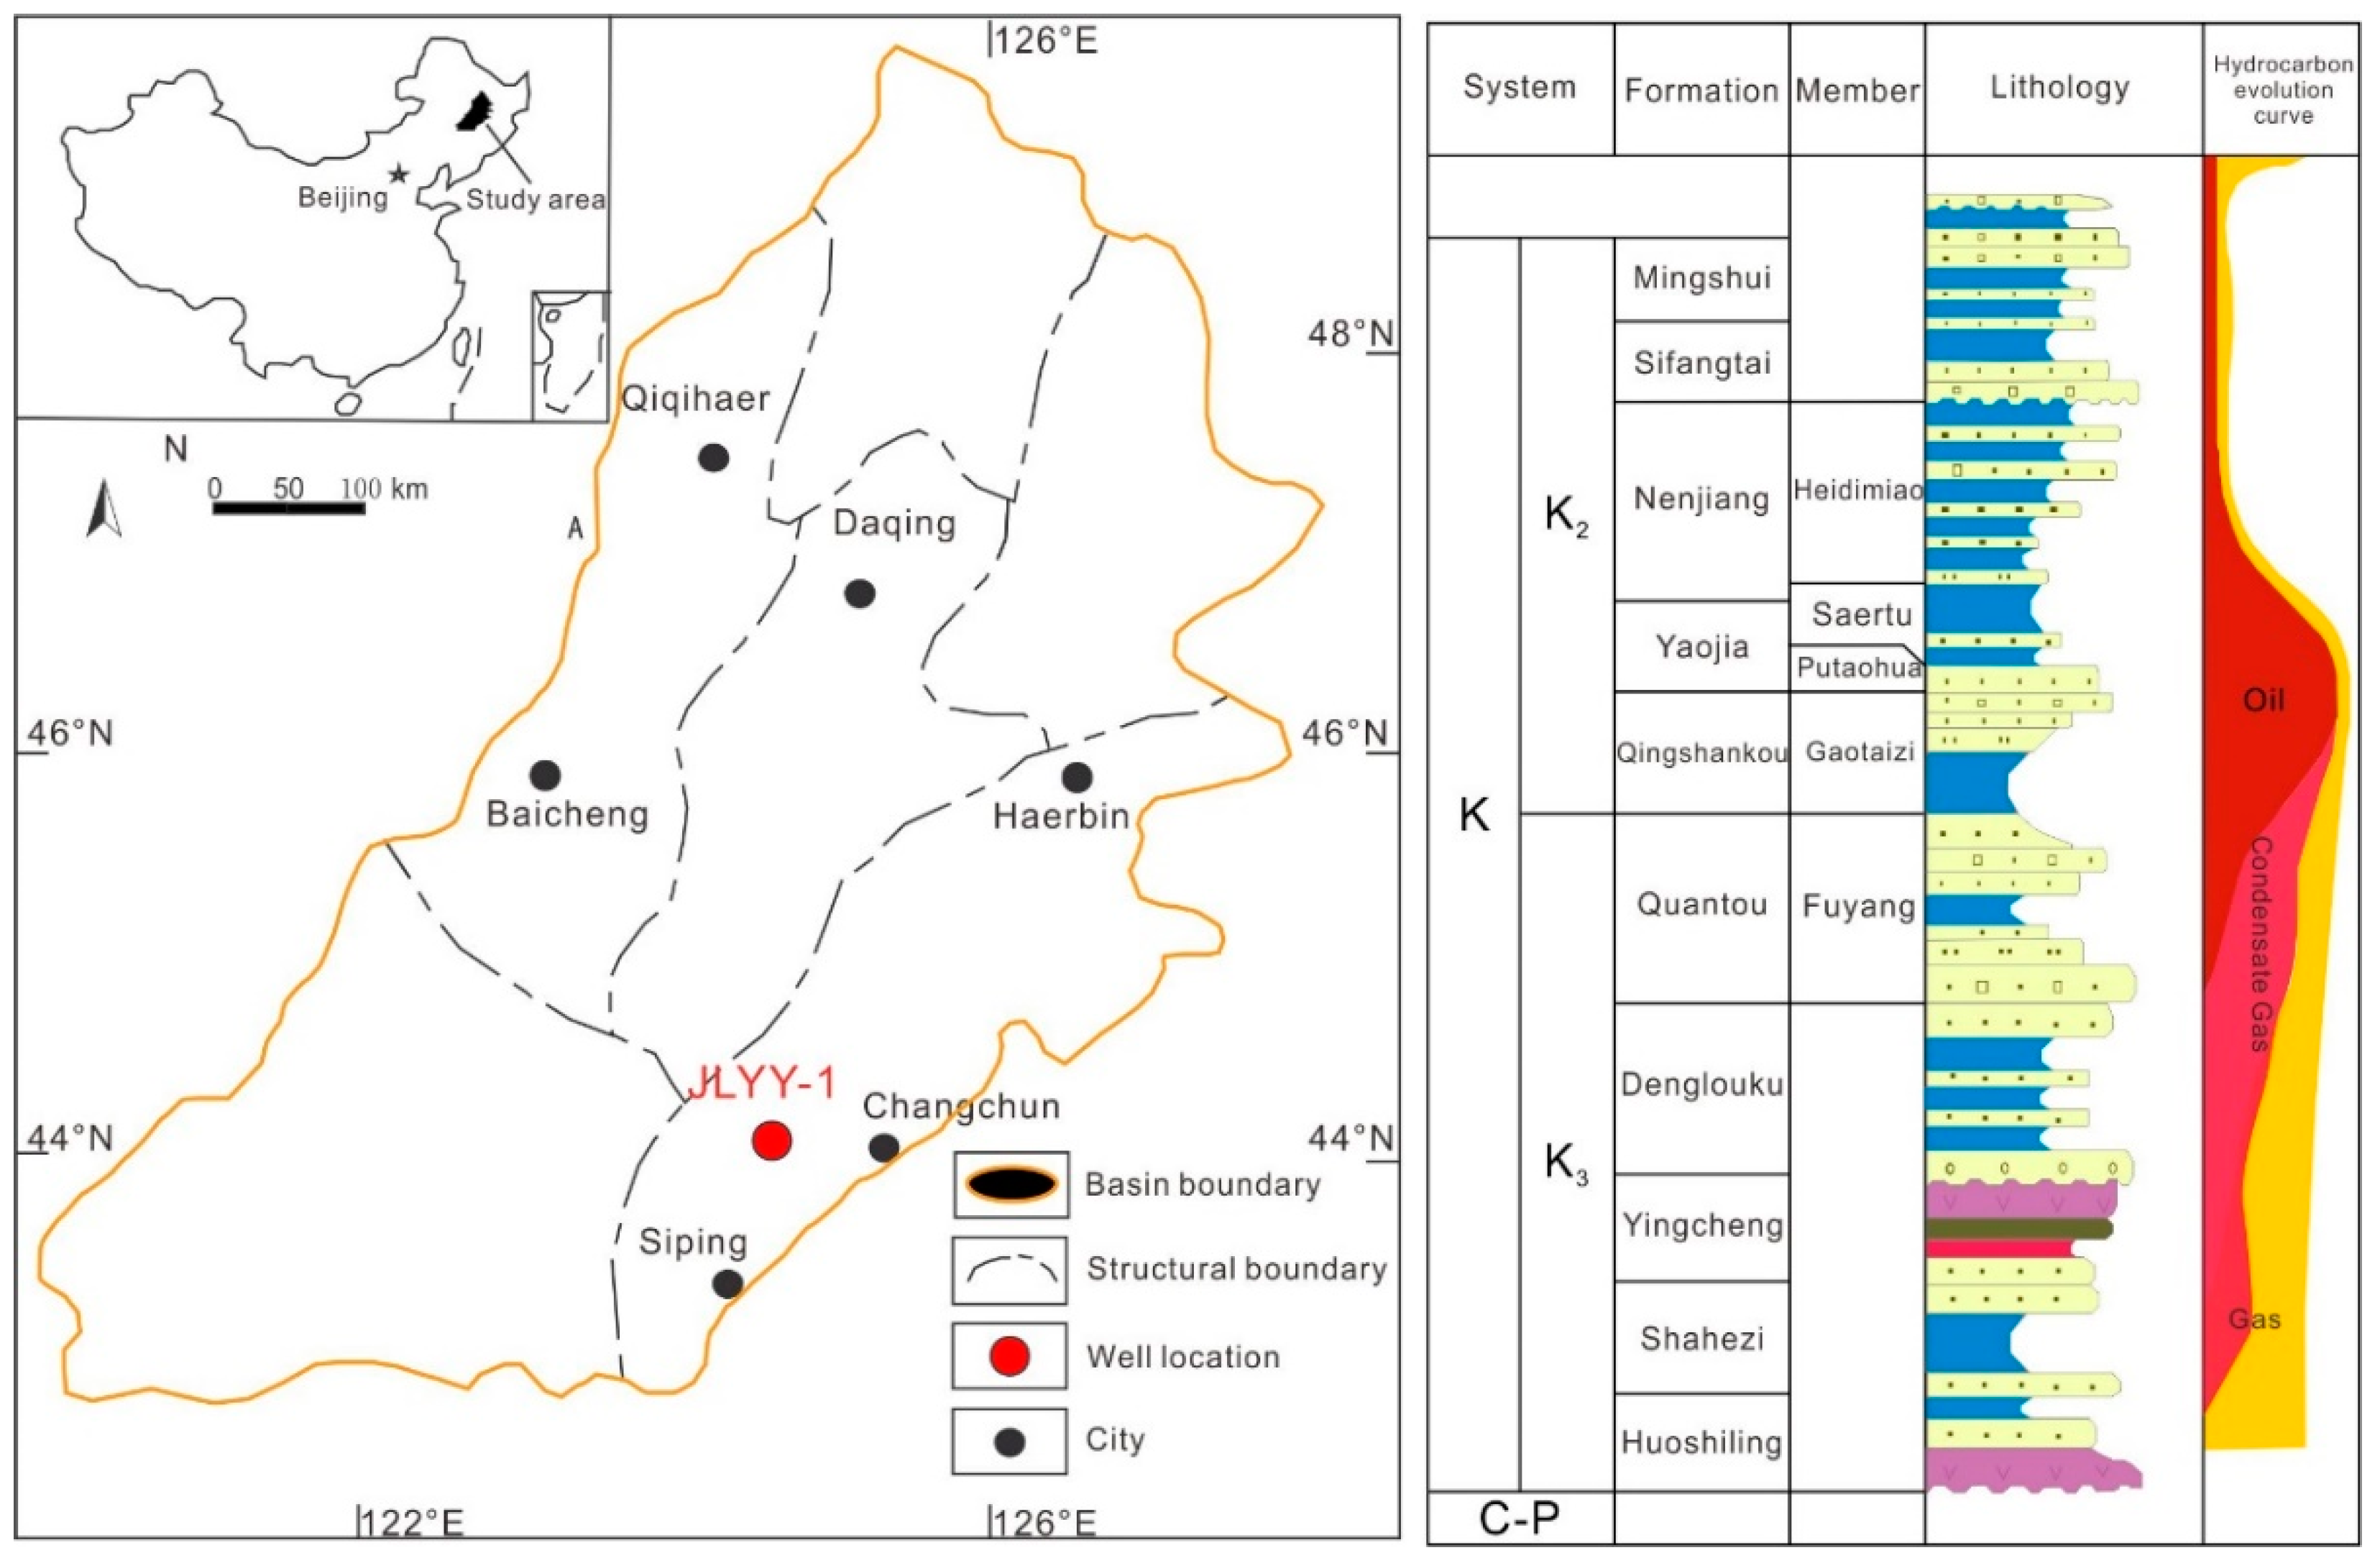
Figure 3.
The core photos and the inorganic and organic components of the K1sh Fm. shales. The cores of siliceous shale are mainly composed of silty mudstone, colored gray-white color, and characterized with wave bedding lamina where the organic matter content is low as shown in b), c) and r); While the cores are found with relatively undeveloped lamination as shown in d)~f); In the range of 50% to 75%, from 3115m to 3165m in a vertical length of 50m, the lamination is developed in cores, and also a large amount foliation. TOC is relatively high, up to 5%, as m)~p); The carbonaceous mudstones in the lower part of h), colored of gray-white, and is mainly composed of calcite which belongs to the carbonatite sedimentation of rock fracture and crumple structure.
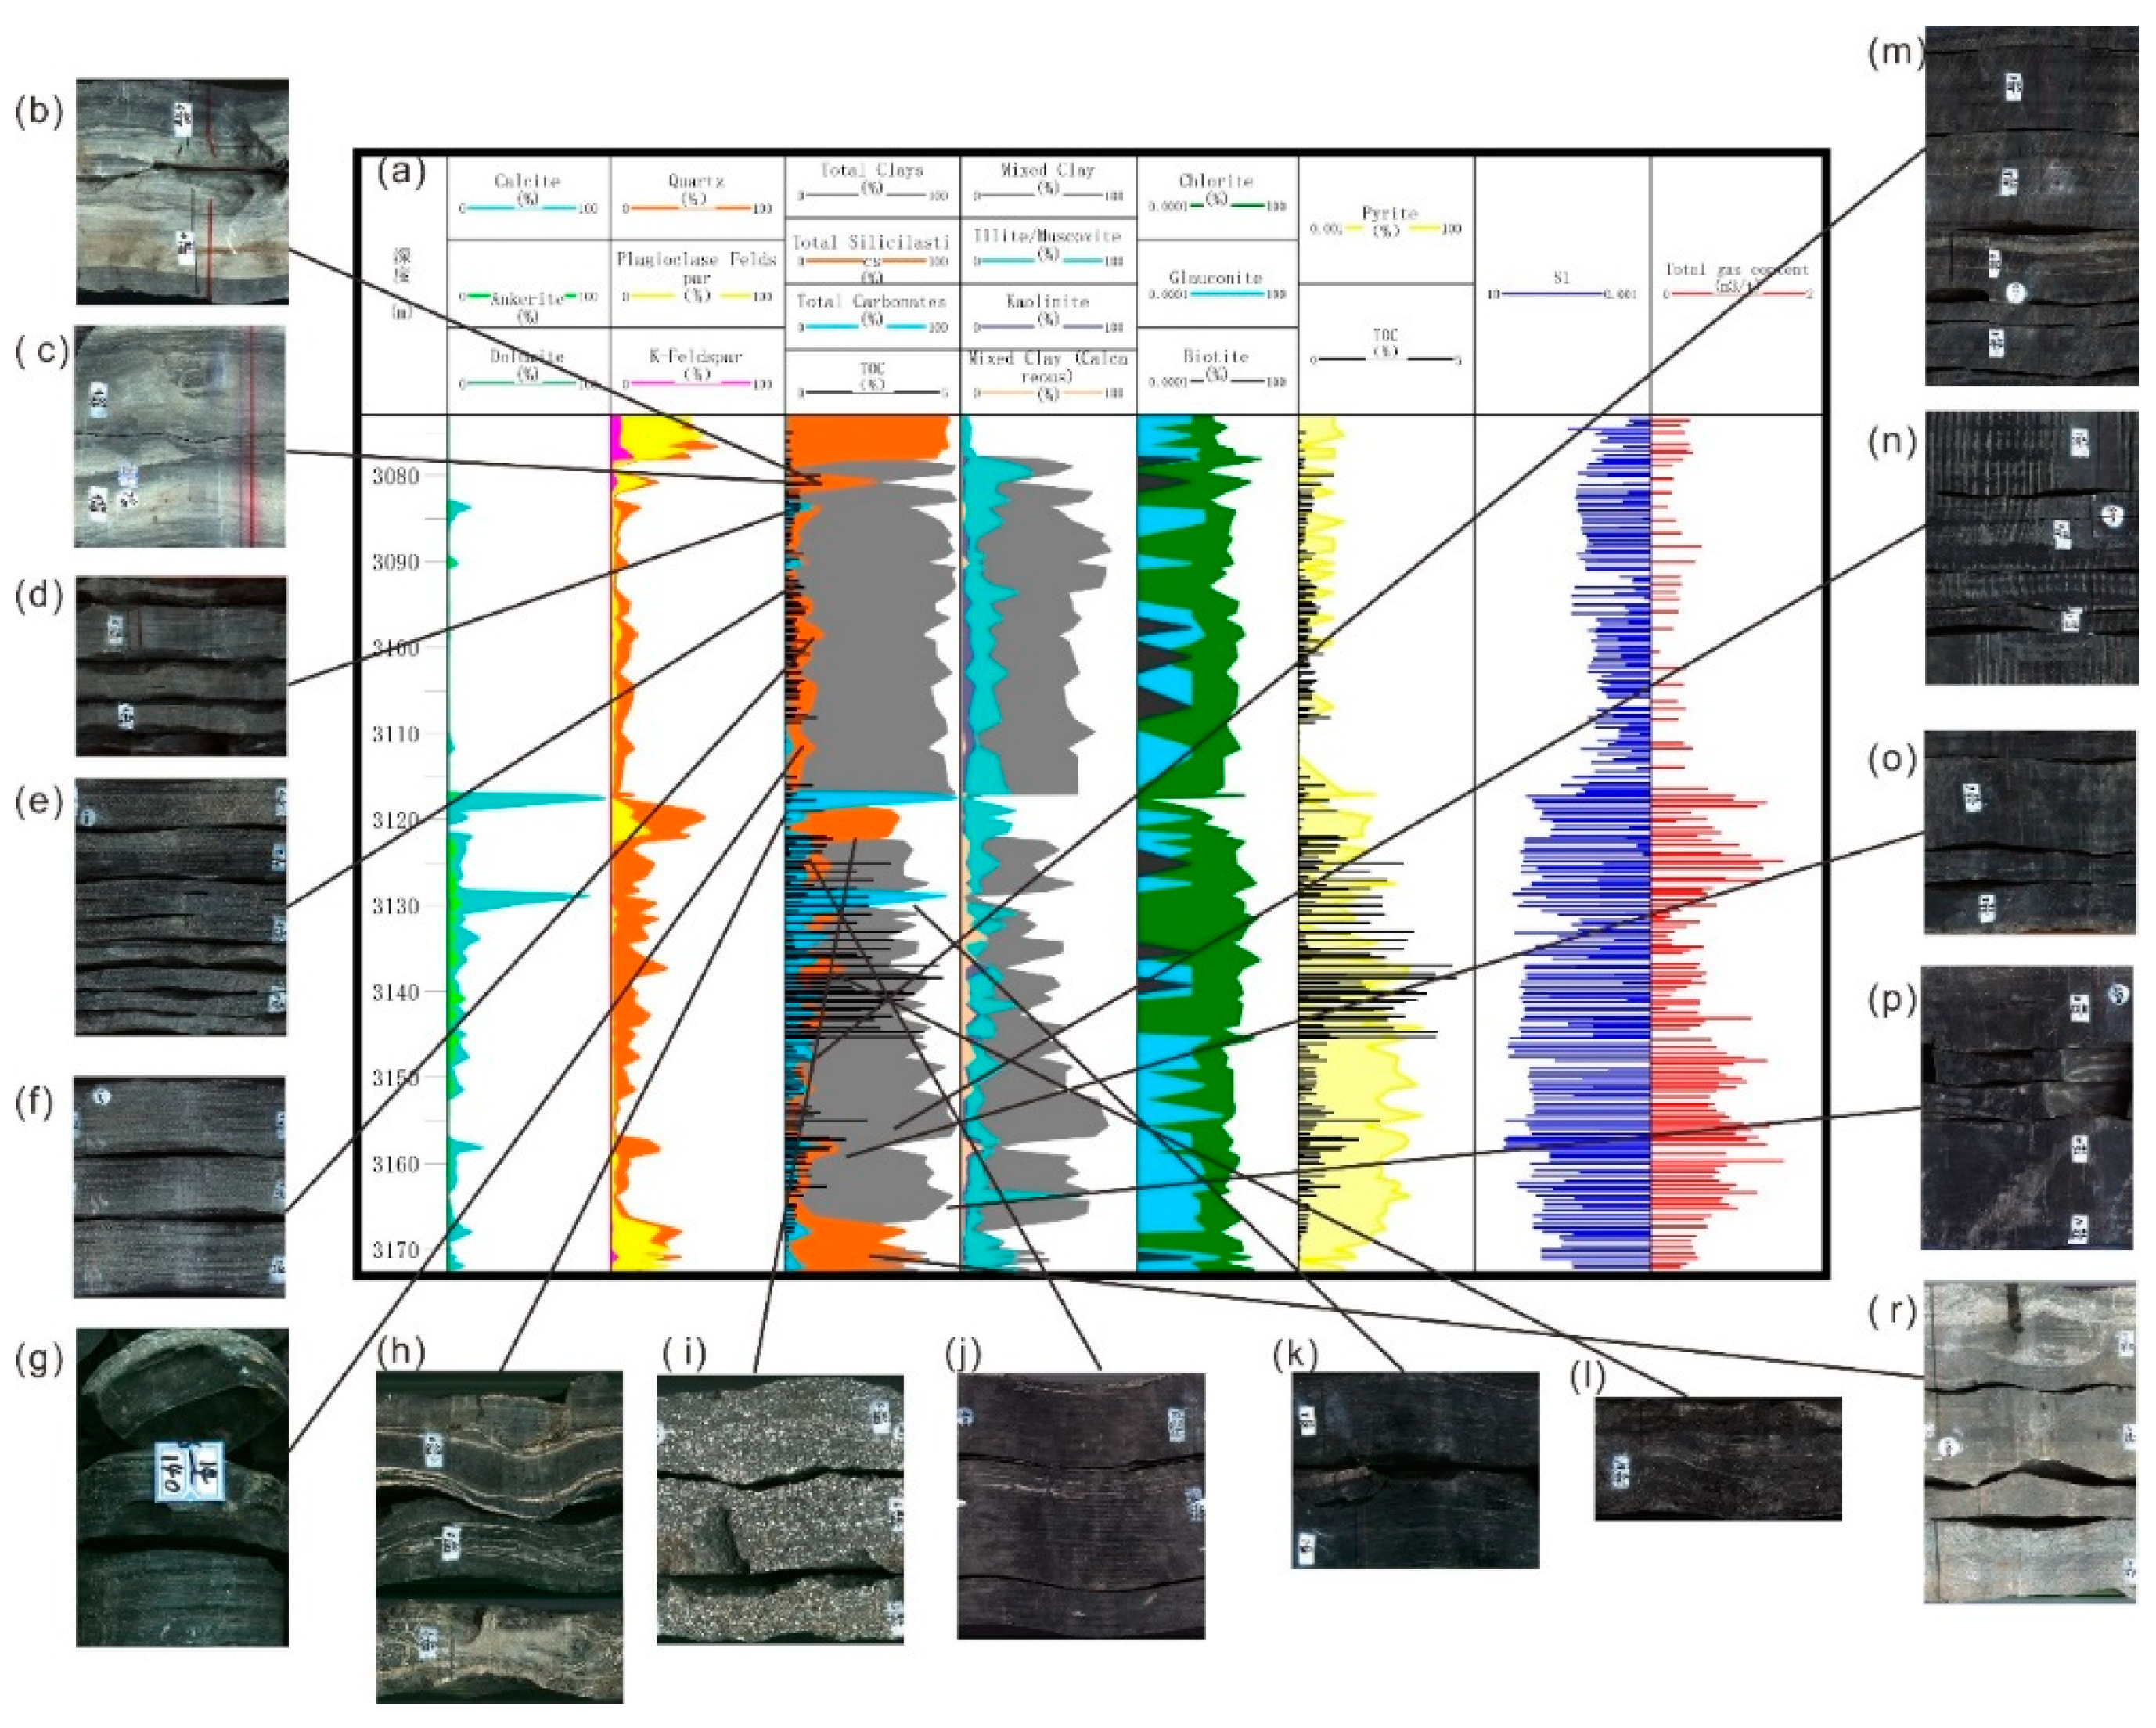
Figure 4.
Statistics between the S1 data and the rock components, where S1 indicates the hydrocarbon in the liquid phase.
Figure 4.
Statistics between the S1 data and the rock components, where S1 indicates the hydrocarbon in the liquid phase.
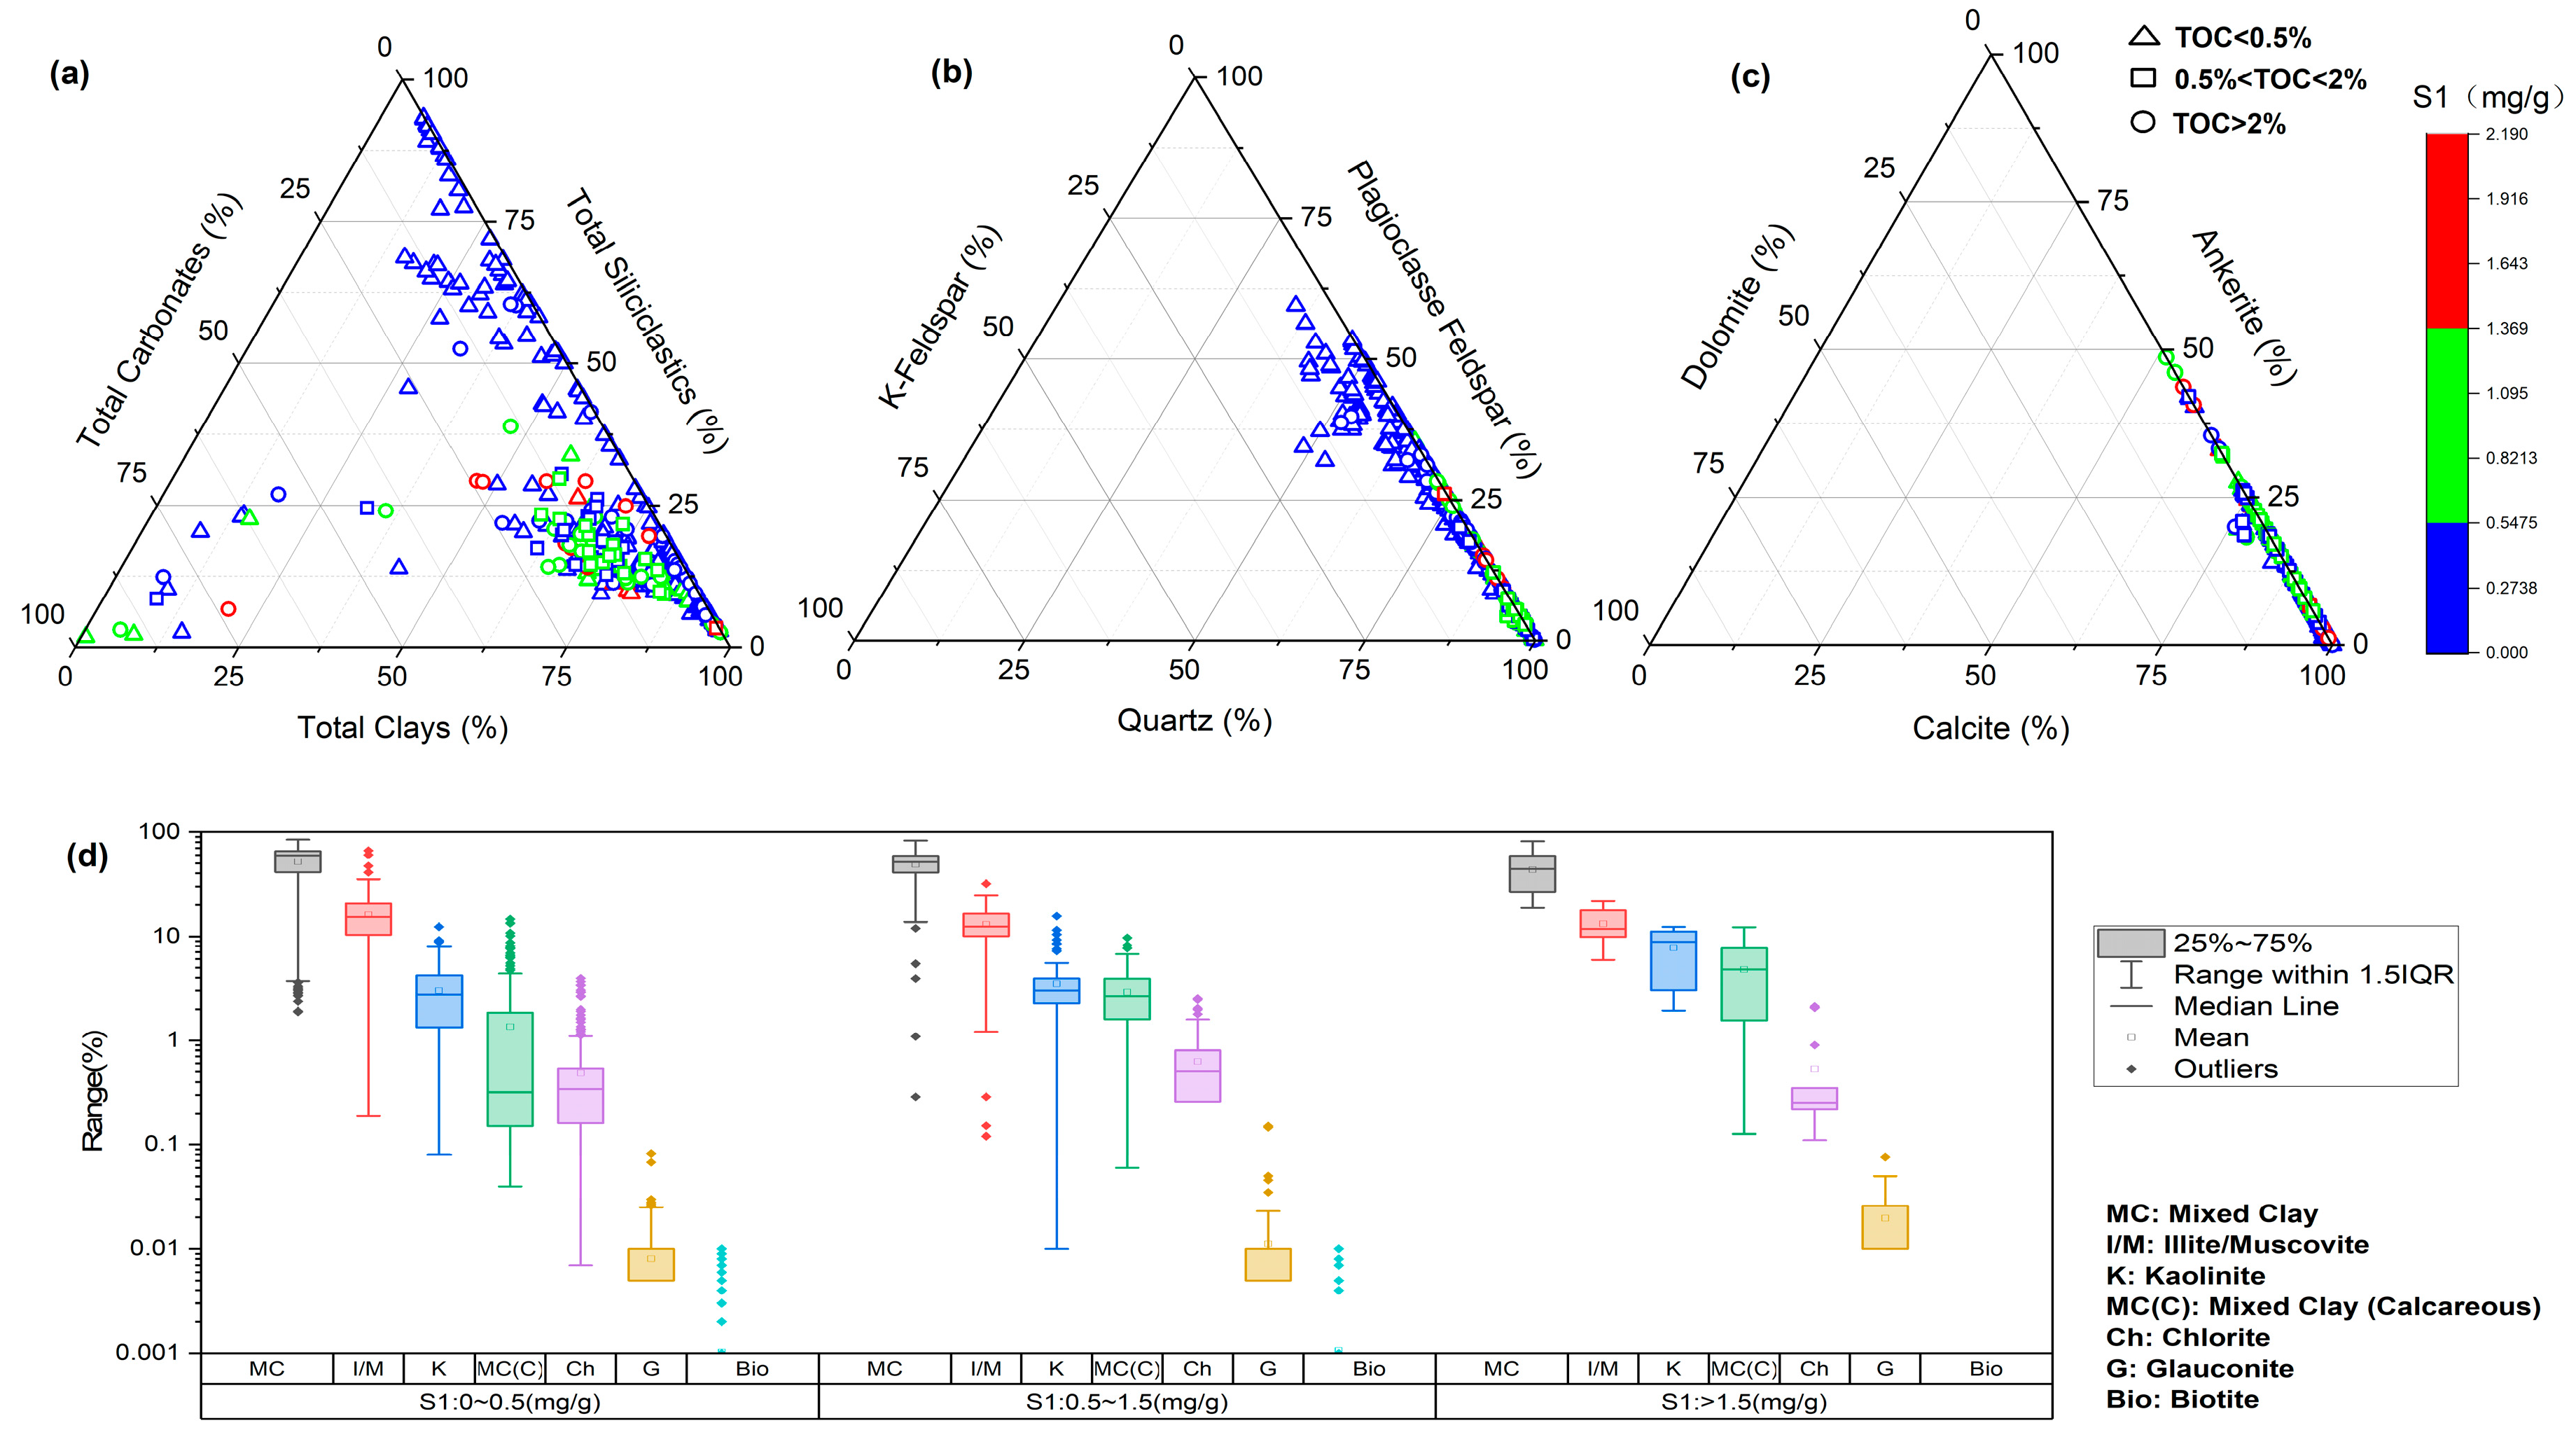
Figure 5.
Statistics between the TGC data and the rock components, where TGC indicates the light hydrocarbon in the gaseous phase.
Figure 5.
Statistics between the TGC data and the rock components, where TGC indicates the light hydrocarbon in the gaseous phase.
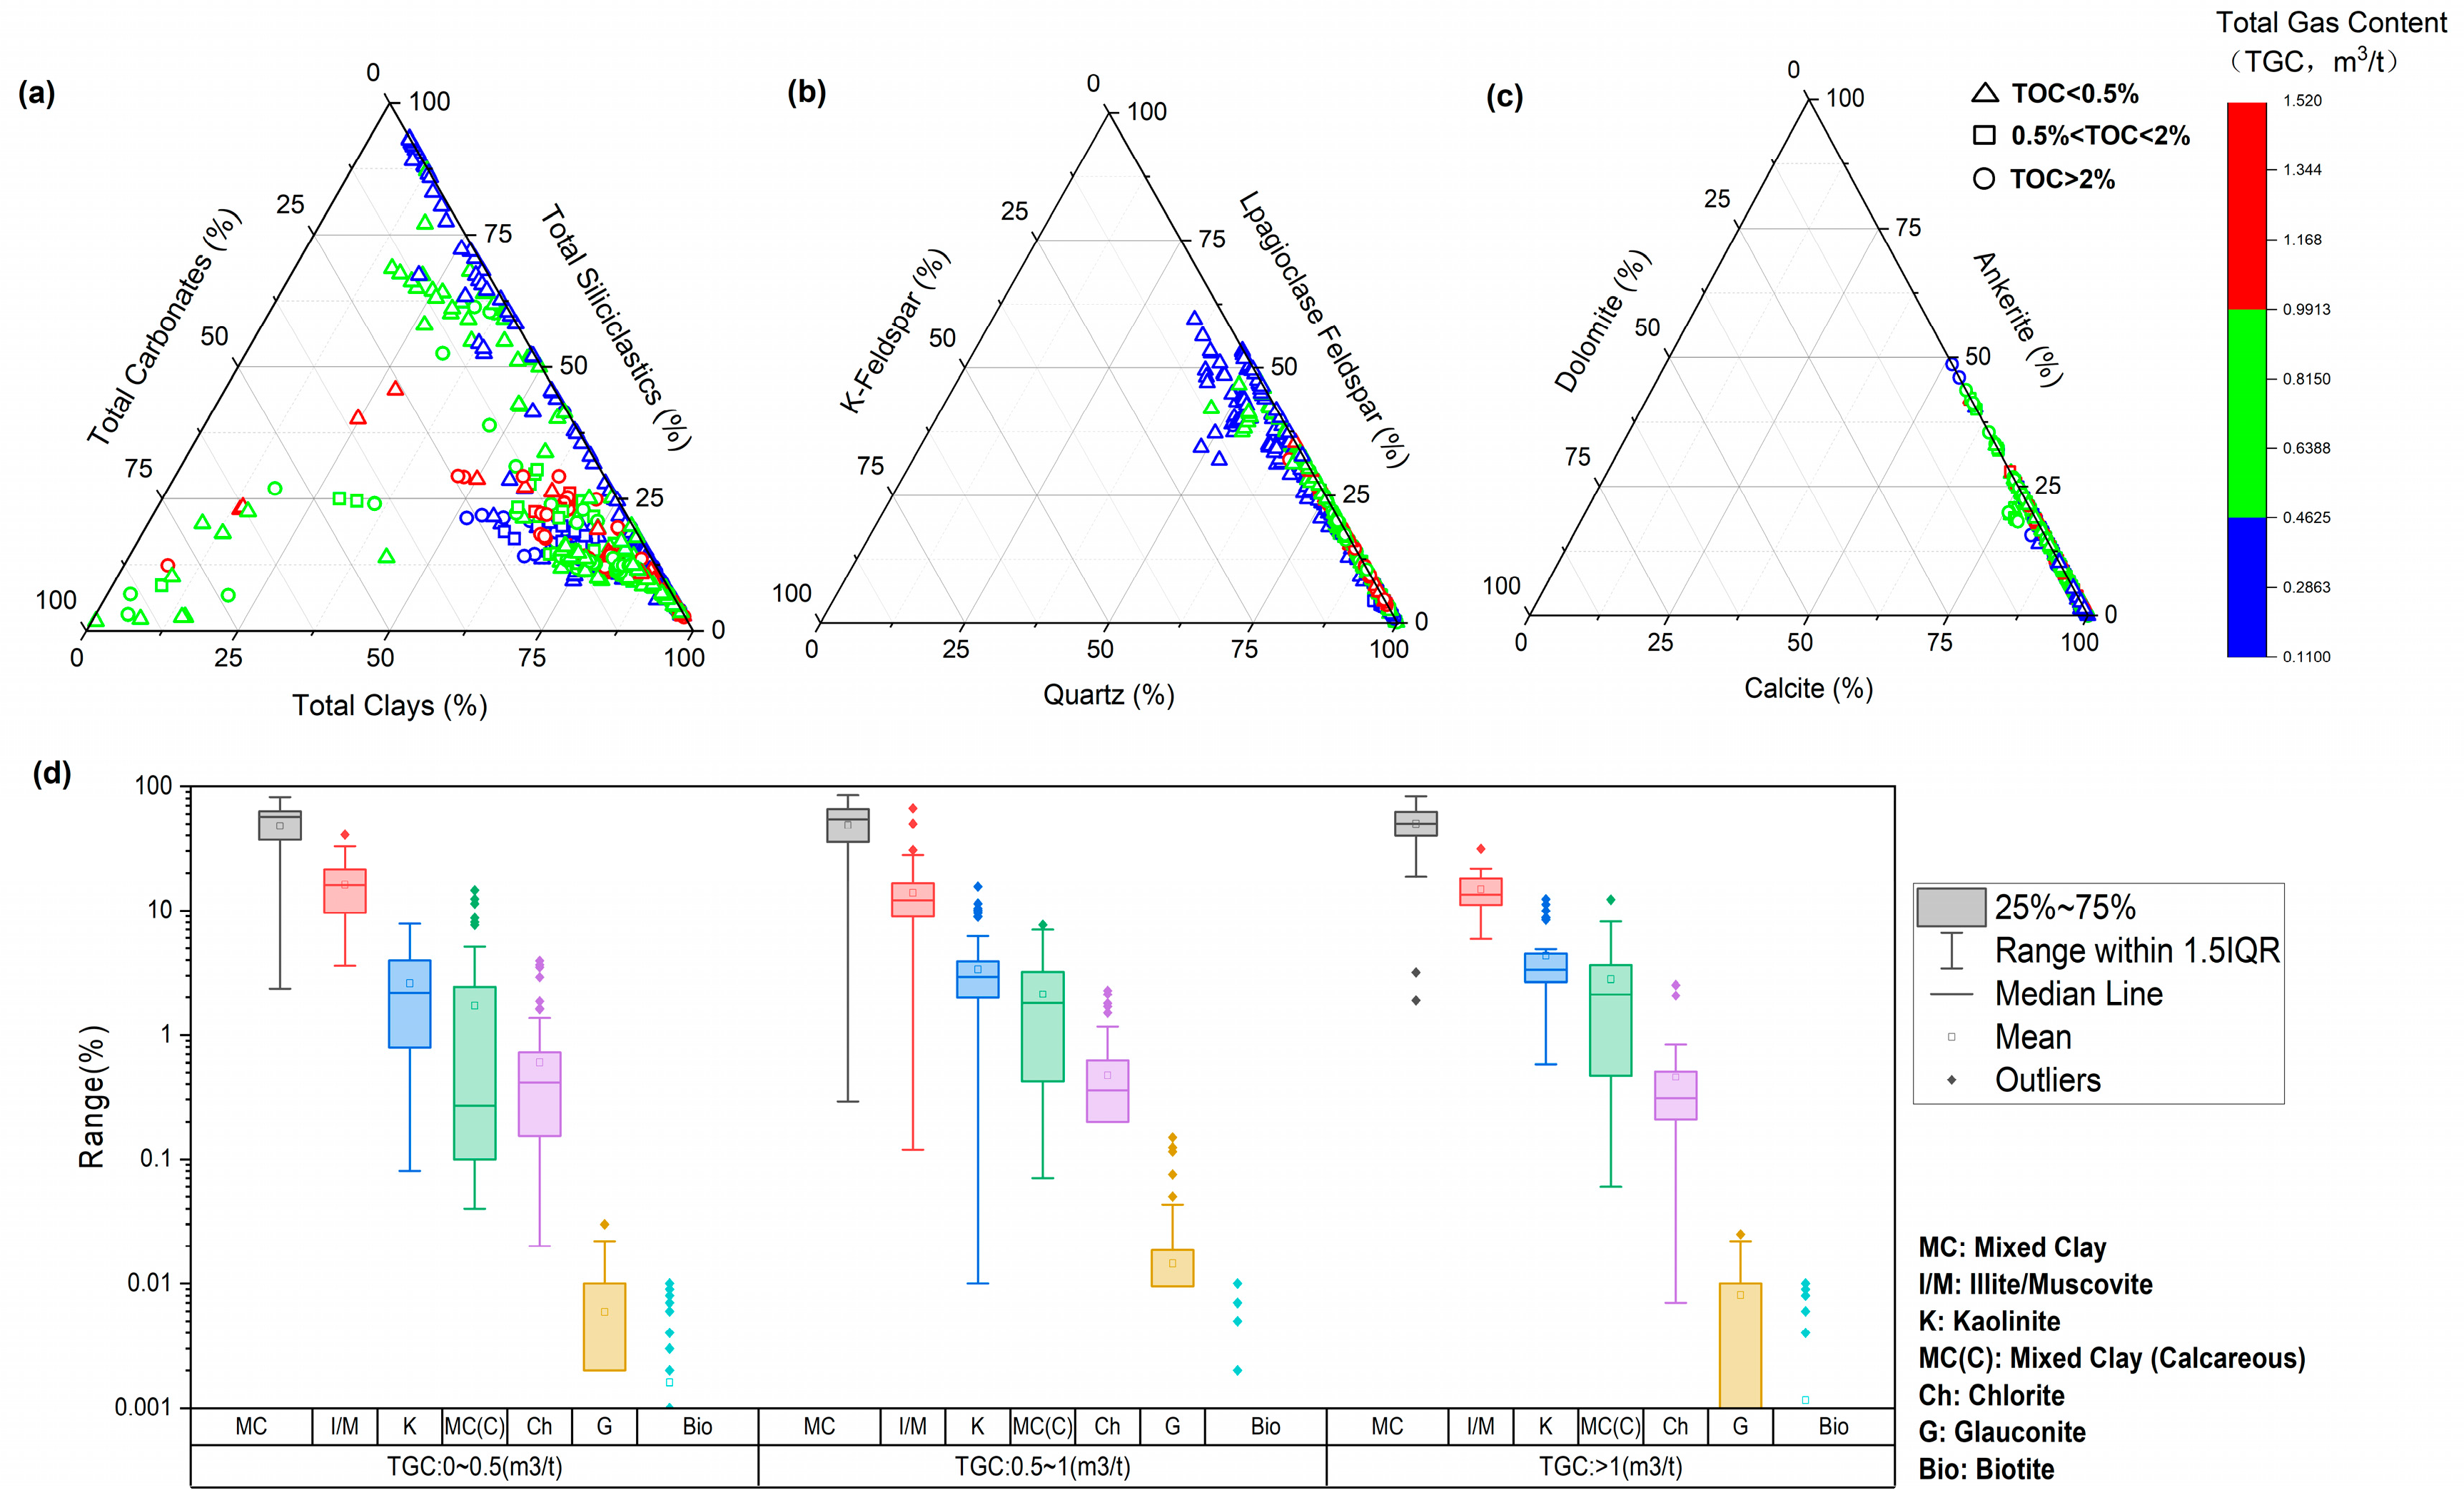
Figure 6.
Classification of hybrid shale condensate reservoirs.
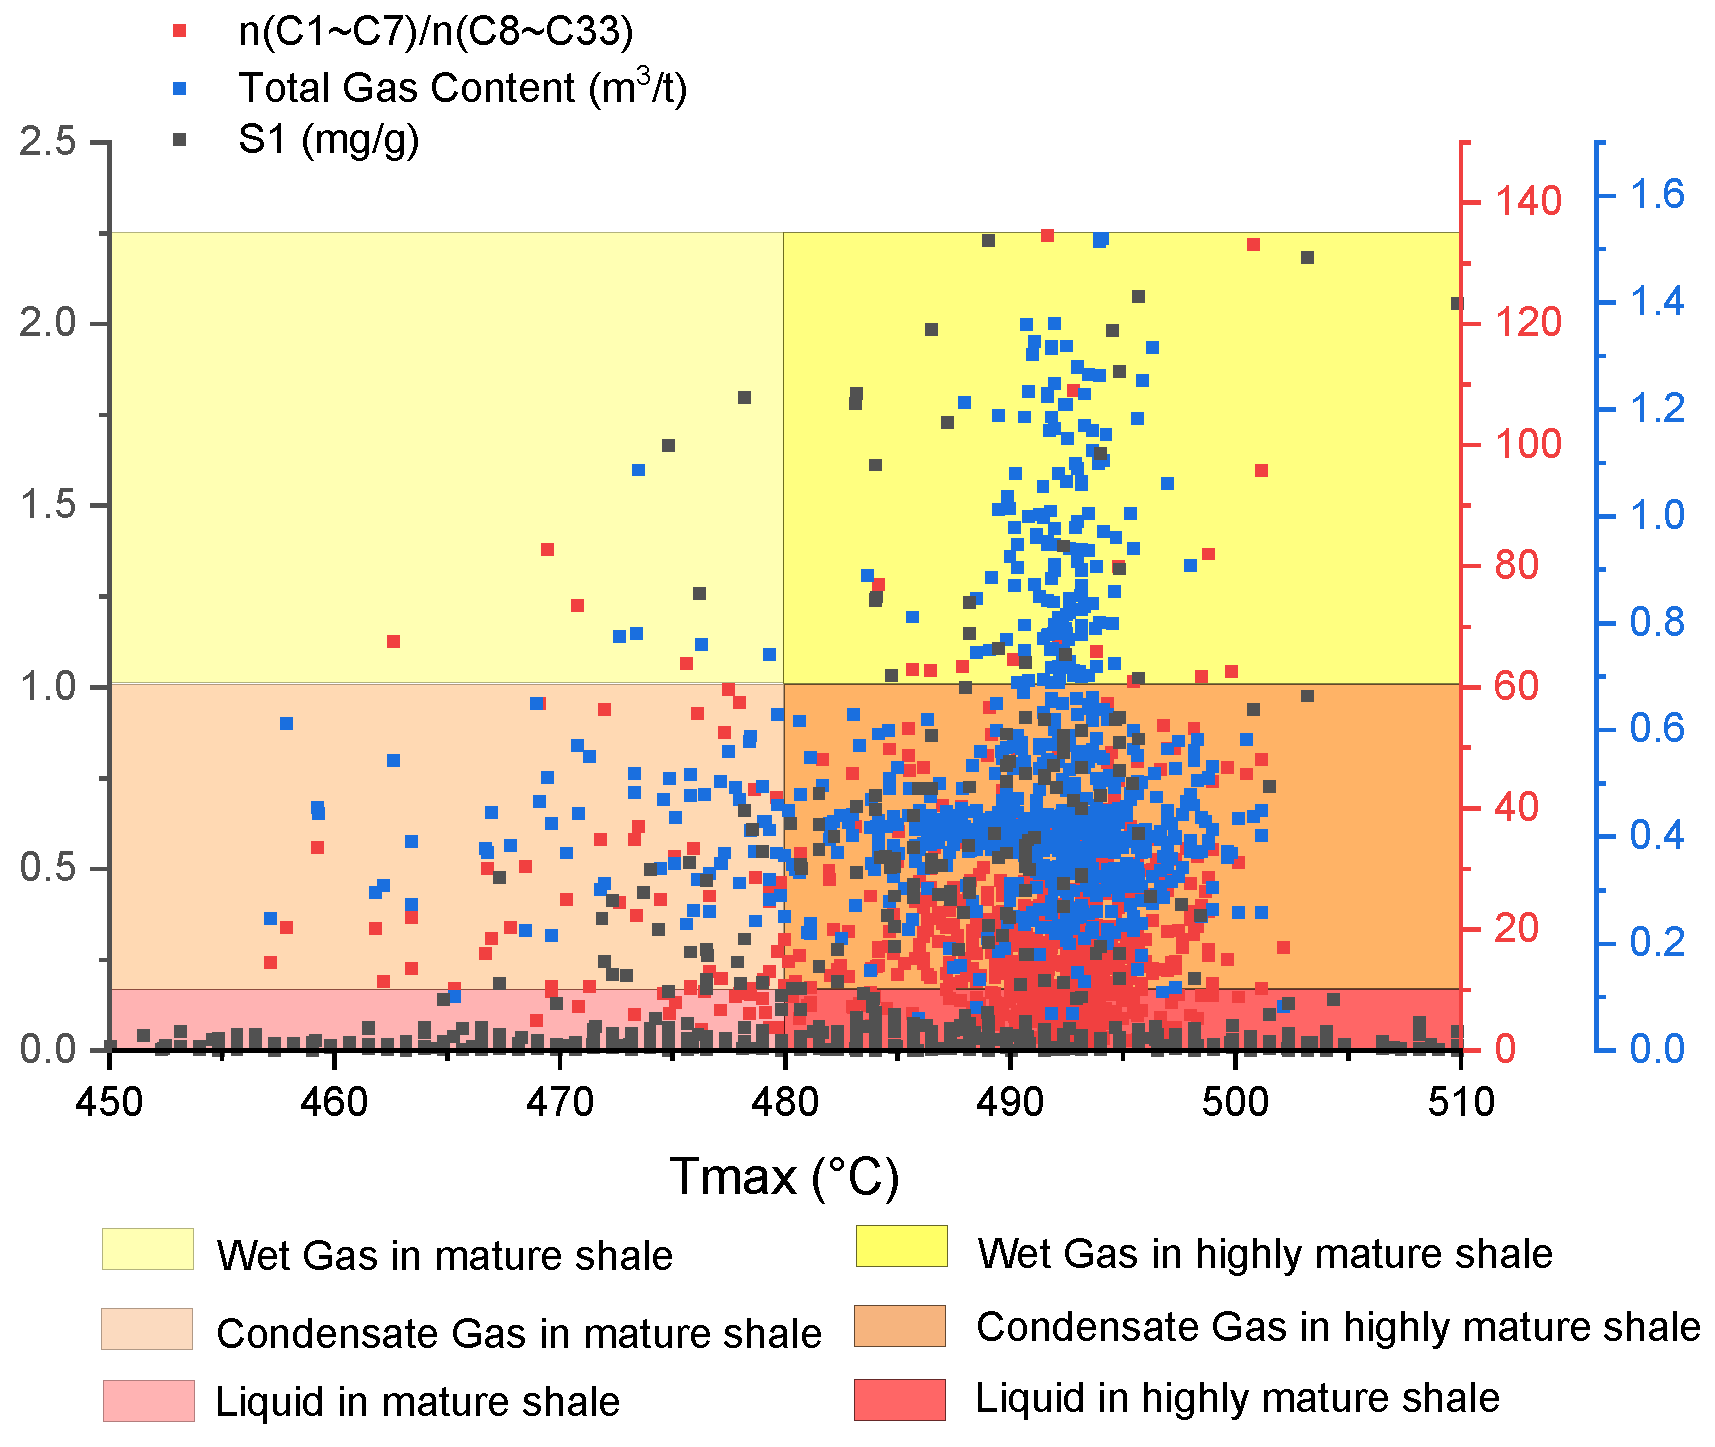
Figure 7.
FES photos illustrating the different sourced organic matters .
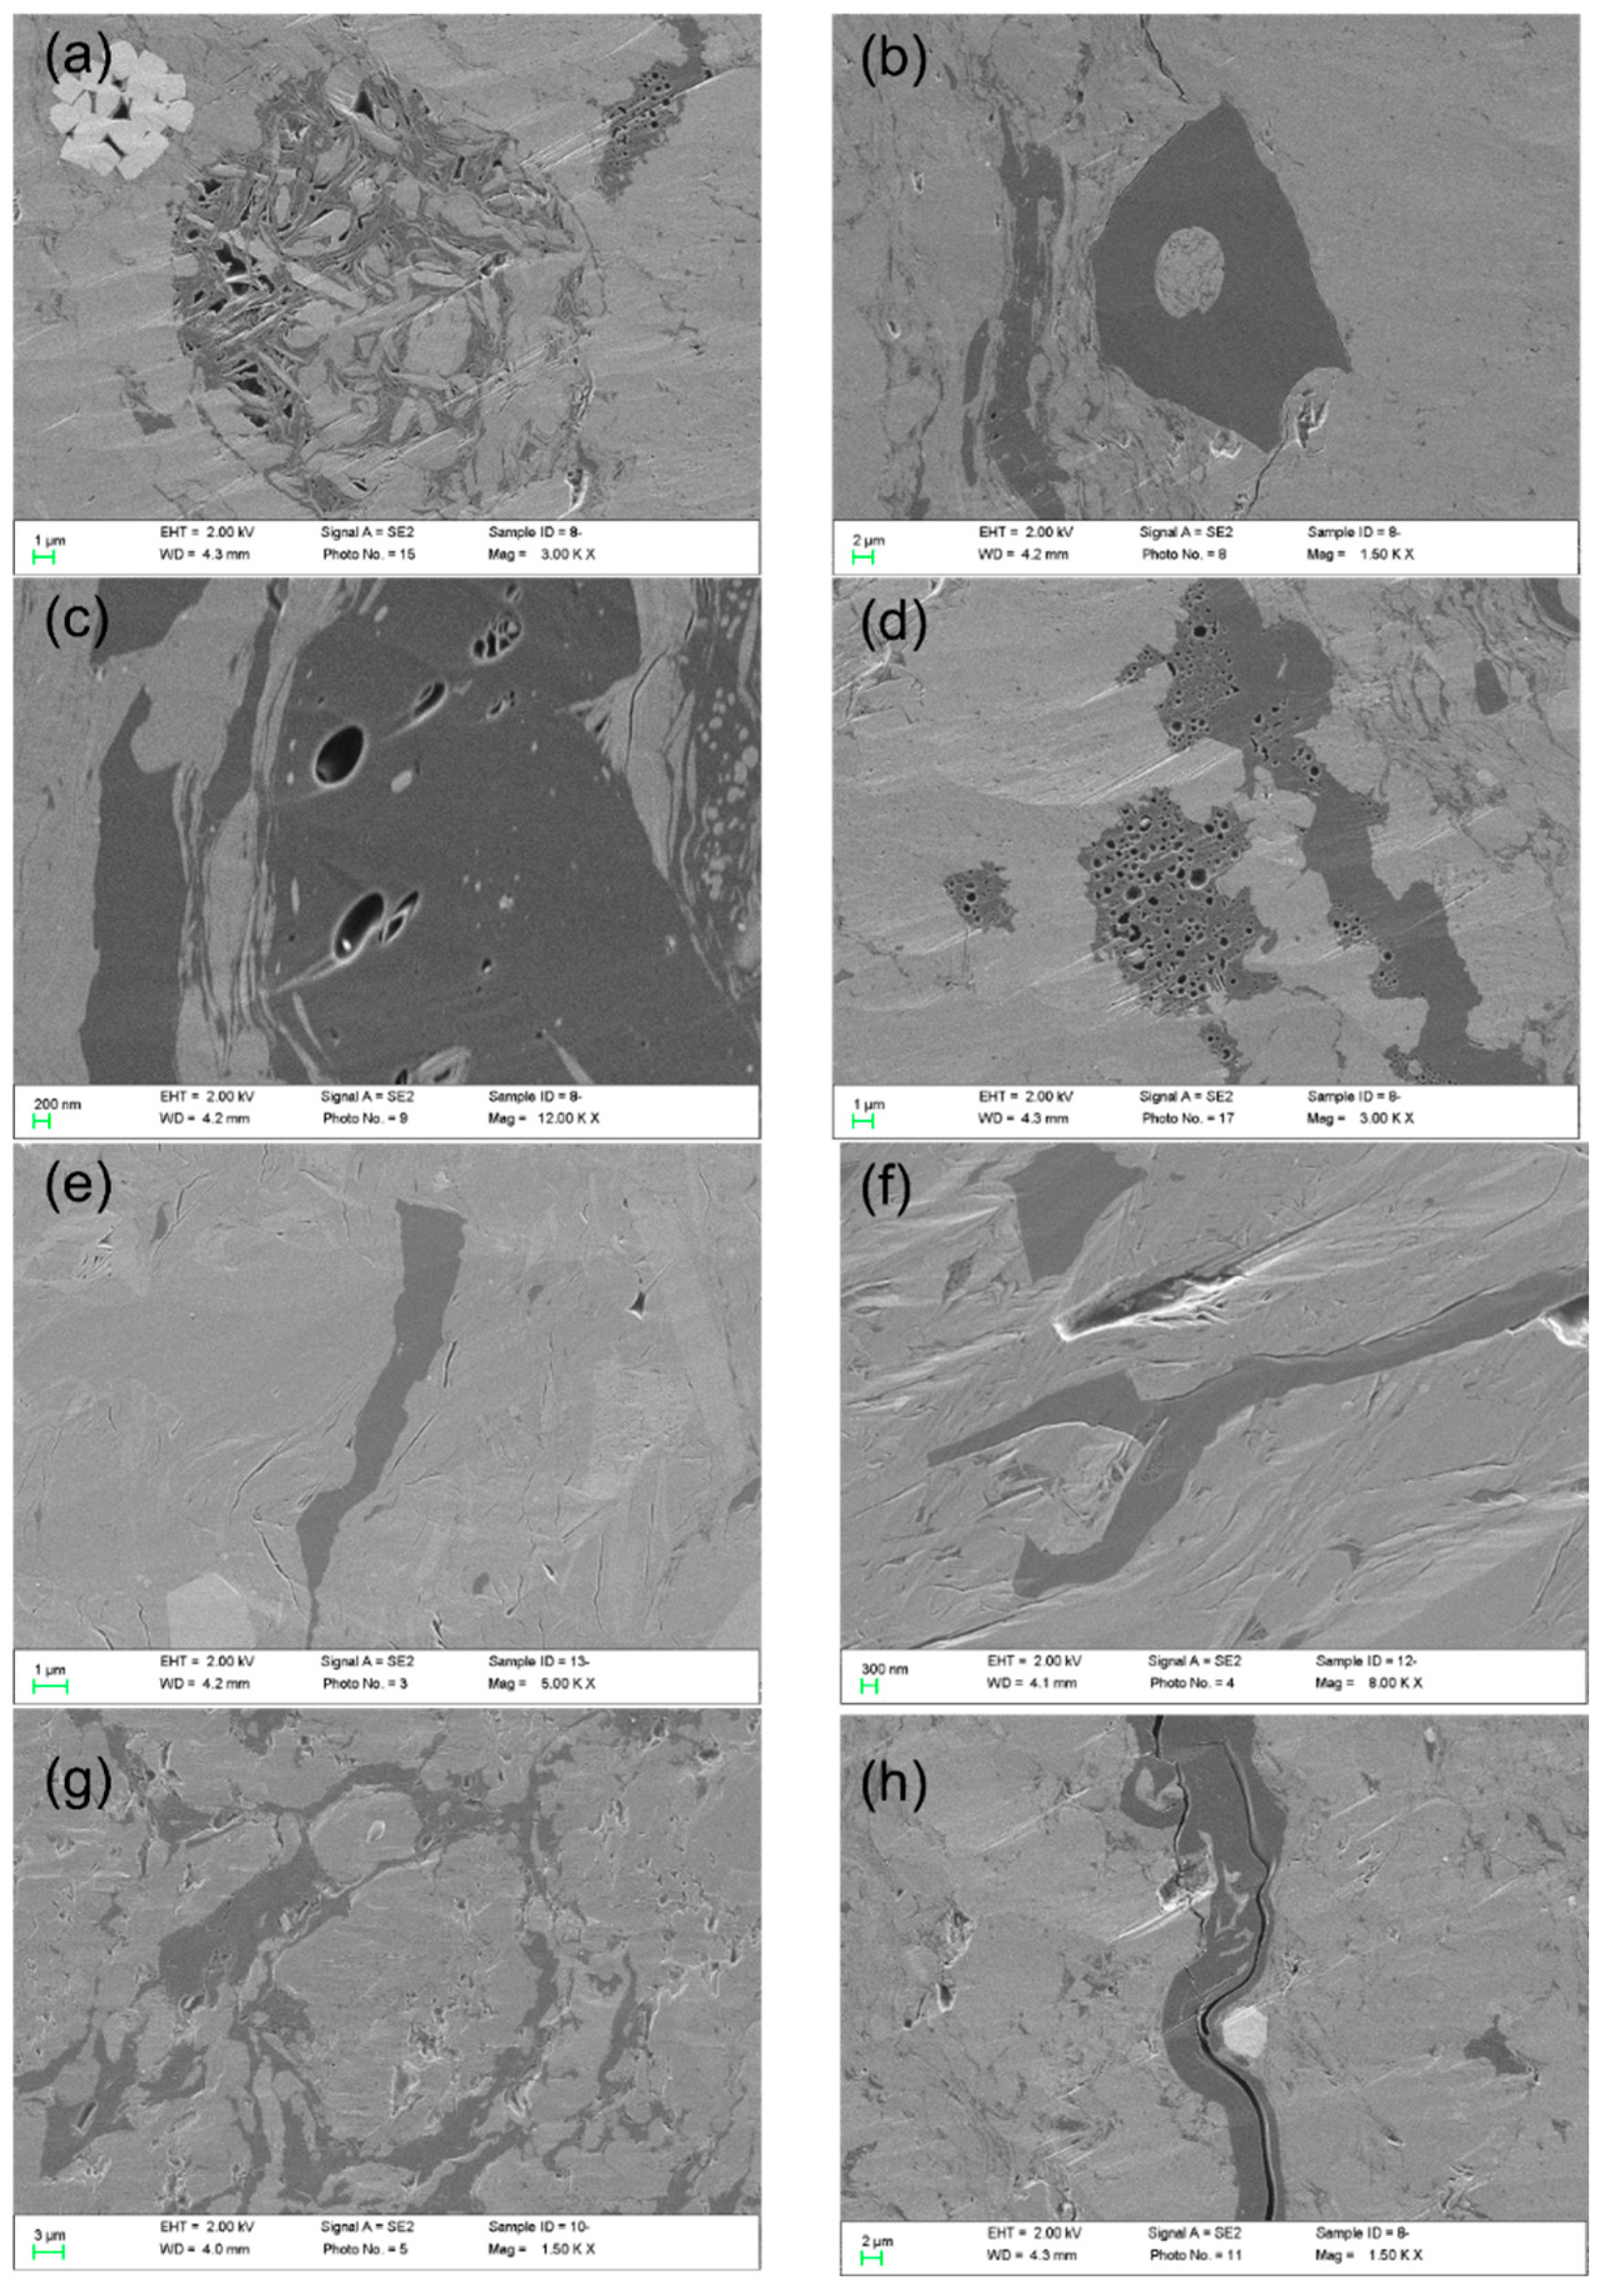
Figure 8.
Four types lacustrine lamina in terrigenous shales, i.e., the siliciclastic lamina as b), d), and f), clayey lamina as h), the carbonate lamina as j), and the pyrite lamina as l), and n). The lamina induced fractures are shown on the BSE microscope photos as a), c), e), g), i), k), and m).
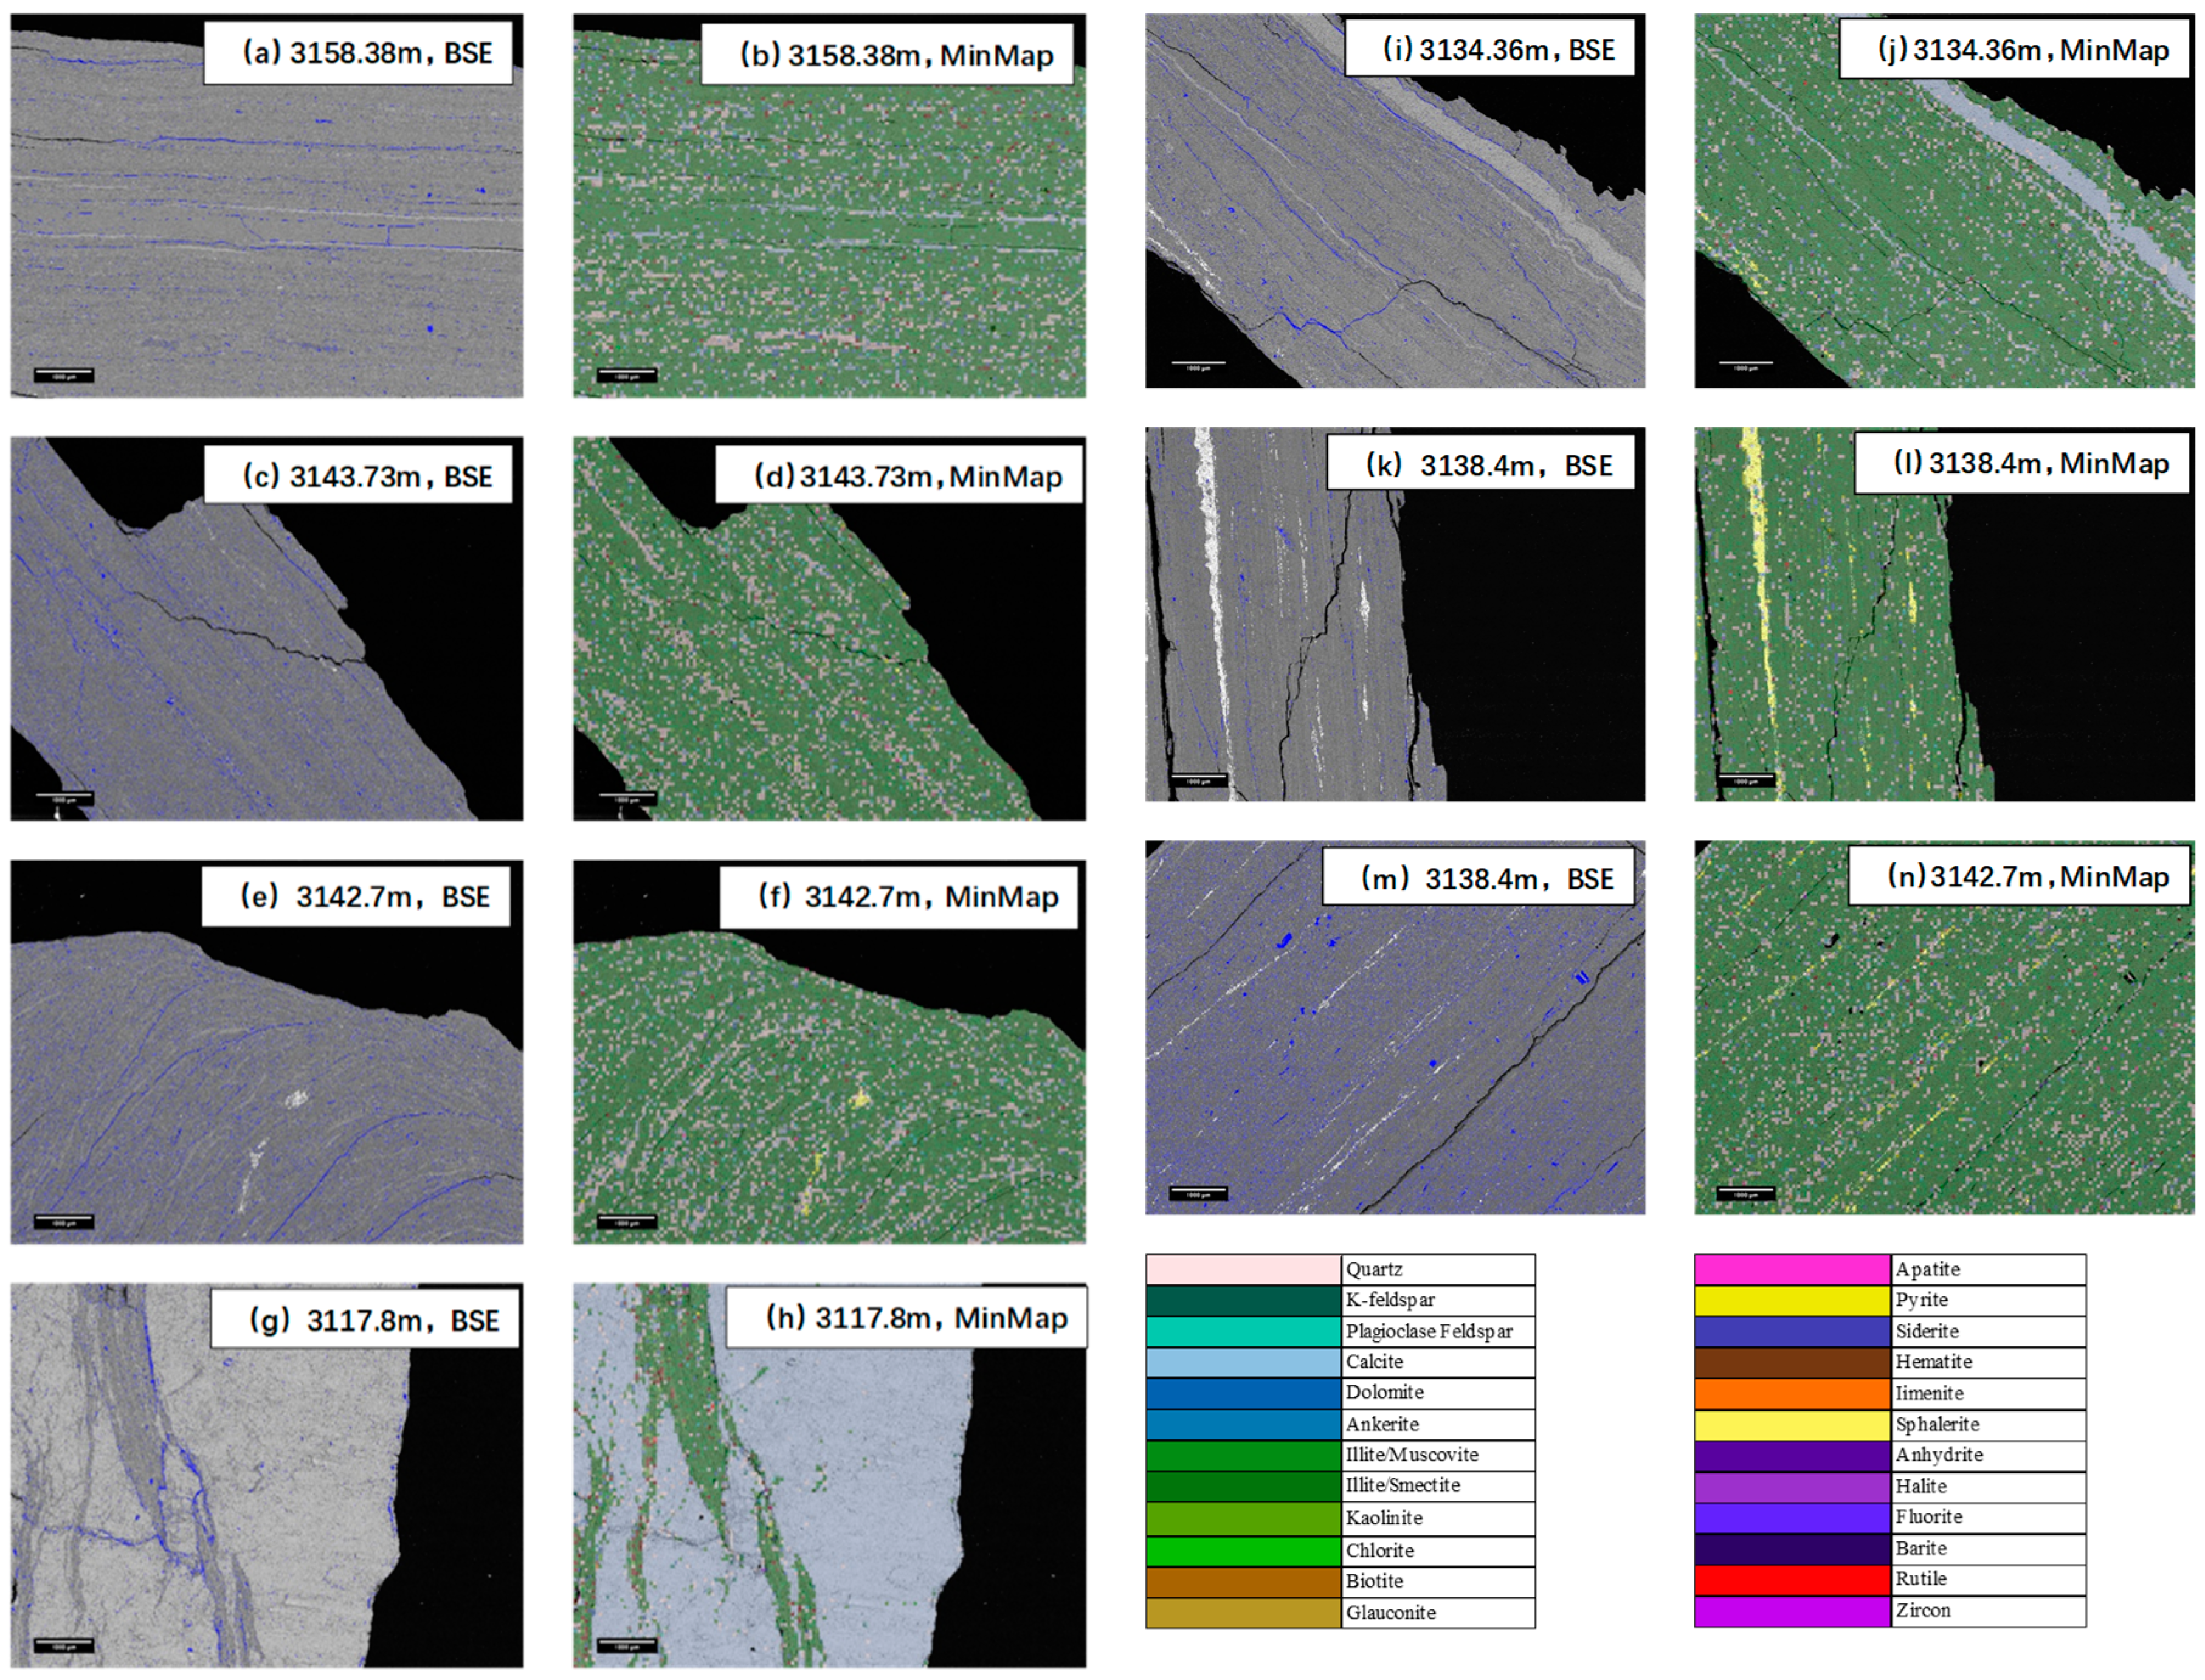
Figure 9.
Integrated model illustrating the hydrocarbon generation and evolution of the hybrid shale condense resources considering the four critical factors, i.e., the lacustrine shale components and lithofacies, the thermal maturity and hydrocarbon phases, the paleo-sedimentary environment, and the shale lamina.
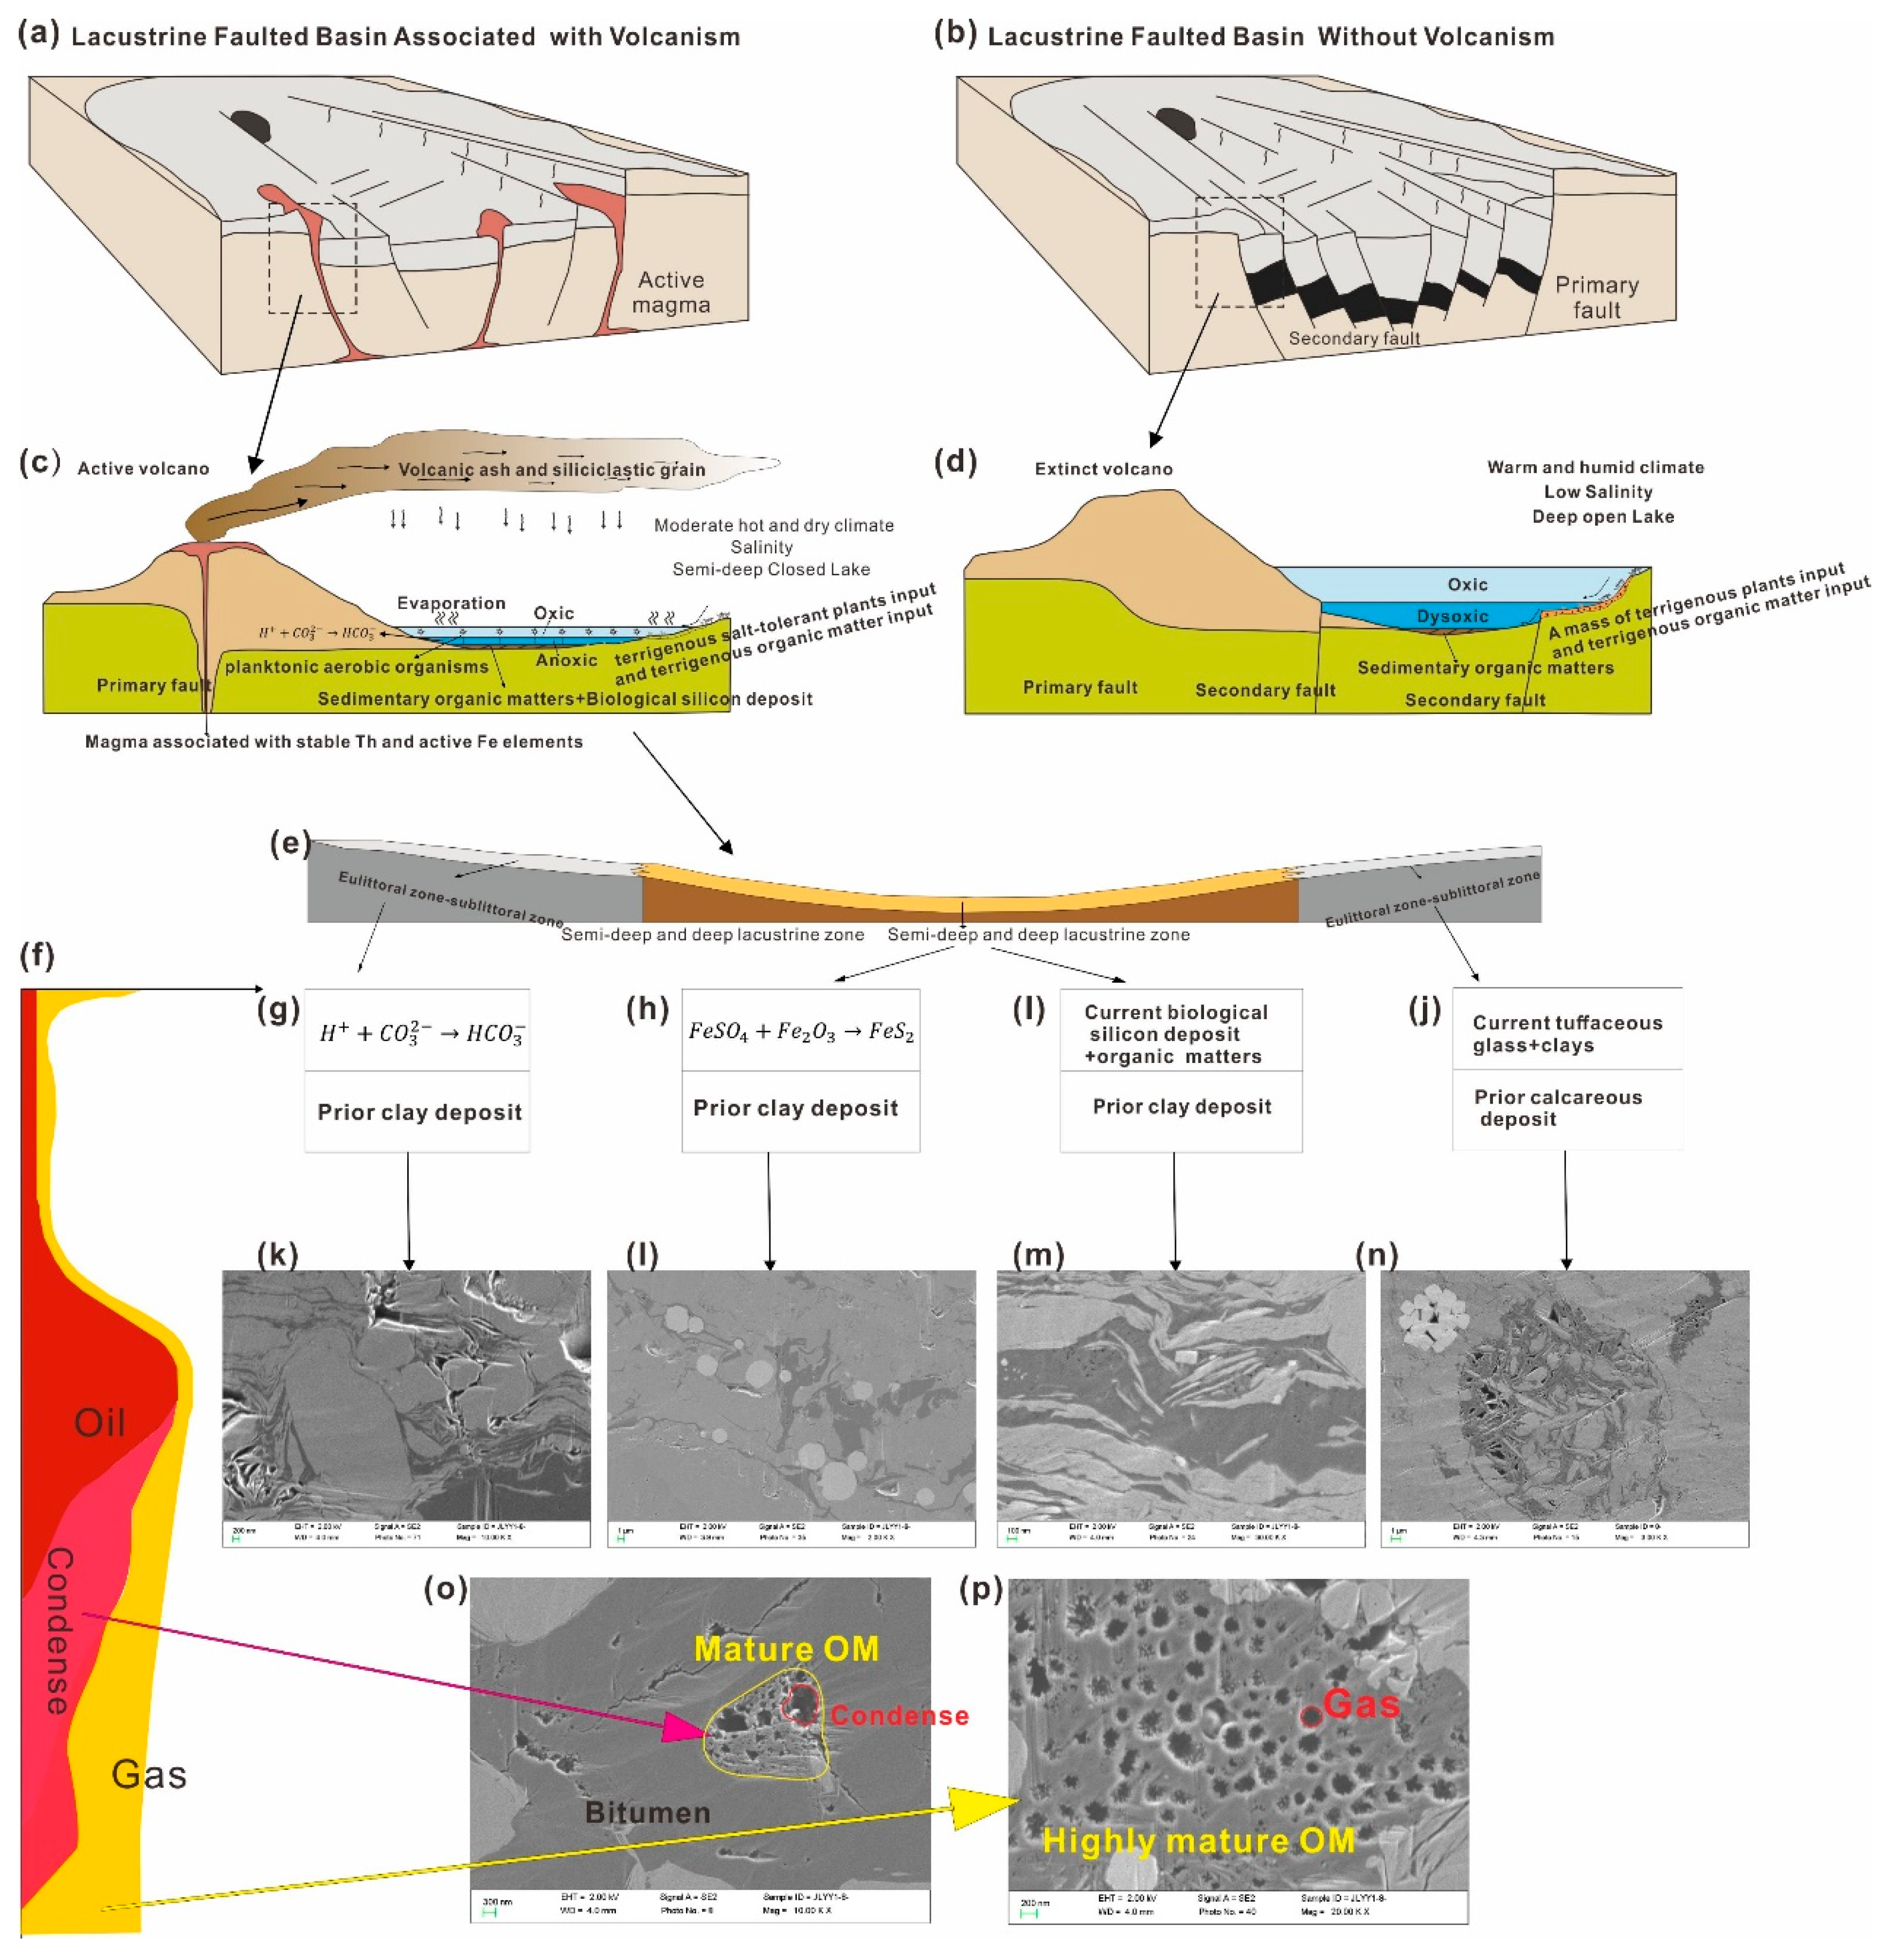

Table 1.
The second-month GOR was used to divide the reservoir into 12 PVT regions. GOR ranges were converted to specific gravity, because GOR may not accurately represent the solution GOR of the reservoir fluid and specific gravity.
Table 1.
The second-month GOR was used to divide the reservoir into 12 PVT regions. GOR ranges were converted to specific gravity, because GOR may not accurately represent the solution GOR of the reservoir fluid and specific gravity.
| Region | GOR range (scf/STB) | Number of wells | Specific gravity (°API) | Fluid type |
|---|---|---|---|---|
| 1 | 0–100 | 251 | 10.0–30.0 | Oil |
| 2 | 100–500 | 356 | 30.0–41.4 | Oil |
| 3 | 500–1000 | 1065 | 41.4–45.8 | Oil |
| 4 | 1000–1500 | 779 | 45.8–48.2 | Oil |
| 5 | 1500–2000 | 345 | 48.2–49.8 | Oil |
| 6 | 2000–3000 | 361 | 49.8–52.0 | Volatile oil |
| 7 | 3000–4000 | 252 | 52.0–53.5 | Rich condensate |
| 8 | 4000–5000 | 247 | 53.5–54.6 | Rich condensate |
| 9 | 5000–8000 | 406 | 54.6–56.7 | Condensate |
| 10 | 8000–15,000 | 499 | 56.7–59.4 | Condensate |
| 11 | 15,000–50,000 | 444 | 59.4–63.6 | Condensate |
| 12 | >50,000 | 405 | >63.6 | Dry gas |
Table 2.
Measured composition and fraction properties for five gas condensate regions. Separator gas and oil samples were captured and recombined to the reported GOR in the laboratory.
Table 2.
Measured composition and fraction properties for five gas condensate regions. Separator gas and oil samples were captured and recombined to the reported GOR in the laboratory.
| GOR(scf/STB) | 3000–4000 | 4000–5000 | 5000–8000 | 8000–15,000 | 15,000–50,000 |
|---|---|---|---|---|---|
| Specific gravity (°API) | 52.1 | 55.5 | N/A | 54.58 | N/A |
| Reservoir Pressure (psi) | 11,025 | 10,630 | 10,000 | 9300 | N/A |
| Reservoir Temperature (°F) | 321 | 328 | 300 | 290 | 275 |
| Dew point (psi) | 4312 | 4165 | 4050 | 3892 | 3310 |
| CO2 | 1.07 | 0.69 | 1.57 | 1.971 | 1.10 |
| N2 | 0.15 | 0.07 | 0.09 | 0.092 | 0.10 |
| C1 | 61.88 | 64.17 | 67.97 | 69.722 | 72.60 |
| C2 | 11.64 | 11.22 | 11.61 | 11.791 | 12.95 |
| C3 | 5.58 | 5.46 | 4.57 | 4.165 | 3.79 |
| I-C4 | 1.32 | 1.53 | 1.38 | 1.316 | 1.25 |
| N-C4 | 2.35 | 2.39 | 1.90 | 1.67 | 1.46 |
| I-C5 | 1.20 | 1.35 | 1.24 | 1.188 | 1.14 |
| N-C5 | 1.15 | 1.17 | 1.18 | 1.1878 | 1.19 |
| C6 | 1.53 | 1.67 | 0.89 | 0.534 | 0.41 |
| C7+mole% | 12.13 | 10.28 | 7.60 | 6.362 | 4.00 |
| C7+MW | 173.41 | 163.82 | 154 | 134.14 | 115 |
| C7+SG | 0.81 | 0.82 | 0.79 | 0.78 | 0.77 |
Disclaimer/Publisher’s Note: The statements, opinions and data contained in all publications are solely those of the individual author(s) and contributor(s) and not of MDPI and/or the editor(s). MDPI and/or the editor(s) disclaim responsibility for any injury to people or property resulting from any ideas, methods, instructions or products referred to in the content. |
© 2025 by the authors. Licensee MDPI, Basel, Switzerland. This article is an open access article distributed under the terms and conditions of the Creative Commons Attribution (CC BY) license (http://creativecommons.org/licenses/by/4.0/).
Copyright: This open access article is published under a Creative Commons CC BY 4.0 license, which permit the free download, distribution, and reuse, provided that the author and preprint are cited in any reuse.


