
Submitted:
25 November 2024
Posted:
27 November 2024
You are already at the latest version
Abstract
The COVID-19 pandemic significantly disrupted urban socio-economic development by limiting the movement of people and resources. As key hubs of talent, culture, and innovation, university fringe areas play an important role in driving economic and cultural growth. While previous research has focused more on urban vitality, there is relatively little research on the recovery of urban vitality in university fringe areas, and its driving mechanism has not been analyzed yet. This study aims to address this gap by exploring the influence mechanisms of urban vitality recovery in the university fringe areas using both linear and nonlinear models. The results reveal that: (1) The recovery of urban vitality in university fringe areas follows a distinct pattern where central urban areas with greater openness recover more rapidly, while university fringe areas farther from the city center with stricter management experience slower recovery. (2) The Student_Population, School_Area, All_POI_Density, and Opening_Hours exhibit a more pronounced linear relation-ship. Recovery effects also express significant spatial heterogeneity. (3) Both university Open-ing_Hours and School_Area show a nonlinear positive relationship with urban vitality recovery of university fringe areas. This relationship is characterized by slow growth at lower values, rapid acceleration once a critical threshold is reached, and eventual stabilization at higher values. This study offers targeted strategies for urban planning, fostering more responsive and adaptive urban governance that aligns with the evolving needs of urban development.
Keywords:
urban vitality
; university fringe
; spatial characteristics
; driving mechanisms
; SHAP
1. Introduction
The COVID-19 pandemic has had a profound impact on global socio-economic development [1,2,3,4]. In addition to triggering a severe public health crisis, it disrupted global supply chains, reduced consumer demand, and caused a sharp downturn in the global economy. To curb the spread of the virus, governments worldwide implemented strict lockdowns and social distancing measures, which led to business closures, a halt in tourism, the shutdown of educational institutions, and a standstill in urban life. In the first quarter of 2020, China’s Gross Domestic Product (GDP) contracted by 6.8%, while in the second quarter, the GDPs of the United States, the European Union, and Japan fell by 8.4%, 13.5%, and 10.3%, respectively [5]. As the pandemic was brought under control, economic activities and social life began to recover by 2023. However, the long-term effects of the pandemic are still evident, particularly in the social economy and culture [6,7].
Socio-economic development is typically measured using indicators such as GDP, per capita disposable income, and the Consumer Price Index (CPI) [8]. As an extension of these indicators, urban vitality is adopted to measure a city’s dynamism, attractiveness, and sustainability across economic, cultural, and social dimensions [9,10,11]. During the pandemic, the widespread cancellation or online transition of large-scale events resulted in a general decline in urban vitality, with areas that had higher pre-pandemic vitality levels experiencing more significant drops. As the world transitions into the post-pandemic era, urban vitality has gradually recovered with the resumption of offline activities, particularly in central urban areas, which have experienced faster growth. However, many cities continue to face challenges in fully recovering from the pandemic’s effects, with several regions yet to return to pre-2019 levels, and some areas still exhibiting a downward trend [12].
Current research on urban vitality is extensive, addressing aspects such as spatial-temporal changes [13,14], driving mechanisms, resilience strategies, and measurement and evaluation frameworks [15]. Studies vary in scale, ranging from neighborhood-level investigations to analyses focusing on entire cities and even countries [16,17]. Methodologically, a broad array of data extraction techniques has been employed, including deep learning [18] and pagerank algorithms [19], as well as feature summarization methods such as gradient boosting regression trees [20], random forest [21], support vector regression [22], and principal component analysis [23]. Drivers of urban vitality have been analyzed through models like regression analysis [24,25,26], machine learning [27,28], difference-in-differences [29], and spatial-temporal clustering [30]. The use of multi-source data and diverse methodologies has enhanced our understanding of the changes in urban vitality and its driving forces. However, there are several limitations in current research: Most research concentrates on macro-level policy analysis, overlooking the potential mechanism of urban vitality recovery in university fringe areas. Linear research methods dominate, with relatively limited studies on nonlinear influence mechanisms.
As an economic, cultural, transportation, and educational hub in eastern China, Nanjing is rich in historical and cultural resources and is home to numerous renowned universities. Prior to the pandemic, Nanjing’s GDP surpassed 1.4 trillion RMB in 2019, with an approximate year-on-year growth rate of 8%, indicating steady economic expansion [31]. However, during the pandemic, the city’s economic activities were severely disrupted, leading to a significant slowdown in economic development and a marked decline in the social operational rhythm, which hindered overall growth. In the post-pandemic era, Nanjing’s GDP for 2023 reached 1,742.14 billion RMB, reflecting a 4.6% year-on-year increase, highlighting the city’s considerable resilience [32]. Nevertheless, the recovery of urban vitality in university fringe areas has yet to be thoroughly investigated and examined.
Universities fringe areas, as central nodes of urban cultural and economic activity, significantly influence the development of their surrounding areas, with this influence closely tied to the intensity of university management [33]. Existing studies suggest that the area surrounding a university typically extends to approximately 500-meter from the campus [34], where the functions and layout are notably shaped by the presence of the university. Considering the campus’s scale, the dynamic interactions between campuses and their surrounding environments, and the practical needs of the people in these areas, this study uses buffer zones of 500-meter around universities as university fringe areas [35]. The research addresses three key issues: first, revealing the spatial characteristics of post-pandemic recovery of urban vitality in university fringe areas; second, exploring the linear and nonlinear effects of urban vitality recovery in university fringe areas; and third, analyzing the varying impacts of factors on urban vitality recovery in university fringe areas.
2. Material and methods
2.1. Study Area
Nanjing, located in southeastern China (Figure 1), is a culturally significant city and one of the core cities driving regional economic development [36]. In recent years, Nanjing’s economy has experienced steady growth, and in 2020, it entered the top ten cities in China in terms of economic output. Following the pandemic, Nanjing’s economy rebounded quickly, exhibiting a positive and stable trend, with the highest growth rate among the thirteen cities in Jiangsu Province [37]. Nanjing is not only known for its rich cultural heritage but also for its extensive higher education resources. The city is home to 33 undergraduate institutions, with a student population of approximately 710,000 and a total campus area of around 75,000 acres. These institutions are primarily concentrated in university towns such as Xianlin, Jiangning, Pukou, and Lishui, collectively forming a robust higher education system. During the pandemic, strict measures, including campus lockdowns and restrictions on external visitors, were implemented, significantly limiting economic and cultural activities in university fringe areas. In the post-pandemic era, university fringe areas have played a pivotal role in revitalizing Nanjing’s economic recovery, serving as a major driver of urban development and vitality [38].
2.2. Measurement of Urban Vitality
Urban vitality is a multidimensional attribute that encompasses economic, social, and cultural factors [39]. Existing studies commonly use NPP/VIIRS nighttime light (NTL) remote sensing data to calculate the average NTL as a proxy for urban vitality intensity. NTL data can effectively represent economic activities within urban areas, but it only reflects the city’s tangible strengths, lacking a depiction of its intangible or "soft" strengths [40]. To provide a more comprehensive measure of urban vitality, this study divides it into two dimensions: economic vitality and cultural vitality. Economic vitality, represented by average NTL, serves as the core indicator of a city’s economic strength, reflecting its capacity and potential for growth. In contrast, cultural vitality represents the cultural aspects of social behavior and demand, highlighting an important facet of a city’s soft power. The assessment of cultural vitality is based primarily on Points of Interest (POI) related to cultural activities, which reflect the distribution and density of cultural venues and events within the city. The study ultimately quantifies urban vitality in university fringe areas by equally weighting and summing economic vitality and cultural vitality. urban vitality recovery in university fringe areas is represented by the difference of urban vitality in 2024 and 2022.
2.3. Selection and Quantification of Influencing Factors
The intensity of university management is an important aspect affecting urban vitality recovery in university fringe areas, which includes weekly university opening hours (Opening_Hours), school area (School_Area), student enrollment (Student_Population), and restrictions on external access to the campus. These indicators collectively provide a scientific assessment of the management conditions and levels of external openness of universities in Nanjing following the pandemic [41]. Among these, the Opening_Hours reflect the extent of universities’ recovery and their frequency of external interactions post-pandemic, serving as a concrete measure of management intensity. The School_Area visually represents the scale of a university’s occupation of urban space. The Student_Population indicates the consumption potential of a university, contributing to the economic vitality of both the campus and surrounding areas. Together, these factors highlight a university’s scale, influence, and development potential, all of which have a significant impact on the urban vitality recovery in university fringe areas [42].
In addition to examining the influence of university management on urban vitality recovery, this research also considers several other dimensions, including the human environment, locational environment, and functional environment. The human environment primarily reflects urban living quality and spatial utilization, represented in this study by three indicators: population density (Population_Density), per capita green space (DisFmGreenSpace), and building density (Building_Density) [43]. The locational environment focuses on transportation accessibility and proximity to key urban resources, with relevant indicators such as road network density (RoadNet_Density), distance to bus and subway stations (DisToSubway, DisToBusStation), and distance to scenic spots (DisToAttraction) [44]. The functional environment emphasizes the distribution and diversity of urban functional facilities, measured by the density and diversity of POI (All_POI_Density, POI_Shannon_Index), which reflects the service resources and functional agglomeration within an area [45].
2.4. Traditional Linear Regression
In this study, the 500-meter buffer zone around the university is set as university fringe areas, mainly considering that this distance is the core area of the radiation-driven effect of the university [46]. The 500-meter range usually covers the main living and service circles around the university, which can fully reflect the driving effect of the university on the surrounding economic and cultural activities. Within this range, residents and various POI around universities are densely populated, and the data are more representative [47].
This study examines the linear impact of all factors on urban vitality recovery by applying both the Ordinary Least Squares (OLS) and Geographically Weighted Regression (GWR) models. To address dimensional differences among the various environmental variables and ensure data comparability, all variables were standardized. This method scales the range of each variable to a common interval (typically 0 to 1), effectively eliminating unit discrepancies and preventing analytical bias.
The normalization formula is expressed as Equation (1):
where denotes the normalized value, X represents the original value, and and are the minimum and maximum values of the variable, respectively.
To ensure the robustness of the regression analysis, a multicollinearity assessment was conducted using the Variance Inflation Factor (VIF), which helped mitigate the potential interference of multicollinearity with the regression model. Following this, the OLS method was employed to establish a baseline model, yielding overall linear estimation results. The significant factors identified in this initial model were then incorporated into the subsequent GWR analysis.
GWR is an extension or advanced form of OLS, which optimizes the regression coefficients for each geographic unit through local modeling, providing a better understanding of spatial heterogeneity in variables across different regions. Unlike the global linear estimates of the OLS model, GWR analyzes local characteristics at each spatial location, offering a more detailed analysis of spatial effects. This approach complements the limitations of the global model [48]. Specifically, the GWR model effectively identifies and quantifies the varying impacts of each factor on urban vitality recovery across space, particularly in areas with significant local differences. The GWR model is represented by Eq.(2):
where represents the spatial location of point , is the intercept at point , is the locally computed coefficient of the explanatory variable at location , and ε is the random error term.
2.5. Nonlinear Regression
We also apply the Shapley Additive exPlanations (SHAP) method to enhance the interpretability of the nonlinear impacts of factors. SHAP, a game theory-based approach proposed by Lundberg and Lee in 2017, is used to explain the predictions of machine learning models [49]. This method evaluates the importance of each input variable by calculating the marginal contribution of each feature when added to the model. The sign of the SHAP value indicates whether the impact is positive or negative, while the absolute value reflects the magnitude of its overall influence. The SHAP method has been widely adopted in urban geography [50].
During implementation, each feature is first identified, followed by the calculation of its respective contribution values. These contributions can be either positive or negative, depending on various factors. Finally, all contribution values are summed to derive the final result. The formula for calculating the SHAP value is as Eq.(3):
where denotes the sample, represents the feature of the sample, is the SHAP contribution value of the feature, is the model’s predicted value for the sample, and is the model baseline, which represents the mean value of the target variable across all samples.
The SHAP value provides an unbiased estimate of parameter weights, reflecting the contribution of a feature to the model’s prediction. A higher absolute mean SHAP value indicates a greater influence of the feature on the model’s outcome. When the SHAP value is greater than 0, it signifies a positive impact of the feature on the prediction; conversely, a SHAP value less than 0 indicates a negative impact. The influence range of SHAP features is determined by the cumulative positive and negative contributions of each feature, relative to the baseline.
2.6. Data Collection and Processing
The data utilized in this study were sourced from a variety of public and commercial platforms, providing comprehensive spatial and socio-economic information (Table 1). To ensure the accuracy and thoroughness of the data, university management indicators were automatically extracted through web scraping from the official websites of universities in Nanjing. These indicators included campus Opening_Hours, School_Area, Student_Population, and visitor restrictions. Additionally, the study verified each university’s opening policies and entry restrictions through telephone consultations with university management departments to ensure that the data remained current and accurate. School boundary data were obtained through visual interpretation using Google Earth. Urban vitality data were characterized using NTL data and cultural POI data, which were sourced from the Cube Data Club and the Geo-Big Data Platform, respectively. NTL data effectively reflects the intensity of urban economic activities, while cultural POI data provides insights into the distribution of cultural resources within a region. Additionally, population density, sourced from LandScan, was incorporated to assess the impact of population distribution on urban vitality. The green area data was obtained from the Remote Sensing Ecological Network and the building area data were sourced from Wu et al [51]. Both of these datasets provided crucial support for the comprehensive analysis in this study. All datasets were resampled into 30-meter, underwent a uniform projection transformation, and analyzed on a 90-meter grid to convey spatial variation.
3. Results
3.1. Spatial Characteristics of Urban Vitality Recovery
The pattern of urban vitality across different locations before and after the pandemic showed minimal change, as depicted in Figure 2 (a) and (b). University fringe areas in the central city continued to exhibit high levels of vitality, while suburban areas experienced lower vitality. This uneven distribution reflects disparities in resource allocation within urban development. High-vitality areas benefit primarily from comprehensive infrastructure, concentrated commercial activities, and an extensive public transportation network, which collectively facilitate the flow of people, goods, and capital.
In terms of vitality recovery, the overall pattern remains consistent (Figure 2(c)). The recovery rate of university fringe areas in central city is approximately 90%, compared to just 50% in suburban regions, highlighting the spatial heterogeneity in urban vitality recovery. Within these regions, areas surrounding clusters of universities demonstrate more pronounced vitality recovery. This pattern emphasizes the significant role of universities in fostering urban economic and cultural development. Changes in university management practices appear to be a key factor supporting the influence of universities on urban vitality recovery. High-value recovery areas make up 0.38% of the total grid, medium-value areas account for 47.12%, and low-value areas comprise 7.31%. While many areas near the city center have experienced rapid recovery, the recovery process remains slower in more distant suburban regions.
The global Moran’s I index of urban vitality recovery is 0.8527, indicating a strong spatial autocorrelation in the recovery of urban vitality in university fringe areas. Specifically, the results reveal that HH (High-High) areas account for 10.64%, HL (High-Low) areas for 0.02%, LH (Low-High) areas for 0.01%, and LL (Low-Low) areas for 6.32% (Figure 3). This distribution suggests that, from 2022 to 2024, urban vitality recovery of university fringe areas in Nanjing’s central city exhibited significant high-high clustering and diffusion trends. In contrast, the recovery of urban vitality around universities in peripheral urban areas displayed low-low clustering, reflecting the imbalance in urban development.
3.2. Linear Driver Analysis Based on GWR
We first assessed the correlation between selected factors and urban vitality recovery using the OLS model, excluding non-significant factors of DisFmGreenSpace and Building_Density (Table 2). The remaining significant factors were then incorporated into the GWR model for further analysis (Figure 4).
The results in Figure 4 show that All_POI_Density and university School_Area have a significant positive impact on university fringe areas within Nanjing’s urban districts. This suggests that a greater diversity of interest points and larger campus sizes help attract more activities and foot traffic. However, this influence gradually diminishes for universities located farther from the city center, potentially leading to underutilization of resources and resulting in inefficiencies. When analyzing Student_Population and Opening_Hours, a "rise-then-fall" trend emerges from the city center to the suburban areas. University density is another critical factor: moderate density tends to yield positive effects, while overly dense university clusters can have negative consequences. This suggests that universities exert a strong pull on university fringe areas, with students’ dependence on universities driving foot traffic concentration within the campuses. Further analysis revealed that Population_Density and RoadNet_Density have relatively low overall impact coefficients on urban vitality recovery in university fringe areas. These factors display a distribution pattern of "high values in the city center, moderate values in suburban areas, and low values in university-concentrated zones." In contrast, the influence of scenic spots follows a different pattern, with "higher impacts in suburban areas and lower impacts in both the city center and university-concentrated zones." POI_Shannon_Index exhibits a similar, albeit weaker, trend compared to scenic spots.
3.3. Nonlinear Driver Analysis Based on SHAP
Figure 5 shows that All_POI_Density is the most influential factor in urban vitality recovery, with a positive correlation—higher density leads to stronger vitality. Conversely, POI_Shannon_Index negatively correlates with vitality. The Student_Population also positively affects vitality recovery, although high sample values are concentrated in areas with negative SHAP values, suggesting that the impact of student numbers may vary by region. While Population_Density has a positive influence. The DisToSubway and DisToBusStation are notable negative factors, with high-value samples scattered across both low and high SHAP regions, highlighting transportation’s critical role in vitality recovery. RoadNet_Density, while mostly showing low sample values, has an overall positive impact trend. Additionally, factors like university Opening_Hours, School_Area, and DisToAttraction show limited impact on vitality recovery in urban districts, but suggesting significant non-linear relationships. In summary, All_POI_Density, Student_Population, School_Area, Opening_Hours, and public transportation are the core drivers of urban vitality recovery. Public transportation fosters interaction, while areas with high All_POI_Density serve as key consumption hubs for students, emphasizing the role of Student_Population in economic recovery and the potential impact of university management changes on urban vitality recovery.
Figure 6 demonstrates that while confidence levels decrease slightly with higher All_POI_Density, the overall effect shows that increased All_POI_Density boosts urban development and revitalizes vitality in university fringe areas. The impact of the university School_Area on urban vitality recovery exhibits a notable scale effect. Medium-sized campuses have a significant influence on urban vitality recovery in university fringe areas, while smaller School_Area are less effective in driving recovery in university fringe areas. An increase in Student_Population also promotes vitality recovery, driving economic activities on campus and stimulating consumption and cultural events in university fringe areas. Population_Density has a clear positive relationship with vitality recovery, particularly in central city areas, where high density accelerates both economic and cultural activity. Opening_hours are crucial for vitality restoration, with the greatest impact when they cover about 30% of the day.
In areas with low RoadNet_Density, vitality recovery samples are sparse and exhibit lower confidence levels. As RoadNet_Density increases, urban vitality recovery peaks when the density reaches 60%, indicating an optimal RoadNet_Density that effectively supports vitality restoration. Many recovery samples are concentrated in areas within medium to short DisToSubway, with the influence diminishing as distance increases. In contrast to subways, the DisToBusStation has a more pronounced effect on urban vitality recovery, especially when nearby. The DisToAttraction also influences vitality recovery. A moderate increase in attractions enhances vitality, particularly in nearby areas, by attracting tourists and residents. However, this effect weakens as the distance increases. Finally, POI_Shannon_Index has a nonlinear relationship with vitality. While diverse POI can boost vitality, excessive variety may lead to fragmented vitality distribution, as seen in the uneven distribution of density samples.
4. Discussion
4.1. Contribution of This Study
This study investigates the recovery of urban vitality in university fringe areas by integrating changes in university management into the framework. This study examines multiple dimensions, including the living, locational, and functional environments. The analysis assesses both the linear and nonlinear impacts of multi-dimensions factors on the recovery of urban vitality in university fringe areas. The findings highlight the spatially dynamic relationship between influencing factors and surrounding urban vitality, capturing geographically heterogeneous factors that influence this process.
The main innovations of this study are twofold. First, it incorporates university management factors into the framework for analyzing urban vitality recovery, offering a fresh perspective on the drivers of urban vitality. Second, by combining both linear and nonlinear methods, and utilizing techniques such as GWR and SHAP, the study reveals the complex effects of various factors on urban vitality recovery. This multidimensional approach allows for a more nuanced understanding of the dynamic interactions between university management intensity and surrounding urban vitality, providing valuable insights for urban planning and management.
4.2. Comparison with Existing Studies
Compared with previous studies, this study has significant advantages in terms of factor selection, impact intensity and effect heterogeneity. First, in terms of factor selection, most of the traditional studies have focused on basic indicators such as economy, population density, and transportation, and most of the existing literature has neglected the unique role of educational institutions in promoting the recovery of urban vitality, especially the special position of universities as cultural and knowledge centers in the post epidemic era [52]. This study fills in the gap by going beyond the traditional economic and cultural indicators, and innovatively adding the intensity of university management as the novel variable. Second, traditional studies tend to use global regression models, such as OLS which are difficult to effectively capture spatial heterogeneity [53]. This study, on the other hand, combines linear and non-linear analytical methods and utilizes GWR models to meticulously assess the impact of vitality factors in each region, which is able to reveal the variability and local patterns among different regions, thus providing a more accurate spatial analysis. In contrast, many previous studies have failed to adequately consider this spatial level of variability. Finally, this study found significant differences in the response of different regions to the intensity of university management through heterogeneity analyses, challenging the homogeneous impact model commonly used in previous studies [54]. By dynamically comparing the data before and after the epidemic, we further reveal the critical role of universities in the recovery of urban vitality, especially in the later stages of the epidemic, when the intensity of university management has become more prominent in promoting the recovery of urban vitality, providing empirical support for urban development strategies in the post-epidemic era.
4.3. Limitations
Despite the important findings of this study, a number of limitations remain. First, while university management intensity was introduced as a key variable, other potential influences have not been fully explored, such as qualitative factors like community involvement and cultural identity that could provide deeper insights into urban vitality. Second, this study is limited to the 500-meter buffer zone around the university, which is a single scale of study and may not be able to fully reveal the scope of the spatial influence of universities on urban vitality; considering buffer zones at different scales may be able to better capture the multilevel impacts of the radiation effects of universities. Finally, this study was conducted in Nanjing, and future research should be extended to other cities to verify the generalizability and applicability of the findings. Incorporating these improvements will provide future studies with broader insights and a more comprehensive understanding on urban vitality recovery.
5. Conclusions
This study explores the influence mechanisms and spatial heterogeneity of urban vitality recovery in university fringe areas in Nanjing. By incorporating university management factors, we expand the scope of traditional macro-policy analysis to multiple dimensions, using both linear and nonlinear models. The results show that university management policies have played a significant role in urban vitality recovery. The vitality recovery in university fringe areas in downtown Nanjing shows a distinct “high-high agglomeration” trend, while vitality recovery around universities in suburban areas presents a low-low agglomeration pattern. Urban vitality recovery is shaped by the basic pattern of "higher in the center, lower in the suburbs," along with the density of universities. Factors such as Student_Population, School_Area, All_POI_Density, and Opening_Hours, which have strong linear driving effects, should be reinforced, while factors with more pronounced non-linear characteristics, such as POI_Shannon_Index and DisToAttraction, need to be adjusted according to their specific traits. The study demonstrates that university management plays a crucial role in urban vitality recovery by influencing surrounding economic and cultural activities. This, in turn, provided implications for urban governance, to aligned with the dynamic needs of urban development.
Author Contributions
Conceptualization, Z.C.and S.W.; methodology, D.L.; software, B.J.; validation, D.L., B.J. and H.L.; formal analysis, Z.C.; investigation, B.J.; resources, S.W.; data curation, H.L.; writing—original draft preparation, D.L.; writing—review and editing, Z.C.; visualization, Z.C.; supervision, D.L.; project administration, D.L. and H.L.; funding acquisition, Z.C.and S.W. All authors have read and agreed to the published version of the manuscript.
Funding
This research was funded by the National Key R&D Program “Optimization and System Restoration Technology of Production, Living, and Ecological Spaces in Industrial and Mining Towns” (No. 2023YFC3804202) ,The Special Research Project of the Jiangsu Provincial Higher Education Society’s Counselor Work Research Committee: "Construction of a Cultural Education Integration System for the Surveying and Mapping Discipline Guided by the ’ Beidou spirit in the new era’ in the New Era"(No. 23FYHYB016), The Ministry of Education’s Third Phase Supply and Demand Matching Employment Education Project: "Construction of the ’Three Phases and Three Drives’ Internship and Practice Base for Surveying and Mapping Talent" (No. 2024011106604), Ministry of Education’s Humanities and Social Sciences Research Special Task Project: "Research on Methods and Pathways for Cultivating a Strong Academic Atmosphere from the Perspective of Student Development Theory" (No. 20JDSZ3196).
Data Availability Statement
The datasets used and/or analyzed during the current study are available from the corresponding author on reasonable request.
Conflicts of Interest
The authors declare no conflicts of interest.
References
- Li, Y.; Niu, Y. A commentary on "The socio-economic implications of the coronavirus pandemic (COVID-19): A review". Int. J. Surg. 2021, 95, 106048. [Google Scholar] [CrossRef] [PubMed]
- Clement, A. Tisdell,Economic, social and political issues raised by the COVID-19 pandemic,Economic Analysis and Policy,2020(68),p.
- Hu, X.; Li, L.; Dong, K. What matters for regional economic resilience amid COVID-19? Evidence from cities in Northeast China. Cities 2022, 120, 103440. [Google Scholar] [CrossRef] [PubMed]
- Rakesh Padhan, K.P. Prabheesh,The economics of COVID-19 pandemic: A survey,Economic Analysis and Policy, 2021(70),p. 220-237.
- Wickramasinghe, K.; Naranpanawa, A. Tourism and COVID-19: An economy-wide assessment. J. Hosp. Tour. Manag. 2023, 55, 131–138. [Google Scholar] [CrossRef]
- Ye, C.; Zhu, J.; Li, S.; Yang, S.; Chen, M. Assessment and analysis of regional economic collaborative development within an urban agglomeration: Yangtze River Delta as a case study. 2018, 83, 20–29. [CrossRef]
- Chen, D.; Hu, W.; Li, Y.; Zhang, C.; Lu, X.; Cheng, H. Exploring the temporal and spatial effects of city size on regional economic integration: Evidence from the Yangtze River Economic Belt in China. Land Use Policy 2023, 132, 106770. [Google Scholar] [CrossRef]
- Xinyue Fan,Research on the coupling of ecological environment and socio-economic development in resource-based cities: Based on scenario simulation method,Sustainable Cities and Society,2024(114),105810.
- Yang Hui, He Qingping, Cui Lliu, et al. Exploring the Spatial Relationship between Urban Vitality and Urban Carbon Emissions. Remote Sens. 2023, 15, 2173.
- Omer Dogan, Sugie Lee,Jane Jacobs’s urban vitality focusing on three-facet criteria and its confluence with urban physical complexity,Cities,2024(155),105446.
- Liu, H.; Gou, P.; Xiong, J. Vital triangle: A new concept to evaluate urban vitality. Comput. Environ. Urban Syst. 2022, 98, 101886. [Google Scholar] [CrossRef]
- Yuan, Z.; Hu, W. Urban resilience to socioeconomic disruptions during the COVID-19 pandemic: Evidence from China. Int. J. Disaster Risk Reduct. 2023, 91, 103670–103670. [Google Scholar] [CrossRef]
- Ouyang, J.; Fan, H.; Wang, L.; Zhu, D.; Yang, M. Revealing urban vibrancy stability based on human activity time-series. Sustain. Cities Soc. 2022, 85, 104053. [Google Scholar] [CrossRef]
- Zeng Zhiwei, Li Yilei, Tang Hui. Multidimensional Spatial Driving Factors of Urban Vitality Evolution at the Subdistrict Scale of Changsha City, China, Based on the Time Series of Human Activities. Buildings. 2023; 13(10):2448.
- Wang, H.; Xue, H.; He, W.; Han, Q.; Xu, T.; Gao, X.; Liu, S.; Jiang, R.; Huang, M. Spatial-temporal evolution mechanism and dynamic simulation of the urban resilience system of the Guangdong-Hong Kong-Macao Greater Bay Area in China. Environ. Impact Assess. Rev. 2024, 104. [Google Scholar] [CrossRef]
- Zhang, Z.; Zhao, L.; Zhang, M. Exploring Non-linear Urban Vibrancy Dynamics in Emerging New Towns: A Case Study of the Wuhan Metropolitan Area. Sustain. Cities Soc. 2024, 112, 105580. [Google Scholar] [CrossRef]
- Liu, S.; Ge, J.; Ye, X.; Wu, C.; Bai, M. Urban vitality assessment at the neighborhood scale with geo-data: A review toward implementation. J. Geogr. Sci. 2023, 33, 1482–1504. [Google Scholar] [CrossRef]
- Li, X.; Li, Y.; Jia, T.; Zhou, L.; Hijazi, I.H. The six dimensions of built environment on urban vitality: Fusion evidence from multi-source data. Cities 2022, 121, 103482. [Google Scholar] [CrossRef]
- Li, S.; Chen, P.; Hui, F.; Gong, M. Evaluating urban vitality and resilience under the influence of the COVID-19 pandemic from a mobility perspective: A case study in Shenzhen, China. J. Transp. Geogr. 2024, 117, 103886. [Google Scholar] [CrossRef]
- Peter Berrill, Florian Nachtigall, Aneeque Javaid, et al,Comparing urban form influences on travel distance, car ownership, and mode choice,Transportation Research Part D: Transport and Environment,2024(128),104087.
- Lin, J.; Wei, K.; Guan, Z. Exploring the connection between morphological characteristic of built-up areas and surface heat islands based on MSPA. Urban Clim. 2024, 53, 101764. [Google Scholar] [CrossRef]
- Wang, Z.; Wang, X.; Liu, Y.; Zhu, L. Identification of 71 factors influencing urban vitality and examination of their spatial dependence: A comprehensive validation applying multiple machine-learning models. Sustain. Cities Soc. 2024, 108, 105491. [Google Scholar] [CrossRef]
- Paköz, M.Z.; Işık, M. Rethinking urban density, vitality and healthy environment in the post-pandemic city: The case of Istanbul. Cities 2022, 124, 103598. [Google Scholar] [CrossRef]
- Chen, Y.; Yu, B.; Shu, B.; Yang, L.; Wang, R. Exploring the spatiotemporal patterns and correlates of urban vitality: Temporal and spatial heterogeneity. Sustain. Cities Soc. 2023, 91, 104440. [Google Scholar] [CrossRef]
- Chen, J.; Ren, K.; Li, P.; Wang, H.; Zhou, P. Toward effective urban regeneration post-COVID-19: Urban vitality assessment to evaluate people preferences and place settings integrating LBSNs and POI. Environ. Dev. Sustain. 2024, 1–24. [Google Scholar] [CrossRef]
- Xiao, L.; Liu, J. Exploring non-linear built environment effects on urban vibrancy under COVID-19: The case of Hong Kong. Appl. Geogr. 2023, 155, 102960. [Google Scholar] [CrossRef]
- He, S.; Zhang, Z.; Yu, S.; Xia, C.; Tung, C.-L. Investigating the effects of urban morphology on vitality of community life circles using machine learning and geospatial approaches. Appl. Geogr. 2024, 167, 103287. [Google Scholar] [CrossRef]
- Chen, Y.; Li, B.; Liu, S.; Cai, Z. Exploring the Impact of Public Health Emergencies on Urban Vitality Using a Difference-In-Difference Model. Remote. Sens. 2024, 16, 1697. [Google Scholar] [CrossRef]
- Chen, M.; Liu, Y.; Ye, Z.; Wang, S.; Zhang, W. Vivid London: Assessing the resilience of urban vibrancy during the COVID-19 pandemic using social media data. Sustain. Cities Soc. 2024, 115, 105823. [Google Scholar] [CrossRef]
- Jiao, Gengying, Lin Lu, Guangsheng Chen, et al. "Spatiotemporal Characteristics and Influencing Factors of Tourism Revenue in the Yangtze River Delta Urban Agglomeration Region during 2001–2019" Sustainability,2021; 13(7):3658.
- Jia, Z.; Wen, S.; Lin, B. The effects and reacts of COVID-19 pandemic and international oil price on energy, economy, and environment in China. Appl. Energy 2021, 302, 117612. [Google Scholar] [CrossRef]
- Cetin, M.; Aksoy, T.; Cabuk, S.N.; Kurkcuoglu, M.A.S.; Cabuk, A. Employing remote sensing technique to monitor the influence of newly established universities in creating an urban development process on the respective cities. Land Use Policy 2021, 109. [Google Scholar] [CrossRef]
- Cosentino, C.; Sarli, A.; Guasconi, M.; Mozzarelli, F.; Foà, C.; De Simone, R.; Argiropoulos, D.; Artioli, G.; Bonacaro, A. Measuring the psychosocial impact of COVID-19 by means of the “international student well-being study questionnaire”: Evidence on Italian university students. Heliyon 2024, 10, e28342. [Google Scholar] [CrossRef] [PubMed]
- Doan, Q.C.; Ma, J.; Chen, S.; Zhang, X. Nonlinear and threshold effects of the built environment, road vehicles and air pollution on urban vitality. Landsc. Urban Plan. 2025, 253, 105204. [Google Scholar] [CrossRef]
- Mohammed, Ahmed M.S., and Tetsuya Ukai. "University campuses as agents for urban change" Environmental & Socio-economic Studies, Sciendo, 2022(10), p. 22-37.
- Shi Yishao, Zheng Jiagwen, Pei Xiaowen Measurement. Method and Influencing Mechanism of Urban Subdistrict Vitality in Shanghai Based on Multisource Data. Remote Sensing. 2023; 15(4):932.
- Lin Xiaochen, Long Hai, Chen Yu. Looking Back Deeper, Recovering up Better: Resilience-Oriented Contrarian Thinking about COVID-19 Economic Impact. Sustainability. 2024; 16(15):6687.
- Yang Yi, Wang Hong, Qin Shuhong, et al. Analysis of Urban Vitality in Nanjing Based on a Plot Boundary-Based Neural Network Weighted Regression Model. ISPRS International Journal of Geo-Information. 2022; 11(12):624.
- Guo, X.; Yang, Y.; Cheng, Z.; Wu, Q.; Li, C.; Lo, T.; Chen, F. Spatial social interaction: An explanatory framework of urban space vitality and its preliminary verification. 2021, 121, 103487. [CrossRef]
- Del Castillo, M.F.P.; Fujimi, T.; Tatano, H. Estimating medium-term regional monthly economic activity reductions during the COVID-19 pandemic using nighttime light data. Int. J. Appl. Earth Obs. Geoinformation 2024, 135. [Google Scholar] [CrossRef]
- Abdulrahman, M. Jabour,Continuous measurement of university students stress level during COVID-19 lockdown: Longitudinal study,Informatics in Medicine Unlocked,2024(49),101560.
- He, Q.S.; He, W.S.; Song, Y.; Wu, J.Y.; Yin, C.H.; Mou, Y.C. The impact of urban growth patterns on urban vitality in newly built-up areas based on an association rules analysis using geographical ‘big data’. Land Use Policy 2018, 78, 726–738. [Google Scholar] [CrossRef]
- Geng, H.; Lin, T.; Han, J.; Zheng, Y.; Zhang, J.; Jia, Z.; Chen, Y.; Lin, M.; Yu, L.; Zhang, Y. Urban green vitalization and its impact on green exposure equity: A case study of Shanghai city, China. J. Environ. Manag. 2024, 370, 122889. [Google Scholar] [CrossRef]
- Minaei, M. Evolution, density and completeness of OpenStreetMap road networks in developing countries: The case of Iran. Appl. Geogr. 2020, 119, 102246. [Google Scholar] [CrossRef]
- Duan, J.; Wang, H.; Liu, L.; Zhang, J. The attraction gradient of urban functions: How does functional mix at multiple scales predict urban vitality. Cities 2025, 156, 105516. [Google Scholar] [CrossRef]
- Sukwai Janjira, Mishima Nobuo, Srinurak Nattasit. Balancing Cultural Heritage Conservation: Visual Integrity Assessment to Support Change Management in the Buffer Zone of Chiang Mai Historic City Using GIS and Computer-Generated 3D Modeling. Land. 2022; 11(5):666.
- Geng Ma, Paola Pellegrini, Hao Wu, et al. TI - Impact of Land-Use Mixing on the Vitality of Urban Parks: Evidence from Big Data Analysis in Suzhou, Yangtze River Delta Region, China, Journal of Urban Planning and Developm ent,2023(149),04023045.
- Wu, D. Spatially and temporally varying relationships between ecological footprint and influencing factors in China’s provinces Using Geographically Weighted Regression (GWR). J. Clean. Prod. 2020, 261, 121089. [Google Scholar] [CrossRef]
- S.M.Lundberg, S.I.,Lee, A unified approach to interpreting model predictionsProceedings of the 31st International Conference on Neural Information Processing Systems, 2017 (12), p. 4768-4777.
- Yuan, Y.; Guo, W.; Tang, S.; Zhang, J. Effects of patterns of urban green-blue landscape on carbon sequestration using XGBoost-SHAP model. J. Clean. Prod. 2024, 476, 143640. [Google Scholar] [CrossRef]
- Wanben Wu, CNBH-10 m: A first Chinese building height at 10 m resolution, Remote Sensing of Environment, 2023(291),113578.
- Lan, F.; Gong, X.; Da, H.; Wen, H. How do population inflow and social infrastructure affect urban vitality? Evidence from 35 large- and medium-sized cities in China. Cities 2020, 100, 102454. [Google Scholar] [CrossRef]
- Ding, J.; Luo, L.; Shen, X.; Xu, Y. Influence of built environment and user experience on the waterfront vitality of historical urban areas: A case study of the Qinhuai River in Nanjing, China. Front. Arch. Res. 2023, 12, 820–836. [Google Scholar] [CrossRef]
- Ziyu Chen, Binzizi Dong, Qing Pe, et al. The impacts of urban vitality and urban density on innovation: Evidence from China’s Greater Bay Area,Habitat International,2022(119),102490.
Figure 1.
Location of the Study Area.
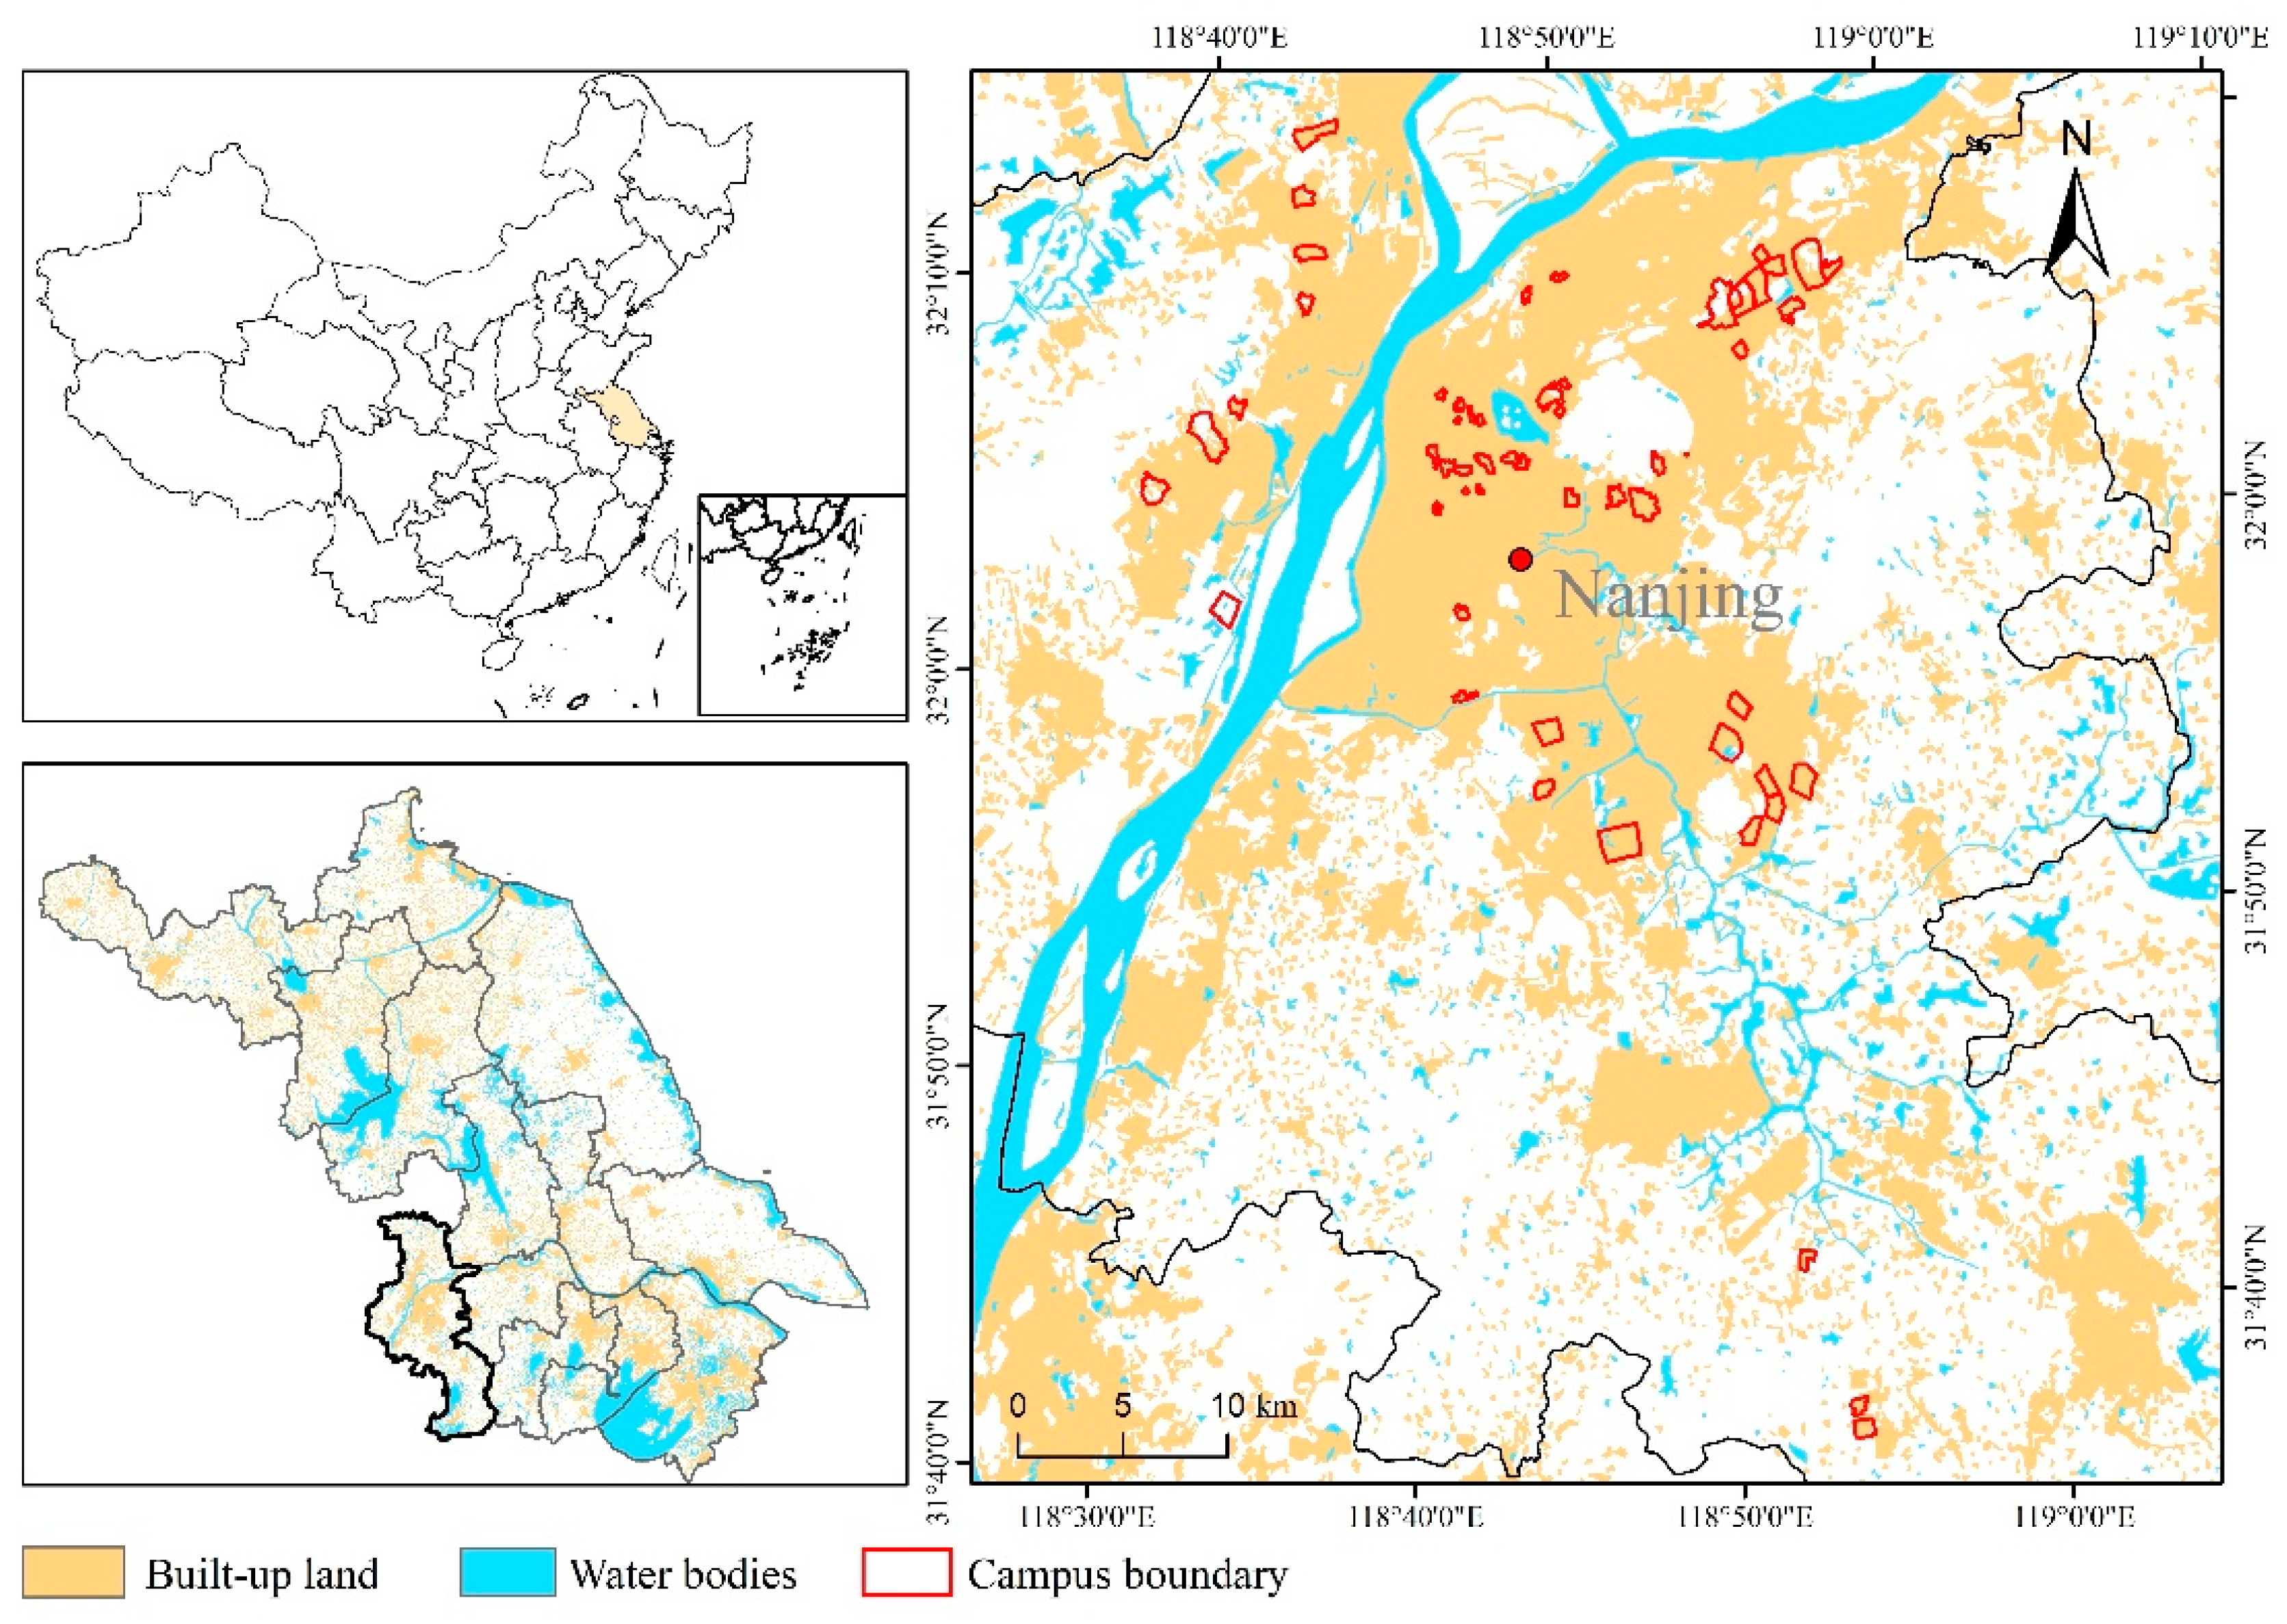
Figure 2.
Spatial characteristics of urban vitality. (a) Urban vitality in 2022; (b) Urban vitality in 2024; (c) Urban vitality recovery from 2022 to 2024.
Figure 2.
Spatial characteristics of urban vitality. (a) Urban vitality in 2022; (b) Urban vitality in 2024; (c) Urban vitality recovery from 2022 to 2024.
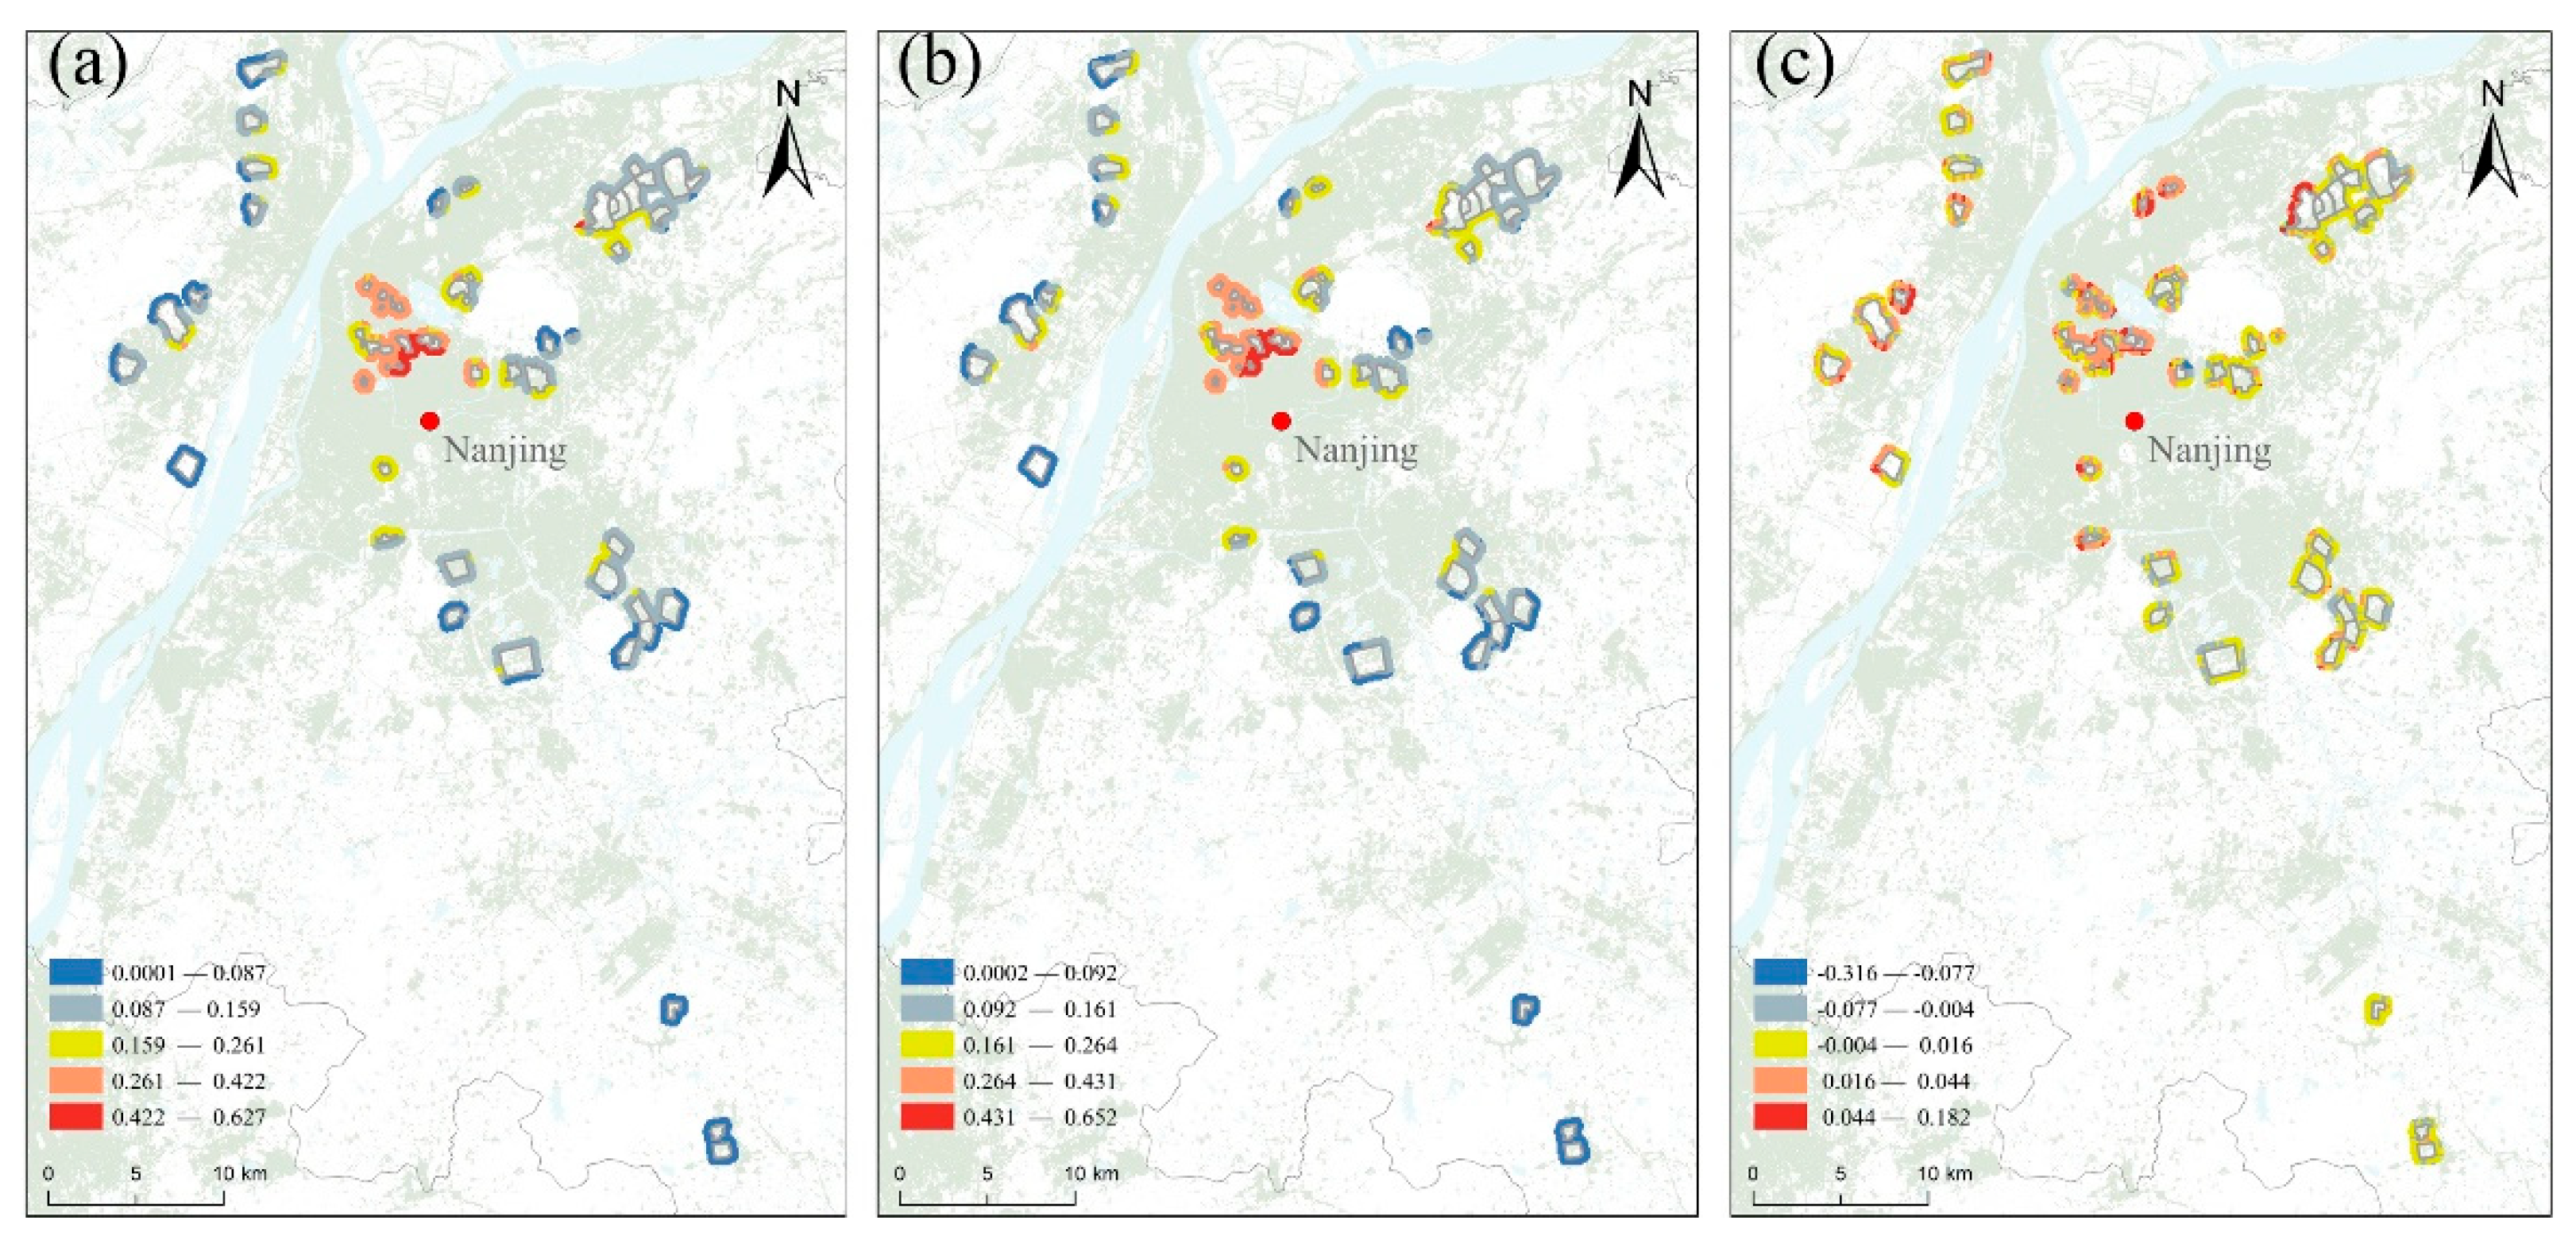
Figure 3.
Local spatial autocorrelation of urban vitality recovery.
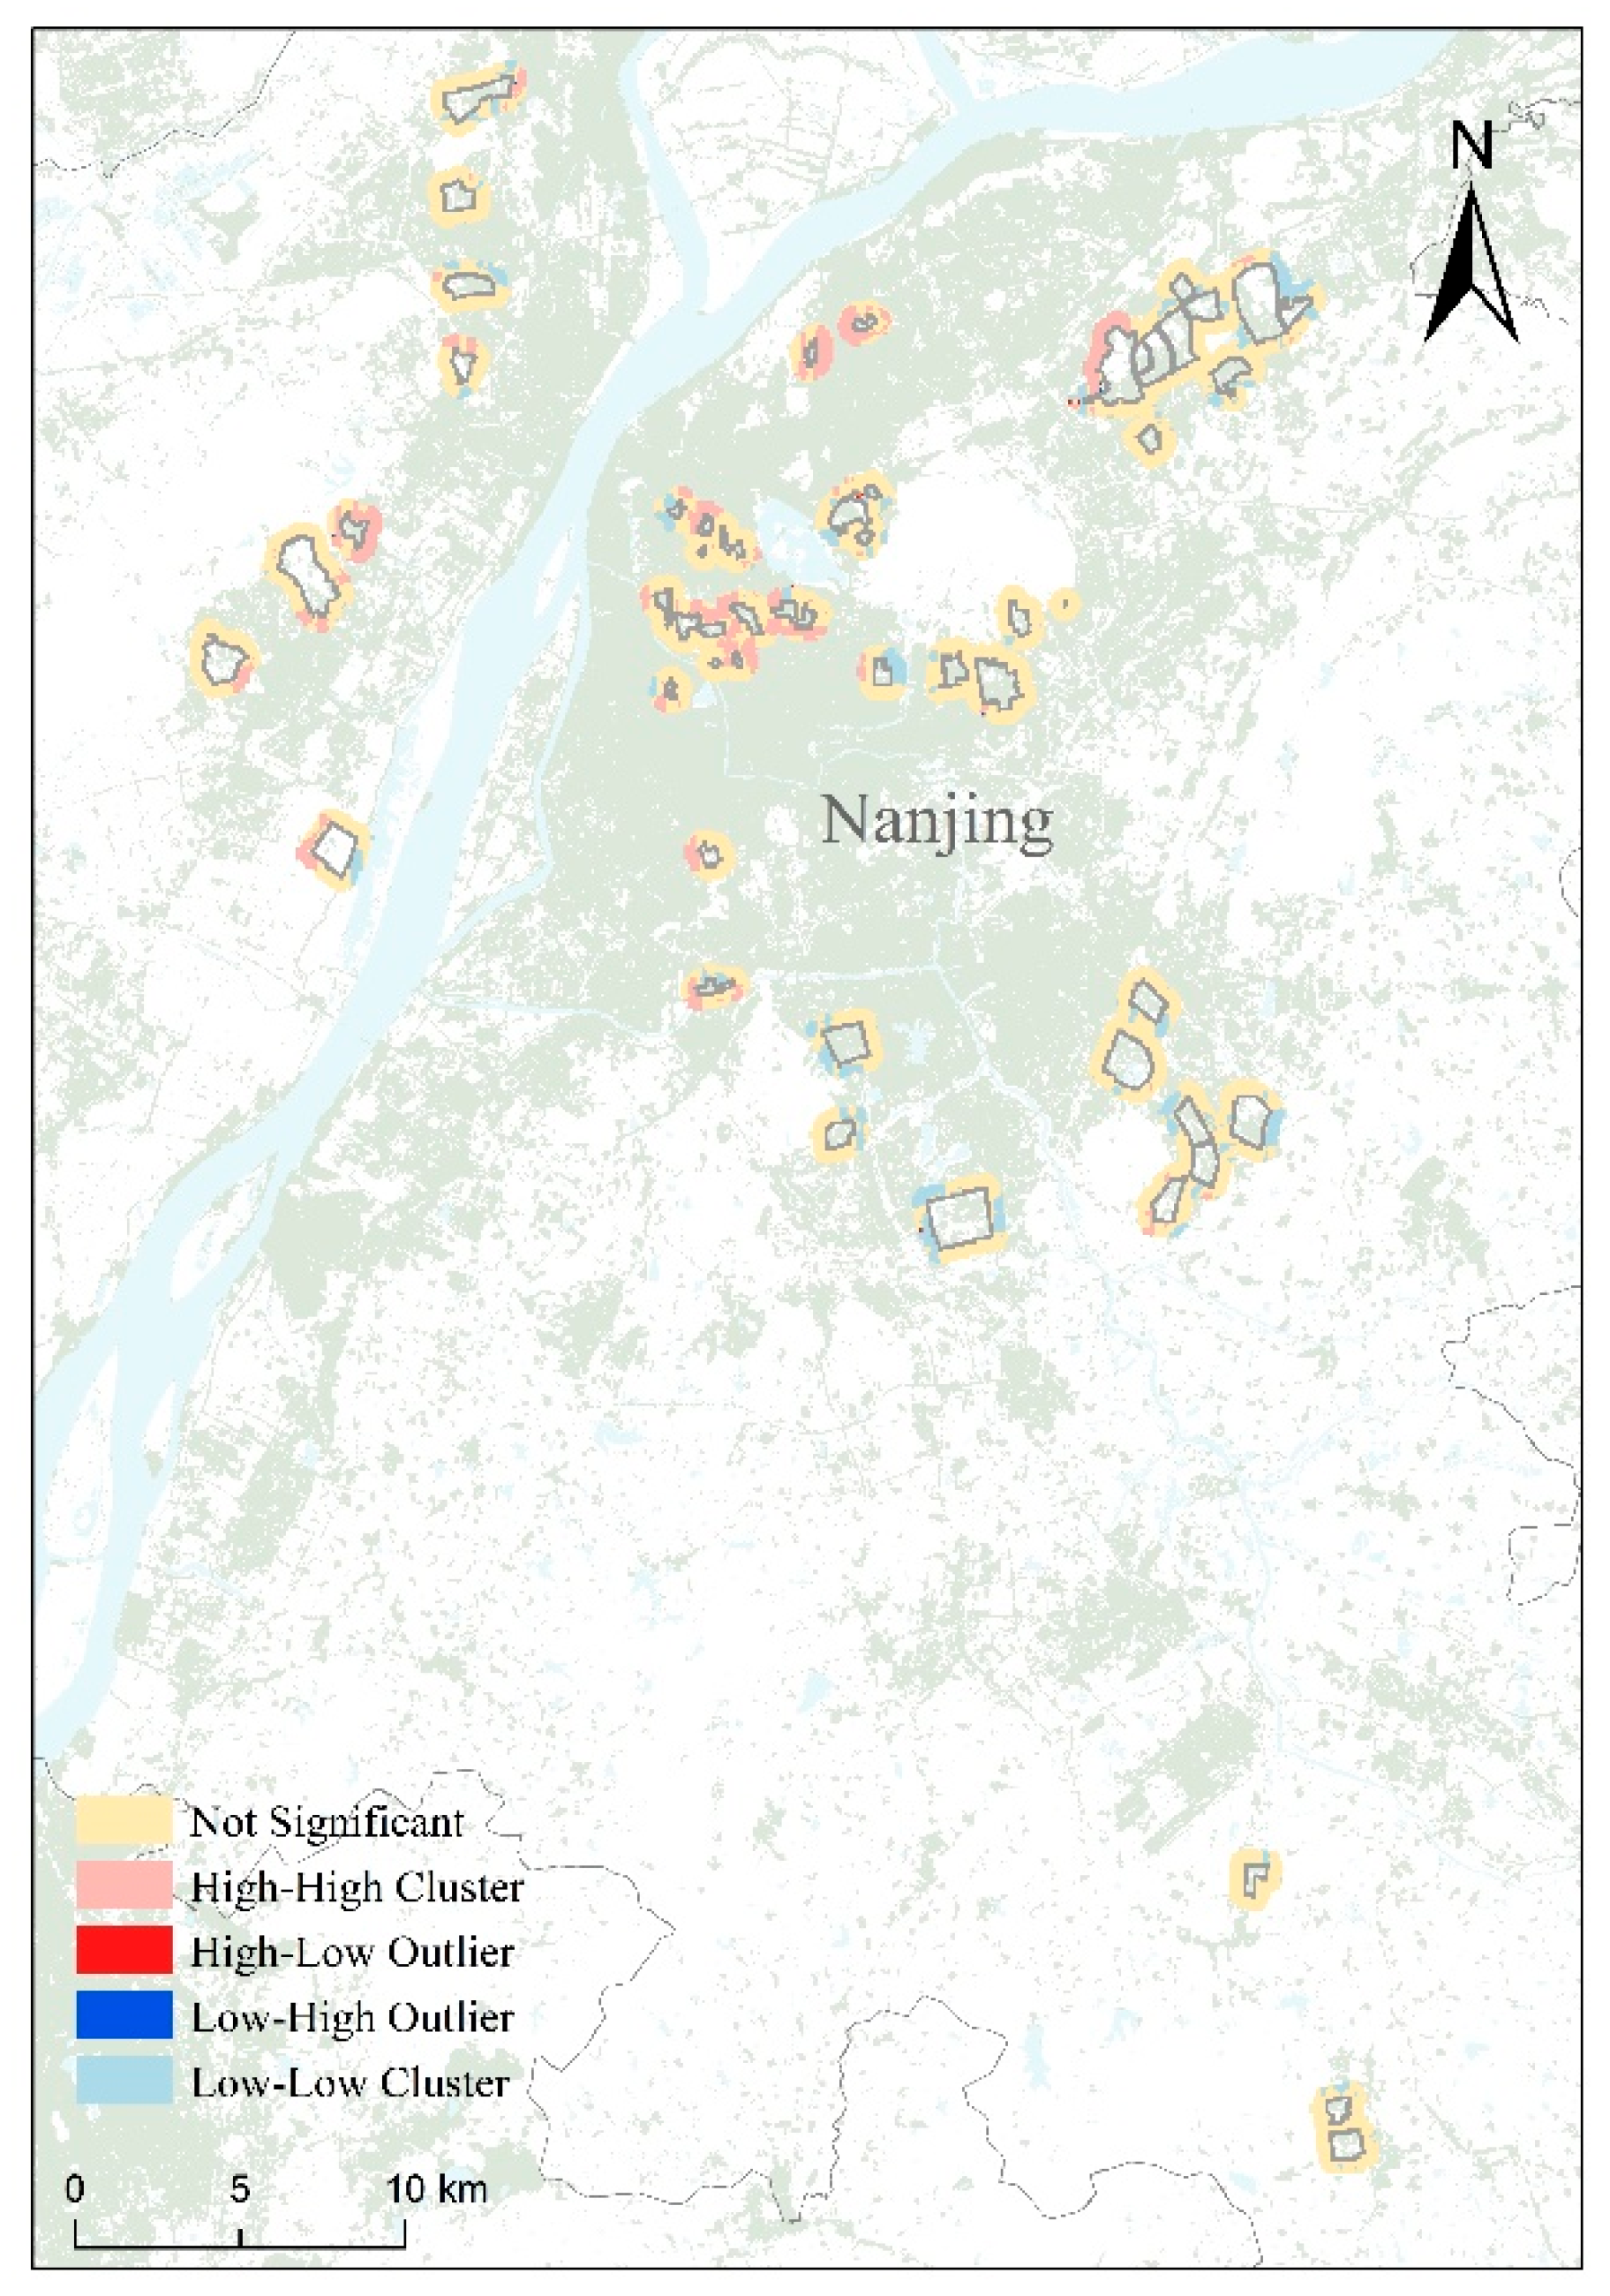
Figure 4.
Coefficients of factors in GWR model. (a) All_POI_Density; (b) DisToSubway; (c) Student_Population; (d) DisToBusStation; (e) Opening_Hours; (f) School_Area; (g) DisToAttraction; (h) RoadNet_Density; (i) Population_Density; (j) POI_Shannon_Index.
Figure 4.
Coefficients of factors in GWR model. (a) All_POI_Density; (b) DisToSubway; (c) Student_Population; (d) DisToBusStation; (e) Opening_Hours; (f) School_Area; (g) DisToAttraction; (h) RoadNet_Density; (i) Population_Density; (j) POI_Shannon_Index.
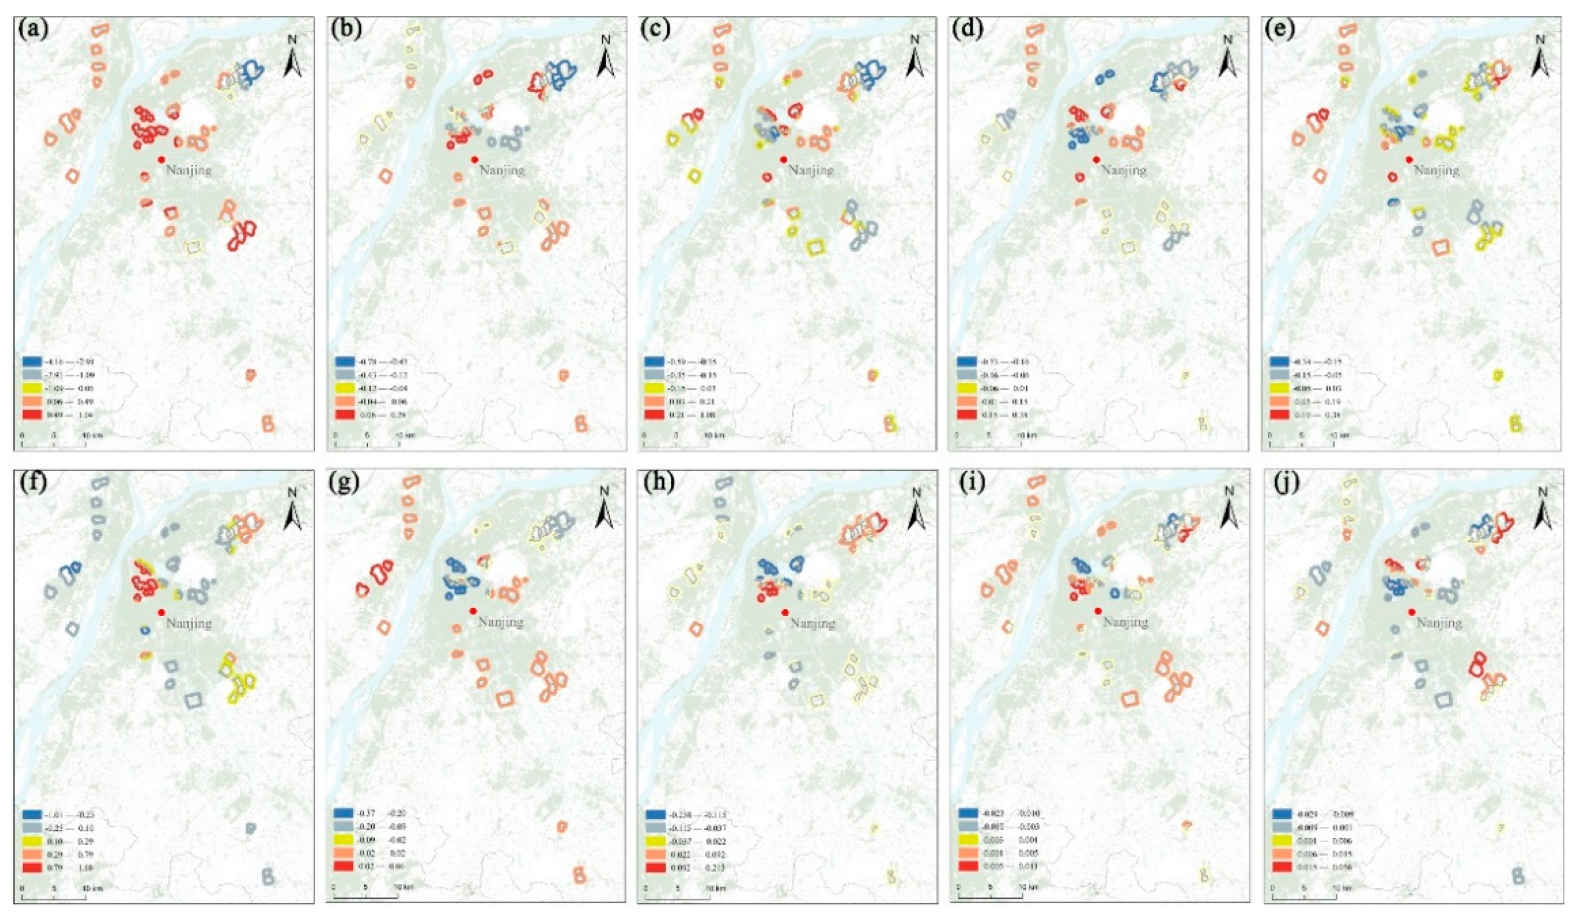
Figure 5.
SHAP overall fitting. (a) SHAP honeycomb diagram; (b) SHAP value ranking of factors.
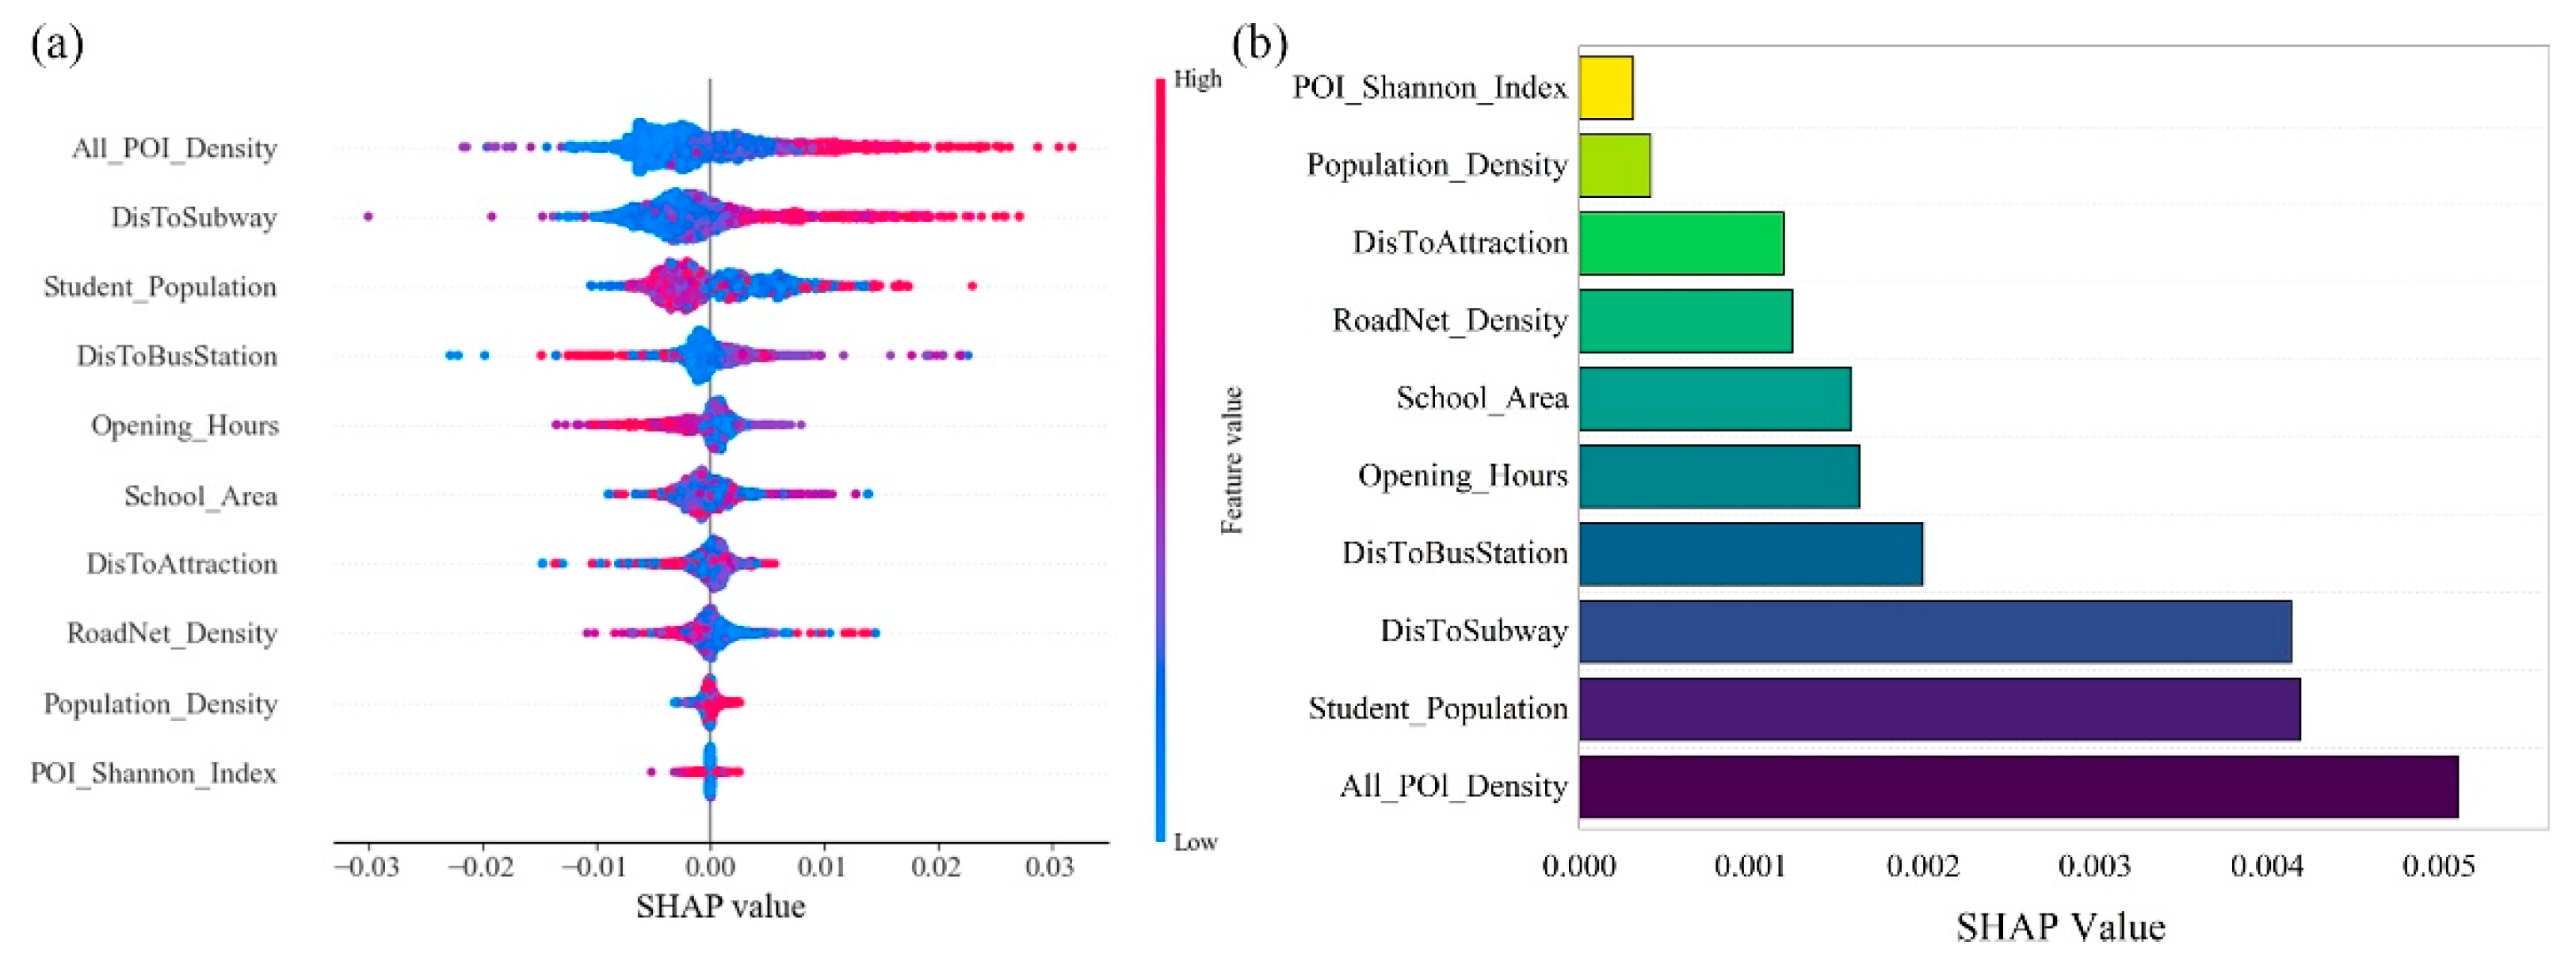
Figure 6.
SHAP partial correlation analysis.
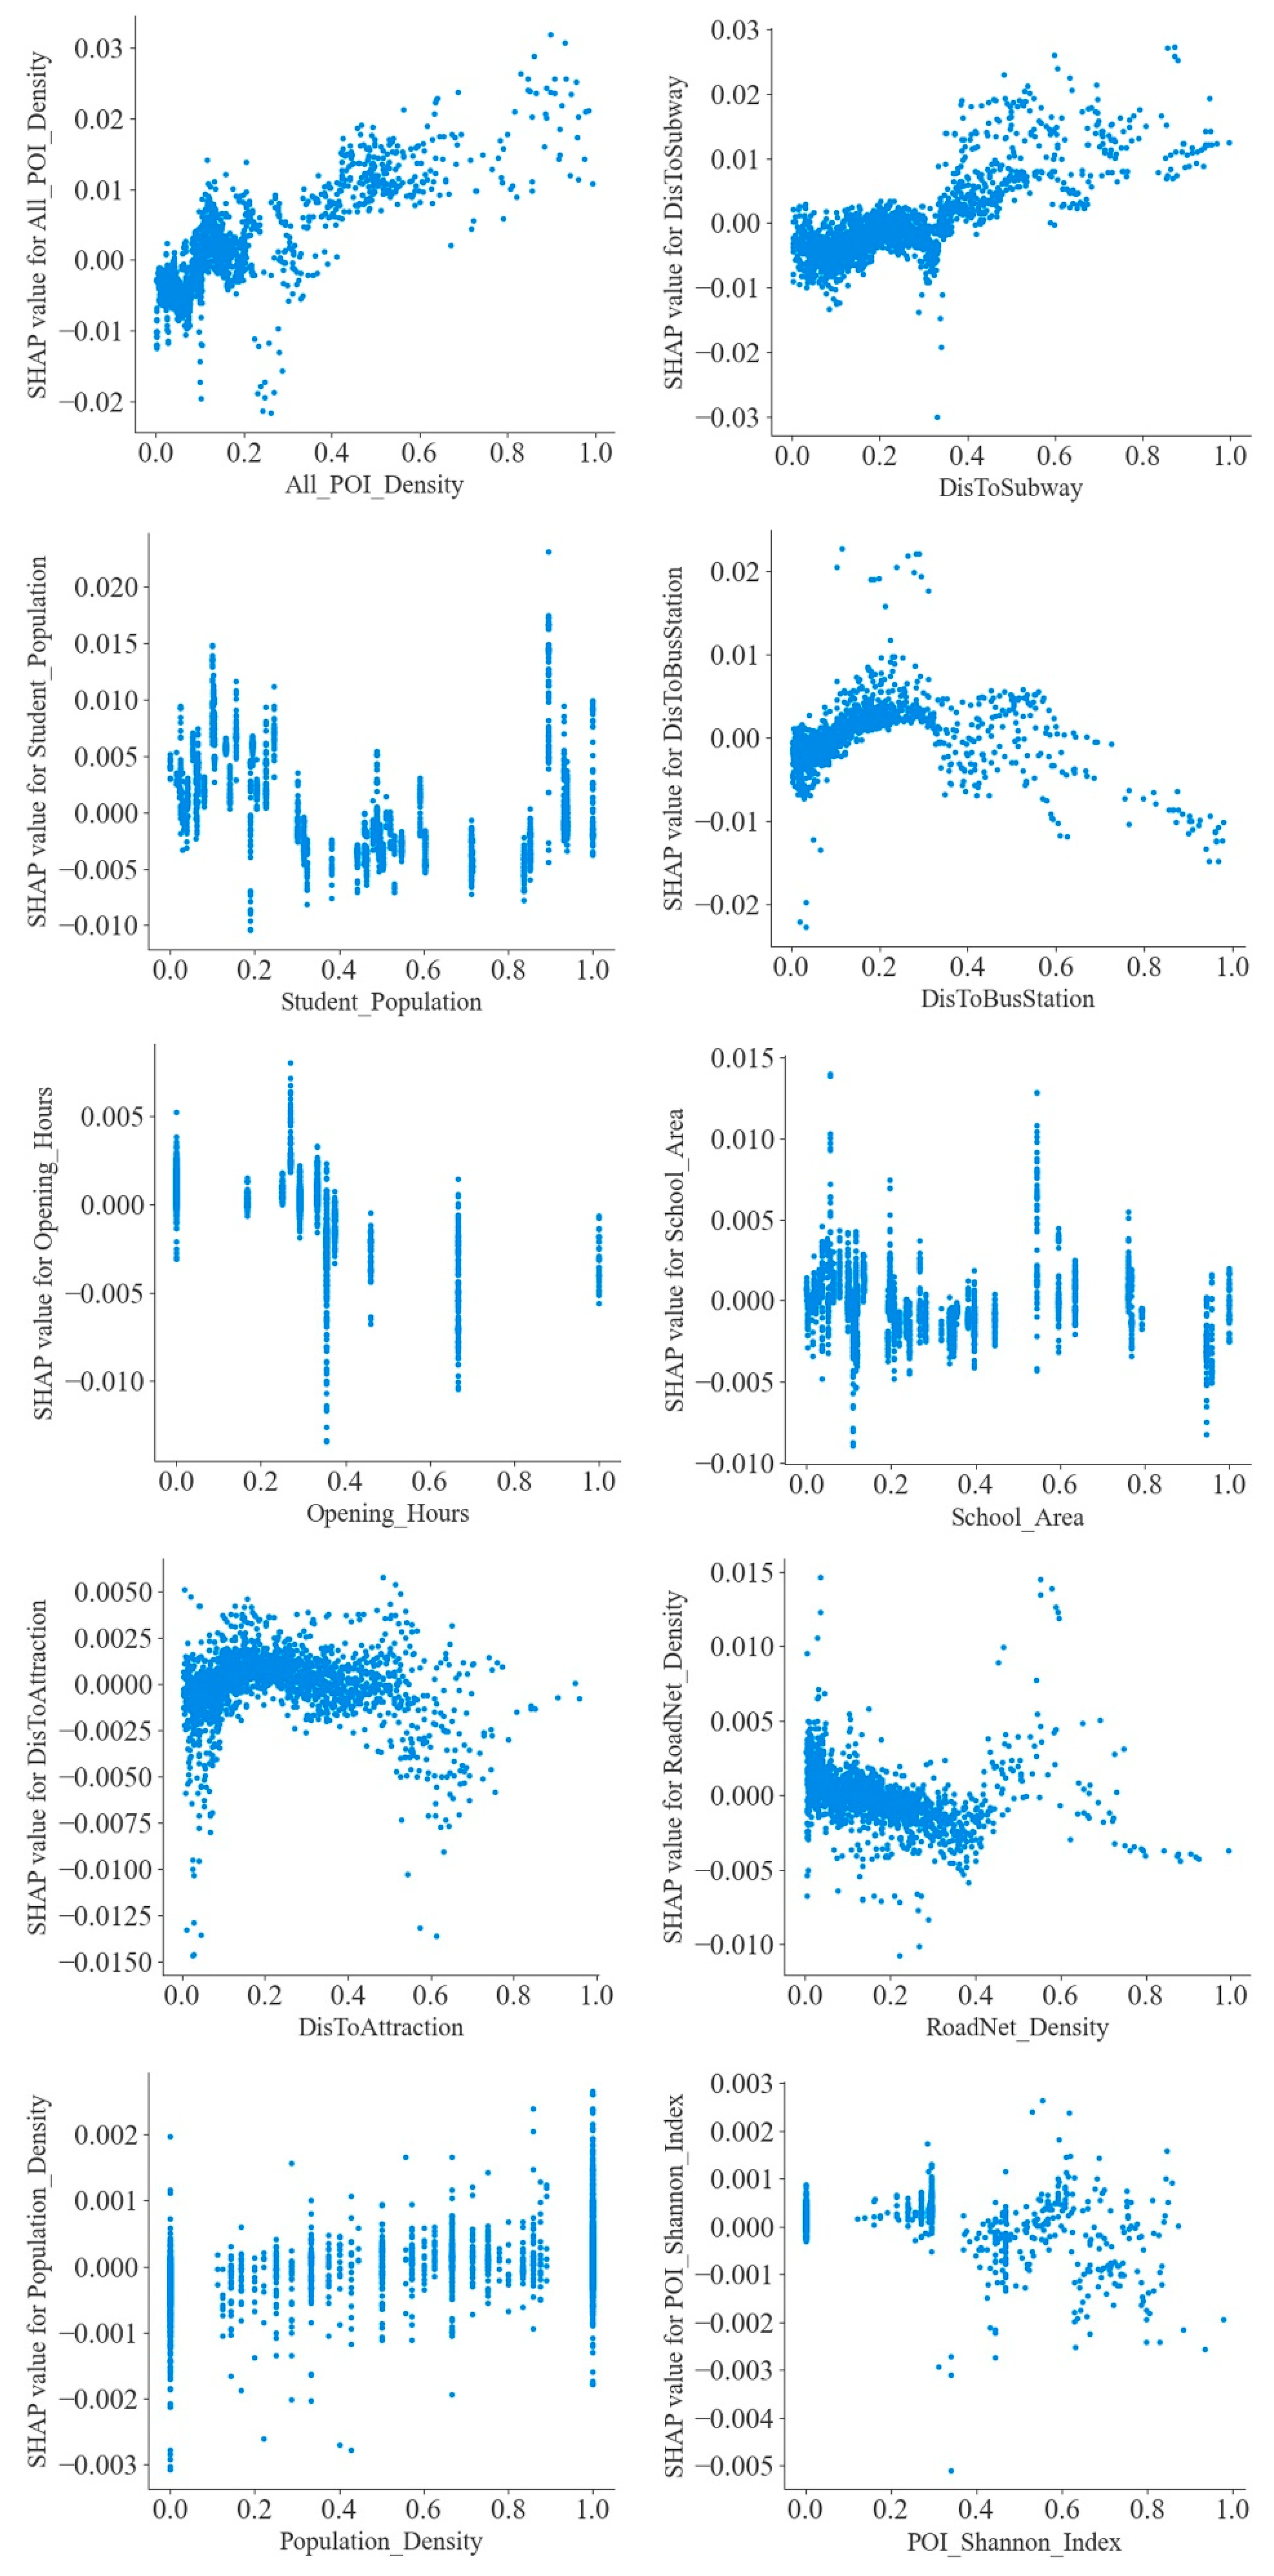

Table 1.
Data sources.
| Variables | Data Types | Spatial Resolution | Data Sources |
|---|---|---|---|
| Subway station | Vector | — | http://www.giscalculator.com/ |
| Scenic spots | Vector | — | https://lbs.amap.com/ |
| Bus station | Vector | — | https://lbs.amap.com/ |
| Road network | Vector | — | https://openmaptiles.org/languages/zh/#0.92/0/0 |
| POI | Vector | — | https://lbs.amap.com/ |
| NTL | Raster | 500m | https://www.resdc.cn/DOI/DOI.aspx?DOIID=105 |
| Green area | Raster | 100m | http://www.gisrs.cn/minindex.html |
| Building density | Raster | 10m | https://zenodo.org/records/7923866 |
| Population density | Raster | 1000m | https://landscan.ornl.gov/ |
| Administrative boundary | Vector | — | http://zrzy.jiangsu.gov.cn/ |
Table 2.
OLS regression.
| Variables (Abbreviation) | Coefficient | VIF |
|---|---|---|
| POI_Shannon_Index | -0.0015*** | — |
| POI_Diversity | -0.0053*** | 1.3499 |
| RoadNet_Density | 0.0063*** | 1.2235 |
| DisToSubway | 0.0375** | 2.0337 |
| DisToAttraction | -0.0044*** | 1.3783 |
| DisToBusStation | -0.0083*** | 2.2970 |
| DisFmGreenSpace | 0.0029 | 1.9224 |
| All_POI_Density | 0.0353** | 2.7557 |
| Population_Density | 0.0031*** | 1.3440 |
| Building_Density | -0.0002 | 1.8117 |
| Opening_Hours | 0.0041*** | 1.3934 |
| School_Area | -0.0105** | 2.3535 |
| Student_Population | 0.0020*** | 1.9980 |
*p<0.10; **p<0.05; ***p<0.01.
Disclaimer/Publisher’s Note: The statements, opinions and data contained in all publications are solely those of the individual author(s) and contributor(s) and not of MDPI and/or the editor(s). MDPI and/or the editor(s) disclaim responsibility for any injury to people or property resulting from any ideas, methods, instructions or products referred to in the content. |
© 2024 by the authors. Licensee MDPI, Basel, Switzerland. This article is an open access article distributed under the terms and conditions of the Creative Commons Attribution (CC BY) license (http://creativecommons.org/licenses/by/4.0/).
Copyright: This open access article is published under a Creative Commons CC BY 4.0 license, which permit the free download, distribution, and reuse, provided that the author and preprint are cited in any reuse.


