

Submitted:
04 September 2024
Posted:
05 September 2024
You are already at the latest version
Abstract
The identification of spatiotemporal heterogeneity, its key determinants, and the interaction effects between the driving factors of urban resilience (UR) within and between subregions is fundamental for understanding its underlying mechanisms. A resilience evaluation model was applied to analyze the temporal and spatial differences in UR in Hunan Province, China. The standard deviation ellipse was used to explore the spatial and dynamic evolution and direction of UR. A hot spot analysis identified clusters of cold and hot spots. The contribution of spatiotemporal differences in UR within and between subregions was assessed using the Theil index. A geodetector analysis determined the factors influencing UR and their interactions. There was an increasing trend in UR from 0.2692 in 2014 to 0.3422 in 2022. The number of cities with high resilience gradually increased from 2014 to 2022, while there was a decreasing gradient in UR from northeast to southwest across the province. High-resilience cities had positive spillover effects on the surrounding area. Hot spots were predominantly located in the northeast, while cold spots were concentrated in the southwest. The barycenter of UR shifted from northeast to southwest by 2018, before moving southeast by 2022. The Theil index values declined over time both within and between subregions. Per capita GDP, average wages of on-the-job employees, per capita social consumption, and doctor density enhanced UR. Two-factor interactions had a greater influence on the spatiotemporal heterogeneity of UR than single factors. Two-factor and nonlinear enhancements were identified as the primary mode of influence.
Keywords:
key determinant
; spatiotemporal heterogeneity
; urban resilience
; Theil index
; Geodetector
1. Introduction
Urban resilience (UR) refers to the capacity of urban systems, including their social technology and social ecological networks, to rapidly recover from disruptions that occur on a specific spatiotemporal scale (Hamilton, 2009; Jabareen, 2013; Burton, 2015). It encompasses the ability to recover from disasters and other crises, while continuing to fulfill industrial, commercial, residential, governmental, and social aggregation functions (Kevin, & Trevor, 2013; Meerow, Newell, & Stults, 2016). The heterogeneity of resilience across different cities arises due to variations in natural, economic, social, and ecological factors (Adger, 2000). Investigating this heterogeneity, as well as its key determinants and the interactions among factors within and between subregions, could determine the mechanisms underlying UR. The results could then be used to inform urban planning and safety governance.
The concept of resilient cities was initially proposed by the International Council for Local Environmental Initiatives in 2002 (Cutter, Barnes, Berry, Burton, Evans, et al. 2008). The Rockefeller Foundation’s project, "100 Resilient Cities", launched in 2013, aimed to encourage governments worldwide to develop resilient urban areas (Marjolein, & Bas, 2017; Daniela, Mauricio, Roberto, & Cristóbal, 2018). In accordance with the 2030 Agenda for Sustainable Development, the construction of inclusive, safe, resilient, and sustainable cities is imperative (Hamilton, 2009). Highly resilient cities are characterized by diversity, modularity, innovation, adaptability to change, rapid feedback ability, social capital reserves, and ecosystem service capabilities (Allan, 2011). Urban elements with high resilience should possess multifunctionality and redundancy, while incorporating ecological and social diversity (Adger, Hughes, Folke, Carpenter, & Rockstrom, 2005). Additional important factors include multi-scale network connectivity, as well as adaptive planning and construction strategies (Ahern, 2011).
The research methods used in studies of UR primarily include function modeling, threshold analysis, social network analysis, scenario analysis, layer overlay, and the geographical detector (geodetector) (Bruneau, Chang, Eguchi, Lee, O’Rourke, et al. 2012; Wang, & Xu, 2017). Function modeling is a straightforward and user-friendly approach (Du, Zhang, Wang, Tao, Li., & Li, 2020); however, it relies on limited datasets and few parameters, leading to significant evaluation errors (Raquel, Leire, & Josune, 2017). The threshold method enables the analysis of complex system evolution and coordination, but is sensitive to threshold selection and noise, resulting in coarse segmentation outcomes (Kamila, Peter, & Porfirio, 2018). A social network analysis can examine the connectivity of social networks and the structural resilience between nodes (Christmann, & Ibert, 2012); however, it overlooks isolated nodes as well as subjective motivations, functions, and the nature of social networks. A scenario analysis enables the impact of multiple factors on UR to be simulated under different scenarios (Josune, Patricia, Raquel, Jose, & Leire, 2019); however, scenario assumptions often rely on personal subjective judgments and biases that reduce prediction accuracy. The layer overlay method intuitively expresses spatial differences in UR by overlaying multiple element layers within a geographic information system (GIS) environment (Meerow, & Newell, 2016); however, identifying interaction effects among multiple factors has proven challenging. The geodetector statistical tool quantitatively analyzes the mechanisms influencing each driving factor, as well as the interactions between factors (Wang, Li, Christakos, Liao, Zhang, Gu, et al., 2010), although its spatial expression capability remains weak (Zhang, Dou, Liu, & Gong, 2023).
The study of UR has evolved from a conceptual framework to a measurable construct, encompassing multiple disturbances rather than singular events. This has shifted the focus of study from infrastructure-centric construction to the humanistic aspects of resilience, and has involved a transitioning from static notions of resilience to dynamic processes (Walker, Holling, Carpener, & Kinzig, 2004; Carvalho, Martins, Marta-Almeida, Rocha, & Borrego, 2017). However, investigations into the spatiotemporal heterogeneity of UR often concentrate solely on spatial variations across the entire study area (Li, Kappas, & Li, 2018). They have rarely considered the interaction of multiple factors or the identification of key determinants. Additionally, the interaction among multiple factors; identification of key determinants; and the contributions made by intra- and inter- subregions toward the spatiotemporal heterogeneity of UR have been neglected. Therefore, it is imperative to fully determine the mechanisms underlying the spatiotemporal heterogeneity of UR.
A UR index system and evaluation model were constructed in this study. A GIS was used to visually analyze the spatiotemporal evolution and driving factors of UR. The analysis of cold and hot spots revealed the agglomeration characteristics of UR. The spatial and dynamic evolution of UR was examined by analyzing its spatial directionality using a standard deviation ellipse. Furthermore, the contributions of spatiotemporal heterogeneity within and between subregions were analyzed using the Theil index. The gedetector tool was used to identify how the key determinants of UR and their interactions affected its spatiotemporal heterogeneity. This study provides a theoretical basis and practical support for evaluating, promoting, and planning UR. Noteworthy innovations of the study include: (1) proposing a factor interaction increment; (2) conducting an in-depth analysis on factors contributing to the spatiotemporal heterogeneity of UR; (3) systematically expressing various aspects of UR, such as its dynamic spatiotemporal evolution, key determinants, agglomeration characteristics, contributions from intra- and inter-subregions, and single- and two-factor interactions.
2. Materials and Methods
2.1. Study Area
Hunan Province, situated in the middle reaches of the Yangtze River in China, covers a total land area of 211,829 km2 between 108°47′ E and 114°15′ E longitude and 24°38′ N and 30°08′ N latitude. The province has a humid monsoon climate within the middle subtropical zone, characterized by an average annual temperature of 17.7°C and an average annual rainfall of 1200−1700 mm. Its altitude above sea level ranges from -123 to 2093 m. Most of the mountains with altitudes exceeding 1000 m are located in eastern, southern, and western Hunan Province. The central region is marked by undulating hills interspersed with valley basins at altitudes below 500 m. The Dongting Lake Plain is located in northern Hunan, where altitudes are mostly below 50 m (Figure 1). Numerous rivers flow through Hunan Province, including Xiangjiang River, Zijiang River, Yuanjiang River, and Lishui River, which drain into Dongting Lake and Yangtze River from south to north.
Hunan Province is traditionally divided into four subregions based on the spatial distribution of its cities and the layout of economic and social development. The northern region encompasses Yueyang, Changde, and Yiyang. The central region includes Changsha, Zhuzhou, Xiangtan, Shaoyang, and Loudi. The southern region comprises Hengyang, Chenzhou, and Yongzhou. Finally, the western region consists of Huaihua, Zhangjiajie, and Xiangxi.
The cities in the four traditional subregions each possess unique advantages in terms of their location, resources, and industries. However, their overall resilience is hindered by environmental degradation, resource depletion, industrial homogenization, uneven regional development, and spatial conflicts between production, livelihoods, and ecology. Identifying the key determinants of the spatiotemporal heterogeneity of UR would provide theoretical support for urban planning and resilience enhancement within the Hunan and Yangtze River economic belt.
2.2. Construction of an UR Index System
Nine indexes were established to assess the economic, social, and ecological resilience, considering the relative and absolute differences in the urban development of Hunan Province. These indexes provided a comprehensive framework to gauge UR across the province (Table 1).
The selection basis of each index was as follows. Per capita gross domestic product (GDP) was used to reflect the overall economic strength and pressure resistance of a city. The proportion of tertiary industry was used to assess the influence of the rationality and diversity of the urban economic structure on various factors. Per capita social consumption was adopted to reflect the market scale and economic development of a city. The average wage of on-the-job employees was used to measure the overall living standard of urban residents. The number of hospital beds per 10,000 people and doctor density were used to reflect the adaptability and recovery capacity of the medical response to disasters in urban areas. Per capita green land in park areas and the greening coverage rate of the built-up area were adopted to reflect the ability of a city to restore and reconstruct the urban ecosystem in response to ecological challenges and disturbances. The sewage treatment rate was used to measure the capacity of urban areas to handle pollutants and protect the environment.
The values of the UR evaluation indexes were mainly obtained from the China Statistical Yearbook (2015−2023), the Hunan Statistical Yearbook (2015−2023), the statistical yearbooks of cities, and the social and economic development bulletins of cities in Hunan Province. Panel data for 2014, 2018, and 2022 were used to analyze the spatiotemporal heterogeneity of UR.
2.3. Construction of the UR Evaluation Model
The entropy weight method was adopted in this study to determine the weight of each index. It is an objective weighting approach with a simple operation and high degree of reliability (Sherrieb, Norris, & Galea, 2010). An index has a large degree of variation, contains a large amount of information, and has a large weight if the information entropy is small.
(1) Standardization of evaluation indexes
Suppose there are n cities and m evaluation indexes for each city, then matrix X is constructed as follows:
yij (i = 1, 2, …, n; j = 1, 2, …, m) is obtained after the standardization of the xij because the indexes used in this study were all positive.
(2) Calculation of index proportion
The proportion pij is calculated according to the ratio of yij to the sum of yij (i = 1, 2, …, n; j = 1, 2,…, m).
(3) Calculation of the information entropy ej of the jth (j = 1, 2,…, m) index.
(4) Calculation of the weight wj of the jth (j = 1, 2,…, m) index.
(5) The UR evaluation model was constructed based on a comprehensive index method to calculate the resilience URi of the ith city.
(6) Hierarchical classification of UR
The UR was classified into five grades in accordance with the distribution characteristics of UR in Hunan Province, namely, the lowest resilience if UR ∈ [0, 0.15), low resilience if UR ∈ [0.15, 0.2), moderate resilience if UR ∈ [0.2, 0.3), high resilience if UR ∈ [0.3, 0.4), and the highest resilience if UR ∈ [0.4, 1.0].
2.4. Cold and Hot Spots of UR
Hot spot analysis can identify the spatial location of the clustering of high or low values of UR based on z scores and p values. The p value represents the probability that the observed spatial pattern is constructed by a random process. The z-score is a multiple of a standard deviation. For instance, the z-score is 2.7 times the standard deviation if the z-score = +2.7. The z-score is calculated by Gi* as follows:
where i is the ith city, j is the jth city in the neighborhood of the ith city, xj is the resilience of the jth city in the neighborhood, wij is the spatial distance between the ith and jth cities, n is the number of cities in the neighborhood, is the average value of xj (j = 1, 2,…, n), and S is the standard deviation.
The higher the positive z score with statistical significance, the closer the clustering of high values (hotspots). The lower the negative z score with statistical significance, the closer the clustering of low values (cold spots).
2.5. Theil Index
The Theil index was used to measure the differences in UR in the entire study area, and between and within the subregions of the study area. The greater the value of Theil index, the larger the spatial difference of UR.
where T ∈ [0, 1] is the Theil index values used to describe the total difference of UR, n is the number of cities, xi is the resilience of the ith city, and is the average value of the resilience of all cities.
The T value was further divided into Tw to express the intraregional difference of UR and Tb to indicate the interregional difference of UR.
where Tw is the spatial heterogeneity of UR within a subregion of the study area, Tb is the spatial heterogeneity of UR between subregions, m is the number of subregions of the study area, np is the number of cities in the pth (p = 1, 2, …, m) subregion, is the ratio of the average of UR in the pth subregion to the average of UR of all cities in Hunan Province, and Tp is the Theil index of the pth subregion.
2.6. Factor Detection of UR
Geodetector was used in this study to analyze the factors influencing the spatiotemporal heterogeneity of UR, due to its ability to detect the spatial differentiation, driving forces, and interactions of geographical phenomena (Wang, & Hu, 2012). The k-means clustering method was initially applied to convert numerical variables into discrete ones, i.e., the domain of variable x was partitioned into h layers (Zhu, Yu, Chen, Tan, & Yuan, 2024). Subsequently, the q value was adopted to detect the spatial heterogeneity of y, i.e., the extent to which the detection factor x affects the spatial differentiation of y. The value of q was calculated as follows:
where q∈ [0, 1] represents the degree of influence of the detection factor x on UR at the 95% confidence level, h denotes the hth layer (h = 1, 2, …, L) where the value of factor x is equally divided into L intervals, N and Nh signify the number of samples in the study area and the detection area respectively, σ2 and σh2 indicate the variances of y in the study area and the detection area respectively, and is the sum of variances within the hth layer.
A straightforward transformation of the q value conformed to the noncentral F distribution as follows:
where λ is a noncentral parameter, and is the average value of UR in the hth layer.
The larger the q, the stronger the degree of influence of factor x on y; conversely, the smaller the q, the weaker the influence. The factor x fully governs the spatial distribution of y when q = 1. In contrast, factor x has no association with y when q = 0.
2.7. Detection of Interactions among UR Factors
The detection of interactions among UR factors can identify whether the influence of an interaction between the factors x1 and x2 will enhance or diminish the degree of influence on the dependent variable y, or whether the influence of these factors on y is independent. The q values of the factors x1 and x2 for y, namely q(x1) and q(x2), respectively, were calculated. The q value for the interaction between x1 and x2 was then calculated, i.e., q(x1∩x2) was computed, which is a new polygon intersected by two vector layers of x1 and x2. Finally, q(x1), q(x2), and q(x1∩x2) were compared based on formula (17) to detect the type of interaction between the two factors (Tid(q)).
Nonlinear weakening in formula (17) implies that the interaction of two factors nonlinearly reduces the influence of variables. Single-factor nonlinear weakening indicates that an interaction between two factors weakens the influence of variables. Nonlinear enhancement implies that the degree of influence of two interacted factors is greater than the sum of the degrees of influence of the two factors acting independently. Two-factor enhancement means that the degree of influence of two interacted factors is greater than that of each factor acting independently, and its influence is less than that of nonlinear enhancement.
Factor interaction increment (Ii(q)) is proposed in this study, which is defined as the difference in the degree of influence produced by the interaction between two factors minus that produced by one factor. Factor interaction increment can effectively analyze the contribution of factor interaction on the improvement of UR, and it is calculated as follows:
3. Results and Analysis
3.1. Temporal Evolution of UR
The weights of the UR evaluation indexes in Hunan Province were determined and shown in Table 1. The resilience levels of 14 cities in Hunan Province in 2014, 2018, and 2022 were calculated according to the UR evaluation model (Figure 2). The average values of UR in Hunan Province were 0.2692 in 2014, 0.3021 in 2018, and 0.3422 in 2022, which represented an increase of 27% from 2014 to 2022, demonstrating an ascending trend. This was because the economic and social development, infrastructure, public services, industrial transformation, and innovation capabilities of cities in Hunan Province were constantly improving over the study period.
The resilience of 11 cities increased from 2014 to 2022, with the cities experiencing a significant increase including Xiangtan, Hengyang, Yueyang, and Huaihua. In recent years, China has implemented various policies and national strategies, such as the strategy to enhance the central China region, which has been achieved through increasing infrastructure construction, ensuring and improving people's livelihoods, and building an ecological civilization. Additionally, investment into Hunan Province in terms of the urban economy, society, and ecology has continuously increased, and the levels of urban safety, health, and sustainable development have risen year by year. Therefore, the UR of most cities in Hunan Province has also increased year by year.
Changsha, Zhuzhou, and Xiangtan maintained a high UR from 2014 to 2022. This was mainly due to the Changsha−Zhuzhou−Xiangtan economic integration that has been promoted by the Hunan provincial government since 1997. The Changsha−Zhuzhou−Xiangtan urban agglomeration was initially established, and has since become the core growth pole of economic development in Hunan Province. Changsha is the political, economic, cultural, educational, and financial center of Hunan Province, with a high level of urbanization and the highest UR.
Changsha and Yiyang have undergone a transition from a high UR in 2014, to a low UR in 2018, and the highest UR in 2022. This was because the profit growth of industrial enterprises above a designated size in Changsha declined, and the output of various heavy industry sectors decreased sharply after 2015, largely due to the relocation of Sany Heavy Industry Co., Ltd. from Changsha to Beijing. After 2018, industrial clusters were established in Changsha, including engineering machinery, food processing, automobiles, new materials, electronic information, biomedicine, and culture and tourism. As a result, Changsha's economy has experienced rapid development. Catastrophic flood disasters in Yiyang City affected 1.47 million people in 2016, with a direct economic loss of 2.6 billion CNY, and a further 0.78 million people in 2017, with a direct economic loss of 2.15 billion CNY. Consequently, Yiyang's UR declined in 2018. After 2018, industries in Yiyang, such as high-end equipment manufacturing, food processing, electronic information, and new materials, have developed rapidly. This has resulted in a rapid increase in UR from 2018 to 2022.
The UR in Changde was low in 2014, highest in 2018, and high in 2022. This is because the development of highly-polluting, high-energy consumption industries, such as coal and chemicals, has been restricted by environmental protection policies in China after 2018. The UR in Hengyang was lowest in 2014, with a significant increase in 2018, and was highest in 2022. This is because per capita GDP, per capita social consumption, per capita green area, and the sewage treatment rate have increased rapidly in recent years.
The UR in Zhangjiajie declined significantly from 2018 to 2022. This was mainly because specific measures, such as closing public places and prohibiting the movement of people due to the corona virus disease 2019 (COVID-19) from 2019 to 2022, restricted the development of the tourism industry, which is the pillar industry of Zhangjiajie.
3.2. Spatial Evolution of UR
The resilience of 14 cities in Hunan Province was spatially visualized using GIS to determine the spatial heterogeneity of UR (Figure 3).
There were obvious spatial differences in UR in Hunan Province, namely, a high resilience in the northeastern and low resilience in the southwest Hunan. In 2014, Changsha has the highest resilience, Xiangtan and Zhuzhou were high-resilience cities, while Shaoyang, Hengyang, and Loudi were the lowest-resilience cities.
In 2018, Changsha and Zhuzhou were the highest-resilience cities. The high-resilience cities included Zhangjiajie, Changde, and Xiangtan. Among them, Zhangjiajie and Changde transitioned from moderate-resilience cities in 2014 to high-resilience cities in 2018. Hengyang upgraded from a lowest-resilience city in 2014 to a moderate-resilience city in 2018 due to its rapid economic, social, and ecological development. In contrast, Yiyang was downgraded from a moderate-resilience city in 2014 to a low-resilience city in 2018. Shaoyang was always the lowest resilience city from 2014 to 2022.
In 2022, the highest-resilience cities were Changsha, Xiangtan, and Zhuzhou. The high-resilience cities included Changde, Yueyang, Yiyang, Hengyang, and Chenzhou. Huaihua and Loudi were upgraded from low-resilience cities in 2018 to moderate-resilience cities in 2022. Yiyang was upgraded from a low-resilience city in 2018 to a high-resilience city in 2022. Zhangjiajie was downgraded from a high-resilience city in 2018 to a low-resilience city in 2022, with a significant decline.
Therefore, the UR of Hunan had specific spatiotemporal heterogeneity, spatial agglomeration characteristics, and polarization phenomenon. The UR of the Changsha−Zhuzhou−Xiangtan urban agglomeration was higher than that of other cities. The highest-resilience cities had a positive spillover effect on their surrounding cities. Over time, the number of cities that upgraded from low to high resilience increased; the degree of agglomeration of high-resilience cities gradually increased; and the gap in resilience between cities narrowed.
The spatial heterogeneity of UR in Hunan Province is influenced by multiple factors. The northeastern cities, such as Changsha, Zhuzhou, and Xiangtan, had high resilience due to the unique policies that have been implemented within them, such as economic integration, and the massive investment in social public services and infrastructure. In contrast, the southwestern cities, such as Shaoyang, had low resilience because of their high level of dependence on resources, and their poor infrastructure, economic development, and social public services.
3.3. Directivity Analysis of the Spatial Distribution of UR
Ellipse parameters, such as the ellipse area, barycenter, semi-minor axis, semi-major axis, oblateness, and azimuth, were obtained according to the UR of Hunan Province in 2014, 2018, and 2022 using the standard deviation ellipse method. These parameters can be used to further explore the process and direction of UR evolution spatially and dynamically (Table 2 and Figure 4).
The areas of the ellipses, which represent the extent of the spatial distribution of UR, were 68,098.97 km2 in 2014, 70,299.88 km2 in 2018, and 69,548.45 km2 in 2022, respectively. This indicates that the spatial impact of UR was largest in 2018, followed by 2022, and was smallest in 2014.
The standard deviation ellipse exhibited a distribution pattern from northwest to southeast in Hunan Province. The semi-major axis, which indicated the direction of the dense spatial distribution of UR, initially increased from 2014 to 2018 and subsequently decreases from 2018 to 2022. This suggests that the UR displayed a trend of initially strengthening and then weakening, as well as initially dispersing and then aggregating, in the main axis direction from the northwest to southeast of Hunan Province.
The semi-minor axis of the ellipse, which represents the direction of the sparse spatial distribution of UR, gradually increased from 2014 to 2022. This indicated that the pulling effect of UR on the standard deviation ellipse in the northeast and southwest of Hunan Province was gradually intensifying. The spatial distribution pattern of UR was relatively stable, and the spatial spillover effect of UR was not prominent.
Oblateness, which represents the directionality and centripetal force of UR, was largest (0.179) in 2018, indicating that strongest directionality of UR occurred in 2018. The oblateness of UR in Hunan Province was smallest (0.079) in 2022, suggesting the weakest directionality of UR, with the length of the semi-major axis approximating that of the semi-minor axis.
The barycenter of UR in Hunan Province was located at the junction of Changsha and Xiangtan, within 112°8'46" E to112°12'36" E and between 27°55'59" N to 27°59'25" N. The barycenter of UR migrated from the northeast in 2014 to the southwest in 2018, with a migration distance of 6.2 km. This was because in the southern Hunan region there was a vigorous promotion of industrial transformation, and upgrading, logistics, and financial expertise were obtained from the economically and commercially developed Pearl River Delta region. In the western Hunan region, an ecological and cultural tourism area was established. The barycenter of UR migrated from the northwest in 2018 to the southeast in 2022, with a migration distance of 5.50 km. This was because Hengyang and Chenzhou, situated in the southeast of Hunan Province, emerged as new growth poles for industrial transfer from the Pearl River Delta.
The azimuth of the ellipse, which represents the main trend in the direction of the spatial distribution of UR, rotated clockwise from 2014 to 2018. This indicates that the pulling effect of cities in the southwest of Hunan Province on the standard deviation ellipse gradually became stronger than that of cities in the northeast at this stage. The azimuth rotated counterclockwise from 2018 to 2022, suggesting that the ability of cities in the northeast to shape the UR spatial pattern was enhanced at this stage.
3.4. Hot Spot Analysis of UR
The distribution of hot and cold spots of UR in Hunan Province was obtained through the use of the Getis-Ord Gi* statistic in GIS (Figure 5). The UR displayed a trend of a gradual decline in hot spots and a gradual increase in cold spots from the northeast to southwest of Hunan Province.
In 2014, the hot spots of UR in Hunan Province were distributed in Changsha, Zhuzhou, and Yueyang. There were also sub-hot spots distributed in Xiangtan and Yiyang. Sub-cold spots were distributed in Xiangxi, Loudi, and Chenzhou. The cold spots were distributed in Yongzhou, Shaoyang, and Huaihua. Generally, the northeast region was dominated by hot spots, and the southwest region was dominated by cold spots.
In 2018, the hot spots of UR were distributed in Zhuzhou, located in the east of Hunan Province. The sub-hot spots were distributed in Changsha, Yiyang, Xiangtan, and Yueyang, in the northeast of Hunan Province. The sub-cold spots were located in Yongzhou and Xiangxi, and the cold spots were distributed in Shaoyang, Huaihua, and Loudi in the southwest. In general, the hot spots of UR in 2018 were mainly concentrated in the northeast of Hunan Province, and the cold spots were mainly concentrated in the southwest.
In 2022, hot spots of UR were identified in Changsha and Zhuzhou, situated in the eastern region of Hunan Province. Sub-hot spots were observed in the periphery of the hot spots, including Yueyang, Yiyang, and Xiangtan. Conversely, sub-cold spots were found in Yongzhou, Loudi, Changde, Zhangjiajie, and Xiangxi. Furthermore, cold spots were evident in Shaoyang and Huaihua in the southwest. Consequently, the distribution of cold and hot spots of UR in Hunan Province mirrored that of UR overall. This spatial pattern confirmed that northeastern Hunan Province was an agglomeration area for hot spots, while the southwest served as an agglomeration area for cold spots; thus, further validating the spatiotemporal heterogeneity of UR in Hunan Province.
3.5. The Spatiotemporal Differences in UR
The overall differences in UR in Hunan Province were measured using the Theil index (Table 3). The Theil index values of UR were 0.17026 in 2014, 0.11703 in 2018, and 0.09327 in 2022, respectively, i.e., gradual decrease. This indicates that the spatial differences in the UR in Hunan Province from 2014 to 2022 became increasingly smaller. This might be related to the strategies to enhance the central China region, the scientific approach taken toward development, and the coordination of regional development.
The spatial variances of UR between and within subregions of the traditional zones, as well as the hot spots of UR in 2014, 2018, and 2022 in Hunan Province were determined using the Theil index (Figure 6). The traditional zoning encompassed four subregions: northern, central, southern, and western Hunan. The zones based on the urban hot spots in 2014, 2018, and 2022 comprised five subregions: hot-spot, sub-hot spot, non-significant, sub-cold spot, and cold-spot areas, respectively (Table 3 and Figure 4).
The Theil index values of resilience within the subregions of Hunan (Tw), derived by the four zoning approaches, progressively diminished from 2014 to 2022. This indicated that the spatial disparity of UR within subregions was shrinking at an increasing rate, which was also the case for the entire Hunan Province. The Theil indexes of UR between subregions (Tb) obtained from the zoning approaches based on the hot spots of UR in 2014 and 2022 gradually reduced from 2014 to 2022. This indicated that the spatial variance of UR between subregions gradually narrowed. The Theil index values of UR between subregions (Tb) in 2014 were greater than those in 2018 and 2022, while the Theil index values of UR between subregions (Tb) in 2018 were nearly equivalent to those in 2022, according to the methods used for conventional zoning and the zoning of hotspots of UR in 2018. This indicated that the spatial variance of UR between subregions in 2014 was more significant than in 2018 and 2022.
There were similarities and dissimilarities in the contribution rates of the spatiotemporal variances of UR within and between subregions due to the diverse zoning methods used. Using the conventional zoning method, the Theil index values of UR within subregions were considerably larger than those between subregions. This indicated that the regional variances of UR mainly arose from the variances within the subregions. For the zoning methods based on the hotspots of UR in 2014 and 2018, the Theil indexes of UR within subregions were analogous to those between subregions. This indicated that the spatial variance of UR within subregions was approximately the same as that between subregions. Using the zoning method based on the hotspots of UR in 2022, the Theil index values of UR within subregions were significantly smaller than those between the subregions of cities. This indicated that the spatial variance in UR mainly originated from the interregional UR.
There were similarities and dissimilarities in the spatiotemporal heterogeneity of UR within the subregions obtained by the different zoning methods (Table 3 and Figure 7). Using the conventional zoning method, the variances within subregions in central Hunan in 2014, 2018, and 2022 were conspicuously higher than those in other subregions. This indicated that the UR in central Hunan exhibited the greatest spatial heterogeneity and imbalance (Figure 7a), with the UR of Changsha City in central Hunan being consistently the highest, while that of Shaoyang was always the lowest throughout the study period. Additionally, the Theil index of UR in central Hunan gradually declined from 2014 to 2022, suggesting that the spatial variance of UR in central Hunan gradually decreased. The spatial variances of UR in northern Hunan were largest in 2018 and smallest in 2022. The spatial variances of UR in western Hunan underwent negligible change from 2014 to 2022. The Theil index values of UR in southern Hunan were largest in 2014, and very small in 2018 and 2022, indicating that the spatial variance of UR in southern Hunan was substantial in 2014, and then relatively balanced in 2018 and 2022.
Using the zoning based on hotspots of UR in 2014, the internal variances in the hotspot area were significantly higher than in other subregions during the study period. This indicated that the UR of the hotspot area presented the largest spatial variance and imbalance (Figure 7b). This was because Changsha had the highest UR, while Yueyang had a low resilience, resulting in the polarization of UR during the study period. The Theil index of UR in the sub-hot spot subregion was highest in 2018, and low in 2014 and 2022. The spatial variance of UR in the non-significant subregion was largest in 2014, and small in 2018 and 2022. The spatial variance of UR in the sub-cold spot subregion was very small during the study period. The spatial variance of UR in the cold spot subregion was largest in 2022, and low in 2014 and 2018.
Using the zoning based on the hotspots of UR in 2018, the Theil index was 0 in each of 2014, 2018, and 2022 because only Zhuzhou City was located in the hotspot subregion, suggesting a lack of internal differences in UR. The Theil index values of UR in the sub-hotspot subregion were significantly higher than in other subregions during the study period. This suggests that the UR in the sub-hotspot subregion exhibited substantial spatial differences and imbalances (Figure 7c). These were attributed to the pronounced polarization between high UR areas, such as Changsha and Zhuzhou, and low UR areas, such as Yiyang during the study period. Furthermore, the spatial differences in UR were greatest within non-significant subregions in 2014 but were smallest in these areas by 2018. Similarly, the spatial difference of UR within sub-cold spot subregions peaked in 2014 but was minimized by 2022; while the differences within cold spots reached their maximum disparity by 2022, but were reduced to a minimum by 2018.
Using the zoning based on the hotspots of UR in 2022, the internal differences of UR within hotspot subregions were found to be significantly larger than those in other subregions. Moreover, minimal changes were observed in the internal differences of UR during the study period (Figure 7d). The spatiotemporal heterogeneity of UR within sub-hot spots, sub-cold spots, and cold spots exceeded those shown in Figure 6a, b, and c. The Theil index values for UR within sub-hot spots and sub-cold spots peaked in 2018 but decreased notably by 2014 and 2022. The spatial disparities of UR within cold spots reached their peak in 2022, with a minimum level in 2018. Furthermore, the spatial disparities of UR within non-significant subregions surpassed those within hotspots in 2014, but declined substantially by 2018, with the decline continuing into 2022.
In summary, among the four zoning methods, the largest Theil index was observed in the area centered on Changsha, and the spatial differences of UR decreased from 2014 to 2022. The Theil index values in other subregions were generally small.
3.6. Factor Detection Analysis
The driving factors of UR in Hunan Province were analyzed using geodetector (Figure 8). The selected factor values were categorized into five levels: highest, high, medium, low, and lowest based on the classification standard of UR. The degree of influence q and factor explanatory power p of each factor on UR were then calculated using the geodetector tool. A higher value of q indicated a larger influence on UR, while a lower value of p suggested a greater explanatory power for influencing UR.
Among the urban economic resilience indexes (x1, x2, x3), except for the proportion of tertiary industry, per capita GDP, and per capita social consumption had significantly higher values of q (> 0.9) from 2014 to 2022, making them important factors affecting the spatial heterogeneity of UR. The p value obtained for the proportion of tertiary industry was higher than 0.1, but was not a significant driver of UR. However, the q value continued to increase from 2014 to 2022, indicating an increasing impact on the spatial distribution of UR. Simultaneously, the p value continued to decrease, suggesting that optimizing urban industrial structure has a positive impact on improving UR.
Among the indexes of urban social resilience (x4, x5, x6), the q values gradually declined from 2014 to 2022, signifying that the influence of social resilience indexes on the spatial heterogeneity of UR gradually weakened. Nevertheless, in 2022, the q values of the doctor density rose, which might be associated with the COVID-19 outbreak commencing at the end of 2019. After the COVID-19 outbreak, many doctors in China were engaged in epidemic prevention and control, facilitating each city to promptly resume normal operation. The p values of the average salary of on-the-job employees and doctor density were < 0.1, indicating that the factors x4 and x6 had a significant effect on enhancing the UR.
The q values of urban ecological resilience factors (x7, x8, x9) were small and the values of p were greater than 0.1, indicating that they had a minimal impact on the spatial heterogeneity of UR. The q values for x7 and x8 gradually increased from 2014 to 2022, although they remained low, suggesting an increasing impact on the spatial heterogeneity of UR. The q value of the sewage treatment rate was large, indicating that the control and purification of pollutants positively influenced the improvement of UR. However, this q value gradually decreased from 2014 to 2022, indicating a diminishing impact on the spatial heterogeneity of UR.
The degree of influence of driving factors on the spatial heterogeneity of UR varied significantly across different time periods. The driving factors followed the order of x4 > x1 > x3 > x6 > x5 > x9 in 2014; x3 > x4 > x1 > x6 > x5 > x9 in 2018; and x1 > x3 > x6 > x4 in 2022. The major contributing factors were the average wage of on-the-job employees and per capita GDP in 2014; per capita social consumption, average wage of on-the-job employees, and per capita GDP in 2018; and per capita GDP, per capita social consumption, and doctor density in 2022. The impact of eco-environmental factors on the spatial heterogeneity of UR was found to be small.
3.7. Detection of Interactions
The geodetector statistical tool was used to detect interactions between the driving factors of UR in Hunan Province (Table 4). In Table 4, the values on the diagonal (bold and italic) are the degrees of influence of each factor on the spatial heterogeneity of UR (q statistics); the values in the lower left corner of the diagonal are the degrees of influence of the interaction between two factors on the spatial heterogeneity of UR (q statistics); and the values in the upper right corner of the diagonal are the interaction increment of the interaction between two factors on the spatial heterogeneity of UR (white font).
For single-factor detection in 2014, the degrees of influence of q(x2), q(x7), and q(x8) with green background cells on the diagonal of Table 4 were very low, suggesting a non-significant impact on the spatial heterogeneity of UR. Other factors such as x4 had the greatest impact, followed by x1, x3, and x6 on the spatial heterogeneity of UR.
For the detection of interactions in 2014, the top three interaction detections were q(x1∩x8) = 0.9964, q(x4∩x8) = 0.9960, and q(x6∩x8) = 0.9954. The q(x2∩x7), q(x2∩x8), and q(x7∩x8) values were not significant due to their low single-factor detections (x2, x7, and x8). However, the interaction detections between these single factors and other factors was large, suggesting a significant impact on the spatiotemporal heterogeneity of UR.
In terms of the interaction increment between two factors in 2014, the positive increments indicated that factor interaction can enhance UR. The values of Ii(q)(x2∩x3), Ii(q)(x2∩x4), Ii(q)(x2∩x5), Ii(q)(x2∩x6), Ii(q)(x2∩x9), Ii(q)(x7∩x9), and Ii(q)(x8∩x9) were large, due to the nonsignificant impact of x2, x7, and x8 on UR resulting in a low degree of influence. The interaction increments between other pairs of factors were small; however, their interaction made a large contribution to UR.
For single-factor detection in 2018, the degrees of influence of the single factors (x2, x7, and x8) were comparable to those in 2014. It was found that x3 and x4 exerted the most significant impact on the spatial heterogeneity of UR, followed by x1 and x6.
In 2018, the interaction detections between two factors revealed notable combinations with high interaction detection values, specifically x2∩x3 and x2∩x4 (0.9909), x3∩x6 and x4∩x6 (0.9698), and x3∩x8 and x4∩x8 (0.9675). Conversely, the interactions q(x2∩x7), q(x2∩x8), and q(x7∩x8) were found to be not-significant, mirroring the findings from 2014.
The interaction increments between two factors in 2018 closely resembled those in 2014.
In 2022, the analysis of single-factor detections indicated that the degrees of influence of q(x2), q(x5), q(x7), q(x8), and q(x9), highlighted by green background cells on the diagonal of Table 4, were notably low, suggesting a non-significant impact on the spatial heterogeneity of UR. In contrast, factors x1, x3, and x6 had a substantial impact on the spatial heterogeneity of UR.
Regarding detection of interactions in 2022, the three highest interaction detection values were recorded as q(x1∩x5) = 0.9977, q(x1∩x2) = 0.9973, and q(x3∩x6) = 0.9938. Notably, x6 had a significant influence on UR in 2022, largely attributed to the outbreak of COVID-19. Meanwhile, the values for q(x5∩x7), q(x5∩x9), and q(x7∩x9) were relatively low. However, the interaction detections values between the single factors (x5, x7, and x9) and other factors were substantial, indicating a significant impact on the spatiotemporal heterogeneity of UR.
For the interaction increments in 2022, all factor interactions were positive, suggesting that such interactions can enhance UR. The interaction increments Ii(q)(x2∩x3), Ii(q)(x2∩x4), Ii(q)(x2∩x5), Ii(q)(x2∩x8), and Ii(q)(x2∩x9) were notably high, which was attributed to the minimal influence of x2 on UR. Conversely, the interaction increments among the other pairs of factors, expect for x2, were comparatively small; however, their interaction contributed significantly to UR.
The impact of the interaction between any two factors on the spatiotemporal heterogeneity of UR was higher than that of a single factor, suggesting that the UR of Hunan Province was influenced by multiple factors rather than a solitary one. There were two types of interaction outcomes for all factors, i.e., two-factor enhancement and nonlinear enhancement, with no linear weakening and independence between two factors observed in this study. The interaction detection value on the right side of the lower left corner of Table 4 gradually turned green over time, i.e., the detection value decreased from 2014 to 2022, indicating that the UR of ecological factors displayed a gradually weakening tendency. Conversely, the interaction detection value on the left side of the lower left corner of Table 4 increased progressively, suggesting that the influence of economic factors on UR gradually increased. This was because economic development served as the foundation for other resilience improvements and sustainable urban development.
To summarize, the interaction detections at each time node were essentially the same although the spatial heterogeneity of UR varied at different time nodes. The factors contributing to the spatiotemporal heterogeneity of UR in Hunan Province mainly arose from the disparities in economic development and social security among different cities. The coordination and joint action of various driving factors was the main reason for the spatiotemporal heterogeneity of UR.
4. Discussion
Cities are complex human-environment coupling systems and the processes by which they develop resilience are comprehensively affected the alterations of the internal and external urban environment. The spatiotemporal heterogeneity of UR is the outcome of the joint effect of various natural environment, economy, society, ecology, facilities, and internal and external interferences. Identifying the spatiotemporal heterogeneity of UR and its key determinants holds significant theoretical and practical significance for determining the UR mechanism and formulating the strategies of resilience promotion.
The conclusions of this study were largely consistent with the distribution principles of China's UR (Zhao, 2021) and Hunan’s UR (Chen, Ma, Yang, Zhou, Huang, & Chen, 2023). For example, high levels of resilience were identified in cities surrounding a provincial capital city; high-resilience cities had a positive spatial spillover effect; and low-resilience cities generally tended to develop toward high-resilience in cities over time. Hunan's UR increased from 2014 to 2022 and was high in the northeast and low in the southwest; The spatiotemporal heterogeneity of UR was mainly driven by economic and social factors.
The average value of Hunan's UR (0.2692 in 2014, 0.3021 in 2018, and 0.3422 in 2022) was lower than the average value of China's UR of 0.3604 in 2010 (Zhao, Fang, Liu, & Zhang, 2022). This indicates that Hunan's UR had not caught up with China's average resilience by 2022, and Hunan's economic, social, and ecological development remains at a low level. Direct comparison between the conclusions of Zhao et al. (2021) and the present study is difficult because Zhao et al. focused their resilience analysis on 292 cities, rather than all cities in China.
Previous studies of the driving factors of UR predominantly employed correlation and partial correlation coefficients. These methods mainly concentrated on the linear relationship between a single driving factor and the research object. In reality, the spatiotemporal heterogeneity of UR is typically a consequence of the interactions among multiple factors. The geodetector statistical tool used in this study can not only explore the impact of a single factor on UR, but also determine the contribution of factor interactions on UR.
The directionality of the spatial distribution of UR based on the standard deviation ellipse can describe the centrality, distribution, directionality, and spatial form of the spatial distribution of UR from a global and spatial perspective. The spatial range, barycenter, major axis, minor axis, and azimuth of the ellipse were used to reveal the outline and dominant direction of the spatial distribution of UR.
The distribution of the Theil index of UR in Hunan Province is associated with the imbalance of its internal economic development. As the political, economic, and cultural center of Hunan Province, Changsha has well-developed manufacturing, service, and high-tech industries due to its favorable geographical location and abundant resources, along with substantial policy support and resource prioritization. In contrast, western and southern Hunan are located in mountainous terrain, characterized by challenging transportation access, limited resource availability, and a reliance on a singular industrial structure. Therefore, achieving the balance of UR and sustainable economic and social development is the primary task confronting Hunan Province.
The following measures should be adopted to enhance the UR in Hunan Province. First, economic development constitutes the most significant factor influencing the spatial heterogeneity of UR (Davidson, Nguyen, Beilin, & Briggs, 2019). The high-quality and diversified urban economy with high levels of innovation, particularly in high-tech industry and the modern service sector, can foster new sources of economic growth. Additionally, emphasis should be placed on industrial transformation and upgrading, such as the transformation from old to new driving forces and the transformation of economic growth patterns. Concurrently, the anti-risk capability of the urban economy should be enhanced through measures including the optimal allocation of resources, industries, and skills as well as increased investment in urban infrastructure.
Second, social development serves as the foundation for the improvement of UR in Hunan Province. Urban social resilience should be enhanced through measures such as increased investment in governance resources and incomes for urban residents; the establishment of emergency management systems, public utilities, smart cities, smart transportation, and smart healthcare; and the improvement of population quality (i.e., education levels, health status, skills and competencies, workforce capabilities, social cohesion).
Finally, ecosystem resilience plays a crucial role in ensuring the smooth functioning of urban systems and creating a comfortable living environment in Hunan Province. The ability of cities to cope with various ecological risks would be enhanced through measures, such as eco-environmental protection, the development of low-carbon and green industry, resource recycling, and integrated and differentiated construction approaches.
5. Conclusions
Identifying the key determinants and their contributions to the spatiotemporal heterogeneity of UR provides the basis for ensuring the balanced development of UR, formulating urban planning, and achieving urban sustainable development. A UR evaluation model was constructed to reveal the spatiotemporal heterogeneity of UR in the GIS environment. The aggregation characteristics of high and low values of UR were revealed by applying the hotspots method. The evolution and direction of UR were spatially and dynamically determined using the standard deviation ellipse. The overall, interregional, and intra-regional differences of UR were determined by applying the Theil index. The degrees of influence of a single factor and interactions between two factors on the spatiotemporal heterogeneity of UR were determined using the geodetector tool.
From 2014 to 2022, the UR in Hunan Province generally increased; the resilience gap between cities gradually narrowed; the number of high-resilience cities gradually increased; and the resilience, hotspots, and Theil index were all high in the northeast and low in the southwest. High resilience cities had a positive spatial spillover effect on surrounding low-resilience cities. The barycenter of UR shifted from the northeast to southwest and then to southeast during the study period. The factors that contribute significantly to UR were per capita GDP, average wages of on-the-job employees, per capita social consumption, and doctor density. The impact of the interactions between any two factors on the spatiotemporal heterogeneity of UR was higher than that of a single-factor. Two-factor enhancement and nonlinear enhancement were the main forms of the factor interaction of UR in Hunan Province. Economic development and social security constitute the main material basis for the spatiotemporal heterogeneity of UR in Hunan Province.
The measurement of UR should encompass a unified theoretical framework featuring multiple elements (environment, facilities, and system), multiple levels (communities, cities, and regions), and multiple objectives (safety, adaptation, and innovation). The effectiveness of decision-making for UR should be enhanced through dynamic monitoring, simulation, and early warning systems. The mechanism of the spatiotemporal heterogeneity of UR could be determined by considering the resilience processes with long-time series and classifying urban types according to different regions, sizes, and functions. The coupling and causal relationships between urban economic, social, and ecological factors and UR should be comprehensively investigated using a Bayesian probability network, structural equation model, and the system dynamics method.
Author Contributions
Jingwei Hou: Funding acquisition, Project administration, Conceptualization, Writing - review & editing, Supervision. Ji Zhou: Formal analysis, Writing – original draft. Yonghong He: Visualization, Validation. Bo Hou: Data curation, Investigation. Gongpeng He: Methodology, Software.
Funding
This research was supported by the Research Project of Humanities and Social Sciences of the Ministry of Education (grant numbers 23YJAZH049), General Project of Achievements Evaluation Committee of Social Science in Hunan Province of China (grant numbers XSP24YBC399), Natural Science Foundation of Hunan Province in China (grant numbers 2023JJ30271), Key Scientific Research Project of Hunan Provincial Education Department (grant numbers 22A0573 and 23A0574) and Construction Program of Applied Characteristic Discipline in Hunan University of Science and Engineering.
Conflicts of Interest
The authors declare that they have no known competing financial interests or personal relationships that could have appeared to influence the work reported in this paper.
References
- Adger, W. N. (2000). Social and ecological resilience: Are they related? Progress in Human Geography, 24(3), 347−364. [CrossRef]
- Adger, W. N., Hughes, T. P., Folke, C., Carpenter, S. R., & Rockstrom J. (2005). Social ecological resilience to coastal disasters. Science, 309 (5737), 1036−1039. [CrossRef]
- Ahern, J. (2011). From fail-safe to safe-to-fail: Sustainability and resilience in the new urban world. Landscape and Urban Planning, 100(4), 341−343. [CrossRef]
- Allan, P., & Bryant, M. (2011). Resilience as a framework for urbanism and recovery. Journal of Landscape Architecture, 6(2), 34−45. [CrossRef]
- Bruneau, M., Chang, S. E., Eguchi, R. T., Lee, G. C., O’Rourke, T. D., Reinhorn, A. M., Shinozuka, M., Tierney, K., Wallace, W. A., Winterfeldt von, & Detlof. (2012). A framework to quantitatively assess and enhance the seismic resilience of communities. Earthquake Spectra, 19(4), 733−752. [CrossRef]
- Burton, C.G. (2015). A validation of metrics for community resilience to natural hazards and disasters using the recovery from Hurricane Katrina as a case study. Annals of the Association of American Geographers, 105(1), 67−86. [CrossRef]
- Carvalho, D., Martins, H., Marta-Almeida, M., Rocha, A., & Borrego, C. (2017). Urban resilience to future urban heat waves under a climate change scenario: A case study for Porto urban area (Portugal). Urban Climate, 19(1), 1−27. [CrossRef]
- Chen, J. H., Ma, H. C., Yang, S., Zhou, Z. Y., Huang, J. H., & Chen, L. C. (2023). Assessment of urban resilience and detection of impact factors based on spatial autocorrelation analysis and geodetector model: a case of Hunan Province. ISPRS International Journal of Geo-Information. 12 (10), 391. [CrossRef]
- Christmann, P., & Ibert, O. (2012). Vulnerability and resilience in a socio-spatial perspective. Raumforschung und Raumordnung, 70(4), 259−272. [CrossRef]
- Cutter, S. L., Barnes, L., Berry, M., Burton, C., Evans, E., Tate, E., & Webb, J. (2008). A place-based model for understanding community resilience to natural disasters. Global Environmental Change, 18(4), 598−606. [CrossRef]
- Daniela, P.G., Mauricio, M., Roberto, M., & Cristóbal, H. (2018). Risk and Resilience Monitor: Development of multiscale and multilevel indicators for disaster risk management for the communes and urban areas of Chile. Applied Geography, 94(5), 262−271. [CrossRef]
- Davidson, K., Nguyen, T. M. P., Beilin, R., & Briggs, J. (2019). The emerging addition of resilience as a component of sustainability in urban policy. Cities, 92(1), 1−9. [CrossRef]
- Du, M., Zhang, X., Wang, Y, Tao, Li., & Li, H. (2020). An operationalizing model for measuring urban resilience on land expansion. Habitat International, 102, 102206. [CrossRef]
- Hamilton, W. A. H. (2009). Resilience and the city: the water sector. Proceedings of the Institution of Civil Engineers, 162(3), 109−121. [CrossRef]
- Jabareen, Y. (2013). Planning the resilient city: concepts and strategies for coping with climate change and environmental risk. Cities, 31, 220−229. [CrossRef]
- Josune, H., Patricia, M., Raquel, G., Jose, M. S., & Leire, L. (2019). Towards resilient cities: A maturity model for operationalizing resilience. Cities, 84(8), 96−103. [CrossRef]
- Kamila, B., Peter, N., & Porfirio, G. (2018). Urban resilience patterns after an external shock: An exploratory study. International Journal of Disaster Risk Reduction, 31(10), 381−392. [CrossRef]
- Kevin, C. D., & Trevor, H. F. (2013). Designing, planning, and managing resilient cities: A conceptual framework. Cities, 35, 89−99. [CrossRef]
- Kim, B., Lee, G. S., Kim, M., Lee, W. S., & Choi, H. S. (2023). Developing and applying an urban resilience index for the evaluation of declining areas: a case study of South Korea’s urban regeneration sites. International Journal of Environmental Research and Public Health. 20(4), 3653. [CrossRef]
- Li, Y., Kappas, M., & Li, Y. F. (2018). Exploring the coastal urban resilience and transformation of coupled human-environment systems. Journal of Cleaner Production, 195(11), 1505−1511. [CrossRef]
- Marjolein, S., & Bas, W. (2017). Building up resilience in cities worldwide-Rotterdam as participant in the 100 Resilient Cities Programme. Cities, 61(5), 109−116. [CrossRef]
- Meerow, S., Newell, J. P., & Stults, M. (2016). Defining urban resilience: a review. Landscape and Urban Planning, 147(3), 38−49. [CrossRef]
- Meerow, S., & Newell, J. P. (2016). Urban resilience for whom, what, when, where, and why? Urban Geography, 12(7), 1−21. [CrossRef]
- Raquel, G., Leire, L., & Josune, H. (2017). A maturity model for the involvement of stakeholders in the city resilience building process. Technological Forecasting & Social Change, 121(8), 7−16. [CrossRef]
- Sherrieb, K., Norris, F. H., & Galea, S. (2010). Measuring capacities for community resilience. Social Indicators Research, 99(2), 227−247. [CrossRef]
- Walker, B., Holling, C. S., Carpener, S. R., & Kinzig, A. P. (2004). Resilience, adaptability and transformability in social- ecological systems. Ecology and Society, 9(2), 5−12. [CrossRef]
- Wang, J. F., & Xu, C. D. (2017). Geodetector: principle and prospective. Acta Geographica Sinica, 72(1), 116−134. [CrossRef]
- Wang, J., Li, X., Christakos, G., Liao, Y., Zhang, T., Gu, X., & Zheng, X. (2010). Geographical detectors-based health risk assessment and its application in the neural tube defects study of the Heshun Region, China. International Journal of Geographical Information Science, 24(1-2),107−127. [CrossRef]
- Wang, J. F., & Hu, Y. (2012). Environmental health risk detection with GeogDetector. Environmental Modelling & Software, 33, 114–115. [CrossRef]
- Zhang, Z., Dou, Y., Liu, X., & Gong, Z. (2023). Multi-hierarchical spatial clustering for characteristic towns in China: An Orange-based framework to integrate GIS and Geodetector. J. Geogr. Sci. 33(3): 618−638. [CrossRef]
- Zhao, R. D. (2021). Study on spatiotemporal pattern evolution, influence mechanism and promotion path of urban resilience in China. Xinjiang University. (in Chinese).
- Zhao, R. D., Fang, C. L., Liu, J., & Zhang, L. F. (2022). The evaluation and obstacle analysis of urban resilience from the multidimensional perspective. Sustainable Cities and Society, 86 (4),104160. [CrossRef]
- Zhao, R., Fang, C., & Liu, X. (2021). Evaluating urban ecosystem resilience using the DPSIR framework and the ENA model: A case study of 35 cities in China. Sustainable Cities and Society, 72(9), 102997. [CrossRef]
- Zhu, M., Yu, X., Chen, K., Tan, H., & Yuan, J. (2024). Spatiotemporal characteristics and driving factors of chemical oxygen demand emissions in China’s wastewater: An analysis based on spatial autocorrelation and geodetector. Ecological Indicators, 166, 112308. [CrossRef]
Figure 1.
Distribution of the topography and cities in Hunan Province, China.
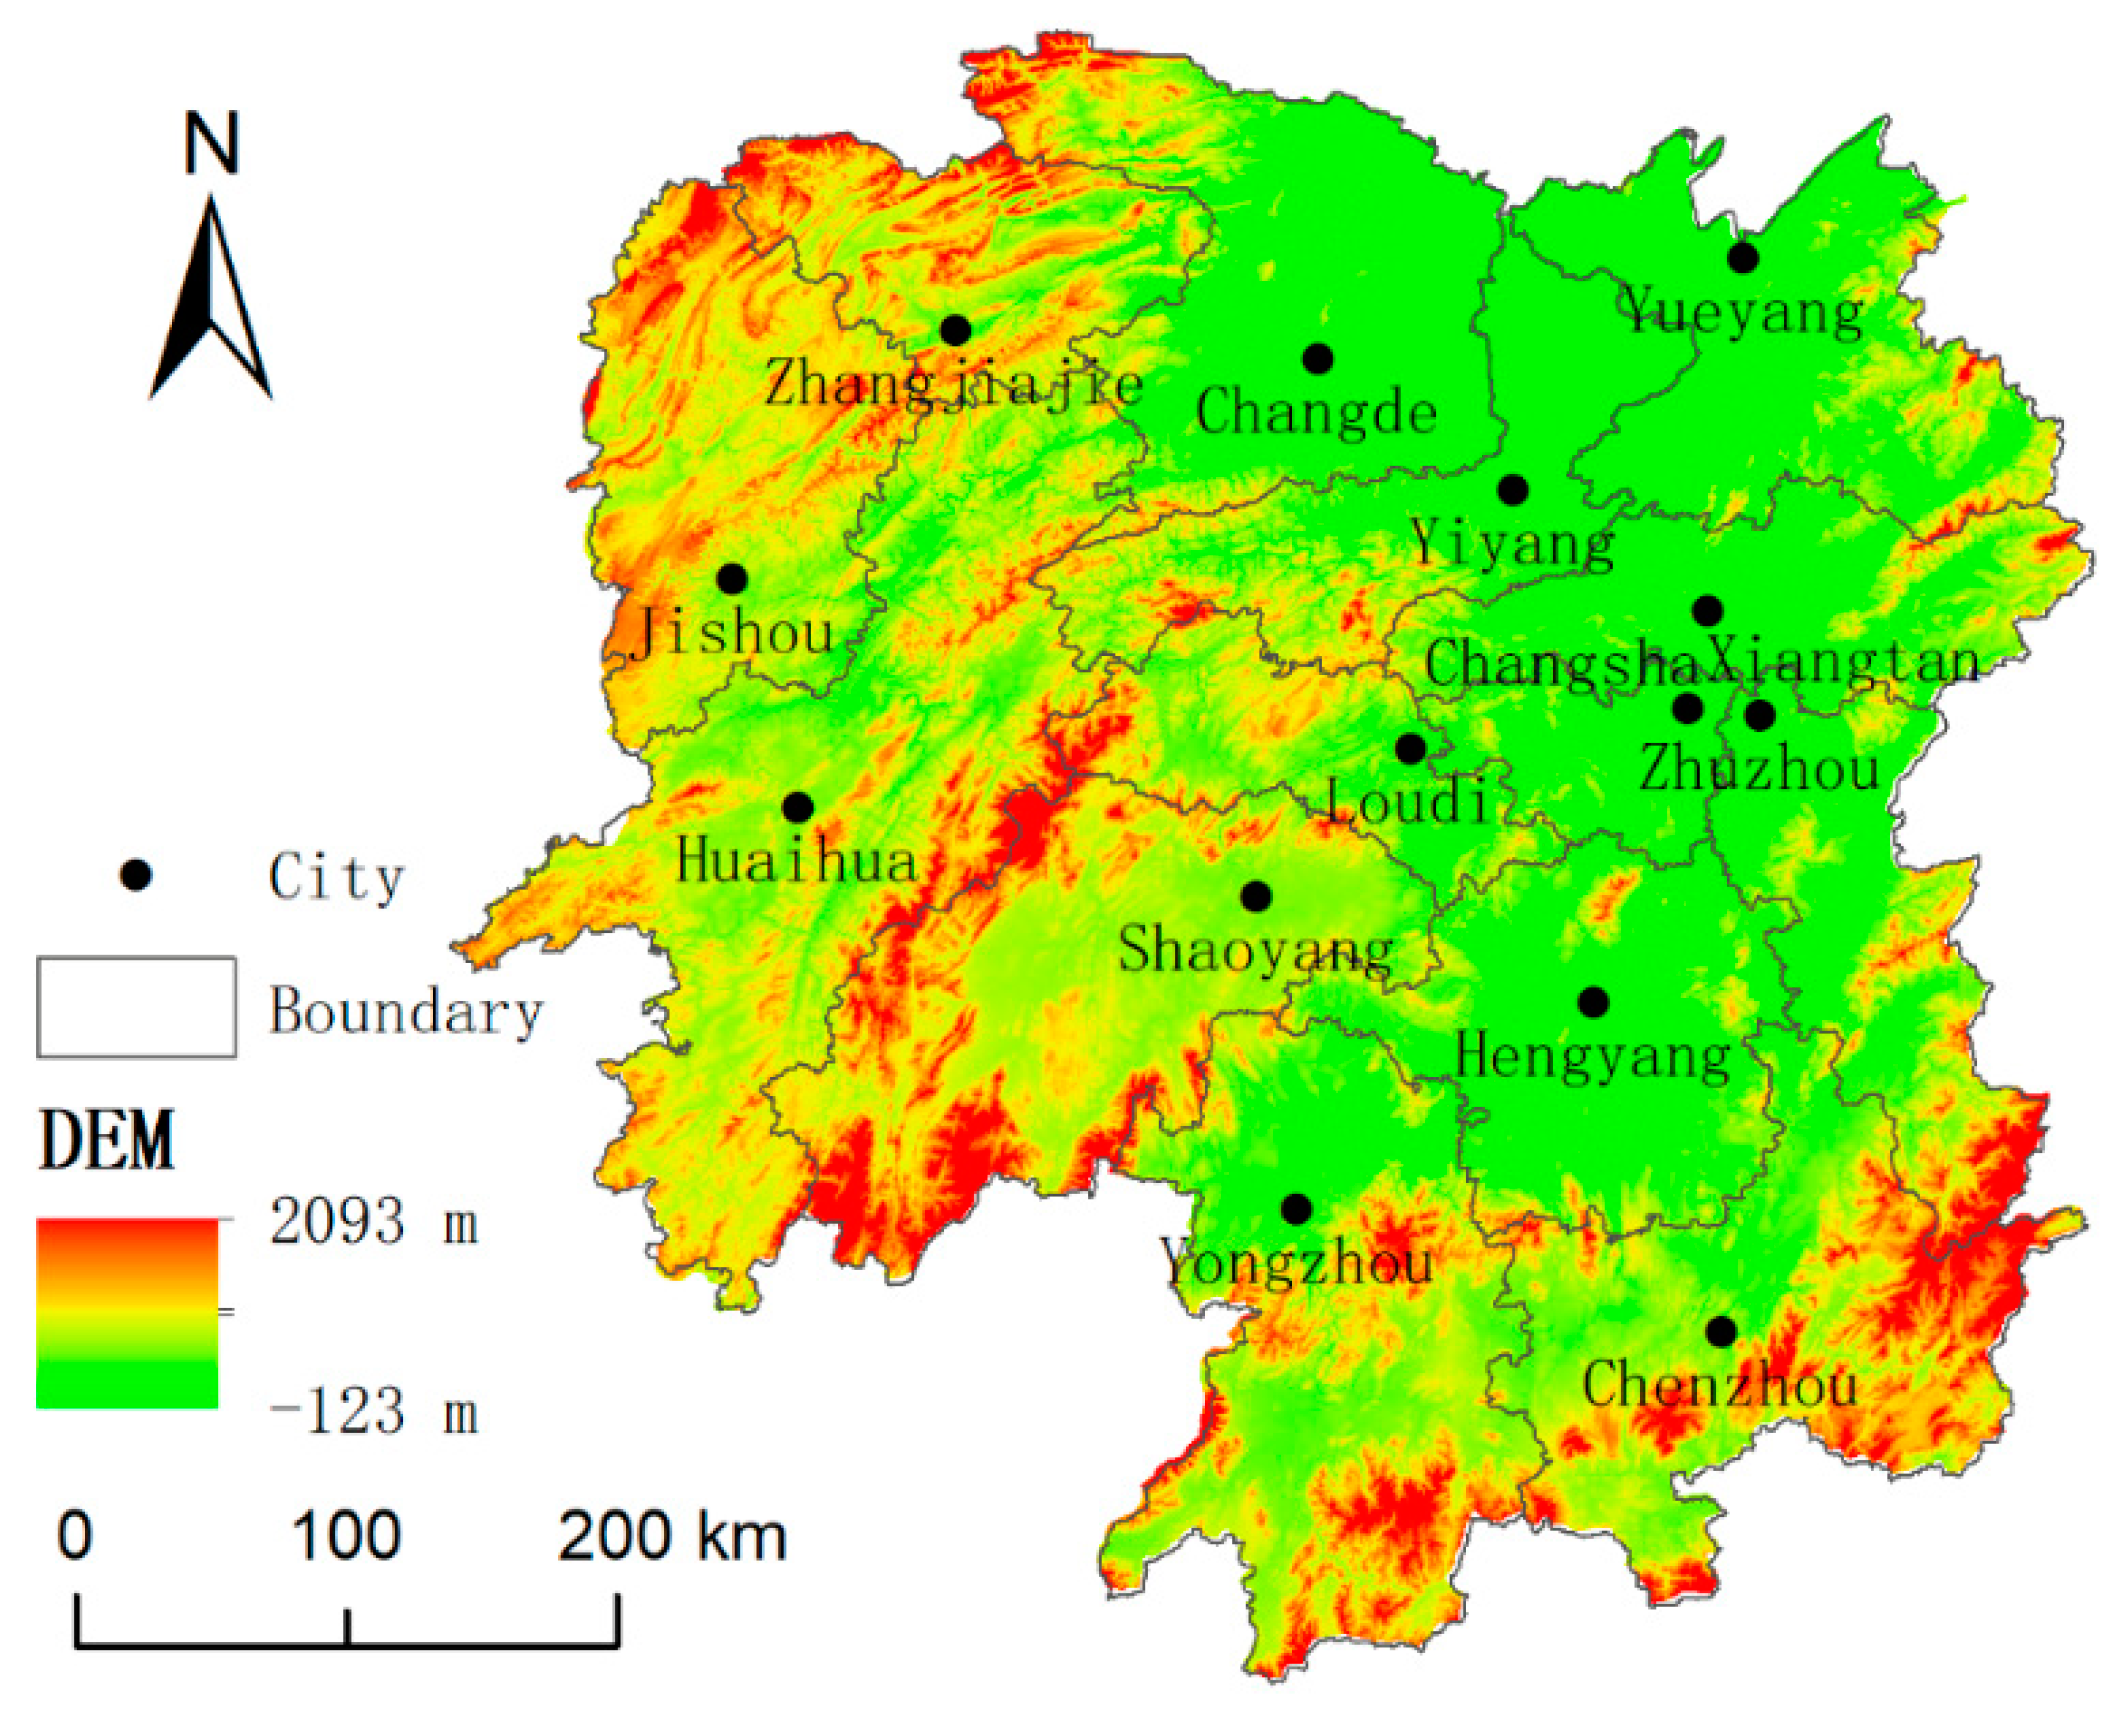
Figure 2.
Temporal evolution of UR in Hunan Province in 2014, 2018, and 2022.
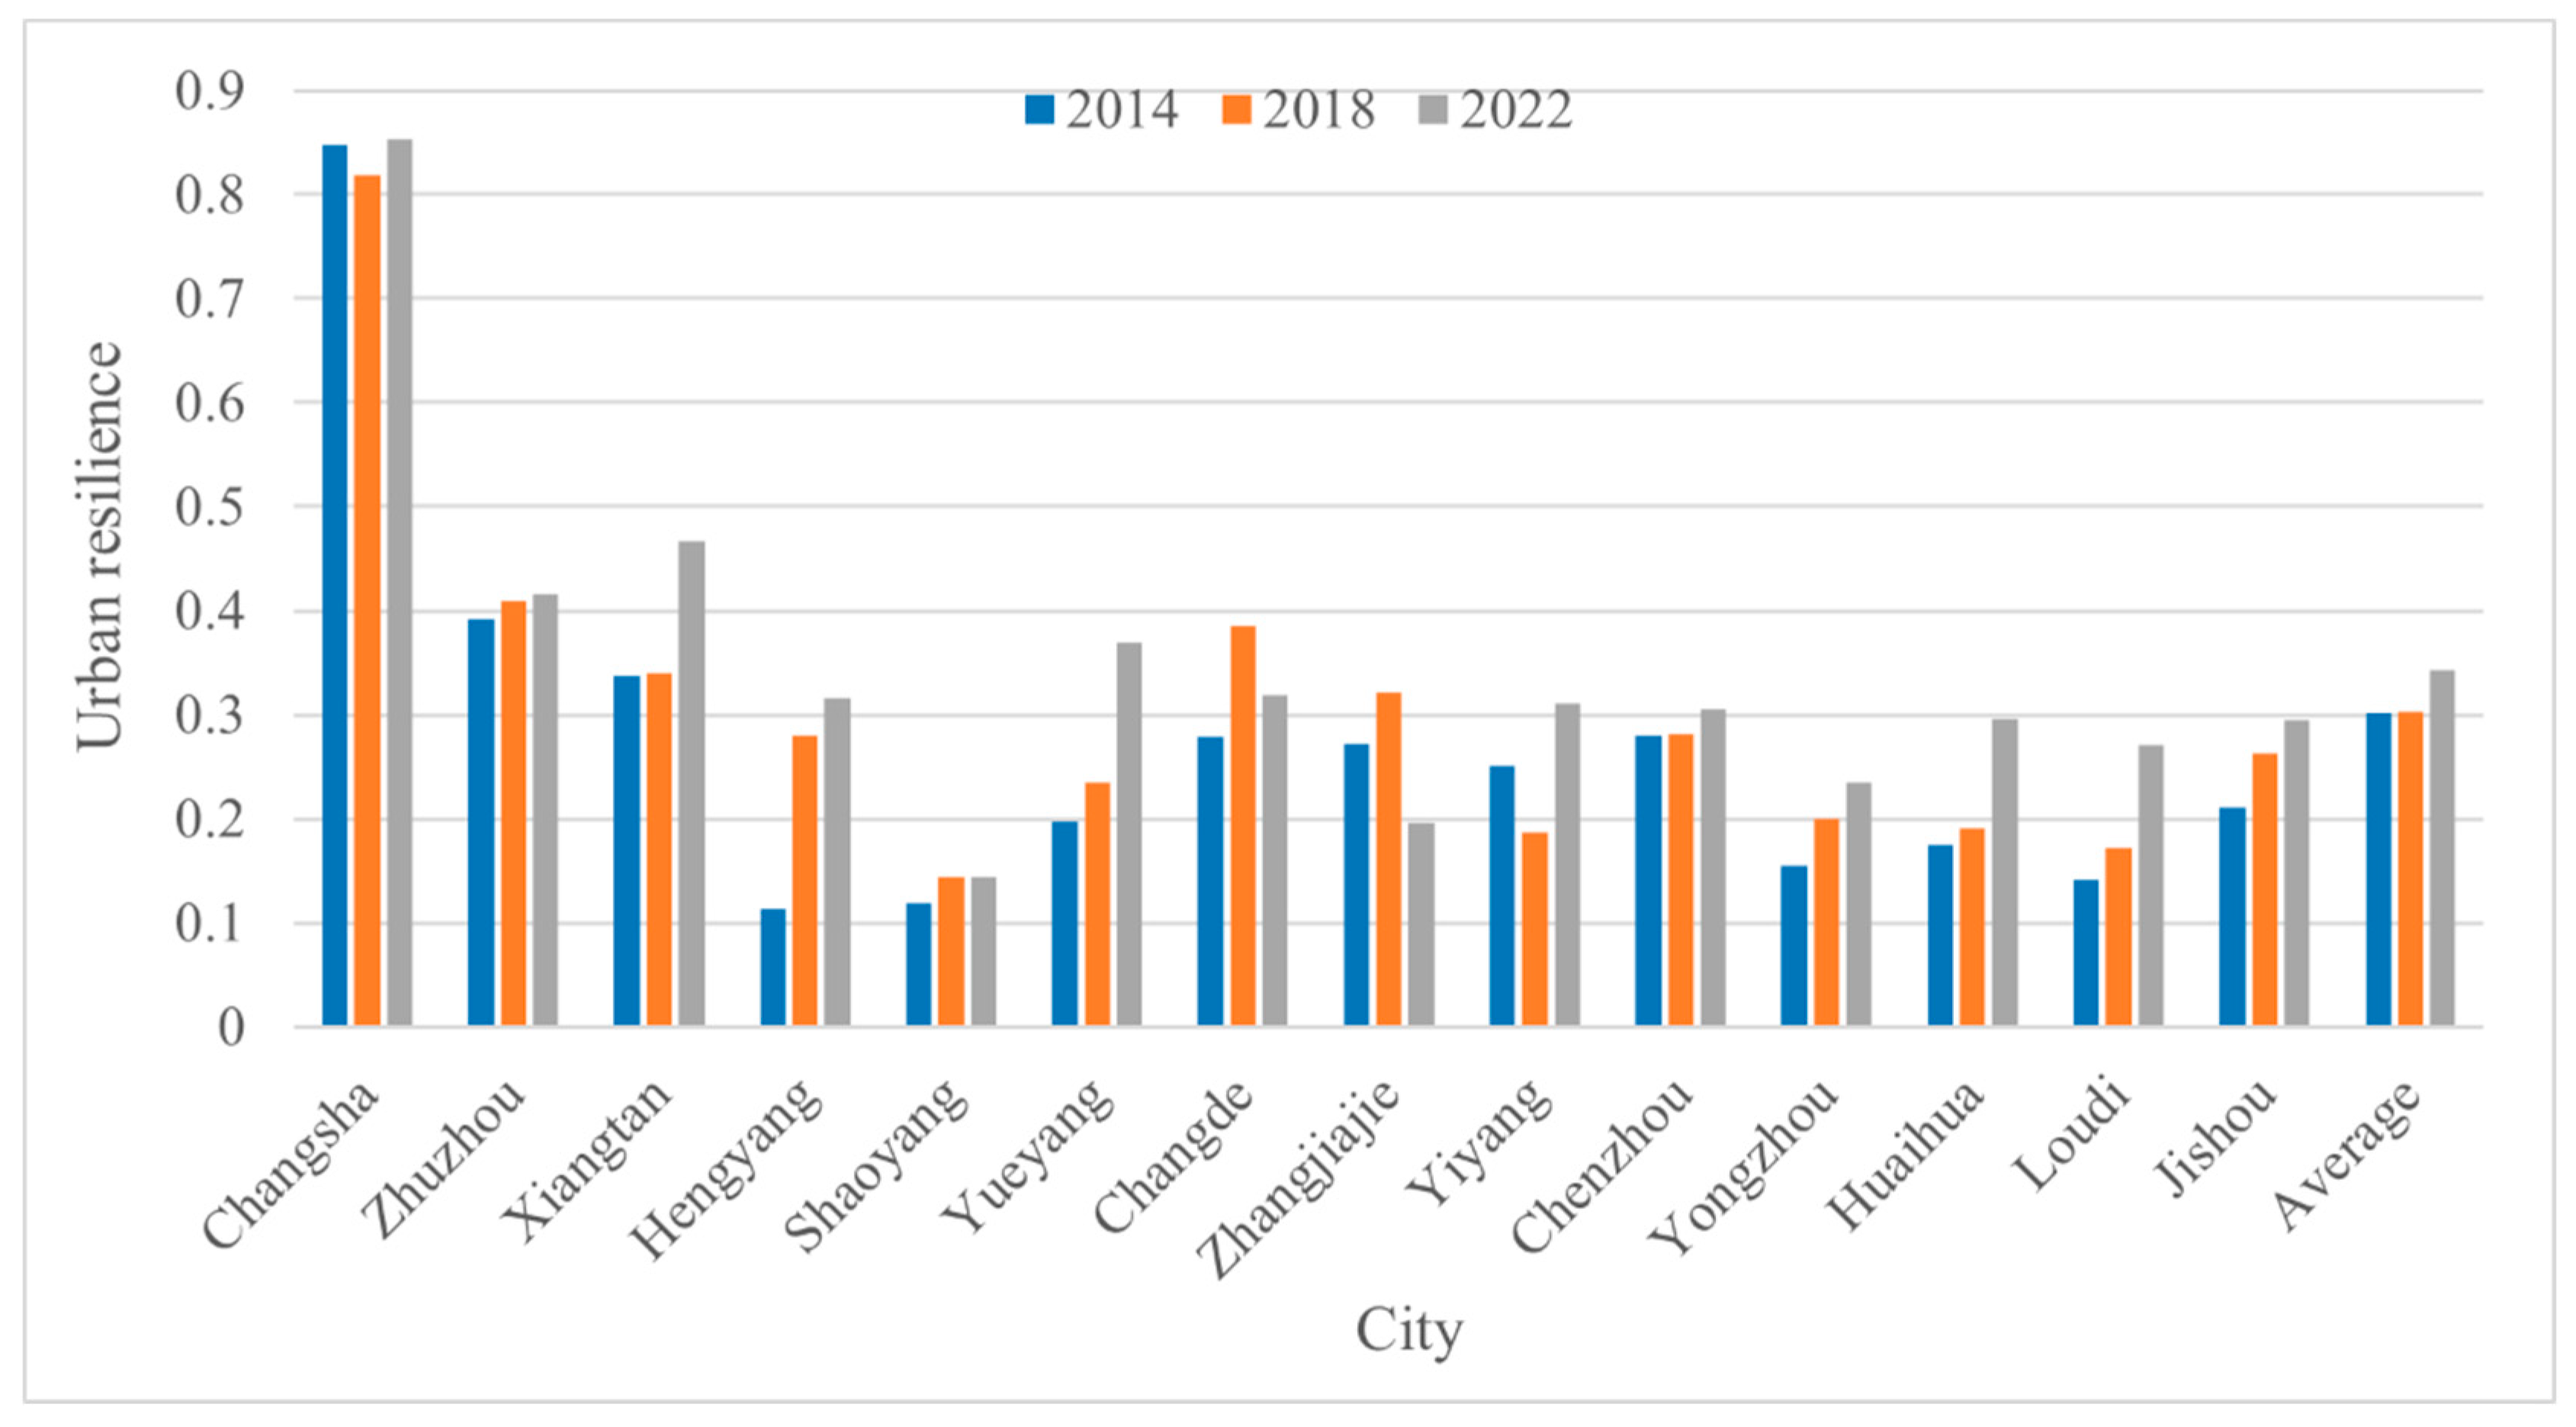
Figure 3.
The UR in Hunan Province in 2014 (a), 2018 (b), and 2022 (c) .
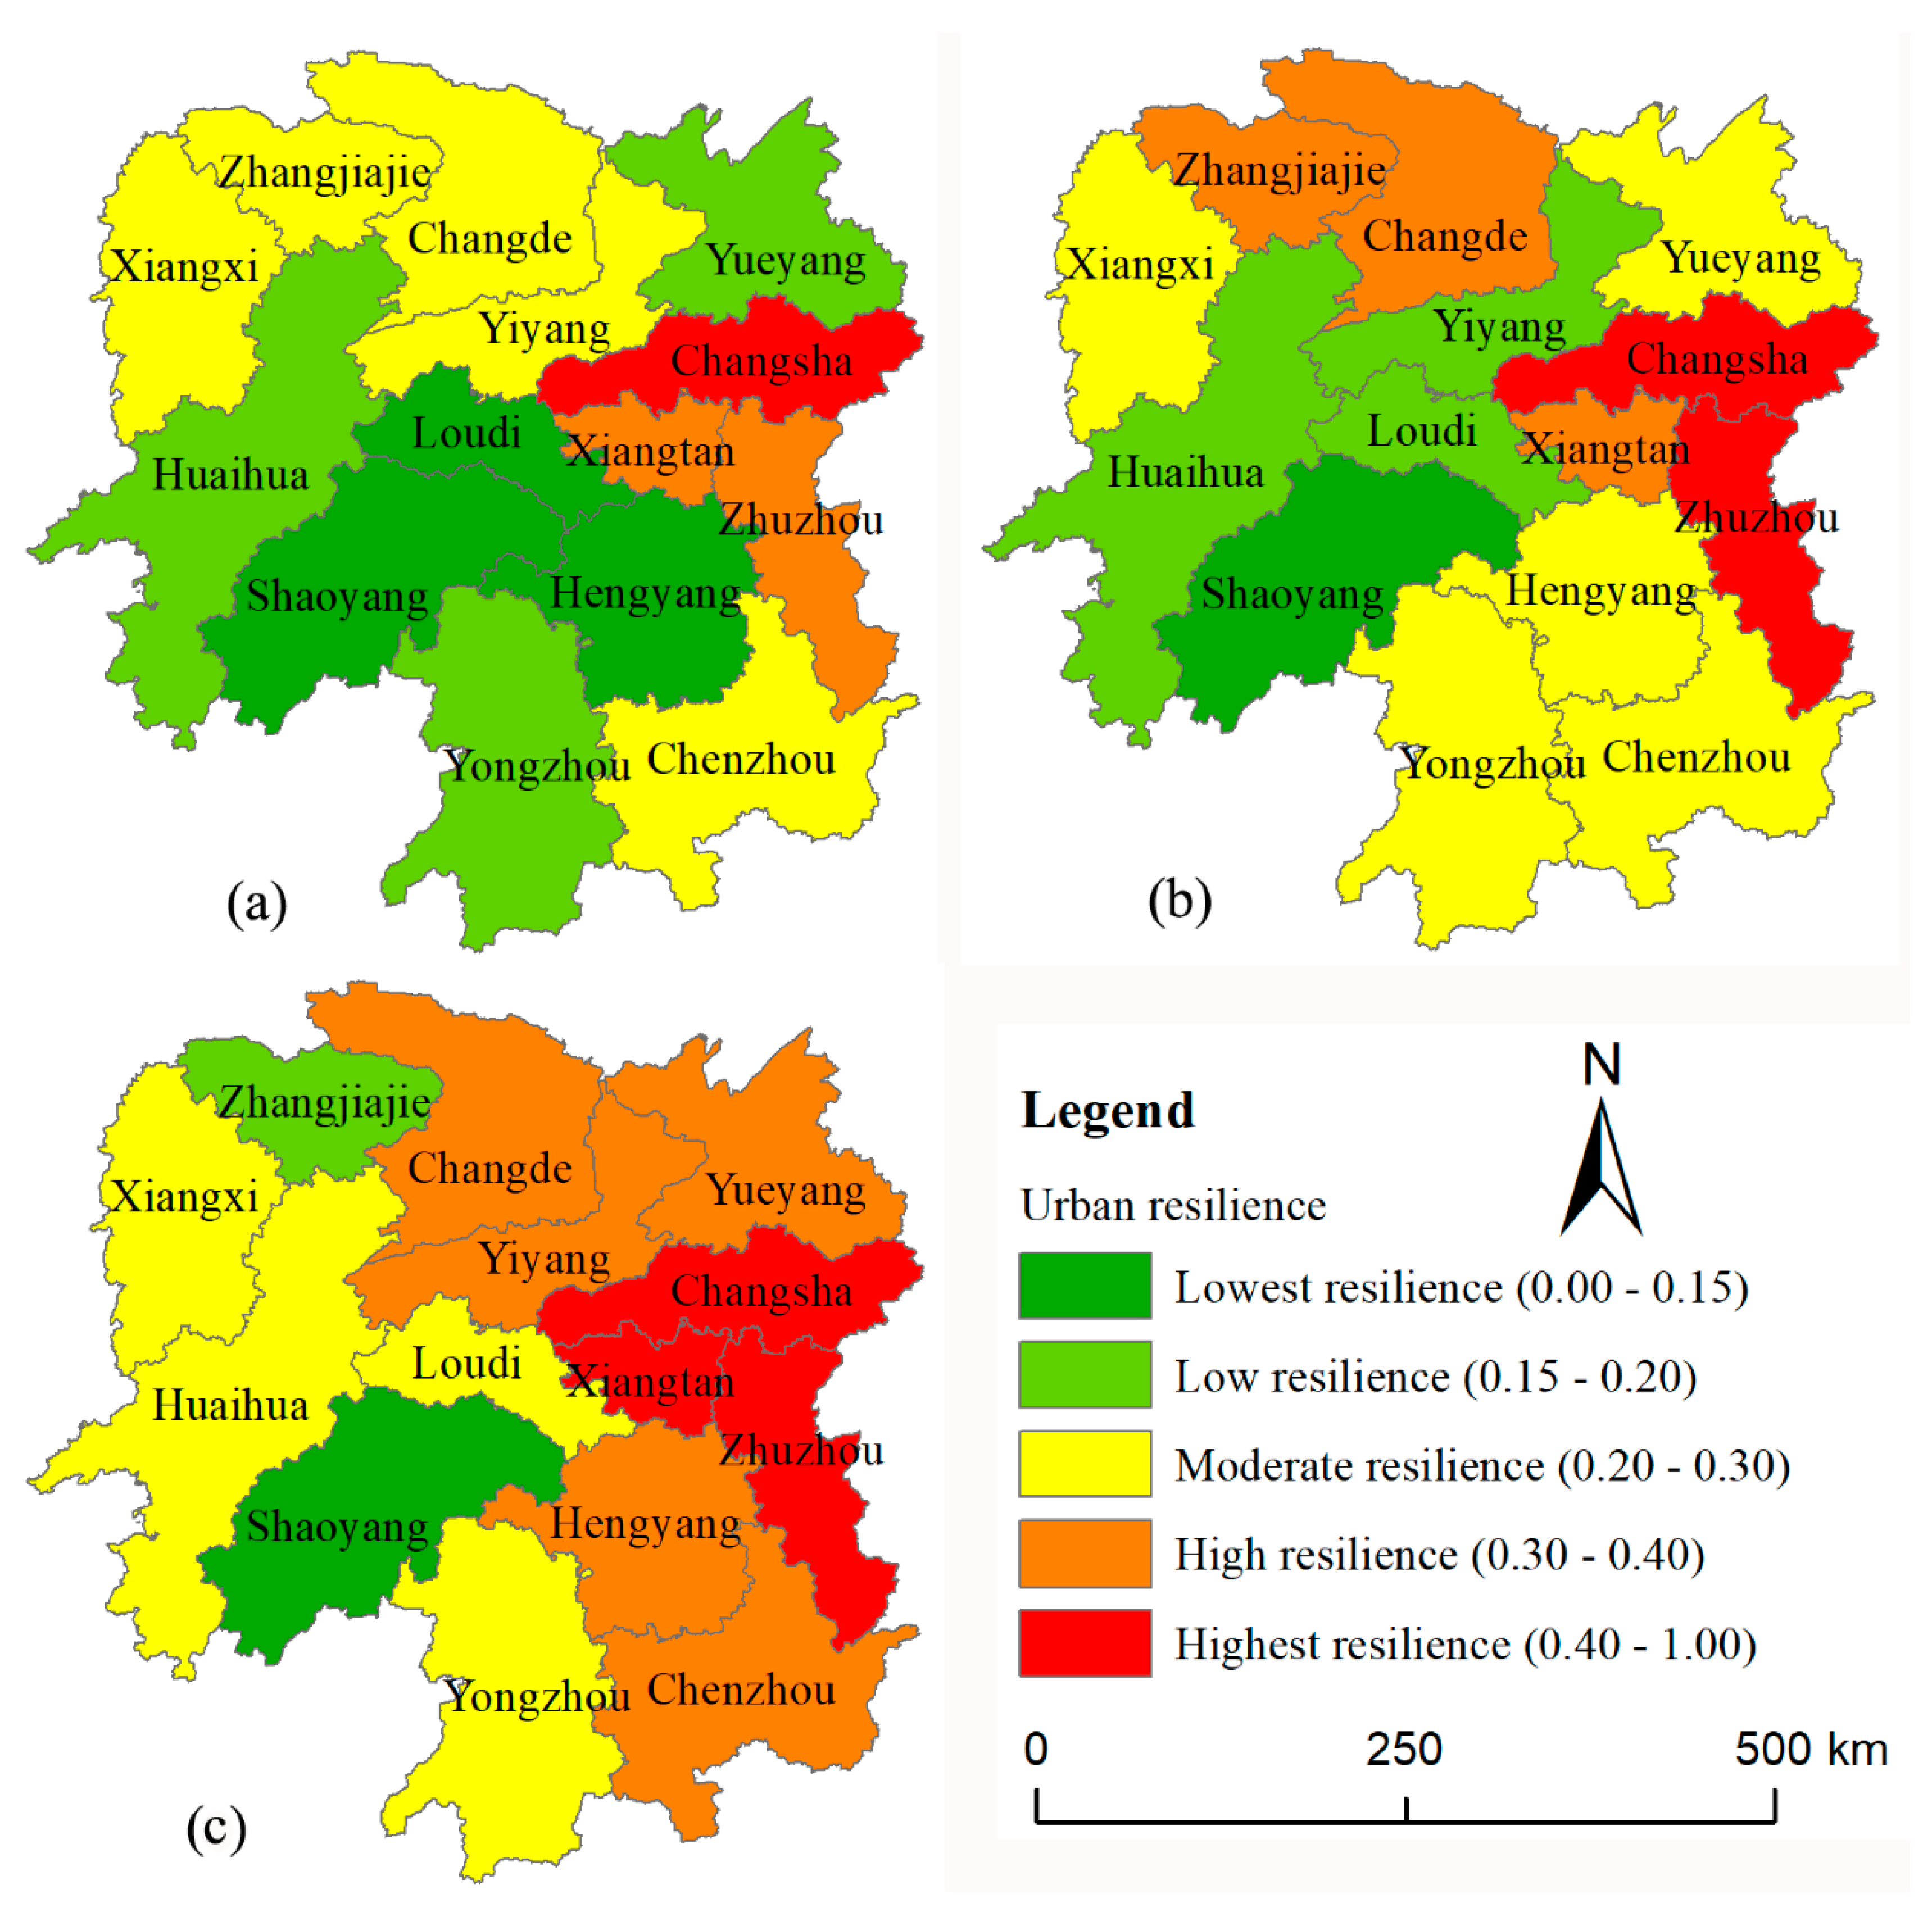
Figure 4.
The spatial and dynamic evolution of UR in Hunan Province from 2014 to 2022.
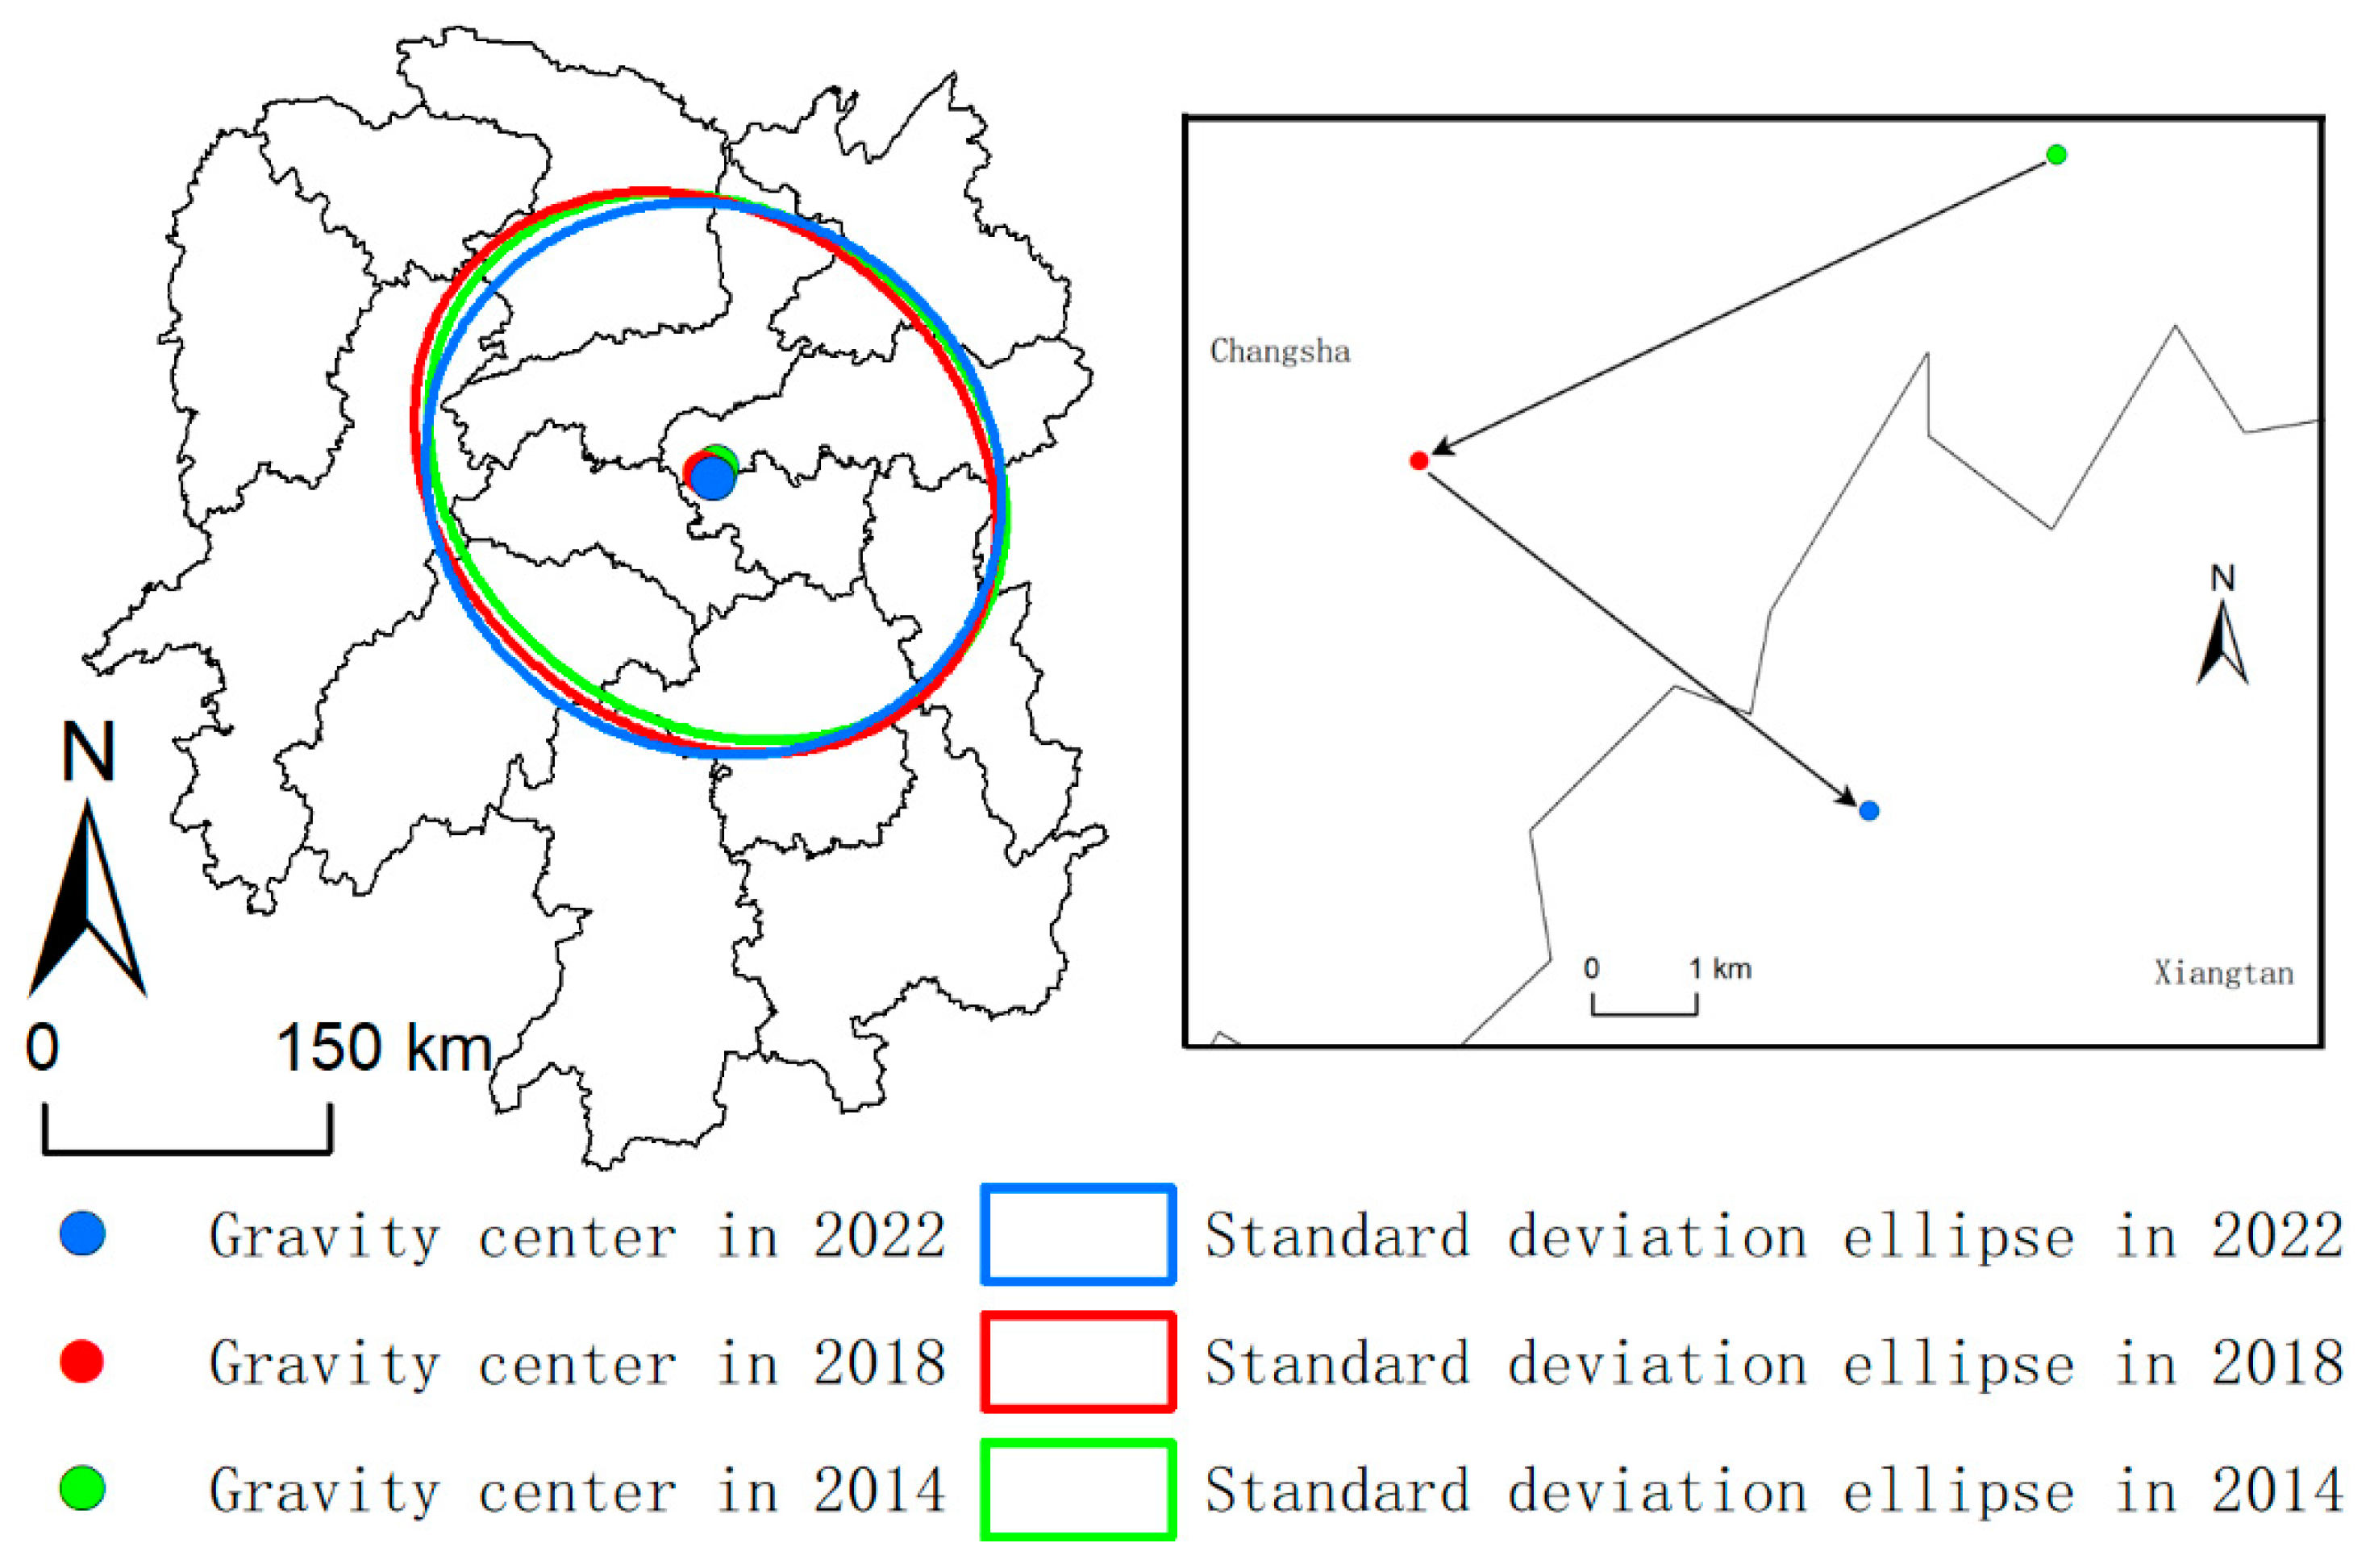
Figure 5.
Distribution of hot and cold spots of UR in 2014 (a), 2018 (b), and 2022 (c).
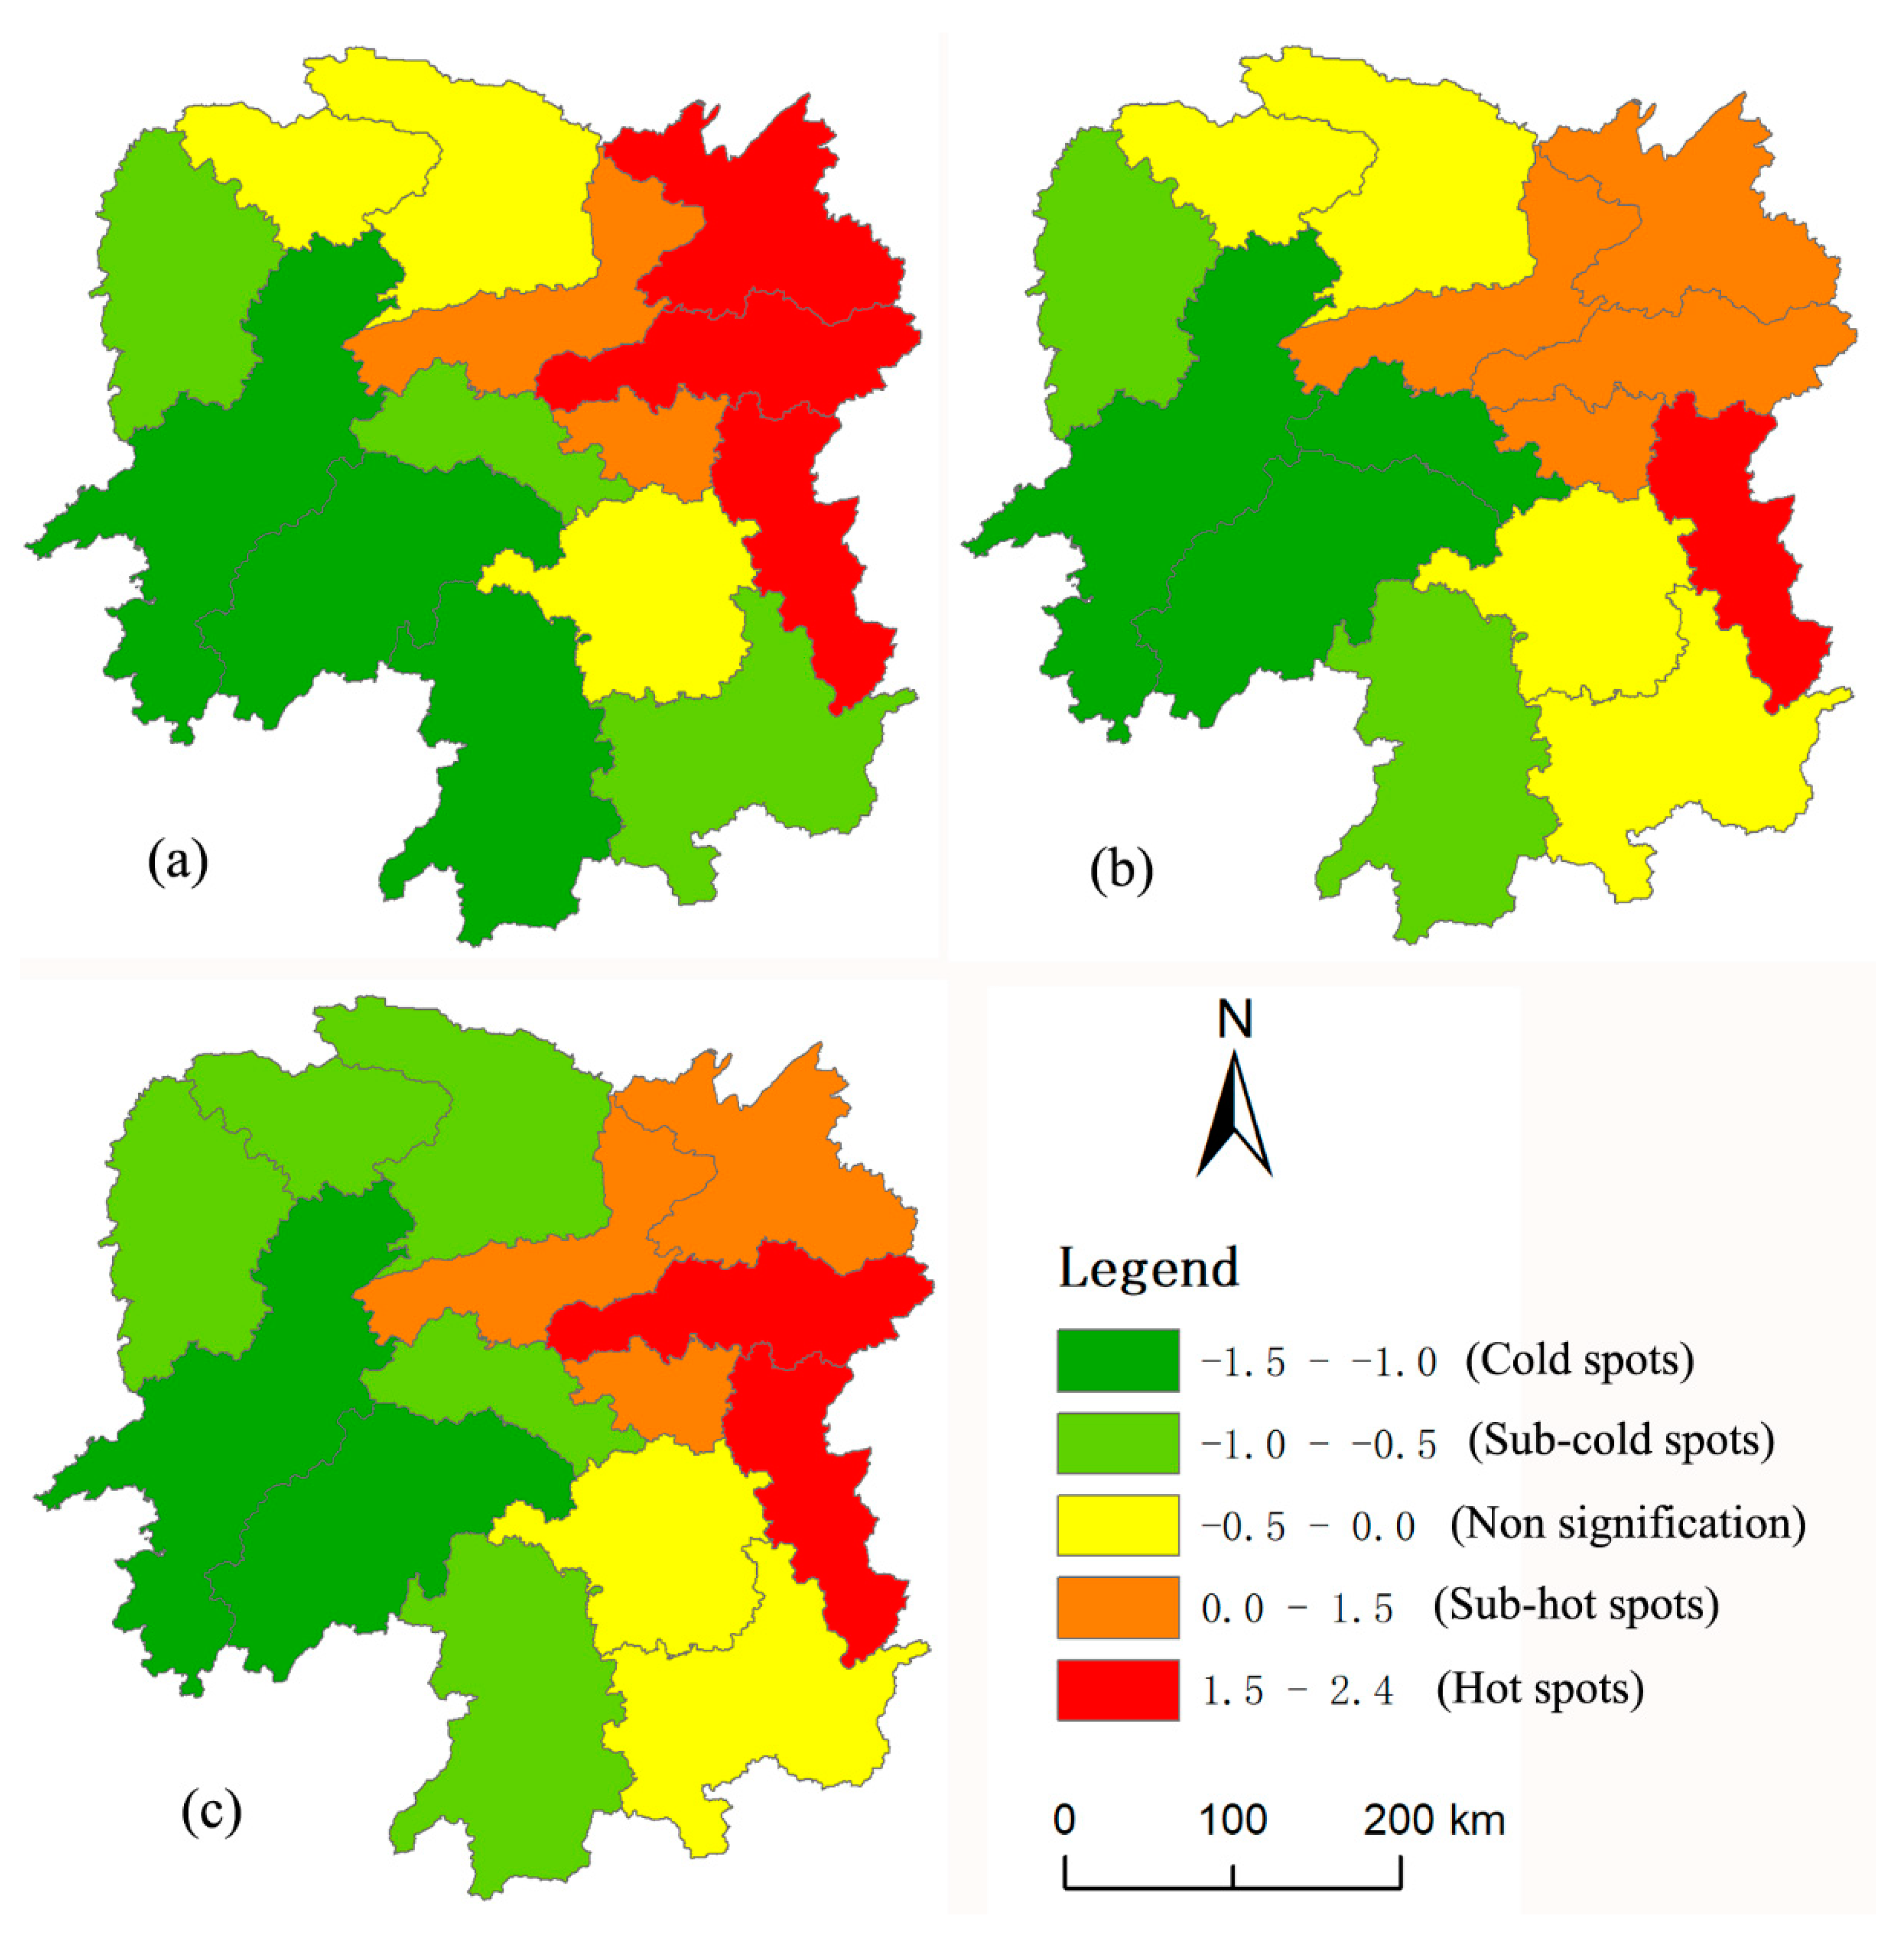
Figure 6.
Theil index values indicating the spatial variances of resilience within subregions (Tw) and between subregions (Tb) of Hunan Province.
Figure 6.
Theil index values indicating the spatial variances of resilience within subregions (Tw) and between subregions (Tb) of Hunan Province.
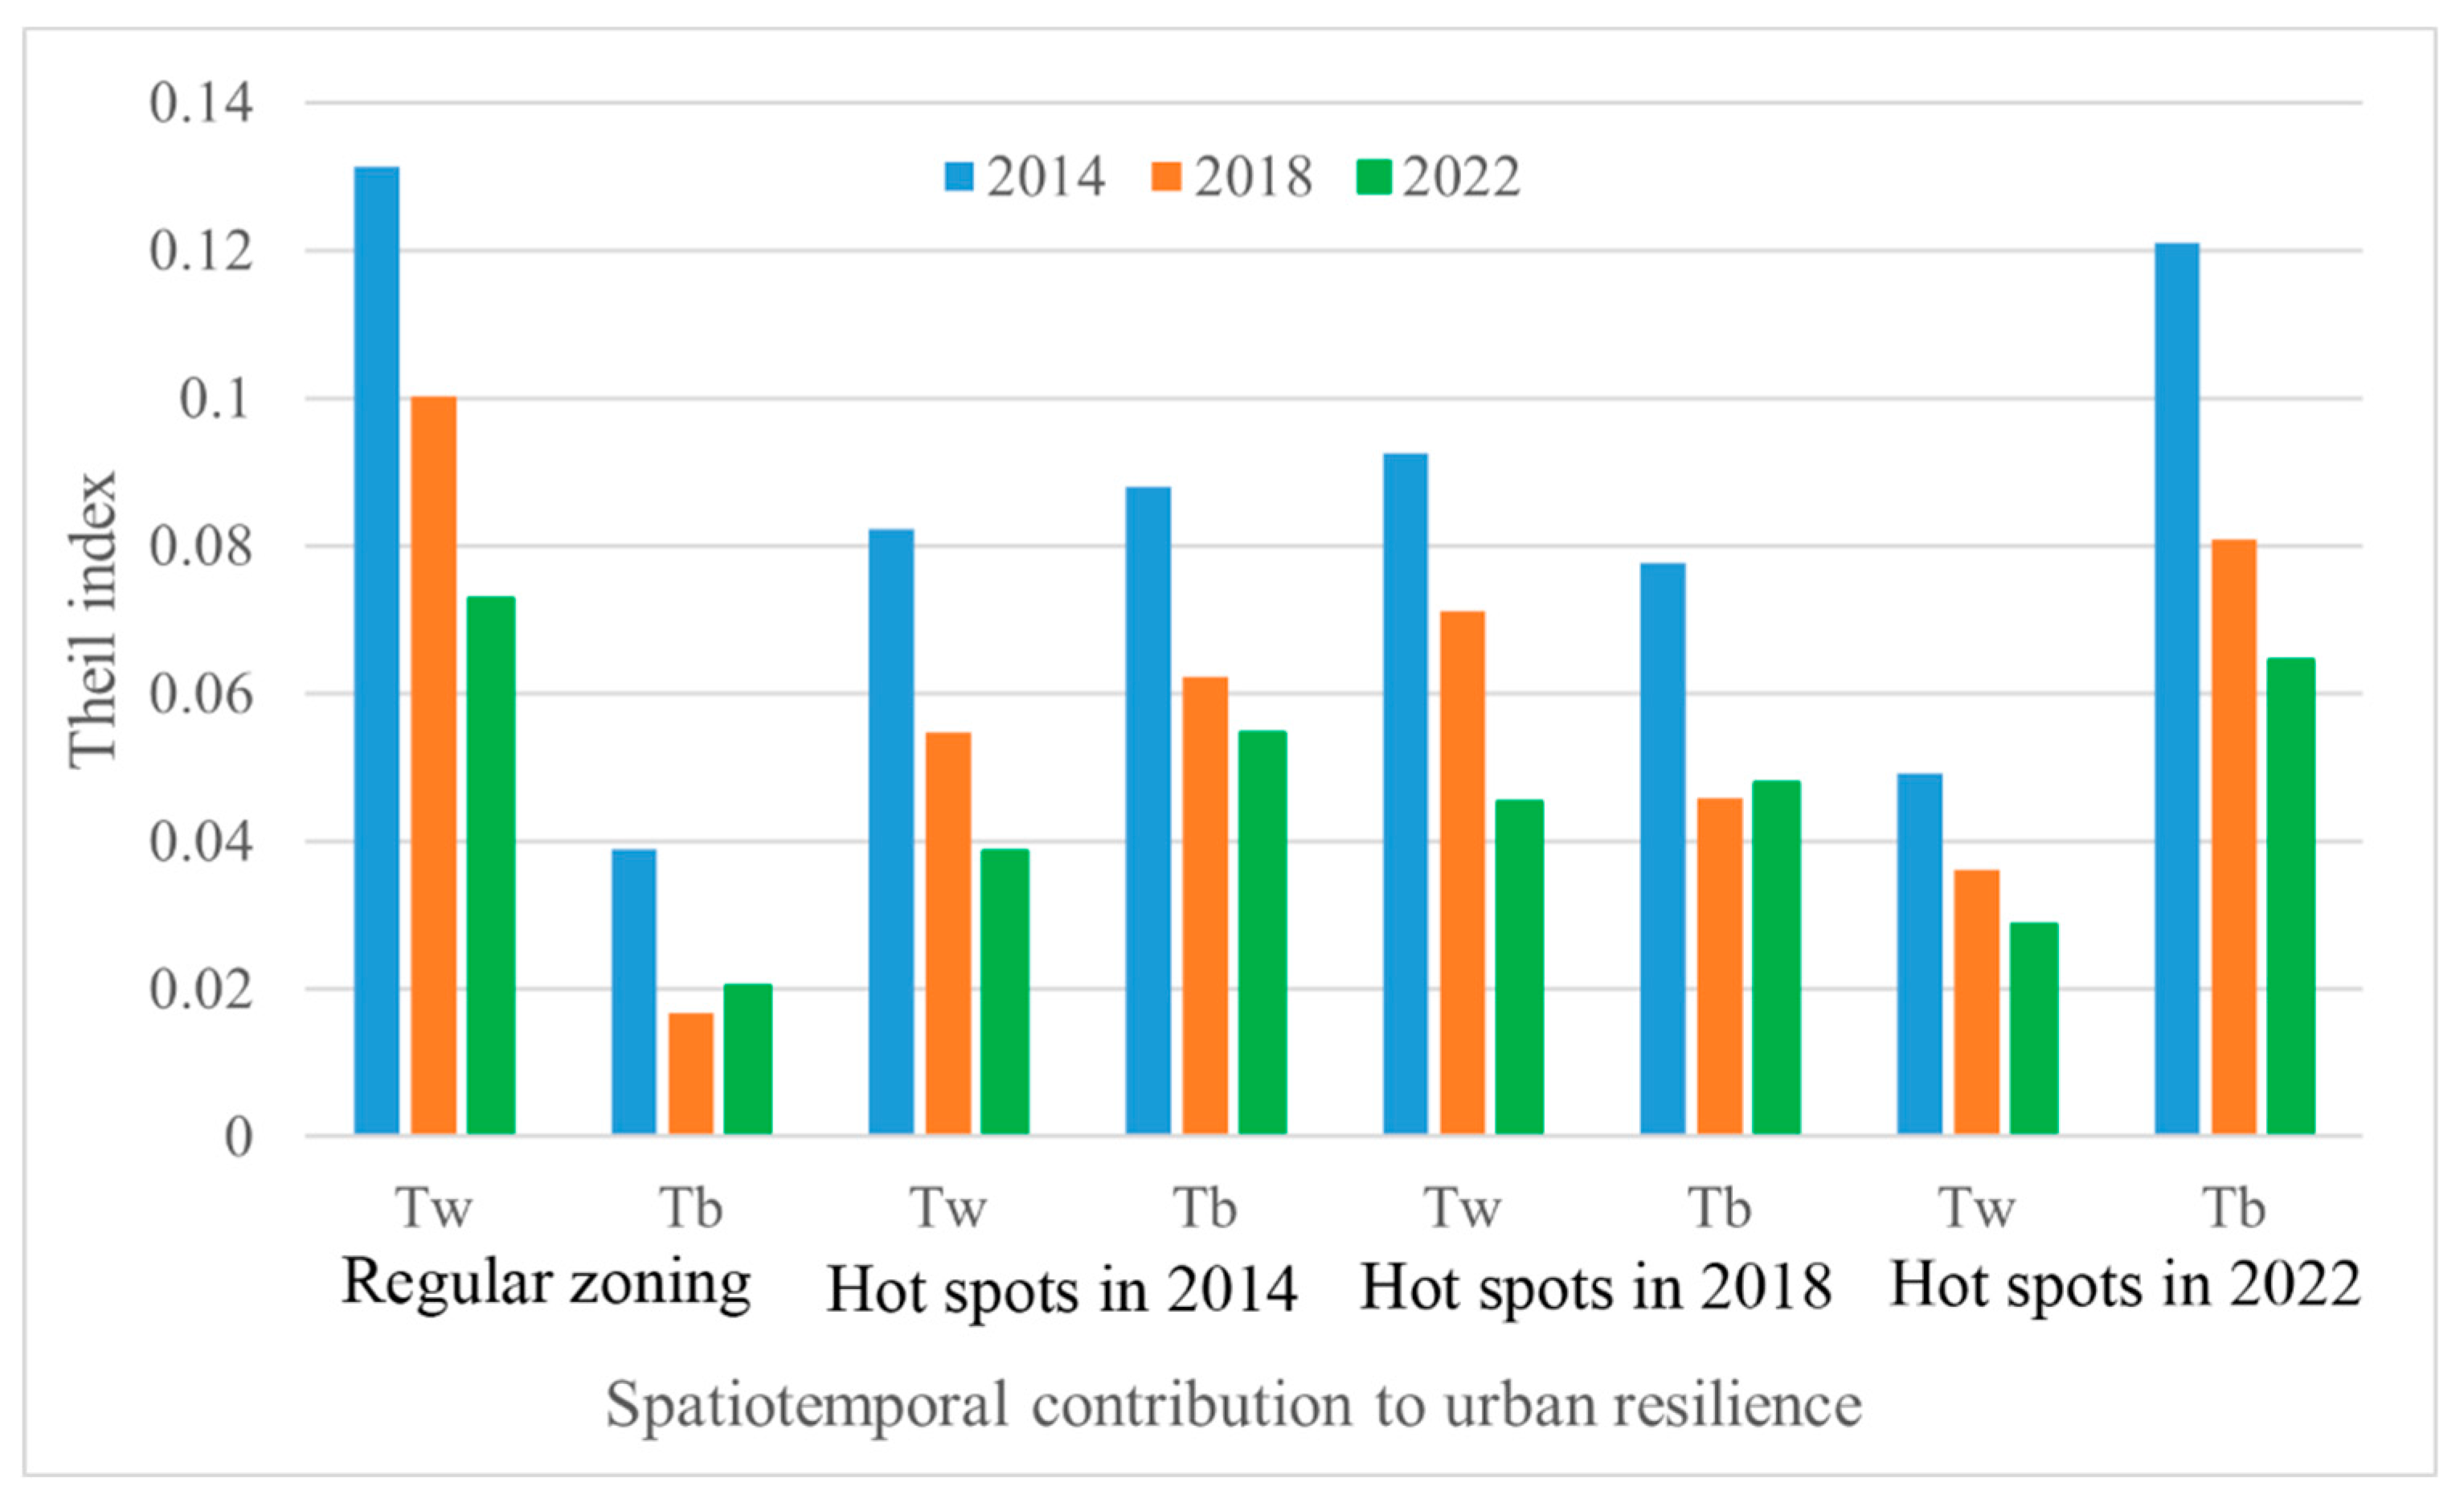
Figure 7.
Theil index values of UR obtained using the methods of conventional zoning (a), and zoning based on hotspots of UR in 2014 (b), 2018 (c), and 2022 (d) in different subregions of Hunan Province.
Figure 7.
Theil index values of UR obtained using the methods of conventional zoning (a), and zoning based on hotspots of UR in 2014 (b), 2018 (c), and 2022 (d) in different subregions of Hunan Province.
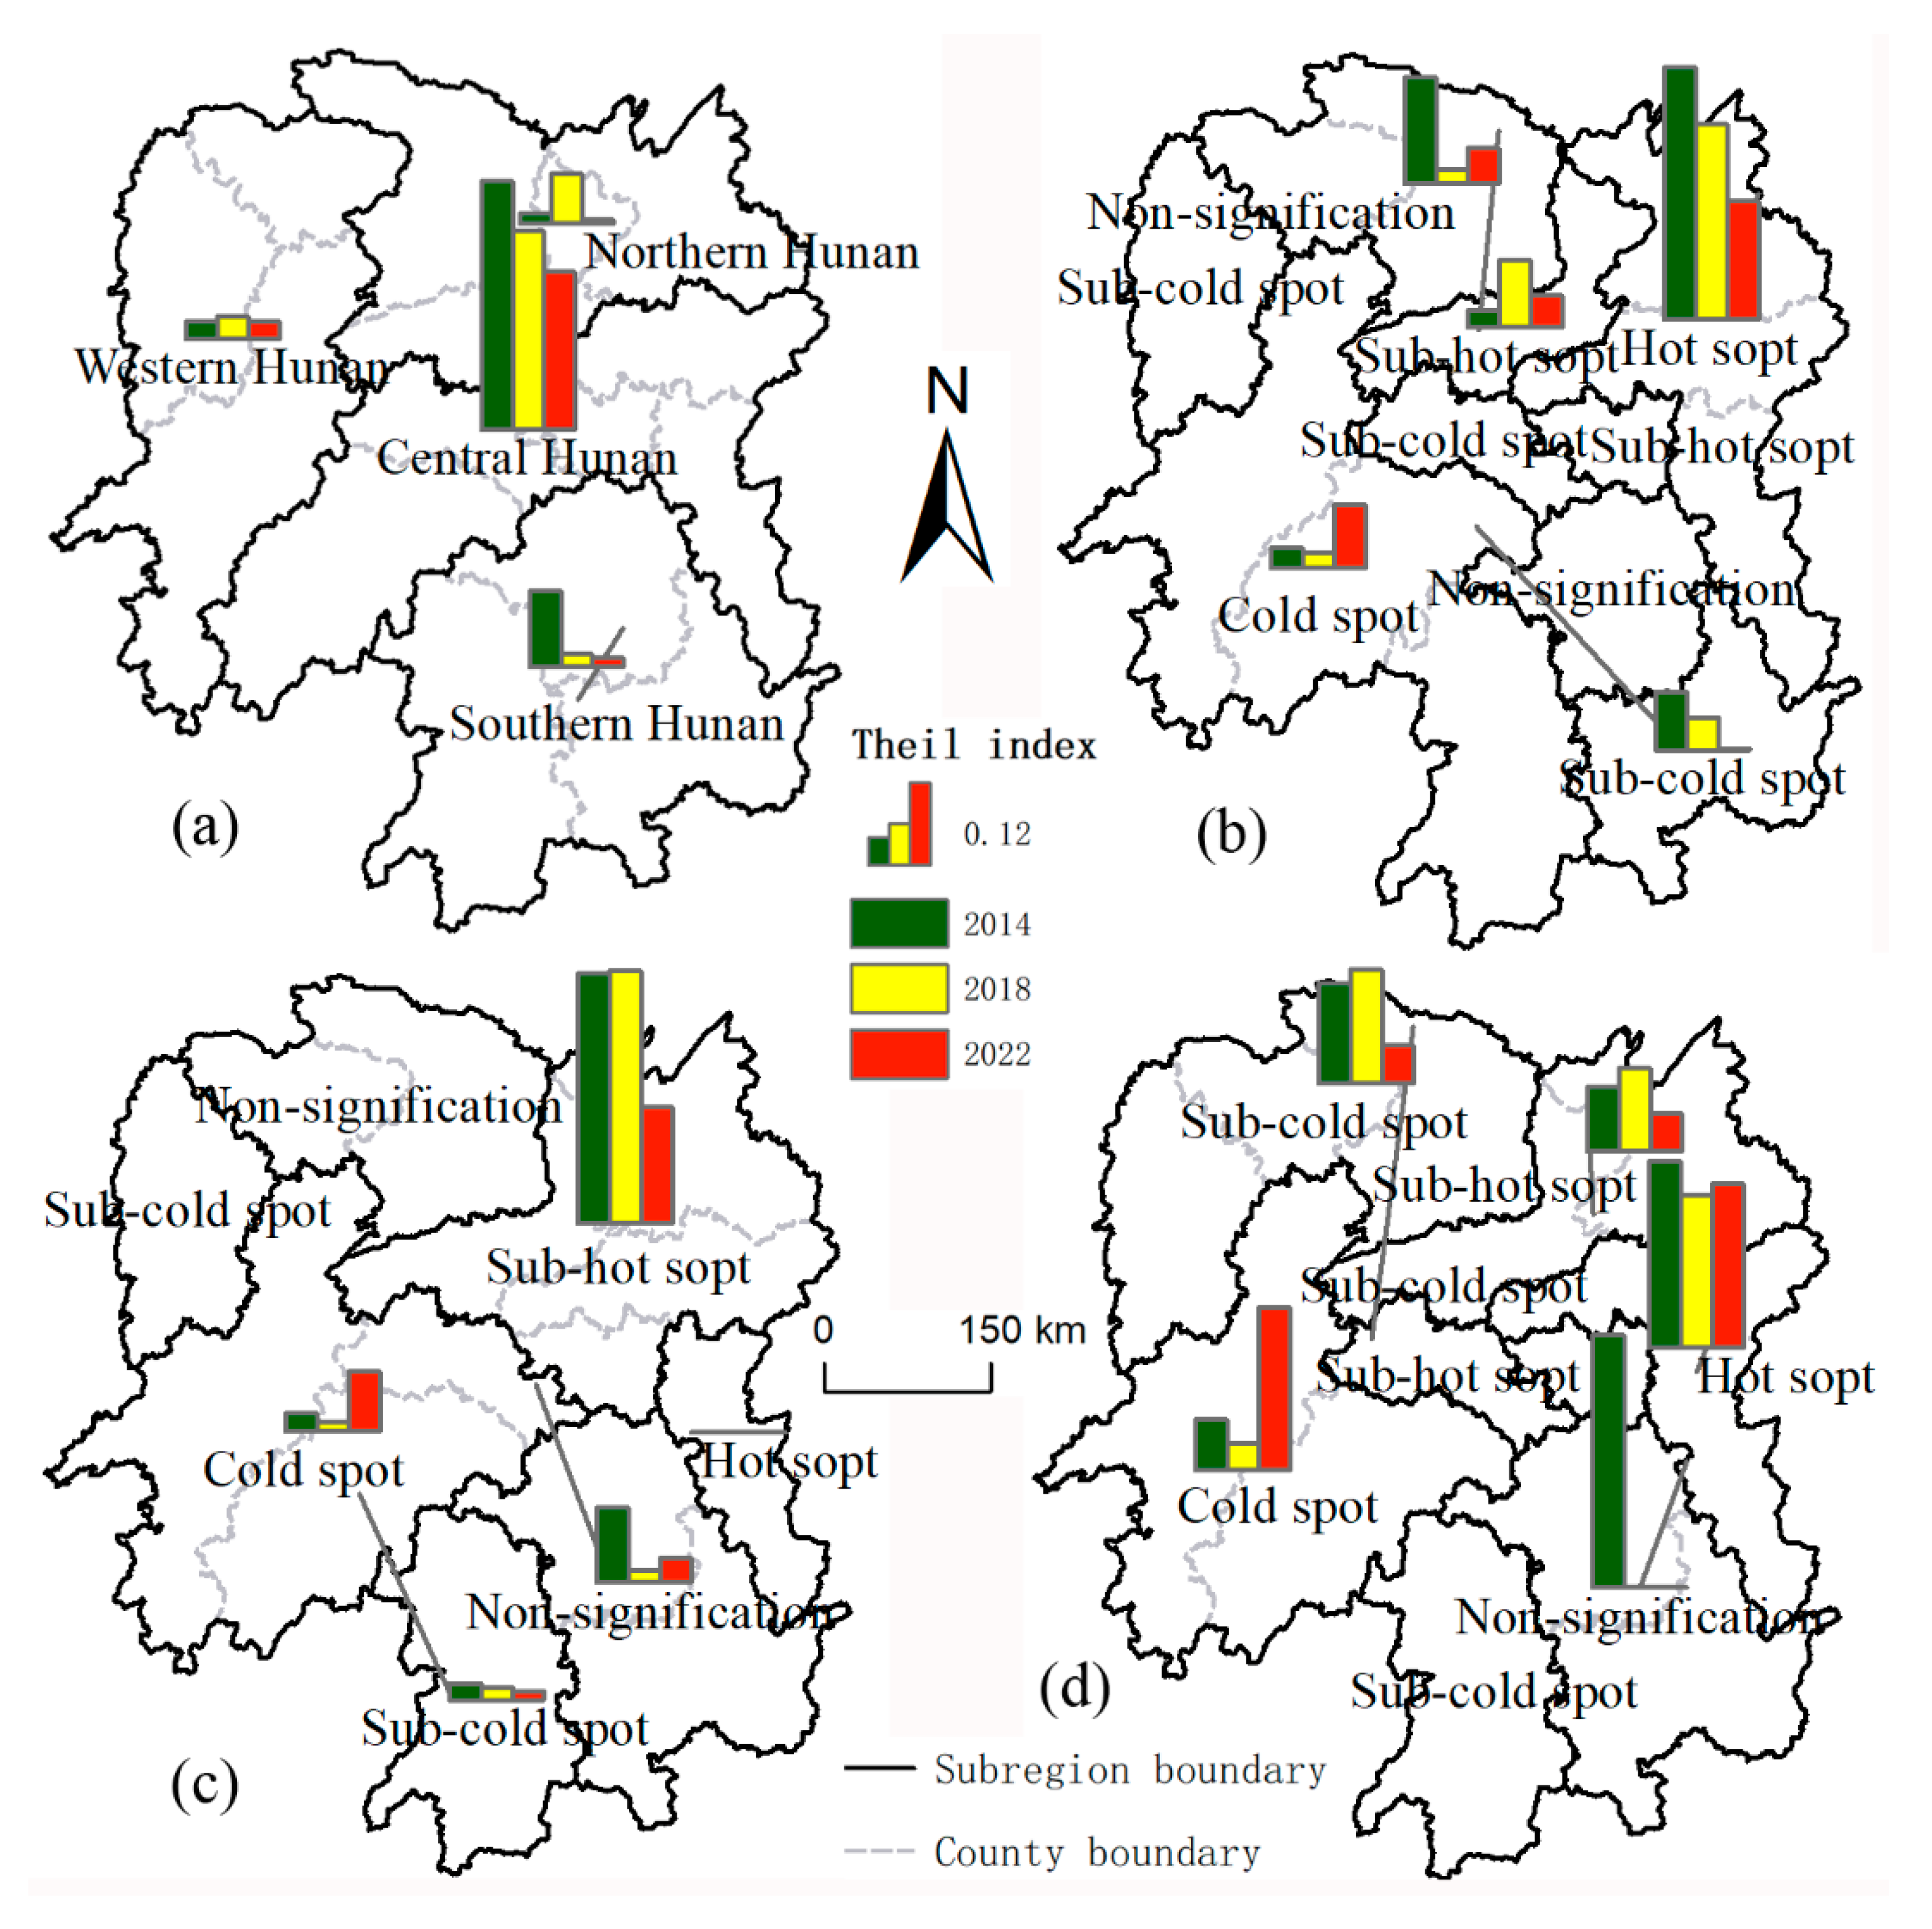
Figure 8.
Factor detection of UR in Hunan Province.
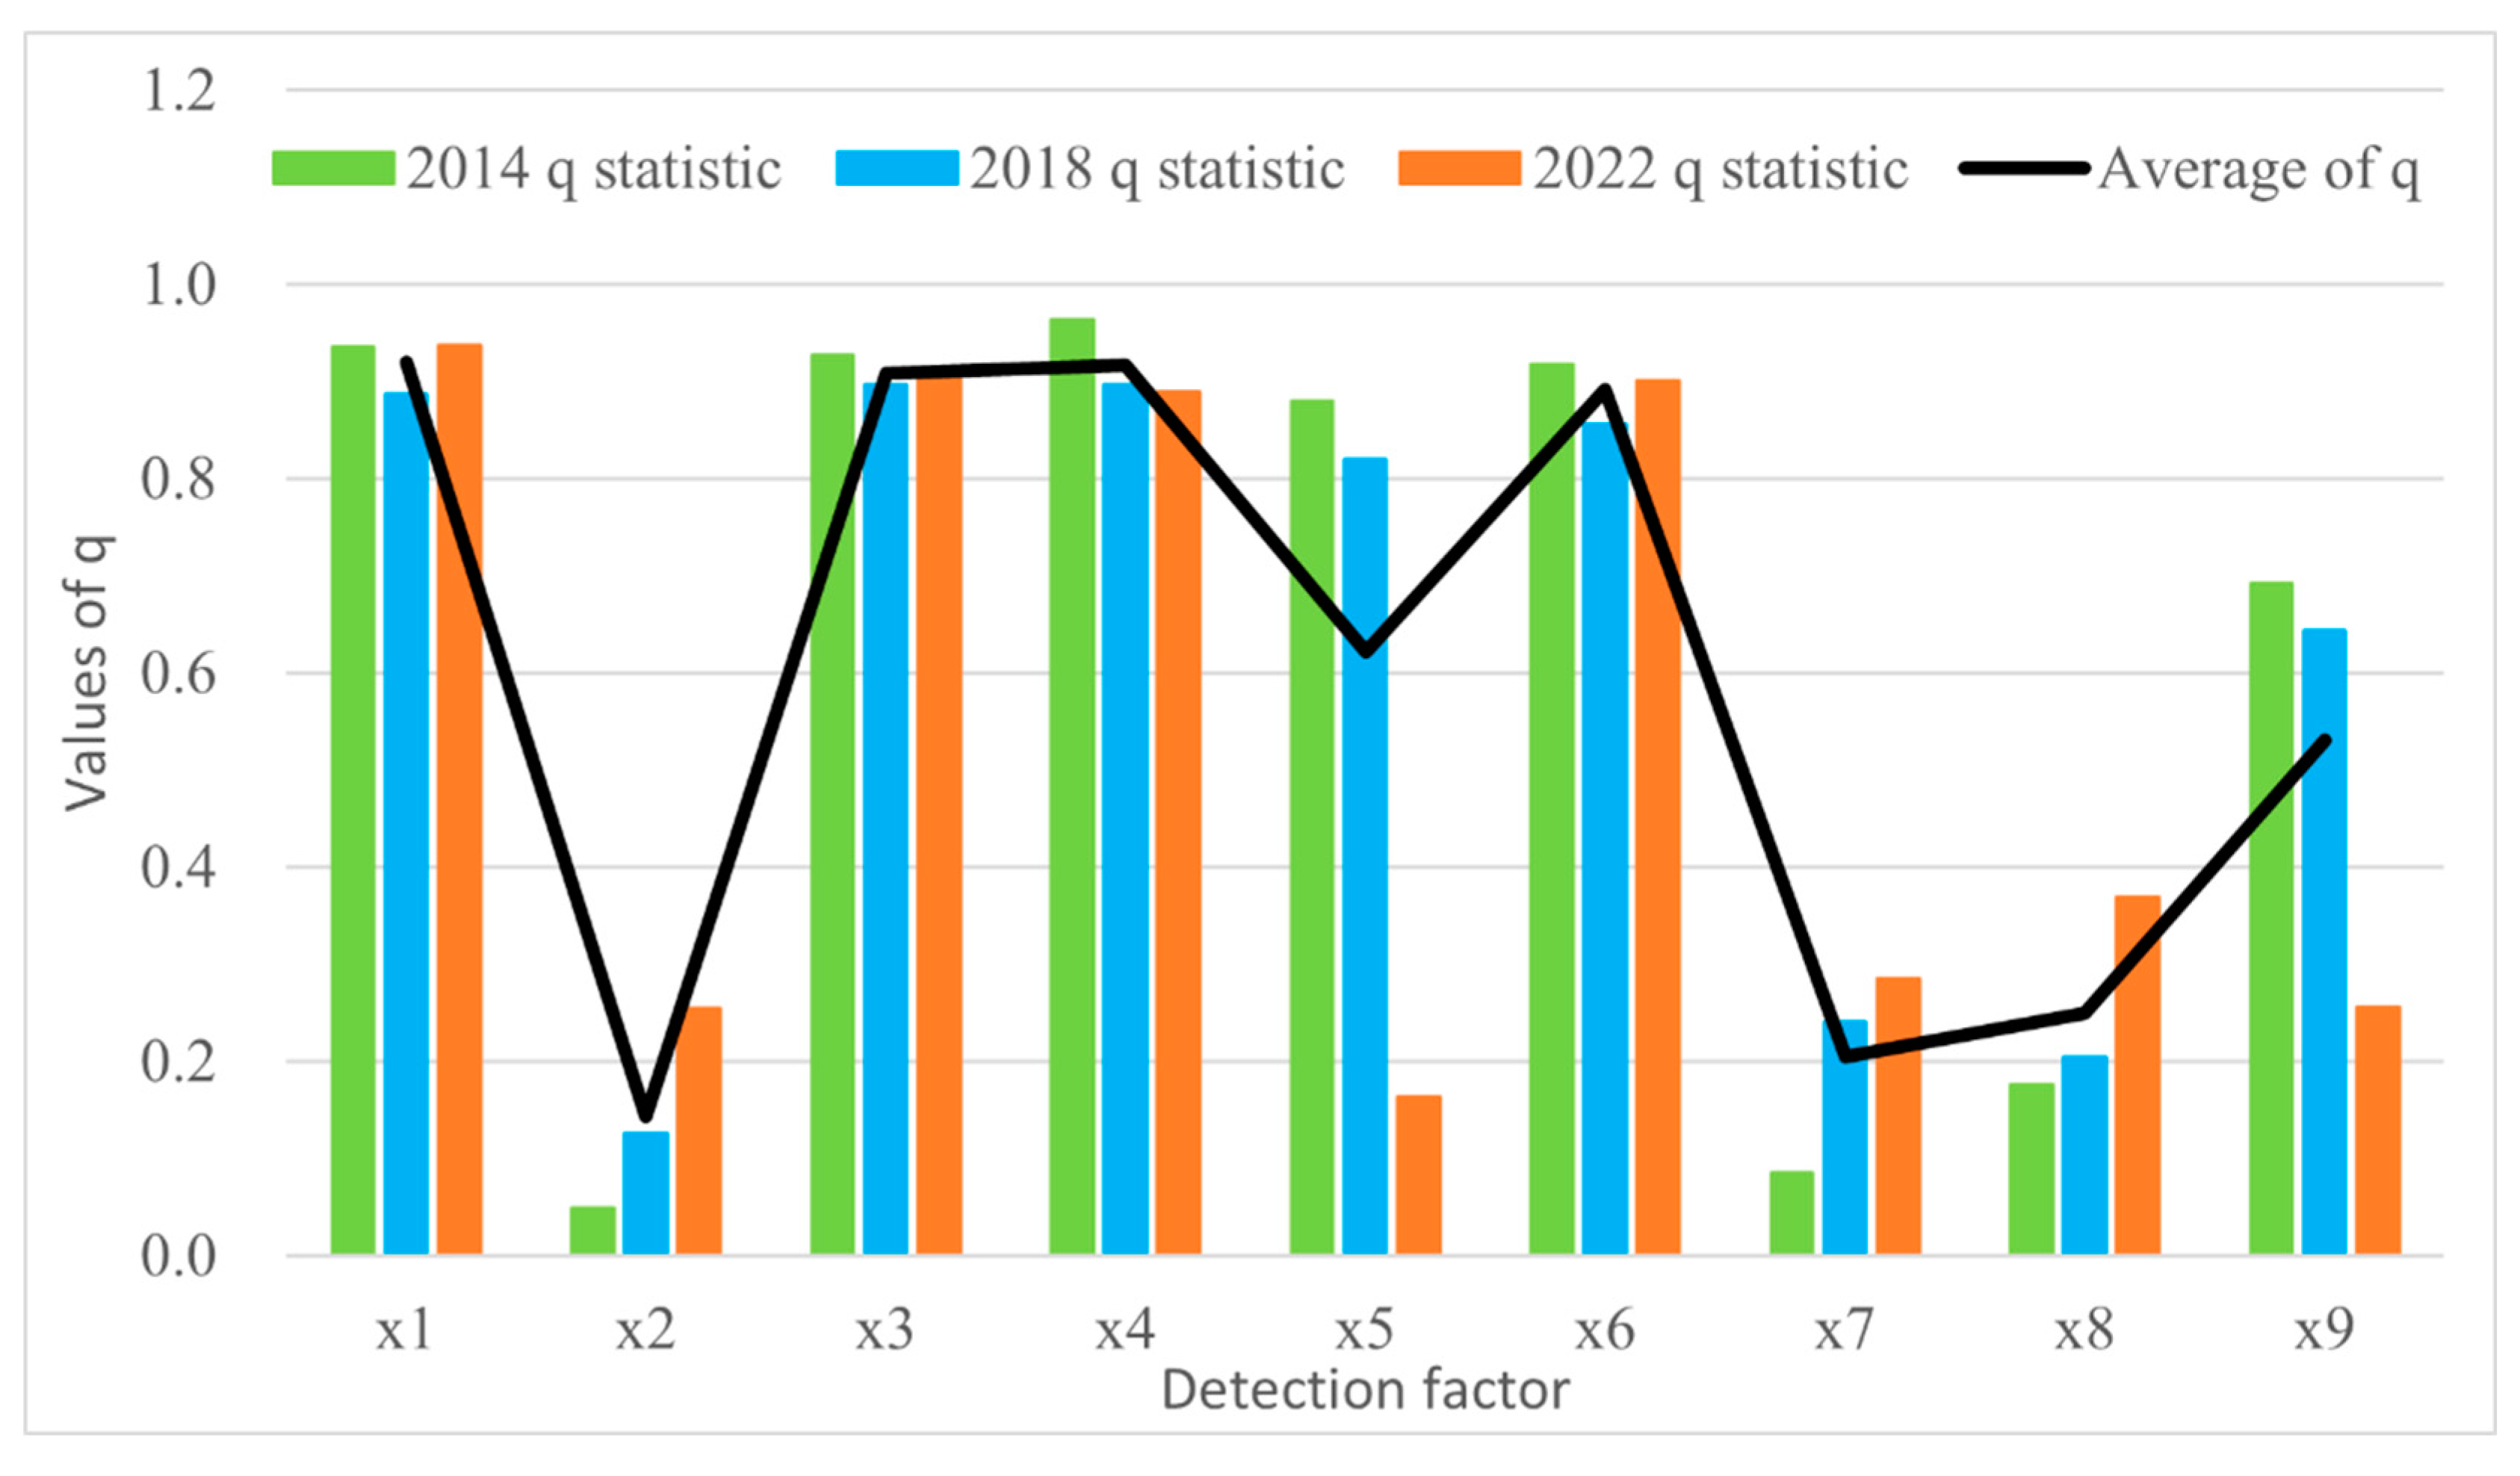

Table 1.
Evaluation index systems used to determine UR.
| Criterion layer | Index layer | variable | Positive/ negative |
Index weight | ||
| 2014 | 2018 | 2022 | ||||
| Economic resilience | Per capita GDP (CNY) | x1 | Positive | 0.1427 | 0.1535 | 0.1406 |
| Proportion of tertiary industry (%) | x2 | Positive | 0.1308 | 0.1411 | 0.0825 | |
| Per capita social consumption (CNY) | x3 | Positive | 0.1886 | 0.2015 | 0.1795 | |
| Social resilience | Average wage of on-the-job employees (CNY) | x4 | Positive | 0.187 | 0.1177 | 0.2127 |
| Number of hospital beds per 10,000 people | x5 | Positive | 0.0864 | 0.1067 | 0.1279 | |
| Doctor density | x6 | Positive | 0.1058 | 0.0847 | 0.1036 | |
| Ecological resilience | Per capita green land in park areas (m2) | x7 | Positive | 0.0878 | 0.0835 | 0.0627 |
| Greening coverage rate of built-up area (%) | x8 | Positive | 0.0275 | 0.0781 | 0.0524 | |
| Sewage treatment rate (%) | x9 | Positive | 0.0434 | 0.0331 | 0.0383 | |
Table 2.
The ellipse parameters of the standard deviation of UR in Hunan Province.
| Year | Ellipse area /km2 | Coordinates of barycenter (E, N) | Semi-minor axis /km | Semi-major axis /km | Oblateness | Azimuth /° | Moving distance /km |
| 2014 | 68,098.97 | 112°12'36", 27°59'25" | 134.02 | 161.75 | 0.171 | 126.82 | — |
| 2018 | 70,299.88 | 112°8'46", 27°57'54" | 135.56 | 165.08 | 0.179 | 129.90 | 6.82 |
| 2022 | 69,548.45 | 112°11'29", 27°55'59" | 142.79 | 155.05 | 0.079 | 119.91 | 5.50 |
Table 3.
The Theil index of UR in Hunan Province based on different zoning methods.
| Zoning method | Zone | Theil index | Zoning method | Zone | Theil index | ||||
| 2014 | 2018 | 2022 | 2014 | 2018 | 2022 | ||||
| Unzoned | Hunan | 0.1703 | 0.117 | 0.0933 | Zoning based on hotspot map in 2018 | Hot spots | 0 | 0 | 0 |
| Traditional Zoning | Northern Hunan | 0.0097 | 0.0473 | 0.003 | Sub-hot spots | 0.177 | 0.1788 | 0.0819 | |
| Central Hunan | 0.2381 | 0.191 | 0.1515 | Non-significant | 0.0529 | 0.0087 | 0.0175 | ||
| Southern Hunan | 0.0731 | 0.0116 | 0.0082 | Sub-cold spots | 0.0117 | 0.0089 | 0.0065 | ||
| Western Hunan | 0.0164 | 0.0218 | 0.0168 | Cold spots | 0.0127 | 0.0063 | 0.0423 | ||
| Zoning based on hotspot map in 2014 | Hot spots | 0.16 | 0.1235 | 0.075 | Zoning based on hotspot map in 2022 | Hot spots | 0.0692 | 0.0565 | 0.0608 |
| Sub-hot spots | 0.0108 | 0.0428 | 0.0201 | Sub-hot spots | 0.0238 | 0.0311 | 0.0139 | ||
| Non-significant | 0.0671 | 0.0085 | 0.0226 | Non-significant | 0.0937 | 2.28E-6 | 0.0001 | ||
| Sub-cold spots | 0.0372 | 0.021 | 0.0013 | Sub-cold spots | 0.037 | 0.042 | 0.014 | ||
| Cold spots | 0.0124 | 0.0097 | 0.0398 | Cold spots | 0.0185 | 0.0095 | 0.0604 | ||
Table 4.
The influence of interactions between two factors on the spatial heterogeneity of UR in Hunan Province.
Table 4.
The influence of interactions between two factors on the spatial heterogeneity of UR in Hunan Province.
| (a) Influence degree of interactive detection and interactive increment in 2014 | |||||||||
| x1 | x2 | x3 | x4 | x5 | x6 | x7 | x8 | x9 | |
| x1 | 0.9355 | 0.0415 | 0.0077 | 0.0544 | 0.0381 | 0.0228 | 0.0456 | 0.0610 | 0.0542 |
| x2 | 0.9770 | 0.0485 | 0.9084 | 0.9316 | 0.9033 | 0.9008 | 0.2202 | 0.3700 | 0.9040 |
| x3 | 0.9432 | 0.9569 | 0.9268 | 0.0630 | 0.0466 | 0.0314 | 0.0342 | 0.0527 | 0.0497 |
| x4 | 0.9898 | 0.9801 | 0.9898 | 0.9642 | 0.0233 | 0.0048 | 0.0289 | 0.0317 | 0.0231 |
| x5 | 0.9735 | 0.9518 | 0.9734 | 0.9875 | 0.8803 | 0.0636 | 0.0706 | 0.0984 | 0.0886 |
| x6 | 0.9582 | 0.9493 | 0.9582 | 0.9690 | 0.9440 | 0.9176 | 0.0379 | 0.0778 | 0.0456 |
| x7 | 0.9810 | 0.2688 | 0.9610 | 0.9931 | 0.9509 | 0.9555 | 0.0859 | 0.1584 | 0.8745 |
| x8 | 0.9964 | 0.4185 | 0.9795 | 0.9959 | 0.9788 | 0.9954 | 0.2443 | 0.1757 | 0.5895 |
| x9 | 0.9897 | 0.9525 | 0.9765 | 0.9873 | 0.9690 | 0.9632 | 0.9605 | 0.7652 | 0.6923 |
| (b) Influence degree of interactive detection and interactive increment in 2018 | |||||||||
| x1 | x2 | x3 | x4 | x5 | x6 | x7 | x8 | x9 | |
| x1 | 0.8873 | 0.0570 | 0.0285 | 0.0285 | 0.0674 | 0.0485 | 0.0688 | 0.0409 | 0.0375 |
| x2 | 0.9443 | 0.1263 | 0.8646 | 0.8646 | 0.7663 | 0.7596 | 0.4759 | 0.4213 | 0.7938 |
| x3 | 0.9158 | 0.9909 | 0.8966 | 0.0074 | 0.0414 | 0.0732 | 0.0682 | 0.0708 | 0.0543 |
| x4 | 0.9158 | 0.9909 | 0.9040 | 0.8966 | 0.0414 | 0.0732 | 0.0682 | 0.0708 | 0.0543 |
| x5 | 0.9547 | 0.8925 | 0.9381 | 0.9381 | 0.8199 | 0.0709 | 0.1457 | 0.1171 | 0.1122 |
| x6 | 0.9358 | 0.8859 | 0.9698 | 0.9698 | 0.8908 | 0.8566 | 0.1005 | 0.0934 | 0.0586 |
| x7 | 0.9561 | 0.6022 | 0.9649 | 0.9649 | 0.9655 | 0.9571 | 0.2408 | 0.7025 | 0.7265 |
| x8 | 0.9282 | 0.5475 | 0.9675 | 0.9675 | 0.9369 | 0.9499 | 0.9433 | 0.2043 | 0.7198 |
| x9 | 0.9248 | 0.9201 | 0.9509 | 0.9509 | 0.9320 | 0.9152 | 0.9674 | 0.9241 | 0.6436 |
| (c) Influence degree of interactive detection and interactive increment in 2022 | |||||||||
| x1 | x2 | x3 | x4 | x5 | x6 | x7 | x8 | x9 | |
| x1 | 0.9373 | 0.0600 | 0.0121 | 0.0198 | 0.0604 | 0.0510 | 0.0381 | 0.0453 | 0.0209 |
| x2 | 0.9973 | 0.2542 | 0.7323 | 0.7329 | 0.7018 | 0.6962 | 0.6684 | 0.7111 | 0.7099 |
| x3 | 0.9494 | 0.9865 | 0.9033 | 0.0387 | 0.0832 | 0.0905 | 0.0840 | 0.0826 | 0.0543 |
| x4 | 0.9571 | 0.9871 | 0.9420 | 0.8894 | 0.0543 | 0.0956 | 0.0692 | 0.0419 | 0.0515 |
| x5 | 0.9977 | 0.9560 | 0.9865 | 0.9437 | 0.1637 | 0.8288 | 0.2896 | 0.6742 | 0.1971 |
| x6 | 0.9883 | 0.9504 | 0.9938 | 0.9851 | 0.9926 | 0.9013 | 0.0138 | 0.0542 | 0.0901 |
| x7 | 0.9754 | 0.9226 | 0.9872 | 0.9586 | 0.4533 | 0.9152 | 0.2861 | 0.6317 | 0.1810 |
| x8 | 0.9827 | 0.9653 | 0.9858 | 0.9313 | 0.8380 | 0.9555 | 0.9177 | 0.3699 | 0.5819 |
| x9 | 0.9582 | 0.9641 | 0.9576 | 0.9409 | 0.3608 | 0.9914 | 0.4671 | 0.9518 | 0.2564 |
 The influence degrees of interactive detection range from 0.1 to 1. Green cell indicates a low detection value, with darker shades of green representing smaller values. Conversely, a red cell represents a high detection value, with darker shades of red indicating greater values. The influence degrees of interactive detection range from 0.1 to 1. Green cell indicates a low detection value, with darker shades of green representing smaller values. Conversely, a red cell represents a high detection value, with darker shades of red indicating greater values. | |||||||||
Disclaimer/Publisher’s Note: The statements, opinions and data contained in all publications are solely those of the individual author(s) and contributor(s) and not of MDPI and/or the editor(s). MDPI and/or the editor(s) disclaim responsibility for any injury to people or property resulting from any ideas, methods, instructions or products referred to in the content. |
© 2024 by the authors. Licensee MDPI, Basel, Switzerland. This article is an open access article distributed under the terms and conditions of the Creative Commons Attribution (CC BY) license (http://creativecommons.org/licenses/by/4.0/).
Copyright: This open access article is published under a Creative Commons CC BY 4.0 license, which permit the free download, distribution, and reuse, provided that the author and preprint are cited in any reuse.


