
Submitted:
08 February 2024
Posted:
12 February 2024
You are already at the latest version
Abstract
Intense climate change and rapid urbanization have increased the risk of urban flooding, seriously affecting urban economic and social stability. Enhancing the urban flood resilience (UFR) has required a new solution to cope with urban flood disasters. In this study, taking Yingtan city as an example, a system of indicators for evaluating UFR was constructed, with 17 representative indicators, comprising three subsystems: socio-economic, ecological and infrastructural. A hybrid (FAHP-EWM)-TOPSIS model was applied, to develop an index-based measurement to compare and evaluate UFR, and Gray Relational Analysis (GRA) was used to discover the main factors affecting UFR. In addition, the natural discontinuous method was innovatively used to divide the UFR grade interval into levels, and the grade change was evaluated based on the TOPSIS method. The results showed that (1) from 2010 to 2022, the UFR in Yingtan City increased by 80.69%, and the factors affecting UFR are highly correlated with urban infrastructure development. However, the ecological resilience in the subsystem showed a fluctuating downward trend, because of the influence of the surface area of lakes and rivers. (2) The grades of UFR for Yingtan City increased from Level III (2010 and 2016) to Level IV (2022), with local financial expenditures and the age structure of the population being the main factors currently limiting the development of UFR. The study provides a theoretical basis for the construction of an indicator system for assessing the UFR of Yingtan and proposes practical improvement directions for UFR.
Keywords:
Urban flood resilience
; Evaluation analysis
; FAHP-EWM
; TOPSIS
; Limiting factor
; Yingtan city
1. Introduction
In the past few decades, the urbanization process in various countries around the world has maintained a rapid growth trend, and the proportion of impermeable surfaces is gradually increasing, inevitably leading to an increased risk of flooding in urban centers due to extreme rainfall[1]. At the same time, the occurrence of urban meteorological disasters has intensified due to climate change, which is mainly characterized by global warming[2]. More than 100 major flood disasters occur globally every year, causing huge losses to human life and property in flood-affected cities, and seriously affecting urban economic and social stability[3]. It is estimated that the direct economic losses caused by floods in China from 1990 to 2018 came to over 4 trillion yuan[4]. China is the one of the countries in the world with a high incidence of floods and waterlogging, and devastating flood disasters have occurred in recent years, such as the flooding in Beijing city in 2012[5] and in Zhengzhou city in 2021[6].
Much research has been conducted in the last few years, on flood hazards and disaster reduction methods, using approaches such as flood strategies[7] and flood risk simulation[8]. Considering the changing precipitation patterns and the damage caused by heavy rainfall in recent years, traditional safety concepts and disaster prevention measures are no longer sufficient to meet the needs of current and future urban development. The assessment and improvement of urban resilience are attracting a great deal of attention from researchers[9], and the concept of resilience has been widely used in many fields and disciplines. In 1973, a Canadian scholar first introduced the concept of resilience into the field of ecology[10]. Resilient cities refer to cities that have a strong ability to resist and absorb external interference, to quickly adapt to environmental changes, and to maintain functional and system structure stability and rapid recovery in the face of disasters. There are new opportunities for urban flood prevention and disaster reduction by building resilient cities. The concept of urban flood resilience (UFR) has been proposed: responding to flood disasters with urban resilience construction, which enables a city to quickly restore its original socio-economic characteristics after a flood, thereby avoiding casualties and reducing economic losses[11].
Based on the concept of the resilient city, many assessment methods have been proposed to evaluate and analyze UFR; these include index systems, system function curves and quantitative modeling. Index-based resilience assessment is the most commonly used method[12]. In addition, UFR has been studied by many scholars, using more sophisticated models such as the PSR framework, the socio-economic-natural complex ecosystem[13] and the system dynamics model[14]. Many models have also been built based on local demand for evaluating urban flood resistance capacity[15,16].
It is believed that UFR is closely related to a city’s economic development level. As the driving force for urban development, economic level directly affects urban infrastructure investment, flood control, disaster relief investment, per capita income and industrial structure[17]. At the social level, as citizens are the main implementers of the concept of urban resilience, it is particularly important to actively mobilize citizen participation, integrate resources, break down psychological barriers, and form a collaborative management mechanism for a whole society. The age distribution, learning ability, and employment status of residents provide support for urban economic development, which has an important impact on disaster resistance and is directly related to a city's resilience to floods. The infrastructure level is the key to ensuring the normal operation of a city during disasters: urban drainage networks, road conditions, and green coverage are considered important factors affecting urban resilience[13]. However, there is currently no standard method suitable for assessing the UFR of any city, since it is affected by many factors.
To understand the level of urban flood resistance, it is usually necessary to select multiple relevant indicators from different perspectives, to construct an evaluation framework. In the absence of standards for these indicators, multi-criteria decision-making methods can serve as a comprehensive evaluation or goal-ranking technique[18], utilizing the ambiguity of expert language terminology to handle subjective ambiguity and constructing a comprehensive flood resistance capacity evaluation system for an entire disaster cycle. In 2023, Zhang and other scholars improved the UFR cloud evaluation model established by combining the Analytic Hierarchy Process (AHP) and the Entropy Weight Method (EWM) to systematically evaluate the UFR in Zhengzhou City[19]. In 2023, Cao and other scholars proposed an index system for urban flood resistance capacity, from four aspects: natural, economic, social, and infrastructure. The entropy method and spatiotemporal permutation scanning method were used to analyze the resilience level of urban flood resistance in Zhejiang Province[20].
In this study, a UFR evaluation index framework was constructed in three dimensions: socio-economic resilience, ecological resilience, and infrastructure resilience. Based on a mixed multi-criteria decision-making method, the entropy weight method (EWM) and the Technique for Order Preference by Similarity to Ideal Solution (TOPSIS) were used as measurement methods to evaluate UFR. EWM can improve the objectivity of indicator weights, and TOPSIS ranks solutions by maximizing the distance to negative ideal solutions (weakest elasticity) and minimizing the distance to positive ideal solutions (most elastic)[21,22]. In addition, in order to provide targeted recommendations for improving UFR, Gray Relational Analysis (GRA) was used to identify the main factors affecting UFR[21].
The rest of this report is organized as follows. Section 2 introduces the study area and data. Section 3 describes the basic approach and the analysis steps of UFR evaluation. Then, in Section 4, we analyze the evolution characteristics of UFR in Yingtan from 2010 to 2022 and the UFR grades in three different years, utilizing the TOPSIS method.
2. Study Area and Data Sources
2.1. Study Area
Yingtan City, situated in the northeastern part of Jiangxi Province (Figure 1), stands at the crossroads where the Wuyi Mountains transition into the Poyang Lake Plain. Spanning coordinates from 27°35′–28°41′ N to 116°41’–117°30′ E, the city covers an area of 3556.7 square kilometers, encompassing Yuehu District, Guixi City, and Yujiang County. As of 2022, the city boasted a population of 1.155 million people and a GDP of 123.76 billion yuan. The region enjoys a humid subtropical monsoon climate, characterized by ample rainfall, abundant sunshine, well-defined seasons, a frost-free period extending up to 262 days, an average temperature of 18.2 °C, and an annual average rainfall of 1880.3 millimeters.
Since the advent of China's reform and opening up, rapid urbanization has given rise to a spectrum of challenges. Urban systems have become increasingly susceptible to both natural disasters and societal crises, each capable of posing a potentially destructive threat to the city. In response, China introduced the concept of sponge cities, to fortify urban resilience against flood disasters. Yingtan City secured its position as one of the pioneering demonstration cities for sponge city construction in 2021. This endeavor encompasses a broad spectrum, spanning from high-level planning and project design to on-site construction, with a primary focus on infrastructure and low-impact development to address these challenges. However, the socio-economic framework and ecological equilibrium of the city also serve as pivotal factors in mitigating floods. Hence, it remains crucial to delve into Yingtan City's flood resilience from a holistic perspective.
2.2. Data Sources
This study collected urban construction, socioeconomic and other related data of Yingtan City from 2010 to 2022. The data used are from the China Urban Statistical Yearbook, the China Urban Construction Statistical Yearbook, local statistical yearbooks and local government official websites. The missing data are interpolated and supplemented based on adjacent years.
3. Methodology
3.1. Overall Framework
As shown in Figure 2, this report establishes an overall assessment system for UFR based on the UFR evaluation framework. The content is divided into three parts: (1) the construction of the UFR evaluation framework consisting of three primary indicators—social resilience, ecological resilience, and infrastructure resilience—and 17 secondary indicators; (2) the use of Gray Correlation Analysis to validate the rationality of the UFR evaluation framework's indicator weights, along with an analysis of the contributions of indicators to regional UFR; (3) an analysis of the temporal evolution characteristics of UFR in Yingtan City and an assessment of the changes in UFR levels there, based on the Technique for Order Preference by Similarity to Ideal Solution method.
Firstly, a UFR assessment indicator system was established, comprising three subsystems: socio-economic resilience, ecological resilience, and infrastructure resilience. Subsequently, a combined subjective-objective approach (FAHP-EWM) was employed to assign weights to 17 secondary indicators. On this basis, the evolution characteristics of flood resilience levels in Yingtan City from 2010 to 2022 were explored using the TOPSIS and GRA methods. In addition, to better guide the future development of flood resilience in Yingtan City, we applied the Natural Breaks Method(NBM) to divide the resilience levels into three annual intervals. Subsequently, the TOPSIS method was used to assess the flood resilience level for the target years, in Yingtan City.
3.2. Index System for UFR
3.2.1. Primary Indicators
Currently, the concept of urban safety resilience is underdeveloped, and its connotations and domain extensions remain ambiguous[23]. Scholars' assessments of urban rain-flood resilience involve various aspects such as ecology, society, economy, environment, and climate. However, there is still no standardized evaluation system[20,24]. Drawing on previous research, it has been found that when cities are unable to maintain their current state in the face of challenges, the social and economic structures have the flexibility to create entirely new systems[25]. At the same time, social and economic conditions are directly related to the resilience and recovery capabilities of cities in coping with flood disasters[26]. The selection of social-economic resilience serves as a crucial dimension within the UFR assessment framework. Some studies have indicated that the dimensions of urban ecological resilience and infrastructure resilience are of significant importance in assessing the recovery capability from flood events[27]. Urban areas with ecological vulnerabilities are highly susceptible to flooding and waterlogging[28,29,30], highlighting the crucial impact of ecology on the recovery capacity from urban waterlogging. Urban ecological resilience, with its connotations of ecological resources and environmental restoration, is a suitable dimension for assessment. Furthermore, when floods occur, urban infrastructure plays a direct role in the discharge of rainwater. Some scholars have utilized hydraulic models for scenario simulations, relying on urban infrastructure parameters to assess urban waterlogging risk[31,32]. We have chosen infrastructure resilience as one of the assessment dimensions, as it is closely associated with urban waterlogging recovery capabilities. This study considers social resilience, ecological resilience, and infrastructure resilience as primary indicators, allowing for a more comprehensive analysis of the contribution of each dimension to UFR and the constraints of each subsystem's indicators.
3.2.2. Secondary Indicators
In order to accurately assess the UFR level of Yingtan City, this study referred to the "Guidelines for the Evaluation of Safety Resilient Cities" (GB_T 40947-2021) and other relevant literature. Based on the actual conditions of the study area, indicators highly correlated with Yingtan City's UFR were selected. Subsequently, domain experts, considering the three major attributes of urban rain-flood resilience and following the principles of scientific validity, relevance, representativeness, and feasibility, conducted a detailed assessment and screening of the indicators. Finally, 17 secondary evaluation indicators representing urban socio-economic resilience, ecological resilience, and infrastructure resilience were selected, establishing the UFR assessment indicator system for Yingtan City. The reasons for selecting each secondary indicator are as follows:
As shown in Table 1, after expert evaluation and screening, six indicators—per capita GDP (A1), local fiscal expenditure (A2), number of healthcare workers per 10,000 population (A3), percentage of population aged over 60 and under 18 (A4), unemployment rate (A5), and density of population (A6)—were selected to characterize the socio-economic resilience of the city. Regional post-disaster recovery or reconstruction relies on local financial inputs, and regions with strong economic dynamics are better equipped to deal with challenges. For instance, the GDP volume in Zhengzhou City during the pre, mid, and post stages of the 2021 flood disaster exhibited a systematic change[33], indicating that per capita GDP and local fiscal expenditure can largely reflect local flood recovery capabilities. Density of population was considered due to its positive correlation with flood risk; higher population density tends to lower resilience levels[34]. In regions with a higher proportion of socially vulnerable groups, the proportion of flooded areas in the floodplain tends to increase[35]. Conversely, an increase in the number of individuals covered by health insurance can mitigate this risk. Previous research has utilized the population age structure index and the number of healthcare workers to assess socio-economic resilience[36]. The ecological resilience (Table 1) was assessed by combining five indicators: per capita public green area (B1), green coverage rate of the built-up area (B2), the centralized treatment rate of the sewage treatment plant (B3), the surface area of lakes and rivers (B4), and land development intensity (B5). In urban development, different types of landscape exhibit significant differences in runoff generated during rainfall events[37]. In highly developed regions, extensive areas of impermeable surfaces increase the risk of urban flooding. In contrast, green spaces, as the primary permeable ground in cities, effectively reduce the runoff coefficient during rainfall events, thereby decreasing the probability of flooding occurrence[38]. Therefore, the three secondary indicators of per capita public green area, the green coverage rate of the built-up area, and the land development intensity play a significant role in UFR. Urban water bodies possess natural storage capacity and are indispensable indicators in waterlogging studies. Regions with a higher water area tend to have a lower flood risk index[39]. Additionally, the urban centralized treatment rate of the sewage treatment plant reflects the construction of sewage treatment facilities and the level of urban sewage management. Given its attributes related to both infrastructure and ecology, and to balance the number of elements in each primary indicator, sewage collection rate was included in the ecological resilience dimension. The assessment of urban infrastructure resilience (Table 1) was conducted by combining six indicators: number of hospital beds per ten thousand population (C1), per capita refuge area (C2), density of road network in built district (C3), communication coverage (C4), density of sewers in built district (C5), and central city pumping capacity (C6). Density of sewers and pumping capacity are crucial indicators representing the capability to discharge rainwater effectively [40,41]. In urban areas, rainfall-induced flooding directly impacts the traffic condition of roads. Road density is highly correlated with flood risk [42]. However, roads can also serve as drainage channels after extreme rainfall, accelerating the discharge of accumulated water. Simultaneously, the recovery of transportation functions in high-density road areas significantly expedites the reconstruction process. Communication coverage, per capita refuge area, and the number of hospital beds per ten thousand population were selected from an emergency perspective. Per capita refuge area includes urban parks, green spaces, and elevated open squares that can be used as areas to mitigate flood disasters [43].
Based on the positive and negative impacts of the 17 indicators on UFR, positive and negative indices were assigned. Positive indices represent a positive correlation with the level of UFR, while negative indices indicate a negative correlation. This assessment resulted in a total of 13 positive indicators and 4 negative indicators.
3.3. Subjective and Objective Weight Calculation Method
The FAHP-EWM method has been validated to improve the accuracy of results, in previous studies[44]. Online survey questionnaires were administered to five experts in construction, meteorology, emergency management, and related fields, obtaining initial score judgment matrices for the primary and secondary indicators in the UFR assessment framework. Subsequently, FAHP was used to calculate the relatively subjective weight values, and EWM was employed to determine the final objective weights of the indicators. See supplemental materials for details.
3.4. TOPSIS Comprehensive Evaluation Method
The fundamental idea of TOPSIS is based on a set of evaluation criteria, an established ideal solution, and a negative ideal solution[45]. The method calculates the distances between each alternative solution and the ideal and the most negative solutions. This computation results in a comprehensive score for each alternative solution. Considering the advantages of TOPSIS in the field of Multiple Attribute Decision Making (MADM), this study adopts TOPSIS as the evaluation method for assessing the UFR of Yingtan City from 2010 to 2022. The specific steps are as follows:
(1) Define the multi-objective decision-making problem.
(2) Standardization of attribute properties.
where represents positive indicators, and represents negative indicators.
(3) Vector normalization of indicator data after processing.
(4) Calculate the Weighted Normalized Decision Matrix.
(5). Determine the Positive Ideal Solution and Most Negative Solution .
where represents positive indicators, and represents negative indicators.
(6) Calculate the Euclidean Distance to the Positive Ideal Solution and Most Negative Solution .
(7) Calculate the proximity of the evaluation object to the most extreme solutions, i.e., the relative closeness between the evaluation object and the most positive and negative solutions. The calculation formula is:
The urban resilience assessment results are expressed using the fitness degree, with a range of values from 0 to 1. When the value is closer to 1, the degree indicates closer proximity to the positive ideal point, implying a higher level of urban resilience. Conversely, when the value is closer to 0, it indicates closer proximity to the most negative solution, suggesting a lower level of urban resilience.
3.5. Gray Relational Analysis
Gray Relational Analysis (GRA) is a multi-criteria decision-making method based on gray system theory. It is commonly used to analyze the correlation or measure the contribution of evaluation factors to evaluation results in uncertain and fuzzy multi-criteria data[46]. In this study, Gray Relational Analysis is employed to diagnose the important factors influencing UFR based on the geometric correspondence data among various indicators. A gray relational degree of an indicator in UFR greater than 0.5 indicates a close correlation. Additionally, indicators with a gray relational degree greater than 0.7 are considered significant factors influencing UFR[47].
3.6. Resilience Level Assessment
3.6.1. UFR Level Classification
The Natural Breaks Method is a univariate method based on cluster analysis. In cases where the number of classes is predetermined, it iteratively calculates data breakpoints between categories to minimize differences within the same category and maximize differences between different categories. This method has been effective in vulnerability zoning along coastlines and resilience level assessments[48,49]. In this study, statistical yearbook data were collected for Chinese prefecture-level cities and some county-level cities, from 2010 to 2022. Given that indicators may fluctuate over different years, yearly data for each indicator in the assessment framework were selected and outliers were removed. Subsequently, NBM was applied to classify indicators such as population density and per capita GDP for all cities(as recorded in the statistical yearbook) in China. For indicators not recorded in the statistical yearbook, classification was based on national standards and technical specifications. A total of 5 levels were classified, with Level 1 indicating low resilience to floods, Level 2 indicating relatively low resilience, Level 3 indicating average resilience, Level 4 indicating relatively high resilience, and Level 5 representing high resilience. To assess the resilience levels of Yingtan city in 2010, 2016, and 2022, three classification interval tables were generated. The classification interval for 2010 is provided below (Table 2), and the classification intervals for other years are detailed in the supplementary Table S1 and Table S2. Using the assigned values corresponding to Levels I to V, each indicator was assigned a five-level indicator value, as shown in Table 3.
3.6.2. Establishment of Resilience Level Evaluation Model
(1) Constructing the Initial Evaluation Matrix A, Based on the Indicator Level Values in Table 3.
(2) Calculating the comprehensive weight values of the 17 evaluation indicators according FAHP-EWM.
After obtaining the weight of each indicator, the Ci of the five levels is calculated based on Equations (1)~(10). A higher relative closeness value, closer to 5, indicates a better performance. The results for Ci are presented in Table 4.
(3) Establishing UFR level standards based on calculated relative closeness values for each level, as shown in Table 5.
4. Evaluation Index Set Analysis Results
4.1. Indicator Correlations
The gray correlation degrees of various dimensional indicators in Yingtan City were computed. The results, as depicted in Figure 3, highlight that among the three primary evaluation indicators, the correlation between urban socio-economic resilience and urban rain-flood resilience stands out as the strongest, scoring a high gray correlation degree of 0.921. Following closely is urban infrastructure resilience, demonstrating a degree of 0.808, while urban ecological resilience exhibits the weakest correlation at 0.521. In the realm of secondary evaluation indicators, several indicators – such as per capita GDP (A1), local fiscal expenditure (A2), land development intensity (B5), the number of hospital beds per ten thousand population (C1), per capita refuge area (C2), density of road network in built district (C3), density of sewers in built district (C5), and central city pumping capacity (C6) – all display gray correlation degrees surpassing 0.75. Meanwhile, the remaining indicators also show significant correlation, exceeding 0.58. This signifies a robust connection between these evaluation indicators and the UFR of Yingtan City. Additionally, a comparison between the comprehensive ranking of gray correlation degrees and the comprehensive weight ranking obtained from FAHP-EWM reveals an alignment between the two (Figure 3). This alignment serves to further validate the rationality behind the selection of evaluation system indicators and the assignment of weights.
4.2. Temporal Evolution of UFR
The Socio-economic, ecological, infrastructure resilience scores of each studied cell were calculated based on FAHP-EWM (Table S1). Integrating the weight outcomes of the 17 indicators and the statistical data (Table S2), on the basis of TOPSIS method, the yearly of UFR was charted in Yingtan City from 2010 to 2022, encompassing socio-economic resilience, ecological resilience, and infrastructure resilience of subsystems. Furthermore, coupling the analysis of indicator GRA across dimensions allowed a deeper investigation into the primary drivers impacting resilience variations. Figure 4 visually depicts the temporal evolution characteristics of flood resilience in the research area.
4.2.1. Urban Flood Resilience
As illustrated in Figure 4, Yingtan City's overall UFR exhibited an upward trajectory from 2010 to 2022. The resilience increased from 0.1646 in 2010 to 0.8522 in 2022, marking an impressive 80.69% surge. Examining the average gray correlation degree of UFR (Figure 3), density of sewers in the built district (C5) emerged with the highest degree at 0.84, closely followed by per capita GDP (A1) at 0.78. Several indicators demonstrated gray correlation degrees exceeding 0.7, including local fiscal expenditure (A2), land development intensity (B5), number of hospital beds per ten thousand population (C1), per capita refuge area (C2), density of road network in built district (C3), and central city pumping capacity (C6). These findings emphasize these indicators as pivotal factors driving the enhancement of flood resilience in Yingtan City. However, it's noteworthy that in both 2011 and 2019, UFR experienced slight declines. Figure 5 shows that in 2011, the indicator with the highest gray correlation was C5. Upon analysis of statistical data and computations (Table S2), the reduction in drainage pipe network density by 0.12 km/km2 compared to 2010 was the primary contributor to the 2011 UFR decline. In 2019, substantial disparities were observed in the gray correlation degree values among different indicators (Figure 5). Notably, indicators with higher gray correlation degrees were predominantly centered around infrastructure resilience. Overall, delayed progress in infrastructure development stood out as the primary reason behind the slight dip in flood resilience in 2019.
4.2.2. Socio-Economic Resilience
As depicted in Figure 4, between 2010 and 2022, the socio-economic resilience of Eagle Lake maintains its growth trend, as it increased by a total of almost 90%. The per capita GDP (A1) and local fiscal expenditure (A2) stand as pivotal metrics in measuring a city's economic growth potential and explaining the regional recovery capability after flooding. Based on the gray correlation information (Table 6), A1 and A2 consistently rank among the top in gray correlation degree, of the six indicators, over the years. This suggests a significant impact of A1 and A2 on Yingtan City's socio-economic resilience. Additionally, indicators such as the number of healthcare workers per ten thousand population (A3), percentage of the population aged over 60 and under 18 (A4), unemployment rate (A5), and density of population (A6) displayed a notable increase in gray correlation degrees from 2010 to 2017. However, these indicators exhibited a gradual decline from 2017 to 2022, indicating their advancement to relatively higher levels in 2017.
4.2.3. Ecological Resilience
As shown in Figure 4, from 2010 to 2020, Yingtan City experienced a decline in ecological resilience, dropping from 0.65 to 0.14. However, by 2022, it rebounded to 0.3, indicating a pattern of initial decrease followed by a subsequent recovery, resulting in an overall decline of 58%. The surface area of lakes and rivers (B4) represents a city's innate water storage capacity during flood disasters. Gray correlation analyses from 2010 to 2020 (Table 7) highlight B4 as having the highest gray correlation degree, followed by the green coverage rate of built-up area (B2) and the centralized treatment rate of the sewage treatment plant (B3). This suggests that B2, B3, and B4 primarily contributed to the decline in ecological resilience. Between 2020 and 2022, though, there was an uptick in resilience. During this period, B4 ranked highest in gray correlation degree, followed by the centralized collection rate of the sewage treatment plant (B3), boasting a gray correlation degree of 0.73 (Table 7). B3 reflects the concentration of sewage collection in a city, also indicating the city's pipeline construction capacity. For Yingtan City, lacking a fully segregated drainage system, B3 remains a pivotal factor in this resurgence. An intriguing observation is the upward fluctuation in resilience in 2017. During that year, the indicator with the highest gray correlation degree was per capita green area (B1). B1 reflects changes in the runoff coefficient of urban underlying surface, which, when increased, helps reduce internal flooding. This highlights that B1 primarily drove this fluctuation.
4.2.4. Infrastructure Resilience
As shown in Figure 4, the overall trend in infrastructure resilience from 2010 to 2022 depicted a consistent upward trajectory, marking a notable cumulative increase of 91.62%. To delineate this trend further, it is segmented into three distinct phases: a period of gradual growth, followed by fluctuations, and culminating in a phase of rapid advancement. Between 2010 and 2016, infrastructure resilience demonstrated a slow but steady ascent. Analyses of average correlation degrees for each indicator (Table 8) revealed that the density of sewers in the built district (C5) held the highest gray correlation degree, at 0.81. Given its role as the primary conduit for urban precipitation discharge, the drainage pipe network could effectively address urban flood disasters. Hence, C6 stands as the most critical factor influencing the gradual enhancement of infrastructure resilience. Over time, indicators such as the number of hospital beds per ten thousand population (C1), per capita refuge area (C2), communication coverage (C4), and central city pumping capacity (C6) displayed gradual increases in gray correlation degree, showcasing their growing impact on infrastructure resilience. From 2016 to 2020, infrastructure resilience experienced fluctuations. Gray correlation analyses (Table 8) indicated that indicators C1, C2, C3, C5, and C6 boasted correlation degrees surpassing 0.8, while C4 stood at 0.77, underscoring the significant influence of all these indicators on infrastructure resilience. Between 2020 and 2022, a rapid upsurge in infrastructure resilience was observed. Gray correlation analyses (Table 8) highlighted C6 as the most influential factor, boasting the highest gray correlation degree, while the other five indicators also contributed actively to the resilience enhancement.
5. Evolution of UFR Level
Considering the minimal fluctuation in resilience levels between consecutive years within the study period, the analysis focused on three specific years in Yingtan City to assess flood resilience grades. The flood resilience indicators for the assessment years are denoted as U1, U2, and U3, corresponding to 2010, 2016, and 2022, respectively. Referring to (Table 2, Table S3, Table S4) and statistical data (Table S2) allows for the determination of individual indicator levels, as presented in Table 9. In this evaluation model, Level V of flood resilience is regarded as the most desirable, while Level I represents the least favorable scenario. Hence, using an evaluation model to analyze the years under assessment involves determining the values of various indicators for each year. Then, Equations (1)~(10) are used to calculate how closely the indicator value sequence of this assessment matches the most ideal and worst solutions, as shown in Table 10. These results are compared against the grading standards provided in Table 5 to determine the flood resilience level of the entity being evaluated.
After conducting our calculations, we determined the flood resilience alignment in Yingtan City for the years 2010, 2016, and 2022. In 2010, the proximity was 0.3439, categorizing it as Level III. By 2016, this proximity had increased to 0.3971, remaining at Level III yet showing a noticeable rise. Moving to 2022, the flood resilience level's proximity reached 0.6061, now positioned at Level IV. These findings indicate a gradual improvement in flood resilience from 2010 to 2016, followed by a swift advancement from 2016 to 2022. This trend aligns with the temporal evolution observed in the previous section on flood resilience levels.
Analyzing the data (Table 9) regarding flood resilience indicator levels spanning from 2010 to 2022, notable shifts are evident in three key metrics within Yingtan City: per capita GDP (A1), communication coverage (C4), and the density of sewers in the built district (C5). The increase in A1 values mirrors the city's levels of livelihood capital, marking a pivotal aspect for fortifying urban resilience against flood risks. This rise aligns with the steady growth of Yingtan's key economic sector—the copper industry—propelling the city's per capita GDP to a leading national position. The surge in C4 values also signifies China's rapid strides in information technology. Yingtan City has achieved an advanced level of mobile communication, furnishing an efficient conduit for disseminating crucial information during flood emergencies. In 2021, as Yingtan was designated a model sponge city, local authorities implemented various projects including rainwater and sewage diversion reforms alongside extensive drainage network construction. These efforts were aimed at addressing urban flooding issues. Consequently, Yingtan City quickly advanced to a leading national position in terms of its C5 level. Moreover, as of 2022, local fiscal expenditure (A2) and percentage of the population aged over 60 and under 18 (A4) in Yingtan City continue to lag behind. Areas such as the number of healthcare workers per ten thousand population (A3), the surface area of lakes and rivers (B4), and the density of road networks in the built district (C3) still hold prospects for improvement.
6. Discussion and Conclusions
6.1. Improvement Strategy
As the largest copper industry base and a significant copper-consuming city in China, Yingtan aims to become a regional comprehensive hub city during the 14th Five-Year Plan period. Enhancing flood resilience is crucial to achieving this goal. According to the evaluation results of flood resilience levels, the current performance of Yingtan in local fiscal expenditure and population age structure still poses challenges to the enhancement of UFR. Simultaneously, there is room for further optimization in the number of healthcare technicians per 10,000 people, watershed area, and road density in built-up areas. To address these challenges, the Yingtan government should adopt the following improvement measures: Firstly, the structure of fiscal expenditure needs optimization. By improving the efficiency of public services, unnecessary expenditures can be reduced. Priority should be given to ensuring investment in critical areas such as infrastructure construction, education, and healthcare. In particular, efforts should be intensified in the construction of flood control and disaster relief facilities, urban infrastructure transformation, and technological innovation. Secondly, the population age structure requires adjustment. Fertility policies should be optimized to increase the number of young people, and talent introduction should be enhanced to enrich the population structure. Comprehensive social security should be provided for the elderly, ensuring that people of different age groups can enjoy corresponding benefits and support. Thirdly, the cultivation and introduction of healthcare technicians should be strengthened. By increasing the number of healthcare technicians per 10,000 people and improving the level of public health services in the city, the city's ability to cope with floods and other disasters can be enhanced. Fourthly, the city's water body area needs to be expanded and improved. Through ecological restoration and water source protection measures, the city's flood resilience can be enhanced. Fifthly, the city's road density should be increased. By strengthening urban road construction, the city's ability to cope with floods and other disasters can be enhanced. These measures, when implemented comprehensively, will enhance Yingtan's flood resilience. This will lay a solid foundation for the city's future sustainable development.
6.2. Limitations
Firstly, the assessment of UFR in China is still in the exploratory stage, and a unified and mature set of indicators has not yet been established. Therefore, the assessment framework and indicator selection in this study unavoidably suffer from some shortcomings. Secondly, this research conducted a quantitative assessment of the flood resilience level using Yingtan City as the study area but lacked exploration at the spatial scale. Thirdly, this study only considered the period from 2010 to 2022, without simulating future UFR. This oversight may result in a lack of precise data support when formulating UFR enhancement plans in the future. To address these issues, we plan to further deepen our research going forward. Firstly, we will refine the indicator system to ensure the accuracy of the assessment results. Secondly, we will explore the resilience characteristics at the spatial scale of the study area to comprehensively understand the distribution of UFR. Lastly, we can apply predictive models to forecast the development of future flood resilience, providing precise data for cities to formulate targeted enhancement plans.
6.3. Conclusion
This report establishes an assessment framework and indicator system for the UFR of Yingtan City, covering three aspects: urban socio-economic resilience, ecological resilience, and infrastructure resilience, using a total of 17 indicators. By calculating the changes in flood resilience levels in Yingtan from 2010 to 2022, and the variations in flood resilience grades over three years, we analyzed the temporal evolution characteristics of flood resilience and its subsystem dimensions in Yingtan city. Specific conclusions are drawn as follows:
- (1)
- In accordance with previous research on resilience assessment methods and considering national regulations and expert recommendations, indicators that can represent a city's ability to resist floods were selected. A three-level indicator system was constructed, with the first-level indicator UFR, the second-level indicators being socio-economic resilience, ecological resilience, and infrastructure resilience, and a total of 17 third-level indicators. The gray relational degrees of all evaluation indicators were greater than 0.58, indicating that the selection of indicators was reasonable.
- (2)
- From 2010 to 2022, the UFR level of Yingtan City steadily increased, showing an overall improvement of 80.69%. In terms of subsystem dimensions, while ecological resilience exhibited a fluctuating downward trend, both socio-economic resilience and infrastructure resilience showed clear growth trends. The factors influencing Yingtan City's UFR are primarily concentrated in the density of the urban pipe network, per capita GDP, local fiscal expenditures, land development intensity, the number of medical institution beds per ten thousand people, the density of the urban road network, per capita refuge area, and emergency drainage capacity.
- (3)
- This study employed the natural breaks method, based on statistical data from all cities in China, to set the grade intervals of each indicator for the assessment years. Subsequently, the flood resilience grades for Yingtan City in the years 2010, 2016, and 2022 were calculated. The flood resilience grades were categorized as Level III in 2010 and 2016, and Level IV in 2022, indicating a continuous improvement in Yingtan City's flood resilience grades. The trend of flood resilience at a time scale was reviewed, and it can be concluded that the method used in this study is feasible.
Supplementary Materials
The following supporting information can be downloaded at the website of this paper posted on Preprints.org.
Author Contributions
Donghai Yuan: Conceptualization, Writing-review & editing, Funding acquisition. Hui Wang: Methodology, Formal analysis, Writing-original draft. Chen Wang: Conceptualization, Writing-review & editing, Funding acquisition. Chenling Yan: Writing-review & editing. Lili Xu: Formal analysis, Investigation, Methodology. Chunyang Zhang: Investigation, Methodology. Jiazhuo Wang: Formal analysis, Methodology. Yingying Kou: Writing-review & editing, Writing-original draft.
Funding
This work is supported by the National Natural Science Foundation of China (52170097), Beijing Natural Science Foundation (9222017), the Project of Construction and Support for high-level Innovative Teams of Beijing Municipal Institutions (BPHR20220108), the Open Research Fund of State Environmental Protection Key Laboratory for Lake Pollution Control (2022HPYB-06) and the Fundamental Research Funds for the Central Public-interest Scientific Institution (2022YSKY-02).
Data Availability Statement
All data generated or analyzed during this study are included in this published article and its supplementary information files.
Acknowledgments
In this section, you can acknowledge any support given which is not covered by the author contribution or funding sections. This may include administrative and technical support, or donations in kind (e.g., materials used for experiments).
Conflicts of Interest
The authors declare no conflict of interest.
References
- Gao, Y.Q.; Chen, J.H.; Luo, H.; Wang, H.Z. Prediction of hydrological responses to land use change. SCIENCE OF THE TOTAL ENVIRONMENT 2020, 708. [Google Scholar] [CrossRef] [PubMed]
- Gu, L.; Chen, J.; Yin, J.B.; Slater, L.J.; Wang, H.M.; Guo, Q.; Feng, M.Y.; Qin, H.; Zhao, T.T.G. Global Increases in Compound Flood-Hot Extreme Hazards Under Climate Warming. GEOPHYSICAL RESEARCH LETTERS 2022, 49. [Google Scholar] [CrossRef]
- Zhu, S.; Li, D.; Huang, G.; Chhipi-Shrestha, G.; Nahiduzzaman, K.M.; Hewage, K.N.; Sadiq, R. Enhancing urban flood resilience: A holistic framework incorporating historic worst flood to Yangtze River Delta, China. International Journal of Disaster Risk Reduction 2021. [Google Scholar] [CrossRef]
- Wu, J.D.; Han, G.Y.; Zhou, H.J.; Li, N. Economic development and declining vulnerability to climate-related disasters in China. ENVIRONMENTAL RESEARCH LETTERS 2018, 13. [Google Scholar] [CrossRef]
- Zhang, X.X.; Sheng, W.F.; Qi, S.Z. Hazards and reflection on Fangshan District extreme rainstorm of July 21, 2012, the urban mountainous region of Beijing, North China. NATURAL HAZARDS 2018, 94, 1459–1461. [Google Scholar] [CrossRef]
- Liu, X.; Zhou, P.; Lin, Y.C.; Sun, S.W.; Zhang, H.L.; Xu, W.Q.; Yang, S.D. Influencing Factors and Risk Assessment of Precipitation-Induced Flooding in Zhengzhou, China, Based on Random Forest and XGBoost Algorithms. INTERNATIONAL JOURNAL OF ENVIRONMENTAL RESEARCH AND PUBLIC HEALTH 2022, 19. [Google Scholar] [CrossRef] [PubMed]
- Nahiduzzaman, K.M.; Aldosary, A.S.; Rahman, M.T. Flood induced vulnerability in strategic plan making process of Riyadh city. Habitat International 2015, 49, 375–385. [Google Scholar] [CrossRef]
- Cassel, M.A.; Hinsberger, M. Flood partnerships: a participatory approach to develop and implement the Flood Risk Management Plans. JOURNAL OF FLOOD RISK MANAGEMENT 2017, 10, 164–172. [Google Scholar] [CrossRef]
- McClymont, K.; Morrison, D.; Beevers, L.; Carmen, E. Flood resilience: a systematic review. Journal of Environmental Planning and Management 2019, 63, 1151–1176. [Google Scholar] [CrossRef]
- Holling, C.S. Resilience and Stability of Ecological Systems. Annual Review of Ecology and Systematics 1973, 4, 1–23. [Google Scholar] [CrossRef]
- Saikia, P.; Beane, G.; Garriga, R.G.; Avello, P.; Ellis, L.; Fisher, S.; Leten, J.; Ruiz-Apilánez, I.; Shouler, M.; Ward, R.; et al. City Water Resilience Framework: A governance based planning tool to enhance urban water resilience. Sustainable Cities and Society 2022, 77, 103497. [Google Scholar] [CrossRef]
- Zhang, Y.; Yue, W.C.; Su, M.R.; Teng, Y.M.; Huang, Q.Y.; Lu, W.W.; Rong, Q.Q.; Xu, C. Assessment of urban flood resilience based on a systematic framework. ECOLOGICAL INDICATORS 2023, 150. [Google Scholar] [CrossRef]
- Huang, G.; Li, D.; Zhu, X.; Zhu, J. Influencing factors and their influencing mechanisms on urban resilience in China. Sustainable Cities and Society 2021, 74, 103210. [Google Scholar] [CrossRef]
- Li, W.; Jiang, R.; Wu, H.; Xie, J.; Zhao, Y.; Song, Y.; Li, F. A System Dynamics Model of Urban Rainstorm and Flood Resilience to Achieve the Sustainable Development Goals. Sustainable Cities and Society 2023, 96, 104631. [Google Scholar] [CrossRef]
- Chen, N.C.; Yao, S.; Wang, C.; Du, W.Y. A Method for Urban Flood Risk Assessment and Zoning Considering Road Environments and Terrain. SUSTAINABILITY 2019, 11. [Google Scholar] [CrossRef]
- Zhong, M.; Lin, K.R.; Tang, G.P.; Zhang, Q.; Hong, Y.; Chen, X.H. A Framework to Evaluate Community Resilience to Urban Floods: A Case Study in Three Communities. SUSTAINABILITY 2020, 12. [Google Scholar] [CrossRef]
- Ghasemzadeh, B.; Zarabadi, Z.S.S.; Majedi, H.; Behzadfar, M.; Sharifi, A. A Framework for Urban Flood Resilience Assessment with Emphasis on Social, Economic and Institutional Dimensions: A Qualitative Study. SUSTAINABILITY 2021, 13. [Google Scholar] [CrossRef]
- Li, Z.; Zhang, X.; Ma, Y.; Feng, C.; Hajiyev, A. A multi-criteria decision making method for urban flood resilience evaluation with hybrid uncertainties. International Journal of Disaster Risk Reduction 2019, 36, 101140. [Google Scholar] [CrossRef]
- Zhang, Y.; Shang, K.J. Cloud model assessment of urban flood resilience based on PSR model and game theory. INTERNATIONAL JOURNAL OF DISASTER RISK REDUCTION 2023, 97. [Google Scholar] [CrossRef]
- Cao, F.F.; Xu, X.F.; Zhang, C.L.; Kong, W.B. Evaluation of urban flood resilience and its Space-Time Evolution: A case study of Zhejiang Province, China. ECOLOGICAL INDICATORS 2023, 154. [Google Scholar] [CrossRef]
- Ji, J.; Wang, D.Y. Evaluation analysis and strategy selection in urban flood resilience based on EWM-TOPSIS method and graph model. JOURNAL OF CLEANER PRODUCTION 2023, 425. [Google Scholar] [CrossRef]
- Moghadas, M.; Asadzadeh, A.; Vafeidis, A.; Fekete, A.; Kötter, T. A multi-criteria approach for assessing urban flood resilience in Tehran, Iran. INTERNATIONAL JOURNAL OF DISASTER RISK REDUCTION 2019, 35. [Google Scholar] [CrossRef]
- Datola, G. Implementing urban resilience in urban planning: A comprehensive framework for urban resilience evaluation. Sustainable Cities and Society 2023, 98, 104821. [Google Scholar] [CrossRef]
- Zhu, S.Y.; Li, D.Z.; Huang, G.Y.; Chhipi-Shrestha, G.; Nahiduzzaman, K.M.; Hewage, K.; Sadiq, R. Enhancing urban flood resilience: A holistic framework incorporating historic worst flood to Yangtze River Delta, China. INTERNATIONAL JOURNAL OF DISASTER RISK REDUCTION 2021, 61. [Google Scholar] [CrossRef]
- Galderisi, A. Urban resilience: A framework for empowering cities in face of heterogeneous risk factors. Z magazine (Boston, Mass.) 2014, 11, 36–58. [Google Scholar]
- Ji, J.; Chen, J.F. Urban flood resilience assessment using RAGA-PP and KL-TOPSIS model based on PSR framework: A case study of Jiangsu province, China. WATER SCIENCE AND TECHNOLOGY 2022, 86, 3264–3280. [Google Scholar] [CrossRef] [PubMed]
- Lianxiao; Morimoto, T.; Tong, S.Q.; An, C.; Bao, Y.H.; Fei, G. Evaluating Regional Flood Disaster Resilience Based on the DROP Model and TOPSIS Method: A Case Study of the Katsushika Ward, Tokyo. NATURAL HAZARDS REVIEW 2022, 23. [Google Scholar] [CrossRef]
- Leta, B.M.; Adugna, D. Characterizing the level of urban Flood vulnerability using the social-ecological-technological systems framework, the case of Adama city, Ethiopia. Heliyon 2023, 9, e20723. [Google Scholar] [CrossRef] [PubMed]
- Chang, H.; Pallathadka, A.; Sauer, J.; Grimm, N.B.; Zimmerman, R.; Cheng, C.; Iwaniec, D.M.; Kim, Y.; Lloyd, R.; McPhearson, T.; et al. Assessment of urban flood vulnerability using the social-ecological-technological systems framework in six US cities. Sustainable Cities and Society 2021, 68, 102786. [Google Scholar] [CrossRef]
- Aroca-Jiménez, E.; Bodoque, J.M.; García, J.A. An Integrated Multidimensional Resilience Index for urban areas prone to flash floods: Development and validation. Science of The Total Environment 2023, 894, 164935. [Google Scholar] [CrossRef]
- Zhao, L.; Zhang, T.; Fu, J.; Li, J.; Cao, Z.; Feng, P. Risk Assessment of Urban Floods Based on a SWMM-MIKE21-Coupled Model Using GF-2 Data. Remote Sensing 2021, 13. [Google Scholar] [CrossRef]
- Bonnefond, M. Hydraulic modeling as a condition of resilient urban projects in flood-prone area? HOUILLE BLANCHE-REVUE INTERNATIONALE DE L EAU, -33. [CrossRef]
- Li, F.; Wang, Q.; Hu, W.; Liu, J.; Zhang, X. Rapid assessment of disaster damage and economic resilience in relation to the flooding in Zhengzhou, China in 2021. Remote Sensing Letters 2022, 13, 651–662. [Google Scholar] [CrossRef]
- Rahman, M.; Ningsheng, C.; Mahmud, G.I.; Islam, M.M.; Pourghasemi, H.R.; Ahmad, H.; Habumugisha, J.M.; Washakh, R.M.A.; Alam, M.; Liu, E.; et al. Flooding and its relationship with land cover change, population growth, and road density. Geoscience Frontiers 2021, 12, 101224. [Google Scholar] [CrossRef]
- Oke, O.; Dougherty, E.; Rasmussen, K.L.; Morrison, R.R.; Carter, E. Spatial distribution of socio-demographic and housing-based factors in relation to flash and slow-rise flooding hazards in the U.S. ENVIRONMENTAL RESEARCH LETTERS 2023, 18. [Google Scholar] [CrossRef]
- Chen, X.S.; Jiang, S.L.; Xu, L.S.; Xu, H.G.; Guan, N.N. Resilience assessment and obstacle factor analysis of urban areas facing waterlogging disasters: a case study of Shanghai, China. ENVIRONMENTAL SCIENCE AND POLLUTION RESEARCH 2023, 30, 65455–65469. [Google Scholar] [CrossRef]
- Xu, C.; Rahman, M.; Haase, D.; Wu, Y.; Su, M.; Pauleit, S. Surface runoff in urban areas: The role of residential cover and urban growth form. Journal of Cleaner Production 2020, 262, 121421. [Google Scholar] [CrossRef]
- Li, C.; Liu, M.; Hu, Y.; Shi, T.; Qu, X.; Walter, M.T. Effects of urbanization on direct runoff characteristics in urban functional zones. Science of The Total Environment 2018, 643, 301–311. [Google Scholar] [CrossRef]
- Bu, J.H.; Peng, C.; Li, C.H.; Wang, X.; Zhang, Y.; Yang, Z.W.; Cai, Y.P. A method for determining reasonable water area ratio based on flood risk and cost-effectiveness in Rainy City. ENVIRONMENTAL EARTH SCIENCES 2020, 79. [Google Scholar] [CrossRef]
- Wang, S.; Jiang, R.; Yang, M.; Xie, J.; Wang, Y.; Li, W. Urban rainstorm and waterlogging scenario simulation based on SWMM under changing environment. Environmental Science and Pollution Research 2023, 30, 123351–123367. [Google Scholar] [CrossRef]
- Liu, Y.; Zhao, W.; Wei, Y.; Sebastian, F.S.M.; Wang, M. Urban waterlogging control: A novel method to urban drainage pipes reconstruction, systematic and automated. Journal of Cleaner Production 2023, 418, 137950. [Google Scholar] [CrossRef]
- Chen, P.; Zhang, J.; Jiang, X.; Liu, X.; Bao, Y.; Sun, Y. Scenario Simulation-Based Assessment of Trip Difficulty for Urban Residents under Rainstorm Waterlogging. International Journal of Environmental Research and Public Health 2012, 9, 2057–2074. [Google Scholar] [CrossRef] [PubMed]
- Ekaputra, R.A.; Lee, C.; Kee, S.-H.; Yee, J.-J. Emergency Shelter Geospatial Location Optimization for Flood Disaster Condition: A Review. Sustainability 2022, 14. [Google Scholar] [CrossRef]
- Sun, N.; Li, C.L.; Guo, B.Y.; Sun, X.K.; Yao, Y.K.; Wang, Y. Urban flooding risk assessment based on FAHP-EWM combination weighting: a case study of Beijing. GEOMATICS NATURAL HAZARDS & RISK 2023, 14. [Google Scholar] [CrossRef]
- Yoon, K. A Reconciliation Among Discrete Compromise Solutions. Journal of the Operational Research Society 1987, 38, 277–286. [Google Scholar] [CrossRef]
- Kuo, T. A review of some modified grey relational analysis models. Journal of Grey System 2017, 29, 70–77. [Google Scholar]
- Zhu, J.; Zhang, S.; Chen, Y.; Zhang, L. A Hierarchical Clustering Approach Based on Three-Dimensional Gray Relational Analysis for Clustering a Large Group of Decision Makers with Double Information. Group Decision and Negotiation 2015, 25, 325–354. [Google Scholar] [CrossRef]
- Cao, C.; Zhu, K.; Cai, F.; Qi, H.S.; Liu, J.H.; Lei, G.; Mao, Z.J.; Zhao, S.H.; Liu, G.; Su, Y. Vulnerability Evolution of Coastal Erosion in the Pearl River Estuary Great Bay Area Due to the Influence of Human Activities in the Past Forty Years. FRONTIERS IN MARINE SCIENCE 2022, 9. [Google Scholar] [CrossRef]
- Ruan, J.E.; Chen, Y.B.; Yang, Z.W. Assessment of temporal and spatial progress of urban resilience in Guangzhou under rainstorm scenarios. INTERNATIONAL JOURNAL OF DISASTER RISK REDUCTION 2021, 66. [Google Scholar] [CrossRef]
Figure 1.
Geographic location of the study area.
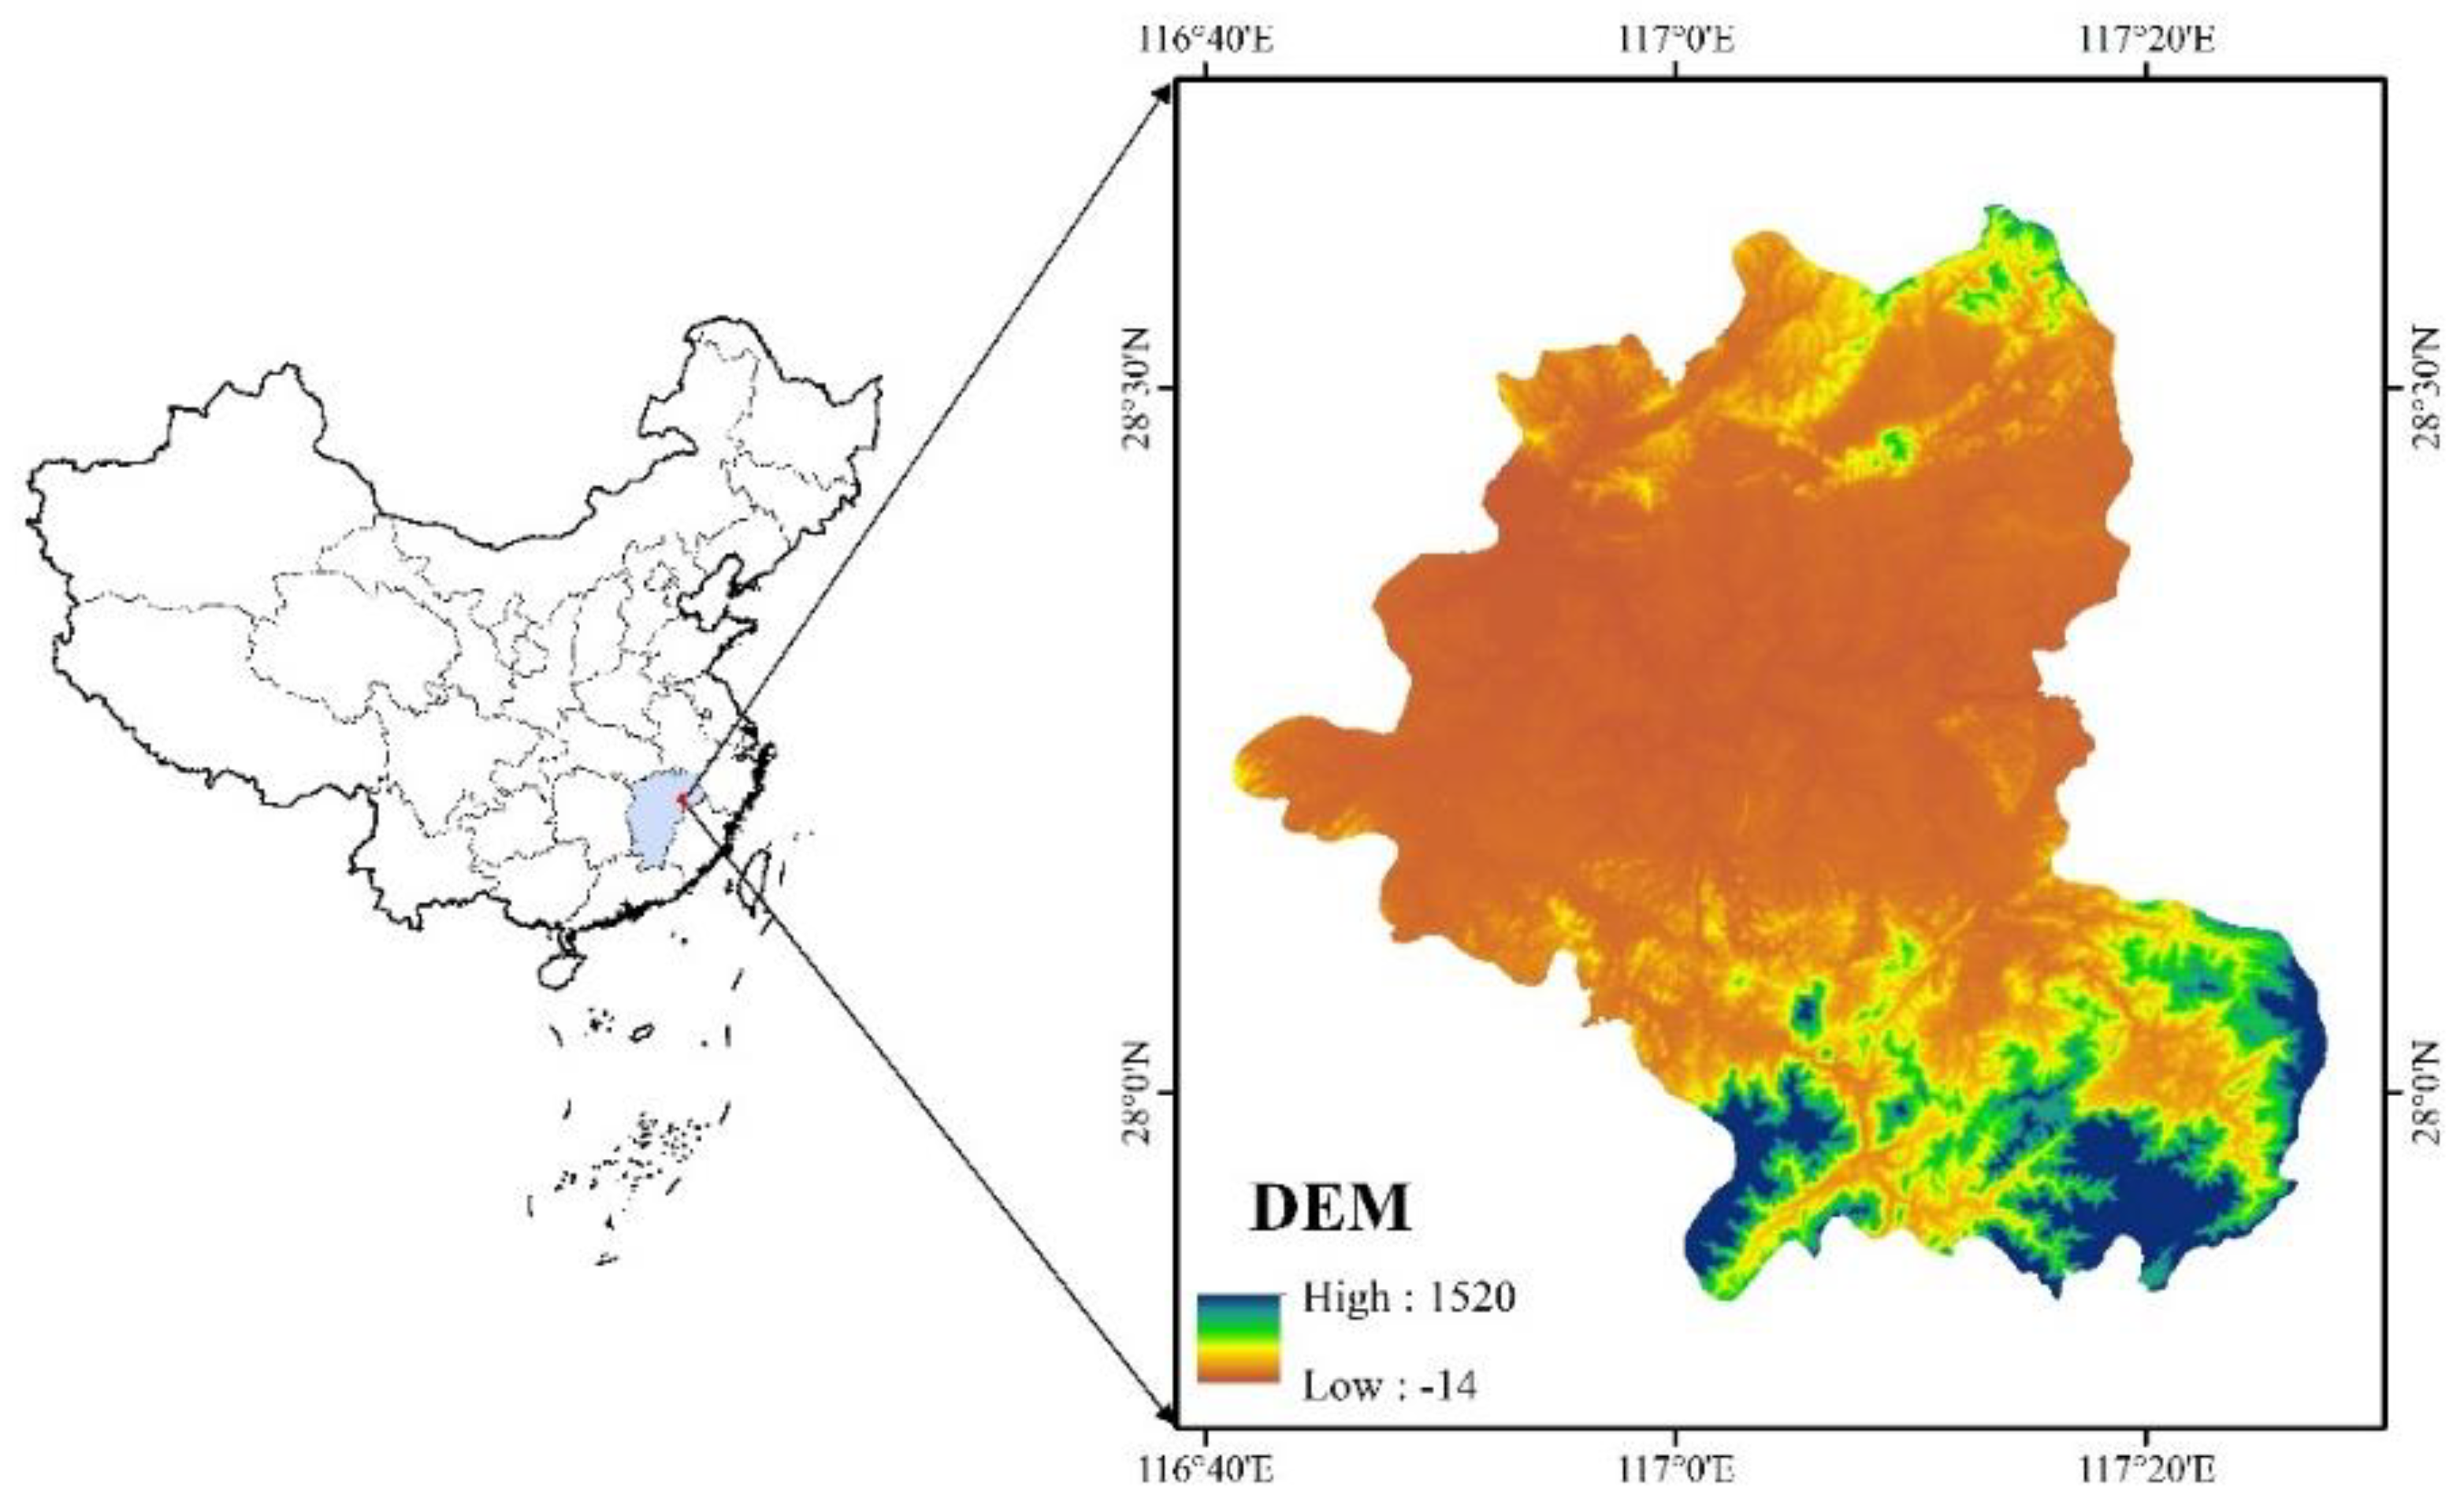
Figure 2.
Overall assessment system for UFR.
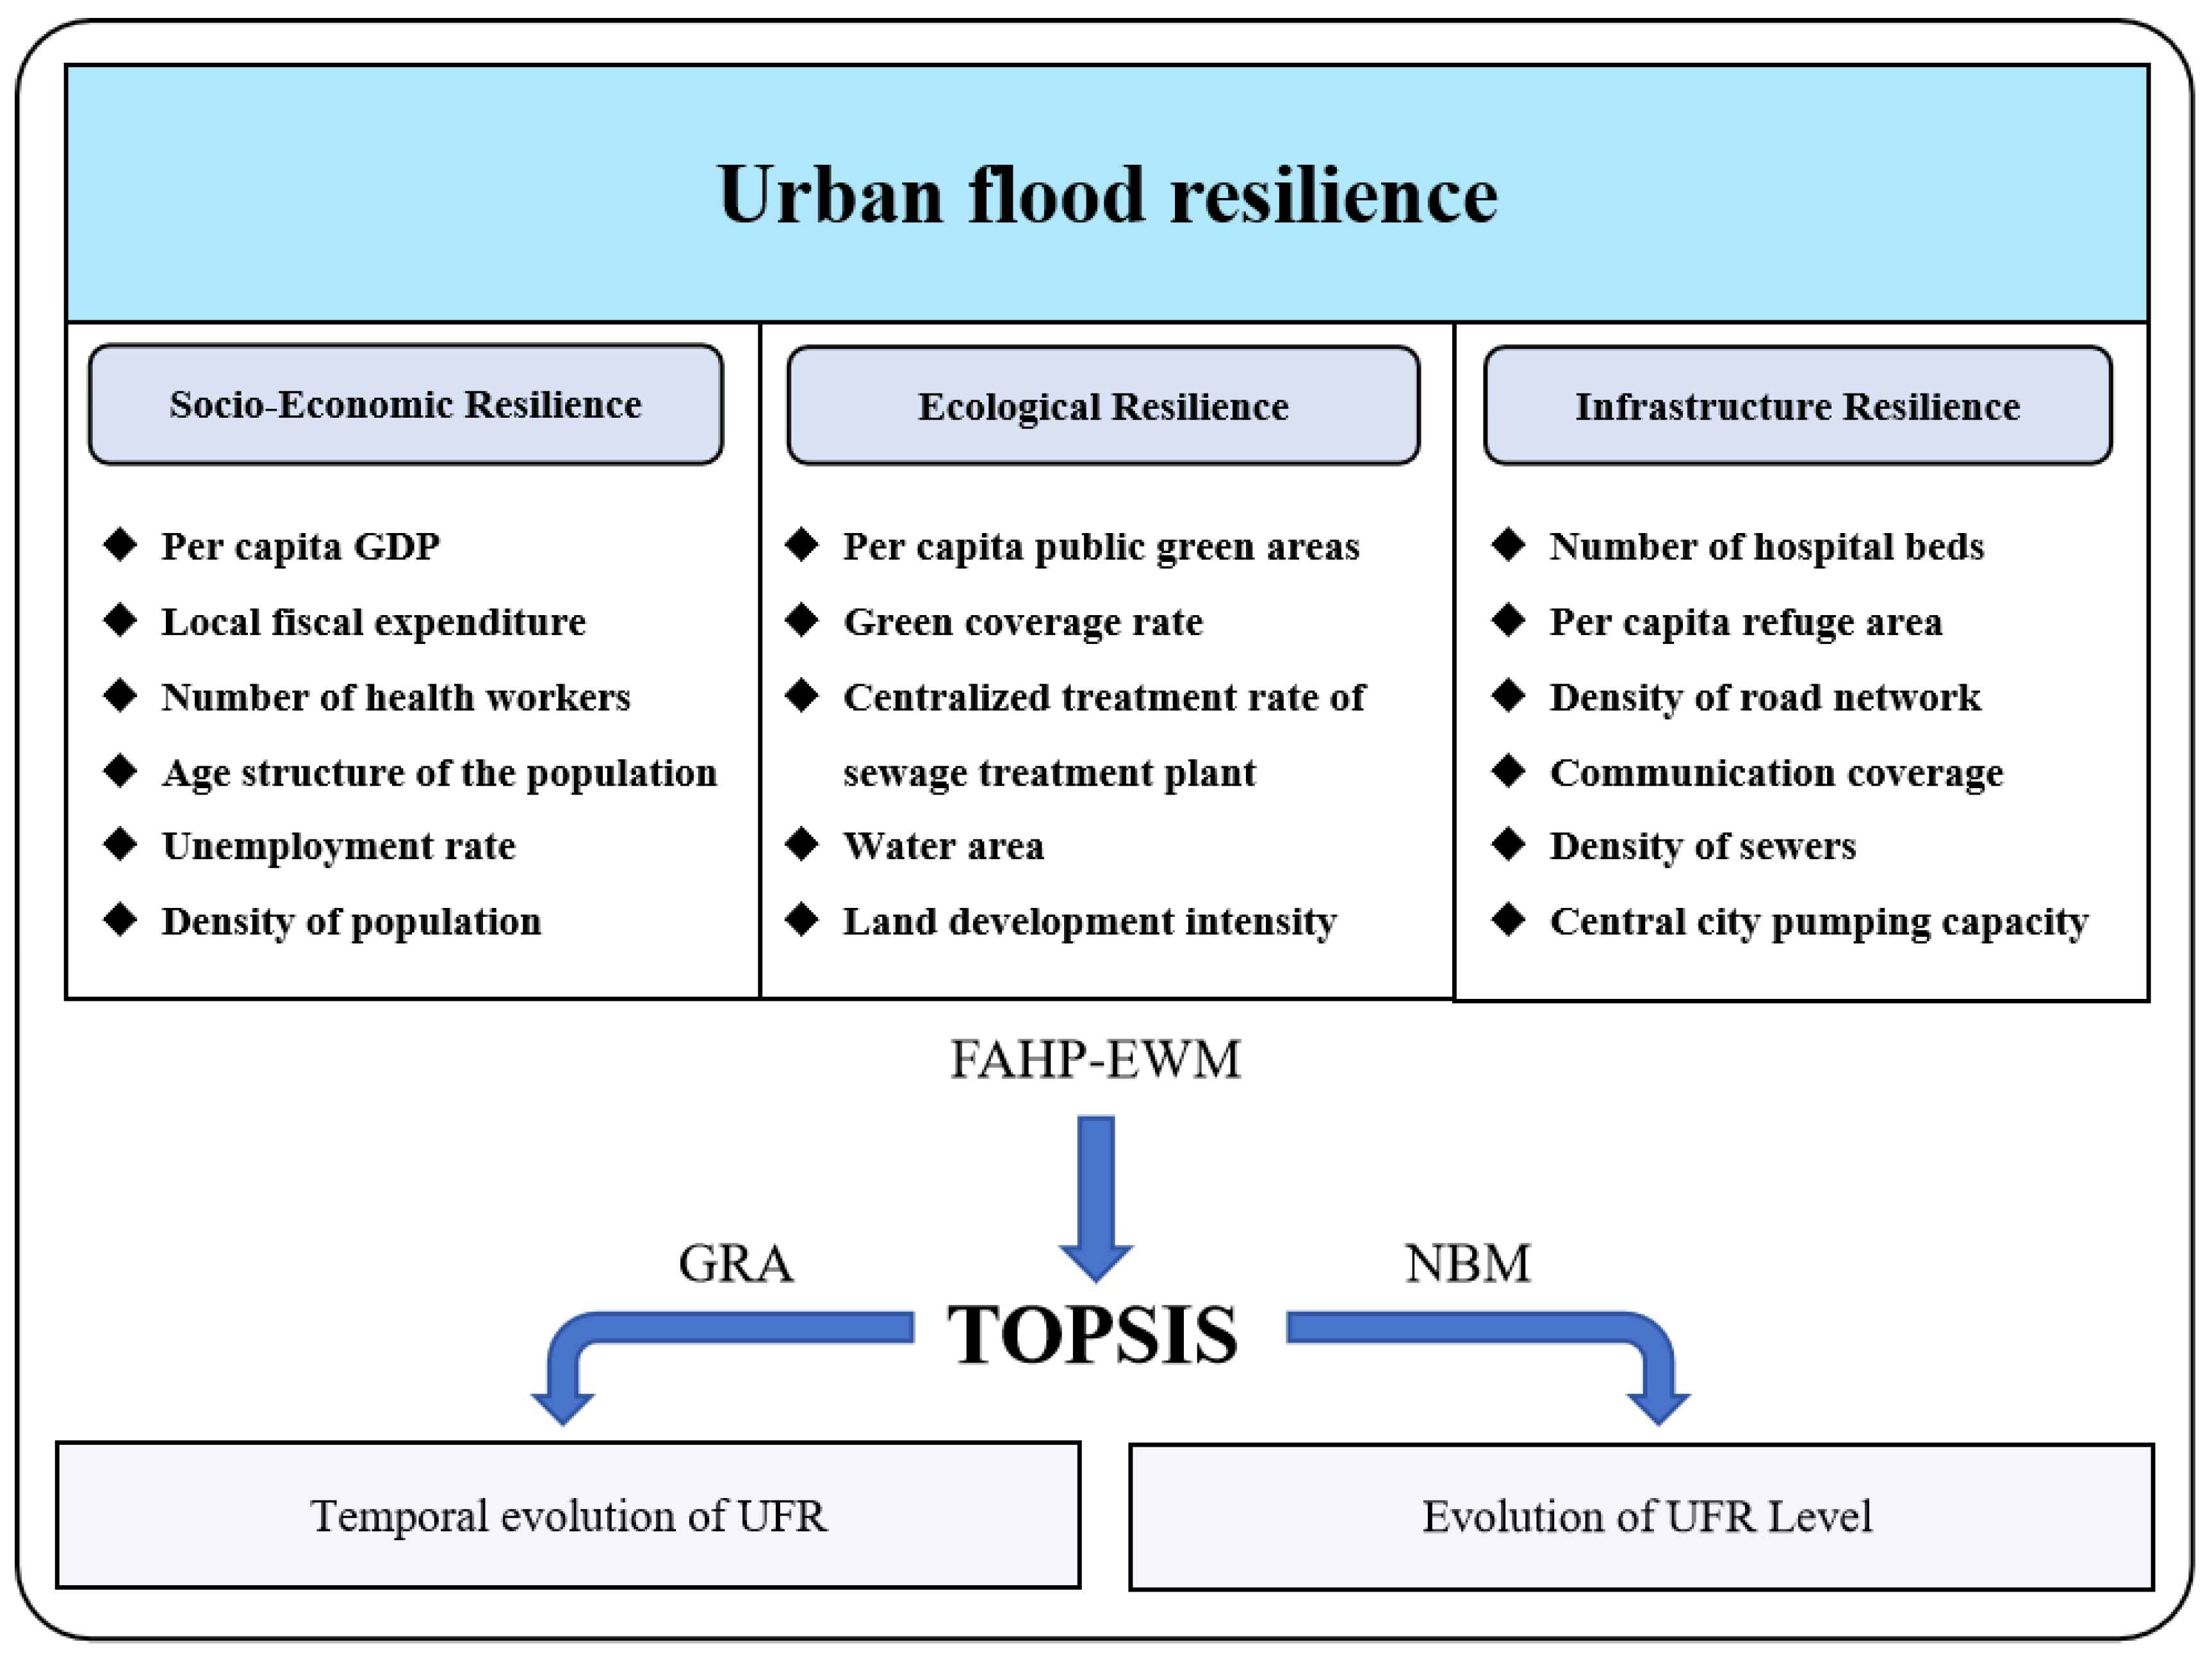
Figure 3.
Ranking of indicators in the FAHP-EWM and GRA methods.
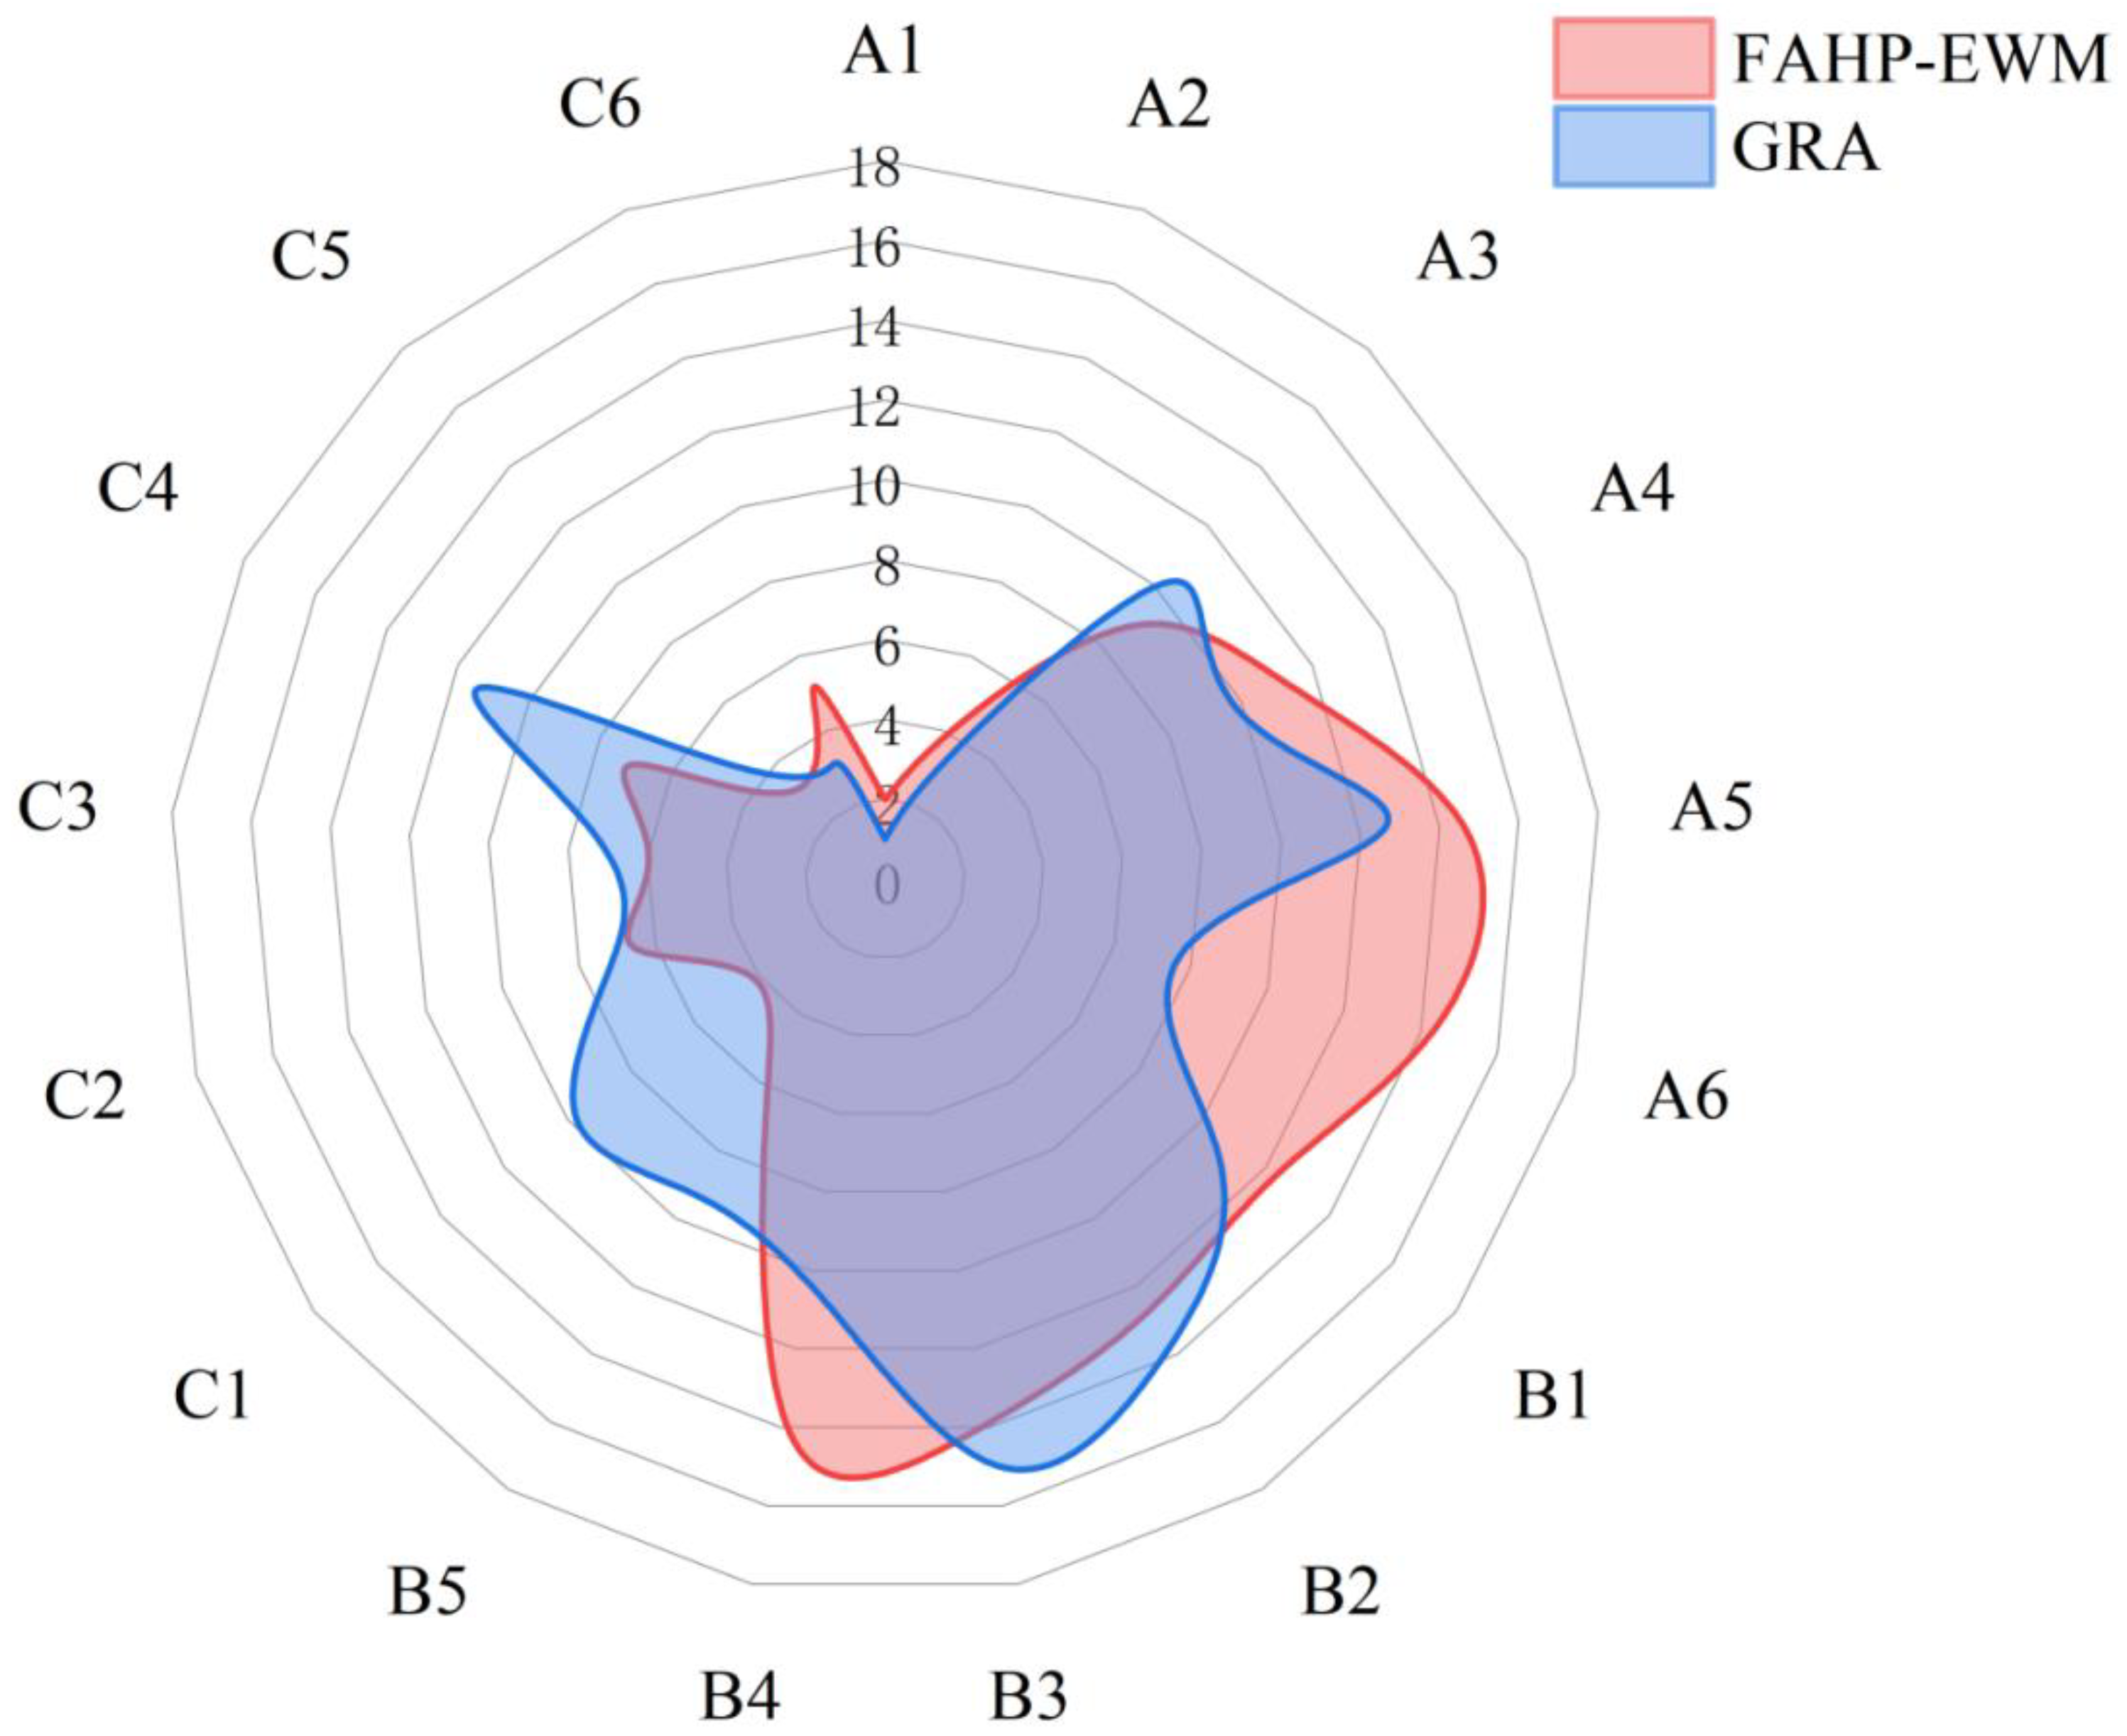
Figure 4.
The urban flooding resilience of each dimension from 2010 to 2022.
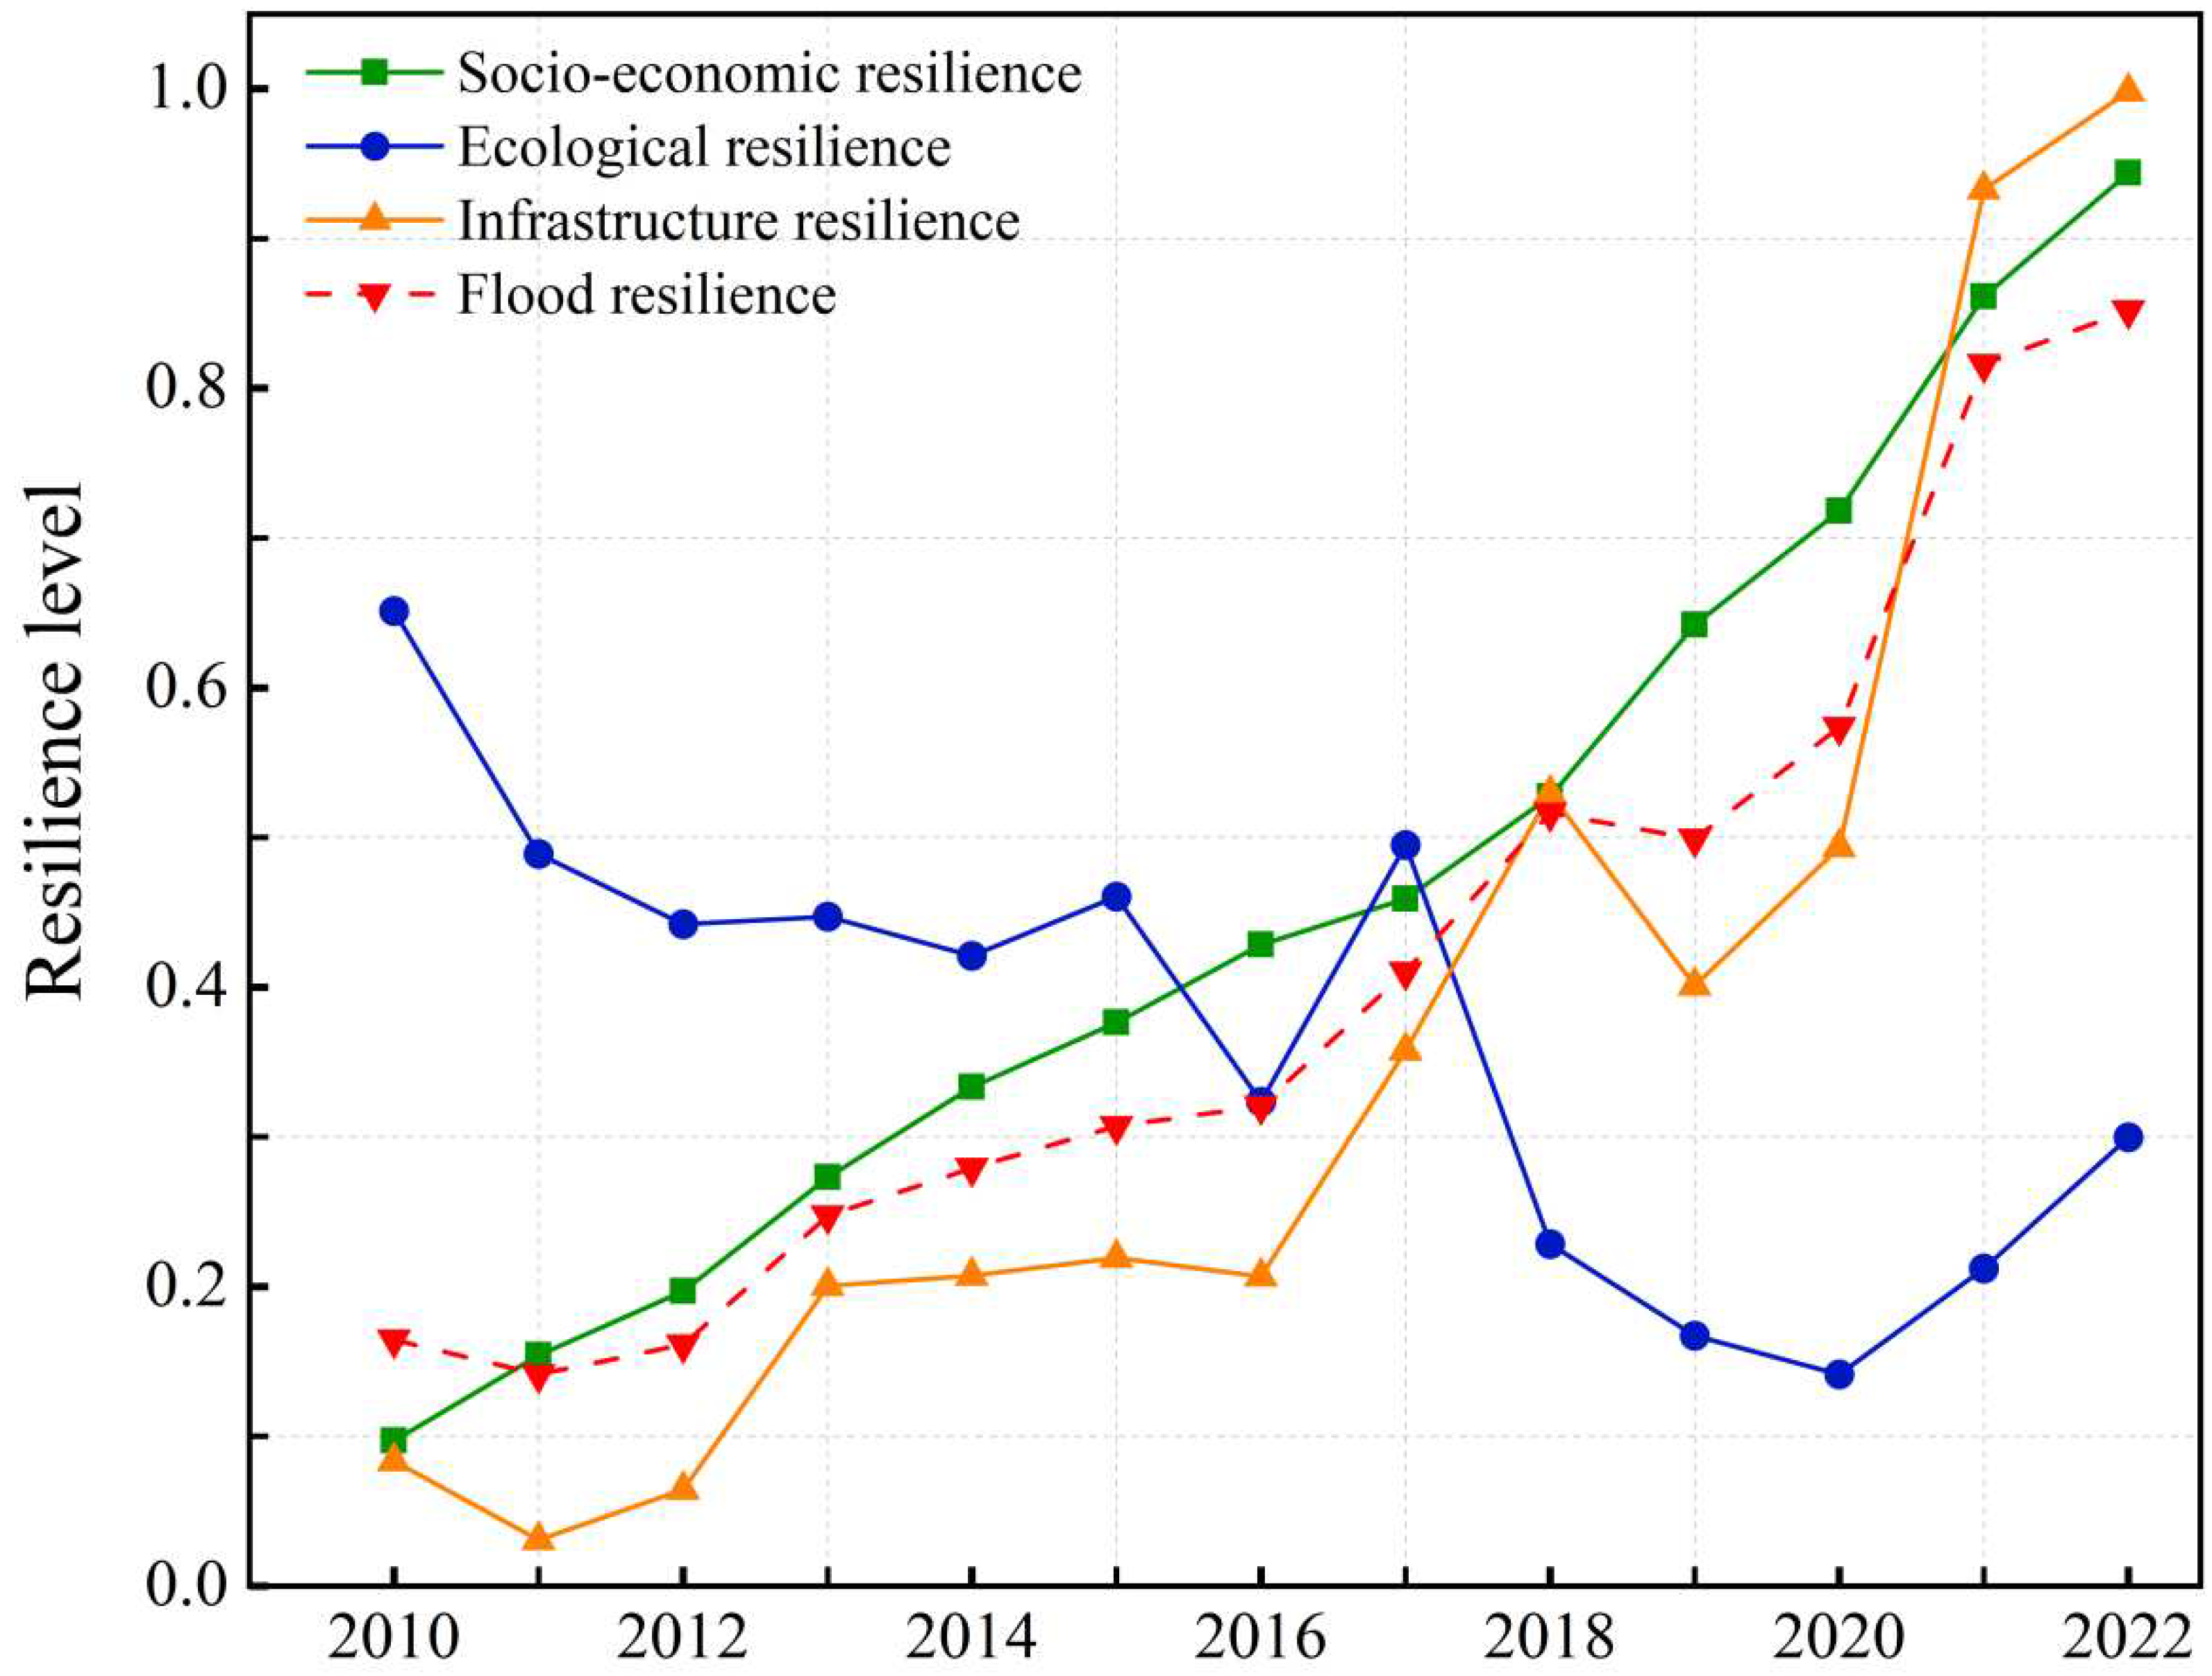
Figure 5.
Change of gray correlation degree of UFR index in Yingtan City from 2010 to 2022.
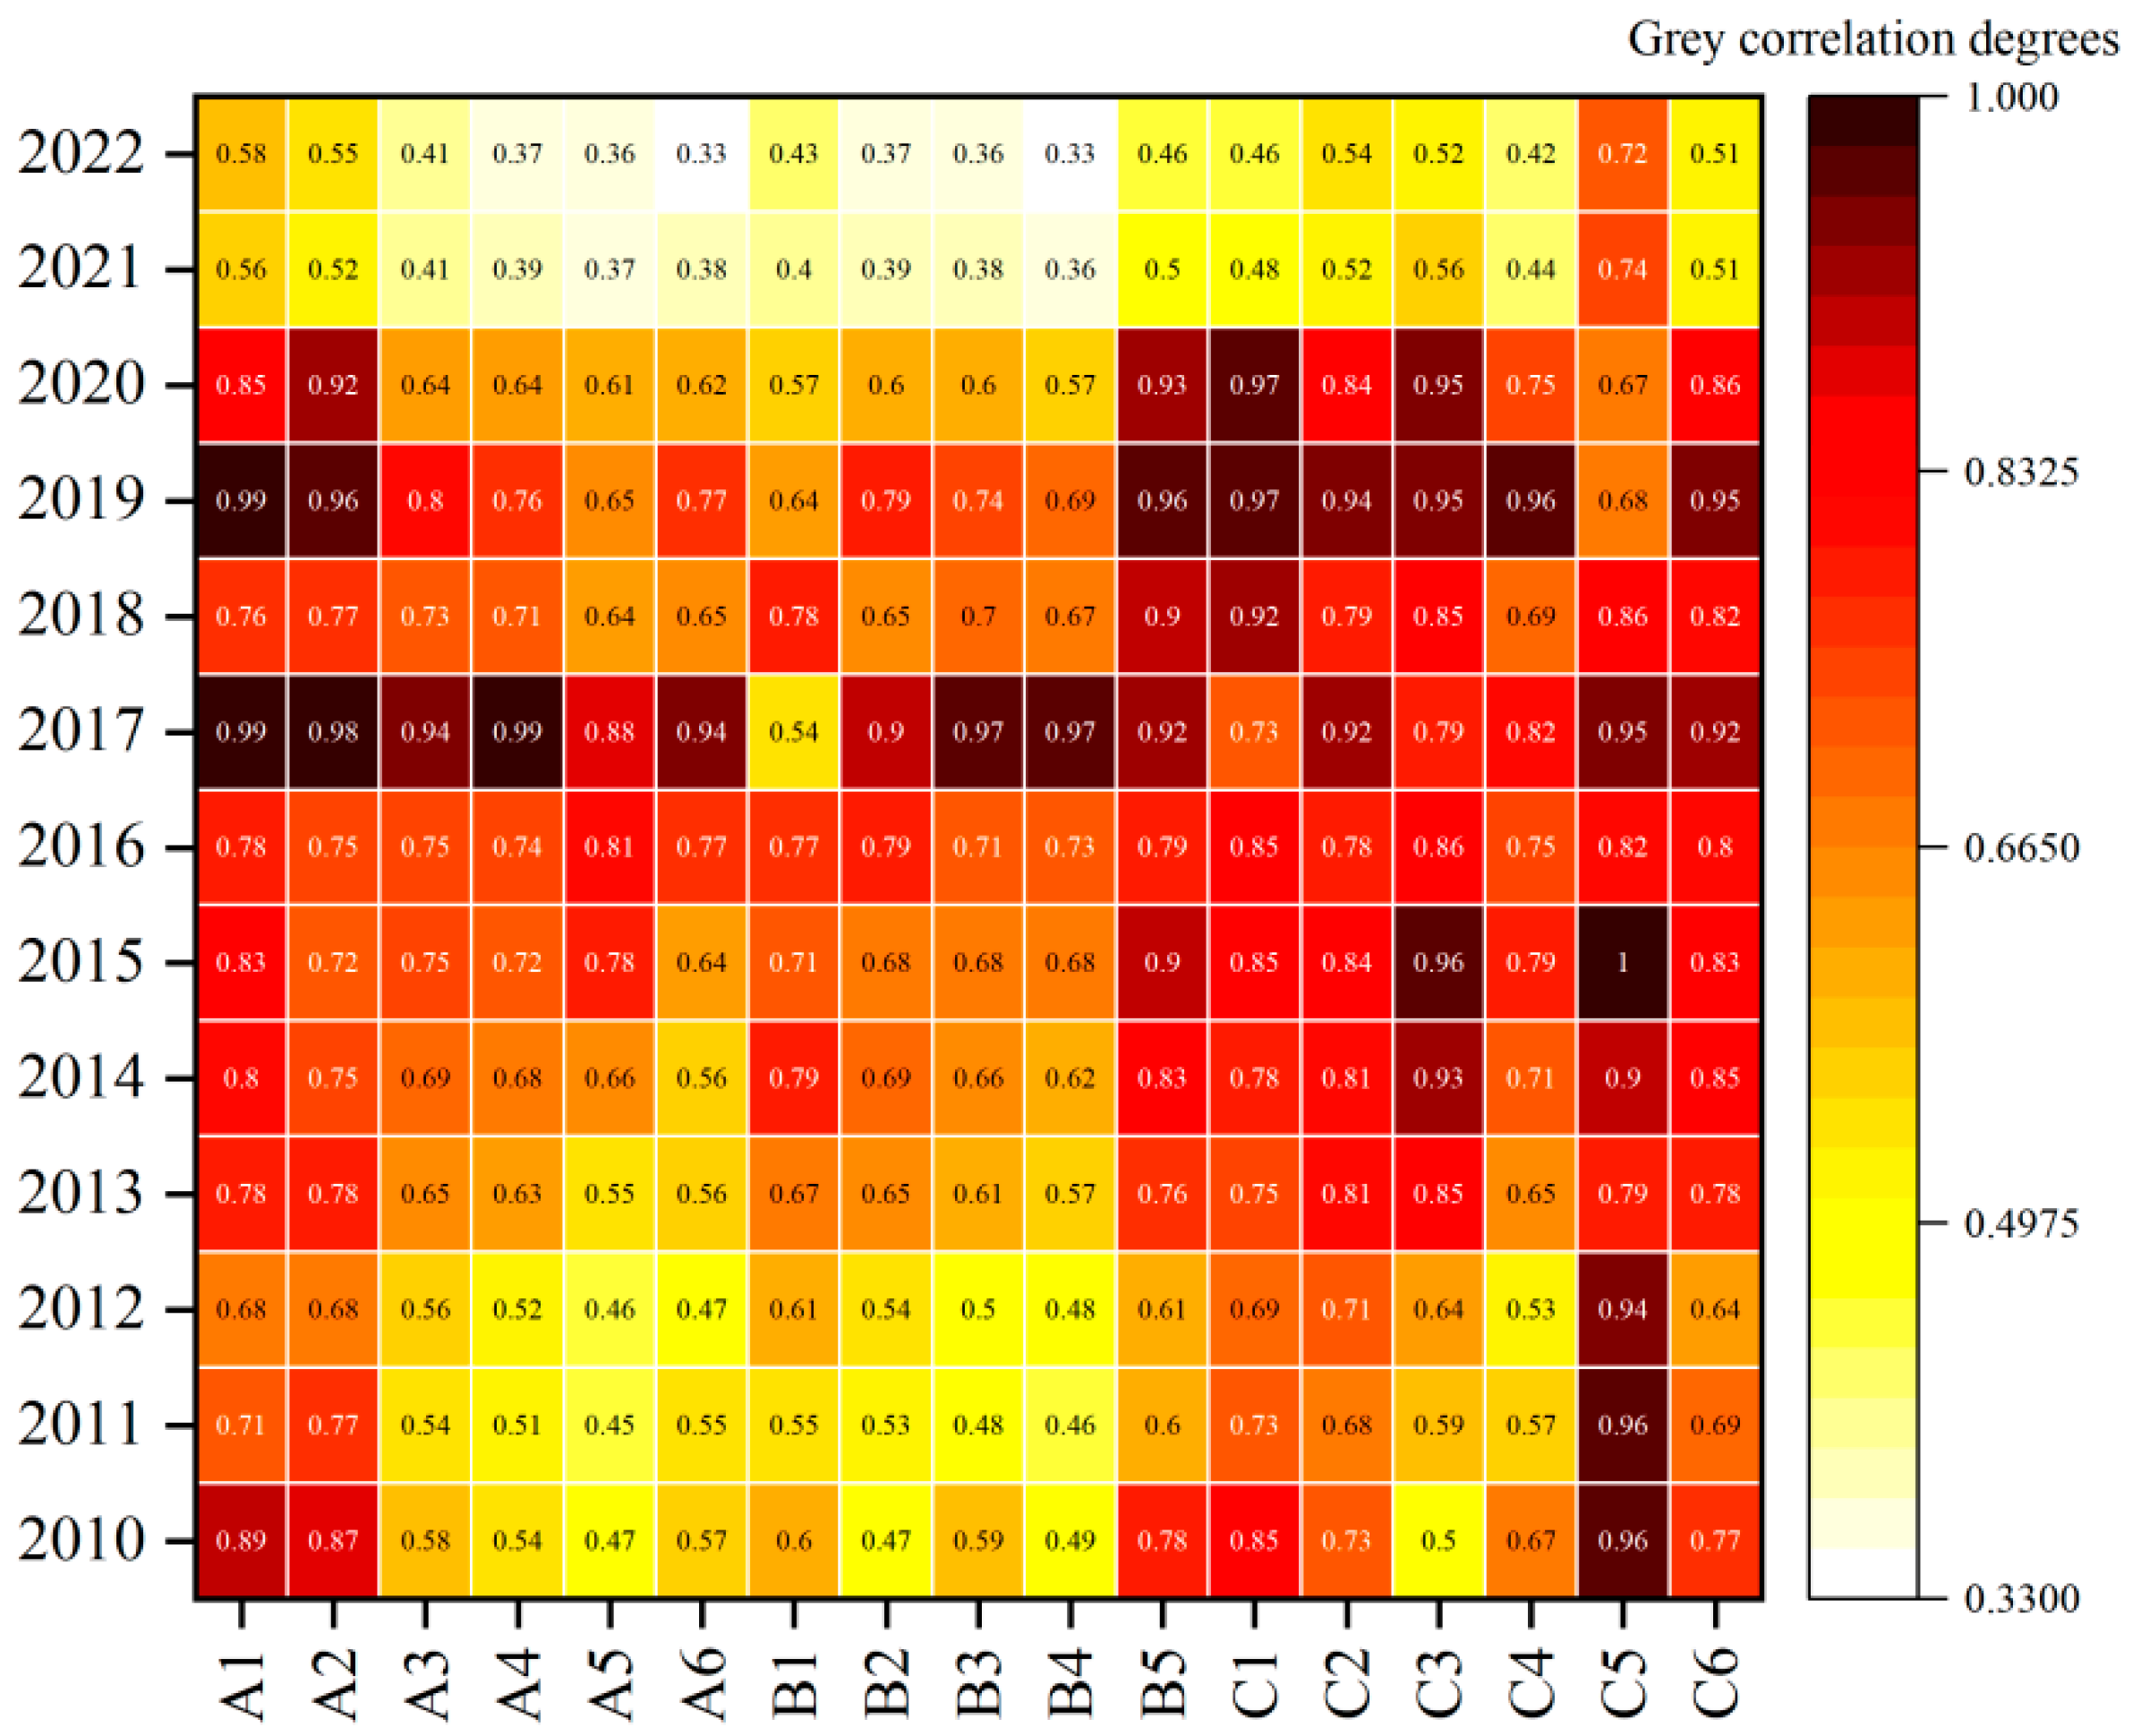

Table 1.
Evaluation index system of UFR of Yingtan City.
| Target Layer | Criterion Layer | Index Layer | Unit | Serial Number | Nature |
|---|---|---|---|---|---|
| Urban flood resilience | Socio-economic resilience (A) | Per capital GDP | RMB/person | A1 | + |
| Local fiscal expenditure | ten thousand RMB | A2 | + | ||
| Number of healthcare workers per 10 000 population | person | A3 | + | ||
| Percentage of population aged over 60 and under 18 | % | A4 | - | ||
| Unemployment rate | % | A5 | - | ||
| Density of population | persons/km2 | A6 | - | ||
| Ecological resilience (B) | Per capita public green areas | m2 | B1 | + | |
| Green coverage rate of built-up area | % | B2 | + | ||
| Centralized treatment rate of sewage treatment plant | % | B3 | + | ||
| Surface area of lakes and rivers | km2 | B4 | + | ||
| Land development intensity | % | B5 | - | ||
| Infrastructure resilience (C) | Number of hospital beds per 10 000 population | sheet | C1 | + | |
| Per capita refuge area | m2 | C2 | + | ||
| Density of road network in built district | km/km2 | C3 | + | ||
| Communication coverage | % | C4 | + | ||
| Density of sewers in built district | km/km2 | C5 | + | ||
| Central city pumping capacity | m3/s | C6 | + |
Table 2.
Classification of flood resilience index of Yingtan City in 2010.
| Secondary Index | Unit | Level 1 | Level 2 | Level 3 | Level 4 | Level 5 |
|---|---|---|---|---|---|---|
| Per capita GDP (A1) | Yuan/person | 5304~19750 | 19750~33137 | 33137~52480 | 52480~83425 | 83425~175125 |
| Local fiscal expenditure (A2) | 100 million Yuan | 12.19~173.76 | 173.76~403.33 | 403.33~977.32 | 977.32~2061.51 | 2061.51~3302.89 |
| Number of healthcare workers per 10 000 population (A3) | person | 0~25 | 25~30 | 30~35 | 35~40 | >40 |
| Percentage of population aged over 60 and under 18 (A4) | % | >25 | 20~25 | 15~20 | 10~15 | 0~10 |
| Unemployment rate (A5) | % | 16.77~27.86 | 7.85~16.77 | 4.59~7.85 | 2.81~4.59 | 0~2.81 |
| Density of population (A6) | person/km2 | 8409~15217 | 5883~8409 | 3671~5883 | 1893~3671 | 137~1893 |
| Per capita public green areas (B1) | m2 | 0.43~7.11 | 7.11~11.21 | 11.21~15.50 | 15.50~23.30 | 23.30~41.92 |
| Green coverage rate of built-up area (B2) | % | 1.92~18.80 | 18.80~29.22 | 29.22~36.71 | 36.71~43.19 | 43.19~57.89 |
| Centralized treatment rate of sewage treatment plant (B3) | % | 0.27~28.84 | 28.84~52.28 | 52.28~71.34 | 71.34~86.35 | 86.35~100 |
| Surface area of lakes and rivers (B4) | km2 | 0~7 | 7~9 | 9~11 | 11~13 | >13 |
| Land development intensity (B5) | % | 15.75~41.67 | 7.23~15.75 | 2.82~7.23 | 1.05~2.82 | 0.02~1.05 |
| Number of hospital beds per 10 000 population (C1) | sheet | 12.72~24.14 | 24.14~32.91 | 32.91~45.51 | 45.51~64.67 | 64.67~110.85 |
| Per capita refuge area (C2) | m2 | 0~0.5 | 0.5~1.5 | 1.5~2.5 | 2.5~3.5 | >3.5 |
| Density of road network in built district (C3) | km/km2 | 1.26~4.99 | 4.99~7.09 | 7.09~9.80 | 9.80~14.38 | 14.38~23.60 |
| Communication coverage (C4) | % | 50~60 | 60~70 | 70~80 | 80~90 | 90~100 |
| Density of sewers in built district (C5) | km/km2 | 0~4.94 | 4.94~8.13 | 8.13~12.11 | 12.11~20.45 | 20.45~40.76 |
| Central city pumping capacity (C6) | m3/s | 0~2 | 2~10 | 10~50 | 50~200 | >200 |
Table 3.
Index level values.
| Index Level | A1 | A2 | A3 | A4 | A5 | A6 | B1 | B2 | B3 | B4 | B5 | C1 | C2 | C3 | C4 | C5 | C6 |
|---|---|---|---|---|---|---|---|---|---|---|---|---|---|---|---|---|---|
| I | 1 | 1 | 1 | 1 | 1 | 1 | 1 | 1 | 1 | 1 | 1 | 1 | 1 | 1 | 1 | 1 | 1 |
| II | 2 | 2 | 2 | 2 | 2 | 2 | 2 | 2 | 2 | 2 | 2 | 2 | 2 | 2 | 2 | 2 | 2 |
| III | 3 | 3 | 3 | 3 | 3 | 3 | 3 | 3 | 3 | 3 | 3 | 3 | 3 | 3 | 3 | 3 | 3 |
| IV | 4 | 4 | 4 | 4 | 4 | 4 | 4 | 4 | 4 | 4 | 4 | 4 | 4 | 4 | 4 | 4 | 4 |
| V | 5 | 5 | 5 | 5 | 5 | 5 | 5 | 5 | 5 | 5 | 5 | 5 | 5 | 5 | 5 | 5 | 5 |
Table 4.
Relative proximity of flood resilience ratings.
| UFR Rating | Di- | Di+ | Ci |
|---|---|---|---|
| I | 0 | 0.1532 | 0 |
| II | 0.0383 | 0.1149 | 0.2500 |
| III | 0.0766 | 0.0766 | 0.500 |
| IV | 0.1149 | 0.0383 | 0.7500 |
| V | 0.1532 | 0 | 1 |
Table 5.
UFR grade standard.
| UFR Rating | Ci |
|---|---|
| I | 0≤Ci<0.25 |
| II | 0.25≤Ci<0.5 |
| III | 0.5≤Ci<0.75 |
| IV | 0.75≤Ci<1 |
| V | Ci=1 |
Table 6.
Gray correlation degree of socio-economic resilience.
| Index | Gray Correlation Degree of Rising Period(2010-2022) |
|---|---|
| Per capita GDP (A1) | 0.78 |
| Local fiscal expenditure (A2) | 0.77 |
| Number of healthcare workers per 10 000 population (A3) | 0.65 |
| Percentage of population aged over 60 and under 18 (A4) | 0.63 |
| Unemployment rate (A5) | 0.59 |
| Density of population (A6) | 0.60 |
Table 7.
Gray correlation degree of ecological resilience.
| Index | Gray Correlation Degree of Rising Period(2010-2020) | Gray Correlation Degree of Declining Period(2020-2022) |
|---|---|---|
| Per capita public green areas (B1) | 0.69 | 0.60 |
| Green coverage rate of built-up area (B2) | 0.72 | 0.68 |
| Centralized treatment rate of sewage treatment plant (B3) | 0.72 | 0.73 |
| The surface area of lakes and rivers (B4) | 0.75 | 0.82 |
| Land development intensity (B5) | 0.61 | 0.52 |
Table 8.
Gray correlation degree of infrastructure resilience.
| Index | Gray Correlation Degree of Slow-Rise Period(2010-2016) | Gray Correlation Degree of Choppy Period(2016-2020) | Gray Correlation Degree of Rapid- Rise Period(2020-2022) |
|---|---|---|---|
| Number of hospital beds per 10 000 population (C1) | 0.69 | 0.80 | 0.56 |
| Per capita refuge area (C2) | 0.68 | 0.82 | 0.58 |
| Density of road network in built district (C3) | 0.71 | 0.86 | 0.59 |
| Communication coverage (C4) | 0.62 | 0.77 | 0.51 |
| Density of sewers in built district (C5) | 0.81 | 0.88 | 0.70 |
| Central city pumping capacity (C6) | 0.68 | 0.83 | 0.58 |
Table 9.
UFR index values.
| Object | A1 | A2 | A3 | A4 | A5 | A6 | B1 | B2 | B3 | B4 | B5 | C1 | C2 | C3 | C4 | C5 | C6 |
|---|---|---|---|---|---|---|---|---|---|---|---|---|---|---|---|---|---|
| U1 | 2 | 1 | 3 | 1 | 4 | 4 | 3 | 5 | 4 | 4 | 5 | 2 | 4 | 2 | 1 | 1 | 3 |
| U2 | 3 | 1 | 3 | 1 | 3 | 3 | 3 | 4 | 5 | 4 | 5 | 2 | 5 | 1 | 3 | 1 | 3 |
| U3 | 4 | 1 | 3 | 1 | 4 | 4 | 4 | 5 | 5 | 3 | 5 | 4 | 5 | 3 | 5 | 4 | 4 |
Table 10.
Results of relative proximity calculations.
| Object | Di- | Di+ | Ci |
|---|---|---|---|
| U1 | 0.0582 | 0.1110 | 0.3439 |
| U2 | 0.0673 | 0.1022 | 0.3971 |
| U3 | 0.0960 | 0.0624 | 0.6061 |
Disclaimer/Publisher’s Note: The statements, opinions and data contained in all publications are solely those of the individual author(s) and contributor(s) and not of MDPI and/or the editor(s). MDPI and/or the editor(s) disclaim responsibility for any injury to people or property resulting from any ideas, methods, instructions or products referred to in the content. |
© 2024 by the authors. Licensee MDPI, Basel, Switzerland. This article is an open access article distributed under the terms and conditions of the Creative Commons Attribution (CC BY) license (https://creativecommons.org/licenses/by/4.0/).
Copyright: This open access article is published under a Creative Commons CC BY 4.0 license, which permit the free download, distribution, and reuse, provided that the author and preprint are cited in any reuse.


