Submitted:
19 April 2025
Posted:
21 April 2025
You are already at the latest version
Abstract
This paper examines the impact of climate risks on urban economic resilience, using panel data from Chinese cities between 2009 and 2022. A multidimensional indicator system, encompassing recovery resilience, adaptive resilience, and transformative innovation capacity, is developed to identify how climate risks negatively affect urban economic resilience. The results show that climate risks weaken resilience by reducing population size and destabilizing financial systems. Additionally, these risks have significant spatial spillover effects, extending from local areas to neighboring cities through regional economic networks, with particular impact on geographically adjacent cities. Heterogeneity analysis indicates that developed eastern cities, central cities, and resource-based cities are more vulnerable to climate risks, while cities in central and western regions and non-central cities show greater resilience. The paper proposes policy recommendations to strengthen urban resilience, including investment in climate-adaptive infrastructure, promoting economic diversification, establishing cross-regional climate risk management, developing green finance systems, and raising public awareness of climate risks.
Keywords:
Climate risk
; Economic resilience
; Spatial spillover
; Population size
; Financial stability
I. Introduction
Since the 1990s, China has experienced rapid economic growth and has now become the world’s second-largest economy. However, the rapid processes of industrialization and urbanization have also led to increasingly severe ecological issues and climate risks. According to data from the United Nations, eight out of 54 major natural disasters worldwide in the 20th century occurred in China, highlighting the significant impact of climate risks on China’s socio-economic development. In particular, the “China Climate Change Blue Book (2024),” published in 2024, points out that China’s climate risk index has continuously risen since 1961, with a notably high increase since the mid-1990s, aligning with the global trend of climate warming. In 2022, the Chinese government released the “National Climate Change Adaptation Strategy 2035,” which explicitly proposes enhancing the capacity of society to cope with climate change and building an adaptive society by 2035. This indicates that climate risks are not only an ecological challenge but also a significant test for China’s high-quality economic development, placing higher demands on the resilience of urban economic systems [2].
In recent years, the frequency and intensity of extreme weather events brought about by climate change have significantly increased, with their impact on urban economic systems being particularly notable. For example, extreme climate events such as heavy rainfall, heatwaves, and droughts have severely affected infrastructure and economic activities. According to the “Global Annual to Decadal Climate Update” released by the World Meteorological Organization (WMO) in 2024, climate change is approaching the risk limits set by the Paris Agreement. In the same year, national natural disasters affected 32.38 million people, with direct economic losses amounting to 93.16 billion yuan. These phenomena indicate that climate change has become a critical factor affecting the stability and sustainability of urban economies [8].
In the face of increasing external shocks and potential risks, the economic systems of different cities show significant differences. Some cities can quickly recover from shocks and maintain economic vitality, while others may suffer long-term damage, demonstrating weaker disaster resilience. Has the increasing climate risk had a significant impact on them? The term “resilience,” initially a concept in physics, refers to a system’s ability to return to its original state after a shock; in economics, it is extended to refer to the ability of an economic system to resist external shocks and achieve recovery, adaptation, and transformation [4,22]. However, existing research has paid little attention to how climate risks specifically affect urban economic resilience and the mechanisms behind this, lacking quantitative analysis and empirical research, which makes it difficult to provide systematic references for practical policy design.
To fill this research gap, this paper explores the impact of climate risks on urban economic resilience based on panel data from Chinese cities between 2009 and 2022. The contributions of this paper are as follows: first, unlike previous studies that focus on a single dimension of economic resilience or macroeconomic impacts, this paper innovatively constructs a multidimensional economic resilience index system and reveals the multi-path impact of climate risks on urban economic resilience. Second, although existing literature has focused on the direct impact of climate risks on specific cities, few studies have explored the cross-city and regional spatial spillover effects. This paper quantifies the significant negative impact of climate risks on the economic resilience of neighboring cities through spatial Durbin models, considering the geographic, economic, and proximity dimensions. Finally, compared to studies focusing on a single region, this paper uses a broader city panel dataset to analyze the differentiated impact of climate risks on cities in different regions and types, providing a novel research perspective.
The structure of the paper is as follows: Section 2 presents a literature review on climate risks and economic resilience; Section 3 introduces the theoretical framework and research hypotheses; Section 4 describes the empirical model and research methods; Section 5 presents the empirical results and analysis; Section 6 provides conclusions and policy implications
II. Literature Review
2.1. Literature Review on Climate Risk Research
With the continuous increase in human activities, particularly the expansion of economic activities, the sustainability of the environment is facing profound impacts [43]. This imbalanced development model has further triggered a series of global climate issues. As a future uncertainty brought about by climate change and its negative effects, climate risk has become an important research topic in the global academic community. Climate risks are primarily divided into two major categories: transition risk and physical risk. Transition risk refers to the long-term economic impacts arising from policy changes, technological innovations, and market sentiment fluctuations during the process of society transitioning to a low-carbon economy or sustainable development [24]. For example, Campiglio pointed out that adjustments in climate policies may lead to increased operational costs for businesses and a loss of asset value [6]. In contrast, physical risk refers to the short-term and direct economic losses caused by extreme climate events or natural disasters, which typically have more significant destructive impacts on the economic system [7]. Typical physical risks include sea-level rise, extreme heat, storms, and floods, all of which pose major challenges to economic infrastructure and supply chains.
In the economic field, physical climate risks have profound effects on financial markets, business operations, and investment decisions. For instance, Hu & Borjigin examined the volatility of climate risk in the futures market, Lin & Wu explored the impact of physical risks on financial products, and Campiglio analyzed the effects of climate risk on asset management and portfolio optimization [6,13,19]. At the macroeconomic level, physical risks have had widespread and far-reaching impacts on agricultural economies, external debt levels, and international trade [3,9,23]. In addition, Carleton suggested that the frequent occurrence of extreme climate events could further exacerbate global economic instability, particularly in regions with more vulnerable economies [7]. Based on past studies, physical risks have more directly affected the stability of economic systems, and under the backdrop of frequent extreme weather events, their impact has been increasing. Therefore, this paper focuses on the study of physical risks and their impact on economic resilience, aiming to reveal how to enhance the adaptive and recovery capacities of economic systems when facing natural disasters and extreme climate events.
2.2. Literature Review on Economic Resilience Research
The term “resilience” originates from physics and refers to the ability of materials to absorb energy during deformation and fracture. In economics, “economic resilience” is used to describe the ability of an economic system to resist and adjust its development path when faced with shocks [4,22]. In past studies on the factors affecting economic resilience, both theoretical and empirical research have been emphasized. Theoretically, Sun & Sun reviewed relevant concepts and proposed research dimensions based on China’s context [30]; Liu et al. further clarified the connotation of the economic resilience concept [21]. Empirically, scholars have explored factors influencing economic resilience from perspectives such as macroeconomics [22], industrial diversity [39], and digital finance [39]. However, most past research on economic resilience has focused on macroeconomics or specific industries, with relatively limited analysis of the economic resilience of cities as complex dynamic systems. Furthermore, static analytical methods are often employed, making it difficult to fully capture the dynamic adjustment process of economic resilience in the context of multidimensional shocks.
Research on the impact of climate risk on economic resilience has found that physical risks affect economic resilience through various pathways. On one hand, extreme climate events directly damage infrastructure and production systems, weakening the short-term resilience of economic systems. For example, Carleton pointed out that natural disasters often interrupt supply chains and logistics systems, causing profound effects on economic activities [7]. On the other hand, transition risks also affect economic resilience through indirect pathways, such as market fluctuations, declining investment confidence, and long-term policy adjustments [24]. In studies on the impact of climate risk on urban economies, Zhao et al. explored the effects of climate change on urban economic resilience [45], Liu examined the role of smog in urban economic resilience [21], and Wu, Z et al. assessed the economic resilience performance of the Yellow River Basin under climate change [38]. Additionally, Liu et al. studied the negative impact of air pollution on urban economic resilience, emphasizing the importance of environmental governance in enhancing urban resilience [21].
While existing research has revealed some mechanisms by which climate risk impacts economic resilience, several gaps remain. First, the dynamic relationship between climate risk and economic resilience has not been fully explored, especially in the context of frequent extreme weather events. Second, systematic studies on the heterogeneous impacts of climate risks on urban economic resilience are lacking. Finally, most current research has focused on the impact of physical climate risks on macroeconomics or specific industries, with limited exploration of the performance of urban economic resilience, a complex dynamic system, under physical climate risk shocks. This paper aims to fill this research gap by combining theoretical analysis and empirical research to reveal the mechanisms through which physical climate risks impact urban economic resilience and to provide scientific evidence for policy-making.
III. Theoretical Analysis and Research Hypotheses
As global climate change intensifies, climate risks not only profoundly affect the ecological environment but also pose a significant threat to the economic structure and stability of cities. Specifically, the impact of climate risks on key areas such as urban population size and the stability of financial markets is particularly prominent [16]. These areas, being fundamental components of urban economies, are directly linked to the core capacity of urban economic resilience. Therefore, this study constructs a framework for urban economic resilience based on recovery capacity, adaptive capacity, and transformative innovation capacity [44]. Existing literature indicates that climate risks primarily affect urban economic resilience through several pathways:
3.1. Direct Impact Mechanisms of Climate Risks on Urban Economic Resilience
Currently, the direct impact of climate risks on cities is primarily manifested in the destruction of critical economic and infrastructure systems. Extreme weather events such as hurricanes, floods, and droughts significantly disrupt the normal operation of infrastructure systems, including transportation, energy supply, and water systems. These disruptions weaken the city’s response and recovery capacities, delivering substantial shocks to economic productivity and residents’ quality of life [29]. Specifically, interruptions in production activities may hinder business operations and lead to economic stagnation. Concurrently, business losses may increase unemployment rates and undermine the ability to meet basic living needs for residents, further exacerbating social instability. This social instability, in turn, diminishes the economic system’s ability to recover from external shocks.
Additionally, the losses caused by climate risks will increase the financial burden on governments, forcing them to allocate large amounts of funds for post-disaster reconstruction and climate adaptation measures. This limits the flow of funds and resource allocation to other economic sectors. Such fiscal pressure not only affects urban economic resilience in the short term but may also erode the city’s innovation capacity and economic growth potential in the long run [27]. Cities with relatively weak infrastructure may fall into prolonged economic distress, hindering their economic development and the achievement of sustainable development goals. This amplifies local fiscal pressures, forcing governments to cut budgets for key sectors such as education and healthcare, impacting long-term urban development and the economic resilience system [28]. Therefore, climate risks not only cause direct damage to the city’s critical infrastructure but also generate profound effects on economic resilience and social stability through a series of cascading reactions.
Hypothesis 1:
Climate risks negatively impact urban economic resilience through direct mechanisms.
3.2. Pathways of Climate Risk Impact on Urban Economic Resilience
The impact of climate risks on urban economic resilience primarily occurs through two main pathways: reducing urban population size and disrupting urban financial stability. Extreme weather events weaken a city’s economic resilience by disrupting various sectors, including population, infrastructure, and financial systems, which in turn affect its capacity to cope with and recover from external shocks. The specific mechanisms of these pathways are illustrated in Figure 1.
Impact on Urban Population and Labor Force: The economic vitality and resilience of cities largely depend on stable labor forces and a healthy population size. Densely populated areas tend to demonstrate stronger resilience, which positively influences regional economic resilience [32]. However, climate risks can reduce population size by altering mobility and living conditions, thus weakening urban economic resilience. Extreme weather events, for instance, damage urban living environments, compelling large numbers of residents to migrate, especially from frequently disaster-prone areas. Long-term adverse climate conditions force residents to relocate to safer regions [5]. Large-scale population outflows not only reduce labor supply but also shrink the consumer market, weakening the economic vitality of the city and increasing vulnerability during economic crises [41]. Furthermore, climate-related physical risks may disrupt businesses dependent on natural resources or logistics, leading to transportation system breakdowns and business shutdowns, which in turn drive up unemployment rates, reduce resident income, and shrink consumer spending [1]. By undermining population structure and labor markets, climate risks weaken urban economic resilience, making it more difficult for cities to demonstrate recovery capacity in the face of future external shocks.
Impact on Urban Financial Stability: Financial stability is a core factor in urban economic resilience, as it reduces economic volatility, supports innovation, and eliminates policy distortions, thereby significantly enhancing regional resilience [34]. However, climate risks increase uncertainty and vulnerability in financial systems and economic operations. Firstly, climate risks lower investor confidence, exacerbating fluctuations in financial markets. Companies facing operational interruptions and losses due to climate events may struggle to secure financial support, leading to financial crises or even bankruptcy. This credit tightening effect not only affects the impacted businesses but also spreads to the broader urban economy, making the financial system more fragile [31]. Moreover, the risks associated with climate events drive up insurance costs, leading to higher premiums. This increases operational costs for businesses, making insurance unaffordable for some enterprises and households, thus exposing them to greater risks and making it impossible to ensure asset security when facing future shocks. The instability in the insurance market also affects bank loans and debt markets, further weakening the city’s economic resilience.
In summary, climate risks reduce urban economic resilience by decreasing population size and disrupting financial stability. Population declines lead to a decrease in economic vitality, labor market contraction, and increased unemployment, which limits the economy’s ability to recover quickly from external shocks. Meanwhile, fiscal pressure, financial volatility, and high insurance costs weaken the city’s capacity to respond to future risks, hindering economic stability and long-term development.
Hypothesis 2:
Climate risks negatively affect urban economic resilience by reducing population size and disrupting financial stability.
3.3. Spatial Spillover Effects of the Negative Impact of Climate Risks on Urban Economic Resilience
Climate risks have far-reaching impacts on the economic resilience of other cities through the transmission effects within economic networks. Extreme weather events such as hurricanes, floods, or droughts typically damage the infrastructure and economic activities of affected cities, and these impacts quickly spread through regional economic linkages. For example, supply chain disruptions may lead to shortages of raw materials and intermediate goods, hindering production in businesses reliant on affected cities. Logistics delays may disrupt interregional flows of goods, causing market supply-demand imbalances. The globalization of capital flows further exacerbates this transmission effect. When investors withdraw capital due to economic uncertainties in affected cities, capital outflows may destabilize the financial systems of other cities, thereby weakening their economic resilience [26,37].
Furthermore, climate risks exert additional pressure on other cities through the diffusion effects within social systems, further diminishing economic resilience. Extreme weather events typically trigger population migration and resource competition, particularly when residents of disaster-stricken cities move to neighboring regions due to deteriorating living conditions. This migration raises the demand for housing, places additional strain on infrastructure, and increases the cost of living in receiving cities. Such pressure compounds the burden on these cities. Labor force loss may further reduce regional productivity. In addition, financial linkages amplify the social diffusion effect, as financial instability in the market is transmitted through regional banking networks, affecting the financing environment of other cities [17,37]. Taken together, climate risks have significant impacts on the economic resilience of neighboring cities through both economic and social spillover mechanisms.
Hypothesis 3:
Climate risks negatively affect the economic resilience of other cities through spatial spillover effects.
IV. Research Design
4.1. Sample Selection and Data Sources
Based on the availability of secondary indicators for climate risk and economic resilience, this study selects an initial sample of 168 prefecture-level cities from the period of 2009 to 2022. The climate risk data is derived from the National Meteorological Centre of China, while data on economic resilience and related control variables are sourced from the “China City Statistical Yearbook.” To ensure data integrity and the accuracy of the analysis, the original data were processed as follows: First, linear interpolation was employed to address missing data for some samples; second, samples with significant missing data were excluded; and third, extreme values in the top and bottom 1% and 99% of the main variables were winsorized. After these data treatments, a final sample of 158 prefecture-level cities was obtained, resulting in a total of 2,212 “city-year” observations.
4.2. Variable Measurement
- a.
- Explanatory Variable: Climate Risk Index (CRI)
The climate risk variable is derived using the methodology of Guo et al. (2024), incorporating four sub-indicators: extreme low-temperature days (LTD), extreme high-temperature days (HTD), extreme rainfall days (ERD), and extreme drought days (EDD). The specific processing steps are as follows: first, observations with significant data gaps are removed from the sample; second, historical distribution characteristics for each indicator are calculated from January 1 1973, to December 31, 1992; third, the frequency and types of extreme weather events at local observation stations from 2009 to 2022 are recorded; finally, the annual extreme weather days are aggregated at the regional level to create a comprehensive Climate Risk Index (CRI), as shown in Table 1. To ensure interpretability, the climate risk index is scaled down by a factor of 100.
- b.
- Dependent Variable: Urban Economic Resilience Index (UERI)
Urban economic resilience index (UERI) is defined as a city’s ability to self-recover and dynamically adapt in response to external shocks (Martin et al., 2016). This concept encompasses resistance, recovery, and adjustment capabilities. Based on this definition and existing literature, this study measures economic resilience across three dimensions: resistance and recovery capacity (Rel), adaptive and adjustment capacity (Ada), and innovation and transformation capacity (Enpu). Eleven secondary indicators are selected for these dimensions, with indicator weights calculated using the entropy weighting method to construct a comprehensive Urban Economic Resilience Index (UERI). Table 2 presents the selected indicators and weights for each dimension.
- c.
- Mediating Variables
➀Urban Population Size (Psize): The size of the urban population serves as a crucial foundation for urban economic development and a key factor in enhancing economic resilience. Following the method of Gao, this study uses the logarithmic form of the year-end total urban population (LogPsize) to represent city population size [11]. This transformation effectively reduces the influence of outliers on the analysis and better reflects the general characteristics of urban population scale.
➁Urban Financial Stability (Fin): Urban financial stability measures a city’s financial system’s capacity to operate under external shocks, especially extreme climate events. This resilience is primarily reflected in the banking system, capital markets, and insurance markets. Drawing on the approach of Xie et al., this study measures financial development level and stability by the ratio of year-end financial institution loan balances to the regional GDP [40].
- d.
- Control Variables
To more comprehensively explore the impact of climate risk on urban economic resilience, this study draws on the control variable design from Xu & Zhang and Zhou et al. [39,47]. Five control variables are established:
➀Urban Economic Density (Den): Urban economic density reflects the spatial concentration of economic activities. This study represents economic density as the ratio of regional GDP to urban land area.
➁Urban Entrepreneurial Activity (Live): Urban entrepreneurial activity indicates the level of dynamism among economic entities in the city. This is measured by the ratio of private and individual business employees to the total urban population.
➂Urban Infrastructure Level (Fund): The level of infrastructure in a city reflects the completeness of its foundational facilities. This study uses per capita road area as a measure of urban infrastructure level.
➃Urban Foreign Capital Dependency (Export): Foreign capital dependency indicates the extent to which a city’s economy relies on international capital. This is measured by the proportion of actual utilized foreign capital to GDP, reflecting the city’s dependence on foreign investment.
➄Urban Human Capital Level (Hr): Human capital level is a key indicator of urban workforce quality. This study uses the ratio of enrolled undergraduate and vocational students to the permanent population to represent urban human resource quality.
The data for the indicators are sourced from the China City Statistical Yearbook. The definitions of the variables used in this study are provided in Table 3, and the descriptive statistics for the main variables are shown in Table 4. The descriptive statistics reveal significant heterogeneity among the sample cities with respect to the main variables in the study. Specifically, the mean value of urban economic resilience (CRI) is 0.097, with a standard deviation of 0.0947. The maximum and minimum values are 0.9878 and 0.0118, respectively, reflecting notable disparities in the levels of economic resilience across different cities. The mean value of climate risk (UERI) is 3.3189, with a standard deviation of 0.2408, indicating that most cities experience climate risk within a narrow range, although some cities are more severely impacted by extreme climate events. The resilience sub-dimensions (Rel, Ada, Enpu) exhibit relatively low mean values, suggesting that cities generally show weaknesses in recovery and resistance, adaptive capacity, and transformational innovation. Control variables, such as urban entrepreneurial vitality (Live), infrastructure development level (Fund), and economic density (Den), display considerable variation, indicating significant differences in economic development conditions across cities, which supports the subsequent empirical analysis.
4.3. Econometric Model Specification
- a.
- Baseline Regression Model
To verify the impact of climate risk on urban economic resilience, this study employs a two-way fixed effects model, structured as follows:
where represents the city, denotes the year, indicates the economic resilience of city in year and represents the climate risk level for city in year The control variables include entrepreneurial activity (), infrastructure development level (), economic density (), foreign capital dependency (), and human capital level () in city during year
- b.
- Mediation Mechanism Model
To examine the mechanisms through which climate risk impacts urban economic resilience, this study draws on Jiang and adopts a two-step model specification as follows [14]:
Here, represents the mediation variables, specifically including urban population size () and financial stability (). Other variables remain consistent with Model (1). The coefficient of if significantly negative, would indicate that climate risk reduces urban economic resilience by decreasing both urban population size and financial system stability, thus validating Hypothesis 2.
- c.
- Spatial Durbin Model (SDM)
To capture the spatial spillover effects of climate risk on urban economic resilience, this study extends Model (1) by introducing a spatial weight matrix and interaction terms among economic resilience, climate risk, and control variables, resulting in the following spatial Durbin model:
where represents the spatial autoregressive coefficient. If is significantly negative, it suggests that climate risk exhibits a spatial spillover effect on urban economic resilience. denotes the spatial weight matrix, which includes geographic, adjacency, and economic matrices. and capture the coefficients of the spatial interaction terms for the explanatory and control variables, respectively. Other variables remain consistent with Model (1) and are not further elaborated here.
V. Empirical Analysis
5.1. Baseline Regression Analysis
In the empirical analysis section, we first conduct a baseline regression analysis to verify whether climate risk suppresses urban economic resilience. Table 5 presents the regression results of baseline model (1), where Columns (1) to (4) show the estimates from the panel fixed-effects model, controlling for both city and time fixed effects but excluding other control variables.
Specifically, Column (1) reports the overall impact of climate risk on the urban economic resilience index, while Columns (2) to (4) explore the effects of climate risk on the three sub-indicators within the resilience capacity system: resistance and recovery capacity (Rel), regulation and adaptation capacity (Ada), and transformation and innovation capacity (Enpu). From these regression results, we can identify the varying impacts of climate risk on each resilience capacity.
In Columns (5) to (8), we further introduce control variables to examine whether the effects of climate risk on the resilience indicators change significantly after accounting for other influencing factors.
Based on regression results of Table 5, we preliminarily verify the significant negative impact of climate risk on urban economic resilience. Specifically, Column (1) reports the baseline regression result without including control variables, where the regression coefficient is -0.6010 and significant at the 5% level. This indicates that climate risk indeed has a significant suppressive effect on urban economic resilience. After introducing control variables, the result in Column (5) shows a regression coefficient of -0.5755, which remains significant. This finding demonstrates robustness and supports Hypothesis 1: climate risk has a direct negative impact on urban economic resilience.
Further, urban economic resilience is decomposed into Rel, Ada, and Enpu for regression analysis. Column (3) presents the impact of climate risk on urban adaptive and adjustment capacity, with a regression coefficient of -0.4552, significant at the 10% level. This suggests that climate risk weakens cities’ ability to adapt and adjust. The result reveals that cities face deficiencies in their adaptive and regulatory mechanisms when responding to climate change, which may hinder long-term economic adjustment and transformation goals.
The results in Column (4) indicate that climate risk also has a significant negative impact on urban innovation and transformation capacity. The regression coefficient is -0.3734 and significant at the 5% level. This suggests that climate risk not only weakens cities’ innovative capabilities but also constrains their potential for future economic transformation.
In Columns (5) to (8), we introduce control variables such as urban entrepreneurial activity, infrastructure development level, economic density, foreign capital dependency, and human capital level. The results show that the negative impact of climate risk on urban resilience remains significant, particularly regarding urban innovation and transformation capacity, where the coefficients remain negative and are significant at the 1% level. Overall, climate risk significantly weakens urban economic resilience, with its impact on innovation and transformation being the most pronounced, further supporting the validity of Hypothesis 1.
5.2. Robustness Tests
To ensure a more robust evaluation of the weakening effect of climate risk on urban economic resilience and to further investigate its related impacts, this study conducts robustness tests using the methods of replacing the explained variable, high-dimensional fixed effects, lagged explanatory variables, and subsample regressions. The results are shown in Table 6.
➀Method of Replacing the Explained Variable: In this test, the explained variable “urban economic resilience” is replaced with “high-quality urban economic development” (measured according to Zhou et al., 2021), and the regression results are presented in Column (1) of Table 6. The results indicate that even after substituting urban economic resilience with high-quality urban economic development, the regression coefficient of UERI remains significantly negative at the 5% level, demonstrating the robustness of the baseline regression results.
➁High-Dimensional Fixed Effects Method: To further control for unobservable provincial-level factors that vary over time (such as the impact of macroeconomic changes on urban economic resilience), this study incorporates province-year interaction fixed effects into the baseline regression model. The regression results are shown in Column (2) of Table 6. The results reveal that under the control of high-dimensional fixed effects, the negative impact of climate risk on urban economic resilience remains significant, confirming the robustness of the research conclusions under a higher-dimensional control framework.
➂Lagged Explanatory Variables Method: Considering the potential continuity and even long-term nature of the impact of climate risk on urban economic resilience, this study lags the climate risk variable by one period to examine the effect of current climate risk on urban economic resilience in the next period. The regression results are presented in Column (3) of Table 6. The findings indicate that after lagging the explanatory variable by one period, the regression coefficient of climate risk remains significantly negative at the 1% level, suggesting that climate risk has a persistent negative effect on urban economic resilience, further confirming its long-term obstructive effect.
➃Subsample Regression Method: Given the profound impact of the COVID-19 pandemic on urban economies, particularly in 2020 and thereafter, urban economic resilience during this period may have been affected by the pandemic rather than climate risk. To address this concern, this study excludes samples from 2020 and beyond and reruns the regression analysis. The results are presented in Column (4) of Table 6. The regression results show that even after removing pandemic-affected samples, the negative impact of climate risk on urban economic resilience remains significant, further supporting the robustness of the research conclusions. In summary, a series of robustness tests further validate the significant negative impact of climate risk on urban economic resilience.
5.3. Endogeneity Treatment
The study finds that climate risks significantly reduce urban economic resilience. Conversely, regions with lower economic resilience are more susceptible to severe impacts from climate risks or may consume substantial resources in response to such risks, further hindering resilience improvement. Therefore, a two-way causal endogeneity issue exists. To address the endogeneity problem stemming from this two-way causality, this paper employs the Instrumental Variable (IV) method and the Heckman two-stage method.
First, in the IV method, the PM2.5 index is selected as the instrumental variable. On one hand, the PM2.5 index serves as a crucial indicator for measuring urban climate risk. Over the past two decades, increasing concentrations of PM2.5 have been closely linked to the intensification of environmental stressors and climate-related risks. These elevated pollution levels have contributed to the exacerbation of global climate change, leading to more frequent and severe climate events, such as heatwaves, floods, and storms (Lim et al., 2020). As such, the PM2.5 index meets the relevance condition of an instrumental variable by having a strong and established relationship with the urban climate risk. On the other hand, PM2.5 does not directly affect urban economic resilience but may indirectly influence it through pathways such as resource misallocation and population scale, meeting the exclusivity condition. For example, persistent air pollution can drive population migration, alter labor force productivity, or disrupt economic activity by reducing quality of life or escalating health-related expenditures. Hence, the annual median of PM2.5 index is a valid instrumental variable because it satisfies both the relevance and exclusivity conditions, making it an appropriate tool for isolating the causal effect of urban climate risk on economic resilience in the analysis.
The IV regression results are presented in Table 7, Columns (1) and (2). The Cragg-Donald Wald F-statistic is 10.610, ruling out the possibility of weak instruments. The Kleibergen-Paap rk LM statistic is 6.623, with a p-value below 0.05, indicating that the instrumental variable does not suffer from identification issues. Overall, selecting PM2.5 as the instrumental variable is reasonable. The results further reveal that an increase in PM2.5 exacerbates climate risks. In the second-stage regression, the negative impact of climate risks on urban economic resilience remains significant.
Meanwhile, the degree of climate risk may vary across regions due to geographical differences. For example, desert and plateau areas often face more severe climate issues, which have a greater impact on transportation and infrastructure development, thereby exerting a more significant influence on urban economic resilience. This introduces a sample selection bias issue. To mitigate this bias, this paper employs the Heckman two-stage method. Specifically, variables such as urban entrepreneurial vitality (Live), infrastructure development level (Fund), economic density (Den), dependence on foreign capital (Export), and human capital level (Hr) are selected as the first-stage selection variables to estimate the influencing factors of urban economic resilience in the sample. The inverse Mills ratio (IMR), calculated in the first stage, is then included in the second-stage regression analysis. The regression results are shown in Table 7, Column (3). The coefficient of IMR is significant at the 5% level, indicating the presence of sample selection bias. After addressing this issue, the regression coefficient of climate risk (UERI) remains significantly negative, further supporting the conclusion that climate risks negatively impact urban economic resilience. In conclusion, using both the instrumental variable method and the Heckman two-stage method, this study robustly verifies the significant negative effect of climate risks on urban economic resilience.
5.4. Mechanism Analysis
The results above indicate that climate risk significantly suppresses urban economic resilience. What pathways does climate risk use to reduce urban economic resilience? To test the mediating effect of climate risk on urban economic resilience, an empirical analysis of the mediation model was conducted, with results presented in Table 8. Columns (1) and (2) show that climate risk significantly negatively affects population size and financial stability, with statistical significance at the 5% level.
Specifically, climate risk indeed exerts a significant negative impact on urban economic resilience (CRI) by reducing urban population size (Psize) and disrupting urban financial stability (Fin). In detail, the significantly negative influence of climate risk on population size and financial stability further weakens urban economic resilience, thereby validating Hypothesis 2. This finding indicates that climate risk not only directly affects urban economic resilience but also indirectly exacerbates its impact on the urban economic resilience system by influencing population size and financial stability. Therefore, Hypothesis 2 of this paper is supported.
5.5. Analysis of Spatial Spillover Effects
This study adopts the methodology proposed by Elhorst, employing the Lagrange Multiplier (L.M) test, Wald test, SDM model fixed-effects test, Hausman test, and the simplified SDM model test to determine the spatial Durbin model (SDM) with spatial-temporal double fixed effects as the optimal choice for analyzing the spatial spillover effects of climate risk (UERI) on urban economic resilience (CRI). As an extended spatial regression model, the SDM not only estimates the direct effects of climate risk but also captures spatial spillover effects across regions, revealing the transmission pathways of climate risk across different spatial dimensions [10].
From the regression results presented in the Table 9, climate risk demonstrates a significant negative direct impact on urban economic resilience across the dimensions of adjacency, geography, and economic space, with specific coefficients of -0.0381, -0.0338, and -0.0363, all significant at the 1% level. This indicates that climate risk weakens urban economic resilience, regardless of whether the cities are connected through geographic proximity, economic linkages, or spatial adjacency. The spatial correlation coefficient (rho) further reveals the spatial spillover effects of climate risk. In both the adjacency and geographic spatial models, the rho values are negative and significant, indicating a notable negative spatial spillover effect. Notably, in the geographic spatial model, the rho value is -0.6901, which suggests that geographically proximate cities are more susceptible to the adverse effects of climate risk.
This finding further demonstrates that climate risk weakens urban economic resilience through negative spillover effects in adjacency, geographic, and economic spaces, with the spillover effect being particularly pronounced among geographically proximate cities. Therefore, Hypothesis 3 is supported.
5.6. Heterogeneous Effects of Climate Risk on Urban Economic Resilience
Due to differences in resource endowments, urban scale, and geographical location, there are significant disparities among cities in terms of both climate risks and economic resilience. This paper further explores the variations in the aforementioned effects. By further exploring these disparities, we can gain a more comprehensive understanding of the vulnerabilities and adaptive capacities of different cities in responding to climate change, thereby providing theoretical support for the formulation of more precise policies and the implementation of corresponding climate adaptation strategies.
➀Geographical Location: Cities are divided into three groups—eastern, central, and western—based on their geographical location. The analysis results are presented in Columns (1), (2), and (3) of Table 10. The study reveals that the negative impact of climate risks on economic resilience is significantly greater in eastern cities compared to those in central and western regions. A possible reason is that eastern cities have higher levels of economic development and greater dependence on external markets, making them more vulnerable to climate risks. Due to their advanced economic structures and open market environments, eastern regions are more susceptible to disruptions caused by climate events, which substantially weaken their recovery and adaptive capacities.
➁Urban Hierarchy: Cities are categorized into central and non-central cities based on their importance. Central cities typically refer to those with significant economic status at the regional or national level, such as cities located in economic core areas. These cities possess stronger economic agglomeration effects and policy resources, while non-central cities have relatively fewer economic activities and resources within their regions. The results are shown in Columns (4) and (5) of Table 10. The analysis indicates that the impact coefficient of climate risks on economic resilience in central cities is five times that in non-central cities. Although central cities exhibit stronger recovery capacities, their highly developed economic systems make them more fragile when exposed to climate risks. In contrast, non-central cities, due to their relatively lower levels of economic activity and resource concentration, experience smaller disruptions to their economic resilience systems when facing climate risks.
➂Administrative Hierarchy of Cities: Cities are classified into provincial capital cities and non-provincial capital cities. The results of the analysis are shown in columns (1) and (2) of Table 11. The negative impact of climate risk is significantly higher for provincial capital cities compared to non-provincial capital cities. Specifically, the climate risk coefficient for provincial capital cities is -1.8574, while the coefficient for non-provincial capital cities is -0.7281. As regional political, economic, and cultural centers, provincial capital cities experience high resource concentration and dense economic activities, which places them under greater pressure when responding to climate risks. Additionally, these cities bear more responsibilities for policy implementation and infrastructure maintenance, making them more vulnerable to climate shocks. In contrast, non-provincial capital cities have relatively smaller economic scales and fewer policy resources. While they are also affected by climate risks, their resilience systems experience comparatively limited disruption.
➃Resource Endowment Conditions: According to the National Plan for Sustainable Development of Resource-Based Cities (2013-2020), cities are divided into resource-based and non-resource-based cities. The results are shown in columns (3) and (4) of Table 11. The impact of climate risk differs significantly between resource-based and non-resource-based cities. Resource-based cities may face deficiencies in infrastructure related to climate adaptation and disaster resilience, rendering them more vulnerable to climate risks. For example, excessive exploitation of water resources can lead to insufficient water supply during droughts, thereby affecting both production and daily life. The economic activities of resource-based cities are often directly tied to resource extraction, which entails a higher risk of environmental degradation, making the adverse effects of climate risks particularly pronounced. Furthermore, these cities face challenges such as population aging and shortages of healthcare and educational resources, which exacerbate the impact of climate risks on economic activities and social stability, further weakening their economic resilience.
In summary, the impact of climate risk on urban economic resilience varies significantly based on geographical location, urban hierarchy, administrative level, and resource endowment conditions. These findings suggest that when formulating policies to address climate risks, differentiated strategies should be implemented based on city-specific characteristics. Particular attention should be paid to the vulnerabilities of eastern regions, central cities, provincial capital cities, and resource-based cities to enhance inter-city economic resilience and overall risk resistance capacity.
VI. Discussion
Previous literature has largely focused on the internal factors of economic systems that affect economic resilience, with limited attention paid to the influence of external factors on urban economic resilience, particularly climate risks. This paper, through data collection (Chinese city panel data from 2009-2022) and the application of appropriate empirical analysis methods, tests the hypotheses presented earlier and confirms the reasonableness of the conclusions drawn in the previous literature. In comparison to other related studies, this paper holds significant practical relevance, as with the continuous increase in human activity, especially the expansion of economic activity, environmental sustainability is under profound pressure, and climate issues have become increasingly prominent [43]. Furthermore, the detrimental effect of climate risk on urban economic resilience has emerged as an important issue in contemporary academic discussions. The study’s findings suggest that climate risk significantly suppresses urban economic resilience, and this conclusion remains robust across various tests.
On the other hand, this paper adopts more advanced empirical analysis methods, making certain improvements in the construction of the economic resilience evaluation system and the comprehensiveness of the analytical methods, providing conclusions that are timely. The study finds that climate risk weakens urban economic resilience through various mechanisms, consistent with Butsch et al. and Tran & Uzmanoglu [5,31]. The research highlights that climate risk undermines infrastructure, leads to population loss, and causes financial system fragility, thereby impacting urban economic resilience. Additionally, climate risk has a significant negative impact on urban economic resilience across neighboring, geographical, and economic dimensions, suggesting that its effects are not confined to the affected cities but spread to surrounding areas through economic networks and supply chains. This finding is also consistent with Nyarko’s research on supply chain disruptions and resource competition [26]. Given the different factor endowments across regions, the impact of climate risk on urban economic resilience also varies significantly.
Although this study strives to ensure the reliability of the results, there are still some limitations. First, while multiple control variables, regression models, and spatial Durbin models have been used to mitigate the impact of endogeneity, it is not possible to completely rule out the potential correlation between explanatory variables and error terms. This endogeneity may arise from bidirectional causality, omitted variables, or measurement errors, such as the possibility that urban economic resilience may, in turn, influence its capacity to withstand climate risks. Furthermore, the exclusion of key variables such as government policy, economic crises, natural disasters and public health emergencies may lead to bias in the estimates of climate risk effects, impacting the accuracy of the conclusions. Future research could further alleviate these issues by incorporating instrumental variables or quasi-natural experiments and including the integration of longer time series and social events in the analysis. Second, given that this study primarily focuses on Chinese cities, China’s unique political system may influence the relationship between climate risk and economic resilience. The differences in regional policies may affect resource allocation and implementation strength, thereby impacting the enhancement of urban economic resilience. For example, the eastern region emphasizes high-quality development and ecological protection, while the central and western regions focus on economic growth and infrastructure development. Third, the public opinion to climate risks is an important driving force for governments to take measures to address climate change and economic resilience. In future research, we will further consider the impact of public opinion. Cross-national comparisons, studies on behavior and attitudes, as well as research on social movements and policy change, will help us gain a more comprehensive understanding of and effectively utilize public opinion as an important force to better address the global climate change challenge.
VII. Conclusions and Policy Implications
7.1. Conclusion
In the context of intensifying global climate risks and growing attention on urban economic resilience, this paper examines the impact of climate risk on the economic resilience of Chinese cities and its underlying mechanisms. Using panel data from Chinese cities between 2009 and 2022, the paper constructs an index system for urban economic resilience and assesses the level of climate risk in each city. Through empirical analysis, the study explores both the direct impact of climate risk on urban economic resilience and its indirect effects mediated by factors such as urban population size and financial stability. In addition, the spatial spillover effects of climate risk are analyzed, revealing the varying impacts across different regions and city types. The results show that climate risk significantly weakens urban economic resilience, a conclusion that remains robust after conducting various robustness checks. Furthermore, climate risk exacerbates this impact by influencing urban population size and financial stability. The effect of climate risk varies by region and city type: compared to the central and western regions, non-central cities, and resource-based cities, the eastern region, central cities, and non-resource-based cities are less affected by climate risk. Finally, the study identifies clear spatial spillover effects, where climate risk impacts do not remain confined to individual cities but spread to surrounding cities or regions through economic connections, supply chains, and market fluctuations.
7.2. Policy Implications
Based on the above conclusions and discussions, this paper provides several insights for policymakers:
- a.
- Increase investment in climate-adaptive infrastructure to enhance the city’s ability to respond to climate risks.
To address the challenges posed by climate change, the government should prioritize investments in infrastructure that can mitigate extreme weather events, such as flood control, drought prevention, and drainage systems. In addition, projects like smart transportation and green buildings should be promoted to improve the sustainability of urban infrastructure. For non-central cities and resource-based cities, it is crucial to prioritize the construction of disaster-resistant infrastructure to ensure the cities can recover swiftly when climate-related events occur. Furthermore, the use of clean and renewable energy should be encouraged to reduce dependence on fossil fuels and improve the long-term sustainability of cities.
- b.
- Promote the diversification of urban economic structures to enhance urban economic resilience.
Climate risks have a more pronounced impact on cities with a single economic structure. Policies should encourage cities in the central and western regions, as well as resource-based cities, to adjust their industrial structures and drive technological innovation. The government should support the development of green industries, low-carbon technologies, and renewable energy through tax incentives, financial subsidies, and other measures. Furthermore, innovation by high-tech companies should be encouraged to steer the industrial structure towards low-carbon and environmentally friendly directions. Additionally, it is essential to strengthen urban development in the fields of digital economy and green buildings to improve the overall economic resilience of cities, thereby maintaining competitiveness in the context of climate change.
- c.
- Establish cross-regional cooperation mechanisms to enhance the synergistic effect of climate risk management.
Due to the spatial spillover effect of climate risks, cities should strengthen regional coordination and establish cross-regional climate risk management mechanisms. Developed regions in the east can leverage their economic and technological advantages to assist cities in the central and western regions, as well as non-central cities, in enhancing their climate adaptation capabilities, thereby forming a collaborative regional network for responding to climate change. Additionally, cross-regional climate emergency response and resource-sharing platforms should be established to facilitate the sharing of climate risk information and the collaborative execution of emergency plans.
References
- Abe, M.; Ye, L. Building resilient supply chains against natural disasters: The cases of Japan and Thailand. Global Business Review 2013, 14, 567–586. [Google Scholar] [CrossRef]
- Abid, N.; Ahmad, F.; Aftab, J.; et al. A blessing or a burden? Assessing the impact of climate change mitigation efforts in Europe using quantile regression models. Energy Policy 2023, 178, 113589. [Google Scholar] [CrossRef]
- Anh, D.L.T.; Anh, N.T.; Chandio, A.A. Climate change and its impacts on Vietnam agriculture: A macroeconomic perspective. Ecological Informatics 2023, 73, 101960. [Google Scholar] [CrossRef]
- Briguglio, L.; Cordina, G.; Farrugia, N.; Vella, S. Economic vulnerability and resilience: Concepts and measurements. Oxford Development Studies 2009, 37, 229–247. [Google Scholar] [CrossRef]
- Butsch, C.; Beckers, L.M.; Nilson, E.; et al. Health impacts of extreme weather events – Cascading risks in a changing climate. Journal of Health Monitoring 2023, 8 (Suppl 4). [Google Scholar] [CrossRef]
- Campiglio, E.; Daumas, L.; Monnin, P.; et al. Climate-related risks in financial assets. Journal of Economic Surveys 2023, 37, 950–992. [Google Scholar] [CrossRef]
- Carleton, T.A.; Hsiang, S.M. Social and economic impacts of climate. Science 2016, 353, aad9837. [Google Scholar] [CrossRef]
- Ding, Y.J.; Li, C.Y.; Xiaoming, W.; Wang, Y. An overview of climate change impacts on society in China. Advances in Climate Change Research 2021, 12, 123–134. [Google Scholar] [CrossRef]
- Dutta, A.; Bouri, E.; Rothovius, T.; Uddin, G.S. Climate risk and green investments: New evidence. Energy (Oxford) 2023, 265, 126376. [Google Scholar] [CrossRef]
- Elhorst, J.P. Matlab software for spatial panels. International Regional Science Review 2014, 37, 389–405. [Google Scholar] [CrossRef]
- Gao, H. Urban population size and labor income. The Journal of World Economy 2014, 145–164. [Google Scholar] [CrossRef]
- Guo, K.; Ji, Q.; Zhang, D. A dataset to measure global climate physical risk. Data in Brief 2024, 54, 110502–110502. [Google Scholar] [CrossRef]
- Hu, Z.; Borjigin, S. The amplifying role of geopolitical risks, economic policy uncertainty, and climate risks on energy-stock market volatility spillover across economic cycles. The North American Journal of Economics and Finance 2024, 71, 102114. [Google Scholar] [CrossRef]
- Jiang, T. Mediating effects and moderating effects in causal inference. China Industrial Economics 2022, 5, r120. [Google Scholar] [CrossRef]
- Jiang, Z.; Liu, Q.; Song, J. Pattern characteristics and evolution mechanism of China’s regional economic resilience. Economic Geography 2023, 43, 1–12. [Google Scholar] [CrossRef]
- Kashi, S.M.H.; Farrokhzadeh, S.; Baharvandi, S.; Zolfani, S.H. Effects of extreme weather events and climate change on cities’ livability. Cities 2024, 151, 105114. [Google Scholar] [CrossRef]
- Li, N. Measuring the combining effects of financial stability and climate risk for green economic recovery. Economic Change and Restructuring 2023, 56, 1225–1241. [Google Scholar] [CrossRef]
- Lim, C.H.; Ryu, J.; Choi, Y.; Jeon, S.W.; Lee, W.K. Understanding global PM2.5 concentrations and their drivers in recent decades (1998–2016). Environment International 2020, 144, 106011. [Google Scholar] [CrossRef]
- Lin, B.; Wu, N. Climate risk disclosure and stock price crash risk: The case of China. International Review of Economics & Finance 2023, 83, 21–34. [Google Scholar] [CrossRef]
- Liu, J.; Huang, X.; Chen, J. High-speed rail and high-quality development of urban economy: An empirical study based on the data of prefecture-level cities. Contemporary Finance & Economics 2021, 14–26. [Google Scholar] [CrossRef]
- Liu, L.; Meng, Y.; Wu, D.; et al. Impact of haze pollution and human capital on economic resilience: Evidence from prefecture-level cities in China. Environmental Development and Sustainability 2023, 25, 13429–13449. [Google Scholar] [CrossRef]
- Liu, X.; Zhang, X.; Li, S. Measurement of China’s macroeconomic resilience – A systemic risk-based perspective. China Social Science 2021, 12–32+204.
- Löscher, A.; Kaltenbrunner, A. Climate change and macroeconomic policy space in developing and emerging economies. Journal of Post Keynesian Economics 2022, 46, 113–141. [Google Scholar] [CrossRef]
- Ma, J.; Caldecott, B.; Volz, U. Case studies of environmental risk analysis methodologies. Environmental Risk Analysis Review 2020. [Google Scholar] [CrossRef]
- Martin, R.; Sunley, P.; Gardiner, B.; Tyler, P. How regions react to recessions: Resilience and the role of economic structure. Regional Studies 2016, 50, 561–585. [Google Scholar] [CrossRef]
- Nyarko, I.K. The impact of natural disasters on international trade: The potential effects of April 2024 Dubai floods on Ghana’s economy. Business, Management and Economics: Research Progress 2024, 4, 64–86. [Google Scholar] [CrossRef]
- Parrado, R.; Bosello, F.; Delpiazzo, E.; et al. Fiscal effects and the potential implications on economic growth of sea-level rise impacts and coastal zone protection. Climatic Change 2020, 160, 283–302. [Google Scholar] [CrossRef]
- Perera, A.T.D.; Hong, T. Vulnerability and resilience of urban energy ecosystems to extreme climate events: A systematic review and perspectives. Renewable and Sustainable Energy Reviews 2023, 173, 113038. [Google Scholar] [CrossRef]
- Salimi, M.; Al-Ghamdi, S.G. Climate change impacts on critical urban infrastructure and urban resiliency strategies for the Middle East. Sustainable Cities and Society 2020, 54, 101948. [Google Scholar] [CrossRef]
- Sun, J.; Sun, X. Progress of regional economic resilience research and exploration of its application in China. Economic Geography 2017, 37, 1–9. [Google Scholar] [CrossRef]
- Tran, N.; Uzmanoglu, C. Climate risk and credit ratings. Journal of Financial Research 2024. [Google Scholar] [CrossRef]
- Wang, X.; Li, M. Determinants of regional economic resilience to economic crisis: Evidence from Chinese economies. Sustainability 2022, 14, 809. [Google Scholar] [CrossRef]
- Wang, Y.; Zhou, B.; Ren, Y.; Sun, C. Impacts of global climate change on China’s climate security. Journal of Applied Meteorological Science 2016, 27, 750–758. [Google Scholar] [CrossRef]
- Wang, Z.; Wei, W. Regional economic resilience in China: Measurement and determinants. Regional Studies 2021, 55, 1228–1239. [Google Scholar] [CrossRef]
- Wen, Q.; Feng, J.; Wei, X.; Yang, Y.; Haq, S. ul. Climate change resilience: Cultural insights from diverse Chinese communities and environmental implications. Polish Journal of Environmental Studies 2024. [Google Scholar] [CrossRef]
- Wenz, L.; Willner, S.N. Climate impacts and global supply chains: An overview. Handbook on Trade Policy and Climate Change 2022, 290–316. [Google Scholar] [CrossRef]
- West, C.D.; Stokeld, E.; Campiglio, E.; Croft, S.; Detges, A.; Duranovic, A.; et al. Europe’s cross-border trade, human security and financial connections: A climate risk perspective. Climate Risk Management 2021, 34, 100382. [Google Scholar] [CrossRef]
- Wu, Z.; Sun, S.; Zhang, S.; et al. Assessment of climate resilience of cities in the Yellow River Basin and countermeasures to improve it. Land Resources Science and Technology Management 2024, 41, 62–74. [Google Scholar] [CrossRef]
- Xu, Y.; Zhang, L. The economic resilience and origin of Chinese cities: The perspective of industrial structure diversification. Finance and Trade Economy 2019, 40, 110–126. [Google Scholar] [CrossRef]
- Xie, J.; Zheng, Y.; Dong, Q. The digital and intelligent construction of supply chains enables the new quality productive forces of manufacturing enterprises: A quasi-natural experiment based on the construction of supply-chain innovation and application pilot cities. Journal of Shanghai University of Finance and Economics 2024, 26, 15–29. [Google Scholar] [CrossRef]
- Xie, M.; Feng, Z.; Li, C. How does population shrinkage affect economic resilience? A case study of resource-based cities in Northeast China. Sustainability 2022, 14, 3650. [Google Scholar] [CrossRef]
- Yu, Z.; Li, Y.; Dai, L. Digital finance and regional economic resilience: Theoretical framework and empirical test. Finance Research Letters 2023, 55, 103920. [Google Scholar] [CrossRef]
- Zhang, L.; Xu, M.; Chen, H.; et al. Globalization, green economy and environmental challenges: State-of-the-art review for practical implications. Frontiers in Environmental Science 2022, 10, 870271. [Google Scholar] [CrossRef]
- Zhang, Y.; Deng, S.; Zhang, Y. Research on urban economic resilience: Theoretical progress and future direction. Journal of Management 2022, 54–67. [Google Scholar] [CrossRef]
- Zhao, R.; Li, X.; Wang, Y.; et al. Assessing resilience of sustainability to climate change in China’s cities. Science of The Total Environment 2023, 898, 165568. [Google Scholar] [CrossRef]
- Zhou, C.; Tao, Y.; Wang, W. Can green finance promote urban economic resilience? Collected Essays on Finance and Economics 2024, 40, 70–80. [Google Scholar] [CrossRef]
- Zhou, Q.; Zhu, M.; Qiao, Y.; Zhang, X.; Chen, J. Achieving resilience through smart cities? Evidence from China. Habitat International 2021, 111, 102348. [Google Scholar] [CrossRef]
Figure 1.
Pathway Mechanisms of Climate Risk Impact on Urban Economic Resilience.
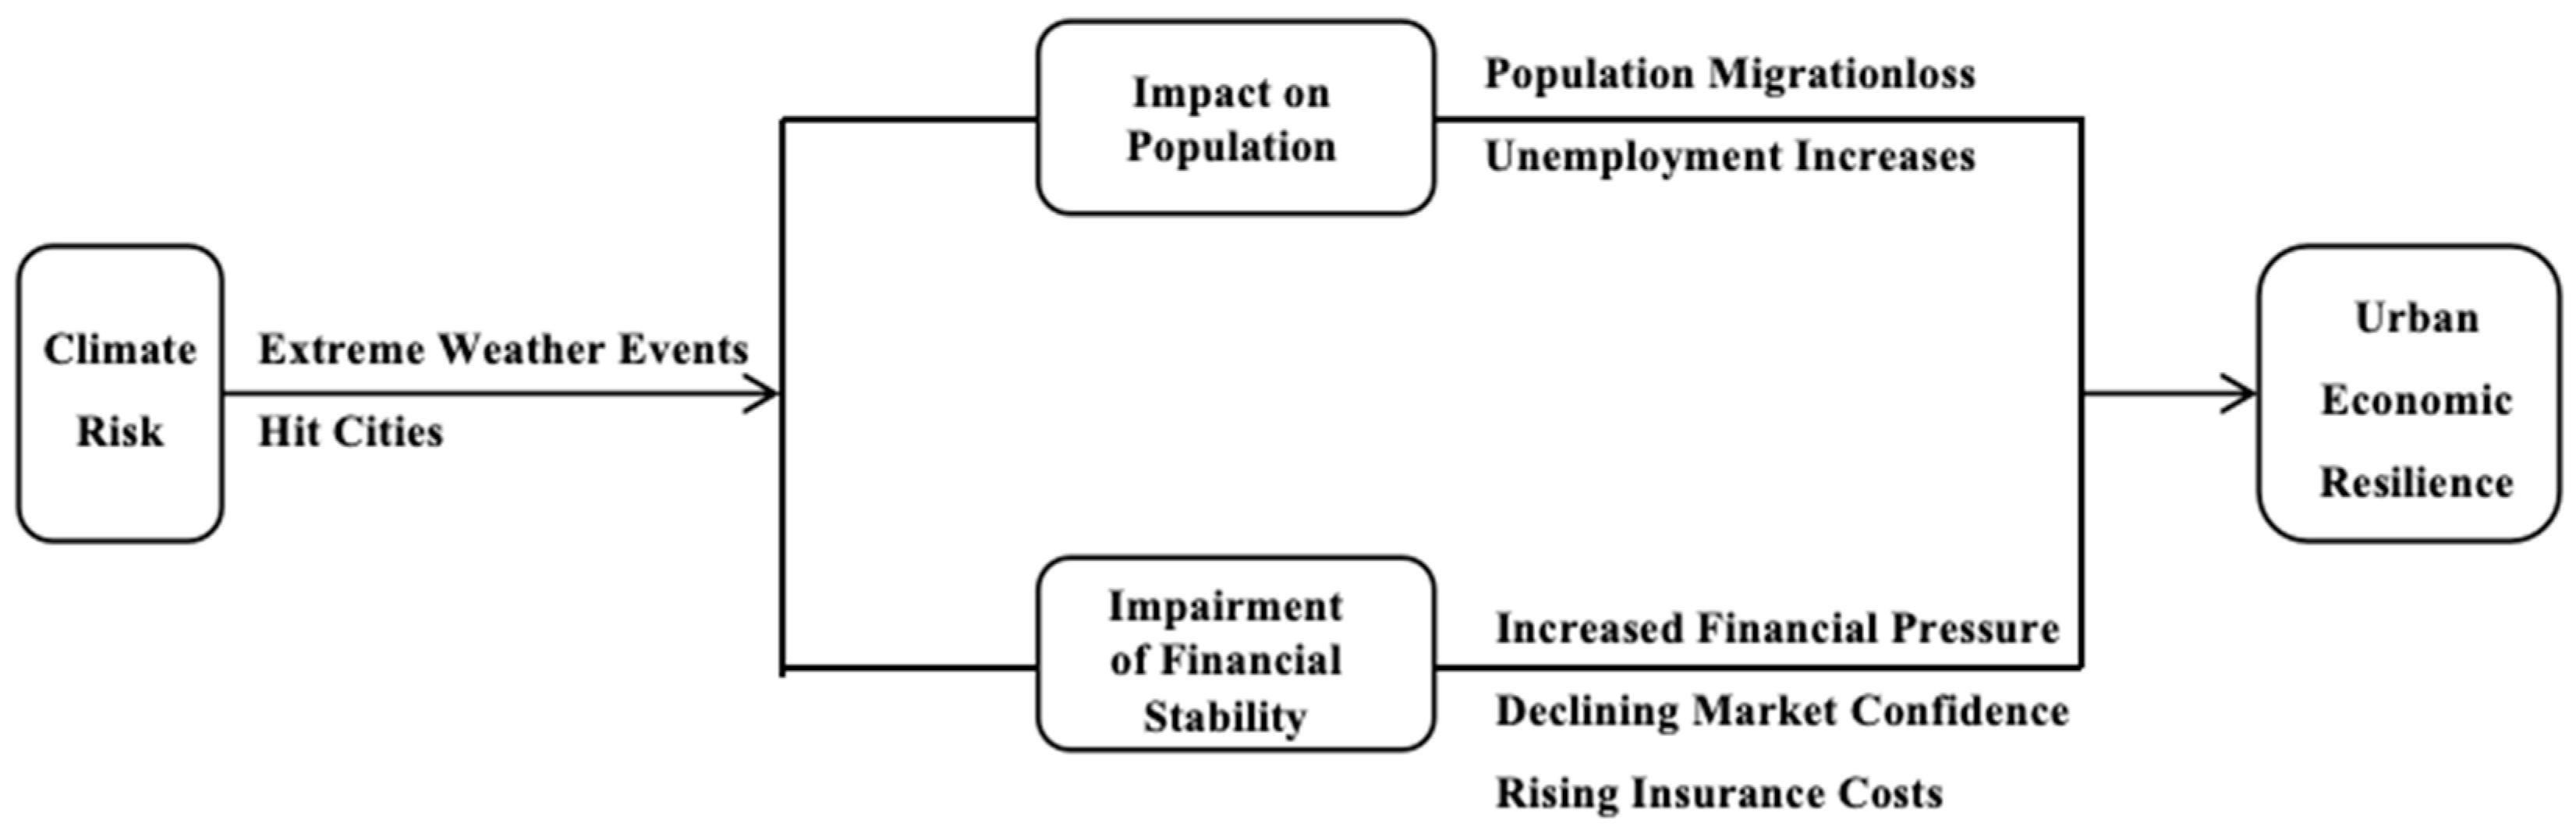

Table 1.
Urban Climate Risk Indicator System.
| Climate Risk Index (CRI) | Sub-indicators | Explanation |
| LTD | The number of extreme low-temperature days | |
| HTD | The number of extreme high-temperature days | |
| ERD | The number of extreme rainfall days | |
| EDD | The number of extreme drought days |
Notes: Following the method of Guo et al. (2024), we constructed an indicator system for urban climate risk.
Table 2.
Urban Economic Resilience Indicator System and Weights.
| Dimension and Weight | Indicator Explanation and Units | Nature |
| Resistance and Recovery Capacity (0.178) | Per capita GDP (10,000 yuan) 0.278 | + |
| Per capita disposable income of urban residents (10,000 yuan) 0.126 | + | |
| Household savings deposits (10,000 yuan) 0.401 | + | |
| Average employee wage (yuan) 0.194 | + | |
| Adaptive and Adjustment Capacity (0.445) | Fixed asset investment (10,000 yuan) 0.421 | + |
| Local fiscal expenditure (10,000 yuan) 0.554 | + | |
| Balance of loans and deposits in RMB from financial institution 0.025 | + | |
| Innovation and Transformation Capacity(0.377) | Total number of enterprises above designated size 0.164 | + |
| Education investment (10,000 yuan) 0.272 | + | |
| Science and technology investment (10,000 yuan) 0.541 | + | |
| Urbanization rate 0.023 | + |
Notes: In the indicator system for urban economic resilience, weights are calculated using the entropy weighting method.
Table 3.
Definitions of Key Variables.
| Variable Category | Variable Name | Abbreviation | Variable Description |
| Explanatory Variable | Climate Risk Index | CRI | A composite index derived from the standardized indices of LTD (Extreme Low Temperature Days), HTD (Extreme High Temperature Days), ERD (Extreme Rainfall Days), and EDD (Extreme Drought Days). |
| Dependent Variable | Urban Economic Resilience Index | UERI | Measured using three dimensions: resistance and recovery capacity, adaptive and adjustment capacity, and innovation and transformation capacity, with 11 secondary indicators. |
| Resistance and Recovery Capacity | Rel | Calculated using entropy weighting based on indicators such as per capita GDP and per capita disposable income of urban residents. | |
| Adaptive and Adjustment Capacity | Ada | Calculated using entropy weighting based on indicators like fixed asset investment and local fiscal expenditure. | |
| Innovation and Transformation Capacity | Enpu | Calculated using entropy weighting based on indicators like the total number of large-scale enterprises and fiscal education expenditure in the region. | |
| Mediating Variable | Urban Population Size | Psize | Logarithmic value of the total urban population at the end of the year. |
| Urban Financial Stability | Fin | Ratio of year-end loan balances of financial institutions to regional GDP. | |
| Control Variable | Urban Entrepreneurship Activity | Live | Ratio of the number of private and individual employees in urban areas to the urban population. |
| Urban Facility Development Level | Fund | Per capita road area. | |
| Urban Economic Density | Den | Ratio of regional GDP to urban land area. | |
| Urban Foreign Investment Dependence | Export | Proportion of actual foreign investment in GDP for the city that year. | |
| Urban Human Capital Level | Hr | Ratio of regular college and university students to the permanent urban population. |
Table 4.
Descriptive Statistics of Main Variables.
| Variable | N | Mean | Sd | Min | Med | Max |
| CRI | 2212 | 0.097 | 0.0947 | 0.0118 | 0.07 | 0.9878 |
| UERI | 2212 | 3.3189 | 0.2408 | 0.2928 | 3.3295 | 4.472 |
| Rel | 2212 | 0.1415 | 0.0816 | 0.016 | 0.1209 | 0.6951 |
| Ada | 2212 | 0.0697 | 0.082 | 0.0048 | 0.0447 | 0.726 |
| Enpu | 2212 | 0.0419 | 0.0657 | 0.0025 | 0.0234 | 0.7941 |
| Live | 2212 | 0.1239 | 0.126 | -0.0231 | 0.0899 | 13,099 |
| Fund | 2212 | 2.5051 | 0.6786 | 0 | 2.5779 | 4.112 |
| Den | 2212 | 0.0403 | 0.0377 | 0.001 | 0.0289 | 0.2712 |
| Export | 2212 | 0.0171 | 0.0182 | 0 | 0.0116 | 0.1361 |
| Hr | 2212 | 0.0188 | 0.0189 | 0.0003 | 0.0122 | 0.1131 |
Table 5.
Baseline Regression.
| (1) | (2) | (3) | (4) | (5) | (6) | (7) | (8) | |
| CRI | Rel | Ada | Enpu | CRI | Rel | Ada | Enpu | |
| UERI | -0.6010** | -0.5600 | -0.4552* | -0.3734** | -0.5755** | -0.5191 | -0.4408* | -0.3604** |
| (0.3025) | (0.4156) | (0.2592) | (0.1838) | (0.2546) | (0.3906) | (0.2250) | (0.1484) | |
| Live | 0.1342*** | 0.1232*** | 0.0946*** | 0.0935*** | ||||
| (0.0343) | (0.0281) | (0.0250) | (0.0286) | |||||
| Fund | 0.0078* | 0.0059* | 0.0049 | 0.0069** | ||||
| (0.0042) | (0.0036) | (0.0036) | (0.0031) | |||||
| Den | 0.2519 | 0.0787 | 0.1838 | 0.2497 | ||||
| (0.2413) | (0.2058) | (0.1777) | (0.1955) | |||||
| Export | 0.0430 | -0.1426* | 0.1281 | 0.0015 | ||||
| (0.1107) | (0.0860) | (0.1034) | (0.0853) | |||||
| Hr | 0.0712 | 0.0586 | 0.0992 | -0.0103 | ||||
| (0.3061) | (0.2771) | (0.2542) | (0.2267) | |||||
| City fe | YES | YES | YES | YES | YES | YES | YES | YES |
| Year fe | YES | YES | YES | YES | YES | YES | YES | YES |
| _cons | 0.1170*** | 0.1601*** | 0.0848*** | 0.0543*** | 0.0676*** | 0.1268*** | 0.0488*** | 0.0151 |
| (0.0100) | (0.0138) | (0.0086) | (0.0061) | (0.0187) | (0.0211) | (0.0147) | (0.0141) | |
| R² | 0.9115 | 0.9194 | 0.9161 | 0.8828 | 0.9224 | 0.9318 | 0.9234 | 0.8942 |
| F | 3.9470** | 1.8151 | 3.0849* | 4.1292** | 3.3194*** | 4.9553*** | 3.0265*** | 2.5643** |
| N | 2212 | 2212 | 2212 | 2212 | 2212 | 2212 | 2212 | 2212 |
Note: *, **, and *** indicate significance at the 0.1, 0.05, and 0.01 levels, respectively, with robust standard errors clustered by city in parentheses. The same applies below.
Table 6.
Robustness Test Regression Results on the Impact of Climate Risk on Urban Economic Resilience.
Table 6.
Robustness Test Regression Results on the Impact of Climate Risk on Urban Economic Resilience.
| Modification of Dependent Variables | High-dimensional Fixed Effects | Lagged Explanatory Variables | Subsample Regression (Excluding COVID-19) | |
| (1) | (2) | (3) | (4) | |
| CRI | CRI | CRI | CRI | |
| UERI | -1.0213** | -0.5413** | -0.8239*** | -0.6597* |
| (0.4538) | (0.2701) | (0.2673) | (0.3344) | |
| Live | -0.0077 | 0.1334*** | 0.1473*** | 0.1749*** |
| (0.0113) | (0.0335) | (0.0352) | (0.0383) | |
| Fund | 0.0011 | 0.0076* | 0.0082* | 0.0065 |
| (0.0032) | (0.0041) | (0.0047) | (0.0043) | |
| Den | -0.0569 | 0.2706 | 0.2287 | 0.0802 |
| (0.0999) | (0.2421) | (0.2425) | (0.2299) | |
| Export | 0.0263 | 0.0460 | 0.0522 | 0.0854 |
| (0.0512) | (0.1092) | (0.1006) | (0.0860) | |
| Hr | 0.1564 | 0.0432 | -0.0340 | -0.3022 |
| (0.2367) | (0.3077) | (0.3141) | (0.3843) | |
| _cons | 0.3624*** | 1.6423 | 0.0801*** | 0.0741*** |
| (0.0173) | (2.2754) | (0.0196) | (0.0184) | |
| City fe | YES | YES | YES | YES |
| Year fe | YES | YES | YES | YES |
| Pro-Year fe | NO | YES | NO | NO |
| R² | 0.8952 | 0.9226 | 0.9360 | 0.9280 |
| F | 0.9047 | 2.9178*** | 3.6837*** | 3.5942*** |
| N | 2212 | 2212 | 2054 | 1738 |
Table 7.
Endogeneity Treatment.
| Instrumental Variables | Heckman | ||
| (1) | (2) | (3) | |
| UERI | CRI | CRI | |
| PM2.5 | 0.003** | ||
| (0.001) | |||
| UERI | -0.773** | -0.597** | |
| (0.302) | (0.254) | ||
| IMR | 1.735** | ||
| (0.725) | |||
| Live | -0.130 | 0.107 | 0.742*** |
| (0.133) | (0.118) | (0.263) | |
| Fund | 0.019 | 0.025 | -0.063** |
| (0.027) | (0.019) | (0.029) | |
| Den | -2.549** | -1.462 | 2.130** |
| (1.212) | (1.003) | (0.840) | |
| Export | -0.148 | -0.148 | 4.644** |
| (0.600) | (0.448) | (1.921) | |
| Hr | 0.259 | 0.721 | -2.096** |
| (2.395) | (1.802) | (0.9881) | |
| -1.841** | |||
| _cons | (0.800) | ||
| City fe | YES | YES | YES |
| Year fe | YES | YES | YES |
| Cragg-Donald Wald F statistic | 10.610 | ||
| Kleibergen-Paap rk LM statistic | 6.623[0.011] | ||
| R² | -2.342 | ||
| F | 2.6305** | ||
| N | 1896 | 1896 | |
Table 8.
Mechanism Analysis.
| (1) | (2) | |
| Psize | Fin | |
| UERI | -0.0475** | -0.1290*** |
| (0.0183) | (0.0375) | |
| Live | -0.0979 | 0.1447 |
| (0.0961) | (0.1390) | |
| Fund | 0.0165 | -0.0069 |
| (0.0224) | (0.0289) | |
| Den | -0.8592 | 0.9278 |
| (0.9225) | (1.2871) | |
| Export | 0.0209 | 1.2637 |
| (0.3638) | (0.9651) | |
| Hr | -1.0430 | -2.0901 |
| (1.4326) | (3.3169) | |
| _cons | 6.2160*** | 6.7928*** |
| (0.0892) | (0.1670) | |
| City fe | YES | YES |
| Year fe | YES | YES |
| R² | 0.9149 | 0.7515 |
| F | 1.5622 | 2.2147** |
| N | 2212 | 2212 |
Table 9.
Spatial Spillover Effect Analysis.
| Adjacency | Geography | Economy | |
| (1) | (2) | (3) | |
| CRI | CRI | CRI | |
| UERI | -0.0381*** | -0.0338*** | -0.0363*** |
| (0.0112) | (0.0118) | (0.0126) | |
| Live | 0.3854*** | 0.4021*** | 0.4654*** |
| (0.0400) | (0.0389) | (0.0402) | |
| Fund | 0.0671*** | 0.0677*** | 0.0625*** |
| (0.0113) | (0.0113) | (0.0116) | |
| Den | 1.2401* | 1.4050** | 2.6545*** |
| (0.7054) | (0.7119) | (0.8102) | |
| Export | 0.4033 | 0.7513** | 0.9348*** |
| (0.3274) | (0.3255) | (0.3432) | |
| Hr | -3.7883*** | -3.5612*** | -1.3852 |
| (1.1304) | (1.2308) | (1.2568) | |
| _cons | -0.3300*** | -0.8437*** | -0.3927*** |
| (0.1150) | (0.2286) | (0.1310) | |
| Spatialrho | -0.1983***(0.0701) | -0.6901***(0.1720) | 0.0672(0.0914) |
| Variancelgt_theta | -2.1955***(0.1692) | -2.2189***(0.1690) | -2.4526***(0.1602) |
| sigma2_e | 0.0012*** | 0.0012*** | 0.0013*** |
| (0.0001) | (0.0001) | (0.0001) | |
| LR_Direct | -0.0387*** | -0.0342*** | -0.0358*** |
| (0.0120) | (0.0127) | (0.0129) | |
| LR_Indirect | 0.0196(0.0153) | 0.0185(0.0161) | 0.0099(0.0192) |
| LR_Total | -0.0192(0.0128) | -0.0158(0.0102) | -0.0259(0.0166) |
| Log-likelihood | 715.9163 | 715.2686 | 694.7808 |
| R² | 0.6422 | 0.6470 | 0.3545 |
Table 10.
Regional Heterogeneity-1.
| Eastern | Central | Western | Core Cities | Non-Core Cities | |
| (1) | (2) | (3) | (4) | (5) | |
| CRI | CRI | CRI | CRI | CRI | |
| UERI | -1.2807*** | -0.1585 | -0.8773 | -2.4546** | -0.5044** |
| (0.4239) | (0.4328) | (0.8129) | (1.0169) | (0.2406) | |
| Live | 0.2022*** | 0.0597 | 0.0971*** | 0.1012 | 0.0701*** |
| (0.0638) | (0.0402) | (0.0345) | (0.0793) | (0.0179) | |
| Fund | 0.0214 | 0.0004 | 0.0094 | 0.0519* | 0.0032 |
| (0.0159) | (0.0051) | (0.0066) | (0.0289) | (0.0023) | |
| Den | -0.7792 | 0.0597 | 2.0551 | -3.1238 | 0.0079 |
| (0.9874) | (0.0731) | (2.0809) | (2.9879) | (0.1984) | |
| Export | 0.2025 | -0.1114 | 0.0796 | 0.9971** | -0.0676 |
| (0.1435) | (0.1585) | (0.2414) | (0.4287) | (0.0788) | |
| Hr | 1.4104 | -0.0366 | -0.0055 | -2.9439 | 0.1252 |
| (1.4252) | (0.6772) | (0.3717) | (2.5310) | (0.2294) | |
| _cons | 0.0860 | 0.0803*** | 0.0034 | 0.4215* | 0.0737*** |
| (0.0817) | (0.0226) | (0.0683) | (0.2018) | (0.0139) | |
| City fe | YES | YES | YES | YES | YES |
| Year fe | YES | YES | YES | YES | YES |
| R² | 0.9361 | 0.8780 | 0.9246 | 0.9255 | 0.9182 |
| F | 4.7442*** | 0.9173 | 3.0807** | 2.7126** | 5.1944*** |
| N | 728 | 676 | 617 | 234 | 1787 |
Table 11.
Regional Heterogeneity - 2.
| Provincial Capitals | Non-Provincial Capitals | Resource Cities | Non-Resource Cities | |
| (1) | (2) | (3) | (4) | |
| CRI | CRI | CRI | CRI | |
| UERI | -1.8574* | -0.7281*** | -0.4482** | -0.6969* |
| (0.8928) | (0.2711) | (0.2073) | (0.3707) | |
| Live | 0.0579 | 0.1395*** | 0.0492** | 0.1825*** |
| (0.0668) | (0.0406) | (0.0198) | (0.0460) | |
| Fund | 0.0241* | 0.0083* | 0.0048** | 0.0168* |
| (0.0131) | (0.0049) | (0.0020) | (0.0099) | |
| Den | 1.1259 | 0.0976 | 0.2119*** | 0.6547 |
| (2.9158) | (0.1853) | (0.0312) | (1.3253) | |
| Export | -0.5324 | 0.1329 | 0.0024 | 0.0951 |
| (0.4431) | (0.0900) | (0.1166) | (0.1340) | |
| Hr | -0.9309 | -0.2721 | 0.3892 | -0.2992 |
| (0.9737) | (0.2869) | (0.2401) | (0.4861) | |
| _cons | 0.1471 | 0.0708*** | 0.0525*** | 0.0419 |
| (0.1818) | (0.0182) | (0.0087) | (0.0709) | |
| City fe | YES | YES | YES | YES |
| Year fe | YES | YES | YES | YES |
| R² | 0.8912 | 0.9309 | 0.9241 | 0.9276 |
| F | 1.4728 | 2.7382** | 12.4263*** | 2.7906** |
| N | 273 | 1748 | 784 | 1326 |
Disclaimer/Publisher’s Note: The statements, opinions and data contained in all publications are solely those of the individual author(s) and contributor(s) and not of MDPI and/or the editor(s). MDPI and/or the editor(s) disclaim responsibility for any injury to people or property resulting from any ideas, methods, instructions or products referred to in the content. |
© 2025 by the authors. Licensee MDPI, Basel, Switzerland. This article is an open access article distributed under the terms and conditions of the Creative Commons Attribution (CC BY) license (http://creativecommons.org/licenses/by/4.0/).
Copyright: This open access article is published under a Creative Commons CC BY 4.0 license, which permit the free download, distribution, and reuse, provided that the author and preprint are cited in any reuse.


