
Submitted:
22 April 2024
Posted:
23 April 2024
You are already at the latest version
Abstract
The sustainable development of resource-based cities has long been a focal point for both governmental policies and academic research. A wealth of academic literature identifies the 'resource curse' as a critical barrier to sustainable development in these urban areas. Despite extensive studies, a consensus on effective strategies to circumvent or resolve this challenge remains elusive. Recent empirical data reveals a noticeable pattern of economic growth differentiation in China's resource-based cities. Why do some resource-based cities experience economic decline while others achieve sustainable economic growth? Therefore, this paper analyzes the reasons for the divergence of economic growth in resource cities from the perspective of heterogeneity. The results of the study show that the phenomenon of the resource curse is conditional, and the heterogeneity of demo-graphic changes, geographic location and institutional environment has a significant impact on the economic growth of resource cities. These factors are investigated to elucidate the observed diversification and heterogeneity in the economic growth of resource-based cities. Building upon this analysis, the paper proposes a framework for differentiated sustainable development pathways tailored to the unique contexts of these cities. This approach not only contributes to the current understanding of the 'resource curse' but also offers novel insights for future research aiming to adopt a more nuanced and context-specific perspective in examining sustainable urban development.
Keywords:
Resource-based Cities
; Resource Curse
; Economic Growth Divergence
; Sustainable Development
1. Introduction
Since the 1970s, resource-based cities have emerged as a distinct and crucial urban category within China's economic framework. These cities, fundamentally reliant on their rich natural resource reserves, have evolved extensive industrial chains primarily focused on the extraction and processing of minerals, oil, and forests. This development model has played a significant role in underpinning China's rapid economic growth, while simultaneously giving rise to a set of unique challenges. Predominantly, the intensive exploitation of resources in these cities has led to critical issues, including resource depletion, ecological degradation, and the development of a homogenous industrial structure with limited diversification potential [1,2]. A heavy emphasis on natural resource-based industries has catalyzed the growth of a robust primary sector. However, this has also inadvertently led to a steady decline in human and capital investments in the manufacturing sector, resulting in a marked deindustrialization trend characterized by the shrinking of the manufacturing base [3]. This industrial imbalance creates a lock-in effect in the primary sector, while simultaneously exerting a crowding-out effect on the manufacturing sector [4]. As resource-based cities are near the depletion of their exploitable resources, a slowdown in regional economic growth becomes apparent. This deceleration dampens investor confidence, culminating in the phenomenon known as the resource curse. This issue not only hinders sustainable economic development but also poses considerable challenges to the long-term viability of these cities [5,6,7]. In recent years, the challenge of the resource curse in resource-based cities has captured the attention of scholars, with a specific focus on transformative strategies for these cities [8]. The prevailing consensus categorizes the transformation paths of resource cities into three primary modes: in-dustrial substitution, industrial chain extension, and a combination of both [9]. While a large number of academic studies have demonstrated the existence of the resource curse, its inevitability in resource-based cities remains a matter of debate. Furthermore, the existing literature tends to overlook the heterogeneity and economic differentiation characteristics of resource-based cities, resulting in a lack of comprehensive explanatory power to account for the success of economic transformation in some resource-based cities.
In the Chinese context, the transition of resource cities is primarily orchestrated by multiple levels of government [10]. In a significant policy move, the State Council issued the National Sustainable Development Plan for Resource Cities (2013-2020) in 2013. This strategic document identified 262 resource cities and emphasized their critical importance within China's urban framework. The plan categorizes these cities into four developmental stages: growth, maturity, decline, and regeneration. This classification is designed to provide targeted guidance for the transformation of each city type. However, the question remains: what are the outcomes of the economic transformation of China's resource-based cities? Recent data indicates an increasingly apparent divergence in the economic growth of China's resource-based cities. Before to the COVID-19 pandemic, the growth rate of per capita GDP in resource-based cities lagged their non-resource-based counterparts. However, a notable shift occurred in 2019, following the pandemic, with resource cities experiencing a higher growth rate in per capita GDP than non-resource-based cities. Specifically, in 2020, the average per capita GDP of non-resource-based cities stood at 68,640.57 yuan, marking a -1.44% decrease from the previous year, while resource-based cities averaged 55,674.41 yuan, with a growth rate of 5.96%. This differentiation is also evident in the varying levels of per capita GDP and GDP growth rates among resource cities themselves. Cities like Karamay and Ordos have significantly higher GDP per capita compared to many non-resource-based cities, and others like Jinchang exhibit superior GDP growth rates (Figure 1).
The phenomenon of economic growth differentiation among China's resource-based cities indicates that the ‘resource curse’ is not an insurmountable ‘bog’. This raises the question: why do some resource-based cities suffer from economic decline, while others manage to achieve sustainable economic growth? This paper posits that the heterogeneity of resource-based cities is a key factor contributing to the observed differences in economic growth. What specific aspects of this heterogeneity influence economic growth? Initially, we examine the presence of the resource curse in different types of resource-based cities, and our findings indicate that this curse predominantly affects mature resource-based cities. This may be attributed to the high degree of economic reliance on resource extraction in these cities, coupled with a lack of industrial diversification and innovation. Subsequently, we explore the reasons behind the economic growth disparities among four categories of resource-based cities through three dimensions: differences in population dynamics, geographical location, and the institutional environment. While there are numerous other characteristics of heterogeneity within resource-based cities, the intent of this paper is to encourage scholars to focus on this heterogeneity and to develop tailored sustainable development strategies based on the unique attributes of each city. The paper's contributions are threefold: firstly, it synthesizes the distinctive features of economic growth in China's resource-based cities, advocating for a heterogeneity-based approach to studying their sustainable development. Secondly, it argues for the conditional nature of the resource curse, suggesting that it manifests at specific developmental types and stages of resource-based cities. Thirdly, by examining the impact of population changes, geographical locations, and institutional environments on the economic growth of resource-based cities, the paper adds to the existing body of literature and offers insights for the formulation of differentiated sustainable development strategies for such cities.
The structure of this paper is organized as follows: In the second section, we delineates the salient characteristics of the economic growth disparities observed among China's resource-based cities. The third section rigorously examines the 'resource curse' phenomenon, scrutinizing its occurrence and variability among the four categorizations of resource cities. Following this, the fourth section offers a thorough analysis of how demographic shifts, geographic locations, and divergent institutional environments influence the economic disparities observed in resource cities. The fifth section projects into the future, suggesting avenues for continued research into the unique aspects of resource cities and proposing differentiated paths for their transformation. Finally, the sixth section synthesizes our findings, presenting the conclusions drawn from our comprehensive study.
2. Characteristic Facts of Economic Growth Divergence in China's Resource-Based Cities
2.1. Definition and Classification of Resource-Based Cities
The definition of resource-based cities in existing literature remains somewhat vague, primarily focusing on mining or oil cities. Drawing from the National Sustainable Development Plan for Resource-Based Cities (2013-2020) issued by the State Council of China, this paper defines resource-based cities as follows: Resource-based cities are urban areas (including prefecture-level cities, regions, and other prefecture-level administrative districts as well as county-level cities and counties) where the extraction and processing of natural resources, such as minerals and forests, constitute the region's dominant industry. Following the document, resource-based cities are categorized into four types: growing, mature, declining, and regenerative. A growing resource city possesses abundant undeveloped resources and is in an ascending phase of resource development; a mature resource city maintains stable resource reserves and is at a steady stage of resource development; a declining resource city is characterized by depleting resources, economic stagnation, and ecological degradation; and a regenerative resource city has largely overcome its reliance on resources and transformed its economic development model.
2.2. Data and Research Methods
In accordance with the National Sustainable Development Plan for Resource-Based Cities (2013-2020), this study selects resource-based cities at the prefecture level and above as its research sample, totaling 126. The data for resource-based cities are sourced from the China Urban Statistical Yearbook.
In this study, our analysis predominantly employs descriptive techniques to assess data, opting not to utilize regression models. The rationale for this approach is twofold: Firstly, our objective is to illuminate the heterogeneity issue in resource cities through an exploration of the characteristics underpinning their economic growth disparities. The descriptive method aptly facilitates a clear and succinct depiction of these economic growth variations and their respective distinctions. Secondly, given the multitude of heterogeneous traits inherent in resource-based cities, regression models might fall short in conclusively affirming the significance of heterogeneity within a singular model or article. Descriptive analysis, on the other hand, enables a comparative examination of how diverse heterogeneous characteristics influence the economic growth differentiation in resource-based cities. This approach not only lays the groundwork for our current findings but also spawns insightful directions for future research pertaining to resource cities.
2.3. Spatial Distribution of Resource-Based Cities in China
These cities' spatial distribution is varied: growing resource cities are primarily located in provinces like Inner Mongolia, Guizhou, and Yunnan; mature ones in Shanxi, Hebei, and other regions; declining cities are predominantly found in the northeastern provinces and areas like Jiangxi and Henan; and regenerative cities are mostly situated in coastal provinces like Liaoning, Shandong, and Jiangsu. This classification aids in understanding the diverse developmental stages and geographical spread of China's resource-based urban centers.
2.4. Divergence Economic Growth in China's Resource-Based Cities
For a clearer and more precise understanding of the economic growth differentiation of China's resource-based cities, we used urban per capita GDP box plot (Figure 3) . Our observations are as follows: Since 2002, there has been a consistent upward trend in the per capita GDP of these cities, marked by steady growth from 2002 to 2008, followed by a more accelerated pace from 2009 to 2020. Notably, in 2020, key metrics such as maximum, median, and lower-median per capita GDP reached their zenith for these cities. It's also significant to observe that the variability in per capita GDP among non-resource cities is considerably greater compared to resource cities. Despite this, the deviations in per capita GDP within resource cities are more pronounced, highlighting that a minority of these cities have a per capita GDP substantially above the average for their counterparts, indicating intriguing economic disparities.
The economic growth differentiation of China's resource cities from 2005 to 2020, categorized into four types, demonstrates clear heterogeneity(Figure 4). An analysis of their per capita GDP growth trends shows continuous growth across all types. Regenerating cities recorded the highest median per capita GDP, followed by declining, mature, and then growing cities. In 2005, the per capita GDP differentiation among these city types was relatively low. However, from 2010 to 2020, this differentiation increased, with regenerative cities showing the most significant variation in 2015, which then began to decrease by 2020.
2.5. Divergence in the Quality of Economic Growth in China's Resource-Based Cities
To analyze the differentiation in economic growth quality in Chinese cities, per capita GDP growth rates are examined, focusing on characteristics and heterogeneity. Figure 5 presents box plots of these rates for both non-resource-based and resource-based cities from 2002 to 2020. The trends in urban per capita GDP growth rates between these two types of cities are quite similar. The period from 2002 to 2007 saw an increasing trend, peaking in 2007. Due to the global economic and financial crisis in 2008, growth rates declined in 2008 and 2009, with a further continuous decline observed from 2010 to 2020. Notably, in 2019 and 2020, the median and 75th quartile GDP per capita growth rates of resource-based cities surpassed those of non-resource-based cities. The differentiation in per capita GDP growth rates is more pronounced among resource-based cities compared to non-resource-based cities, with a broader range of extreme values observed between 2012 and 2019.
Figure 6 illustrates the per capita GDP growth rates of growing, mature, declining, and regenerating resource cities over five selected years: 2000, 2005, 2010, 2015, and 2020. An upward trend is observed in all four types of cities from 2000 to 2010, followed by a downward trend from 2010 to 2020. Growing cities demonstrate the highest growth rate, with regenerative cities coming in second. During 2000 to 2010, declining cities had higher growth rates than mature cities, but this trend reversed from 2010 to 2020. The differentiation in growth rates is most consistent for regenerative cities, remaining stable over time. In contrast, the variation in growth rates for mature and declining cities decreased between 2015 and 2020, while increasing for growing cities.
2.6. The Differentiation of Industrial Development in China's Resource-Based Cities
Figure 7 illustrate the proportion of primary industry output in the GDP of four types of resource cities from 2010 to 2020. This decade witnessed relatively stable proportions across all city types. Growing and mature resource cities averaged around a 15% contribution of primary industry to their GDP, while declining and regenerating cities averaged closer to 9%. Growing cities showed the highest proportion, with a decelerating growth trend. In contrast, mature, regenerative, and declining cities ranked second, third, and fourth, respectively. The greatest variability was observed in mature cities, followed by growing, regenerative, and declining types. The COVID-19 pandemic significantly impacted the primary industry's share in declining cities, resulting in increased differentiation in 2020.
Figure 8 depicts the proportion of secondary industry output to GDP for four types of resource-based cities from 2010 to 2020. A noticeable decline in the secondary industry's contribution was seen across all city types during this period. Declining cities experienced the most significant drop, with a 19.47 percentage point decrease. Growing cities experienced a 13.91 percentage point decline, while mature cities' contribution fell by 13.83 points. Regenerative cities had the smallest reduction of 11.52 points. The variation in secondary industry output value was highest in mature cities, followed by growing, declining, and regenerative cities. The degree of differentiation in regenerative cities' secondary industry output value initially decreased until 2018 but increased in the following two years.
Figure 9 shows the growth of the tertiary industry's contribution to GDP in four types of resource-based cities from 2010 to 2020. Declining cities experienced the largest increase in tertiary output, up 18.39 percentage points. Mature cities followed with a 13.84-point rise, regenerative cities increased by 12.73 points, and growth cities by 12.45 points. Despite these increases, growth cities had the smallest rise. Mature cities displayed the greatest variation in tertiary industry output, followed by growth, decline, and regeneration of cities. These trends indicate a consistent shift towards the tertiary sector across all city types.
3. The ‘Resource Curse’ Retested: An Analysis of Heterogeneity
Since the late 20th century, contrasting studies have emerged regarding economic growth and natural resources. Scholars have found that regions with scarce resources often exhibit growth, while resource-rich areas may stagnate or decline [11,12,13,14]. This finding challenges the conventional view that natural resources uniformly foster economic growth. Auty introduced the resource curse notion, proposing that natural resources can both positively and negatively impact growth [15]. Instead of facilitating developmental goals, resource abundance often leads to slow growth [6,13,14,16,17], deindustrialization [3,18,19,20], widening wealth gaps, and unsustainable development [21,22,23]. Recent research extends the resource curse analysis to both national and subnational levels, as demonstrated in various regions of the United States [24,25,26] and China [27,28,29]. Empirical studies underscore the complex impact of natural resources on economic growth [30]. The relationship between resources and growth is multifaceted; both positive and negative effects can be observed, with some resources like minerals, oil, and coal typically contributing positively [31]. However, this resource welfare effect, varies significantly among countries and over time [32]. For instance, in the top 19 exporting nations, precious metals are more likely to lead to a resource curse [33]. This suggests that resource abundance doesn't universally lead to economic stagnation. The link between resource dependence and economic growth is particularly complex in urban and smaller regions, highlighting the need for a detailed, diverse analysis of the resource curse phenomenon.
Figure 10's scatterplot and analysis of GDP growth rate and resource dependence in Chinese cities from 2012 to 2020 present a nuanced picture. The existing literature distinguishes between resource abundance and resource dependence. Resource abundance is the total amount of a region's natural resource wealth over a given period, while resource dependence is the extent to which an economy relies on resources in its development process. There are significant differences in their impact on the economy; resource dependence is a key factor leading to the ‘resource curse’ phenomenon, while resource abundance does not necessarily lead to the ‘resource curse’ [21]. Therefore, this paper adopts the proportion of employees in the mining industry to the total number of employees at year-end in the city to measure resource dependence. The advantages of this indicator include: first, the mining industry comprises subsectors related to the development and utilization of natural resources, accurately reflecting the city's degree of resource dependence; second, compared with other indicators, the year-end employment population data is more stable,reducing the impact of measurement error on the empirical analysis. In Figure 10, non-resource cities exhibit a low level of resource dependence, with the majority showing less than 5% reliance on resources. The correlation coefficient between their per capita GDP growth rate and resource dependence is negligible -0.0067, lacking statistical significance. In stark contrast, resource-based cities display a much higher resource dependence, typically exceeding 20%. Here, the correlation between per capita GDP growth rate and resource dependence is -0.1, which is statistically significant at the 1% level. This evidence underscores the presence of the ‘resource curse’ in China's resource cities, suggesting that reliance on resources tends to hinder their economic growth.
This brings us to the question: Why is there such marked economic growth differentiation among China's resource cities? We propose that the ‘resource curse’ is not a perpetual condition but manifests under specific circumstances. Consequently, this paper delves deeper, investigating the existence of the ‘resource curse’ across various types of resource cities and their developmental stages, to understand the nuances of this phenomenon better.
Figure 11 shows distinct correlations between per capita GDP growth and resource dependence for four types of Chinese resource cities. Growing cities (a) exhibit a U-shaped relationship, indicating beneficial effects of higher resource dependence. However, mature cities (b), reveal a resource curse with an inverse correlation, implying that increased resource dependence does not foster economic growth. Declining cities (c) show a near-horizontal trend, indicating a minimal negative impact from resource dependence. Regenerative cities (d) demonstrate an inverted U-shaped relationship, with a critical inflection point at around 6% resource dependence. To test the heterogeneity among these four types of resource-based cities as illustrated in Figure 11, the Chow test and the SUEST test are applied. According to Table 1, both the Chow test and the SUEST test reject the null hypothesis at the 1% level, indicating significant differences between groups. This confirms significant heterogeneity in the effect of the degree of resource dependence on the per capita GDP growth rate in the four types of resource-based cities.
The analysis presented reveals a striking heterogeneity in the impact of resource dependence on economic development. Depending on their type or stage of development, cities experience varied effects: in some instances, resource dependence acts as a catalyst for economic growth, while in others, it serves as a constraint, highlighting the complex interplay between resource reliance and urban economic dynamics.Growing cities, in their early development stages, benefit from booming resource industries, necessitating a strategic plan for sustainable growth. Mature cities, with developed resource industries, face growth restrictions due to increased resource dependence. For these cities promoting extended industries and regulating resource expansion is key. Declining cities, with depleted resources, should pivot to alternative industries, adapting to urban contraction. Regenerative cities, less dependent on resources, should focus on new strategic industries and modern services for sustainable development.
4. Heterogeneity behind Economic Growth Variations in Resource-Based Cities
The transformation of resource-based cities, a topic that emerged in the early 20th century, has been viewed through various theoretical lenses including the Staple Theory [34], the hurricane development method [35], and theories focusing on development and transformation [36], as well as whole life cycle development [37]. By the late 1980s, the focus shifted to concepts like long-distance commuting [38] and diverse economic structural transformations [39]. As industrialization and urbanization accelerate globally, resource-based cities are increasingly grappling with the depletion of non-renewable resources and environmental deterioration, leading to an unavoidable decline in these areas [40]. A consensus among scholars is that abundant resource endowments often hinder sustained economic growth, with the developmental trajectory of resource-based cities typically following a 'growth-boom-decline' pattern as resources dwindle [41]. The core issue at the heart of the 'resource curse' in these cities is their excessive dependence on resource industries [42].
Recent discourse on transforming Chinese resource cities focuses on overcoming the resource curse, a key concern for both governments and scholars. In the realm of related research, there are numerous and illustrative examples of the transformation of resource cities in China. This abundance of case studies is primarily attributable to the greater number of resource cities within China, as well as the intricate interplay between government, economy, society, and environment in these locales [1]. Studies emphasize the government's pivotal role in this transformation, particularly in mitigating the negative effects of resource dependence [1]. Additionally, factors like local officials’ political incentives [43], human capital accumulation [44], investment in science and technology [45], and industry diversification [9] play a critical role in driving sustainable development in these cities.
While existing research offers valuable insights into the transformation of resource cities, there remains a relative lack of focus on elucidating the economic growth differentiation and the heterogeneity inherent in these cities. This paper seeks to address this gap by examining the impact of three key dimensions: demographic shifts, geographic location, and institutional environments, on the economic growth differentiation in resource cities.
The rationale for selecting these dimensions is multifaceted: Firstly, studies specifically addressing population change, geographic location, and institutional environments in this context are scarce. Secondly, while population decline is a common trait of resource-based cities, we observe contrasting trends of population growth in certain cases, warranting further exploration. Thirdly, the diverse spatial distribution of China's resource cities, spanning coastal to inland areas, presents a unique opportunity to investigate variations in economic development patterns. Lastly, the simplistic categorization of institutional environments as either 'good' or 'bad' overlooks their historical context and the significant regional variations that can arise from differences in governance capabilities, economic conditions, and social factors.
By exploring the economic growth differentiation in resource cities through the lens of these heterogeneous factors, this paper aims to underscore the importance of heterogeneity in understanding resource cities and advocates for more research on their sustainable development from this perspective.
4.1. Demographic Change and Divergent Economic Growth
The population factor is a crucial component of urban economic development, with the size of the population significantly influencing long-term economic growth [46]. Research on population dynamics in resource-based cities has largely concentrated on issues such as population decline, urban shrinkage[47], human capital accumulation [44], and their interplay with city contraction[48]. As exemplars of negative population growth, demographic factors are commonly utilized to assess the extent of urban shrinkage in resource-based cities. However, despite the global trend of negative population growth, some resource cities in China have witnessed ongoing population increases. This raises the question: does the variability in population change affect the economic development of resource cities? Existing research examining economic growth in resource cities, particularly from the perspective of population change differences, is notably scarce. Therefore, we aim to conduct a comparative analysis on the impact of population change heterogeneity on both non-resource cities and various types of resource cities.
In Figure 12, the correlation coefficient for non-resource cities is 2711, significant at the 1% level, indicating a positive impact of population growth on their economy. In resource cities, a trend of low population growth is observed. Mature cities show a negative correlation coefficient of -1109, significant at the 10% level. Declining cities have a positive correlation coefficient of 1795, significant at the 5% level, suggesting population growth aids their economic development. This data underscores the need for mature cities to focus on human capital development and for declining cities to diversify their economic base. The analysis reveals a significant positive correlation in non-resource cities, emphasizing the contributory role of population growth to their economic development. However, resource-based cities generally exhibit low population growth. The data for mature resource cities show a negative correlation between population growth and GDP per capita, indicating that an increase in population might negatively impact their economic growth. In contrast, declining resource cities demonstrate a positive correlation, suggesting population growth can be beneficial for their economy. This dichotomy indicates the need for tailored strategies: mature cities should respond to population outflow trends by focusing on human capital development, while declining cities should diversify from resource dependence, attracting labor in alternative industries and enhancing infrastructure and public services to foster sustainable growth and improve quality of life.
4.2. Geographic Location and Economic Growth Divergence
Geographic location significantly influences regional economic development, particularly in China where coastal cities benefit from maritime trade and economic activities concentrated in the eastern region. This geographic advantage, bolstered by development, contributes to economic agglomeration, enhancing supply-demand matching [49], regional productivity [50], and economic growth [51]. The center-periphery spatial development pattern resulting from economic agglomeration leads to significant externalities in central regions [52]. However, the literature on resource-based city’s economic development considering geographic location is limited [17]. This perspective stems from the prevailing notion in many studies that geographic location is a static factor. These studies often attribute the prosperity of resource cities solely to their natural resources, overlooking the diversity in spatial and geographic distribution among these cities. Consequently, it becomes imperative to concentrate on how the variations in geographic locations contribute to the divergent economic growth trajectories in resource-based cities.
Figure 13, which calculates correlations based on the straight-line distance to major ports such as Dalian, Tangshan, and others, shows significant correlations in Chinese cities. In non-resource cities, a negative correlation coefficient of -21 at the 1% level indicates a positive impact of port proximity on GDP per capita. For resource cities, growing, declining, and regenerating types show negative coefficients (-38, -14, and -21, respectively), all significant at the 1% level, suggesting geographic location influences economic growth. Conversely, mature resource cities have a positive coefficient of 15, signifying a contrasting trend.
These results emphasize the importance of geographic location in urban economic development. Proximity to major ports benefits most city types, except for mature resource cities, where over-reliance on resource industries may negate this advantage. To enhance sustainable development, growing, declining, and regenerating resource, cities should improve transportation links to ports, while mature cities need to diversify their economies and capitalize on their geographic advantages. Adopting this approach can strengthen economic ties and promote holistic urban development.
4.3. Institutional Environment and Growth Divergence
The study of institutions and natural resource wealth, a crucial aspect of the resource curse discourse, suggests that resource exploitation often leads to interest groups influencing political decisions, causing rent-seeking and corruption [53]. This corruption weakens institutions [54] and hinders innovation [55]. Mehlum and Moene emphasize that institutional quality determines whether resources become a curse or a blessing [56]. Poor institutions not only limit the economic benefits of resource wealth [54] but also promote corruption [57,58], exacerbating the resource curse [59]. A robust institutional environment, therefore, is crucial for transforming resource wealth into sustainable growth and can positively influence financial development [60], potentially mitigating the resource curse [61].
Previous studies on institutional environments have largely been conducted at the national level, but variation within a country also exists. The institutional environment includes factors like governmental efficiency, rule of law, corruption incidence, and governance capacity [62]. The 'resource curse' effect, manifested as a negative impact of natural resources on economic growth, is more pronounced in regions with higher marketization [63]. The assessment of the institutional environment is undoubtedly a multifaceted issue. In this study, we employ the marketization composite index developed by the Chinese economist Fan Gang as a metric for the institutional environment. This index offers a comprehensive evaluation of the marketization process across five dimensions: the interaction between government and market, the growth of the non-state sector, the advancement of the product market, the maturity of the factor market, and the progress of market intermediary organizations along with the legal and institutional framework. Regrettably, the scope of the marketization composite index is limited to 31 provinces in China. Consequently, this paper's analysis of the heterogeneous impacts of the institutional environment on economic growth in resource cities is constrained to examining the variations in the institutional environments of the provinces where these cities are situated.
Figure 14 illustrates the correlation between the institutional environment and urban GDP per capita. In non-resource cities, a strong correlation of 0.7431, significant at the 1% level, suggests a better institutional environment leads to higher GDP per capita. For growing and mature resource cities, the institutional environment significantly affects per capita GDP with correlation coefficients of 6405 and 5242 at the 5% and 1% levels. However, in declining and regenerating resource cities, the institutional environment's impact is not significant. This indicates the varying importance of institutional environment in different types of resource cities and the need for focused attention on improving it in resource-rich areas for sustainable economic growth.
5. Future Outlook: Navigating the Sustainable Development Trajectory of Resource-Based Cities through Heterogeneity
This paper's research and conclusions underscore the criticality of heterogeneity in resource-based cities. It's essential to formulate strategies that are specifically tailored to the unique conditions and disparities inherent in these cities. Future research dedicated to the sustainable development of resource cities should prioritize the identification and exploration of their heterogeneous attributes and distinct developmental pathways. Accordingly, this paper proposes several approaches for investigating diverse development trajectories, drawing upon the heterogeneity found within resource cities.
Firstly, it is vital to further refine and expand the categorization of resource-based cities. While the existing classification into growing, mature, declining, and regenerating resource cities may seem somewhat broad, it effectively highlights the significant differences in resource reserves and the varying needs for sustainable urban development. For instance, the Chinese government identified 69 resource-depleted cities across three groups in 2008, 2009, and 2011, offering them fiscal support from the central government. A notable example is Jiaozuo City, which, after receiving nearly 5 billion yuan in financial aid, successfully transitioned to manufacturing. This city boasts an annual titanium dioxide production capacity exceeding 1.5 million tons — the largest globally; it leads in the production and sales of lithium hexafluorophosphate; and it ranks first worldwide in conductive carbon black production and sales. Clearly, different types of resource-based cities face unique challenges in industrial transformation and sustainable economic development. In the future, a more nuanced understanding of resource cities, considering aspects like strategic positioning, industrial characteristics, and resource endowments, is crucial for their effective categorization and development planning.
Secondly, it's essential to design diverse sustainable development paths that reflect the unique characteristics of resource-based cities. This paper has so far discussed the differentiation in resource-based economic growth primarily in terms of demographic changes, geographic location, and the institutional environment. However, many other heterogeneous characteristics of resource-based cities remain to be explored, such as demographic structure and aging, labor mobility, regional development strategies, and the digital economy. The success story of Karamay City exemplifies the importance of leveraging a city's distinct features for sustainable development. Located in western China, Karamay, an oil-rich city, has maximized its geographical advantages by harnessing its abundant solar energy resources. The city has vigorously developed photovoltaic power generation and other clean energy industries like hydrogen energy, achieving sustained economic growth. Going forward, recognizing, and utilizing the diversity in resource cities and their economic growth patterns is crucial. This approach holds significant value in devising differentiated and sustainable development paths tailored to each city’s unique context.
Third, there is a need to broaden the scope of research. Conducting comparative analyses between Chinese resource-based cities and their global counterparts can lead to a deeper understanding of common patterns and effective strategies. Engaging in such comparative studies not only enriches academic discussions but also contributes to the development of practical solutions for sustainable urban development that are applicable on a global scale.
6. Conclusions
First, there are obvious characteristics of economic growth differentiation in China's resource-based cities. (1) The per capita GDP growth rate of resource-based cities is more differentiated than that of non-resource-based cities. From the perspective of the four types of resource cities, the per capita GDP growth rate of regenerative resource cities has the lowest degree of differentiation. (2) The differentiation of economic growth in resource cities is on a widening trend. The gap in per capita GDP between resource cities expanded rapidly after 2004, and remained at a high level by 2014. From the perspective of the four types of resource cities, the per capita GDP differentiation of the growing resource cities gradually expands after 2010, becomes the resource city with the highest per capita GDP differentiation among the four types in 2020. (3) The development of primary, secondary and tertiary industries in resource cities is clearly differentiated. From the perspective of the primary industry, the changes in the proportion of output value of the primary industry in the four types of resource cities have been relatively stable. From the point of view of secondary industry, the proportion of output value of secondary industry in the four types of resource cities has shown a continuous downward trend. From the point of view of tertiary industry, the proportion of output value of tertiary industry in the four types of resource cities has shown a continuous upward trend.
Second, the manifestation of the resource curse phenomenon is conditional. Specifically, it is primarily observed in mature resource cities; in long and declining resource cities, the resource curse phenomenon is less evident. In contrast, in regenerative resource cities, resource dependence and economic growth exhibit an inverted U-shaped relationship.
Third, the heterogeneity of demographic changes, geographic location and institu-tional environment all significantly impact on the economic growth of resource cities. (1) In mature resource cities, population growth tends to be detrimental to economic growth, while in declining resource cities, it is beneficial. (2) The economic growth in growing, declining, and regenerating resource cities is positively influenced by geographic location advantages. However, for mature resource cities, these geographic advantages appear to have a negative impact on economic growth. (3) The institutional environment exerts a positive influence on the economic growth of growing and mature resource cities. In contrast, the economic growth of declining and regenerating resource cities does not show a significant correlation with the institutional environment.
Author Contributions
Conceptualization, Jiahao Chen and Cheng Zhan; Data curation, Jinhua Cheng; Formal analysis, Jiahao Chen and Tongping Li; Investigation, Jiahao Chen; Methodology, Jiahao Chen; Resources, Jinhua Cheng; Software, Yanqiong Zhao; Validation, Tongping Li and Jinhua Cheng; Writing – original draft, Jiahao Chen; Writing – review & editing, Chuandi Fang. All authors have read and agreed to the published version of the manuscript.
Funding
This research was funded by National Natural Science Foundation of China, grant number 71991482.
Data Availability Statement
Restrictions apply to the availability of these data. Data were obtained from China National Knowledge Infrastructure and are available from website (https://data.cnki.net) with the permission of China National Knowledge Infrastructure.
Conflicts of Interest
The authors declare no conflicts of interest.
References
- He, S.; Lee, J.; Zhou, T.; Wu, D. Shrinking cities and resource-based economy: The economic restructuring in China's mining cities. Cities 2017, 60, 75–83. [Google Scholar] [CrossRef]
- Yu, C.; de Jong, M.; Cheng, B. Getting depleted resource-based cities back on their feet again the example of Yichun in China. J Clean Prod 2016, 134, 42–50. [Google Scholar] [CrossRef]
- Corden, W.M.; Neary, J.P. Booming sector and de-industrialisation in a small open economy. The Economic Journal 1982, 92, 825–848. [Google Scholar] [CrossRef]
- Fan, F.; Zhang, X. Transformation effect of resource-based cities based on PSM-DID model: An empirical analysis from China. Environ Impact Asses 2021, 91. [Google Scholar] [CrossRef]
- Takatsuka, H.; Zeng, D.; Zhao, L. Resource-based cities and the Dutch disease. Resour Energy Econ 2015, 40, 57–84. [Google Scholar] [CrossRef]
- Fitjar, R.D.; Timmermans, B. Relatedness and the Resource Curse: Is There a Liability of Relatedness? Econ Geogr 2019, 95, 231–255. [Google Scholar] [CrossRef]
- Wen, S.; Jia, Z. Resource curse or resource blessing: Perspective on the nonlinear and regional relationships in China. J Clean Prod 2022, 371. [Google Scholar] [CrossRef]
- Sliuzas, R.; Martinez, J.; Bennett, R. Urban futures: Multiple visions, paths and construction? Habitat Int 2015, 46, 223–224. [Google Scholar] [CrossRef]
- Li, Q.; Zeng, F.; Liu, S.; Yang, M.; Xu, F. The effects of China's sustainable development policy for resource-based cities on local industrial transformation. Resour Policy 2021, 71. [Google Scholar] [CrossRef]
- Li, H.; Lo, K.; Wang, M. Economic transformation of mining cities in transition economies: lessons from Daqing, Northeast China. Int Dev Plann Rev 2015, 37, 311–328. [Google Scholar] [CrossRef]
- Gylfason, T. Natural resources, education, and economic development. Eur Econ Rev 2001, 45, 847–859. [Google Scholar] [CrossRef]
- Papyrakis, E.; Gerlagh, R. The resource curse hypothesis and its transmission channels. J Comp Econ 2004, 32, 181–193. [Google Scholar] [CrossRef]
- Sachs, J.D.; Warner, A.M. Natural Resource Abundance and Economic Growth. National Bureau of Economic Research Working Paper Series 1995, No. 5398.
- Gylfason, T.; Zoega, G. Natural resources and economic growth: The role of investment. World Econ 2006, 29, 1091–1115. [Google Scholar] [CrossRef]
- Richard, A. Sustaining development in mineral economies: the resource curse thesis. Routledge Press 1993, 1–2. [Google Scholar]
- Herbertsson, T.T.; Skuladottir, M.; Zoega, G. Three symptoms and a cure: A contribution to the economics of the Dutch disease. Centre for Economic Policy Research London: 2000; Vol. 23, p.
- Sachs, J.D.; Warner, A.M. Natural Resources and Economic Development: The curse of natural resources. Eur Econ Rev 2001, 45, 827–838. [Google Scholar] [CrossRef]
- Harding, T.; Stefanski, R.; Toews, G. Boom Goes the Price: Giant Resource Discoveries and Real Exchange Rate Appreciation. Econ J 2020, 130, 1715–1728. [Google Scholar] [CrossRef]
- Behzadan, N.; Chisik, R.; Onder, H.; Battaile, B. Does inequality drive the Dutch disease? Theory and evidence. J Int Econ 2017, 106, 104–118. [Google Scholar] [CrossRef]
- Corrocher, N.; Lenzi, C.; Deshaires, M. The curse of natural resources: an empirical analysis of European regions. Reg Stud 2020, 54, 1694–1708. [Google Scholar] [CrossRef]
- Hamilton, K. The Sustainability of Extractive Economies. In Resource Abundance and Economic Development, Auty, R.M.,Ed. Oxford University Press: Oxford, 2001; pp 36-56.
- Papyrakis, E.; Gerlagh, R. Resource windfalls, investment, and long-term income. Resour Policy 2006, 31, 117–128. [Google Scholar] [CrossRef]
- Brutschin, E.; Fleig, A. Innovation in the energy sector - The role of fossil fuels and developing economies. Energ Policy 2016, 97, 27–38. [Google Scholar] [CrossRef]
- Papyrakis, E.; Gerlagh, R. Resource abundance and economic growth in the United States. Eur Econ Rev 2007, 51, 1011–1039. [Google Scholar] [CrossRef]
- James, A.; Aadland, D. The curse of natural resources: An empirical investigation of US counties. Resour Energy Econ 2011, 33, 440–453. [Google Scholar] [CrossRef]
- Allcott, H.; Keniston, D. Dutch Disease or Agglomeration? The Local Economic Effects of Natural Resource Booms in Modern America. Rev Econ Stud 2018, 85, 695–731. [Google Scholar] [CrossRef]
- Shao, S.; Qi, Z. Energy exploitation and economic growth in Western China: An empirical analysis based on the resource curse hypothesis. Front Econ China 2009, 4, 125–152. [Google Scholar] [CrossRef]
- Dou, S.; Yue, C.; Xu, D.; Wei, Y.; Li, H. Rethinking the ‘resource curse’: New evidence from nighttime light data. Resour Policy 2022, 76. [Google Scholar] [CrossRef]
- He, X.; Mou, D. Impacts of mineral resources: Evidence from county economies in China. Energ Policy 2020, 136. [Google Scholar] [CrossRef]
- Havranek, T.; Horvath, R.; Zeynalov, A. Natural Resources and Economic Growth: A Meta-Analysis. World Dev 2016, 88, 134–151. [Google Scholar] [CrossRef]
- Stijns, J. Natural resource abundance and economic growth revisited. Resour Policy 2005, 30, 107–130. [Google Scholar] [CrossRef]
- Ben-Salha, O.; Dachraoui, H.; Sebri, M. Natural resource rents and economic growth in the top resource-abundant countries: A PMG estimation. Resour Policy 2021, 74. [Google Scholar] [CrossRef]
- Ozcan, B.; Temiz, M.; Tarla, E.G. The resource curse phenomenon in the case of precious metals: A panel evidence from top 19 exporting countries. Resour Policy 2023, 81. [Google Scholar] [CrossRef]
- Machintosh, W.A. Economic Factors in Canadian History. Can Hist Rev 1923, 4, 12–25. [Google Scholar] [CrossRef]
- Innis, H.A. The Fur Trade in Canada: an Introduction to Canadian Economic History. University of Toronto Press: Toronto, 1930; Vol. 33, p 383-402.
- Bradbury, J.H. Towards an alternative theory of resource-based town development in Canada. Econ Geogr 1979, 55, 147–166. [Google Scholar] [CrossRef]
- Bradbury, J.H.; St-Martin, I. Winding Down in a Quebec Mining Town: a Case Study of Schefferville. Canadian Geographer / Le Géographe Canadien 1983, 27, 128–144. [Google Scholar] [CrossRef]
- Houghton, D.S. Long-distance commuting: a new approach to mining in Australia. Geogr J 1993, 281–290. [Google Scholar] [CrossRef]
- Randall, J.E.; Ironside, R.G. Communities on the edge: An economic geography of resource-dependent communities in Canada. Canadian Geographer/Le Géographe Canadien 1996, 40, 17–35. [Google Scholar] [CrossRef]
- Martinez-Fernandez, C.; Wu, C.; Schatz, L.K.; Taira, N.; Vargas-Hernandez, J.G. The Shrinking Mining City: Urban Dynamics and Contested Territory. Int J Urban Regional 2012, 36, 245–260. [Google Scholar] [CrossRef] [PubMed]
- Jiao, W.; Zhang, X.; Li, C.; Guo, J. Sustainable transition of mining cities in China: Literature review and policy analysis. Resour Policy 2021, 74. [Google Scholar] [CrossRef]
- Van der Ploeg, F. Natural Resources: Curse or Blessing? J Econ Lit 2011, 49, 366–420. [Google Scholar] [CrossRef]
- Zhang, H.; Xiong, L.; Li, L.; Zhang, S. Political incentives, transformation efficiency and resource-exhausted cities. J Clean Prod 2018, 196, 1418–1428. [Google Scholar] [CrossRef]
- Shao, S.; Yang, L.L. Natural resource dependence, human capital accumulation, and economic growth: A combined explanation for the resource curse and the resource blessing. Energ Policy 2014, 74, 632–642. [Google Scholar] [CrossRef]
- Guo, S.; Zhang, Y.; Qian, X.; Ming, Z.; Nie, R. Urbanization and CO2 emissions in resource-exhausted cities: evidence from Xuzhou city, China. Nat Hazards 2019, 99, 807–826. [Google Scholar] [CrossRef]
- Jones, C.I. Was an industrial revolution inevitable? Economic growth over the very long run. Advances in Macroeconomics 2001, 1, 1–43. [Google Scholar]
- Long, Y.; Wu, K. Shrinking cities in a rapidly urbanizing China. Environment and Planning a: Economy and Space 2016, 48, 220–222. [Google Scholar] [CrossRef]
- Shao, S.; Zhang, X.B.; Yang, L.L. Natural resource dependence and urban shrinkage: The role of human capital accumulation. Resour Policy 2023, 81. [Google Scholar] [CrossRef]
- Giuliano, G.; Kang, S.; Yuan, Q. Agglomeration economies and evolving urban form. The Annals of Regional Science 2019, 63, 377–398. [Google Scholar] [CrossRef]
- Fontagné, L.; Santoni, G. Agglomeration economies and firm-level labor misallocation. J Econ Geogr 2019, 19, 251–272. [Google Scholar] [CrossRef]
- Duranton, G.; Puga, D. Micro-foundations of urban agglomeration economies. In Elsevier: 2004; Vol. 4, pp 2063-2117.
- Garcia López, M.À.; Muñiz, I. Urban spatial structure, agglomeration economies, and economic growth in Barcelona: An intra-metropolitan perspective. Pap Reg Sci 2013, 92, 515–534. [Google Scholar] [CrossRef]
- Mauro, P. Corruption: causes, consequences, and agenda for further research. Finance & Development 1998, 1, 10–14. [Google Scholar]
- Deacon, R.T.; Mueller, B. Political economy and natural resource use. In Economic Development and Environmental Sustainability: New Policy Options, Oxford University Press: 2006; pp 122-153.
- Baland, J.; Francois, P. Rent-seeking and resource booms. J Dev Econ 2000, 61, 527–542. [Google Scholar] [CrossRef]
- Mehlum, H.; Moene, K.; Torvik, R. Institutions and the resource curse. Econ J 2006, 116, 1–20. [Google Scholar]
- Brollo, F.; Nannicini, T.; Perotti, R.; Tabellini, G. The Political Resource Curse. Am Econ Rev 2013, 103, 1759–1796. [Google Scholar] [CrossRef]
- Vicente, P.C. Does oil corrupt? Evidence from a natural experiment in West Africa. J Dev Econ 2010, 92, 28–38. [Google Scholar] [CrossRef]
- Wiens, D. Natural resources and institutional development. J Theor Polit 2014, 26, 197–221. [Google Scholar] [CrossRef]
- Khan, M.A.; Gu, L.; Khan, M.A.; Olah, J. Natural resources and financial development: The role of institutional quality. J Multinatl Financ M 2020, 56. [Google Scholar] [CrossRef]
- Eslamloueyan, K.; Jafari, M. Do high human capital and strong institutions make oil-rich developing countries immune to the oil curse? Energ Policy 2021, 158. [Google Scholar] [CrossRef]
- Ross, M.L. What Have We Learned about the Resource Curse? Annu Rev Polit Sci 2015, 18, 239–259. [Google Scholar] [CrossRef]
- Lee, C.; He, Z. Natural resources and green economic growth: An analysis based on heterogeneous growth paths. Resour Policy 2022, 79. [Google Scholar] [CrossRef]
Figure 1.
Scatterplot of per capita GDP and GDP growth rate of Chinese cities in 2020.
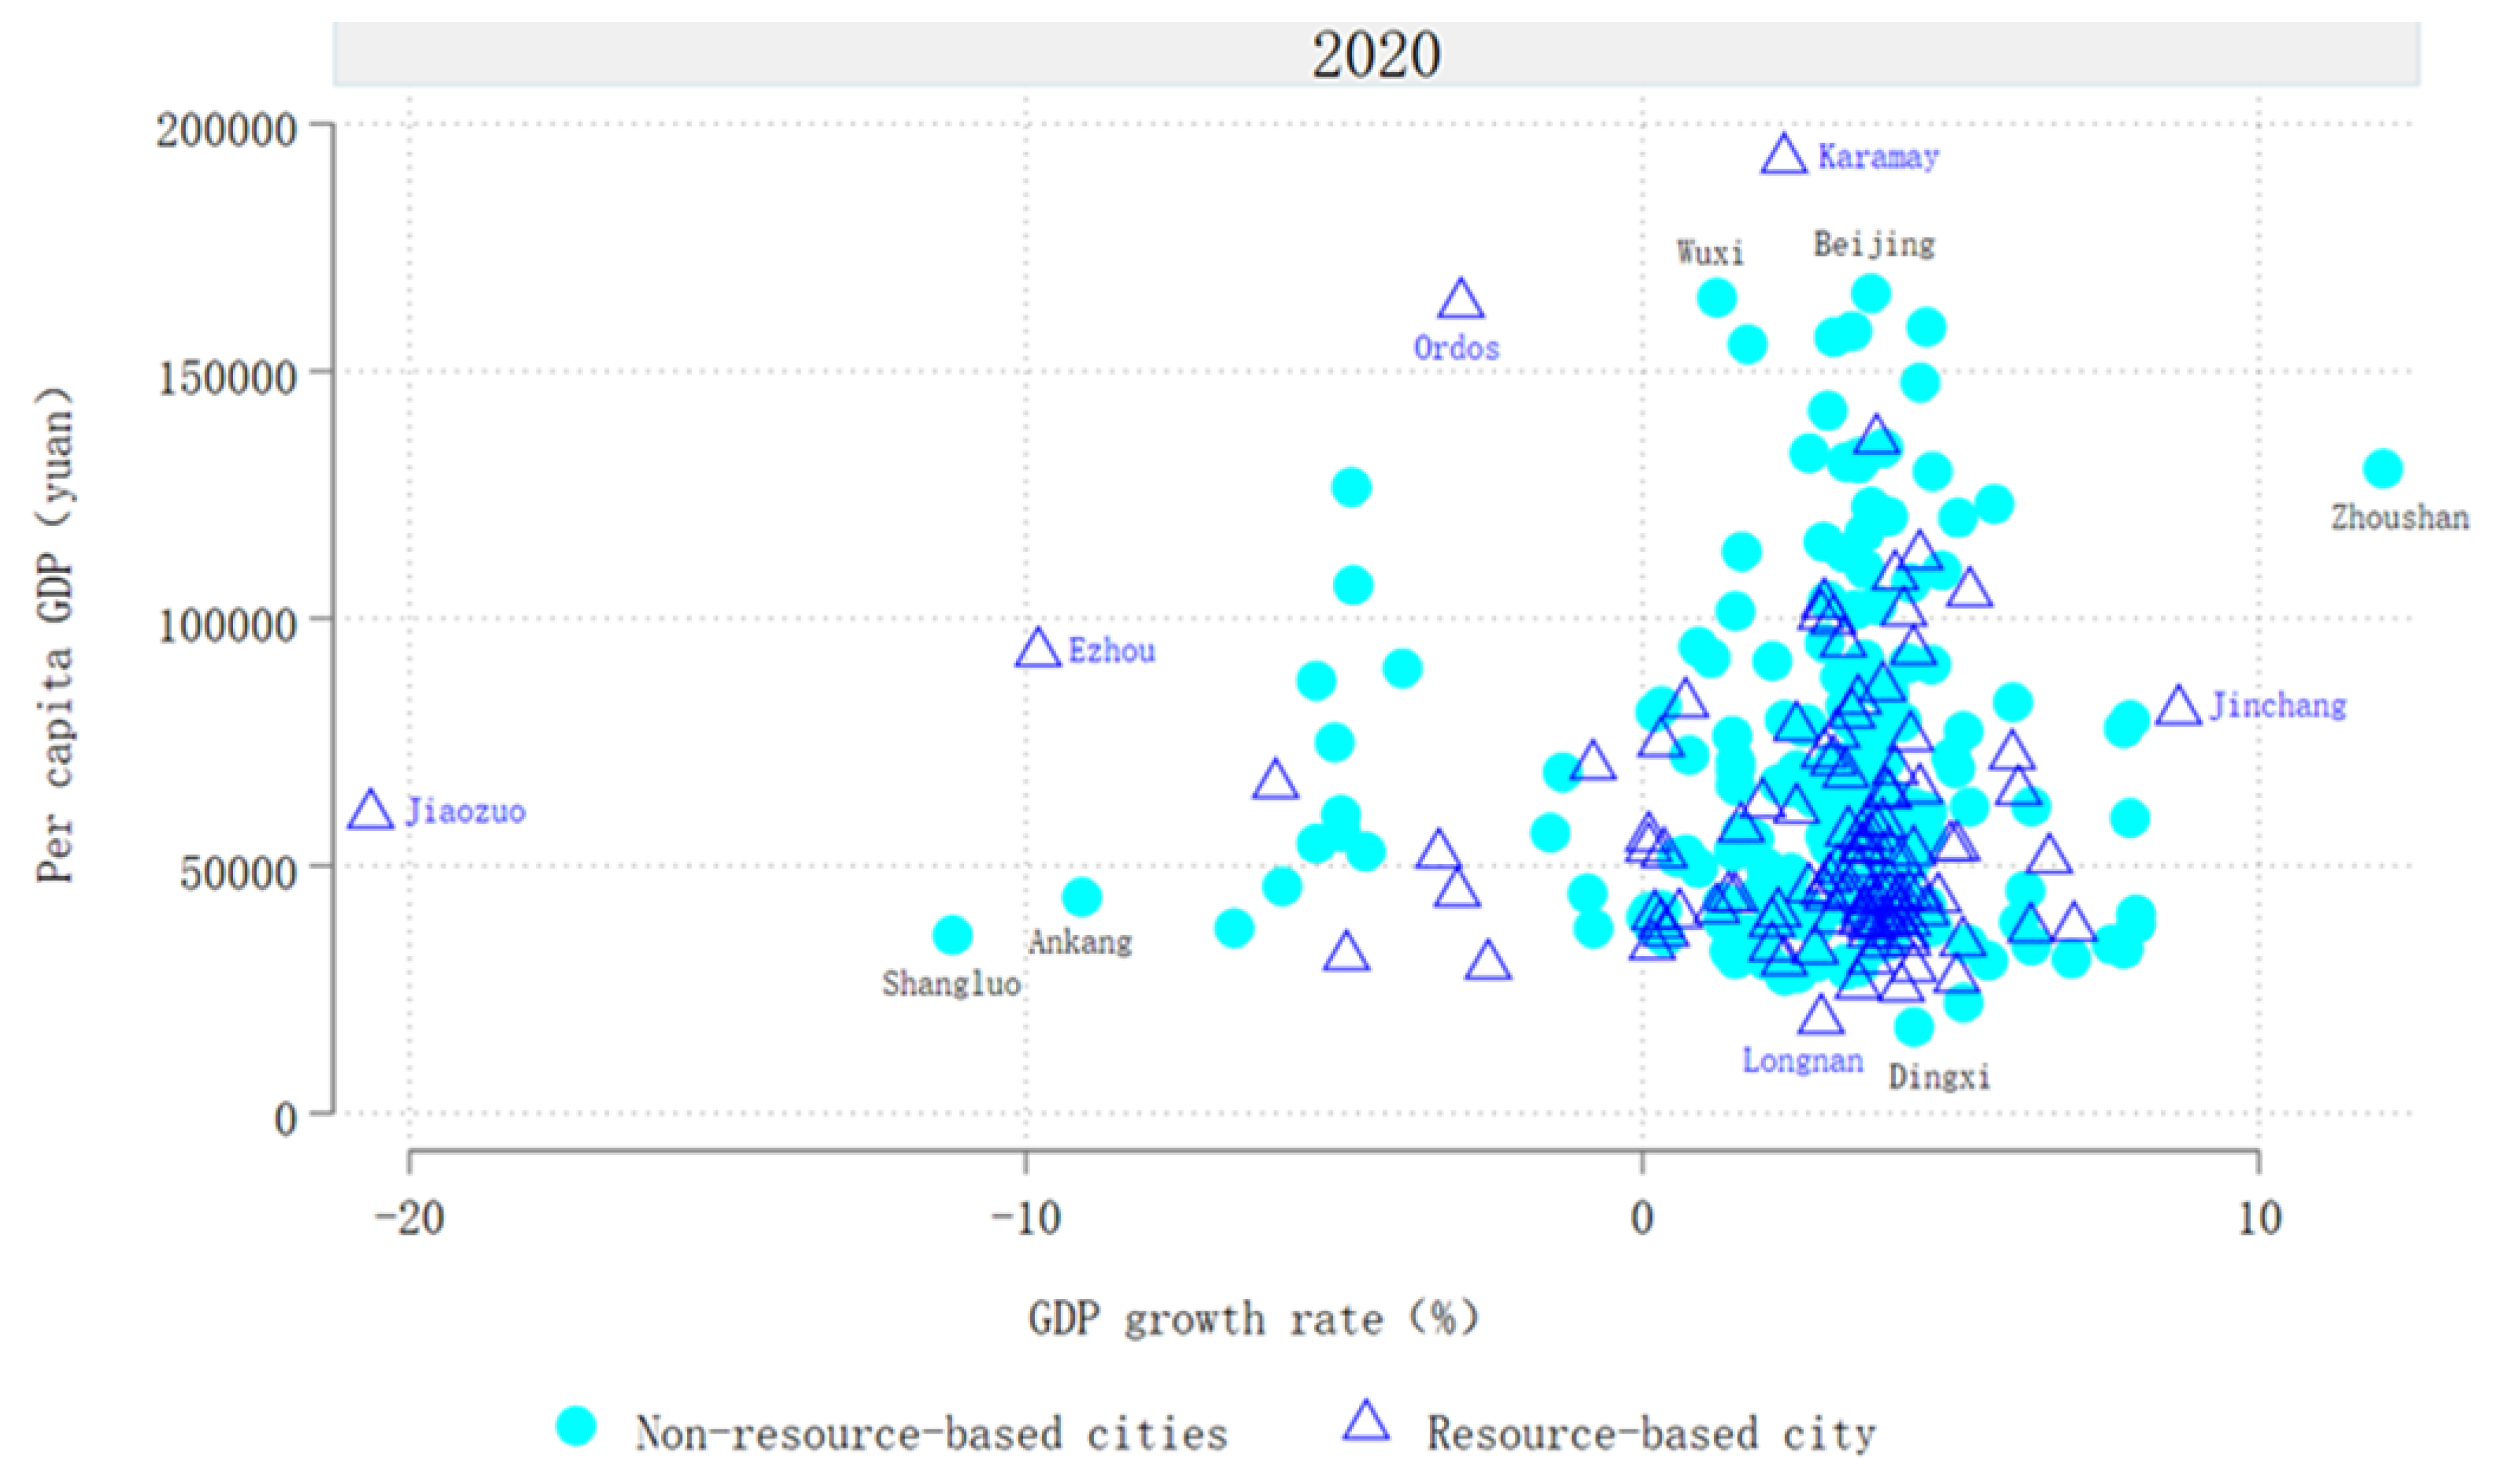
Figure 2.
Spatial distribution of different types of resource-based cities in China.
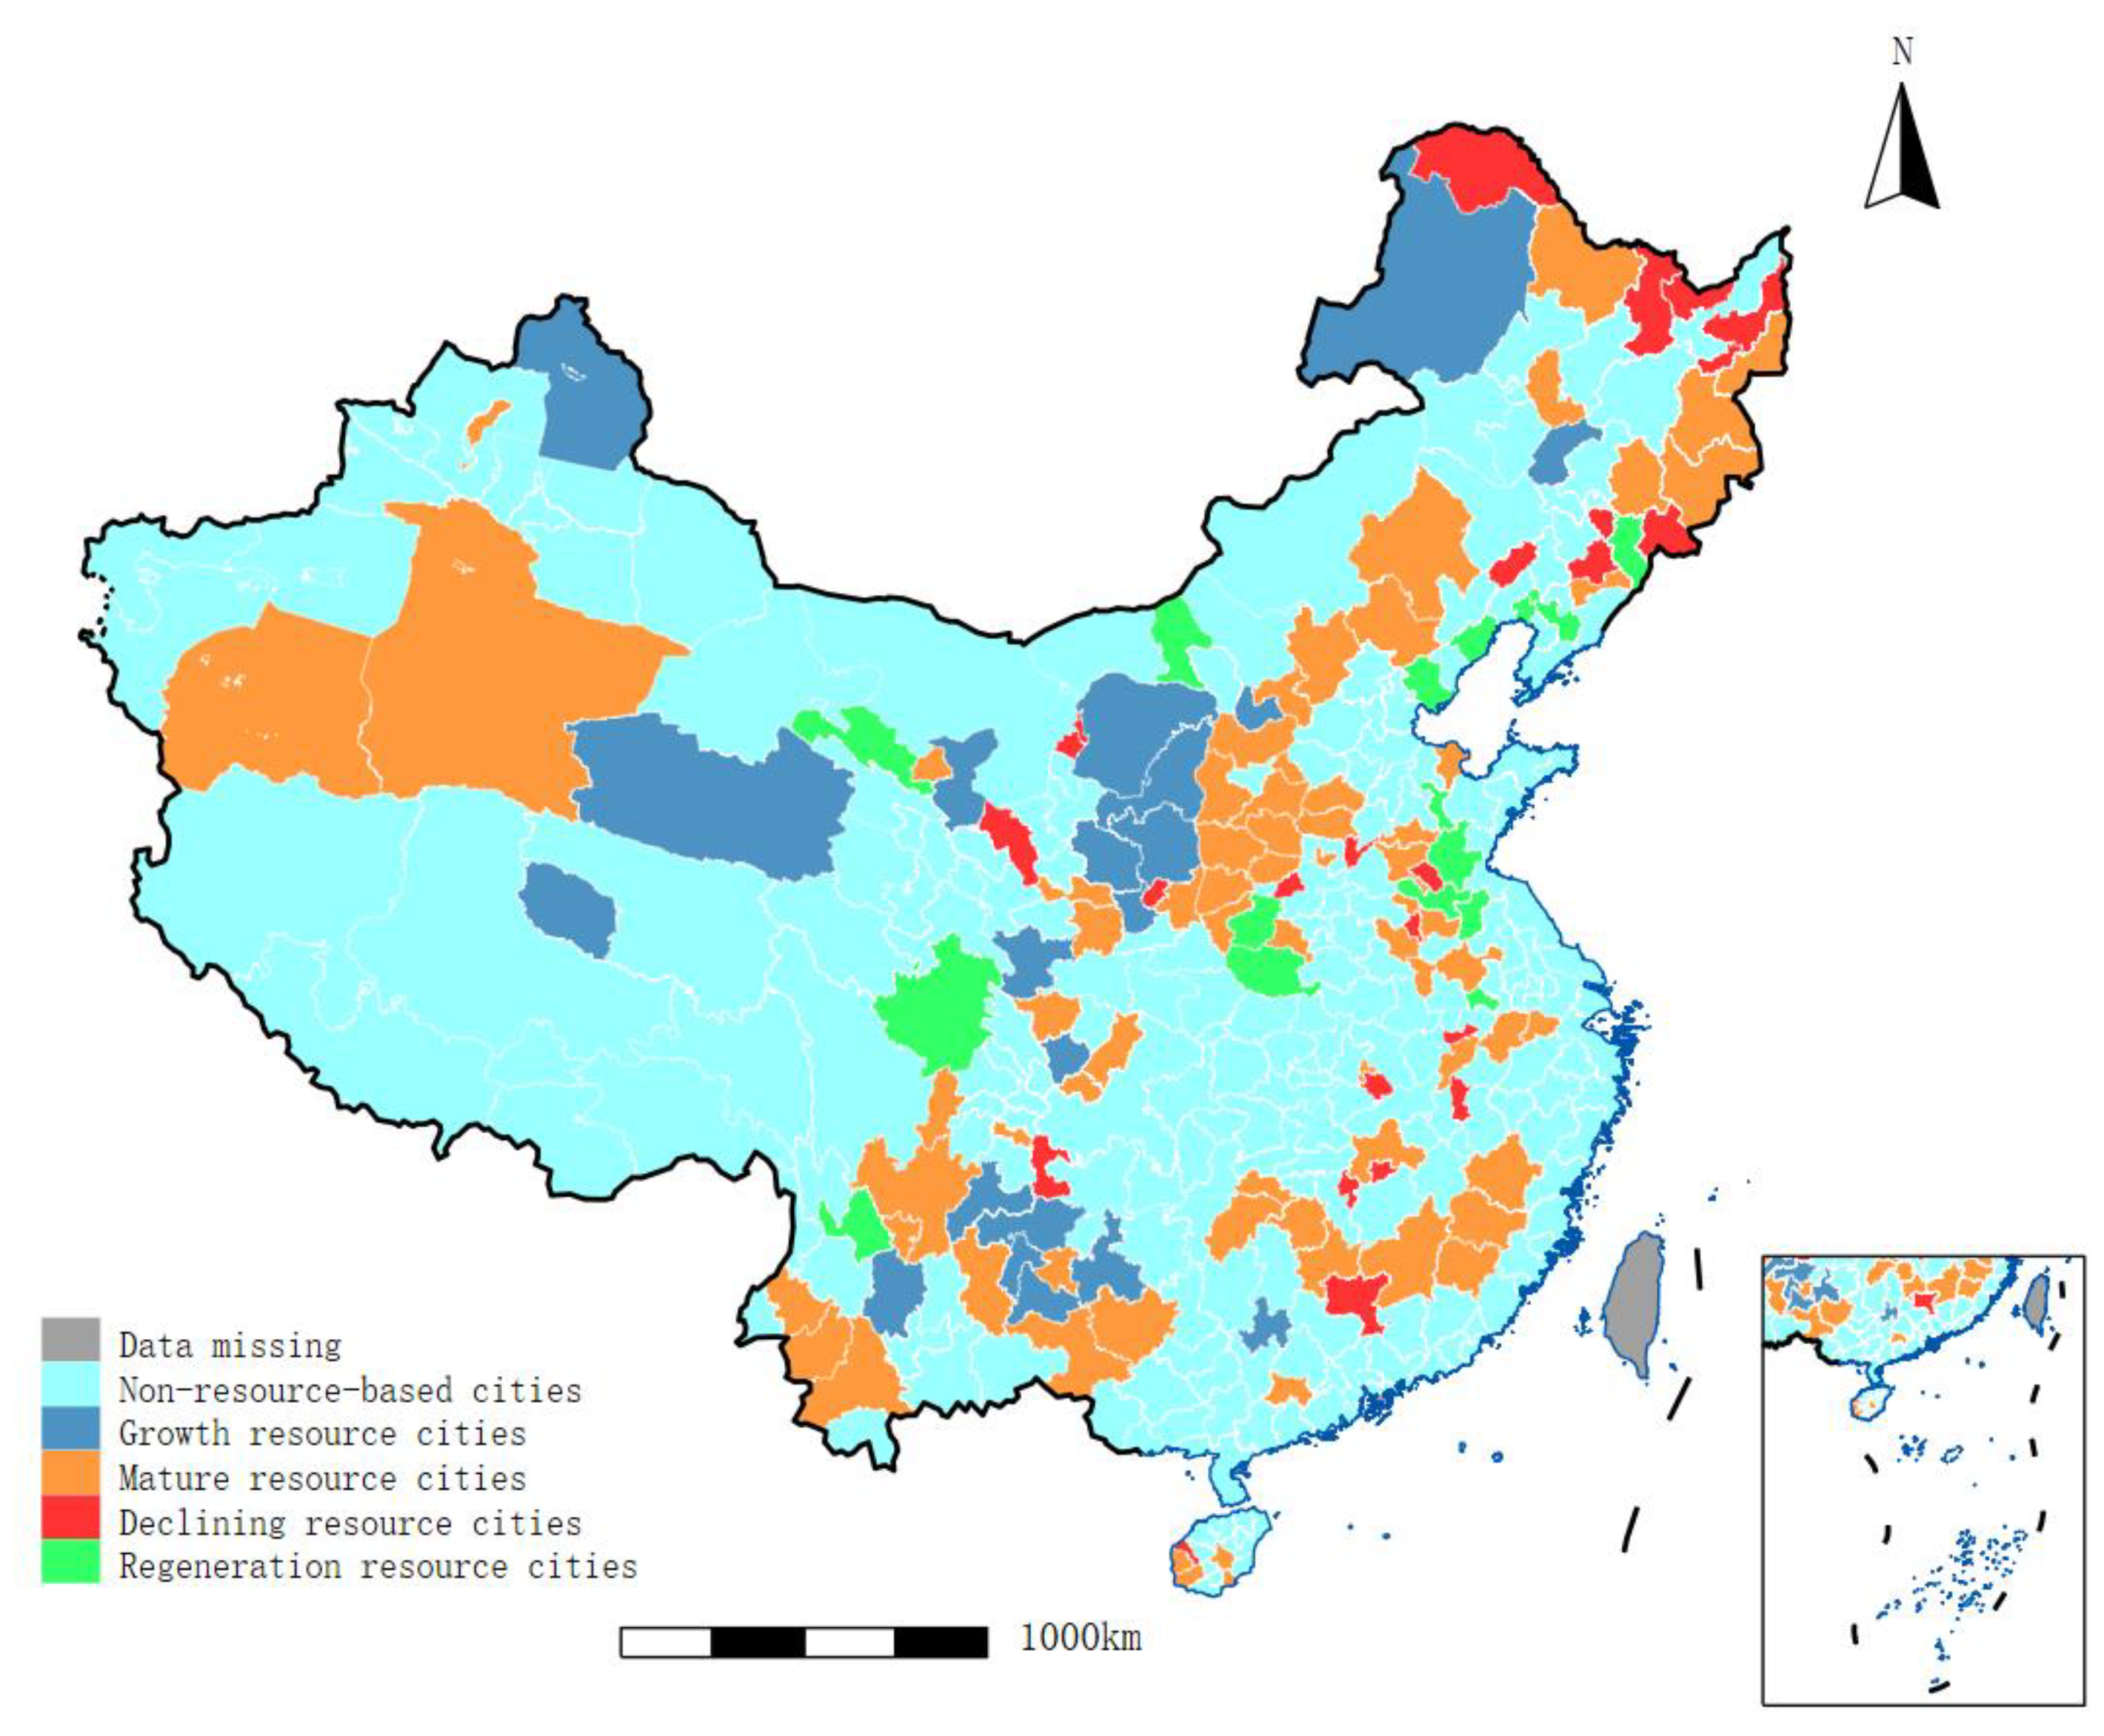
Figure 3.
Box plots of per capita GDP in China's cities.
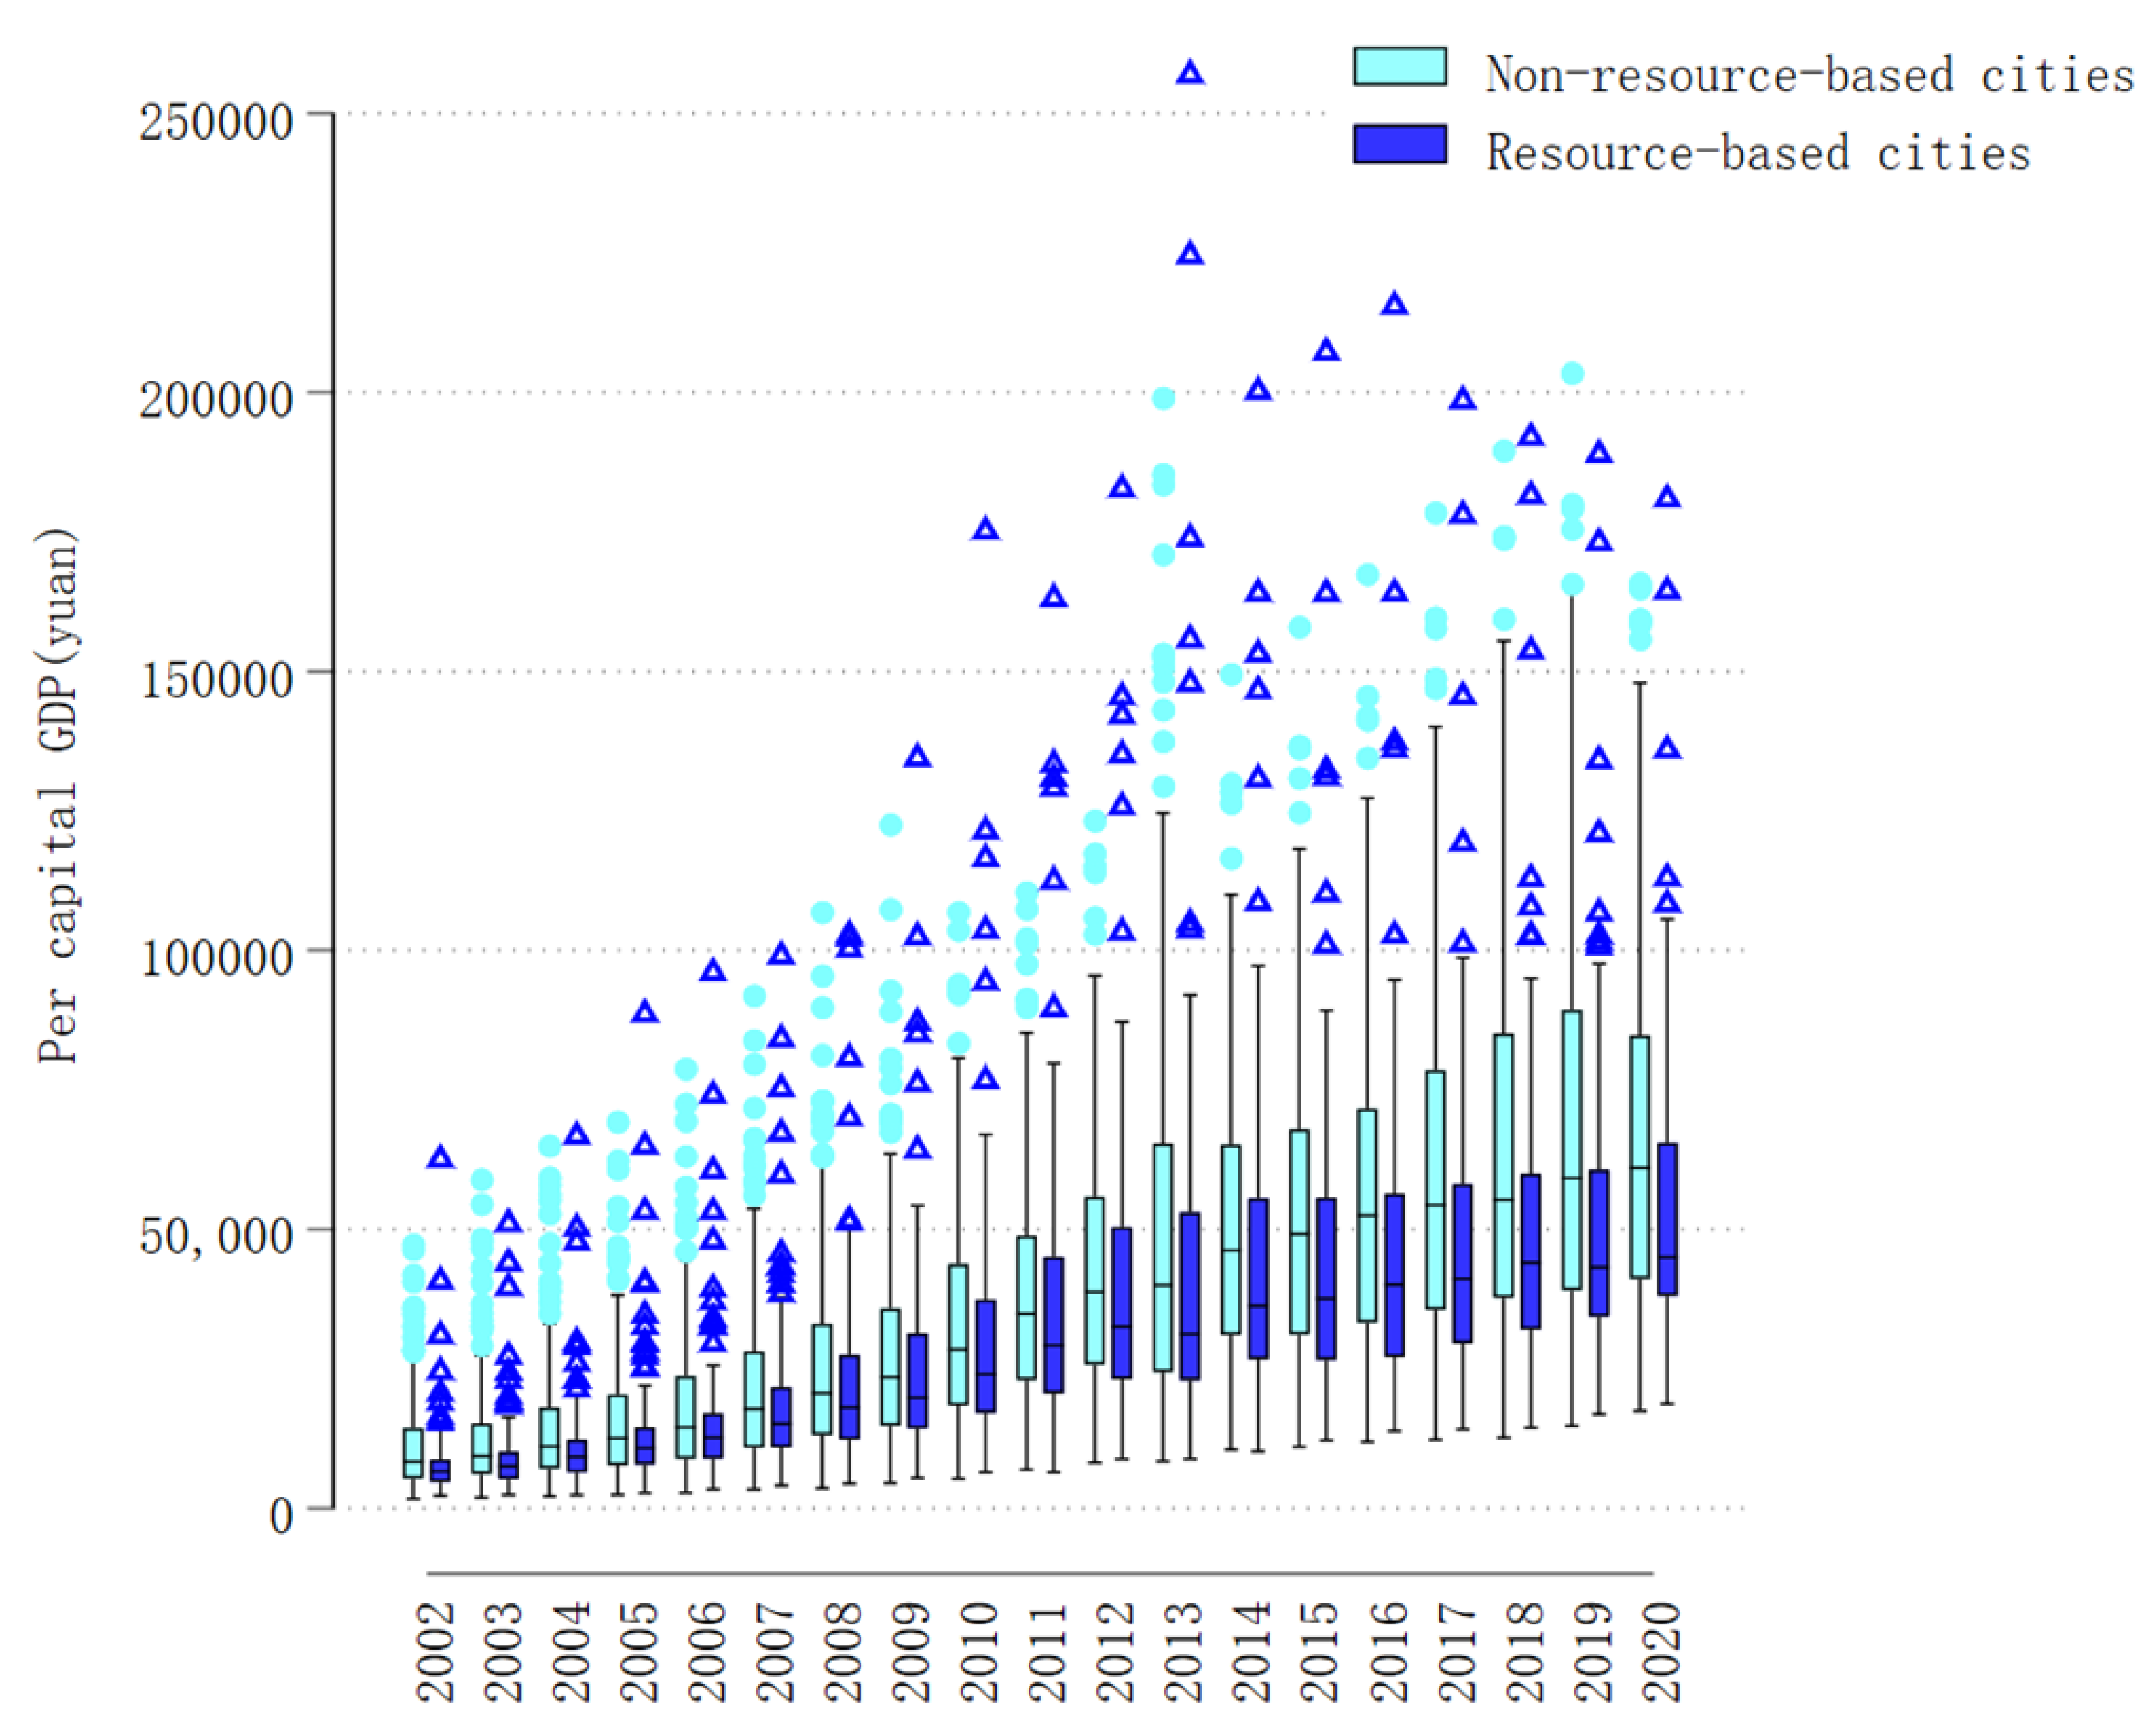
Figure 4.
Box plots of per capita GDP in four types of resource-based cities.
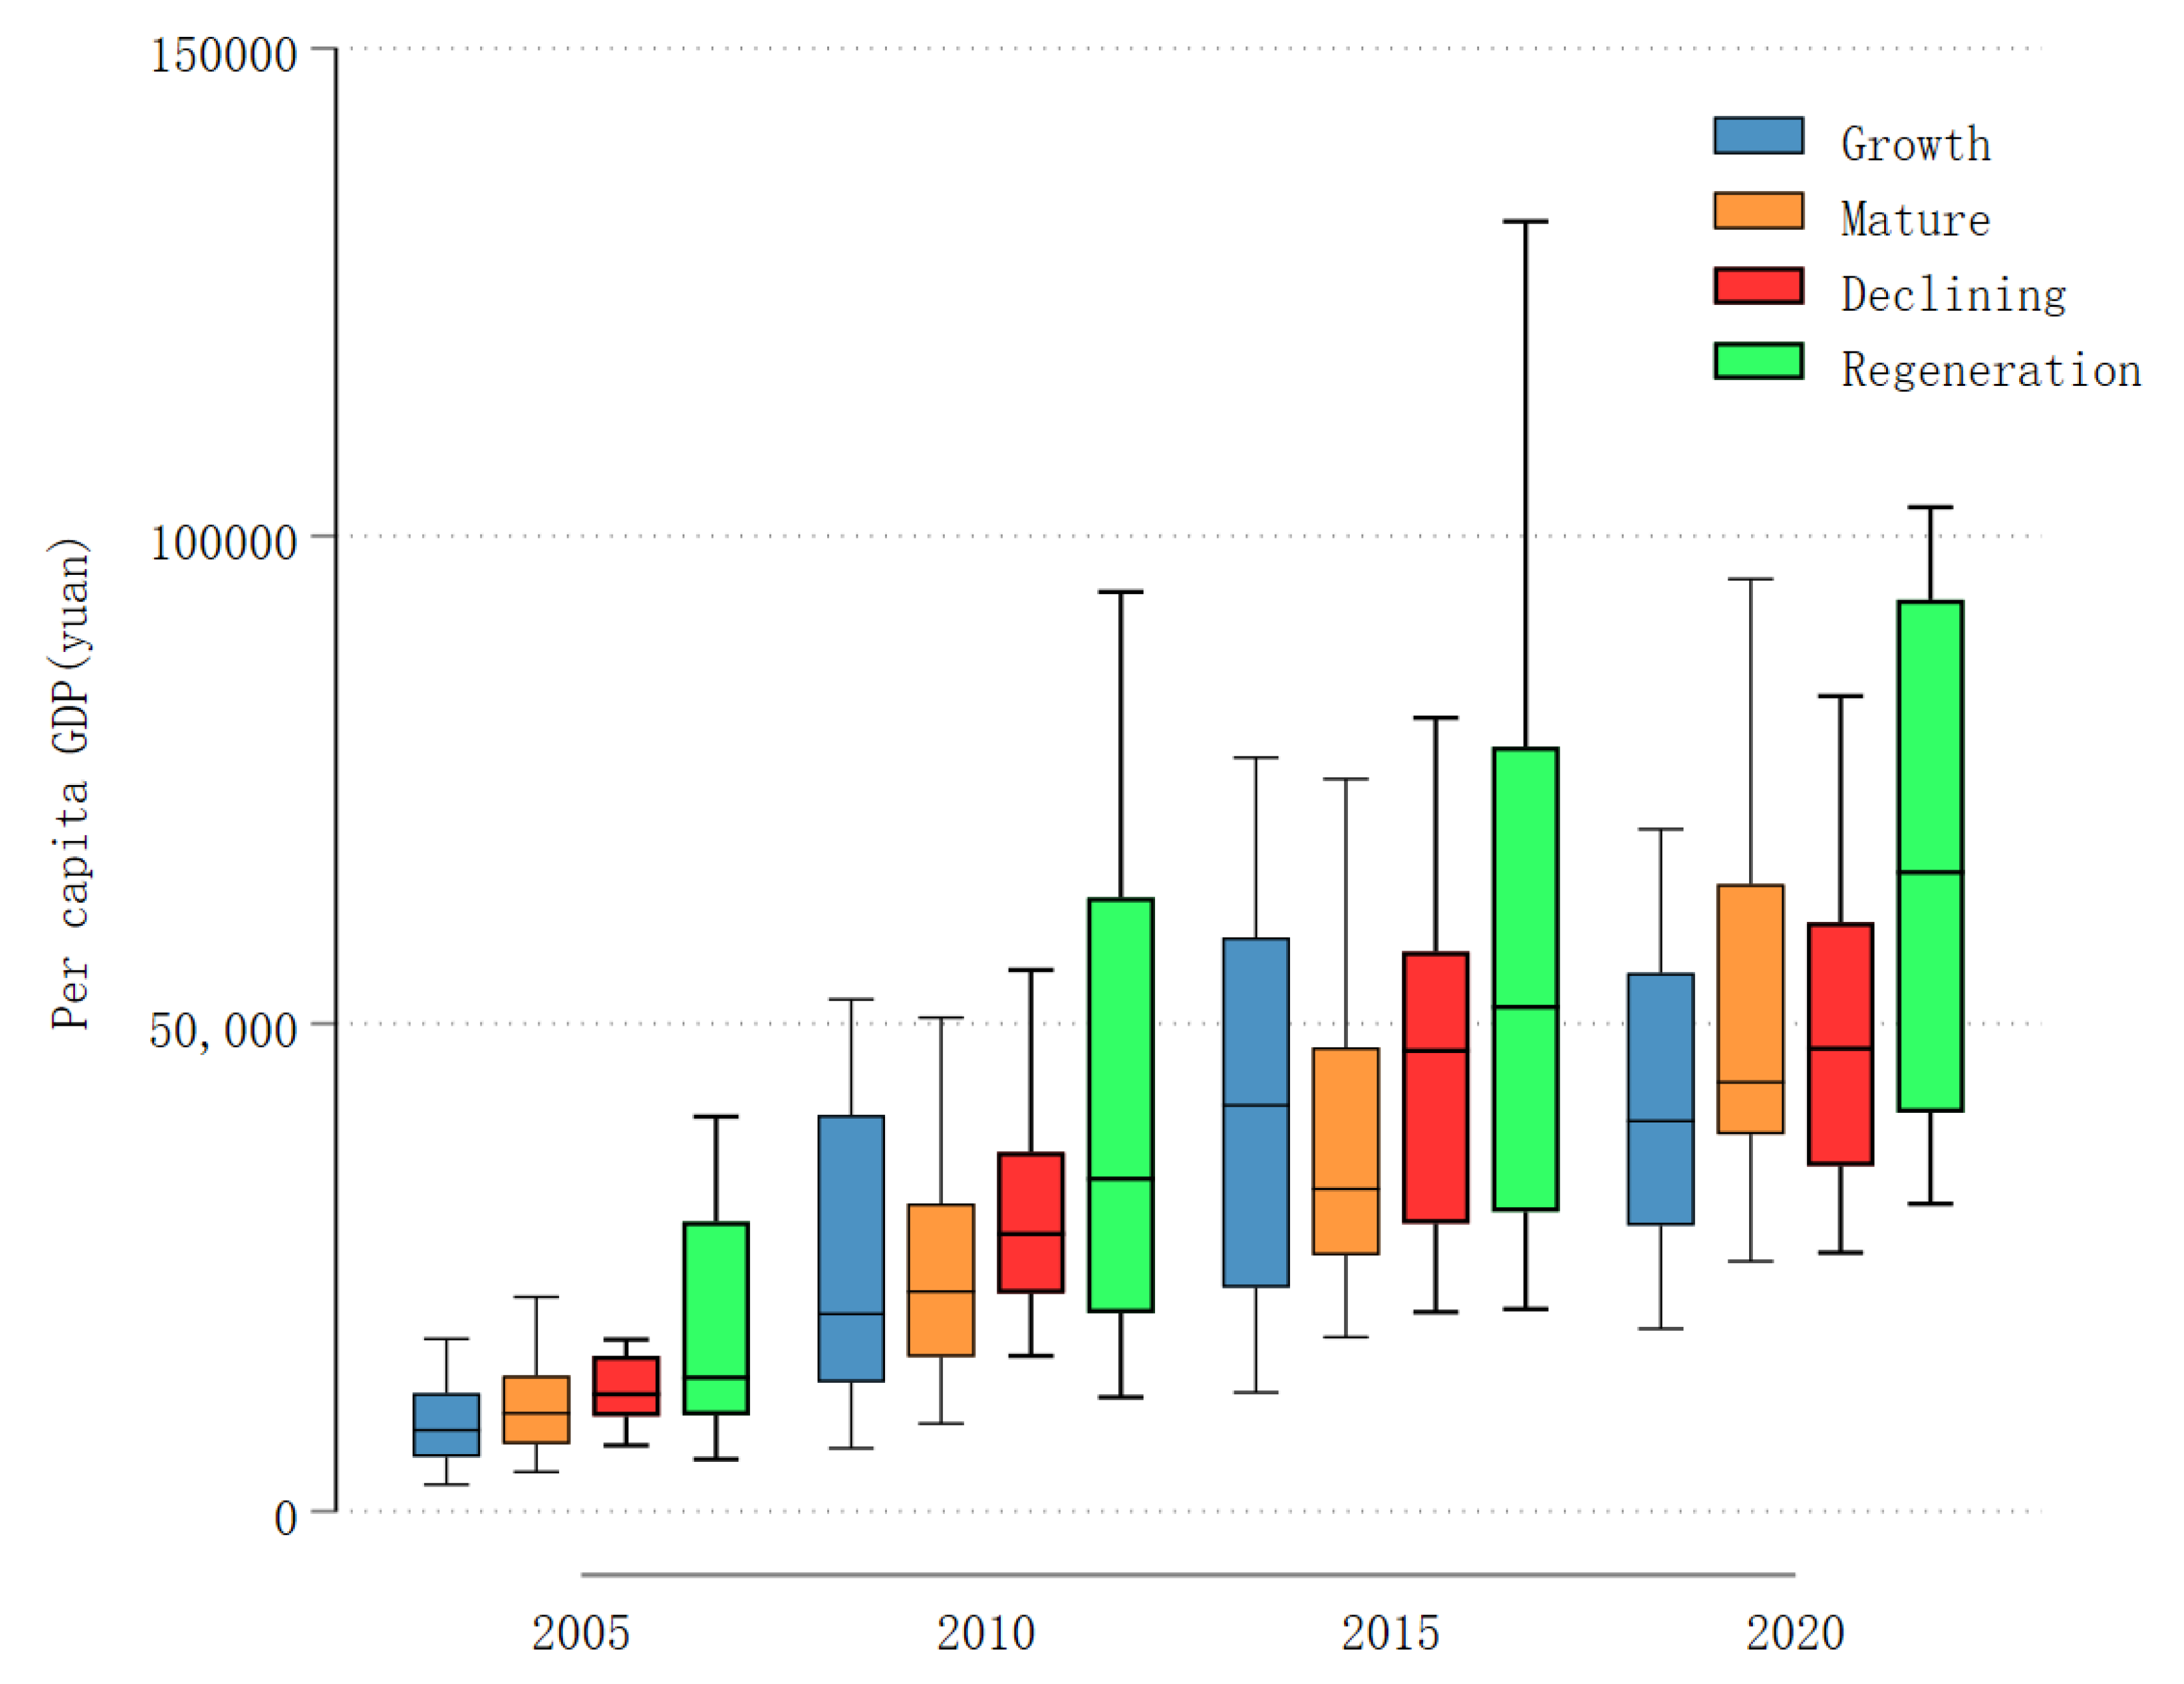
Figure 5.
Box plots of per capita GDP growth rates in China's resource-based cities.
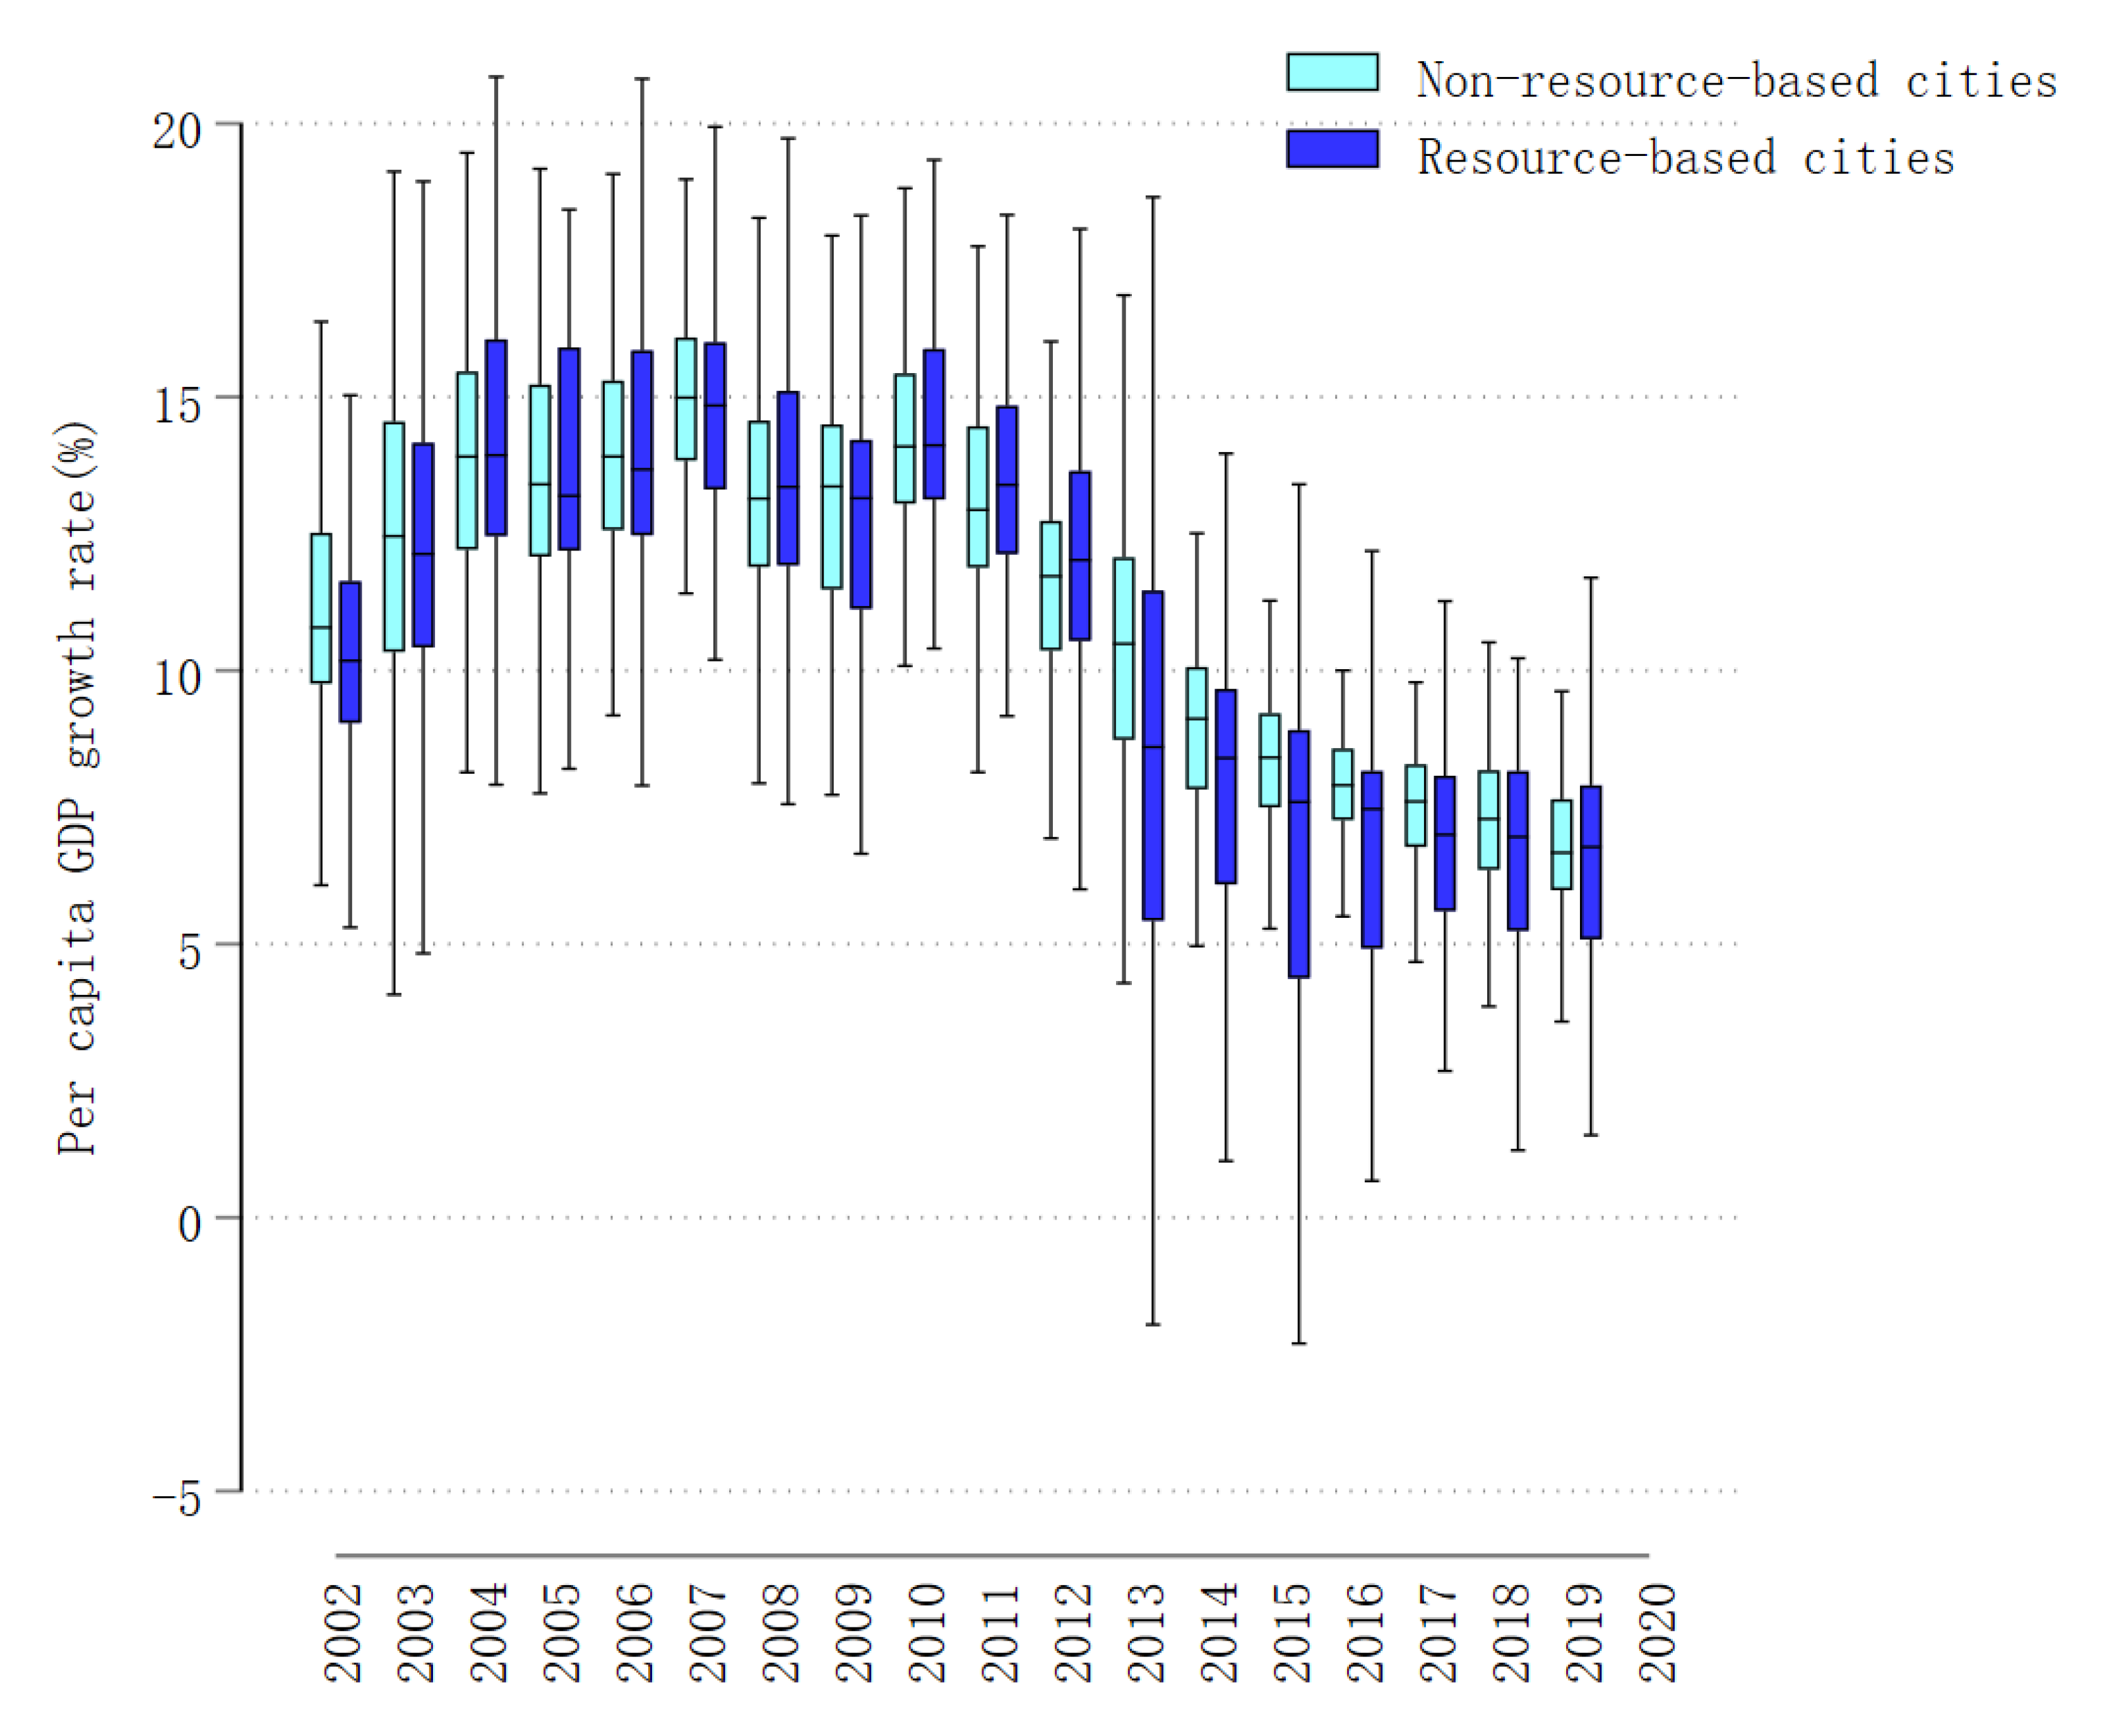
Figure 6.
Box plots of per capita GDP growth rates for four types of resource-based cities.
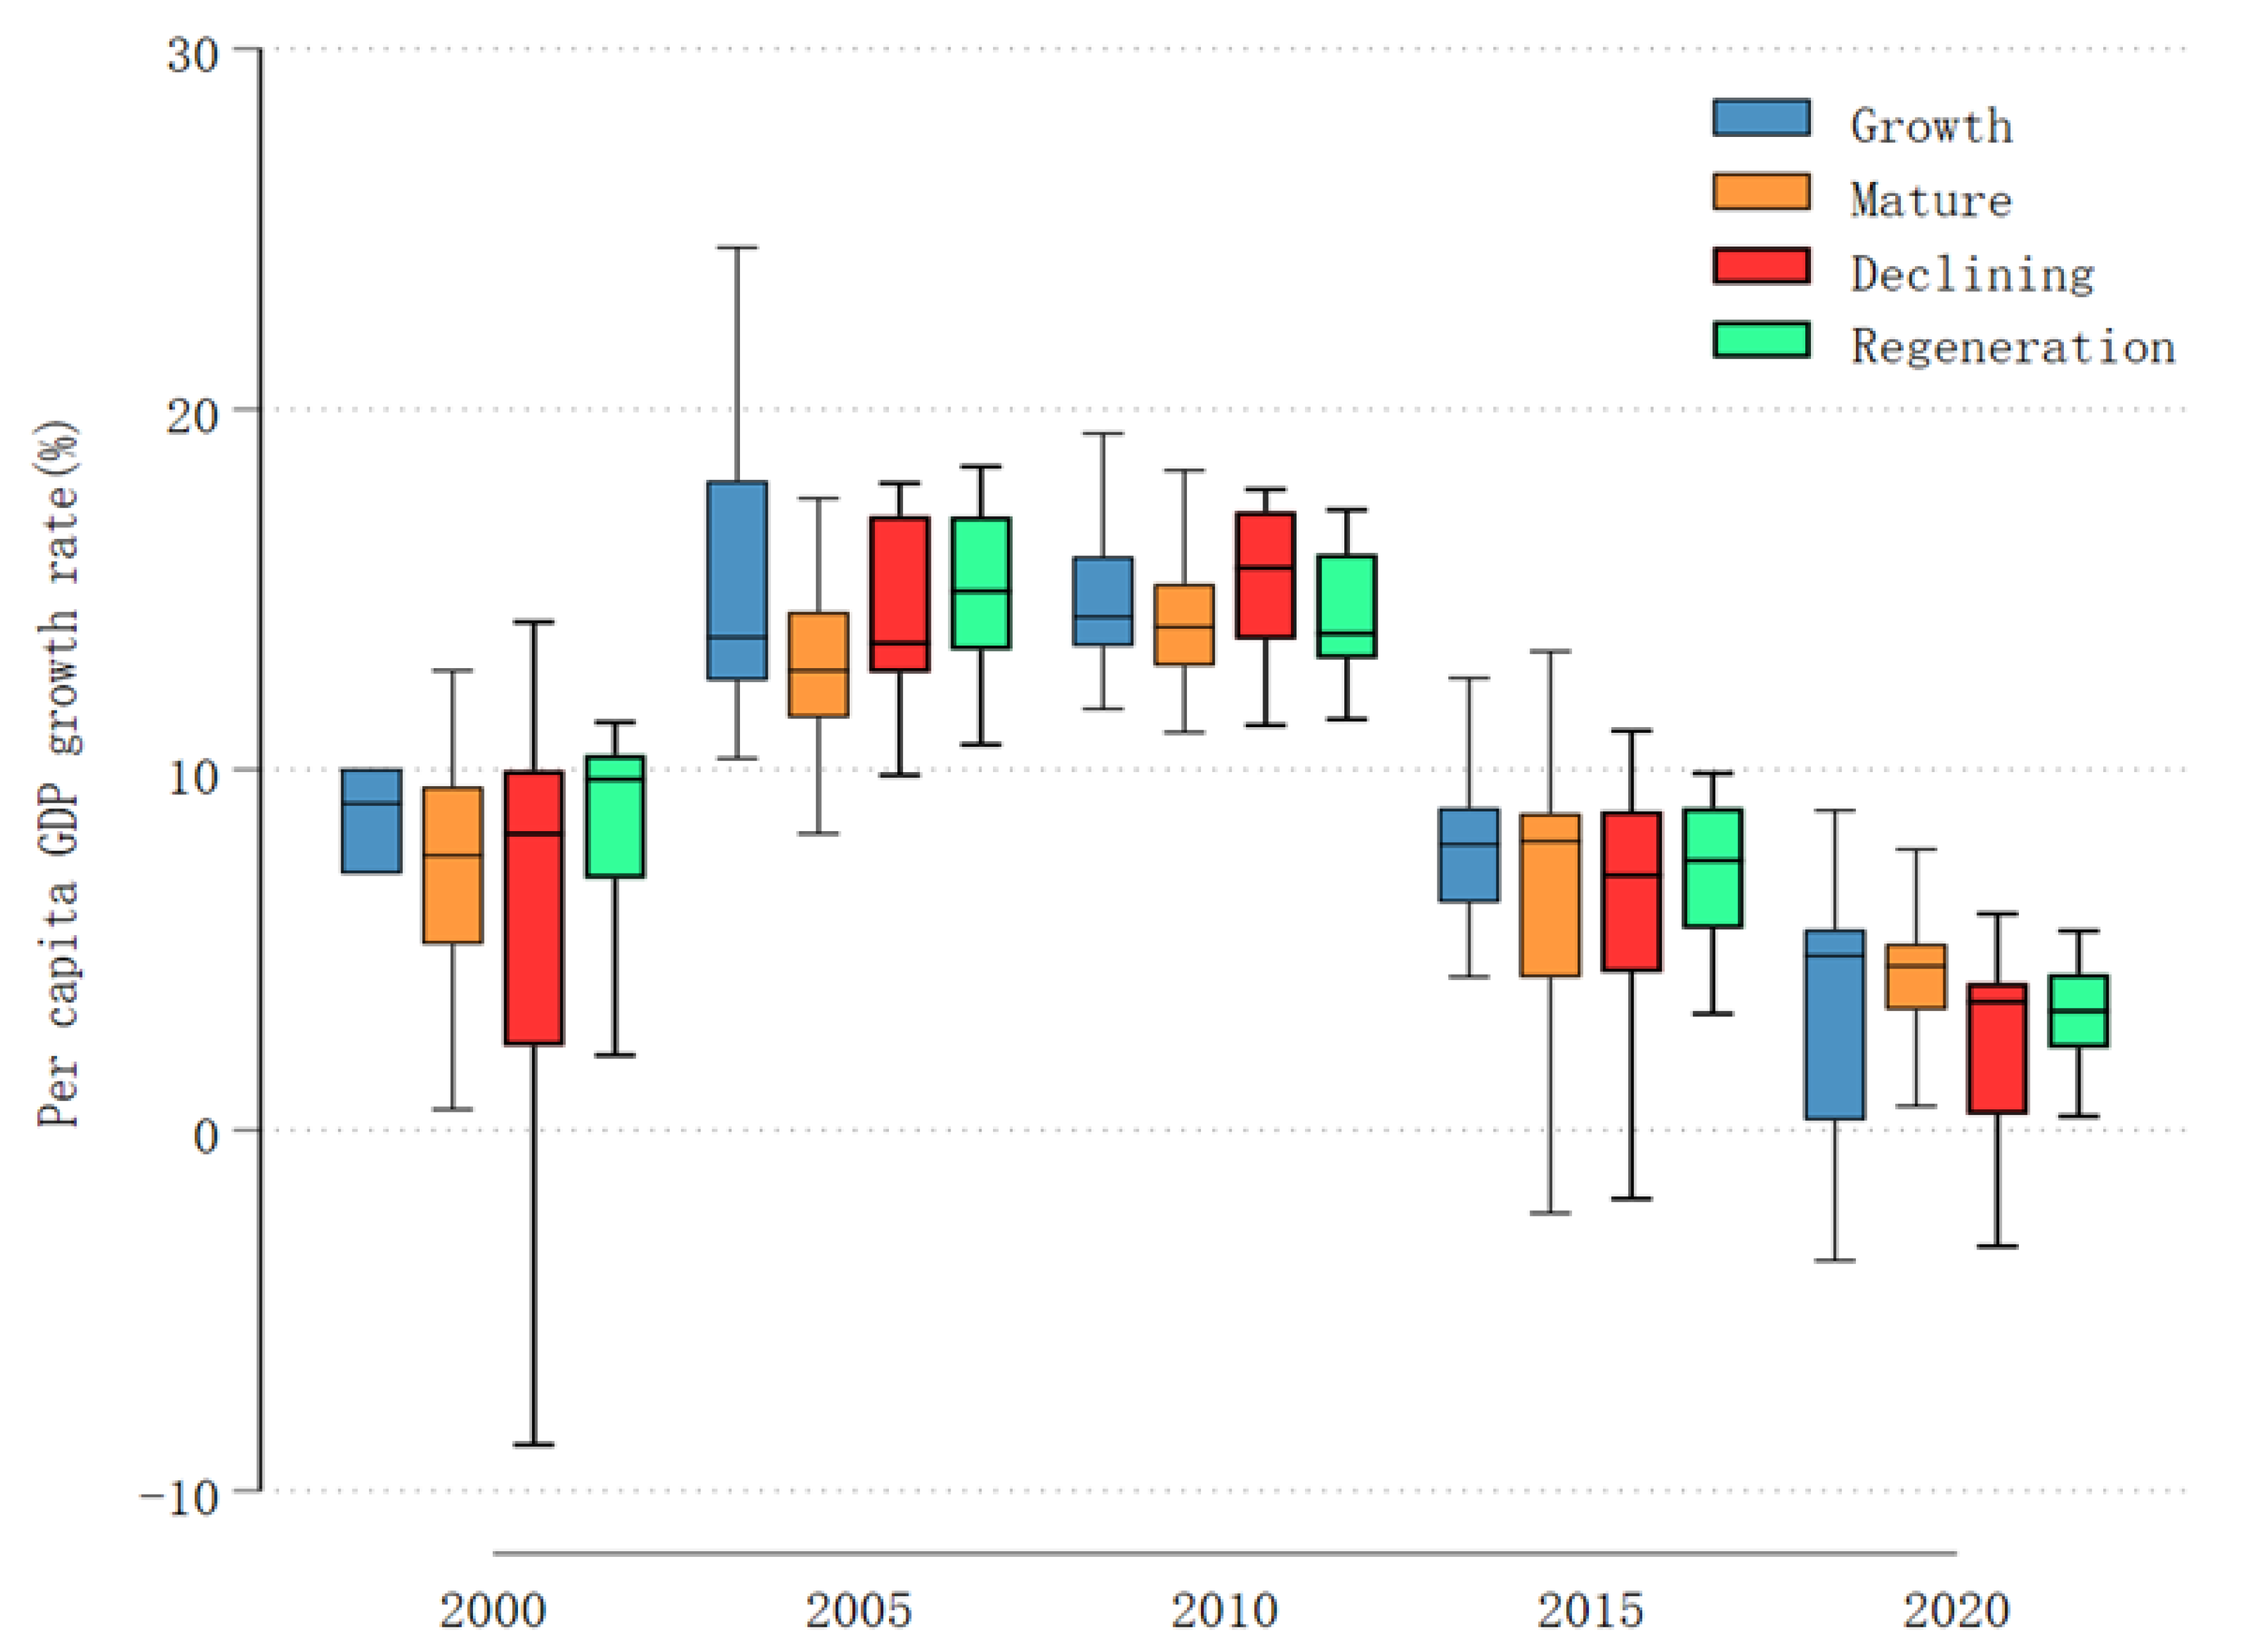
Figure 7.
Box plots of primary industry output ratio in four types of resource-based cities.
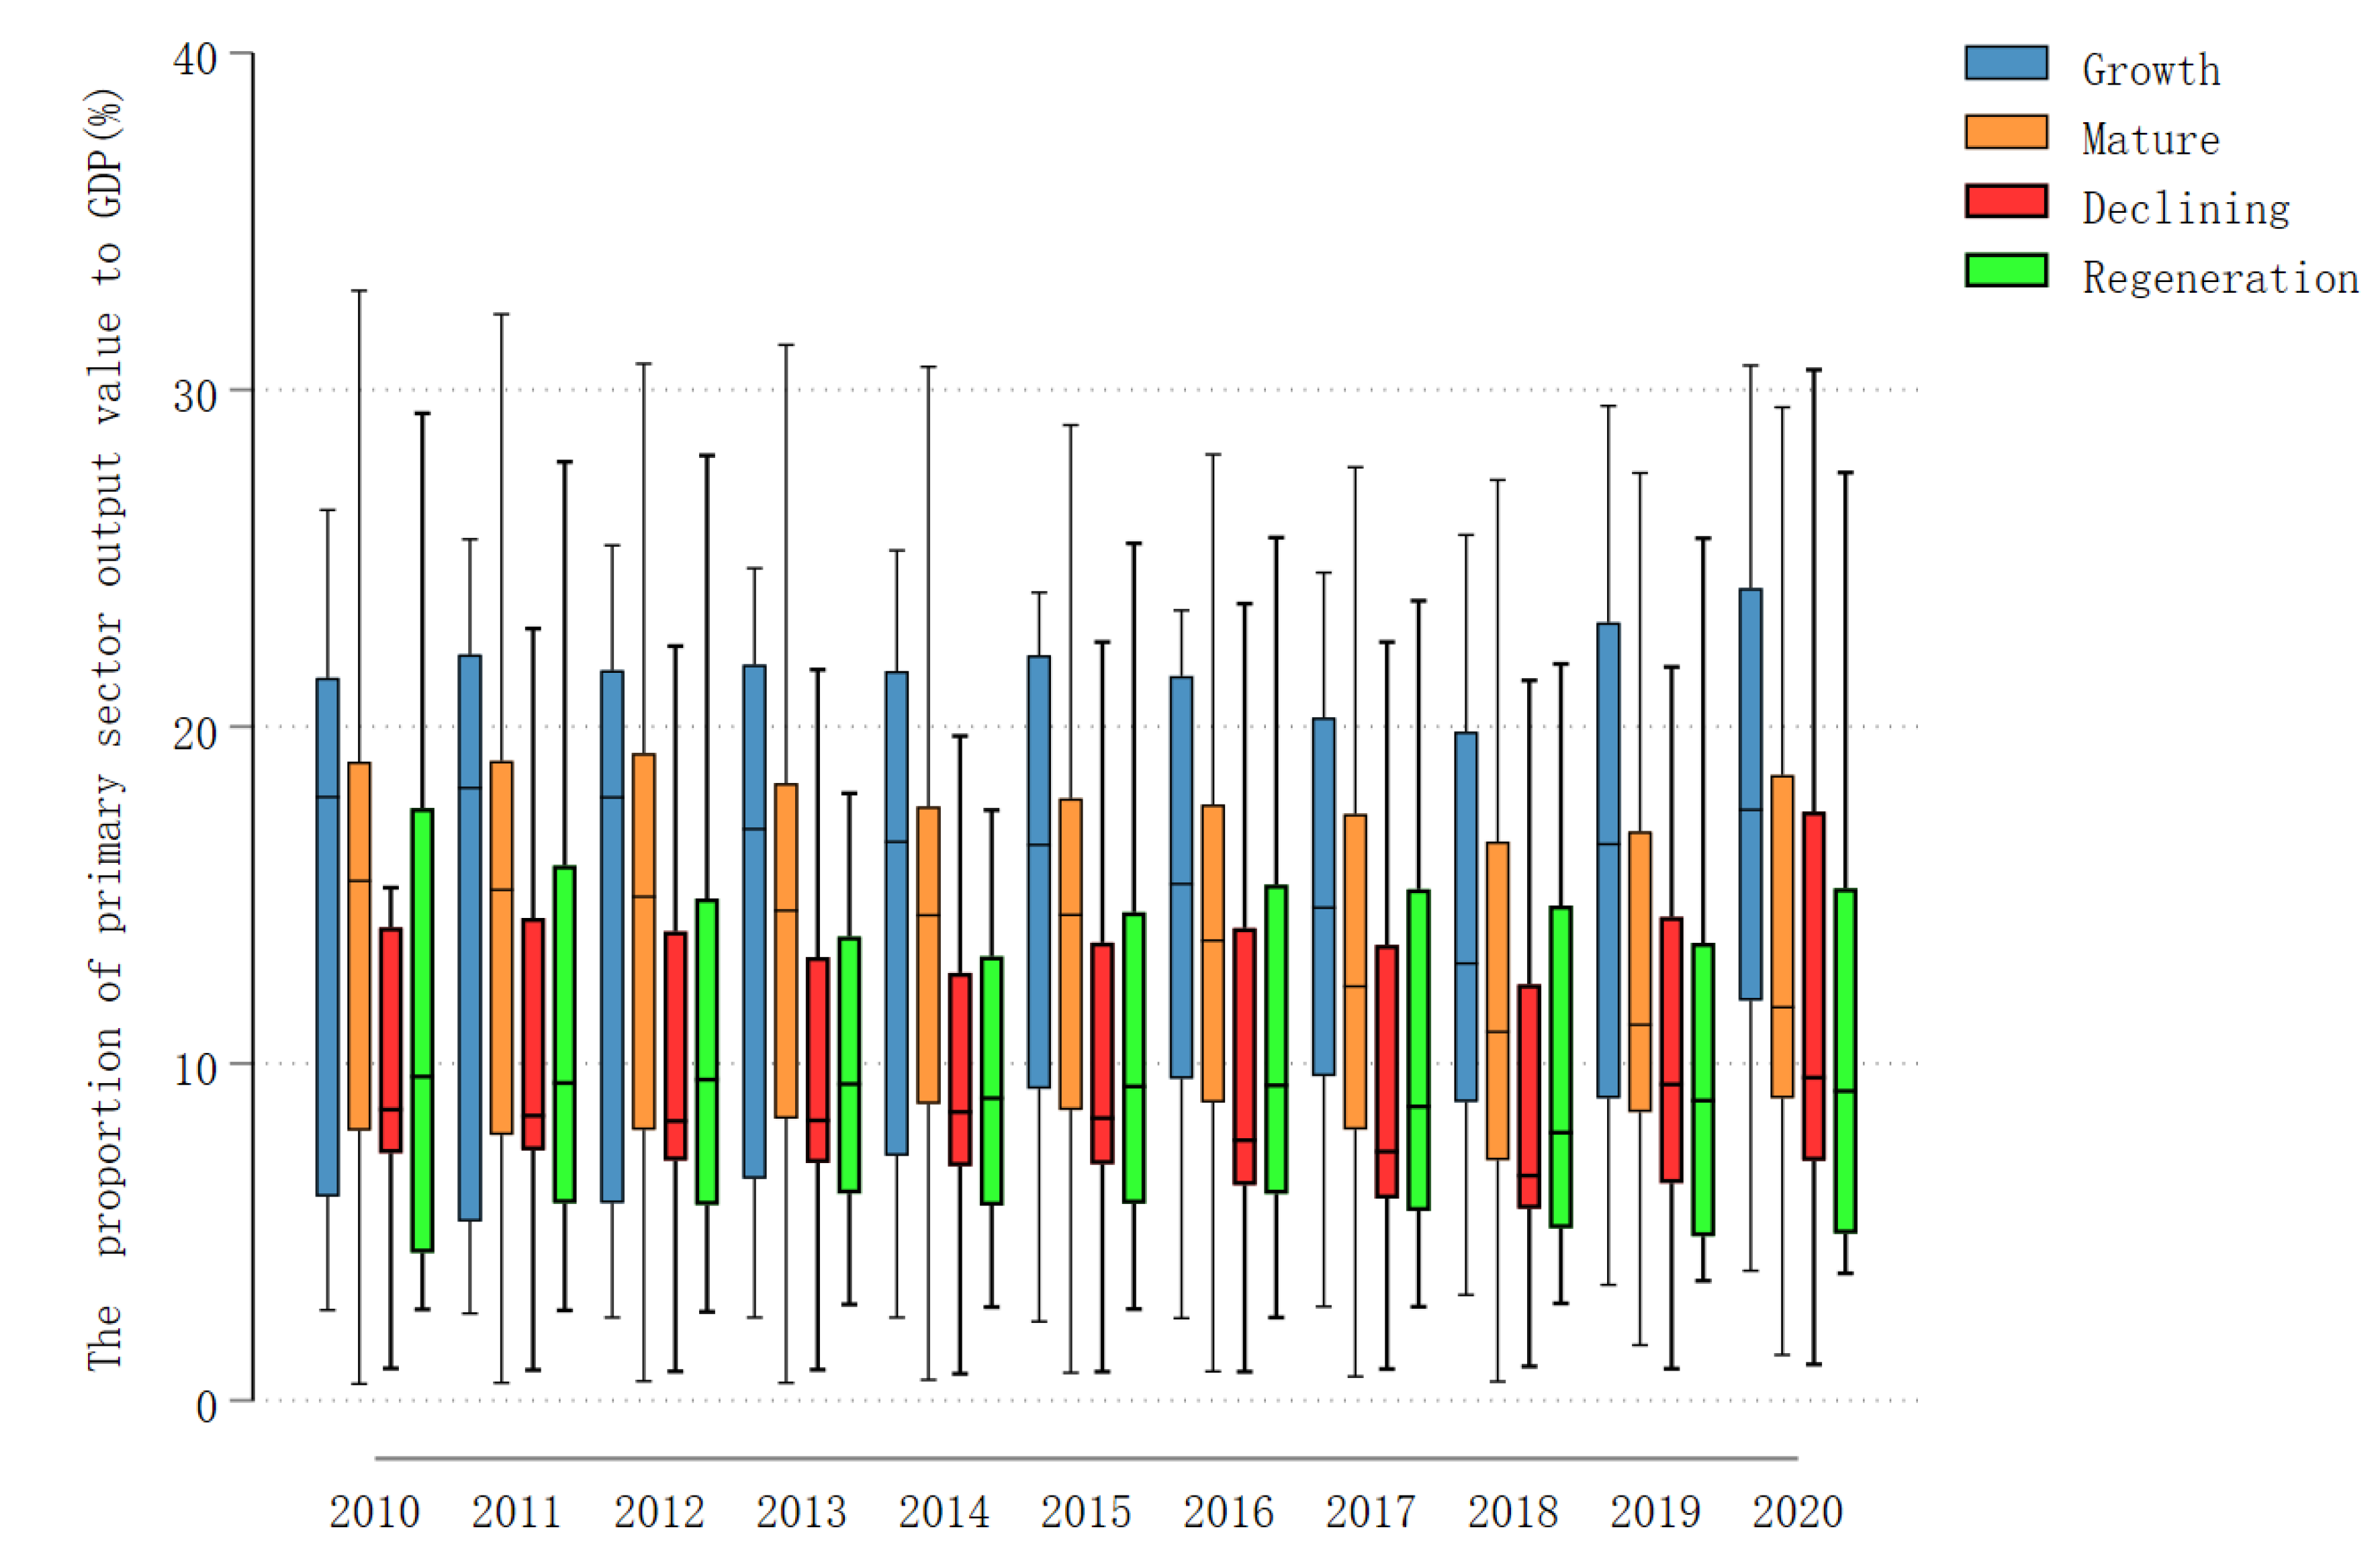
Figure 8.
Box plots of secondary industry output ratio in four types of resource-based cities.
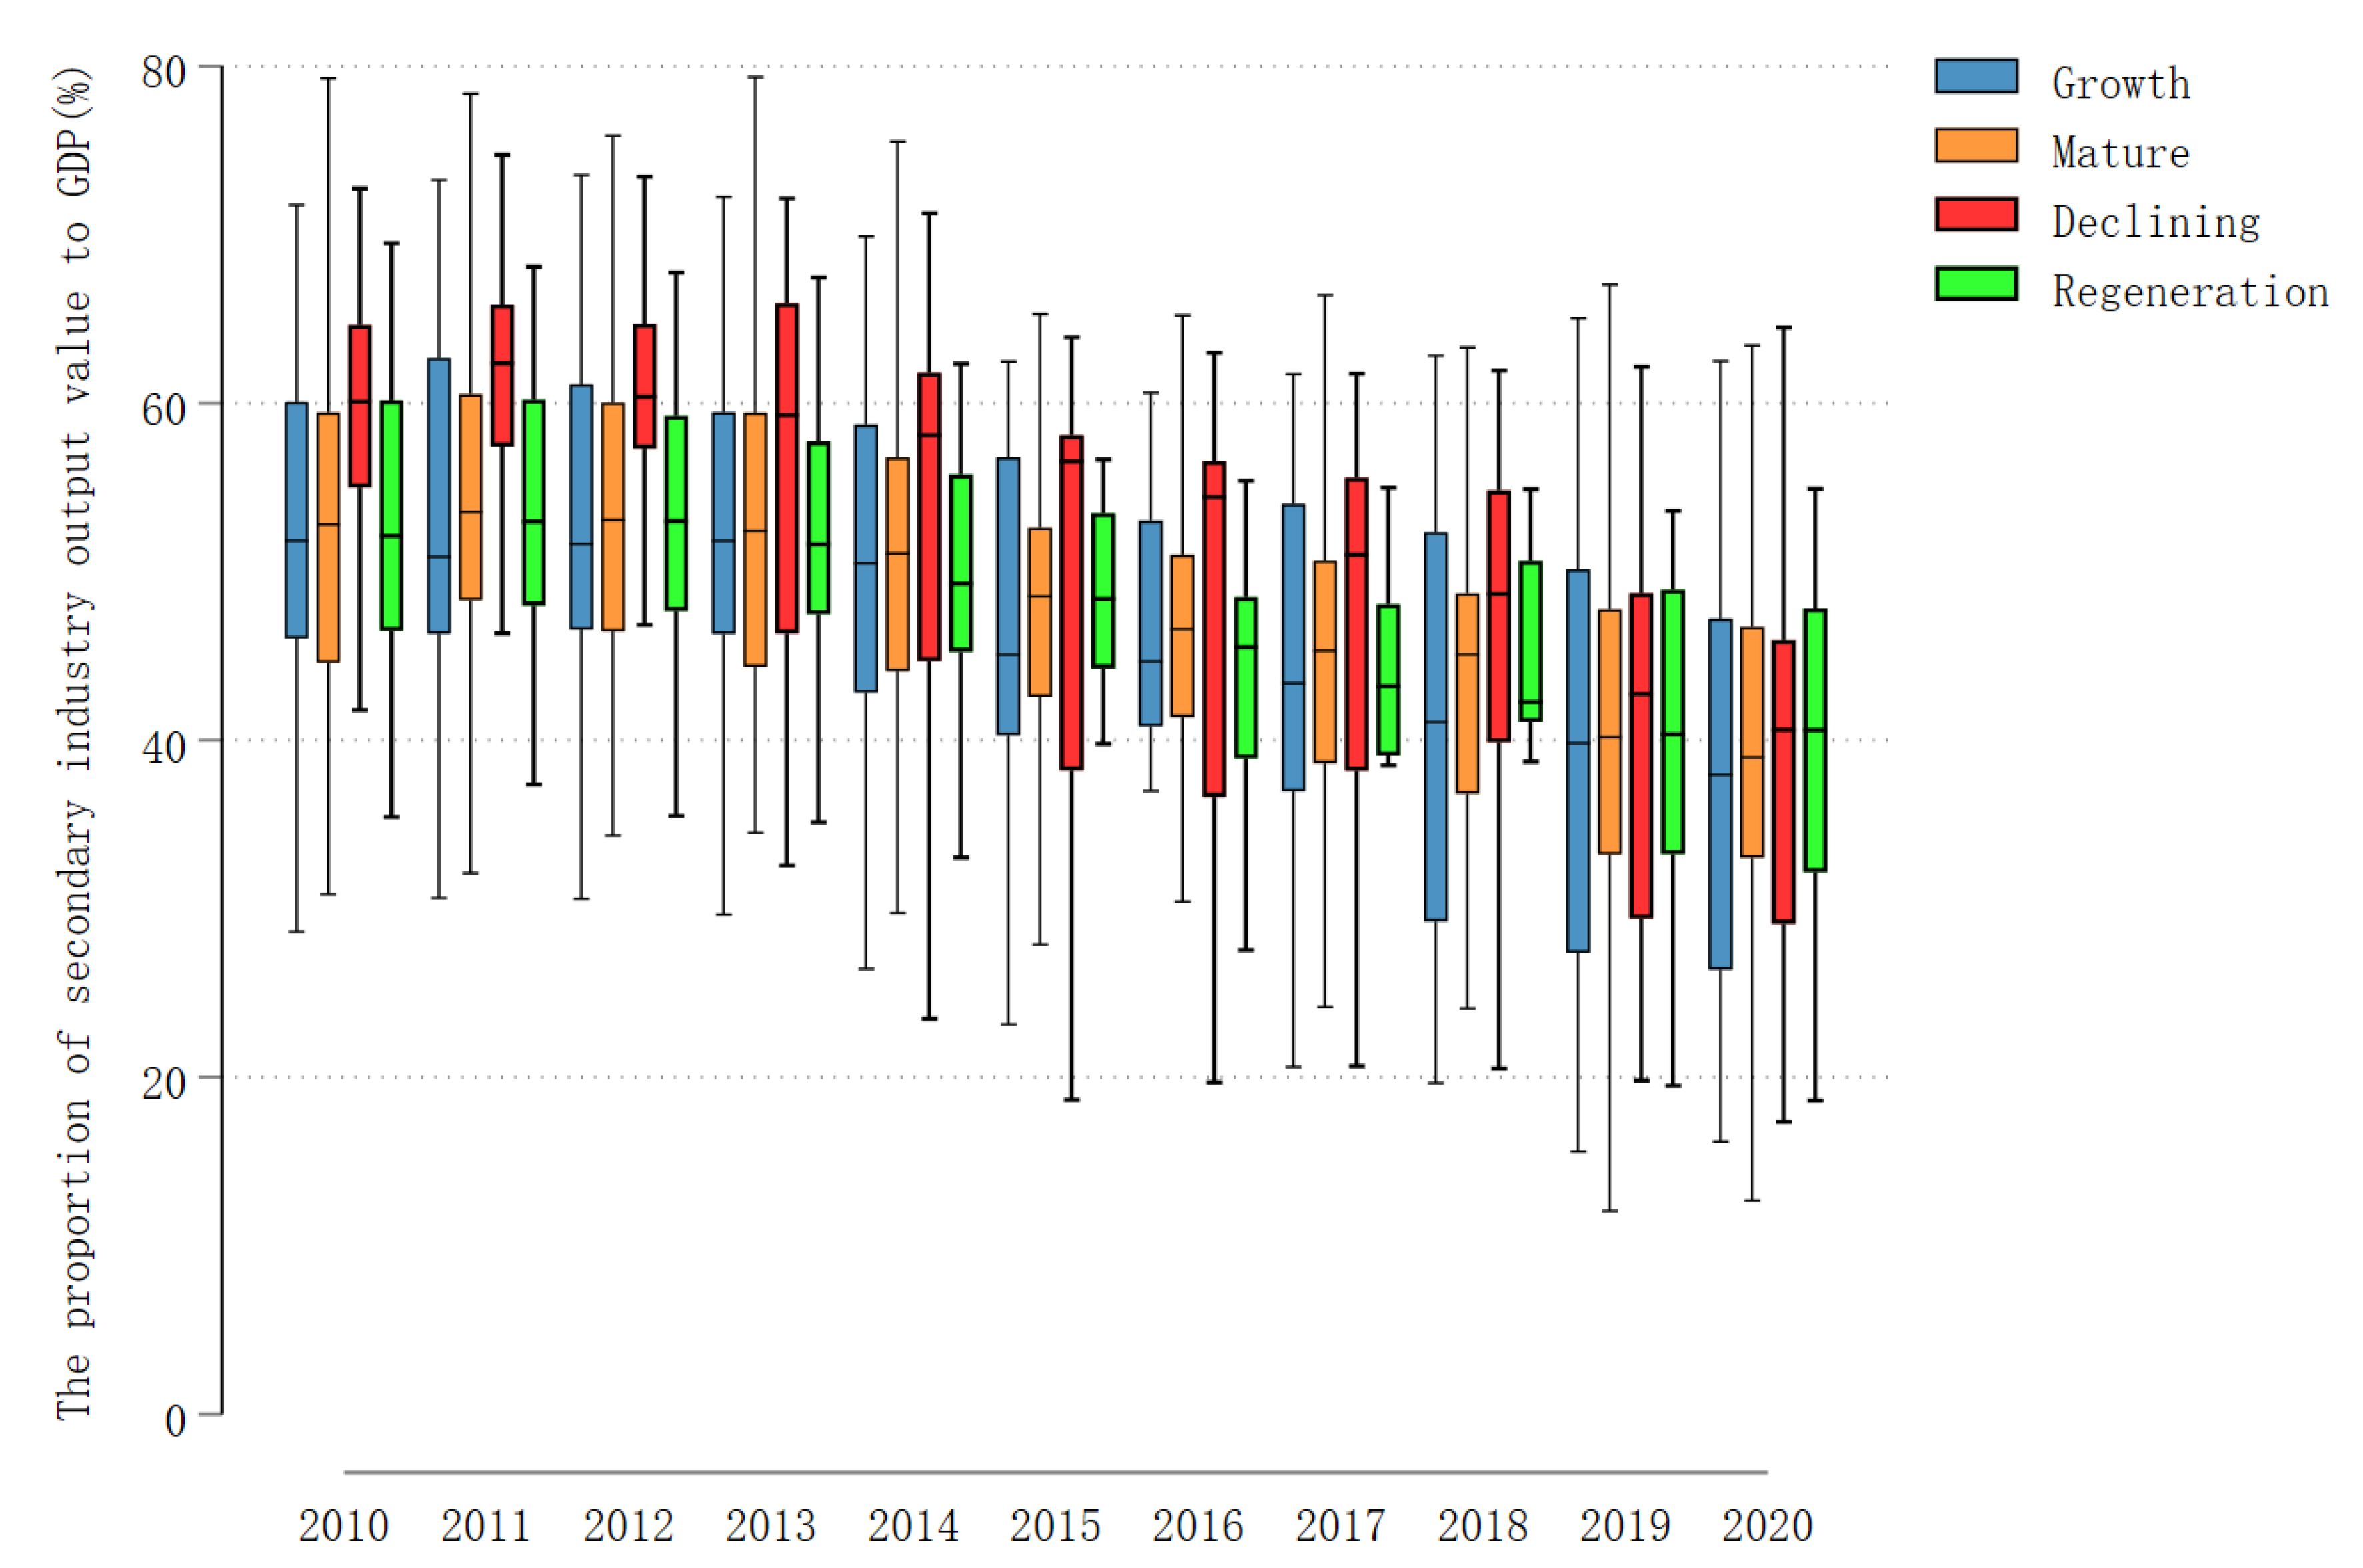
Figure 9.
Box plot of tertiary industry output ratio in four types of resource-based cities.
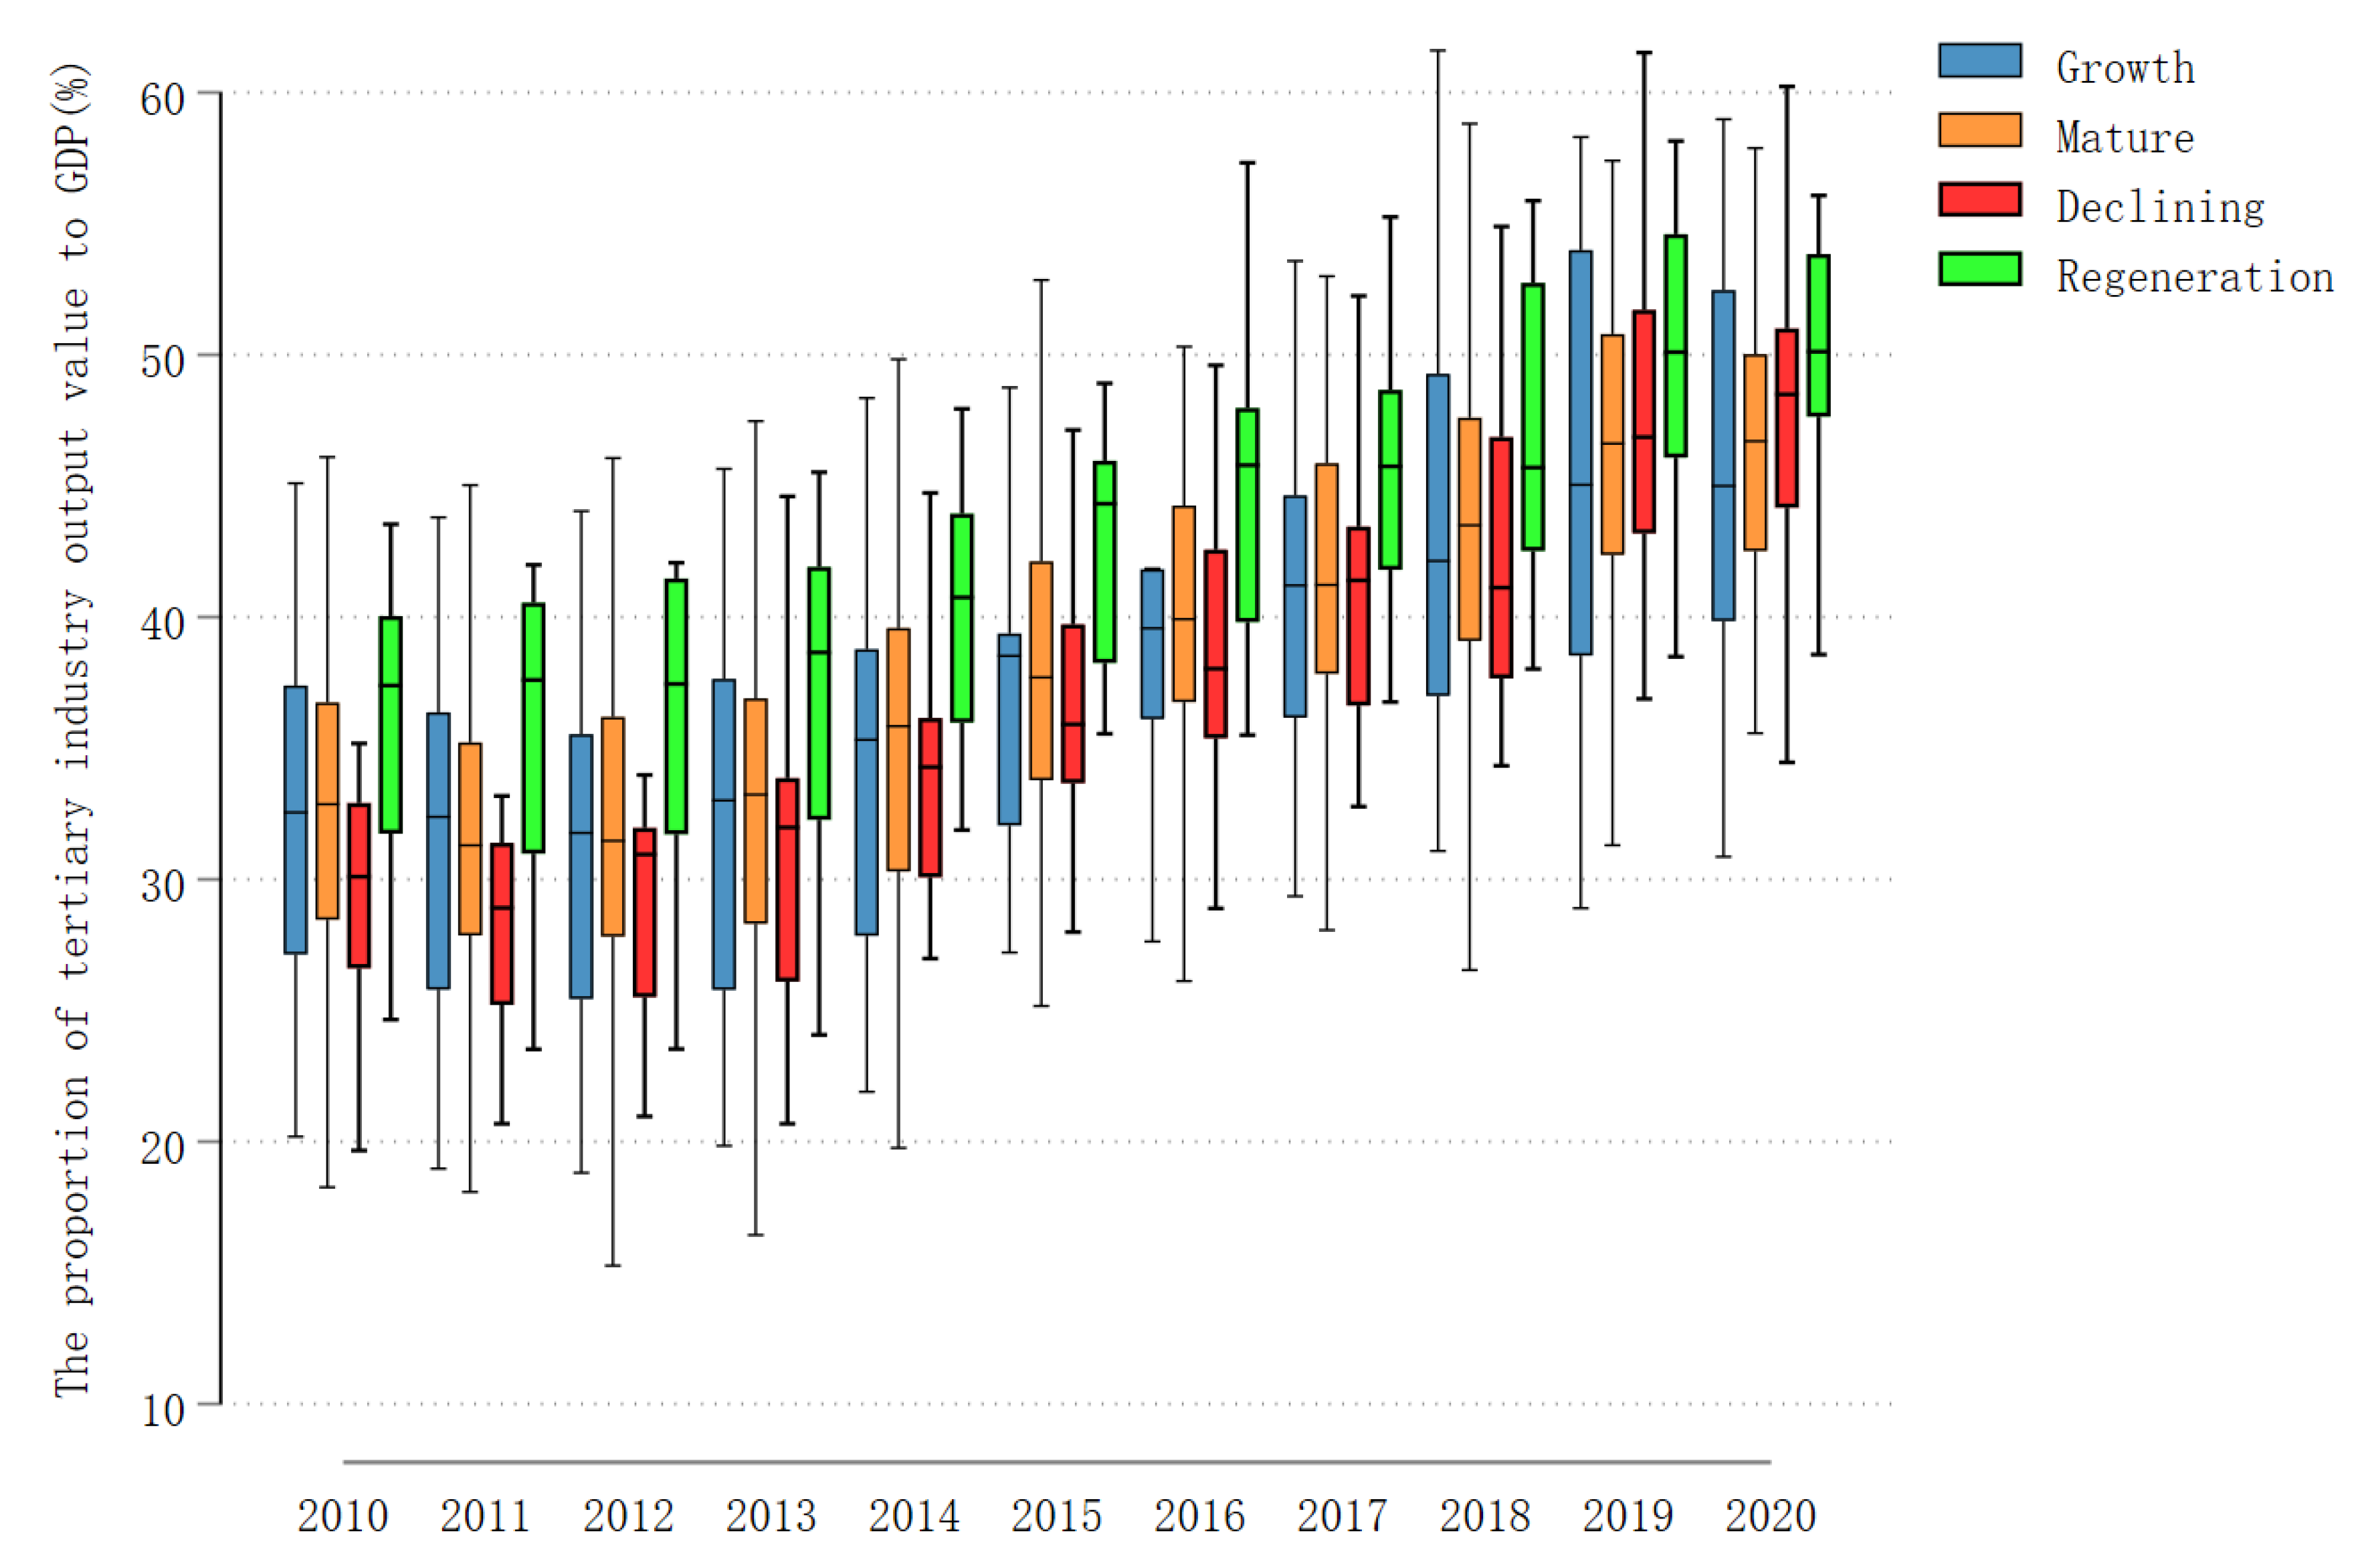
Figure 10.
Scatterplot of urban resource dependence versus per capita GDP growth rate.
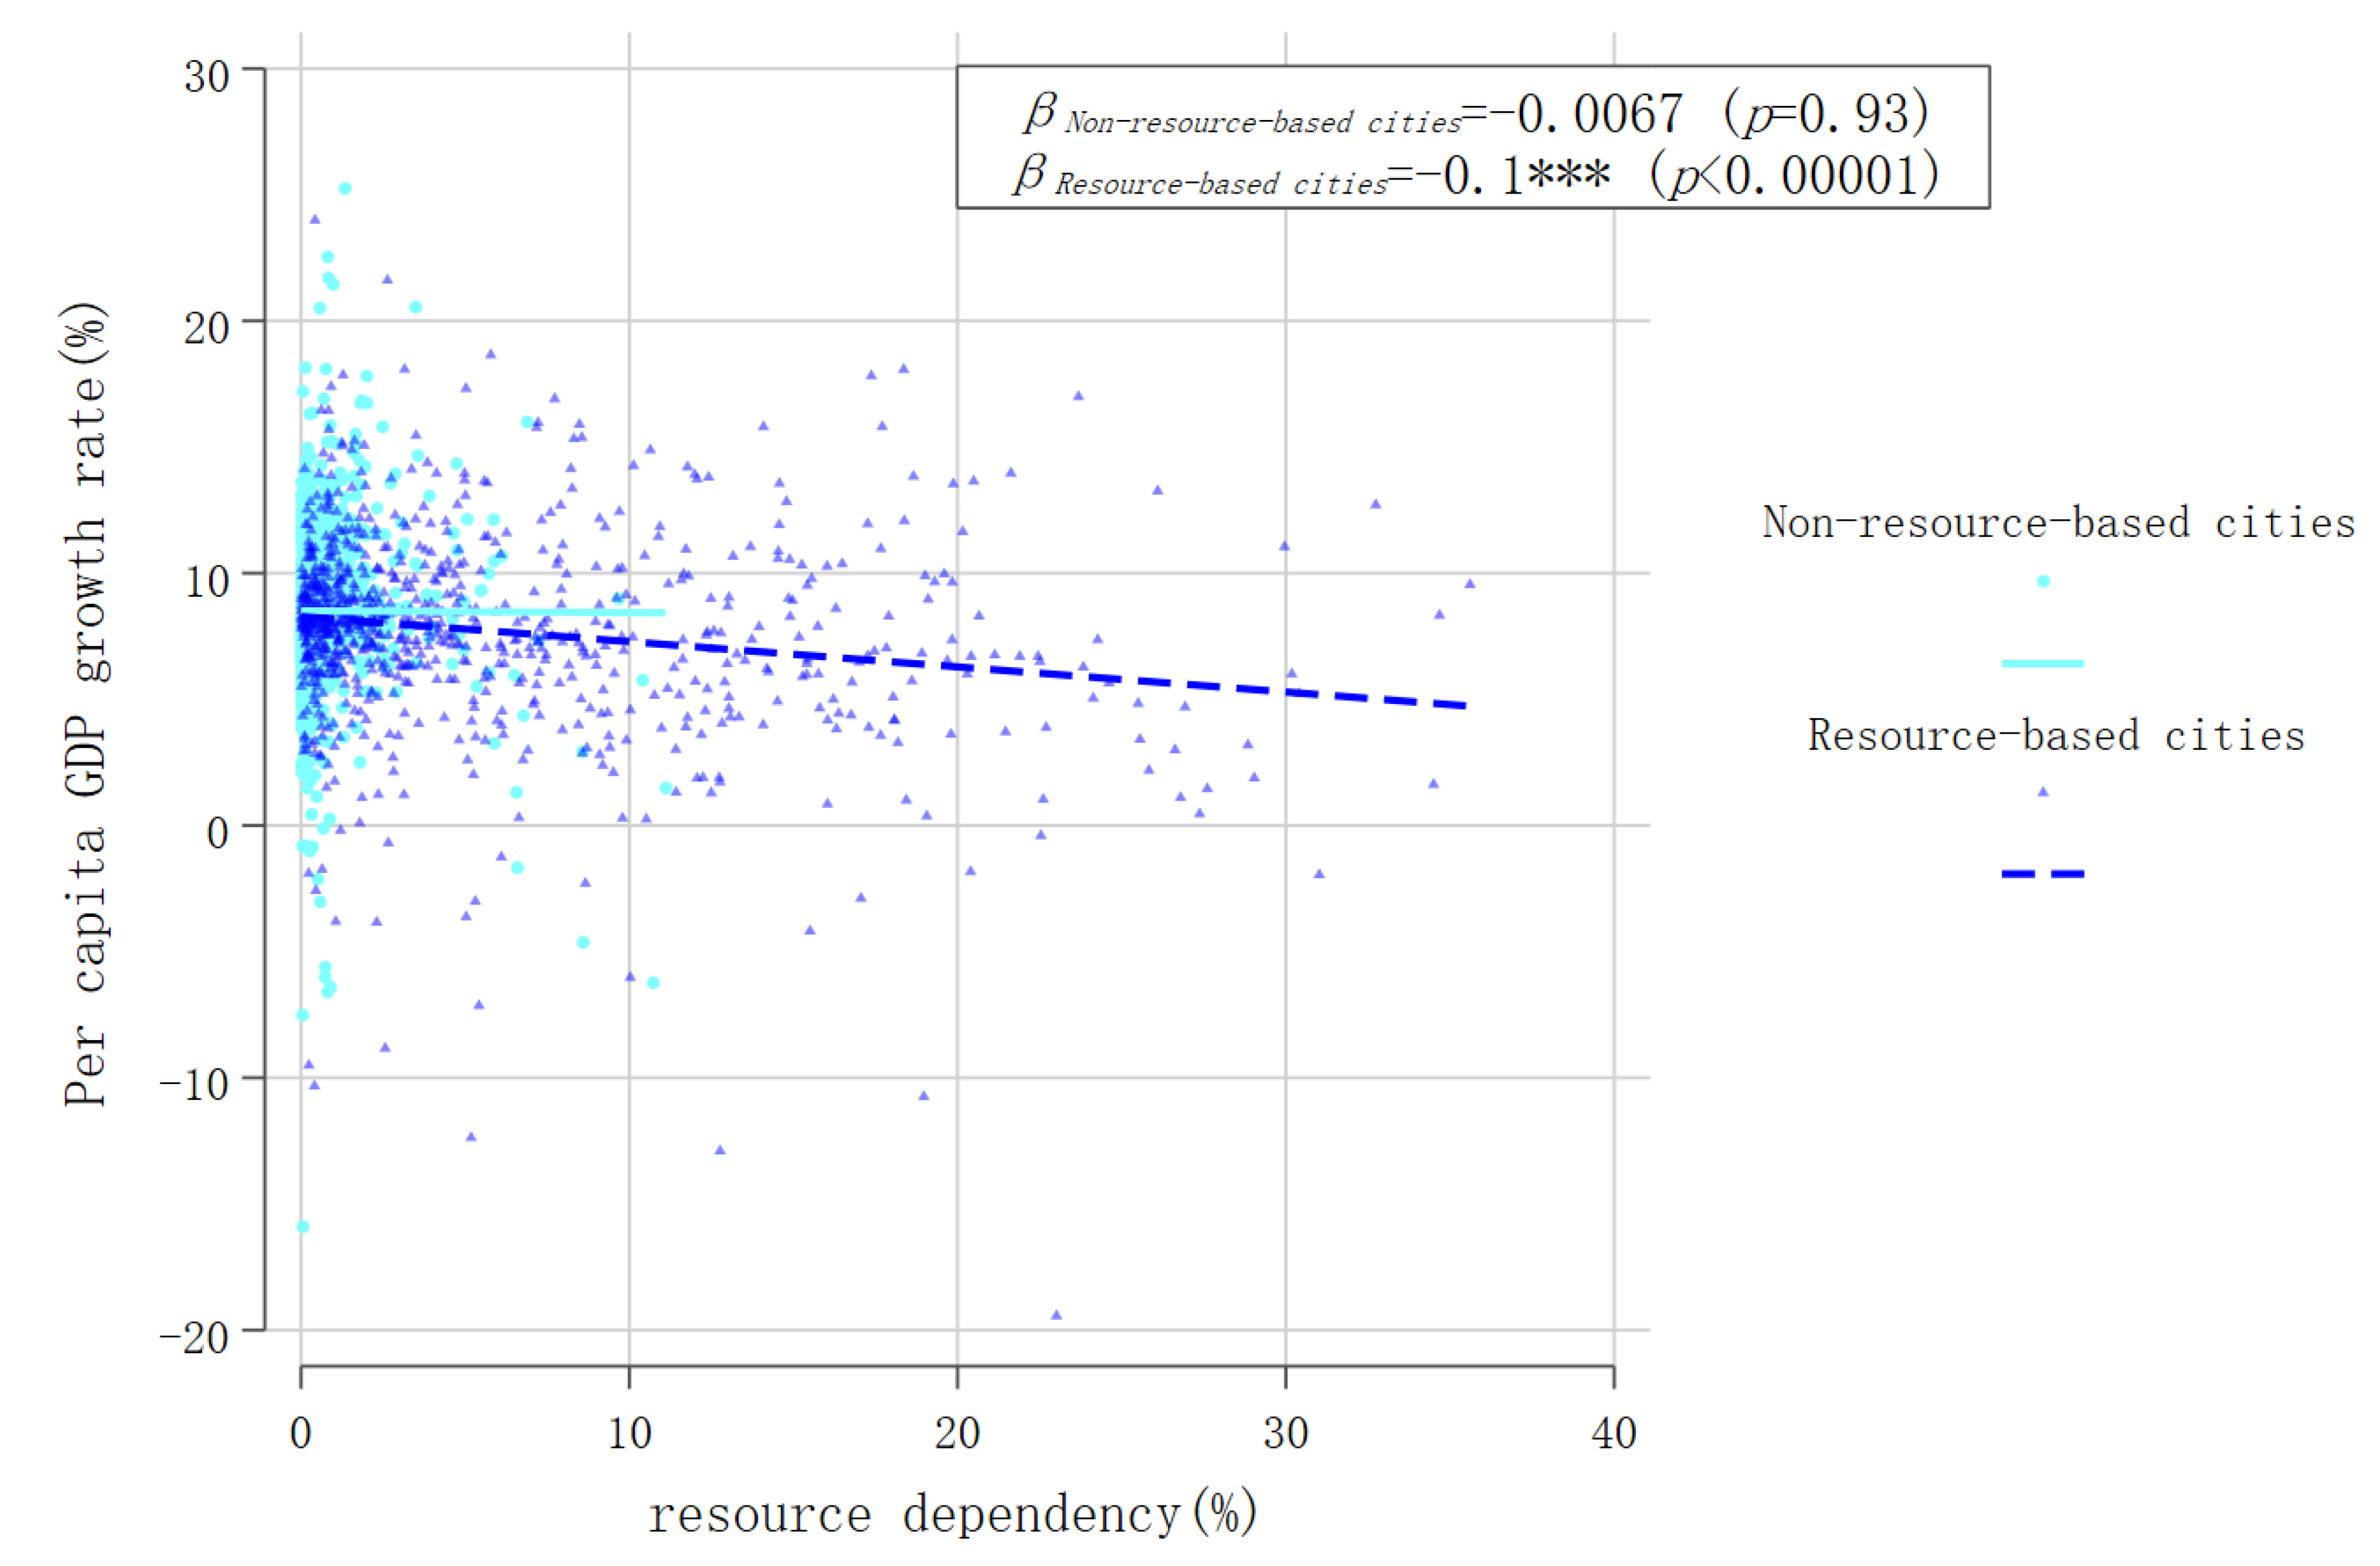
Figure 11.
Scatterplot of resource dependence and per capita GDP growth rate for four types of resource-based cities.
Figure 11.
Scatterplot of resource dependence and per capita GDP growth rate for four types of resource-based cities.
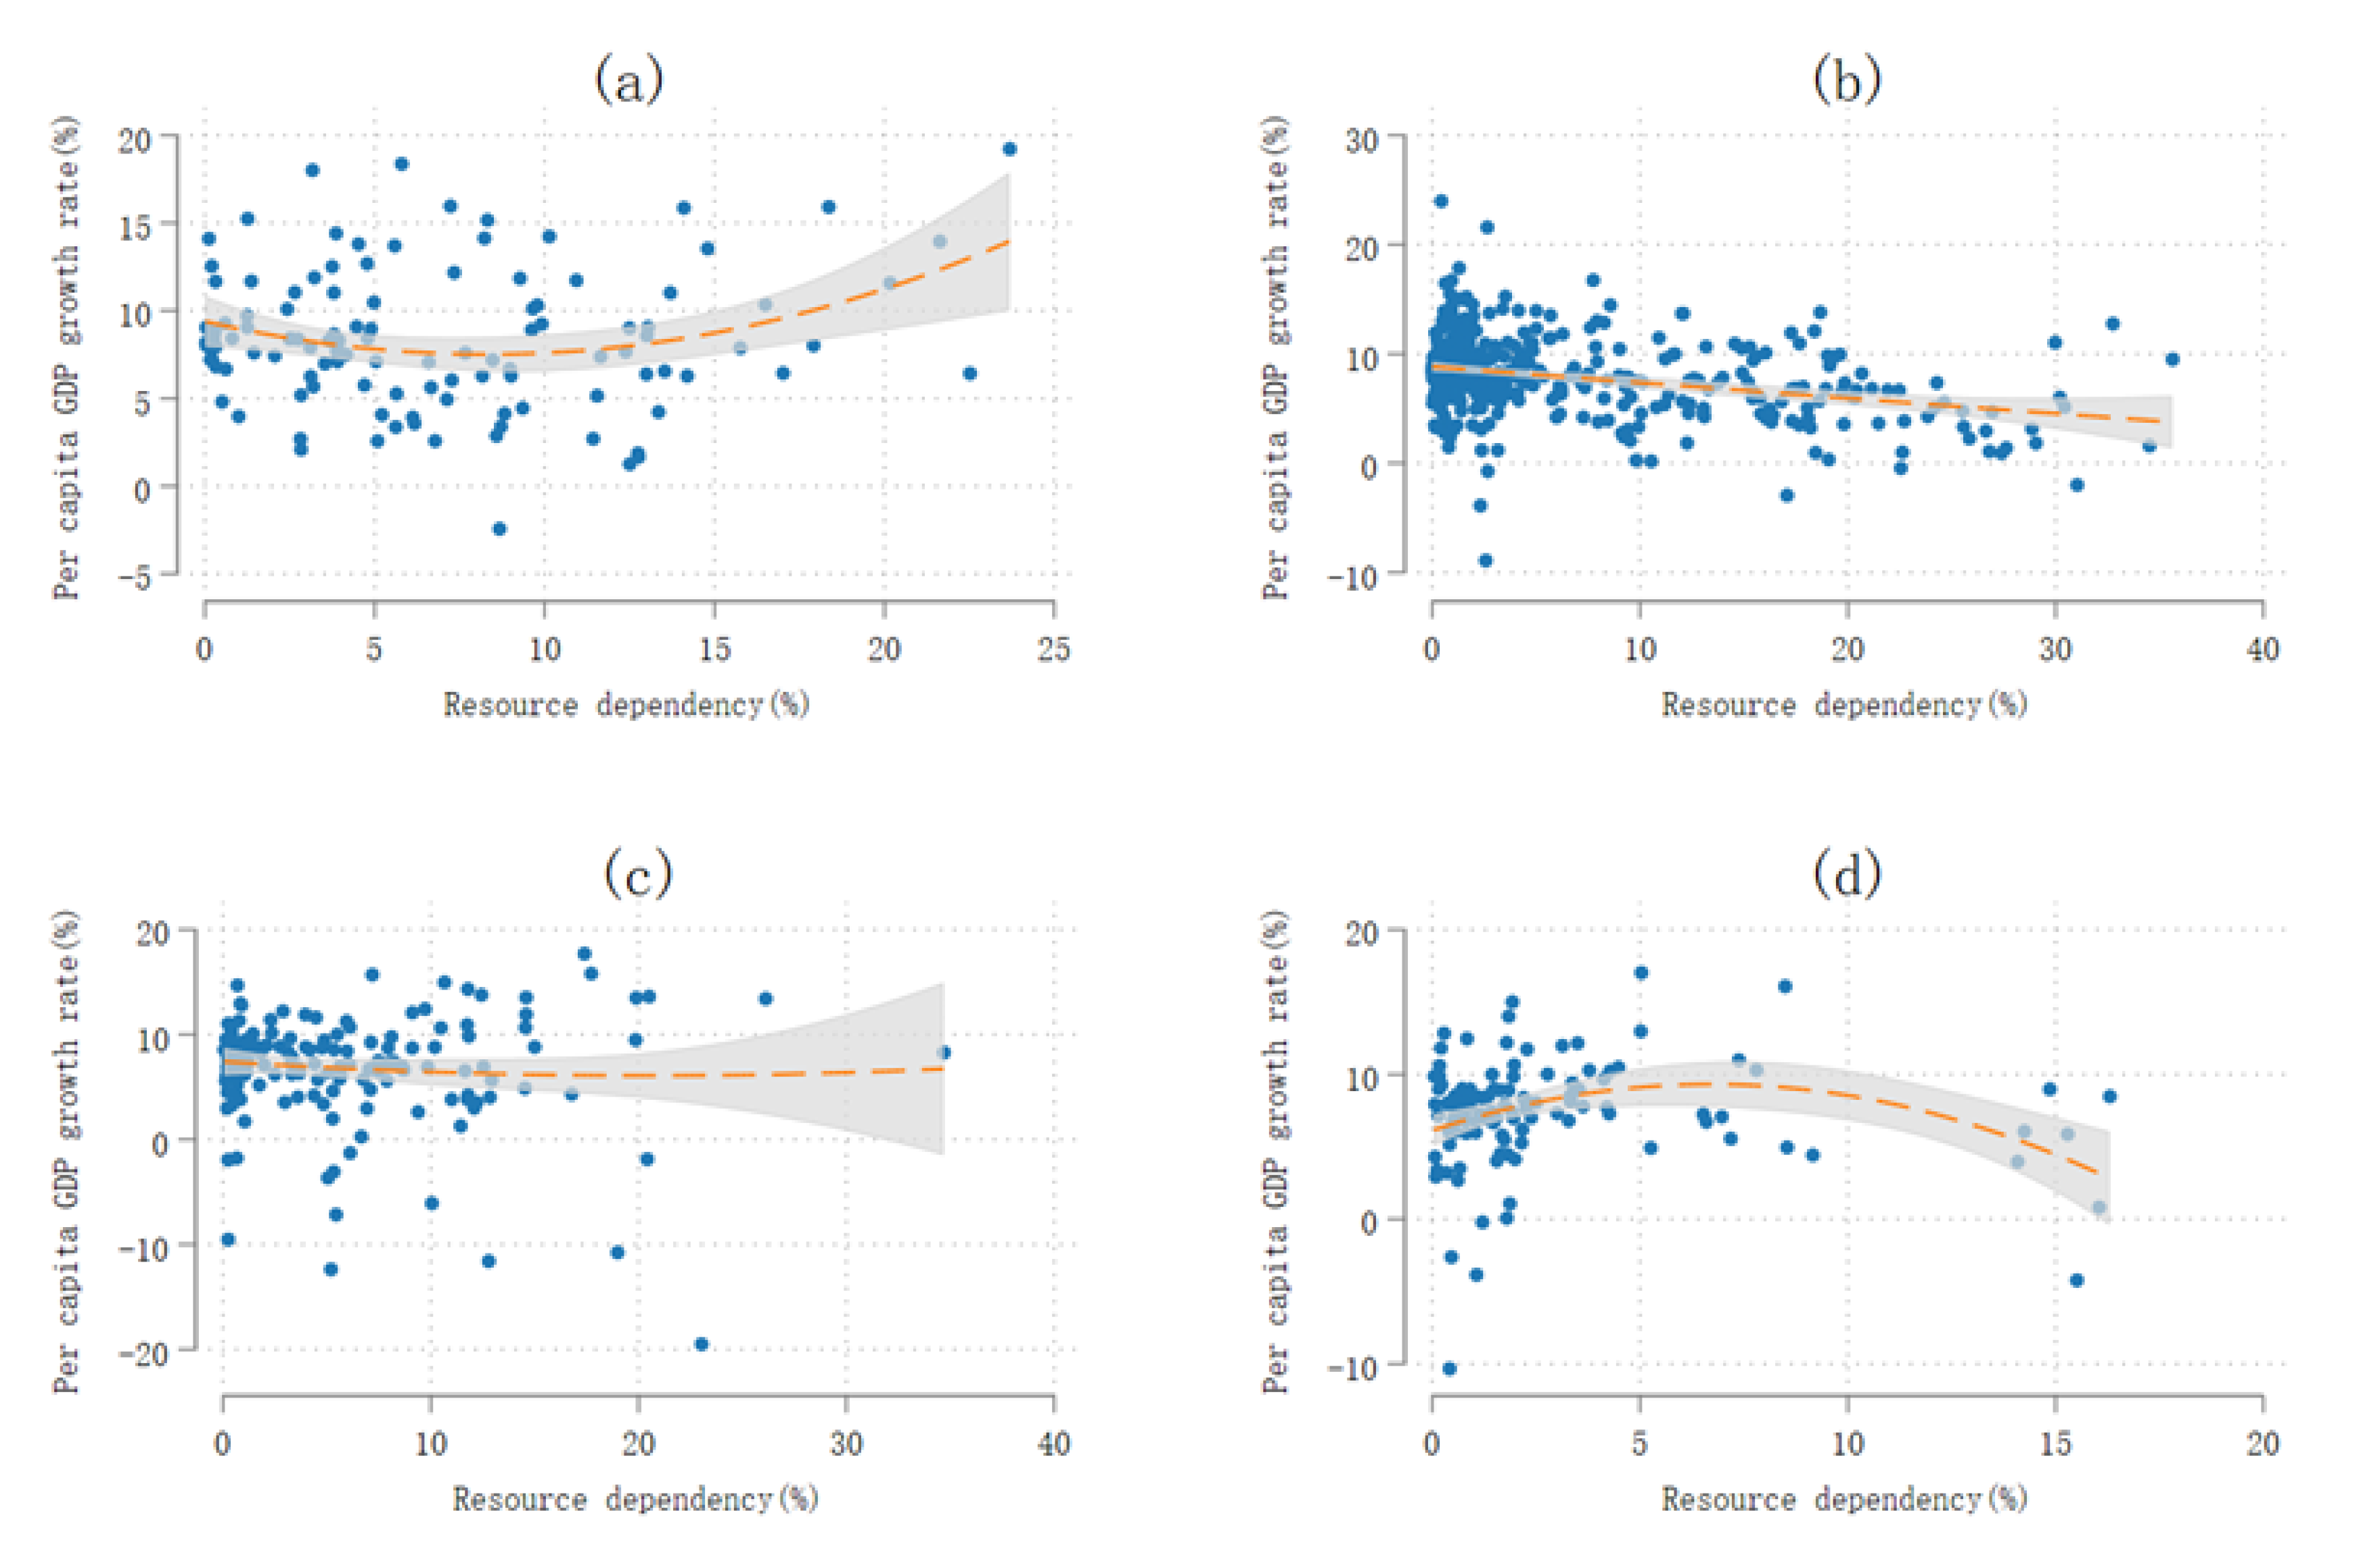
Figure 12.
Scatterplot of urban population growth rate versus per capita GDP.
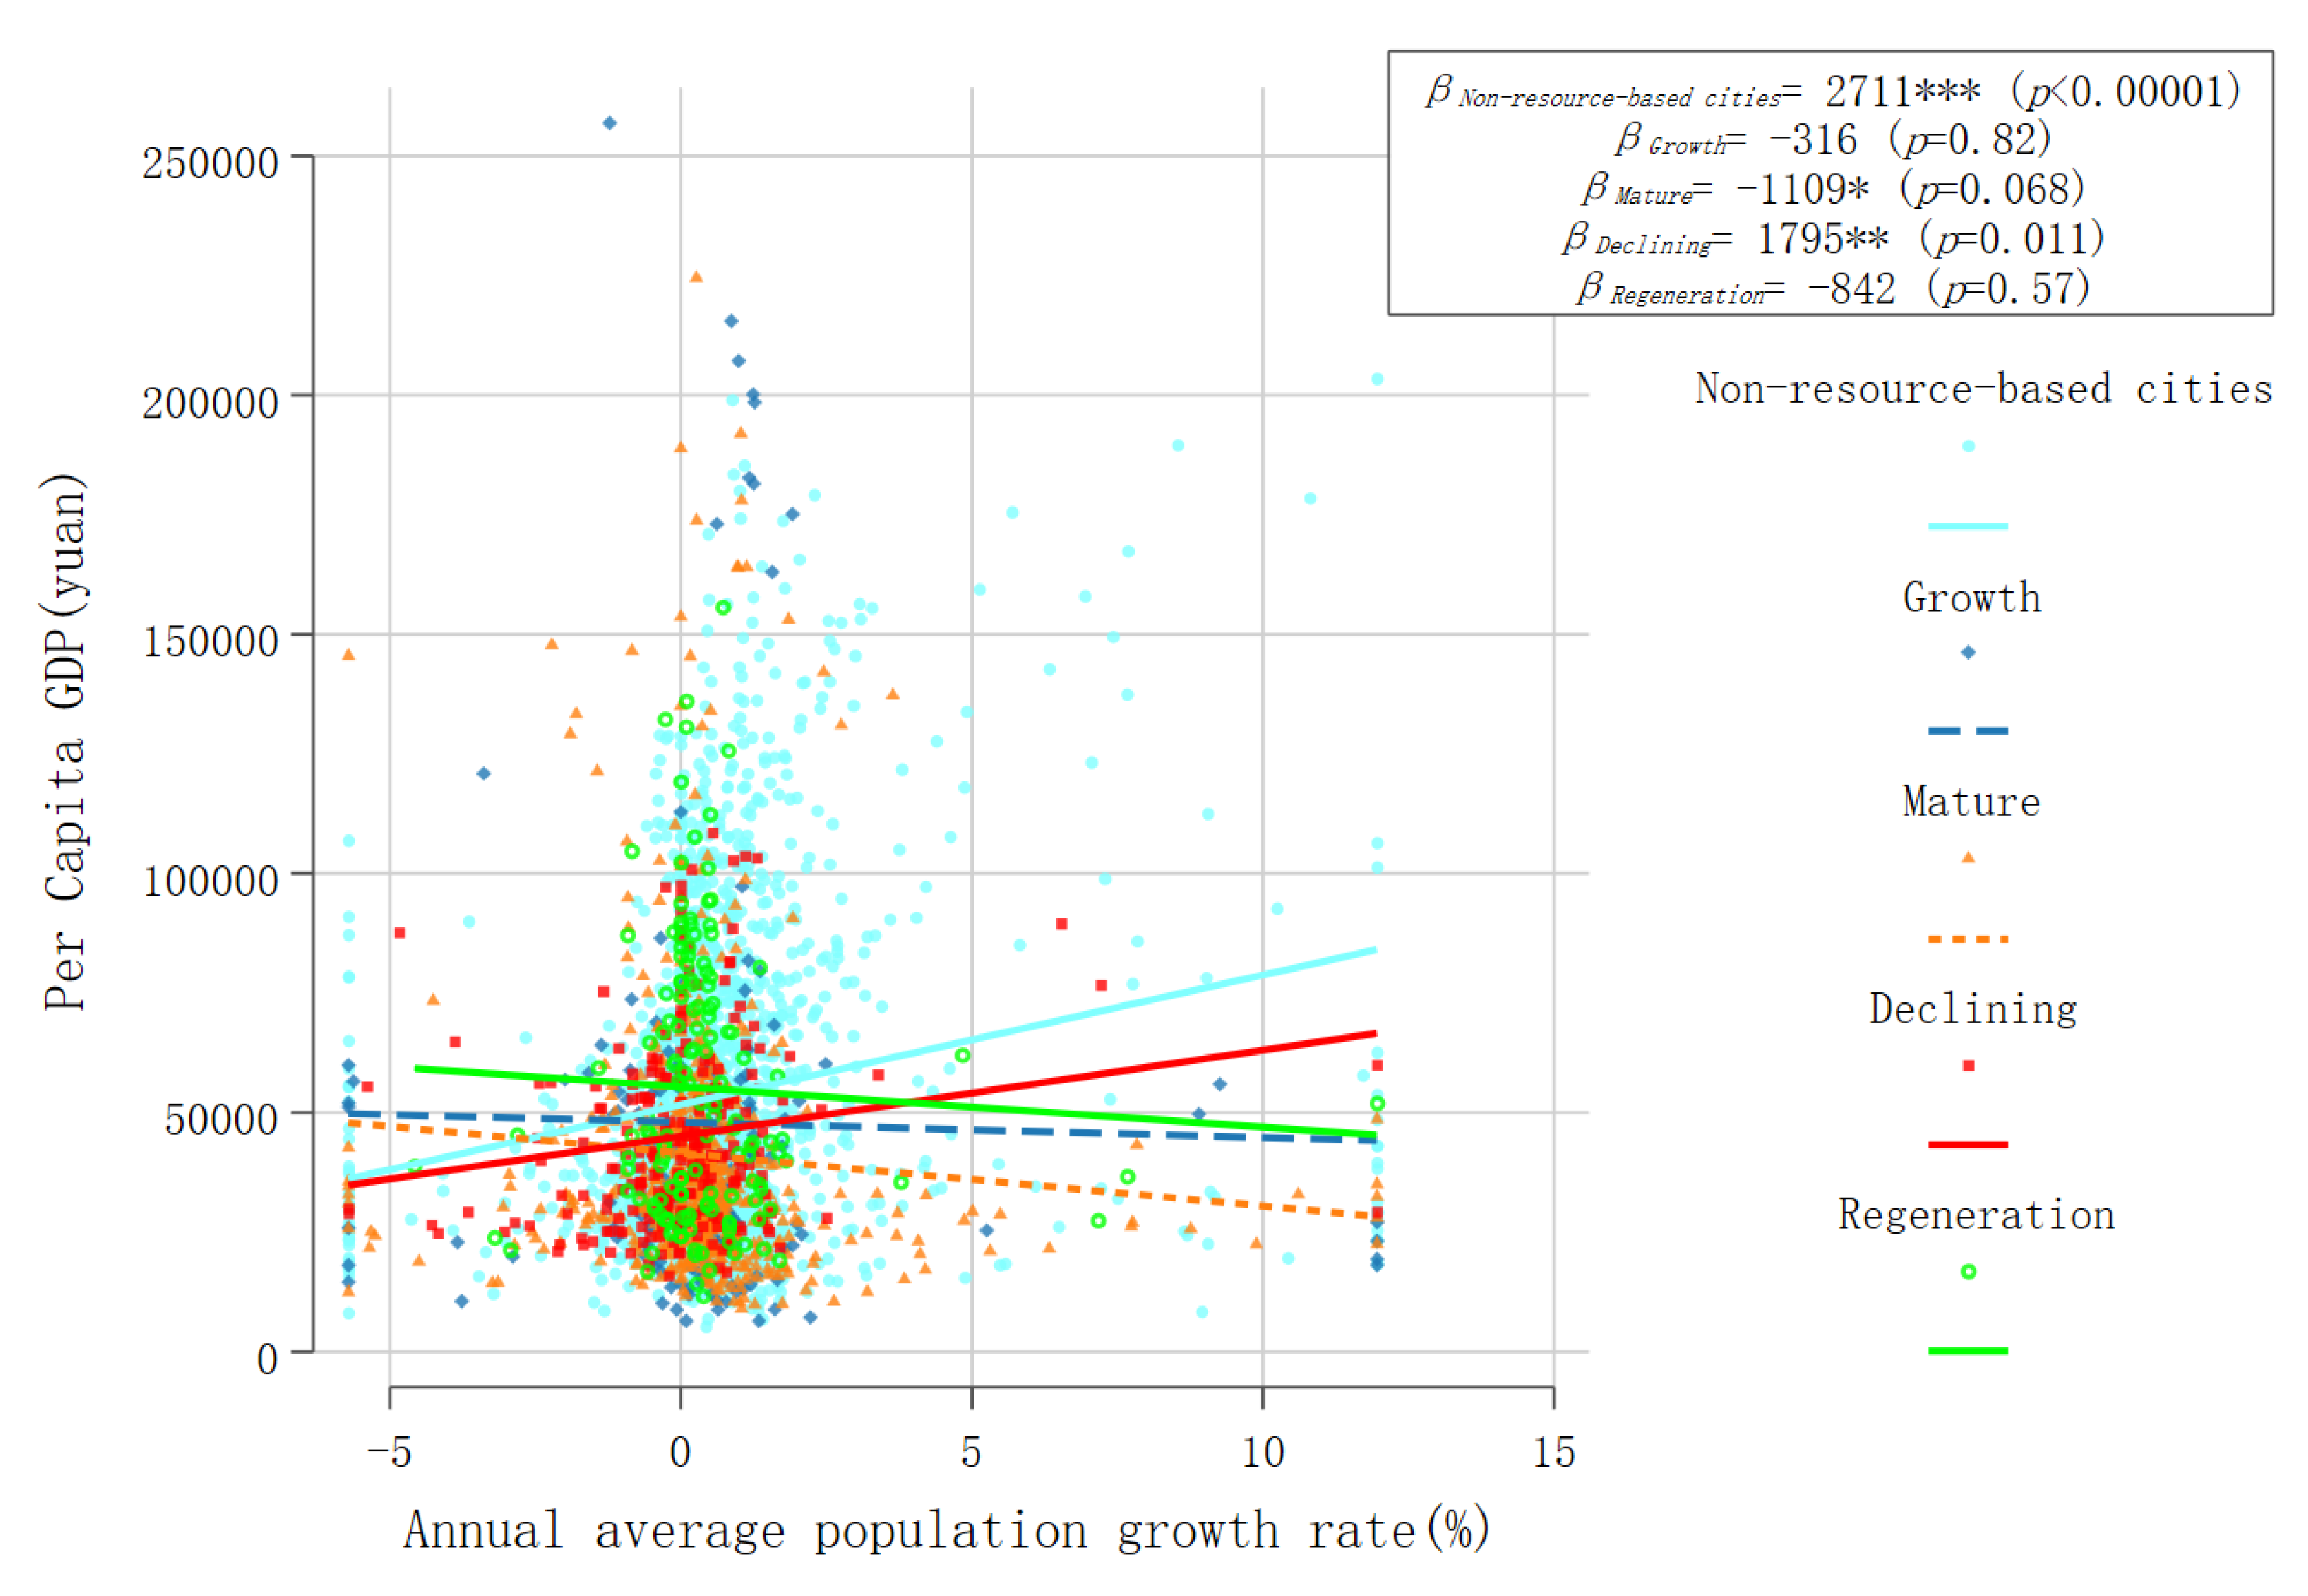
Figure 13.
Scatter plot of distance to urban ports versus per capita GDP.
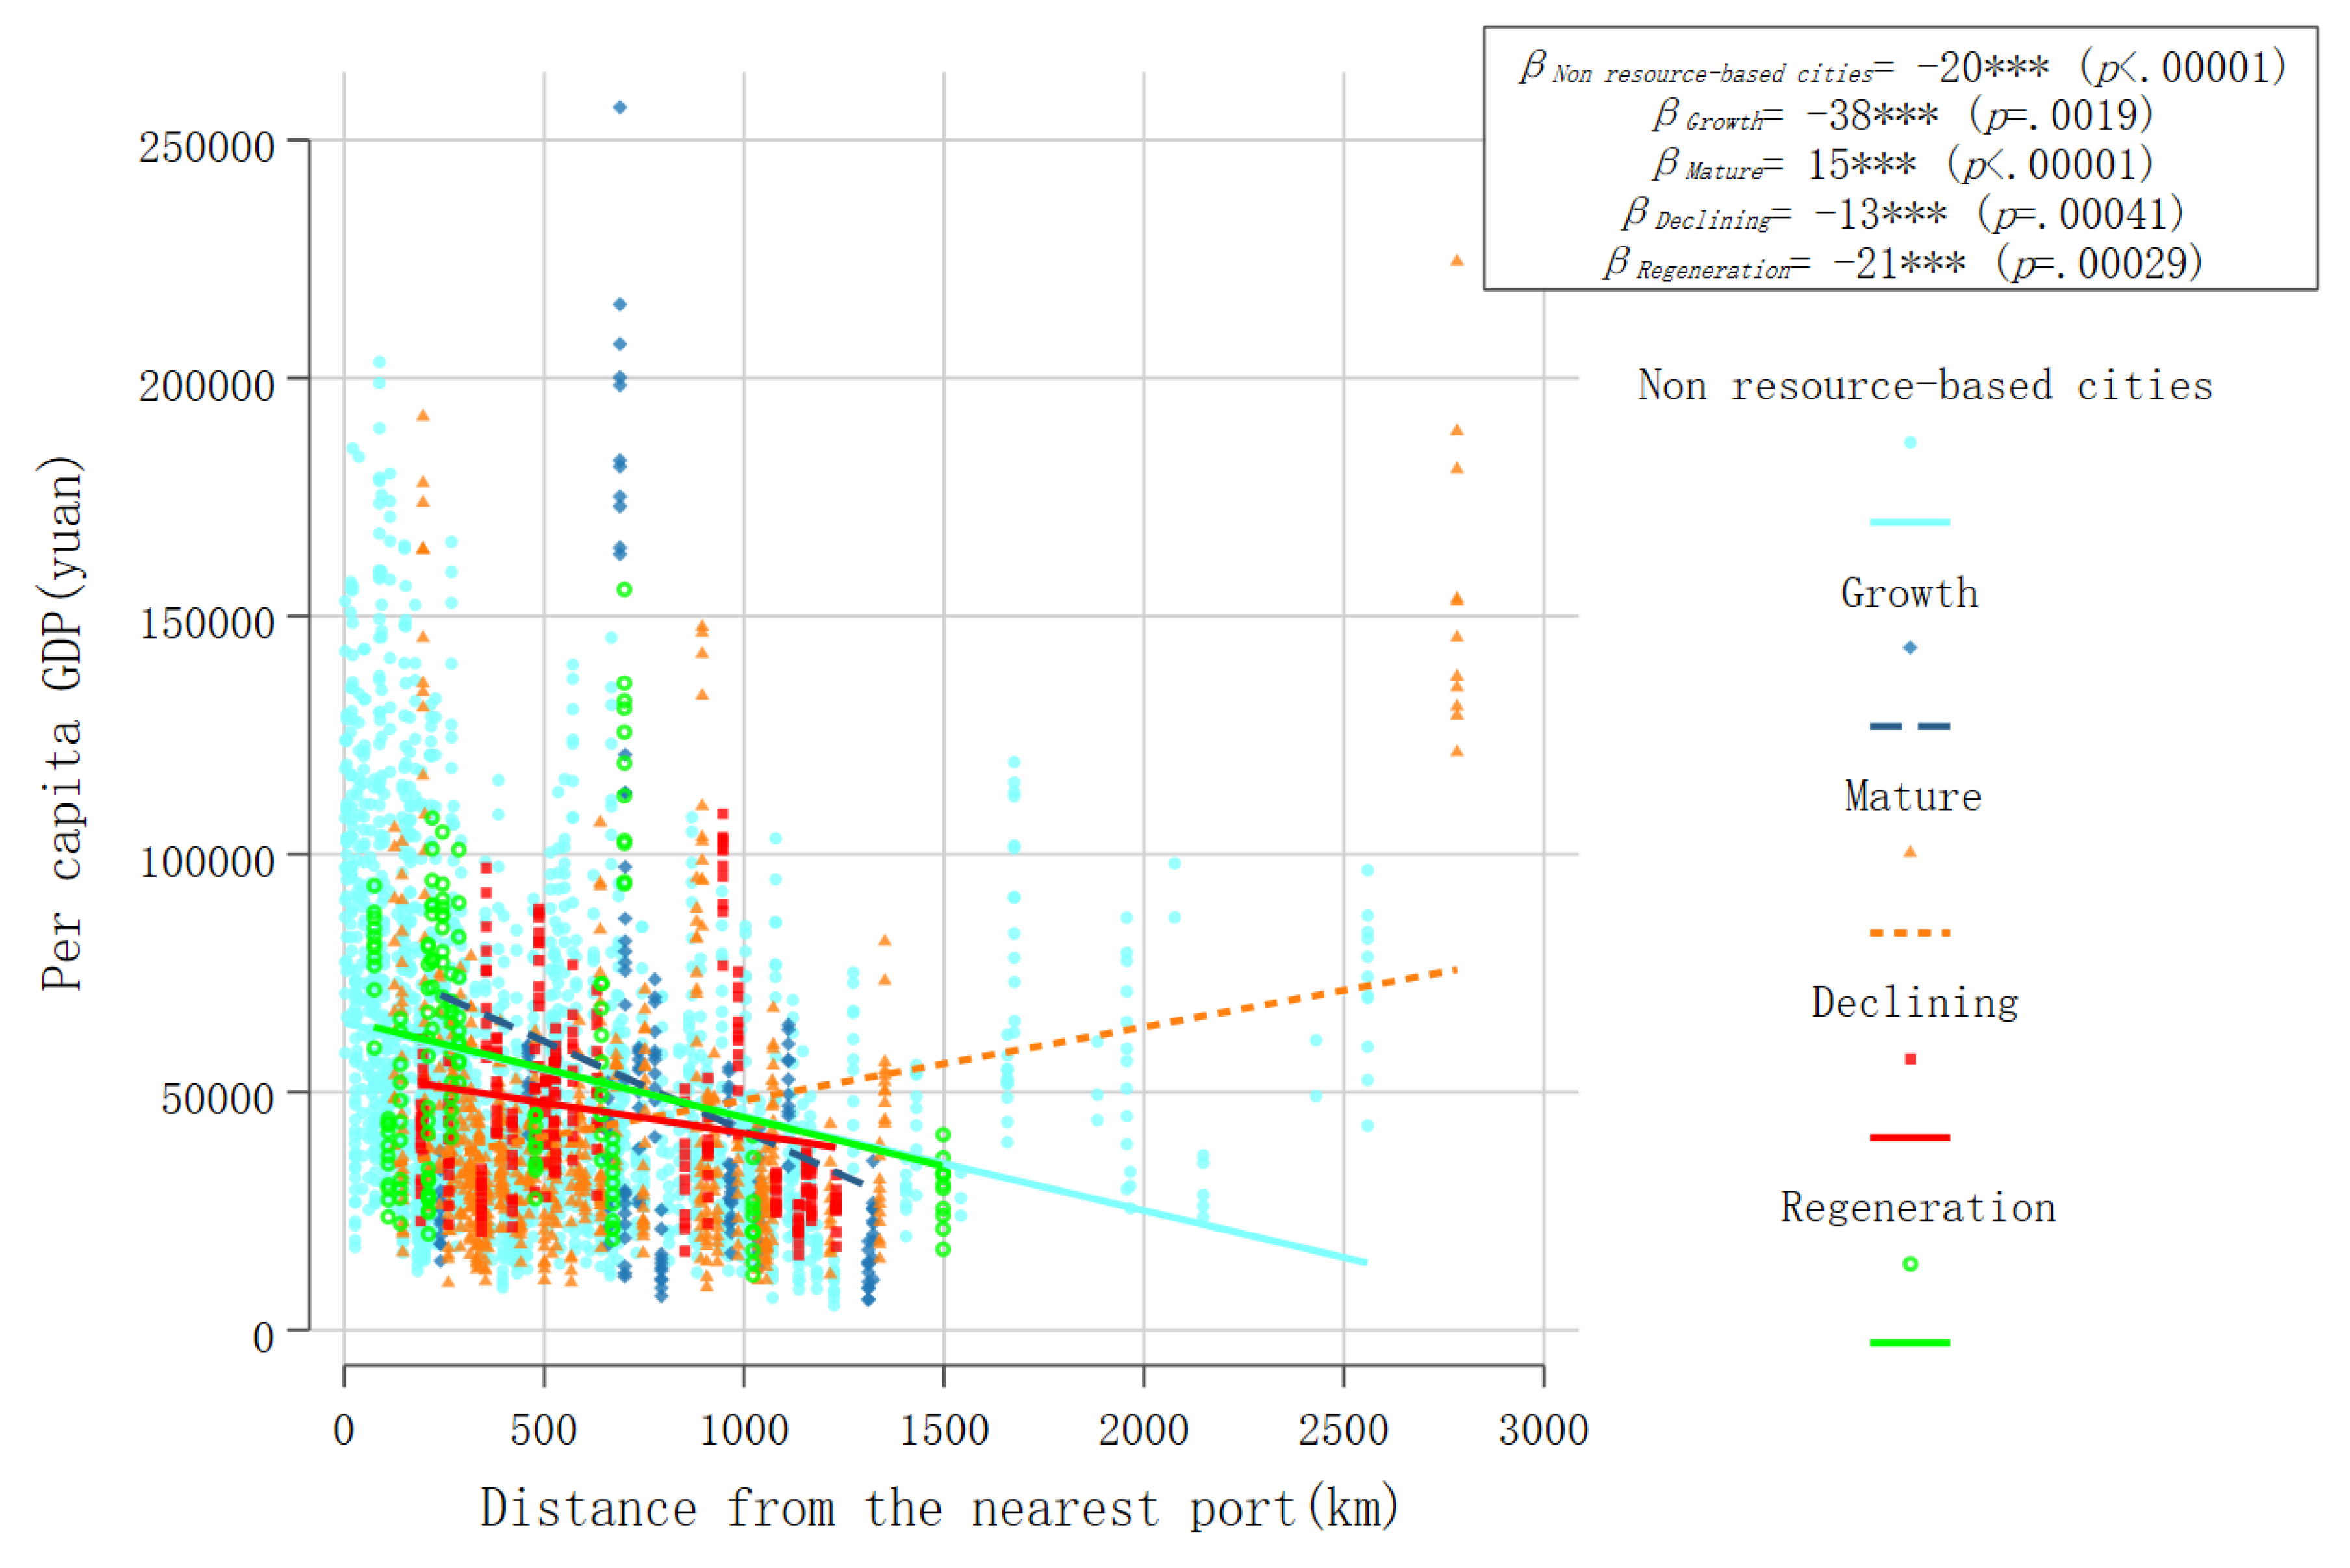
Figure 14.
Scatterplot of institutional environment and per capita GDP.
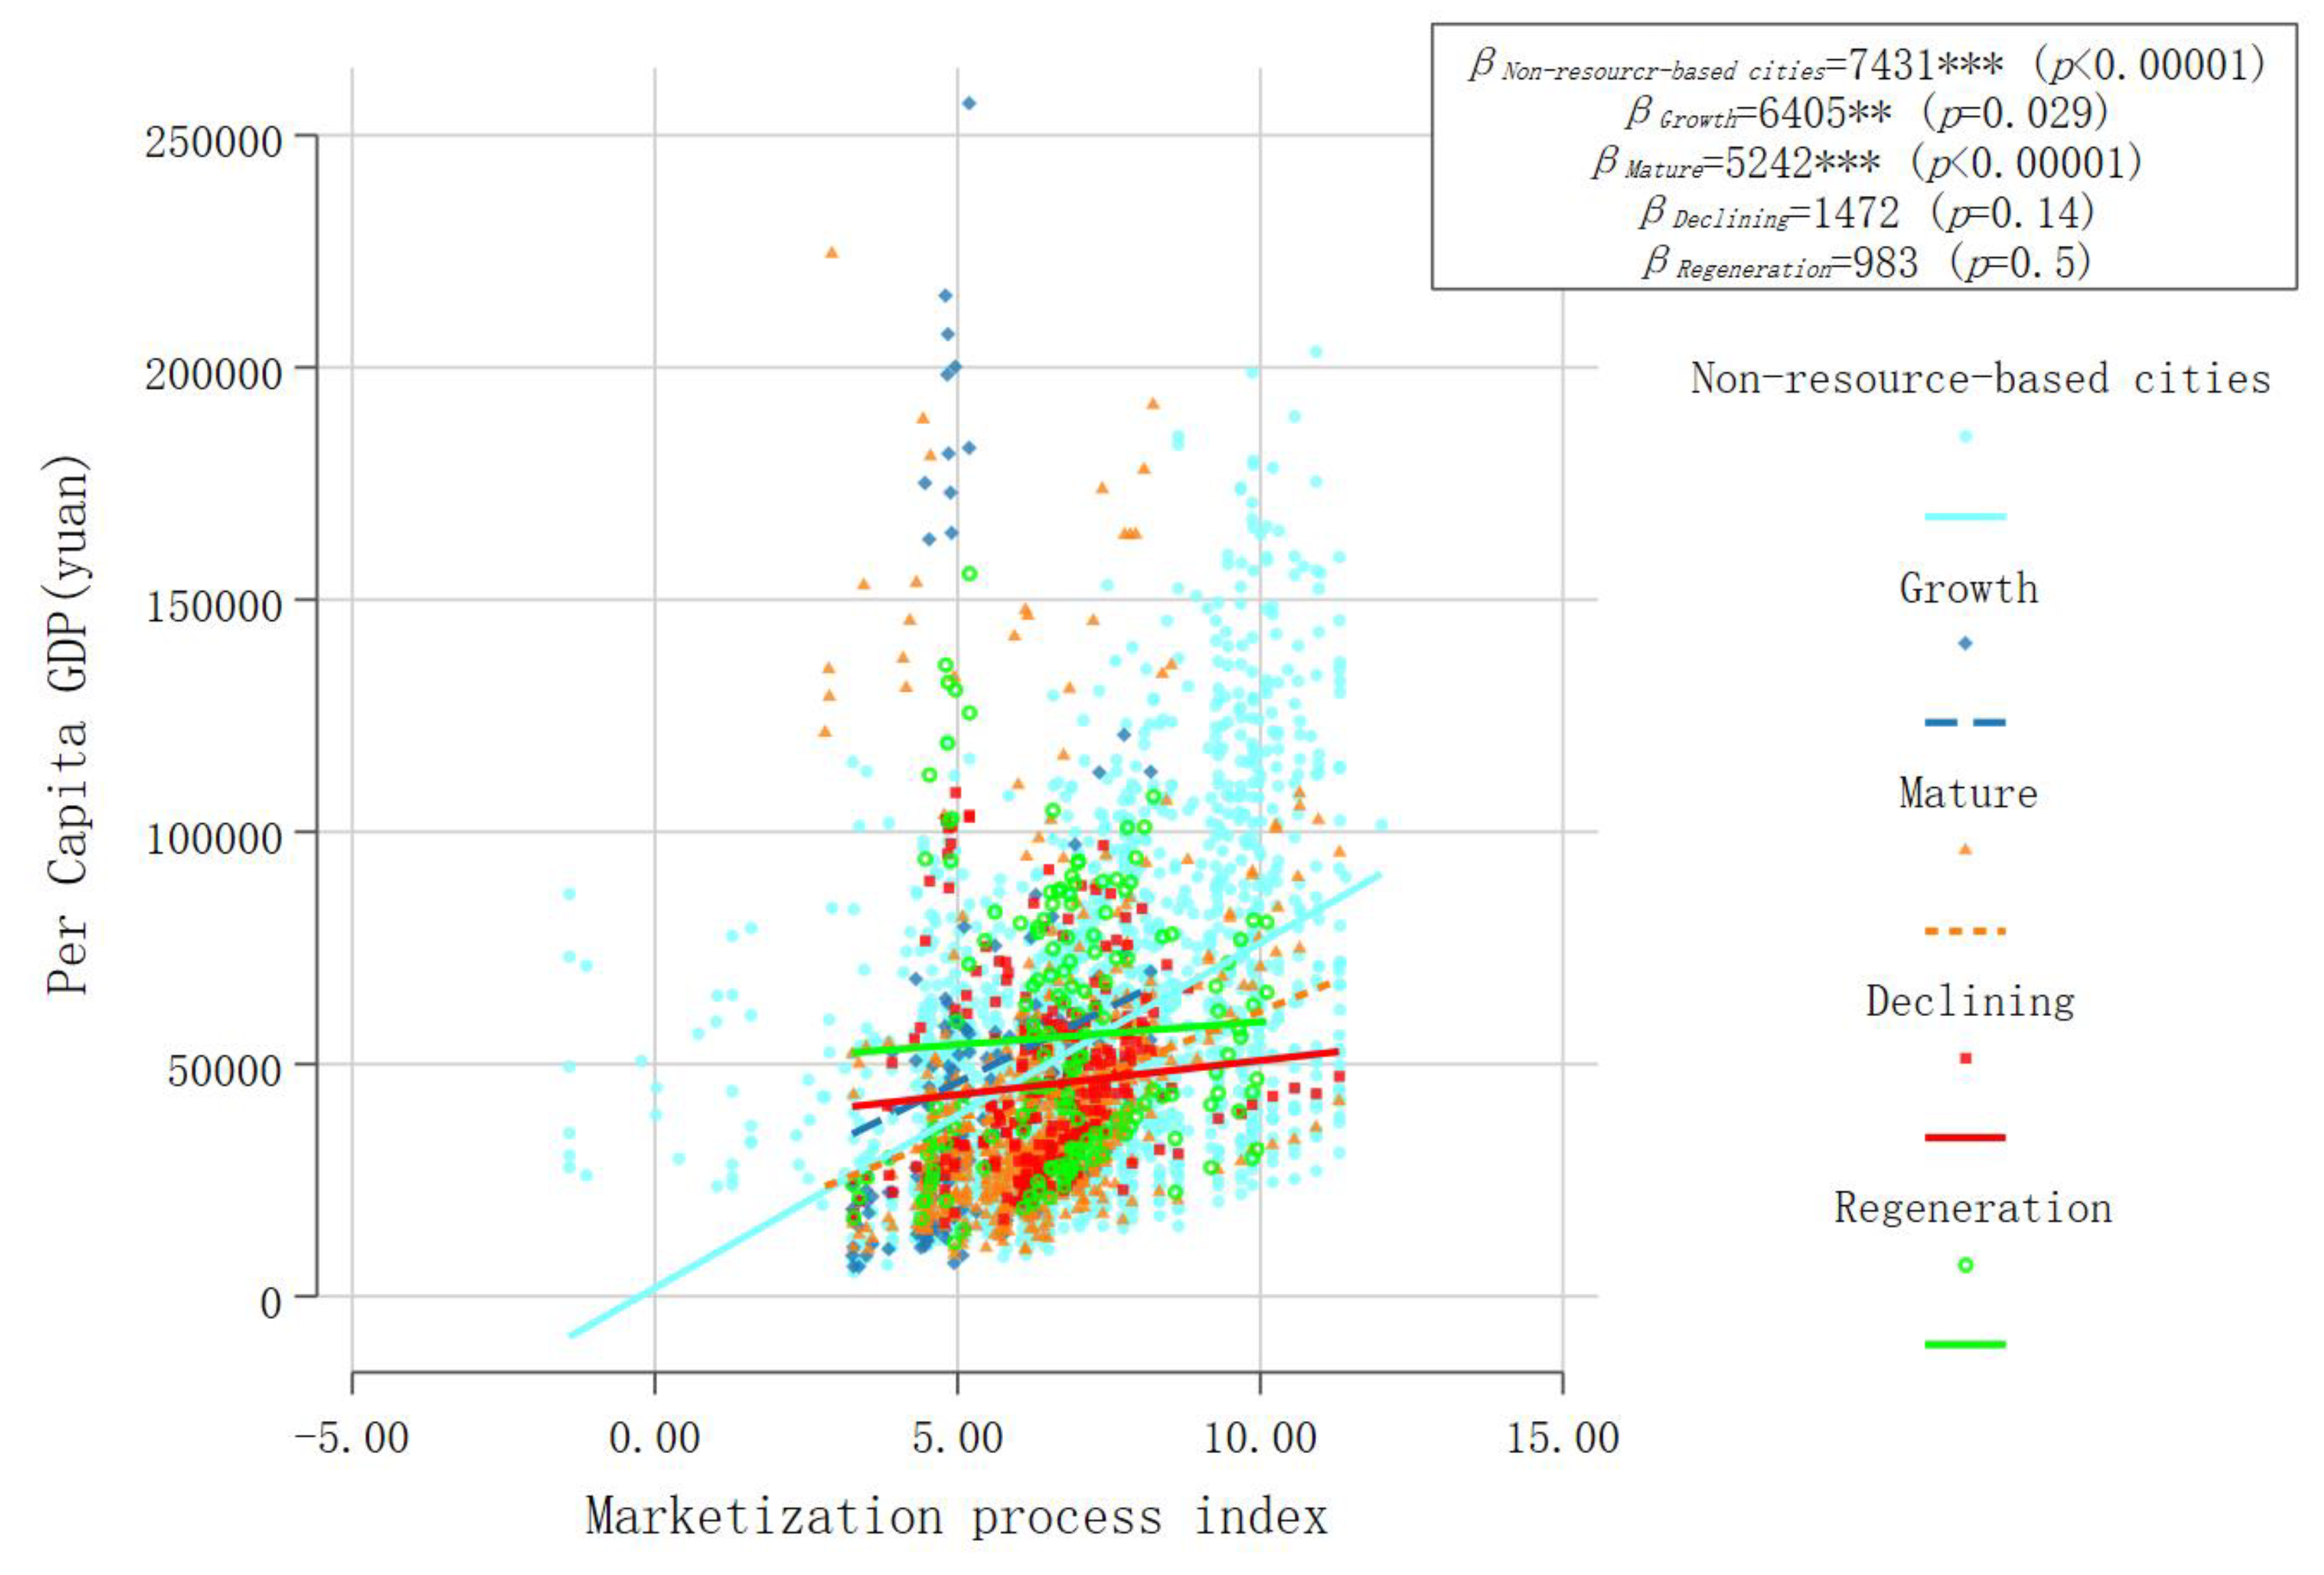

Table 1.
Test of Heterogeneity in Four Types of Resource-Based Cities.
| Test Methods | Chow test | SUEST test |
|---|---|---|
| P value | 0.000*** | 0.001*** |
Disclaimer/Publisher’s Note: The statements, opinions and data contained in all publications are solely those of the individual author(s) and contributor(s) and not of MDPI and/or the editor(s). MDPI and/or the editor(s) disclaim responsibility for any injury to people or property resulting from any ideas, methods, instructions or products referred to in the content. |
© 2024 by the authors. Licensee MDPI, Basel, Switzerland. This article is an open access article distributed under the terms and conditions of the Creative Commons Attribution (CC BY) license (http://creativecommons.org/licenses/by/4.0/).
Copyright: This open access article is published under a Creative Commons CC BY 4.0 license, which permit the free download, distribution, and reuse, provided that the author and preprint are cited in any reuse.


