
Submitted:
25 November 2024
Posted:
26 November 2024
You are already at the latest version
Abstract
A simple pore microstructure of parallel, identical, inclined smooth walled slits in a rigid solid, for which prediction of its geometrical and acoustic properties is straightforward, can yield useful sound absorption. This microstructure should be relatively amenable to 3D printing. Discrepancies between measurements and predictions of normal incidence sound absorption spectra of 3D printed vertical and slanted slit pore samples have been attributed to the rough surfaces of the slit walls and uneven slit cross sections perpendicular to the printing direction. Theories for the influence of (a) sinusoidal walls and (b) periodically varying uniform slit widths on the normal incidence absorption spectra of a slit pore medium are outlined. Although the slit wall surface and geometrical imperfections due to 3D printing differ from these idealizations, predictions assuming the ideal forms of roughness confirm that pore wall roughness could account for differences between predictions and data. Pore wall roughness is predicted to increase both flow resistivity and tortuosity thereby increasing the low frequency sound absorption of thin hard-backed layers. The extent to which sinusoidal slit walls or periodically varying uniform slit widths could improve sound absorption is explored.
Keywords:
sound absorption
; 3D printing
; sinusoidal walls
; periodically varying widths
1. Introduction
Many designs for porous sound absorbers have been created and tested by additive manufacturing and observed differences between measured and predicted performance have been attributed to imperfections introduced during the manufacturing process [1,2]. A thin hard backed rigid solid matrix containing inclined slits is a relatively simple microstructure for which the geometric and acoustic properties are straightforward to predict but, nevertheless, as long as the slits and separating walls are thin enough, can give useful sound absorption [3]. Cylindrical samples containing 0.3 mm wide, parallel, identical slits separated by 0.4 mm walls in a rigid resin matrix that are either vertical or inclined in zigzag patterns have been manufactured by 3D printing and their normal ini-cidence sound absorption spectra measured in an impedance tube [4]. The zigzags overcome the difficulty that a significant proportion of parallel inclined slits in samples placed in an impedance tube would not be accessible to incident sound waves. Comparisons between measurements and predictions reveal discrepancies, especially for samples made by Fused Deposition Modelling (FDM).
The flow resistivity of the samples is sufficiently low that their sound absorption spectra are dominated by quarter wavelength layer resonances. Between these resonances, the measured absorption is higher than predicted. Also, the second order resonance in the measured absorption spectrum for the sample with vertical slits is at a lower frequency than predicted. It has been suggested that these discrepancies may be attributed to the rough internal surfaces and the uneven slit cross sections perpendicular to the printing direction that occur during manufacture [4]. For a given mean width, the flow resistivity in microchannels with wavy walls is predicted to be greater than if their width is constant [5]. In close packed cubic arrays of insulating spheres and in media containing pores with fractally rough walls, the formation factor, which has the same influence on electrical conductivity as tortuosity has on acoustic wave propagation, is predicted to have relatively high values [6].
This paper outlines theories for the influence of two idealized forms of pore wall roughness on flow resistivity and tortuosity and uses them to confirm that inclusion of pore wall roughness effects would improve agreement between data and predictions of the normal incidence absorption coefficient of the 3D printed slit pore samples. Since wall roughness is predicted to increase sound absorption, the theories outlined are used also to explore the benefits of deliberately creating slits with these forms of wall roughness.
Section 2 outlines theories for sound absorption by a hard backed rigid solid layer containing parallel identical slits with cross sections that either vary sinusoidally or have periodically alternating widths. In Section 3, these theories are used to confirm that pore wall roughness is responsible for at least part of the observed differences between predictions and data for the 3D printed samples. In Section 4, the theories are used further to illustrate the extent to which varying slit cross sections could improve the absorption of hard backed rigid solid layers containing identical parallel slits. Concluding remarks are in Section 5.
2. Theories for Slits with Regularly Varying Cross Sections
2.1. Sinusoidal Slit Walls
Sound absorption by rigid solid matrix containing parallel, identical, inclined slits with sinusoidal cross sections can be predicted analytically by extending a theory developed for microperforated plates [7]. Figure 1 (a) shows a single slit with sinusoidal walls and a mean width of . The sinusoidal variation in width has amplitude and wavelength . Figure 1(b) shows an array of such slits arranged vertically in a solid matrix to form a hard backed porous layer with a thickness which encompasses wavelengths of the sinusoidal cross section, so that . Where the slits intersect the layer surface, their width is . So, if the edge to edge spacing is , the symmetry of the sinusoidal cross sections means that the porosity at the surface is the same as the bulk porosity of a medium containing slits with a constant width of .
If and , the tortuosity of a slit of mean semi width with a cross section that is sinusoidal with amplitude and wavelength is given by [5],
The flow resistivity of a uniform slit of semi width is , where is the dynamic viscosity of air [3]. With the sinusoidal cross section shown in Figure 1(a), the flow resistivity of the slit is increased by a factor given by [7].
If the slits are inclined at an angle to the surface normal, then the tortuosity and flow resistivity are increased by a further factor given by [3]
The flow resistivity of a medium with bulk porosity containing identical, inclined, sinusoidal cross section slits, is given by [3,7]
According to Stinson [8], the complex density and complex compressibility of air in a parallel sided slit of width , are written, respectively, as
The bulk complex density () and complex compressibility () for a medium of porosity containing identical, parallel, inclined, slits with sinusoidal cross sections are calculated from those for individual slits using Equations (1), (4), (7a) and (7b),
2.2. Periodic Sectionally Uniform Slits
Consider a medium with vertical slits which have alternating sections of length and length with corresponding widths of and width respectively, as shown in Figure 2. If the narrower sections of the slits intersect the surface and their edge to edge spacing is , the number of slits per unit surface area . The repeating structure or unit cell in each slit is composed of adjacent narrow and wide slit sections of total length , so the number, , of such cells per unit thickness of the layer is given by .
Champoux and Stinson [9] have derived a general theory for the acoustic properties of a medium containing sectionally uniform pores of arbitrary shape and obtained results for alternating sectionally uniform cylindrical pores with different radii. Their equations (18), (19) and (20) can be used to derive analytical expressions for the porosity, flow resistivity and tortuosity of the regularly varying width slit pore medium shown in Figure 2.
Accordingly, the porosity is given by
The flow resistivity is given by
and the tortuosity is given by
The bulk dynamic density of the medium containing slits with periodically varying widths of the form shown in Figure 2 and inclined at θ to the normal to the surface is given by [9, equation (24)]
where and are given by equations (5a,b,c) after replacing by and respectively and is given by equation (3).
Similarly, the bulk compressibility of the medium is given by [9, equation (29)],
Where and are given by equation (6) with replaced by and respectively.
Note that, for this regular variation in slit width, the acoustic properties depend on the proportion of wider to narrower cross sections and the ratio of the widths but, as long as these lengths are small compared to the incident wavelength, they do not depend on the individual lengths of the sections with different widths. Also, it should be noted that the theory ignores the complicated flow velocity fields that may occur near the changes in width [3,7].
The bulk propagation constant () and relative characteristic impedance () of a porous material in which the pores are either slits with sinusoidal cross sections of mean width or periodically varying uniform widths with mean width and repetition length are calculated either from equations (7a), (7b), (13a) and (13b) and equations (11), (12), (13a) and (13b) respectively,
The surface impedance of a hard-backed porous layer of thickness d is:
The plane wave reflection coefficient, , and normal incidence absorption coefficient, , for a hard-backed porous layer are given by Equations (15a), and (15b), respectively:
3. Absorption by 3D Printed Samples
Opiela et al [4] report impedance tube measurements of the normal incidence absorption spectra for 49.5 mm thick samples containing 0.3 mm wide parallel slits which are either vertical or with zigzags inclined at 45° to the surface normal. Nominally, the edge-to-edge slit separation at the surface of 0.4 mm implies a porosity of 0.429. Predictions obtained both analytically and numerically, the latter by using a Finite Element code, agree with each other, but depart from the data. Between the quarter wavelength resonances, the measured absorption is higher than predicted. Also, for the vertical slits, the frequency of the second quarter wavelength resonance in the measured spectrum is slightly lower than predicted. These discrepancies would be consistent with the samples having higher flow resistivity and tortuosity than predicted for uniform cross section slits.
Microscope images of a cylindrical sample [2] indicate that the printed slit widths vary between 0.285 mm and 0.308 mm i.e. between +5% and -2.7% of the nominal 0.03 m width. The thickness of the separating walls varies between 0.401 and 0.436 mm i.e. by up to 9% of the nominal wall thickness of 0.04 m. It is suggested that these variations and other internal surface imperfections may have caused the discrepancies between predictions and data [2]. Although the variation in slit and wall widths in the 3D printed samples is neither sinusoidal nor sectionally uniform, it is interesting to investigate whether allowing for idealised forms of wall roughness can reduce the discrepancy between data and predictions.
Figure 3(a) shows that the differences between predictions for uniform slits and data are reduced by assuming that the slit widths vary sinusoidally (eqns. (1) to (10) with (i.e. 10% of the mean width) and ()). The corresponding values of and are 1.076 and 1.325 respectively. Figure 3(b) shows that a similar reduction in the discrepancy between data and predictions for vertical uniform slits results from allowing for periodically uniform slit cross section variation of the form shown in Figure 2 with and .
To allow for the folds of length in the 3D printed samples with zigzag slits, it was found that an empirical tortuosity correction factor, , given by
improved agreement between analytical predictions for infinitely long slits inclined at 45° to the surface normal and finite element predictions for zigzag slits2. However, neither of these predictions yield significantly better agreement with the data than the prediction for infinitely long inclined slits.
Figure 4(a) shows that the prediction for infinitely long slits can be improved by not only allowing for folds in the slits, with but also by assuming that the slits have sinusoidally varying cross sections with and . The corresponding values of , and are 0.92, 1.053 and 1.24 respectively. Figure 4(b) shows that a similar improvement in agreement between data and the predictions for infinitely long slits results from not only allowing for the zigzag folds but also by assuming a periodic variation in slit cross section of the form shown in Figure 2 with and . Both comparisons suggest that pore wall roughness results in an increase in absorption between the layer resonances.
4. Increasing Absorption by Periodically Varying Slit Widths
Equations (1) to (15) can be used to investigate the extent to which the deliberate introduction of sinusoidal variations in slit width or periodic variation in slit width might improve the absorption of a low flow resistivity sound absorber containing vertical narrow slits with mean width 0.3 mm produced by 3D printing2. Figure 5(a) shows the influence on predicted normal incidence absorption coefficient spectra of varying the sinusoidal variation amplitude at constant wavelength and Figure 10(b) shows the influence of varying the wavelength at constant amplitude.
Either increasing the amplitude for a given wavelength or decreasing the wavelength for a given amplitude lowers the first quarter wavelength frequency and, because of the associated increases in tortuosity and flow resistivity, both increase the absorption between quarter wavelength resonances. But, for a given wavelength, amplitude variation is predicted to have greater influence.
Figure 6 suggests that periodically varying the slit widths also would improve the absorption of such a low flow resistivity 3D printed hard backed layer.
As with the sinusoidal cross sections, a regular sectionally uniform slit variation is predicted to decrease the quarter wavelength resonance frequencies as well as to increase absorption between these resonances. The width variation has a greater influence than the proportion of wider slit sections.
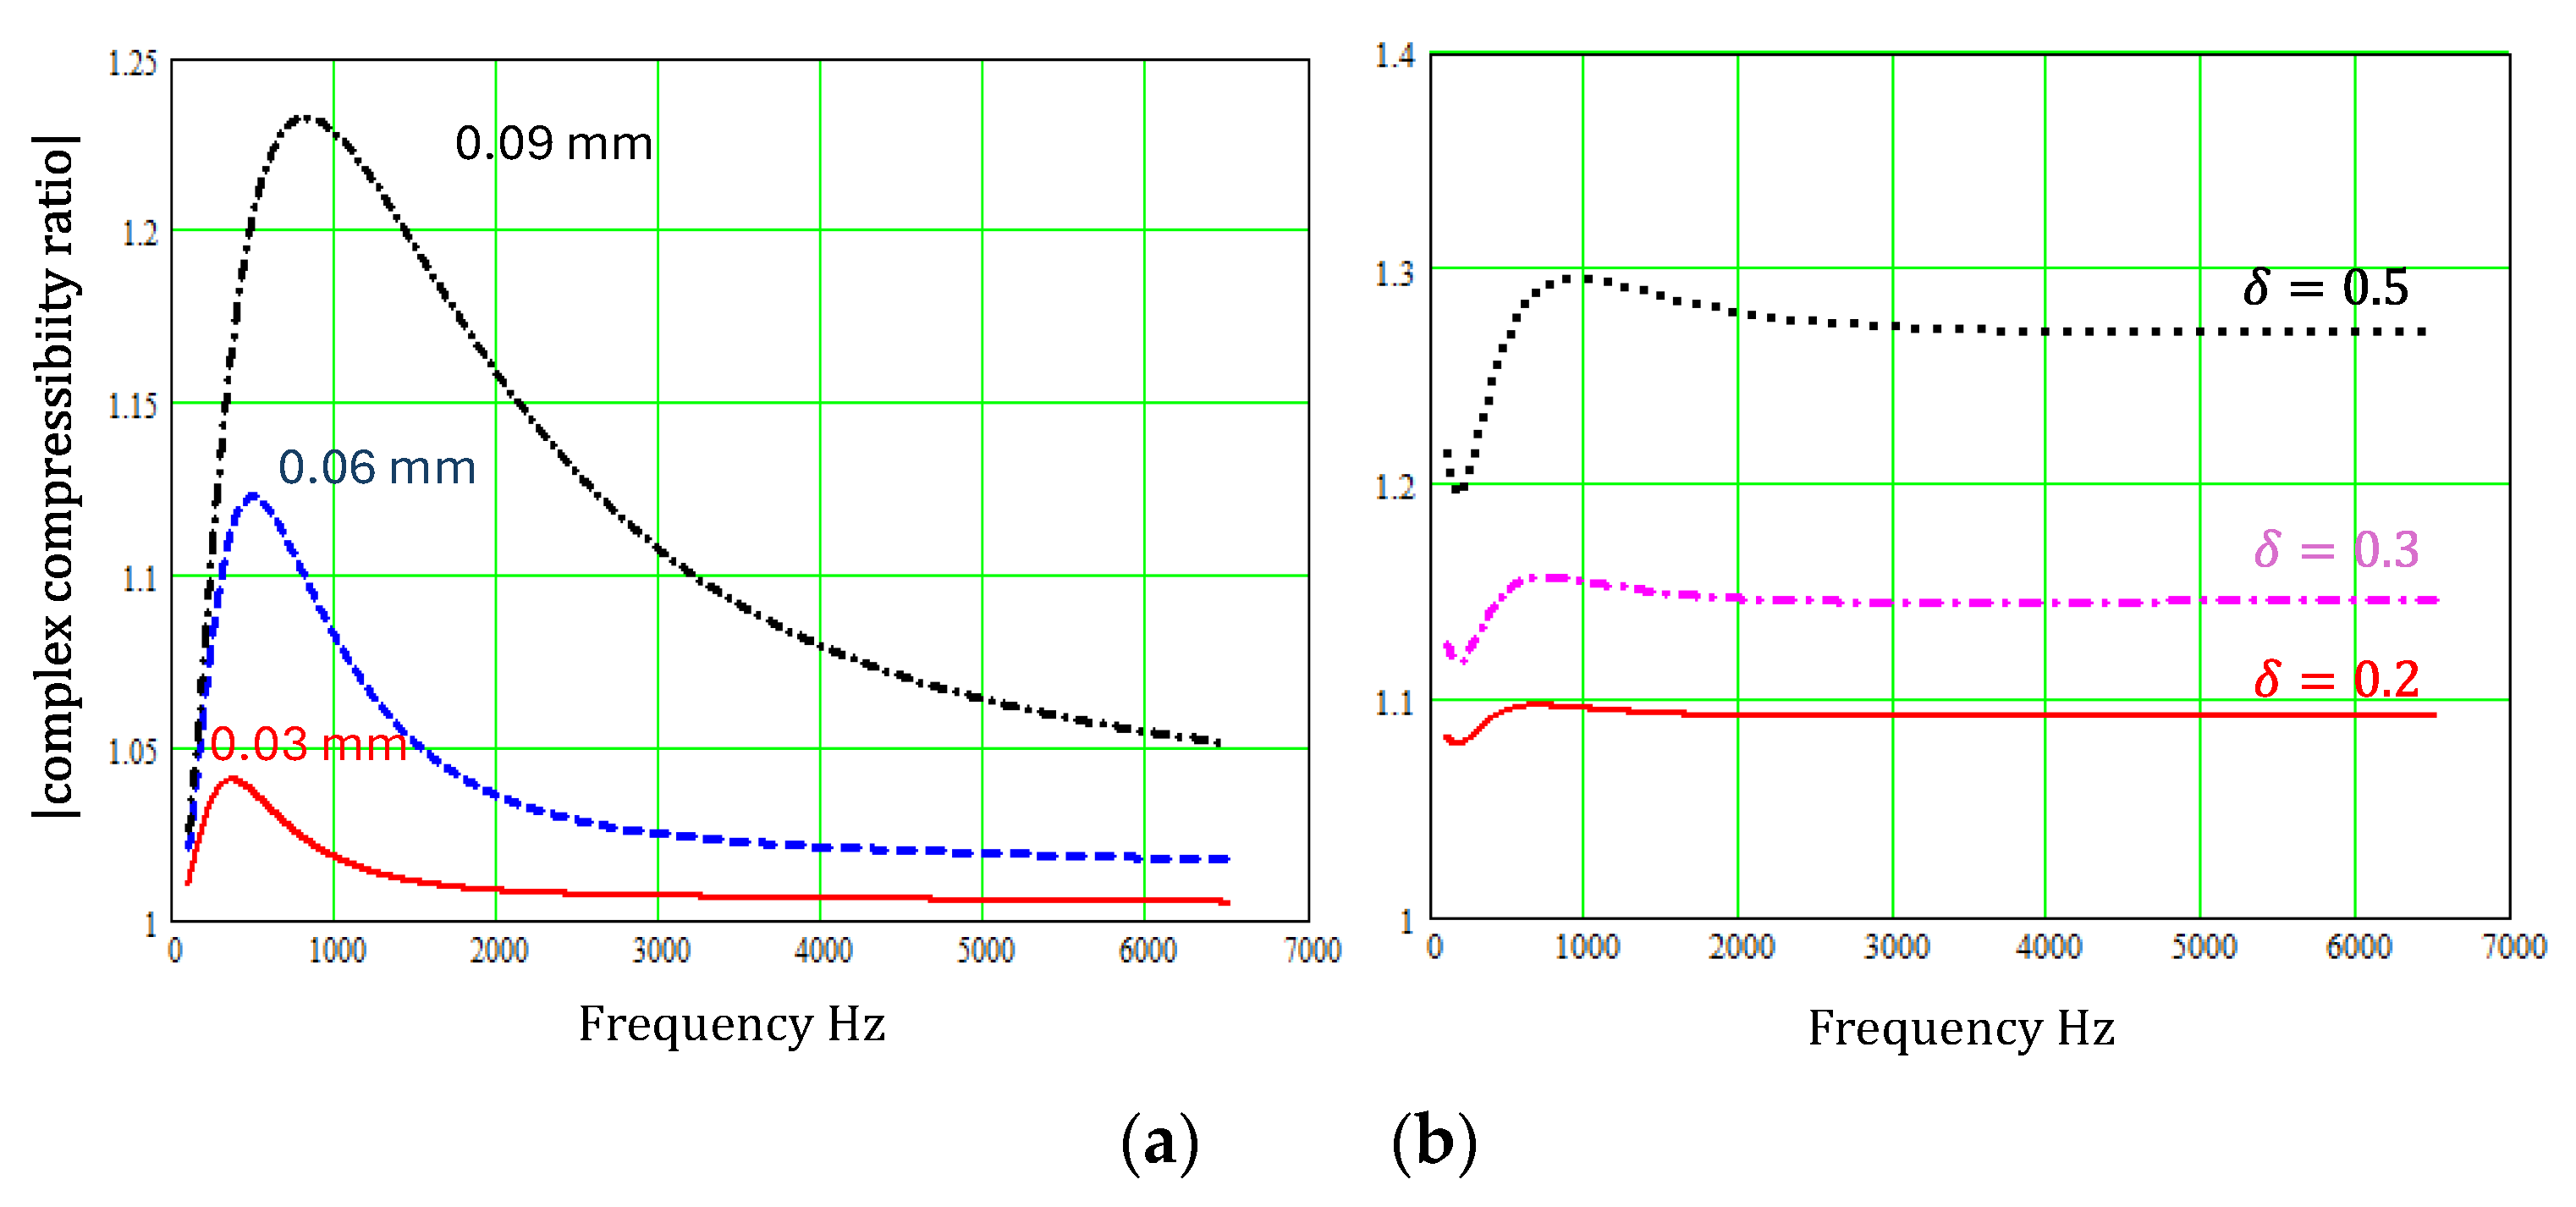
As the change in the periodically varying slit width increases, the resulting slit microstructure begins to resemble that of ‘pancake’ absorber in which each module consists of a central cylindrical main channel with dead end side branches [10]. A hard backed layer of such a microstructure has been found to achieve good low frequency absorption, albeit with narrow layer resonance peaks in the normal incidence absorption spectrum. The main influence of this microstructure is on the complex compressibility [10]. Although the sinusoidal cross section and regular repeating sectionally uniform slit microstructures may not create absorption peaks at as low frequencies as the ‘pancake’ absorber, Figure 7 and Figure 8 show that varying slit cross sections have a large influence on both complex density and complex compressibility at low frequencies and their influence persists over a wide frequency range.
It should be noted, however, that the theory presented for sinusoidal pore walls is increasingly inaccurate as increases and the assumptions used in the theory for regularly varying sectionally uniform slits become less tenable as the slit width variation increases.
5. Conclusions
Theories for the influence of sinusoidal variations and of regular uniform variations in slit widths have been outlined and used to confirm that at least part of the discrepancies between measured and predicted normal incidence absorption spectra for 3D printed samples with vertical and zigzag slits2 can be attributed to variation in the width of the slits in the manufactured samples.
Furthermore, the extent to which the deliberate introduction of either a sinusoidal variation or a sectionally uniform variation in slit width can improve the absorption offered by a rigid frame absorber containing vertical slits with constant widths has been investigated. The amplitude of the sinusoidal variation for a given wavelength has a larger influence on the predicted normal incidence absorption spectrum than the variation in wavelength for given amplitude. Similarly, the ratio of different width section lengths for a given ratio of lengths of different width sections has a larger influence on the predicted normal incidence absorption spectrum than the ratio of lengths of different width sections, for a given width ratio.
Funding
This research received no external funding.
Data Availability Statement
No new data were created or analyzed in this study. Data sharing is not applicable to this article.
Conflicts of Interest
The author declares no conflicts of interest.
References
- Boulvert, J.; Costa-Baptista, J.; Cavalieri, T.; Perna, M.; Fotsing, E.R.; Romero-García, V.; Gabard, G.; Ross, A.; Mardjono, J.; Groby, J.-P. Acoustic modeling of micro-lattices obtained by additive manufacturing. Applied Acoustics 2020, 164, 107244. [Google Scholar] [CrossRef]
- Kennedy, J.; Flanagan, L.; Dowling, L.; Bennett, G.J.; Rice, H.; Trimble, D. The Influence of Additive Manufacturing Processes on the Performance of a Periodic Acoustic Metamaterial. Int. J. Polymer Science 2019, 7029143. [Google Scholar] [CrossRef]
- Attenborough, K. Microstructures for lowering the quarter wavelength resonance frequency of a hard-backed rigid-porous layer. Applied Acoustics 2018, 130, 188–194. [Google Scholar] [CrossRef]
- Opiela, K.C.; Zielinski, T.; Attenborough, K. Limitations on validating slitted sound absorber designs through budget additive manufacturing. J. Materials and Design 2022, 110703. [Google Scholar] [CrossRef]
- Wang, H.; Wang, Y. Flow in microchannels with rough walls: flow pattern and pressure drop. J. Micromech. Microeng. 2007, 17, 586. [Google Scholar] [CrossRef]
- Schwartz, L.M.; Sen, P.N.; Johnson, D.L. Influence of rough surfaces on electrolytic conduction in porous media. Phys. Rev. B 1989, 40, 2450–2458. [Google Scholar] [CrossRef] [PubMed]
- Song, S.Y.; Yang, X.H.; Xin, F.X.; Ren, S.W.; Lu, T.J. Modeling of roughness effects on acoustic properties of micro-slits. J Appl Phys D. 2017, 50, 235303. [Google Scholar] [CrossRef]
- Stinson, M.R. The propagation of plane sound waves in narrow and wide circular tubes, and generalization to uniform tubes of arbitrary cross-sectional shape. J. Acoust. Soc. Am. 1991, 89, 550–558. [Google Scholar] [CrossRef]
- Champoux, Y.; Stinson, M. On acoustical models for sound propagation in rigid frame porous materials and the influence of shape factors. J. Acoust. Soc. Am. 1992, 92, 1120–1131. [Google Scholar] [CrossRef]
- Dupont, T.; Leclaire, P.; Panneton, R.; Umnova, O. A microstructure material design for low frequency sound absorption. Applied Acoustics 2018, 136, 86–93. [Google Scholar] [CrossRef]
Figure 1.
(a) A slit of mean width and cross section varying sinusoidally with amplitude and wavelength . (b) a porous hard backed layer of thickness containing vertical identical slits each of which has the Fig.1(a) sinusoidal cross section which extends for wavelengths ().
Figure 1.
(a) A slit of mean width and cross section varying sinusoidally with amplitude and wavelength . (b) a porous hard backed layer of thickness containing vertical identical slits each of which has the Fig.1(a) sinusoidal cross section which extends for wavelengths ().
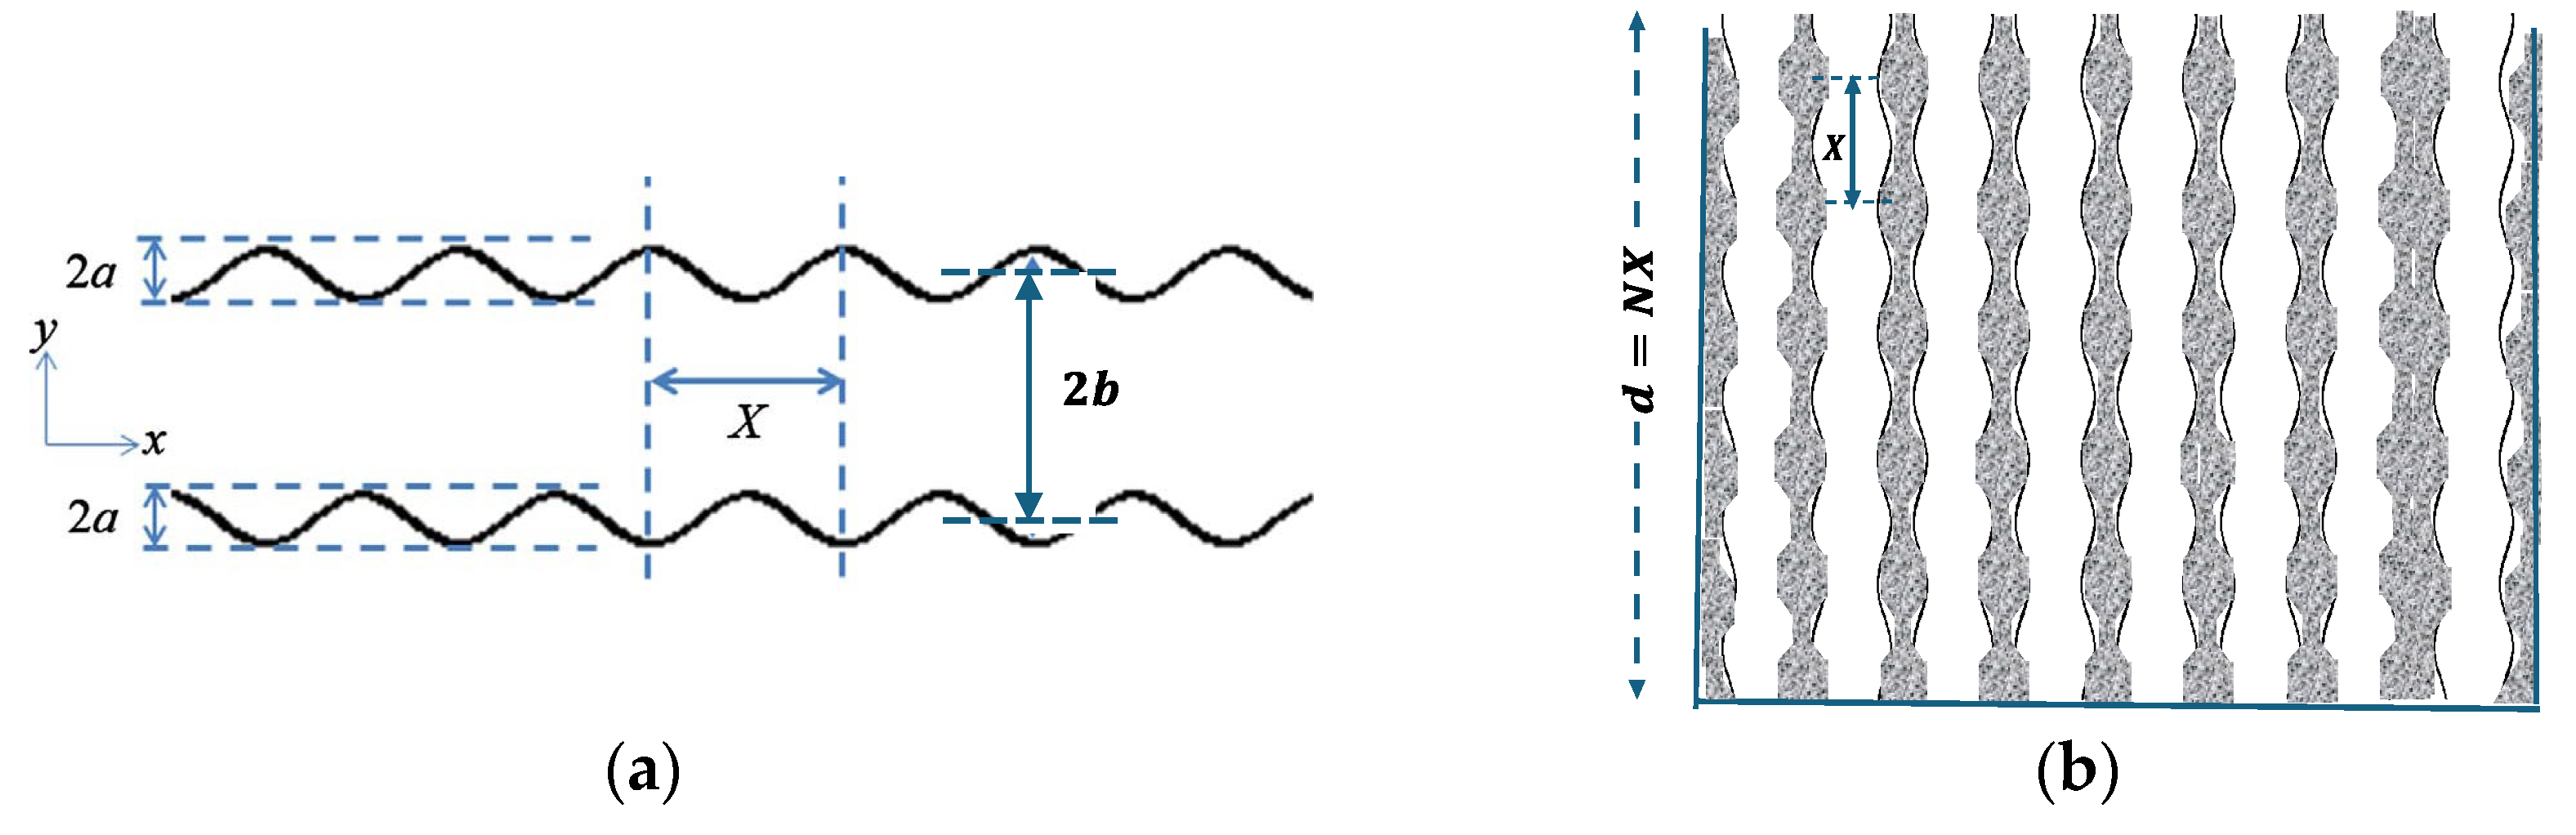
Figure 2.
A solid matrix containing vertical identical parallel periodic sectionally uniform slits with alternating widths of and and a repeating cell length of
Figure 2.
A solid matrix containing vertical identical parallel periodic sectionally uniform slits with alternating widths of and and a repeating cell length of
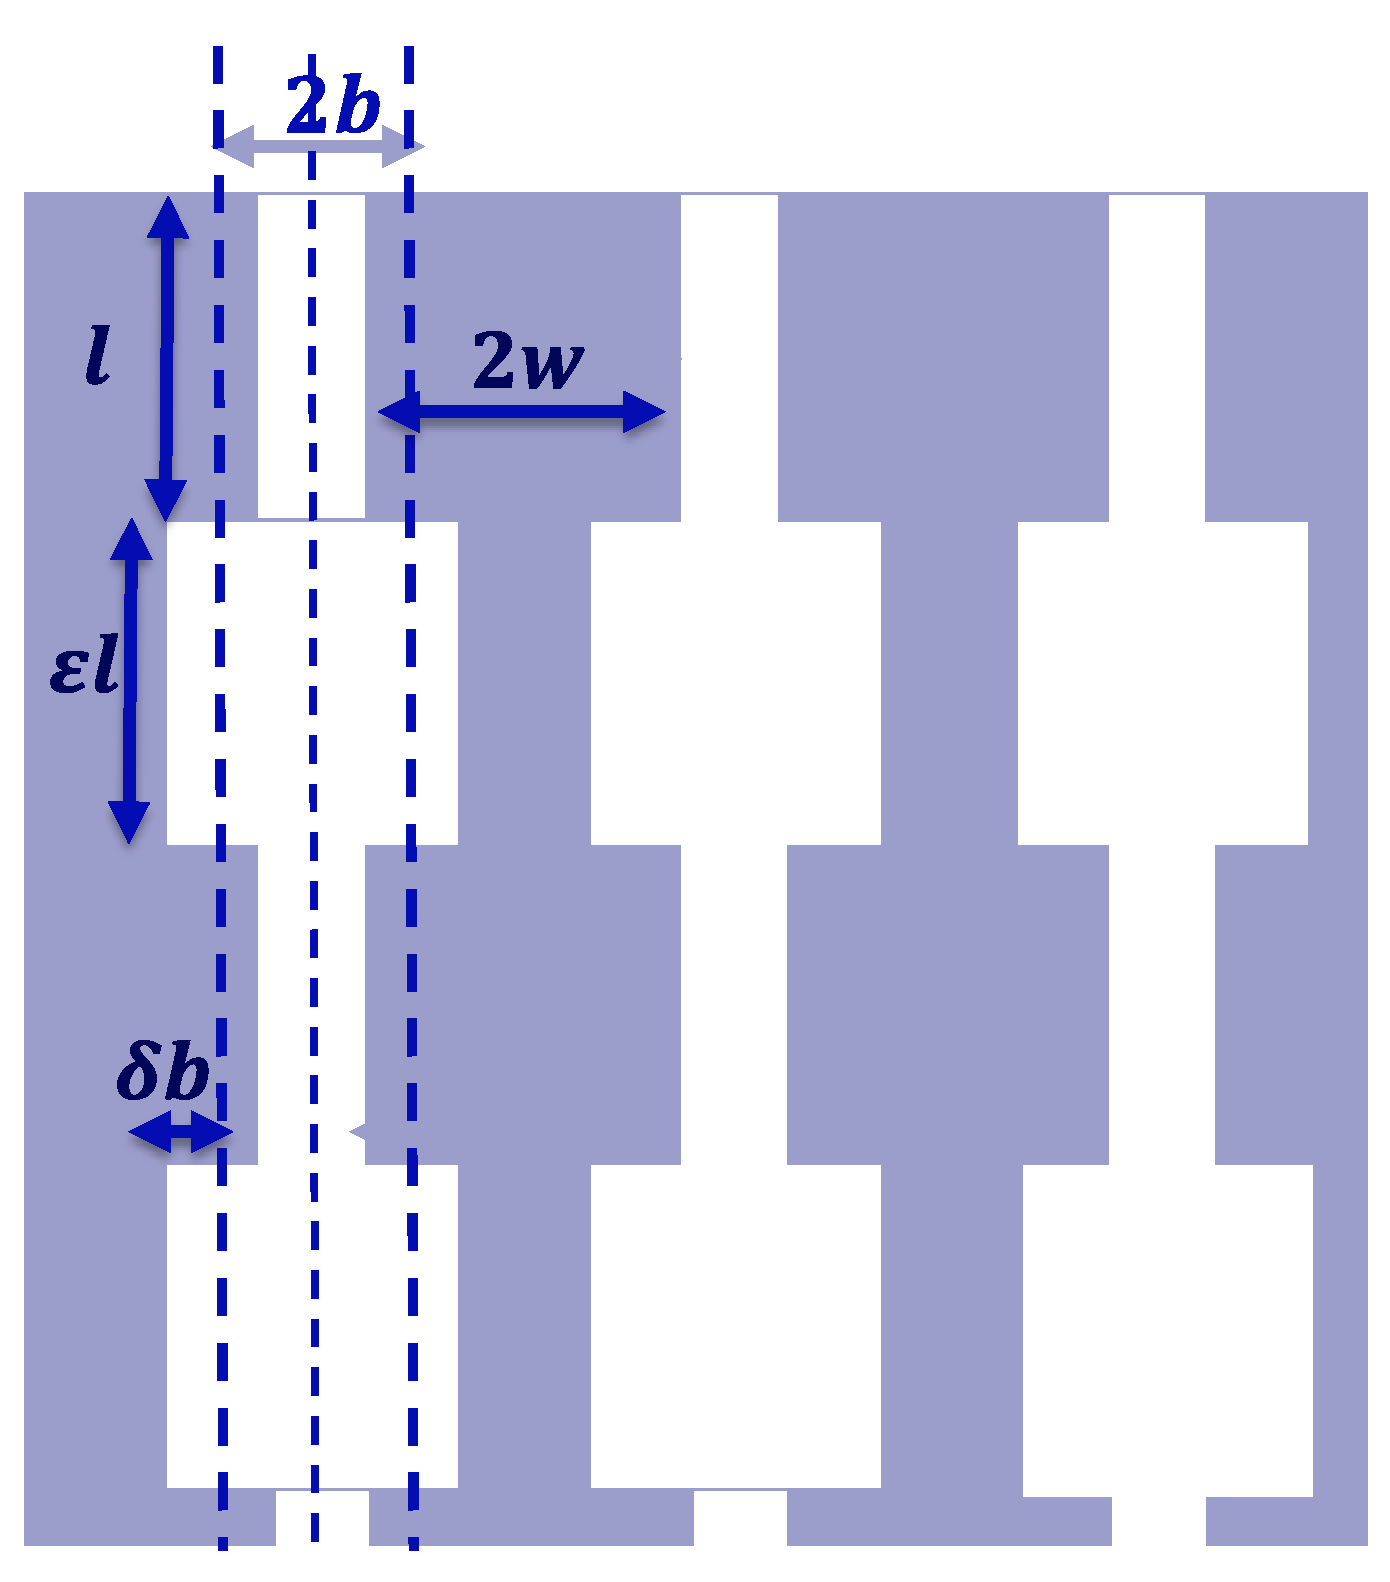
Figure 3.
Comparison between the measured absorption spectrum of a 3D printed sample containing zigzag slits inclined at 45° to the surface normal (broken black line) and predictions including the fold correction for infinitely long slits with parallel walls (solid red line) and (a) slits with sinusoidal walls (, , dash-dot blue line), or (b) slits with periodic variation in width (see Figure 2) with and .
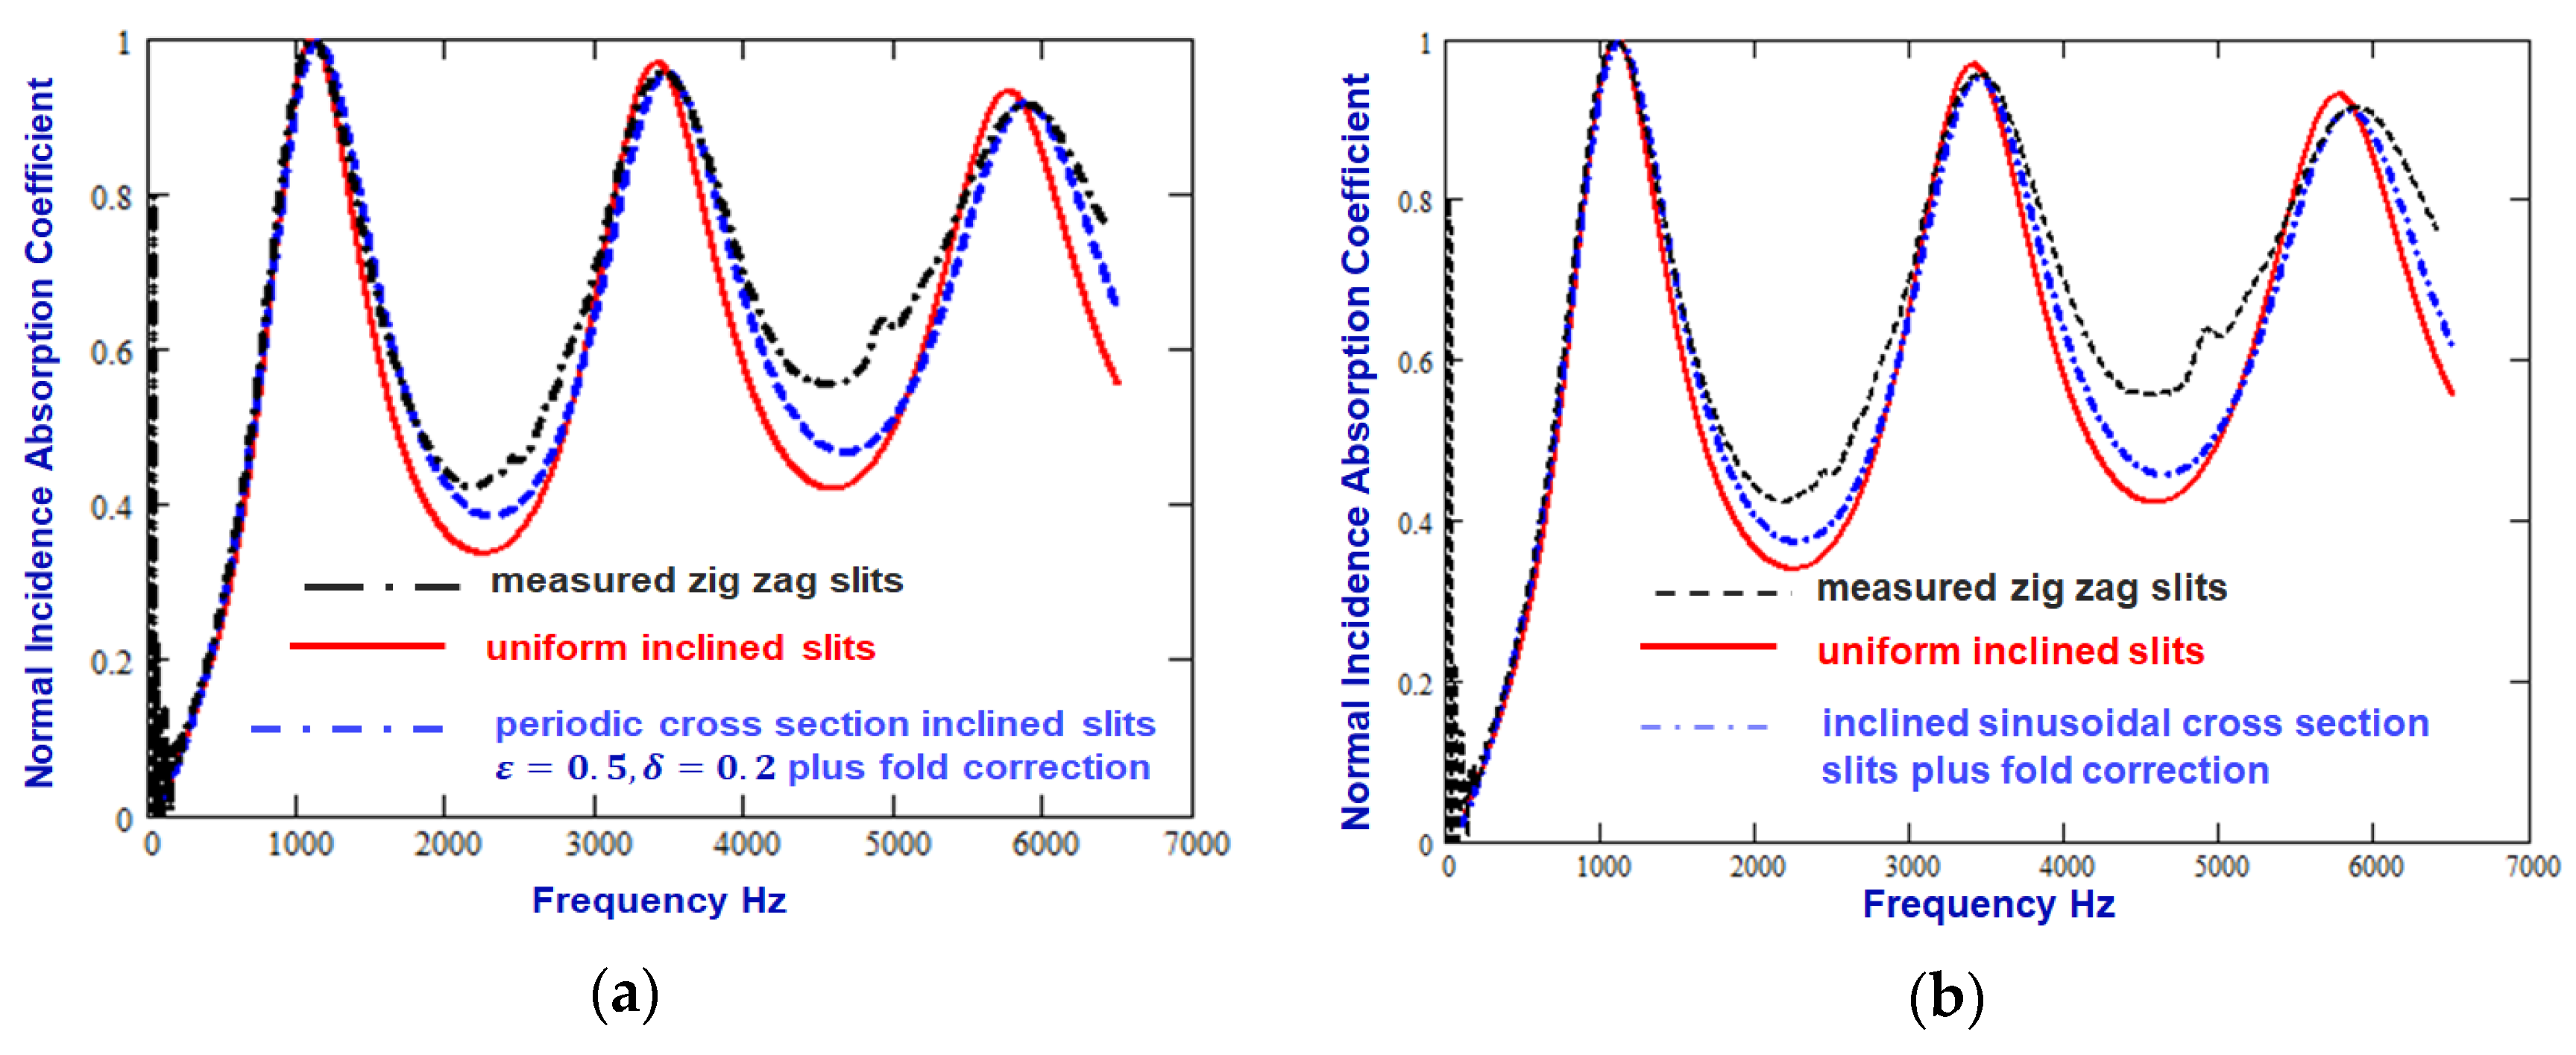
Figure 4.
Comparison between the measured absorption spectrum of a 3D printed sample containing zigzag slits inclined at 45° to the surface normal (broken black line) and predictions including the fold correction for infinitely long slits with parallel walls (solid red line) and (a) slits with sinusoidal walls (, , dash-dot blue line), or (b) slits with periodic variation in width (see Figure 2) with and .
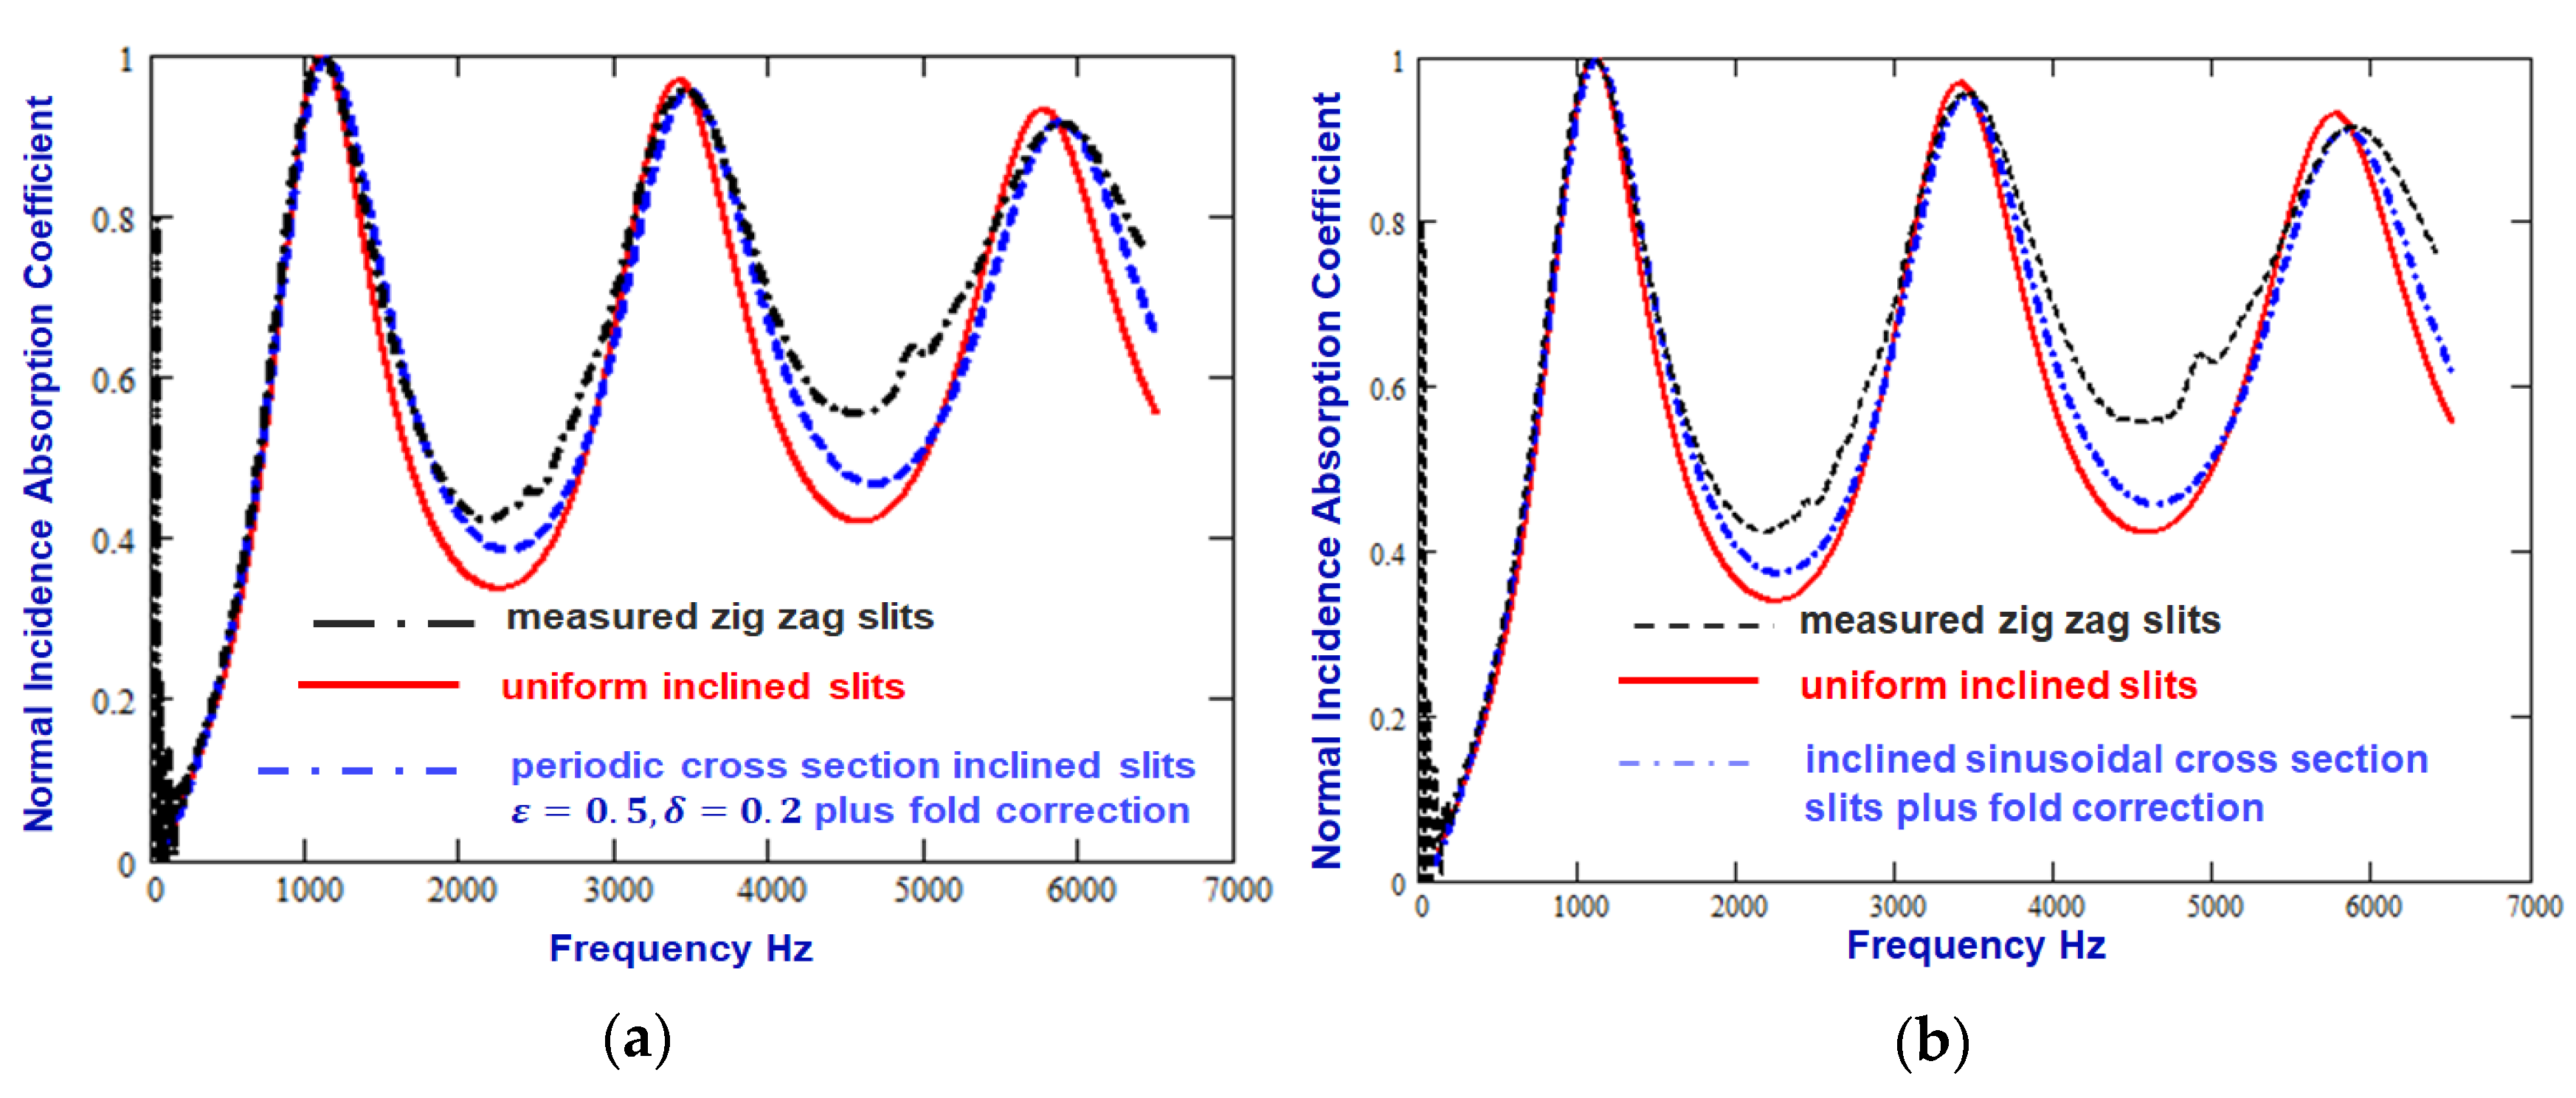
Figure 5.
The predicted influence of sinusoidal slit parameters on normal incidence absorption coefficient of a 0.0495 m thick hard backed layer containing vertical slits of nominal width 0.3 mm (a) due to varying the amplitude of the sinusoidal variation in slit cross sections between 0 mm and 0.06 mm assuming a constant wavelength of 0.248 mm and (b) due to varying the sinusoidal wavelength between 0 mm and 0.165 mm assuming a constant amplitude of 0.04 mm.
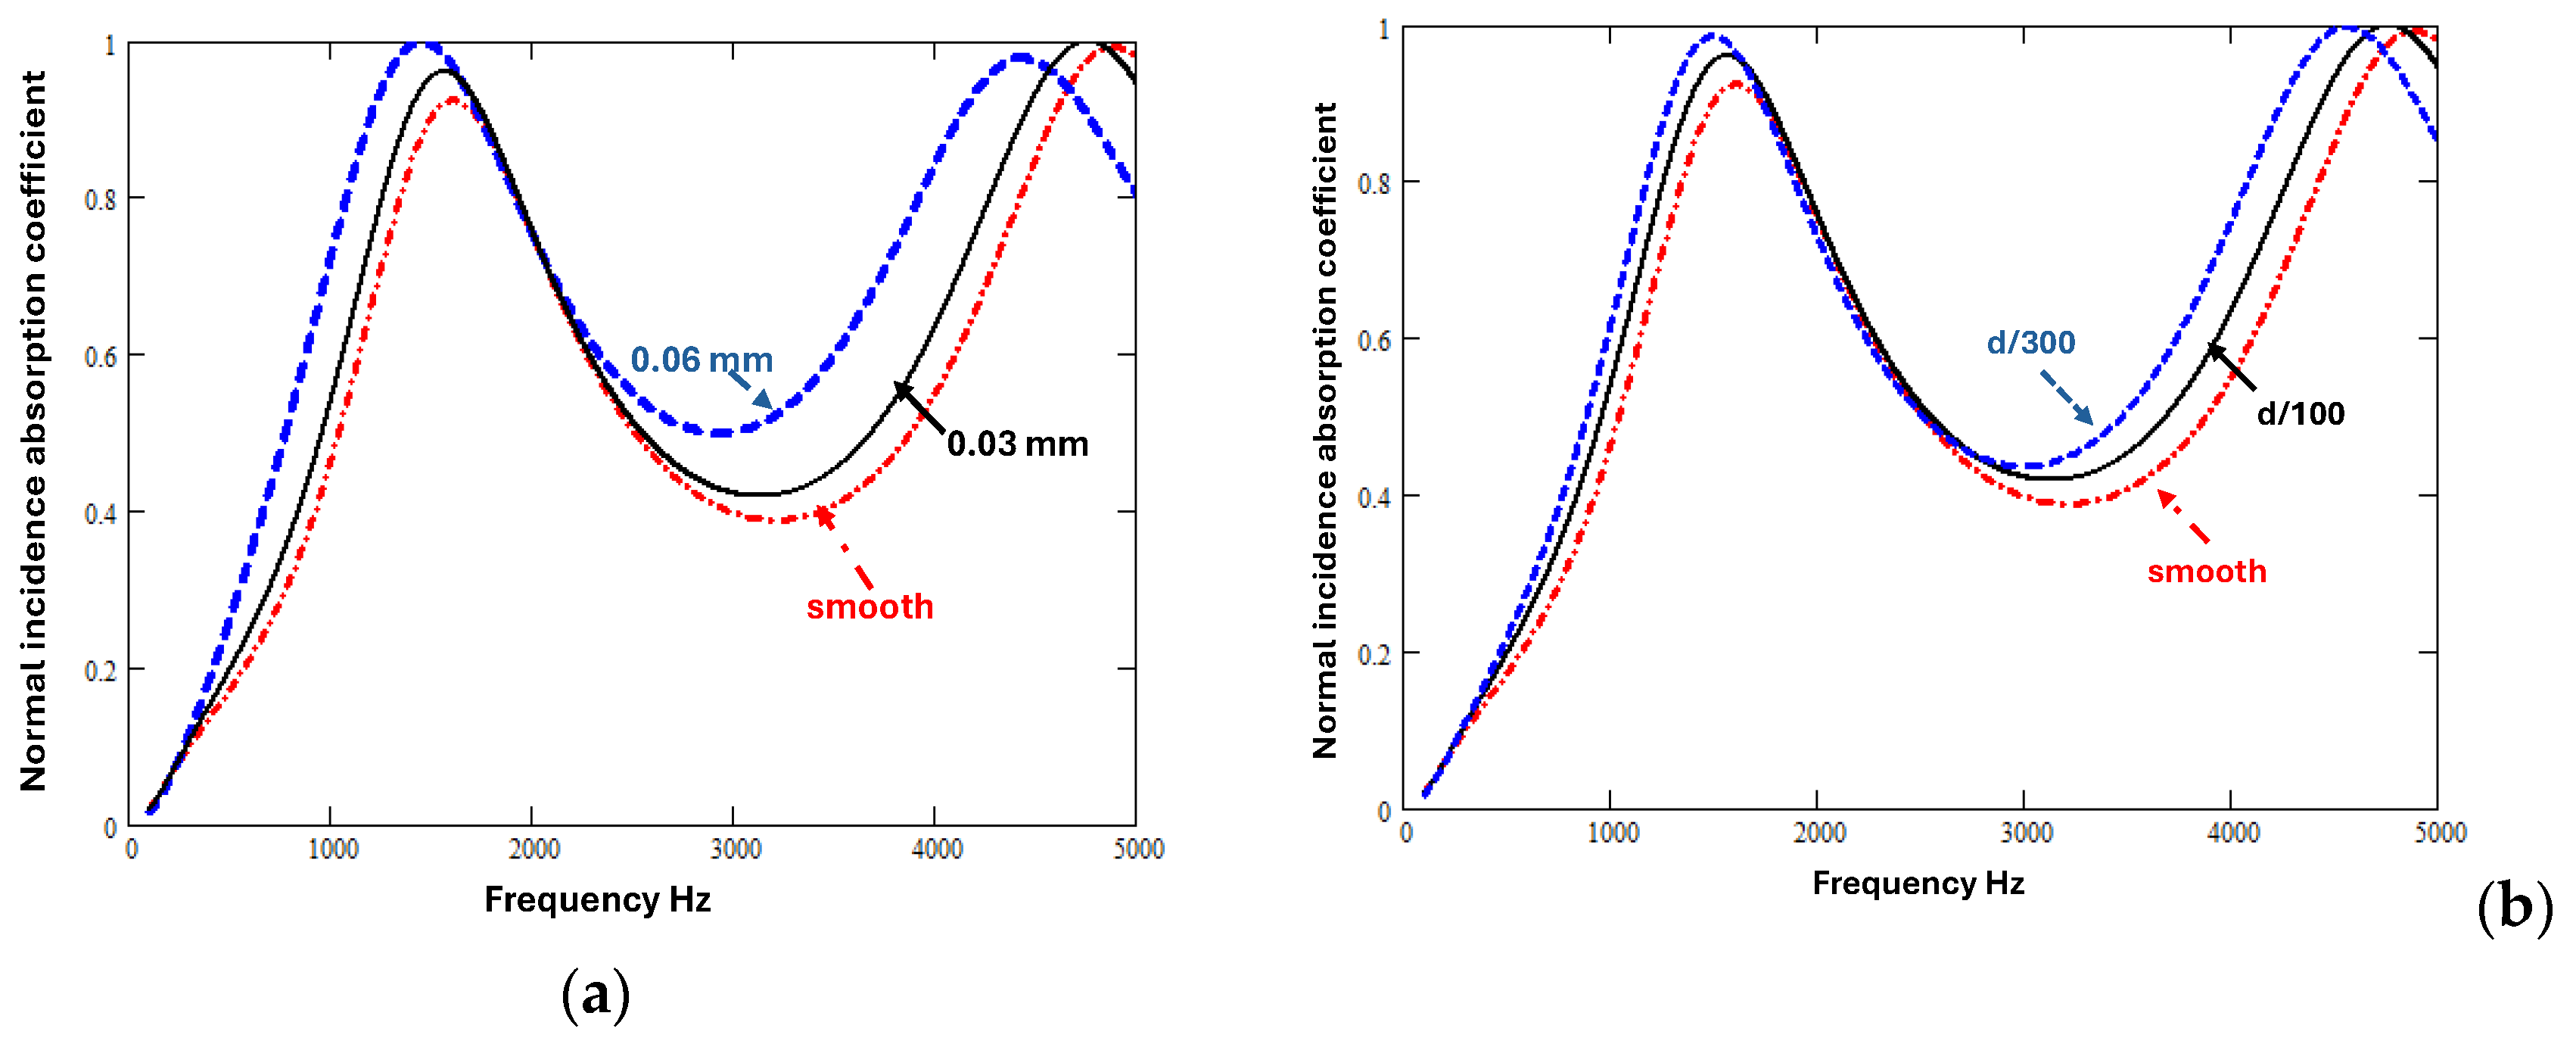
Figure 6.
Predicted absorption spectra for a 0.0495 m thick hard backed layer containing regularly repeating sectionally uniform slits normal to the surface of mean width 0.0003 m (a) as the wider width fraction has values of 0, 0.05, 0.2 and 1 (b) as the extra width of the wider parts of the slits has values of 0%, 20%, 40% and 50% of the mean widths.
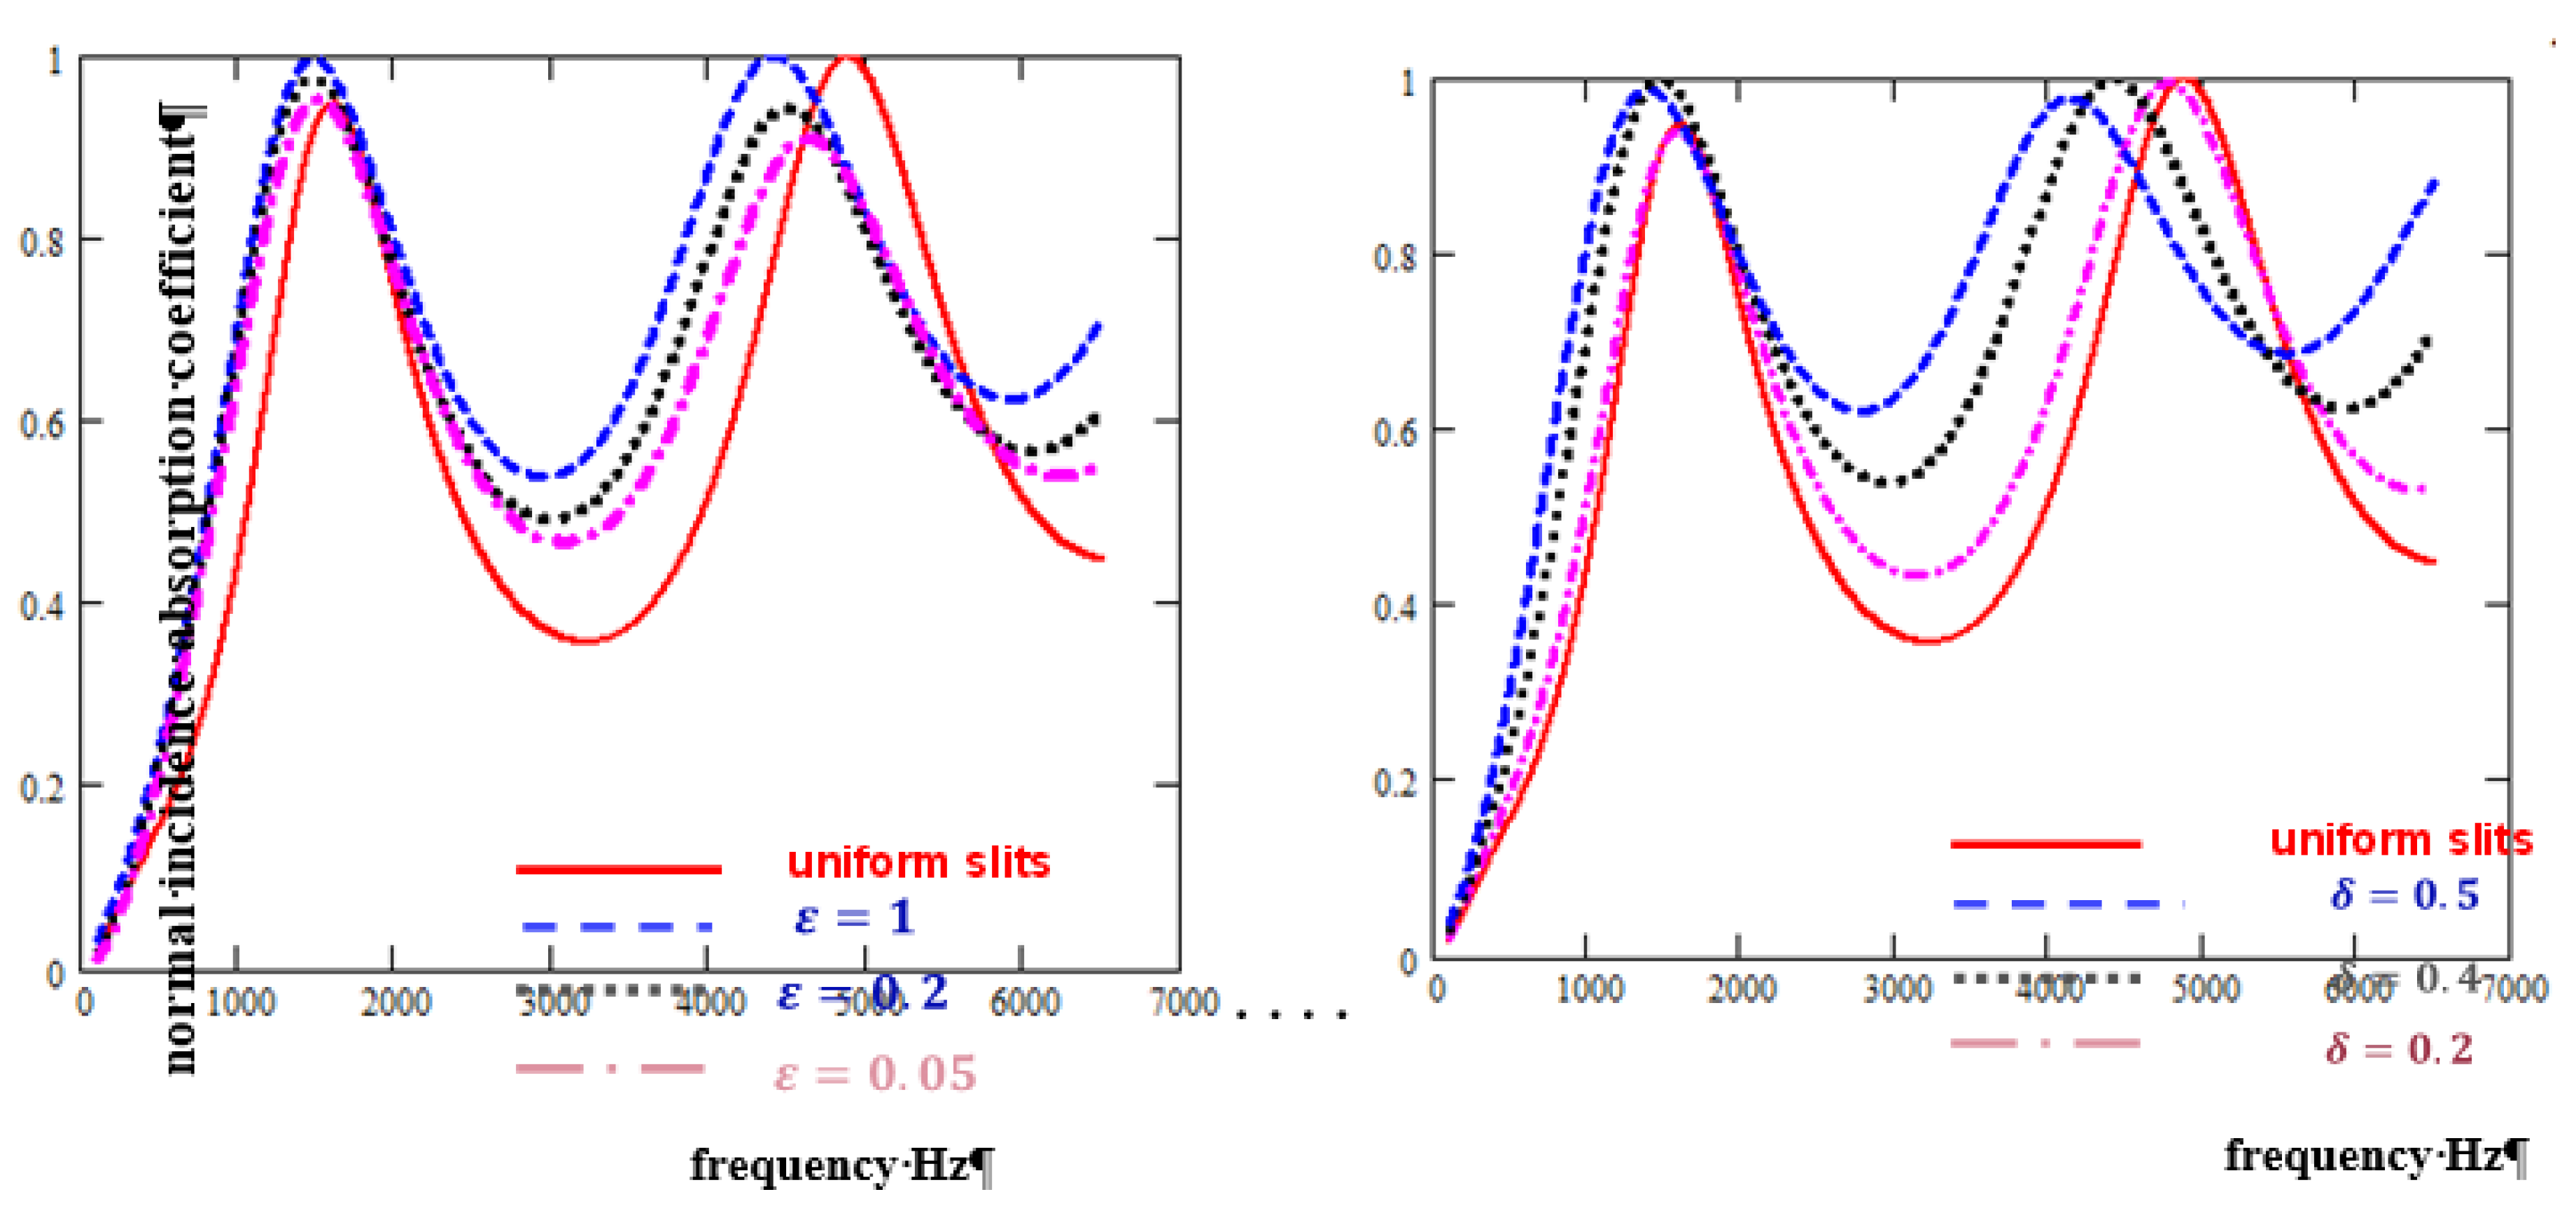
Figure 7.
Predicted influence of regularly varying slit cross sections on the modulus of the complex density relative to that for constant cross section pores of width 0.3 mm (a) for sinusoidal slit walls with wavelength fixed at 0.0248 mm and amplitudes of 0.03 mm, 0.06 mm or 0.09 mm (b) for regular sectionally uniform slit width variations with and = 0.2, 0.3 or 0.5.
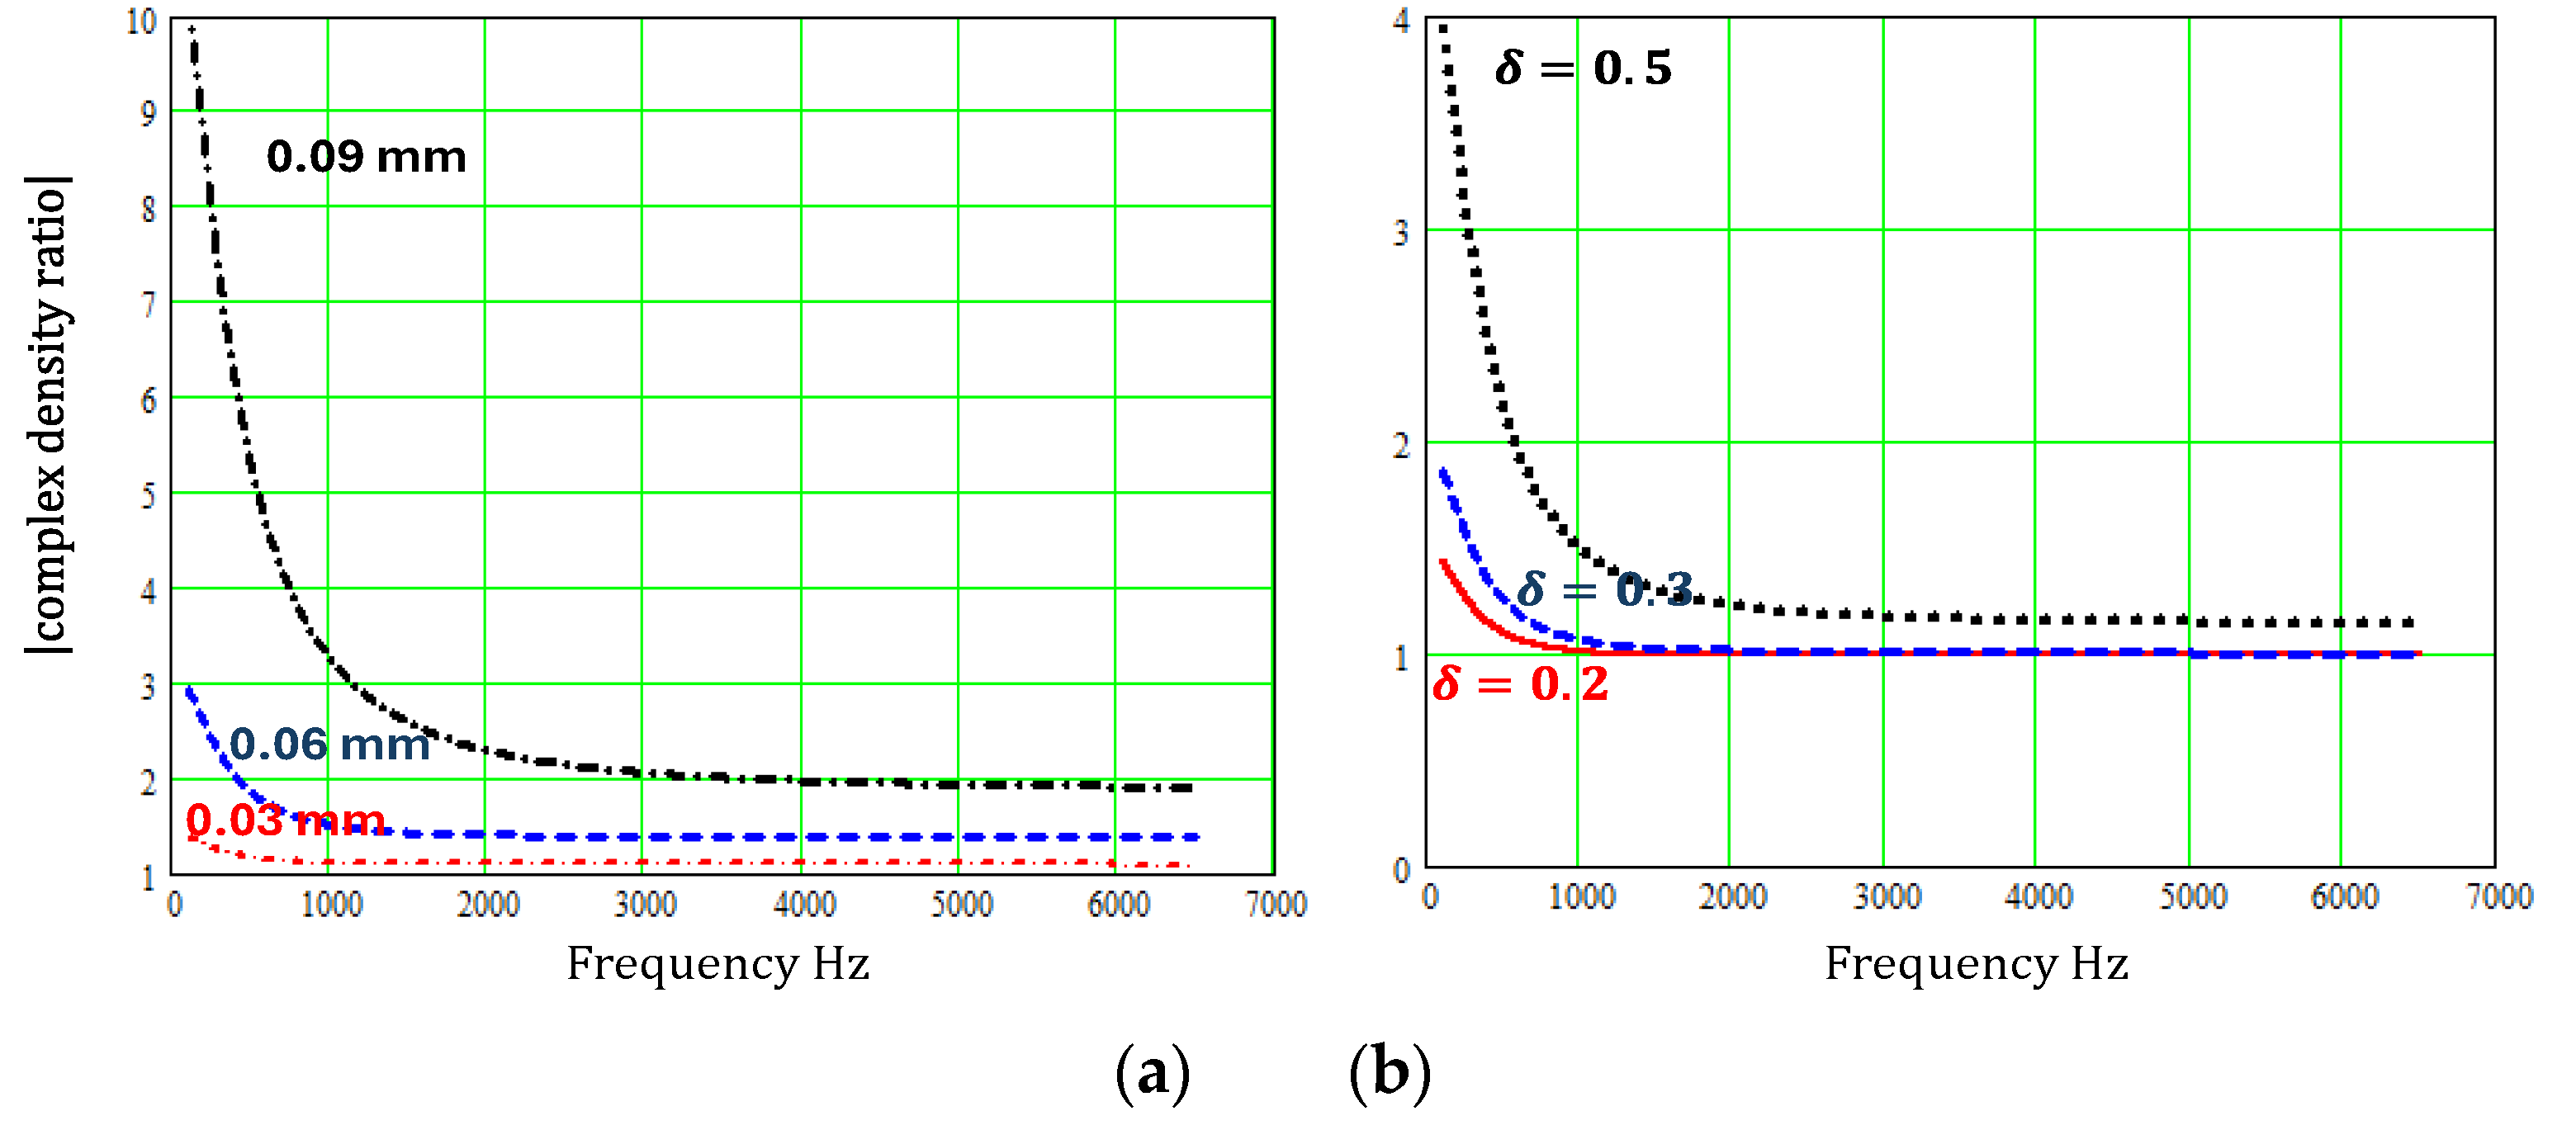
Figure 8.
Predicted influence of regularly varying slit cross sections on the modulus of the complex compressibility relative to that for constant cross section pores of width 0.3 mm (a) for sinusoidal slit walls with wavelength fixed at 0.0248 mm and amplitudes of 0.03 mm, 0.06 mm or 0.09 mm (b) for regular sectionally uniform slit width variations with and = 0.2, 0.3 or 0.5.
Disclaimer/Publisher’s Note: The statements, opinions and data contained in all publications are solely those of the individual author(s) and contributor(s) and not of MDPI and/or the editor(s). MDPI and/or the editor(s) disclaim responsibility for any injury to people or property resulting from any ideas, methods, instructions or products referred to in the content. |
© 2024 by the authors. Licensee MDPI, Basel, Switzerland. This article is an open access article distributed under the terms and conditions of the Creative Commons Attribution (CC BY) license (http://creativecommons.org/licenses/by/4.0/).
Copyright: This open access article is published under a Creative Commons CC BY 4.0 license, which permit the free download, distribution, and reuse, provided that the author and preprint are cited in any reuse.


